Embed Size (px)
Citation preview
SERA TR 99-21-11/12-01d
Clopyralid (Transline) -Final Report
Prepared for:
USDA, Forest ServiceTask Nos. 11/12
USDA/FS Contract No. 53-3187-5-12USDA/FS Order Nos.43-3187-8-0167 and 43-3187-8-0220
Submitted to:Leslie Rubin, COTR
Animal and Plant Health Inspection Service (APHIS)Biotechnology, Biologics and Environmental Protection
Environmental Analysis and DocumentationUnited States Department of Agriculture
Suite 5A44, Unit 1494700 River Road
Riverdale, MD 20737
Submitted by:Syracuse Environmental Research Associates, Inc.
5100 Highbridge St., 42CFayetteville, New York 13066-0950
Telephone: (315) 637-9560Fax: (315) 637-0445
Internet: [email protected]
Report Date: April 11, 1999
ii
TABLE OF CONTENTS
LIST OF TABLES . . . . . . . . . . . . . . . . . . . . . . . . . . . . . . . . . . . . . . . . . . . . . . . . . . . . . . . . . v
ACRONYMS, ABBREVIATIONS, AND SYMBOLS . . . . . . . . . . . . . . . . . . . . . . . . . . . . . vi
COMMON UNIT CONVERSIONS . . . . . . . . . . . . . . . . . . . . . . . . . . . . . . . . . . . . . . . . . . . viii
CONVERSION OF SCIENTIFIC NOTATION . . . . . . . . . . . . . . . . . . . . . . . . . . . . . . . . . . . ix
EXECUTIVE SUMMARY . . . . . . . . . . . . . . . . . . . . . . . . . . . . . . . . . . . . . . . . . . . . . . . . . . . . x
1. INTRODUCTION . . . . . . . . . . . . . . . . . . . . . . . . . . . . . . . . . . . . . . . . . . . . . . . . . . . . . . 1-1
2. PROGRAM DESCRIPTION . . . . . . . . . . . . . . . . . . . . . . . . . . . . . . . . . . . . . . . . . . . . . . 2-1
2.1. OVERVIEW . . . . . . . . . . . . . . . . . . . . . . . . . . . . . . . . . . . . . . . . . . . . . . . . . . . . . . 2-1
2.2. CHEMICAL DESCRIPTION AND COMMERCIAL FORMULATIONS . . . . . . . . 2-2
2.3. APPLICATION METHODS . . . . . . . . . . . . . . . . . . . . . . . . . . . . . . . . . . . . . . . . . . 2-2
2.4. MIXING AND APPLICATION RATES . . . . . . . . . . . . . . . . . . . . . . . . . . . . . . . . . 2-4
3. HUMAN HEALTH RISK ASSESSMENT . . . . . . . . . . . . . . . . . . . . . . . . . . . . . . . . . . . 3-1
3.1. HAZARD IDENTIFICATION . . . . . . . . . . . . . . . . . . . . . . . . . . . . . . . . . . . . . . . . . 3-1
3.1.1. Overview . . . . . . . . . . . . . . . . . . . . . . . . . . . . . . . . . . . . . . . . . . . . . . . . . . 3-13.1.2. Acute Toxicity . . . . . . . . . . . . . . . . . . . . . . . . . . . . . . . . . . . . . . . . . . . . . . 3-13.1.3. Subchronic or Chronic Systemic Toxic Effects . . . . . . . . . . . . . . . . . . . . . . 3-13.1.4. Reproductive and Teratogenic Effects . . . . . . . . . . . . . . . . . . . . . . . . . . . . 3-13.1.5. Carcinogenicity and Mutagenicity . . . . . . . . . . . . . . . . . . . . . . . . . . . . . . . . 3-23.1.6. Effects on the Skin and Eyes . . . . . . . . . . . . . . . . . . . . . . . . . . . . . . . . . . . 3-23.1.7. Systemic Toxic Effects from Dermal Exposure . . . . . . . . . . . . . . . . . . . . . . 3-33.1.8. Inhalation Exposure . . . . . . . . . . . . . . . . . . . . . . . . . . . . . . . . . . . . . . . . . . 3-43.1.9 Impurities, Metabolites, and Inerts . . . . . . . . . . . . . . . . . . . . . . . . . . . . . . . 3-43.1.10. Toxicological Interactions . . . . . . . . . . . . . . . . . . . . . . . . . . . . . . . . . . . . . 3-6
iii
TABLE OF CONTENTS (continued)
3.2. EXPOSURE ASSESSMENT . . . . . . . . . . . . . . . . . . . . . . . . . . . . . . . . . . . . . . . . . . 3-7
3.2.1. Overview . . . . . . . . . . . . . . . . . . . . . . . . . . . . . . . . . . . . . . . . . . . . . . . . . . 3-73.2.2. Workers . . . . . . . . . . . . . . . . . . . . . . . . . . . . . . . . . . . . . . . . . . . . . . . . . . . 3-73.2.3. General Public . . . . . . . . . . . . . . . . . . . . . . . . . . . . . . . . . . . . . . . . . . . . . 3-123.2.4. Hexachlorobenzene . . . . . . . . . . . . . . . . . . . . . . . . . . . . . . . . . . . . . . . . . 3-12
3.3. DOSE-RESPONSE ASSESSMENT . . . . . . . . . . . . . . . . . . . . . . . . . . . . . . . . . . . 3-17
3.3.1. Overview . . . . . . . . . . . . . . . . . . . . . . . . . . . . . . . . . . . . . . . . . . . . . . . . . 3-173.3.2. Existing Guidelines . . . . . . . . . . . . . . . . . . . . . . . . . . . . . . . . . . . . . . . . . . 3-173.3.3. Dose-Response and Dose-Severity Relationships . . . . . . . . . . . . . . . . . . . 3-18
3.4. RISK CHARACTERIZATION . . . . . . . . . . . . . . . . . . . . . . . . . . . . . . . . . . . . . . . 3-24
3.4.1. Overview . . . . . . . . . . . . . . . . . . . . . . . . . . . . . . . . . . . . . . . . . . . . . . . . . 3-243.4.2. Workers . . . . . . . . . . . . . . . . . . . . . . . . . . . . . . . . . . . . . . . . . . . . . . . . . . 3-243.4.3. General Public . . . . . . . . . . . . . . . . . . . . . . . . . . . . . . . . . . . . . . . . . . . . . 3-263.4.4. Sensitive Subgroups . . . . . . . . . . . . . . . . . . . . . . . . . . . . . . . . . . . . . . . . . 3-283.4.5. Connected Actions . . . . . . . . . . . . . . . . . . . . . . . . . . . . . . . . . . . . . . . . . . 3-283.4.6. Cumulative Effects . . . . . . . . . . . . . . . . . . . . . . . . . . . . . . . . . . . . . . . . . . 3-28
4. ECOLOGICAL RISK ASSESSMENT . . . . . . . . . . . . . . . . . . . . . . . . . . . . . . . . . . . . . . 4-1
4.1. HAZARD IDENTIFICATION . . . . . . . . . . . . . . . . . . . . . . . . . . . . . . . . . . . . . . . . . 4-1
4.1.1. Overview . . . . . . . . . . . . . . . . . . . . . . . . . . . . . . . . . . . . . . . . . . . . . . . . . . 4-14.1.2. Toxicity to Terrestrial Organisms . . . . . . . . . . . . . . . . . . . . . . . . . . . . . . . . 4-14.1.3. Aquatic Organisms . . . . . . . . . . . . . . . . . . . . . . . . . . . . . . . . . . . . . . . . . . . 4-3
4.2. EXPOSURE ASSESSMENT . . . . . . . . . . . . . . . . . . . . . . . . . . . . . . . . . . . . . . . . . . 4-4
4.2.1. Terrestrial Animals . . . . . . . . . . . . . . . . . . . . . . . . . . . . . . . . . . . . . . . . . . . 4-44.2.2. Terrestrial Plants . . . . . . . . . . . . . . . . . . . . . . . . . . . . . . . . . . . . . . . . . . . . 4-94.2.3. Aquatic Organisms . . . . . . . . . . . . . . . . . . . . . . . . . . . . . . . . . . . . . . . . . . 4-13
4.3. DOSE-RESPONSE ASSESSMENT . . . . . . . . . . . . . . . . . . . . . . . . . . . . . . . . . . . 4-14
4.3.1. Overview . . . . . . . . . . . . . . . . . . . . . . . . . . . . . . . . . . . . . . . . . . . . . . . . . 4-144.3.2. Toxicity to Terrestrial Animals . . . . . . . . . . . . . . . . . . . . . . . . . . . . . . . . . 4-144.3.3. Aquatic Organisms . . . . . . . . . . . . . . . . . . . . . . . . . . . . . . . . . . . . . . . . . . 4-18
iv
TABLE OF CONTENTS (continued)
4.4. RISK CHARACTERIZATION . . . . . . . . . . . . . . . . . . . . . . . . . . . . . . . . . . . . . . . 4-19
4.4.1. Overview . . . . . . . . . . . . . . . . . . . . . . . . . . . . . . . . . . . . . . . . . . . . . . . . . 4-194.4.2. Terrestrial Organisms . . . . . . . . . . . . . . . . . . . . . . . . . . . . . . . . . . . . . . . . 4-194.4.3. Aquatic Organisms . . . . . . . . . . . . . . . . . . . . . . . . . . . . . . . . . . . . . . . . . . 4-25
5. REFERENCES . . . . . . . . . . . . . . . . . . . . . . . . . . . . . . . . . . . . . . . . . . . . . . . . . . . . . . . . 5-1
6. GLOSSARY . . . . . . . . . . . . . . . . . . . . . . . . . . . . . . . . . . . . . . . . . . . . . . . . . . . . . . . . . 6-1
7. SUBJECT INDEX . . . . . . . . . . . . . . . . . . . . . . . . . . . . . . . . . . . . . . . . . . . . . . . . . . . . . . 7-1
APPENDICES
Appendix 1: Toxicity of clopyralid to mammalsAppendix 2: Toxicity of clopyralid to birds after oral administration.Appendix 3: Toxicity of clopyralid to terrestrial invertebrates.Appendix 4: Toxicity of clopyralid to non-target terrestrial plants.Appendix 5: Toxicity to fish, aquatic invertebrates, and aquatic plants.Appendix 6: Field studies on the fate of clopyralid in soil.Appendix 7: GLEAMS modeling of hexachlorobenzene runoff.
WORKSHEETS
ClopyralidHexachlorobenzene
v
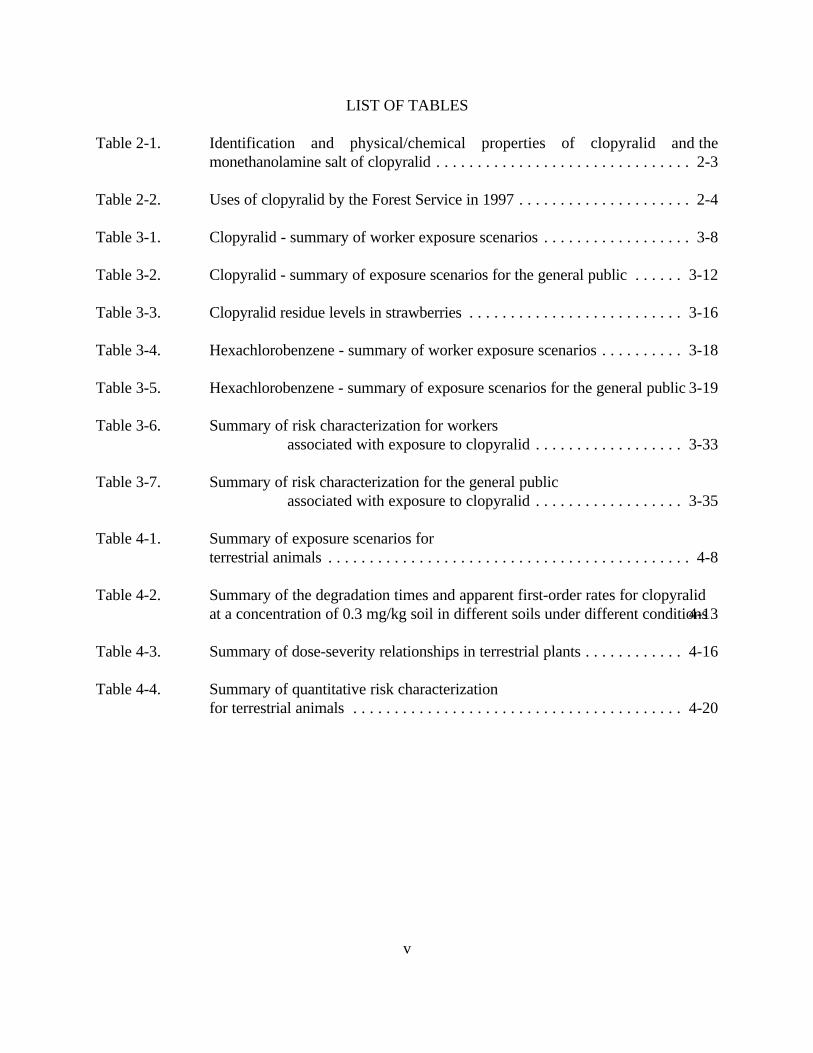
LIST OF TABLES
Table 2-1. Identification and physical/chemical properties of clopyralid and themonethanolamine salt of clopyralid . . . . . . . . . . . . . . . . . . . . . . . . . . . . . . . 2-3
Table 2-2. Uses of clopyralid by the Forest Service in 1997 . . . . . . . . . . . . . . . . . . . . . 2-4
Table 3-1. Clopyralid - summary of worker exposure scenarios . . . . . . . . . . . . . . . . . . 3-8
Table 3-2. Clopyralid - summary of exposure scenarios for the general public . . . . . . 3-12
Table 3-3. Clopyralid residue levels in strawberries . . . . . . . . . . . . . . . . . . . . . . . . . . 3-16
Table 3-4. Hexachlorobenzene - summary of worker exposure scenarios . . . . . . . . . . 3-18
Table 3-5. Hexachlorobenzene - summary of exposure scenarios for the general public 3-19
Table 3-6. Summary of risk characterization for workers associated with exposure to clopyralid . . . . . . . . . . . . . . . . . . 3-33
Table 3-7. Summary of risk characterization for the general public associated with exposure to clopyralid . . . . . . . . . . . . . . . . . . 3-35
Table 4-1. Summary of exposure scenarios forterrestrial animals . . . . . . . . . . . . . . . . . . . . . . . . . . . . . . . . . . . . . . . . . . . . 4-8
Table 4-2. Summary of the degradation times and apparent first-order rates for clopyralid at a concentration of 0.3 mg/kg soil in different soils under different conditions4-13
Table 4-3. Summary of dose-severity relationships in terrestrial plants . . . . . . . . . . . . 4-16
Table 4-4. Summary of quantitative risk characterizationfor terrestrial animals . . . . . . . . . . . . . . . . . . . . . . . . . . . . . . . . . . . . . . . . 4-20
vi
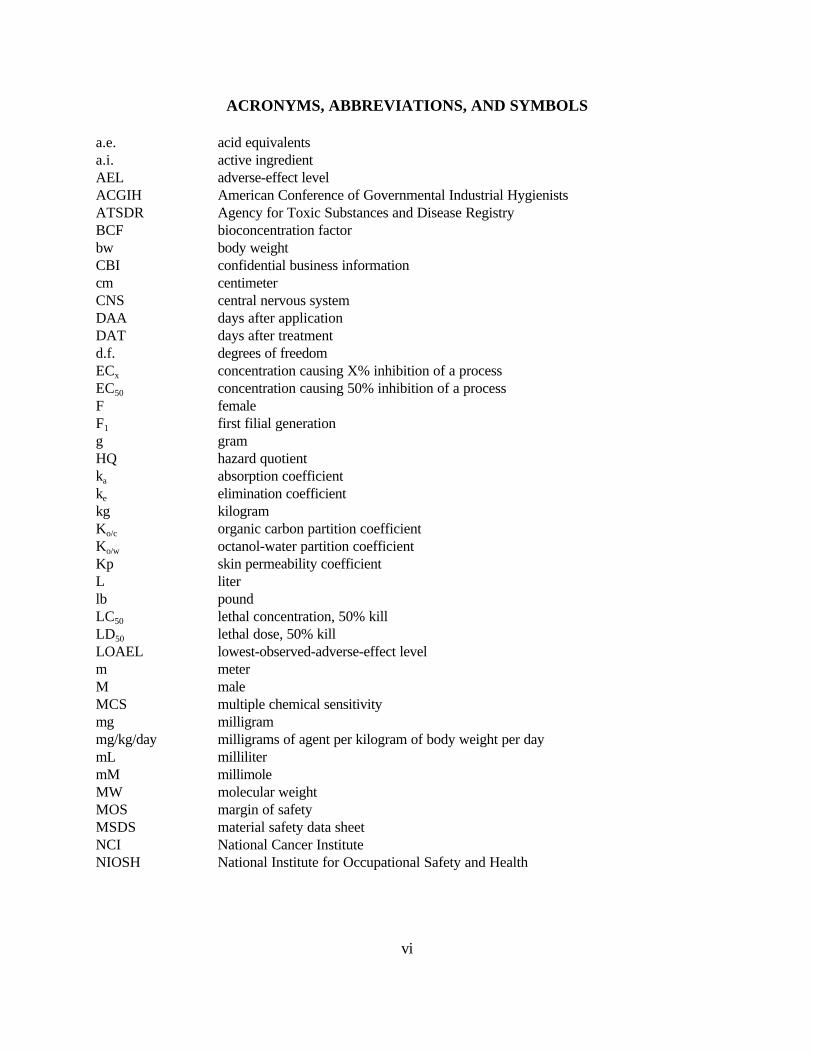
ACRONYMS, ABBREVIATIONS, AND SYMBOLS
a.e. acid equivalentsa.i. active ingredientAEL adverse-effect levelACGIH American Conference of Governmental Industrial HygienistsATSDR Agency for Toxic Substances and Disease RegistryBCF bioconcentration factorbw body weightCBI confidential business informationcm centimeterCNS central nervous systemDAA days after applicationDAT days after treatmentd.f. degrees of freedomECx concentration causing X% inhibition of a processEC50 concentration causing 50% inhibition of a processF femaleF1 first filial generationg gramHQ hazard quotientka absorption coefficientke elimination coefficientkg kilogramKo/c organic carbon partition coefficientKo/w octanol-water partition coefficientKp skin permeability coefficientL literlb poundLC50 lethal concentration, 50% killLD50 lethal dose, 50% killLOAEL lowest-observed-adverse-effect levelm meterM maleMCS multiple chemical sensitivitymg milligrammg/kg/day milligrams of agent per kilogram of body weight per daymL millilitermM millimoleMW molecular weightMOS margin of safetyMSDS material safety data sheetNCI National Cancer InstituteNIOSH National Institute for Occupational Safety and Health
vii
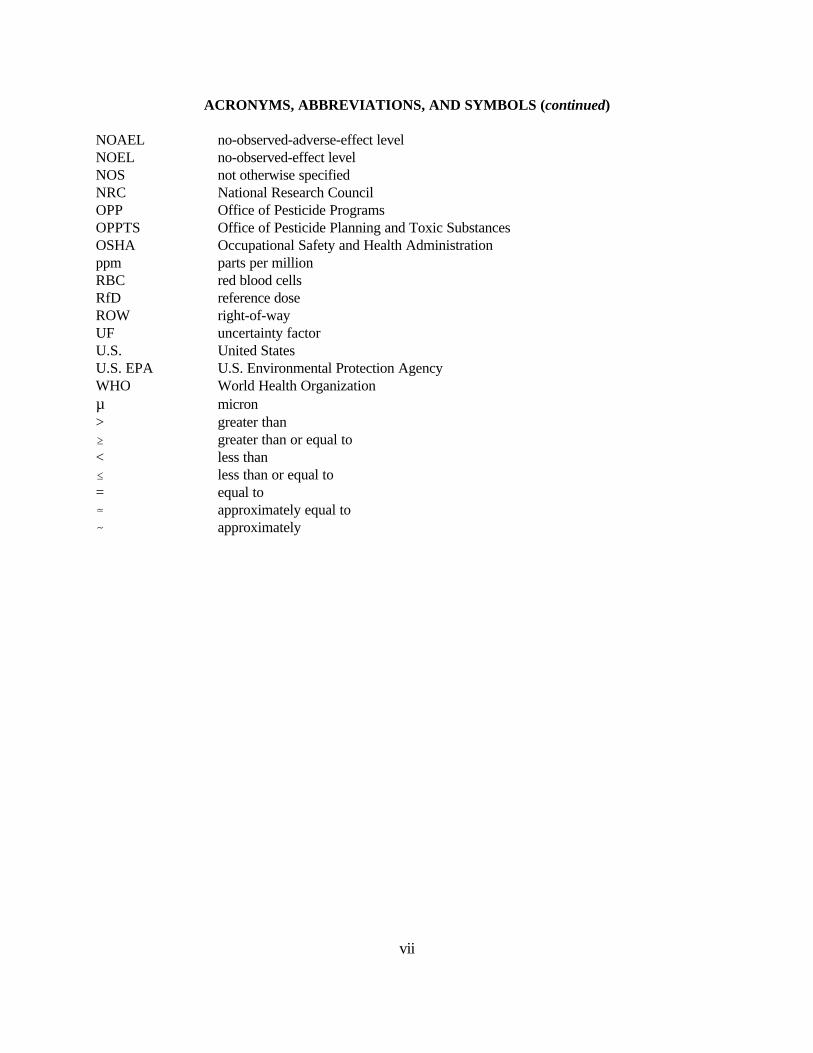
ACRONYMS, ABBREVIATIONS, AND SYMBOLS (continued)
NOAEL no-observed-adverse-effect levelNOEL no-observed-effect levelNOS not otherwise specifiedNRC National Research CouncilOPP Office of Pesticide ProgramsOPPTS Office of Pesticide Planning and Toxic SubstancesOSHA Occupational Safety and Health Administrationppm parts per millionRBC red blood cellsRfD reference doseROW right-of-wayUF uncertainty factorU.S. United StatesU.S. EPA U.S. Environmental Protection AgencyWHO World Health Organizationµ micron> greater than$ greater than or equal to< less than# less than or equal to= equal to• approximately equal to- approximately
viii
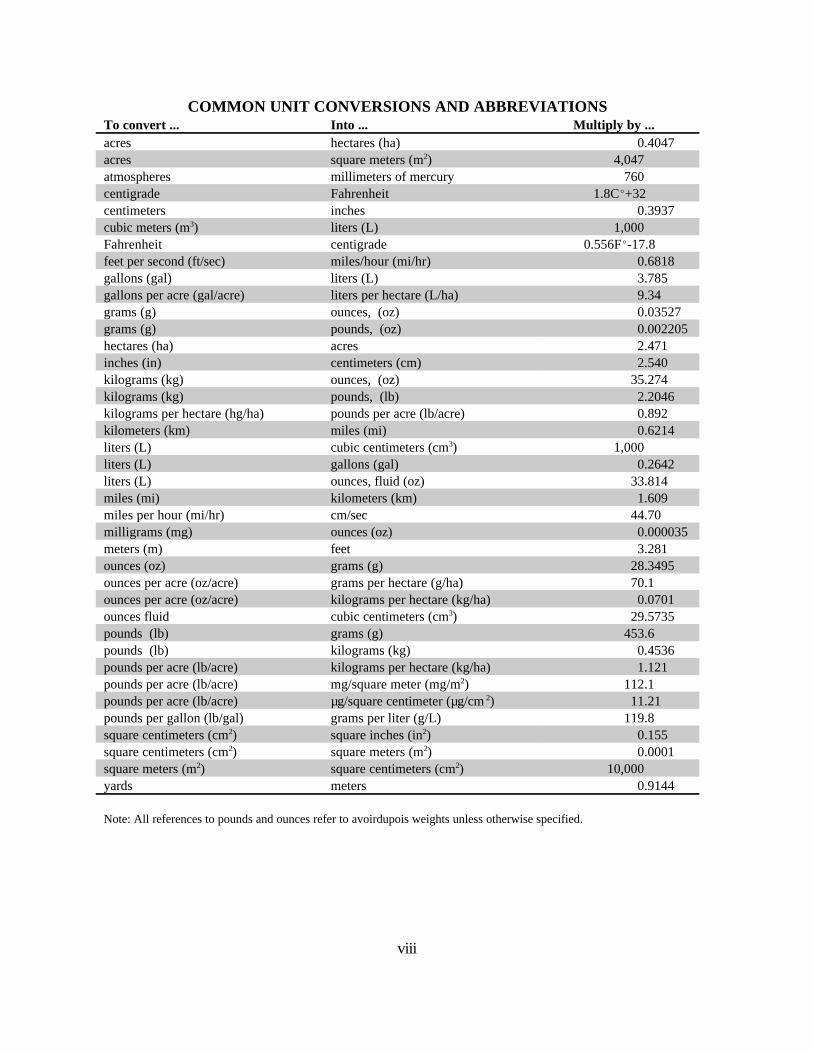
COMMON UNIT CONVERSIONS AND ABBREVIATIONSTo convert ... Into ... Multiply by ...acres hectares (ha) 0.4047acres square meters (m2) 4,047atmospheres millimeters of mercury 760centigrade Fahrenheit 1.8CE+32centimeters inches 0.3937cubic meters (m3) liters (L) 1,000Fahrenheit centigrade 0.556FE-17.8feet per second (ft/sec) miles/hour (mi/hr) 0.6818gallons (gal) liters (L) 3.785gallons per acre (gal/acre) liters per hectare (L/ha) 9.34grams (g) ounces, (oz) 0.03527grams (g) pounds, (oz) 0.002205hectares (ha) acres 2.471inches (in) centimeters (cm) 2.540kilograms (kg) ounces, (oz) 35.274kilograms (kg) pounds, (lb) 2.2046kilograms per hectare (hg/ha) pounds per acre (lb/acre) 0.892kilometers (km) miles (mi) 0.6214liters (L) cubic centimeters (cm3) 1,000liters (L) gallons (gal) 0.2642liters (L) ounces, fluid (oz) 33.814miles (mi) kilometers (km) 1.609miles per hour (mi/hr) cm/sec 44.70milligrams (mg) ounces (oz) 0.000035meters (m) feet 3.281ounces (oz) grams (g) 28.3495ounces per acre (oz/acre) grams per hectare (g/ha) 70.1ounces per acre (oz/acre) kilograms per hectare (kg/ha) 0.0701ounces fluid cubic centimeters (cm3) 29.5735pounds (lb) grams (g) 453.6pounds (lb) kilograms (kg) 0.4536pounds per acre (lb/acre) kilograms per hectare (kg/ha) 1.121pounds per acre (lb/acre) mg/square meter (mg/m2) 112.1pounds per acre (lb/acre) µg/square centimeter (µg/cm 2) 11.21pounds per gallon (lb/gal) grams per liter (g/L) 119.8square centimeters (cm2) square inches (in2) 0.155square centimeters (cm2) square meters (m2) 0.0001square meters (m2) square centimeters (cm2) 10,000yards meters 0.9144
Note: All references to pounds and ounces refer to avoirdupois weights unless otherwise specified.
ix
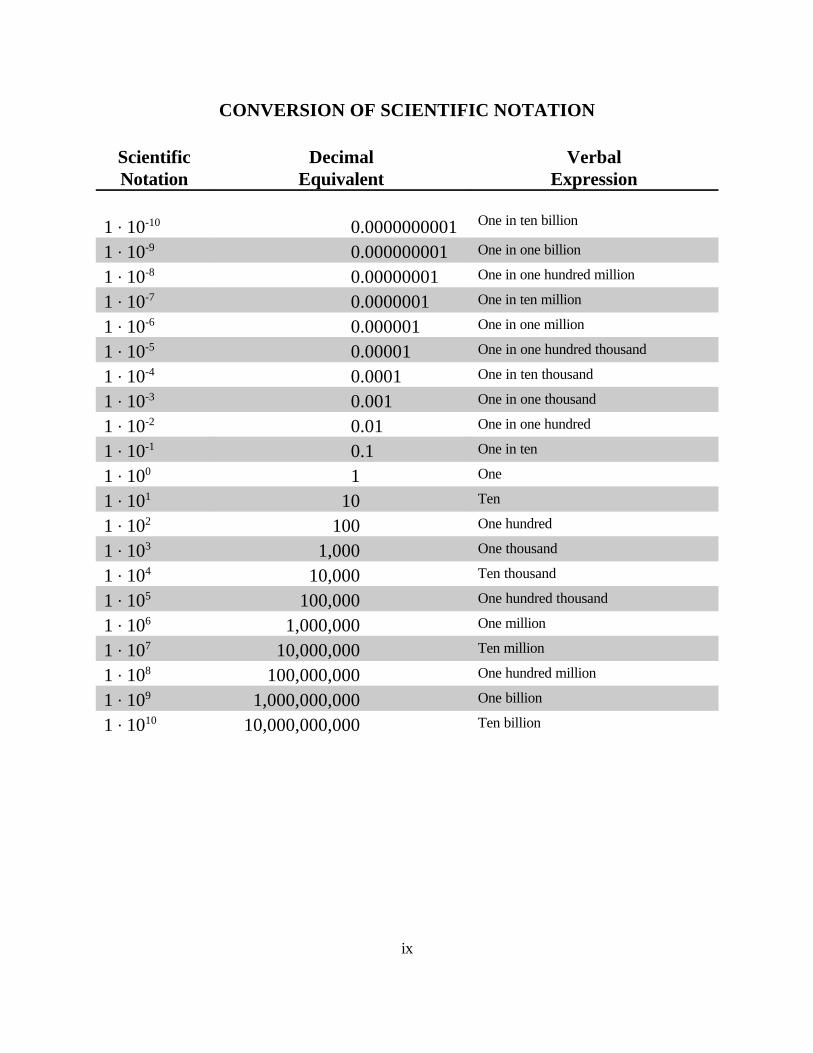
CONVERSION OF SCIENTIFIC NOTATION
ScientificNotation
DecimalEquivalent
VerbalExpression
1 @ 10-10 0.0000000001 One in ten billion
1 @ 10-9 0.000000001 One in one billion
1 @ 10-8 0.00000001 One in one hundred million
1 @ 10-7 0.0000001 One in ten million
1 @ 10-6 0.000001 One in one million
1 @ 10-5 0.00001 One in one hundred thousand
1 @ 10-4 0.0001 One in ten thousand
1 @ 10-3 0.001 One in one thousand
1 @ 10-2 0.01 One in one hundred
1 @ 10-1 0.1 One in ten
1 @ 100 1 One
1 @ 101 10 Ten
1 @ 102 100 One hundred
1 @ 103 1,000 One thousand
1 @ 104 10,000 Ten thousand
1 @ 105 100,000 One hundred thousand
1 @ 106 1,000,000 One million
1 @ 107 10,000,000 Ten million
1 @ 108 100,000,000 One hundred million
1 @ 109 1,000,000,000 One billion
1 @ 1010 10,000,000,000 Ten billion
x
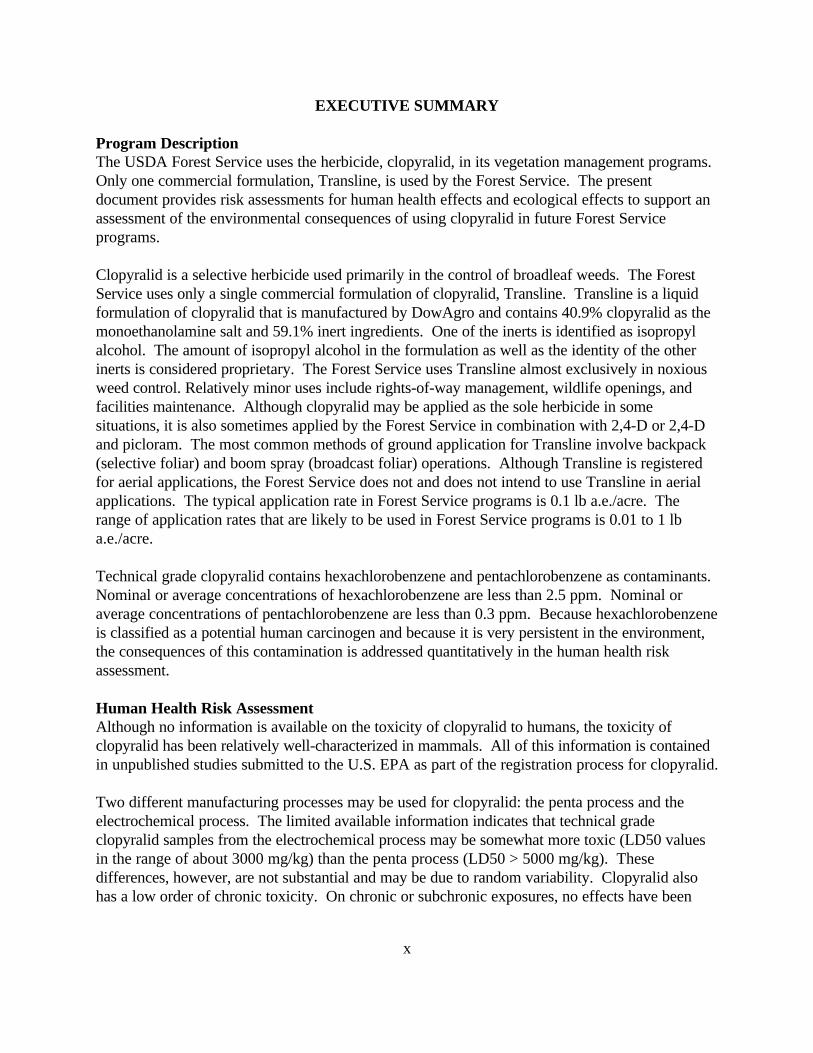
EXECUTIVE SUMMARY
Program DescriptionThe USDA Forest Service uses the herbicide, clopyralid, in its vegetation management programs. Only one commercial formulation, Transline, is used by the Forest Service. The presentdocument provides risk assessments for human health effects and ecological effects to support anassessment of the environmental consequences of using clopyralid in future Forest Serviceprograms.
Clopyralid is a selective herbicide used primarily in the control of broadleaf weeds. The ForestService uses only a single commercial formulation of clopyralid, Transline. Transline is a liquidformulation of clopyralid that is manufactured by DowAgro and contains 40.9% clopyralid as themonoethanolamine salt and 59.1% inert ingredients. One of the inerts is identified as isopropylalcohol. The amount of isopropyl alcohol in the formulation as well as the identity of the otherinerts is considered proprietary. The Forest Service uses Transline almost exclusively in noxiousweed control. Relatively minor uses include rights-of-way management, wildlife openings, andfacilities maintenance. Although clopyralid may be applied as the sole herbicide in somesituations, it is also sometimes applied by the Forest Service in combination with 2,4-D or 2,4-Dand picloram. The most common methods of ground application for Transline involve backpack(selective foliar) and boom spray (broadcast foliar) operations. Although Transline is registeredfor aerial applications, the Forest Service does not and does not intend to use Transline in aerialapplications. The typical application rate in Forest Service programs is 0.1 lb a.e./acre. Therange of application rates that are likely to be used in Forest Service programs is 0.01 to 1 lba.e./acre.
Technical grade clopyralid contains hexachlorobenzene and pentachlorobenzene as contaminants. Nominal or average concentrations of hexachlorobenzene are less than 2.5 ppm. Nominal oraverage concentrations of pentachlorobenzene are less than 0.3 ppm. Because hexachlorobenzeneis classified as a potential human carcinogen and because it is very persistent in the environment,the consequences of this contamination is addressed quantitatively in the human health riskassessment.
Human Health Risk AssessmentAlthough no information is available on the toxicity of clopyralid to humans, the toxicity ofclopyralid has been relatively well-characterized in mammals. All of this information is containedin unpublished studies submitted to the U.S. EPA as part of the registration process for clopyralid.
Two different manufacturing processes may be used for clopyralid: the penta process and theelectrochemical process. The limited available information indicates that technical gradeclopyralid samples from the electrochemical process may be somewhat more toxic (LD50 valuesin the range of about 3000 mg/kg) than the penta process (LD50 > 5000 mg/kg). Thesedifferences, however, are not substantial and may be due to random variability. Clopyralid alsohas a low order of chronic toxicity. On chronic or subchronic exposures, no effects have been
xi
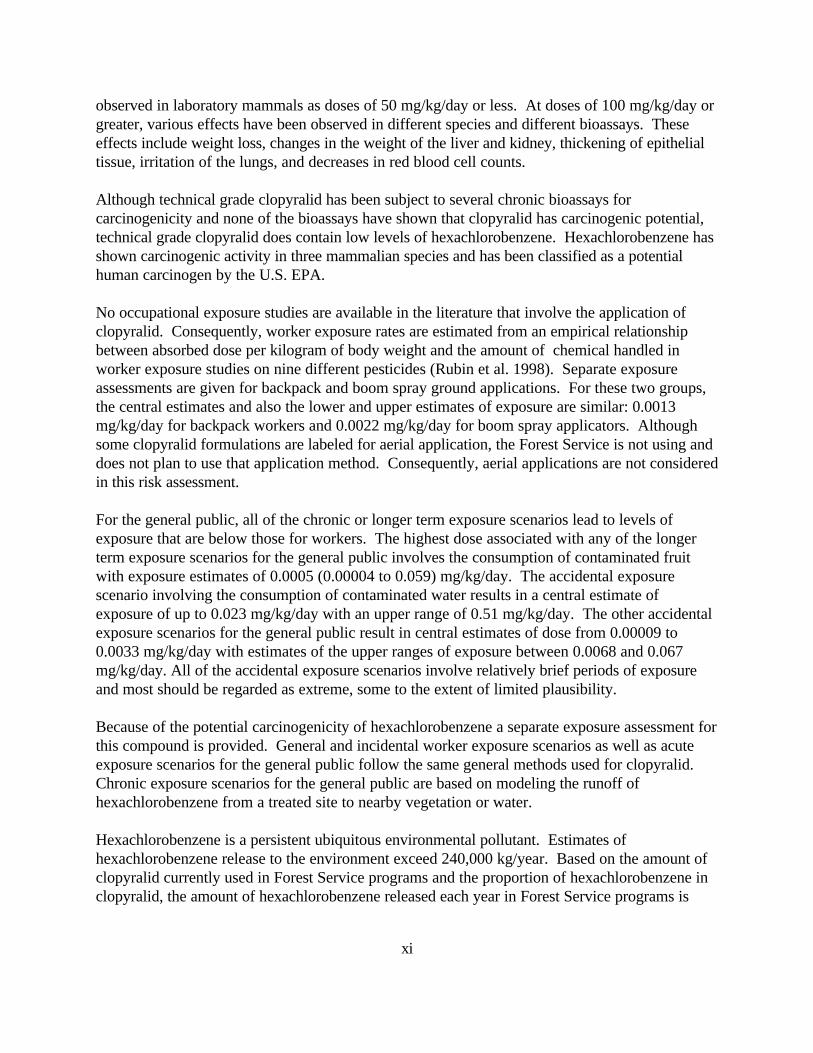
observed in laboratory mammals as doses of 50 mg/kg/day or less. At doses of 100 mg/kg/day orgreater, various effects have been observed in different species and different bioassays. Theseeffects include weight loss, changes in the weight of the liver and kidney, thickening of epithelialtissue, irritation of the lungs, and decreases in red blood cell counts.
Although technical grade clopyralid has been subject to several chronic bioassays forcarcinogenicity and none of the bioassays have shown that clopyralid has carcinogenic potential,technical grade clopyralid does contain low levels of hexachlorobenzene. Hexachlorobenzene hasshown carcinogenic activity in three mammalian species and has been classified as a potentialhuman carcinogen by the U.S. EPA.
No occupational exposure studies are available in the literature that involve the application ofclopyralid. Consequently, worker exposure rates are estimated from an empirical relationshipbetween absorbed dose per kilogram of body weight and the amount of chemical handled inworker exposure studies on nine different pesticides (Rubin et al. 1998). Separate exposureassessments are given for backpack and boom spray ground applications. For these two groups,the central estimates and also the lower and upper estimates of exposure are similar: 0.0013mg/kg/day for backpack workers and 0.0022 mg/kg/day for boom spray applicators. Althoughsome clopyralid formulations are labeled for aerial application, the Forest Service is not using anddoes not plan to use that application method. Consequently, aerial applications are not consideredin this risk assessment.
For the general public, all of the chronic or longer term exposure scenarios lead to levels ofexposure that are below those for workers. The highest dose associated with any of the longerterm exposure scenarios for the general public involves the consumption of contaminated fruitwith exposure estimates of 0.0005 (0.00004 to 0.059) mg/kg/day. The accidental exposurescenario involving the consumption of contaminated water results in a central estimate ofexposure of up to 0.023 mg/kg/day with an upper range of 0.51 mg/kg/day. The other accidentalexposure scenarios for the general public result in central estimates of dose from 0.00009 to0.0033 mg/kg/day with estimates of the upper ranges of exposure between 0.0068 and 0.067mg/kg/day. All of the accidental exposure scenarios involve relatively brief periods of exposureand most should be regarded as extreme, some to the extent of limited plausibility.
Because of the potential carcinogenicity of hexachlorobenzene a separate exposure assessment forthis compound is provided. General and incidental worker exposure scenarios as well as acuteexposure scenarios for the general public follow the same general methods used for clopyralid. Chronic exposure scenarios for the general public are based on modeling the runoff ofhexachlorobenzene from a treated site to nearby vegetation or water.
Hexachlorobenzene is a persistent ubiquitous environmental pollutant. Estimates ofhexachlorobenzene release to the environment exceed 240,000 kg/year. Based on the amount ofclopyralid currently used in Forest Service programs and the proportion of hexachlorobenzene inclopyralid, the amount of hexachlorobenzene released each year in Forest Service programs is
xii
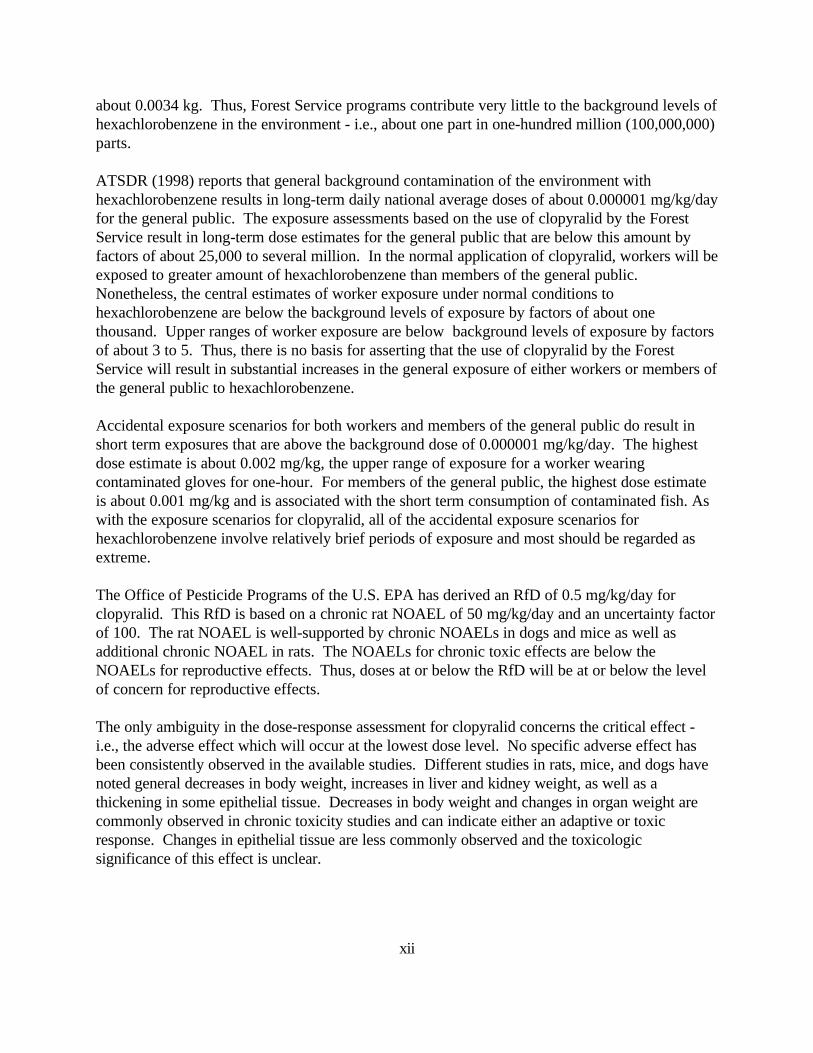
about 0.0034 kg. Thus, Forest Service programs contribute very little to the background levels ofhexachlorobenzene in the environment - i.e., about one part in one-hundred million (100,000,000)parts.
ATSDR (1998) reports that general background contamination of the environment withhexachlorobenzene results in long-term daily national average doses of about 0.000001 mg/kg/dayfor the general public. The exposure assessments based on the use of clopyralid by the ForestService result in long-term dose estimates for the general public that are below this amount byfactors of about 25,000 to several million. In the normal application of clopyralid, workers will beexposed to greater amount of hexachlorobenzene than members of the general public. Nonetheless, the central estimates of worker exposure under normal conditions tohexachlorobenzene are below the background levels of exposure by factors of about onethousand. Upper ranges of worker exposure are below background levels of exposure by factorsof about 3 to 5. Thus, there is no basis for asserting that the use of clopyralid by the ForestService will result in substantial increases in the general exposure of either workers or members ofthe general public to hexachlorobenzene.
Accidental exposure scenarios for both workers and members of the general public do result inshort term exposures that are above the background dose of 0.000001 mg/kg/day. The highestdose estimate is about 0.002 mg/kg, the upper range of exposure for a worker wearingcontaminated gloves for one-hour. For members of the general public, the highest dose estimateis about 0.001 mg/kg and is associated with the short term consumption of contaminated fish. Aswith the exposure scenarios for clopyralid, all of the accidental exposure scenarios forhexachlorobenzene involve relatively brief periods of exposure and most should be regarded asextreme.
The Office of Pesticide Programs of the U.S. EPA has derived an RfD of 0.5 mg/kg/day forclopyralid. This RfD is based on a chronic rat NOAEL of 50 mg/kg/day and an uncertainty factorof 100. The rat NOAEL is well-supported by chronic NOAELs in dogs and mice as well asadditional chronic NOAEL in rats. The NOAELs for chronic toxic effects are below theNOAELs for reproductive effects. Thus, doses at or below the RfD will be at or below the levelof concern for reproductive effects.
The only ambiguity in the dose-response assessment for clopyralid concerns the critical effect -i.e., the adverse effect which will occur at the lowest dose level. No specific adverse effect hasbeen consistently observed in the available studies. Different studies in rats, mice, and dogs havenoted general decreases in body weight, increases in liver and kidney weight, as well as athickening in some epithelial tissue. Decreases in body weight and changes in organ weight arecommonly observed in chronic toxicity studies and can indicate either an adaptive or toxicresponse. Changes in epithelial tissue are less commonly observed and the toxicologicsignificance of this effect is unclear.
xiii
The data on the toxicity of clopyralid are adequate for additional dose-response or dose-severitymodeling. Because none of the anticipated exposures substantially exceed the RfD and the greatmajority of anticipated exposures are far below the RfD, such additional modeling is not necessaryfor the characterization of risk.
The contamination of technical grade clopyralid with hexachlorobenzene and pentachlorobenzenecan be quantitatively considered to a limited extent. The U.S. EPA has derived RfDs for bothpentachlorobenzene and hexachlorobenzene and a cancer potency factor for hexachlorobenzene. Based on the levels of contamination of technical grade clopyralid with these compounds and therelative potencies of these compounds to clopyralid, this contamination is not significant in termsof potential systemic toxic effects. This assessment, however, does not reduce concern for thepotential carcinogenicity associated with hexachlorobenzene and this risk is quantitativelyconsidered.
The risk characterization for potential human health effects associated with the use of clopyralidin Forest Service programs is relatively unambiguous. Based on the estimated levels of exposureand the criteria for chronic exposure developed by the U.S. EPA, there is no evidence that typicalor accidental exposures will lead to dose levels that exceed the level of concern. In other words,all of the anticipated exposures - most of which involve highly conservative assumptions - are ator below the RfD. The use of the RfD - which is designed to be protective of chronic or lifetimeexposures - is itself a very conservative component of this risk characterization because theduration of any plausible and substantial exposures is far less than lifetime.
Irritation and damage to the skin and eyes can result from exposure to relatively high levels of clopyralid - i.e., placement of clopyralid directly onto the eye or skin. From a practicalperspective, eye or skin irritation is likely to be the only overt effect as a consequence ofmishandling clopyralid. These effects can be minimized or avoided by prudent industrial hygienepractices during the handling of clopyralid.
The only reservation attached to this assessment of clopyralid is that associated with any riskassessment: Absolute safety cannot be proven and the absence of risk can never bedemonstrated. No chemical, including clopyralid, has been studied for all possible effects and theuse of data from laboratory animals to estimate hazard or the lack of hazard to humans is aprocess that is fraught with uncertainty. Prudence dictates that normal and reasonable care shouldbe taken in the handling of this or any other chemical. Notwithstanding these reservations, theuse of clopyralid does not appear to pose any identifiable hazard to workers or the general publicin Forest Service programs.
The contamination of clopyralid with hexachlorobenzene does not appear to present anysubstantial cancer risk. Administratively, the Forest Service has adopted a cancer risk level of onein one-million (1÷1,000,000) as a trigger that would require special steps to mitigate exposure orrestrict and possibly eliminate use. Based on relatively conservative exposure assumptions, therisk levels estimated for members of the general public are below this trigger level. The highest
xiv
risk level is estimated at about 8 in 100 million, about a factor of 12 below the level of concern. The exposure scenario associated with this risk level involves the consumption of contaminatedfish by subsistence populations - i.e., groups that consume relatively large amounts ofcontaminated fish. The consumption of fish contaminated with hexachlorobenzene is a primaryexposure scenario of concern because of the tendency of hexachlorobenzene to bioconcentratefrom water into fish. This is also consistent with the general observation that exposure tohexachlorobenzene occurs primarily through the consumption of contaminated food.
For workers, the only cancer risk level that approaches a level of concern involves workerswearing contaminated gloves for one-hour. In this instance, the risk level is about one in ten-million, a factor of 10 below the Forest Service trigger level of one in one-million. As with thefish consumption scenario for members of the general public, the contaminated glove scenario forworkers leads to relatively high risks because of the tendency of hexachlorobenzene to partitioninto fatty tissue.
Both of these relatively high risk scenarios are based on upper ranges of plausible exposures. Based on central estimates of exposure, the cancer risk levels are below the trigger level byfactors of about one-thousand (1000) to ten-million (10,000,000). In other words, the cancer riskestimates based on central or most likely estimates of exposure are in the range of about 1 in one-billion (1÷1,000,000,000) to less than 1 in one-trillion (1÷1,000,000,000,000).
In terms of potential toxic effects, the only scenarios of marginal concern with hexachlorobenzeneare the scenarios that approach the level of concern for cancer risk: consumption of contaminatedfish by members of the general public and workers wearing contaminated gloves. In all cases,however, projected exposures are below the RfD by at least a factor of five.
The simple verbal interpretation of this risk characterization is that, in general, the contaminationof clopyralid with hexachlorobenzene does not appear to pose a risk to the general public. Theprolonged use of clopyralid at the highest plausible application rate, 1 lb a.e./acre, could approacha level of concern in areas with small ponds or lakes used for fishing and in areas with localconditions that favor runoff. In such cases, site-specific exposure assessments and/or monitoringof hexachlorobenzene concentrations in water could be considered.
Ecological Risk AssessmentThe toxicity of clopyralid is relatively well characterized in experimental mammals but few wildlifespecies have been assayed relative to the large number of non-target species that might bepotentially affected by the use of clopyralid. Within this admittedly substantial reservation,clopyralid appears to be relatively non-toxic to terrestrial or aquatic animals, is highly selective inits toxicity to terrestrial plants, and relatively non-toxic to aquatic plants. Thus, the potential forsubstantial effects on non-target species appears to be remote. Consistent with this assessment oftoxicity to non-target species, one long-term field study has been conducted that indicates nosubstantial or significant effects on species diversity.
xv
The toxicity to non-target terrestrial animals is based almost exclusively on toxicity studies usingexperimental mammals - i.e., the same studies used in the human health risk assessment. Someadditional studies are available on birds, bees, and earthworms that generally support thecharacterization of clopyralid as relatively non-toxic. An additional study of the toxicity ofclopyralid to non-target invertebrates also suggests that clopyralid has a low potential for risk. Acaveat in the interpretation of this study is the limited detail in which the experimental data arereported. As with terrestrial species, the available data on aquatic species, both plants andanimals, suggest that clopyralid is relatively non-toxic.
The toxicity of clopyralid to terrestrial plants has been examined in substantial detail in studiesthat have been published in the open literature as well as studies that have been submitted to theU.S. EPA to support the registration of clopyralid. Clopyralid is a plant growth regulator andacts as a synthetic auxin or hormone, altering the metabolism and growth characteristics of theplant and causing a proliferation of abnormal growth that interferes with the transport of nutrientsthroughout the plant. This, in turn, can result in gross signs of damage and the death of the plant. The phytotoxicity of clopyralid is relatively specific to broadleaf plants because clopyralid israpidly absorbed across leaf surfaces but much less readily absorbed by the roots of plants. Forthe same reason, clopyralid is much more toxic/effective in post-emergent treatments (i.e., foliarapplication) than pre-emergent treatment (i.e., application to soil).
Clopyralid does not bind tightly to soil and thus would seem to have a high potential for leaching. While there is little doubt that clopyralid will leach under conditions that favor leaching - i..e.,sandy soil, a sparse microbial population, and high rainfall - the potential for leaching or runoff isfunctionally reduced by the relatively rapid degradation of clopyralid in soil. A number of fieldlysimeter studies and one long-term field study indicate that leaching and subsequentcontamination of ground water are not likely to be substantial. This conclusion is also consistentwith a short-term monitoring study of clopyralid in surface water after aerial application.
For terrestrial mammals, the dose-response assessment for clopyralid is based on the same data asthe human health risk assessment (i.e., a NOAEL of 50 mg/kg/day from a 2-year rat feedingstudy). None of the exposure scenarios, acute or longer-term, result in exposure estimates thatexceed this NOAEL. The very limited data on toxicity to birds suggest that birds may besomewhat more sensitive than mammals. The data on birds, however, are not as extensive or ofthe same detail as the data on experimental mammals. The available data on terrestrialinvertebrate are also less complete than the data on mammals. Nonetheless, there is no indicationthat clopyralid is highly toxic to birds or terrestrial invertebrates.
The toxicity of clopyralid to terrestrial plants can be characterized relatively well and with littleambiguity. Clopyralid is more toxic to broadleaf plants than grains or grasses and is more toxic inpost-emergence applications - i.e., foliar spray - than pre-emergence applications - i.e., soiltreatment. Many non-target species - especially grains, grasses, and several types of trees - arenot likely to be affected by clopyralid even if the plants are sprayed at application rates of 0.1 lba.e./acre or greater. When applications are made prior to emergence - i.e., directly to the soil
xvi
before the germination of the plant seeds - NOAELs for sensitive species such as soybeans, snapbeans, tomatoes, and sunflowers are in the range of 0.028 to 0.056 kg/ha. When applied directlyto the foliage - i.e., post-emergence - the NOAELs are about 0.00056 kg/ha. This difference isattributable to the very rapid absorption of clopyralid after direct foliar application.
Based on the results of acute bioassays, fish and aquatic invertebrates are equally sensitive toclopyralid. While there are no chronic studies available in fish, a chronic reproductive NOAEL ofabout 20 mg/L has been determined in Daphnia magna, a common aquatic invertebrate testspecies. Given the low levels of plausible exposure to clopyralid in water, this NOAEL can beused to characterize risk to both fish and aquatic invertebrates. Aquatic plants are somewhatmore sensitive than aquatic animals to clopyralid. The lowest reported LC50 for aquatic algae is6.9 mg/L, about a factor of 3 below the chronic NOAEL in Daphnia.
Clopyralid is a herbicide and the most likely damage to non-target species will involve terrestrialplants. As is the case with any herbicide, the likelihood of damage to non-target plant species isrelated directly to the difference between the sensitivity of target species—which dictates theapplication rate—and the sensitivity of the potential non-target species. In this respect, theapparent selectively of clopyralid substantially narrows the number of non-target plants that mightbe affected. With clopyralid, some sensitive post-emergent plants could be adversely effected byoff-site drift over a relatively narrow band. Most species of trees, grains, or grasses, however, arenot likely to be affected by off-site drift or even direct spray. This risk characterization isconservative in that the off-site drift estimates are derived from studies involving aerialapplication. Well-directed ground applications conducted under conditions that do not favor off-site drift will probably have no substantial or detectable impact on off-site plant species outside ofa very narrow range - i.e., less than and perhaps much less than 25 feet.
Soil contamination by runoff, which could potentially harm off-site plant species, does not appearto be a major concern with clopyralid. Rains are most likely to cause clopyralid to leach into thesoil column rather than wash-off. The best available estimate of runoff is on the order of 0.015(1½%) of the applied amount. Because clopyralid is less effectively absorbed from roots thanfrom leaf surfaces, the consequences of runoff are likely to be less severe than those of drift. Inaddition, once in the soil column, clopyralid will be rapidly degraded except in arid soils with lowmicrobial populations. Thus, while damage to off-site plants from runoff cannot be ruled-outunder conditions that would be highly favorable to runoff, this is not likely to be a major problemwith clopyralid.
The potential for adverse effects on other non-target species appears to be remote. The weight ofevidence suggests that no adverse effects in terrestrial or aquatic animals are plausible usingtypical or even very conservative worst case exposure assumptions. Some inhibition of growth inaquatic plants would be possible in cases involving accidental spills. Such effects, however,would be transient.
xvii
As with the human health risk assessment, this characterization of risk must be qualified by thegeneral reservation in any risk assessment: Absolute safety cannot be proven and the absence ofrisk can never be demonstrated. Clopyralid has been tested in only a limited number of speciesand under conditions that may not well-represent populations of free-ranging non-target animalsor some populations of non-target plants. Notwithstanding this limitation, the available data donot indicate that adverse effects are likely in terrestrial or aquatic animals from the use of thiscompound in Forest Service programs. Under normal and proper conditions of application,effects on non-target vegetation would likely be confined to sensitive plant species in or very nearto the treatment area.
1-1
1. INTRODUCTION
The USDA Forest Service uses the herbicide, clopyralid, in its vegetation management programs. Only one commercial formulation, Transline, is used by the Forest Service. The presentdocument provides risk assessments for human health effects and ecological effects to support anassessment of the environmental consequences of using clopyralid in future Forest Serviceprograms.
This document has four chapters, including the introduction, program description, risk assessmentfor human health effects, and risk assessment for ecological effects or effects on wildlife species. Each of the two risk assessment chapters has four major sections, including an identification ofthe hazards associated with clopyralid and its commercial formulation, an assessment of potentialexposure to the product, an assessment of the dose-response relationships, and a characterizationof the risks associated with plausible levels of exposure. These are the basic steps recommendedby the National Research Council of the National Academy of Sciences (NRC 1983) forconducting and organizing risk assessments.
Although this is a technical support document and addresses some specialized technical areas, aneffort was made to ensure that the document can be understood by individuals who do not havespecialized training in the chemical and biological sciences. Certain technical concepts, methods,and terms common to all parts of the risk assessment are described in plain language in a separatedocument (SERA 1998). Furthermore, the technical terms are defined in the glossary to this riskassessment. Some of the more complicated terms and concepts are defined, as necessary, in thetext.
The human health and ecological risk assessments presented in this document are not, and are notintended to be, comprehensive summaries of all of the available information. No publishedreviews regarding the human health or ecological effects of clopyralid have been encountered. Moreover, almost all of the mammalian toxicology studies and most of the ecotoxicology studiesare unpublished reports submitted to the U.S. EPA as part of the registration process for thiscompound.
Because of the lack of a detailed, recent review concerning clopyralid and the preponderance ofunpublished relevant data in U.S. EPA files, a complete search of the U.S. EPA files wasconducted. Full text copies of relevant studies were kindly provided by the U.S. EPA Office ofPesticide Programs. These studies were reviewed, discussed in sections 3 and 4 as necessary, andsynopses of the most relevant studies are provided in the appendices to this document.
In the interest of economy, an updated chemical background statement has not been preparedwith the current risk assessment. The information presented in the appendices and the detaileddiscussions in sections 2, 3, and 4 of the risk assessment are intended to be detailed enough tosupport an independent review of the risk analyses; however, they are not intended to be asdetailed as the information generally presented in Chemical Background documents.
1-2
For the most part, the risk assessment methods used in this document are similar to those used inrisk assessments previously conducted for the Forest Service as well as risk assessmentsconducted by other government agencies. Details regarding the specific methods used to preparethe human health risk assessment are provided in SERA (1998), while detailed explanations ofspecific methods used in estimating occupational exposure are provided in Rubin et al. (1998). Similar documentation for methods used in assessing dermal absorption are provided in Durkin etal. (1998).
Risk assessments are usually expressed with numbers; however, the numbers are far from exact. Variability and uncertainty may be dominant factors in any risk assessment, and these factorsshould be expressed. Within the context of a risk assessment, the terms variability anduncertainty signify different conditions.
Variability reflects the knowledge of how things may change. Variability may take several forms. For this risk assessment, three types of variability are distinguished: statistical, situational, andarbitrary. Statistical variability reflects, at least, apparently random patterns in data. Forexample, various types of estimates used in this risk assessment involve relationships of certainphysical properties to certain biological properties. In such cases, best or maximum likelihoodestimates can be calculated as well as upper and lower confidence intervals that reflect thestatistical variability in the relationships. Situational variability describes variations depending onknown circumstances. For example, the application rate or the applied concentration of aherbicide will vary according to local conditions and goals. As discussed in the following section,the limits on this variability are known and there is some information to indicate what thevariations are. In other words, situational variability is not random. Arbitrary variability, as thename implies, represents an attempt to describe changes that cannot be characterized statisticallyor by a given set of conditions that cannot be well defined. This type of variability dominatessome spill scenarios involving either a spill of a chemical on to the surface of the skin or a spill ofa chemical into water. In either case, exposure depends on the amount of chemical spilled and thearea of skin or volume of water that is contaminated.
Variability reflects a knowledge or at least an explicit assumption about how things may change,while uncertainty reflects a lack of knowledge. For example, the focus of the human healthdose-response assessment is an estimation of an “acceptable” or “no adverse effect“ dose that willnot be associated with adverse human health effects. For clopyralid and for most other chemicals,however, this estimation regarding human health must be based on data from experimental animalstudies, which cover only a limited number of effects. Generally, judgment, not analyticalmethods, is the basis for the methods used to make the assessment. Although the judgments mayreflect a consensus (i.e., be used by many groups in a reasonably consistent manner), the resultingestimations of risk cannot be proven analytically. In other words, the estimates regarding riskinvolve uncertainty. The primary functional distinction between variability and uncertainty is thatvariability is expressed quantitatively, while uncertainty is generally expressed qualitatively.
In considering different forms of variability, almost no risk estimate presented in this document isgiven as a single number. Usually, risk is expressed as a central estimate and a range, which is
1-3
sometimes very large. Because of the need to encompass many different types of exposure aswell as the need to express the uncertainties in the assessment, this risk assessment involvesnumerous calculations.
Most of the calculations are relatively simple, and the very simple calculations are included in thebody of the document. Some of the calculations, however, are cumbersome. For thosecalculations, worksheets are included as an attachment to the risk assessment. The worksheetsprovide the details for the estimates cited in the body of the document. The worksheets aredivided into the following sections: general data and assumptions, chemical specific data andassumptions, exposure assessments for workers, exposure assessments for the general public, andexposure assessments for effects on non-target organisms. Because of the importance ofhexachlorobenzene, a contaminant in technical grade clopyralid, to the human health riskassessment, a separate subset of worksheets for hexachlorobenzene are provided that detail thecalculations involved in assessing the health effects of hexachlorobenzene.
2-1
2. PROGRAM DESCRIPTION
2.1. OVERVIEWClopyralid is a selective herbicide used primarily in the control of broadleaf weeds. The ForestService uses only a single commercial formulation of clopyralid, Transline. Transline is a liquidformulation of clopyralid that is manufactured by DowAgro and contains 40.9% clopyralid as themonoethanolamine salt and 59.1% inert ingredients. One of the inerts is identified as isopropylalcohol. The amount of isopropyl alcohol in the formulation as well as the identity of the otherinerts is considered proprietary. The Forest Service uses Transline almost exclusively in noxiousweed control. Relatively minor uses include rights-of-way management, wildlife openings, andfacilities maintenance. Although clopyralid may be applied as the sole herbicide in somesituations, it is also sometimes applied by the Forest Service in combination with 2,4-D or 2,4-Dand picloram. The most common methods of ground application for Transline involve backpack(selective foliar) and boom spray (broadcast foliar) operations. Although Transline is registeredfor aerial applications, the Forest Service does not and does not intend to use Transline in aerialapplications. The typical application rate in Forest Service programs is 0.1 lb a.e./acre. Therange of application rates that are likely to be used in Forest Service programs is 0.01 to 1 lba.e./acre.
Technical grade clopyralid contains hexachlorobenzene and pentachlorobenzene as contaminants. Nominal or average concentrations of hexachlorobenzene are less than 2.5 ppm. Nominal oraverage concentrations of pentachlorobenzene are less than 0.3 ppm (Lade 1998).
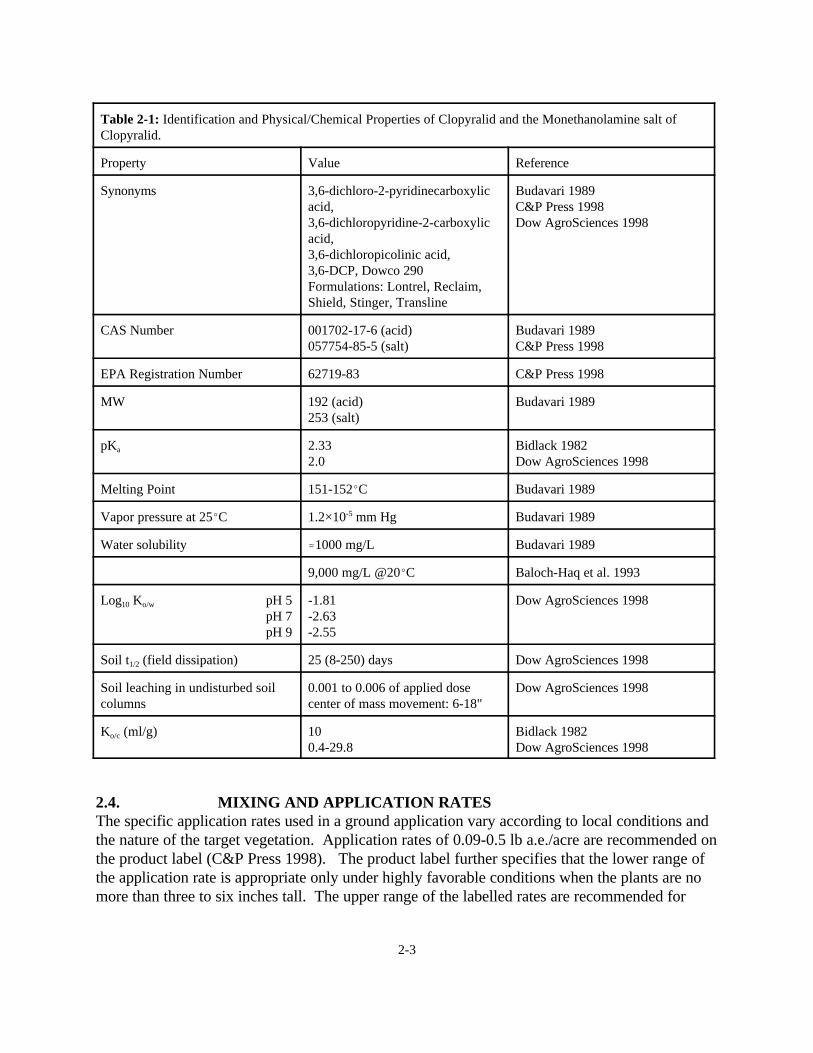
2.2. CHEMICAL DESCRIPTION AND COMMERCIAL FORMULATIONSClopyralid is the common name for 3,6-dichloro-2-pyridinecarboxylic acid:
Selected chemical and physical properties of clopyralid are summarized in Table 2-1. Additionalinformation is presented in worksheet B03.
There are two different manufacturing processes used in the synthesis of clopyralid: the pentaprocess and the electrochemical process. The penta process is the original method used in themanufacturing of clopyralid. The electrochemical process is a new procedure. The two processesyield “slightly different ingredient profiles” (Dow AgroSciences 1998). Details of these methodshave been submitted to the U.S. EPA but are considered proprietary and are not detailed in thisrisk assessment. Nonetheless, some comparative information is available on the acute toxicity ofclopyralid produced by both the penta and electrochemical processes and these data aresummarized in sections 3 and 4.
2-2
Technical grade clopyralid contains hexachlorobenzene and pentachlorobenzene as contaminants. Nominal or average concentrations of hexachlorobenzene are less than 2.5 ppm. Nominal oraverage concentrations of pentachlorobenzene are less than 0.3 ppm (Lade 1998). The impact ofthese contaminants to this risk assessment is detailed in section 3.
Transline is the only formulation of clopyralid used by the Forest Service. Transline is producedby Dow AgroSciences and is formulated as a liquid containing the monoethanolamine salt ofclopyralid (40.9% w/v). This is equivalent to a concentration of 3 lb a.e./gallon. The remaining59.1% of the formulation consists of inerts. The identity of the inerts in Transline is proprietarywith the exception of isopropyl alcohol. This inert is listed on the Transline MSDS, but theamount of isopropyl alcohol in the formulation is not disclosed (C&P Press 1998). The potentialsignificance of the inerts in Transline to this risk assessment is discussed further in section 3.1.9.
Transline is labelled for use only in non-crop and non-timber areas. It has no labeled uses oncrops. The uses for Transline recommended on the product label include selective,postemergence control of broadleaf weeds on rights-of-way and the maintenance of wildlifeopenings, wild parkland and wildlife management areas, and forest spot applications adjacent tosuch areas (C&P Press 1998).
2.3. APPLICATION METHODSDetailed descriptions regarding the use of herbicides in silviculture and the various methods ofherbicide application are available in the general literature [e.g., Cantrell and Hyland (1985)] andin earlier risk assessments conducted by the Forest Service (USDA 1989a,b,c). The followingsummary focuses on those aspects of application that are most relevant to the exposureassessments (sections 3.2 and 4.2).
The most common methods of ground application for Transline involve backpack (selective foliar)and boom spray (broadcast foliar) operations. In selective foliar applications, the herbicide sprayeror container is carried by backpack and the herbicide is applied to selected target vegetation. Application crews may treat up to shoulder high brush, which means that chemical contact with thearms, hands, or face is plausible. To reduce the likelihood of significant exposure, applicationcrews are directed not to walk through treated vegetation. Usually, a worker treats approximately0.5 acres/hour with a plausible range of 0.25-1.0 acre/hour.
Boom spray is used primarily in rights-of-way management. Spray equipment mounted ontractors or trucks is used to apply the herbicide on either side of the roadway. Usually, about 8acres are treated in a 45-minute period (approximately 11 acres/hour). Some special truckmounted spray systems may be used to treat up to 12 acres in a 35-minute period withapproximately 300 gallons of herbicide mixture (approximately 21 acres/hour and 510gallons/hour) (USDA 1989b, p 2-9 to 2-10).
Although Transline is registered for aerial applications (C&P Press 1998), the Forest Service doesnot and does not intend to use Transline in aerial applications.
2-3
Table 2-1: Identification and Physical/Chemical Properties of Clopyralid and the Monethanolamine salt ofClopyralid.
Property Value Reference
Synonyms 3,6-dichloro-2-pyridinecarboxylicacid,3,6-dichloropyridine-2-carboxylicacid,3,6-dichloropicolinic acid,3,6-DCP, Dowco 290Formulations: Lontrel, Reclaim,Shield, Stinger, Transline
Budavari 1989C&P Press 1998Dow AgroSciences 1998
CAS Number 001702-17-6 (acid)057754-85-5 (salt)
Budavari 1989C&P Press 1998
EPA Registration Number 62719-83 C&P Press 1998
MW 192 (acid)253 (salt)
Budavari 1989
pKa 2.332.0
Bidlack 1982Dow AgroSciences 1998
Melting Point 151-152EC Budavari 1989
Vapor pressure at 25EC 1.2×10⁻⁵ mm Hg Budavari 1989
Water solubility .1000 mg/L Budavari 1989
9,000 mg/L @20EC Baloch-Haq et al. 1993
Log10 Ko/w pH 5pH 7pH 9
-1.81-2.63-2.55
Dow AgroSciences 1998
Soil t1/2 (field dissipation) 25 (8-250) days Dow AgroSciences 1998
Soil leaching in undisturbed soilcolumns
0.001 to 0.006 of applied dosecenter of mass movement: 6-18"
Dow AgroSciences 1998
Ko/c (ml/g) 100.4-29.8
Bidlack 1982Dow AgroSciences 1998
2.4. MIXING AND APPLICATION RATESThe specific application rates used in a ground application vary according to local conditions andthe nature of the target vegetation. Application rates of 0.09-0.5 lb a.e./acre are recommended onthe product label (C&P Press 1998). The product label further specifies that the lower range ofthe application rate is appropriate only under highly favorable conditions when the plants are nomore than three to six inches tall. The upper range of the labelled rates are recommended for
2-4
Canada thistle or knapweeds.
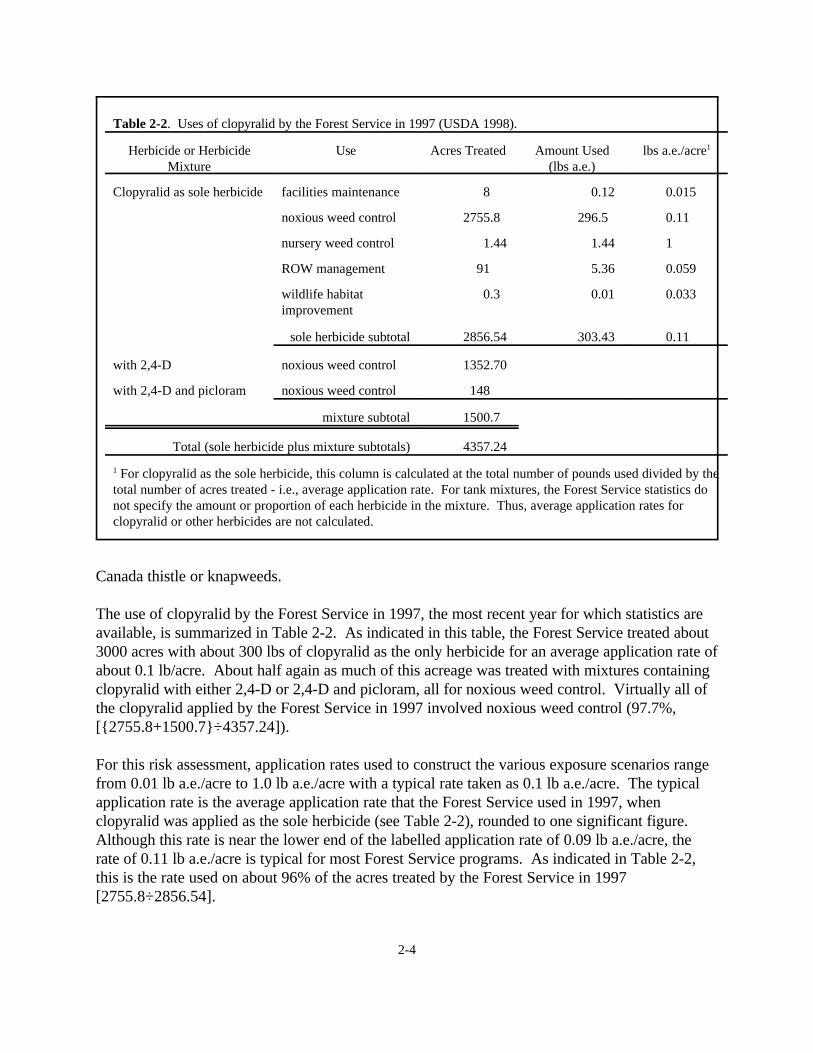
The use of clopyralid by the Forest Service in 1997, the most recent year for which statistics areavailable, is summarized in Table 2-2. As indicated in this table, the Forest Service treated about3000 acres with about 300 lbs of clopyralid as the only herbicide for an average application rate ofabout 0.1 lb/acre. About half again as much of this acreage was treated with mixtures containingclopyralid with either 2,4-D or 2,4-D and picloram, all for noxious weed control. Virtually all ofthe clopyralid applied by the Forest Service in 1997 involved noxious weed control (97.7%,[{2755.8+1500.7}÷4357.24]).
For this risk assessment, application rates used to construct the various exposure scenarios rangefrom 0.01 lb a.e./acre to 1.0 lb a.e./acre with a typical rate taken as 0.1 lb a.e./acre. The typicalapplication rate is the average application rate that the Forest Service used in 1997, whenclopyralid was applied as the sole herbicide (see Table 2-2), rounded to one significant figure. Although this rate is near the lower end of the labelled application rate of 0.09 lb a.e./acre, therate of 0.11 lb a.e./acre is typical for most Forest Service programs. As indicated in Table 2-2,this is the rate used on about 96% of the acres treated by the Forest Service in 1997[2755.8÷2856.54].
Table 2-2. Uses of clopyralid by the Forest Service in 1997 (USDA 1998).
Herbicide or HerbicideMixture
Use Acres Treated Amount Used(lbs a.e.)
lbs a.e./acre1
Clopyralid as sole herbicide facilities maintenance 8 0.12 0.015
noxious weed control 2755.8 296.5 0.11
nursery weed control 1.44 1.44 1
ROW management 91 5.36 0.059
wildlife habitatimprovement
0.3 0.01 0.033
sole herbicide subtotal 2856.54 303.43 0.11
with 2,4-D noxious weed control 1352.70
with 2,4-D and picloram noxious weed control 148
mixture subtotal 1500.7
Total (sole herbicide plus mixture subtotals) 4357.24
1 For clopyralid as the sole herbicide, this column is calculated at the total number of pounds used divided by thetotal number of acres treated - i.e., average application rate. For tank mixtures, the Forest Service statistics donot specify the amount or proportion of each herbicide in the mixture. Thus, average application rates forclopyralid or other herbicides are not calculated.
2-5
The lower limit of the application rate is taken as 0.01 lb a.e./acre, somewhat below the lowestreported use by clopyralid by the Forest Service in 1997.
The upper end of the range of application rates is taken as 1 lb clopyralid a.e./acre. This is abovethe highest labeled application rate (0.5 lb a.e./acre) but is used in this risk assessment because arate of 1.0 lb a.e./acre was used by the Forest Service in 1997 for nursery weed control.
For ground applications, spray volumes of 20 gallons or more per acre are recommended. Forthis risk assessment, 20 gallons per acre is taken as the minimum spray volume. A spray volumeof 40 gallons per acre is taken as an upper range. Based on these application rates and sprayvolumes, the typical field concentration - i.e., the concentration of clopyralid in solution aftermixing and dilution - is taken as 0.4 mg/L with a range of 0.03 mg/L to 6 mg/L. These values aresummarized in worksheet B02 and the calculations for these values are given in the text thatfollows worksheet B01.
3-1
3. HUMAN HEALTH RISK ASSESSMENT
3.1. HAZARD IDENTIFICATION3.1.1. Overview. Although no information is available on the toxicity of clopyralid to humans,the toxicity of clopyralid has been relatively well-characterized in mammals. All of thisinformation is contained in unpublished studies submitted to the U.S. EPA as part of theregistration process for clopyralid.
Two different manufacturing processes may be used for clopyralid: the penta process and theelectrochemical process. The limited available information indicates that technical gradeclopyralid samples from the electrochemical process may be somewhat more toxic (LD50 values inthe range of about 3000 mg/kg) than the penta process (LD50 > 5000 mg/kg). These differences,however, are not substantial and may be due to random variability. Clopyralid also has a loworder of chronic toxicity. On chronic or subchronic exposures, no effects have been observed inlaboratory mammals as doses of 50 mg/kg/day or less. At doses of 100 mg/kg/day or greater,various effects have been observed in different species and different bioassays. These effectsinclude weight loss, changes in the weight of the liver and kidney, thickening of epithelial tissue,irritation of the lungs, and decreases in red blood cell counts.
Although technical grade clopyralid has been subject to several chronic bioassays forcarcinogenicity and none of the bioassays have shown that clopyralid has carcinogenic potential,technical grade clopyralid does contain low levels of hexachlorobenzene. Hexachlorobenzene hasshown carcinogenic activity in three mammalian species and has been classified as a potentialhuman carcinogen by the U.S. EPA. Thus, this effect is considered both qualitatively andquantitatively in this risk assessment.
3.1.2. Acute Toxicity. Although the mechanism of phytotoxic action of clopyralid ischaracterized in some detail (section 4.1), the mechanism of toxic action in mammals or otheranimal species is not well characterized. Standard acute toxicity studies have been conductedwith rats using clopyralid produced from both the penta process, the original method used in themanufacture of clopyralid, and the electrochemical process, a more recently developed method forthe commercial synthesis of clopyralid (appendix 1). As summarized in Dow AgroSciences(1998), the LD50 of clopyralid from the penta process is >5000 mg/kg and the LD50 of clopyralidfrom the electrochemical process is 3738 mg/kg for male rats and 2675 mg/kg for female rats. This information appears to be a summary of the studies by Jeffrey et al. (1987b) and Gilbert andCrissman (1995) on the penta and electrochemical samples, respectively, detailed in Appendix 1. While these data suggest that clopyralid from the newer electrochemical process may besomewhat more toxic than the clopyralid from the older penta process, this assessment is based ononly one study for each type of clopyralid. In addition, these studies were conducted at differenttimes, and the results of acute toxicity studies will vary both among and within laboratories whenassays of the same compound are conducted at different times (Streibig et al. 1995). Thus, theapparent differences between the two studies should not be overly interpreted.
3-2
Gilbert and Crissman (1995) observed gross changes in the stomach of rats that died after beinggiven clopyralid (electrochemical) by gavage at a dose of 5000 mg/kg. This effect is not reportedin this study at lower dose levels - i.e., 500 mg/kg or 2000 mg/kg.
3.1.3. Subchronic or Chronic Systemic Toxic Effects. As summarized in appendix 1, severalsubchronic and chronic studies have been conducted on clopyralid. These studies were submittedto the U.S. EPA in support of the registration of clopyralid, and none of the studies are publishedin the open peer-reviewed literature. In the preparation of this risk assessment, full copies of mostof studies submitted to the U.S. EPA were obtained from EPA and reviewed. In some cases, asspecified in appendix 1, summaries of the studies are based on the recent review by DowAgroSciences (1998).
The most consistent effects associated with dietary exposures to clopyralid are decreased bodyweight (Barna-Lloyd et al. 1986; Dow AgroSciences 1998; Humiston et al. 1977; Young et al.1986) and increases in relative kidney weight (Barna-Lloyd et al. 1986; Dow AgroSciences 1998)and relative liver weight (Barna-Lloyd et al. 1986; Breckenridge et al. 1984; Dow AgroSciences1998). In addition, Barna-Lloyd et al. (1986) report hyperplasia and thickening of the gastricepithelium of rats after dietary exposures to clopyralid that resulted in daily doses of 150mg/kg/day.
As discussed further in section 3.3, the U.S. EPA has identified a rat NOEL of 50 mg/kg/day asthe basis for the RfD (U.S. EPA 1988a; U.S. EPA 1997a) with a corresponding LOAEL of 150mg/kg/day based on decreased body weight in female rats (Humiston et al. 1977; DowAgroSciences 1998) that is also supported by a LOAEL based on epithelial hyperplasia at 150mg/kg/day (Barna-Lloyd et al. 1986). The rat NOEL of 50 mg/kg/day is supported by another ratNOEL of 100 mg/kg/day from the study by Young et al. (1986).
Based on the study by Breckenridge et al. (1984), a dose of 100 mg/kg/day is also a NOEL indogs, although the endpoint, changes in hematologic parameters, is different from the endpointseen in rats. In the Breckenridge et al. (1984) study, six beagle dogs per sex were used at eachnominal/target dose levels: 0 (control), 100, 320 and 1000 mg/kg/day. Actual doses based onmeasured food consumption and body weights were 99, 301, and 983 mg/kg/day for males and99, 319, and 977 mg/kg/day for females. The primary toxic effect noted was a significantreduction in red blood cell counts in males and females at the 320 and 1000 mg/kg/day nominaldose levels. These effects were not statistically significant in the 100 mg/kg/day dose groups. Significant decreases in total protein, serum albumin and serum globulin were also noted in highdose males and females at 14 weeks and mid and high dose groups at 27 weeks. At 52 weeks,these differences were not statistically significant.
Also in the mid and high dose groups, Breckenridge et al. (1984) noted a significant increase inabsolute liver weight. In the high dose group, this was accompanied by increases in relativekidney and heart weights. No changes at any dose level, however, were observed in SGPT,SGOT, or alkaline phosphatase - all indicators of effects on the liver - and signs of histopathologicdamage were not apparent. Assays of cytochrome P-450 levels or liver mixed-function oxidases
3-3
were not conducted. Adrenal weights were significantly reduced in low dose males. This effect,however, was not seen in higher dose males or any females and is probably incidental.
3.1.4. Reproductive and Teratogenic Effects. As detailed in appendix 1, two gavageteratogenicity studies have been conducted in rabbits and two dietary reproduction studies havebeen conducted in rats. Other than a decrease in maternal body weight, which is consistent withthe information on the subchronic and chronic toxicity of clopyralid, these studies report few signsof toxicity in dams or offspring. At doses that cause no signs of maternal toxicity - i.e., dosesbelow about 100 mg/kg/day - no reproductive or teratogenic effects are apparent.
3.1.5. Carcinogenicity and Mutagenicity. Several chronic bioassays have been conducted onclopyralid in both mice (West and Willigan 1976; Young et al. 1986) and rats (Barna-Lloyd et al.1986; Dow AgroSciences 1998) and no evidence of carcinogenic activity has been detected. Inaddition, clopyralid is inactive in several different standard bioassays of mutagenicity (DowAgroSciences 1998).
Technical grade clopyralid, however, is contaminated with hexachlorobenzene (Lade 1998), acompound classified as a potential carcinogen by the U.S. EPA (1997b). A recent review of theextensive toxicity data on hexachlorobenzene is available from ATSDR (1998). As discussedfurther in section 3.1.9.1, the risk of cancer from this contaminant is considered both qualitativelyand quantitatively in this risk assessment.
3.1.6. Effects on the Skin and Eyes. After direct instillation into the eyes, both penta andelectrochemical process clopyralid can cause persistent damage to the eyes. The damage ischaracterized as slight to marked redness, swelling of the conjunctiva, and discharge withreddening of the iris and moderate to marked opacity of the cornea. Details of these studies arepresented in appendix 1.
Other than signs of transient dermal redness shortly after application (appendix 1), there is noevidence to suggest that clopyralid is a potent skin irritant. Dow AgroSciences (1998) indicatesthat neither penta process clopyralid nor electrochemical process clopyralid causes skinsensitization. As detailed in Appendix 1, this statement is consistent with and appears to be basedon the studies by Jeffery (1987c), presumably using penta process clopyralid and Gilbert (1995d),presumably using electrochemical process clopyralid.
3.1.7. Systemic Toxic Effects from Dermal Exposure. The available toxicity studiessummarized in appendix 1 suggest that dermal exposure to 2000 mg/kg clopyralid was notassociated with any signs of systemic toxicity in rabbits based on standard acute/single applicationbioassays with 14-day observation periods. Although there are no data concerning the dermalabsorption kinetics of clopyralid, dermal absorption is typically less rapid than absorption afteroral exposure and dermal LD50's are typically higher than oral LD50's (e.g., Gaines 1969). Sincethe reported acute oral LD50's of clopyralid are all more than 2000 mg/kg, the lack of apparenttoxicity at dermal doses of up to 2000 mg/kg/day is to be expected and these studies add little tothe assessment of risk for clopyralid.

3-4
Nonetheless, the dermal exposure route is important to this and other similar risk assessments.Most of the occupational exposure scenarios and many of the exposure scenarios for the generalpublic involve the dermal route of exposure. For these exposure scenarios, dermal absorption isestimated and compared with an estimated acceptable level of oral exposure based on subchronicor chronic toxicity studies. Thus, it is necessary to assess the consequences of dermal exposurerelative to oral exposure and the extent to which clopyralid is likely to be absorbed from thesurface of the skin.
As discussed in Durkin et al. (1995), dermal exposure scenarios involving immersion orprolonged contact with chemical solutions use Fick's first law and require an estimate of thepermeability coefficient, Kp, expressed in cm/hour. Because no kinetic data are available on thedermal absorption of clopyralid, the method for estimating a zero-order absorption rate (U.S.EPA 1992) is used in this risk assessment. Using this method, a dermal permeability coefficientfor clopyralid is estimated at 0.0000017 cm/hour with a 95% confidence interval of 0.00000044-0.0000065 cm/hour. These estimates are used in all exposure assessments that arebased on Fick’s first law. The calculations for these estimates are presented in worksheet B05.
For exposure scenarios like direct sprays or accidental spills, which involve deposition of thecompound on the skin’s surface, dermal absorption rates (proportion of the deposited dose perunit time) rather than dermal permeability rates are used in the exposure assessment. Using themethods detailed in Durkin et al. (1998), the estimated first-order dermal absorption coefficient is 0.00063 hour-1 with 95% confidence intervals of 0.00013-0.0031 hour-1. The calculations forthese estimates are presented in worksheet B04.
3.1.8. Inhalation Exposure. Compared with oral exposure data, data regarding the inhalationtoxicity of clopyralid are extremely limited. As detailed in appendix 1, two relatively detailedinhalation studies have been submitted to the U.S. EPA in support of registration of clopyralid(Hoffman 1995; Streeter et al. 1987). At nominal concentrations of 1 mg/L or greater over4-hour exposure periods, the only effects noted during were labored breathing and red stainsaround the nares. After a two week recovery period, Hoffman (1995) noted discoloration of thelungs in rats exposed to nominal concentrations of 1.2 mg/L but not in rats exposed to nominalconcentrations of 5.5 mg/L. As noted by Hoffman (1995), both of these nominal concentrationswere comparable in terms of respirable particles - i.e., #1.0 microns.
Although Hoffman (1995) did not attribute the changes in the lungs to clopyralid exposure, thesechanges are consistent with effects noted in a one-year dietary study in dogs - i.e., Breckenridgeet al. (1984) detailed in section 3.1.3. In this study, three low-dose (100 mg/kg/day) animals,three mid-dose (320 mg/kg/day) animals, and five high-dose (1000 mg/kg/day) animals evidencedatypical foci or nodules in the lungs. These lung changes were not noted in any control animals. The study authors attributed these findings to the inhalation of food particles containing clopyralidwith subsequent irritation of the lungs from direct clopyralid contact.
No occupational exposure criteria have been found for clopyralid. While any effects on the lungsare of substantial concern, such effects have not been seen at lower dietary dose levels in other
3-5
species. As noted in section 3.3.2, the current RfD for clopyralid is based on a NOAEL of 5mg/kg/day from a two-year rats feeding study. This NOAEL (5 mg/kg/day) is a factor of 20below the lowest dose associated with lung effects in dogs (100 mg/kg/day).
3.1.9. Impurities, Adjuvants, and Metabolites.3.1.9.1. Impurities -- Virtually no chemical synthesis yields a totally pure product. Technicalgrade clopyralid, as with other technical grade products, undoubtedly contains some impurities. To some extent, concern for impurities in technical grade clopyralid is reduced by the fact that theexisting toxicity studies on clopyralid were conducted with the technical grade product. Thus, iftoxic impurities are present in the technical grade product, they are likely to be encompassed bythe available toxicity studies on the technical grade product.
An exception to this general rule involves carcinogens, most of which are presumed to act bynon-threshold mechanisms. Because of the non-threshold assumption, any amount of acarcinogen in an otherwise non-carcinogenic mixture may pose a carcinogenic risk. This is thesituation with clopyralid. As indicated in Section 2, technical grade clopyralid containshexachlorobenzene and pentachlorobenzene as contaminants. Nominal or average concentrationsof hexachlorobenzene are less than 2.5 ppm. Nominal or average concentrations ofpentachlorobenzene are less than 0.3 ppm (Lade 1998). The U.S. EPA has classifiedhexachlorobenzene as a probable human carcinogen for which the data are adequate to considerrisk quantitatively (U.S. EPA 1997b). While a detailed review of hexachlorobenzene is beyondthe scope of this risk assessment, adequate information is available on hexachlorobenzene toquantify the carcinogenic risk associated with the use of clopyralid (section 3.3).
3.1.9.2. Metabolites -- As with contaminants, the potential effect of metabolites on a riskassessment is often encompassed by the available in vivo toxicity studies under the assumptionthat the toxicologic consequences of metabolism in the species on which toxicity studies areavailable will be similar to those in the species of concern, human in this section. Uncertainties inthis assumption are encompassed by using an uncertainty factor in deriving the RfD (section 3.3)and may sometimes influence the selection of the study used to derive the RfD.
This general uncertainty, however, has little impact on the risk assessment for clopyralid. Although the metabolism of clopyralid has been studied only in one mammalian species (Bosch1991), this study suggests that rats do not metabolize clopyralid in detectable amounts and that79-96% of the administered dose is excreted unchanged in the urine during the first 24 hours. This is similar to the pattern seen in plants that generally suggests that clopyralid is not extensivelymetabolized (Guo 1996), although it may be conjugated to form a methyl ester (Biehn 1990).
3.1.9.3. Adjuvants -- As indicated in section 2, the commercial formulation of clopyralid used bythe Forest Service is Transline, which contains clopyralid as the monoethanolamine salt and alsocontains isopropyl alcohol. Both monoethanolamine and isopropyl alcohol are approved foodadditives (Clydesdale 1997) and there is no reason to assert that these compounds will materiallyimpact the risks associated with the use of clopyralid.
3-6
3.2. EXPOSURE ASSESSMENT3.2.1. Overview. No occupational exposure studies are available in the literature that involve theapplication of clopyralid. Consequently, worker exposure rates are estimated from an empiricalrelationship between absorbed dose per kilogram of body weight and the amount of chemicalhandled in worker exposure studies on nine different pesticides (Rubin et al. 1998). Separateexposure assessments are given for backpack and boom spray ground applications. For these twogroups, the central estimates and also the lower and upper estimates of exposure are similar:0.0013 (0.000005 to 0.08) mg/kg/day for backpack workers and 0.0022 (0.000007 to 0.15)mg/kg/day for boom spray applicators. Although some clopyralid formulations are labeled foraerial application, the Forest Service is not using and does not plan to use that applicationmethod. Consequently, aerial applications are not considered in this risk assessment.
For the general public, all of the chronic or longer term exposure scenarios lead to levels ofexposure that are below those for workers. The highest dose associated with any of the longerterm exposure scenarios for the general public involves the consumption of contaminated fruitwith exposure estimates of 0.0005 (0.00004 to 0.059) mg/kg/day. The accidental exposurescenario involving the consumption of contaminated water results in a central estimate ofexposure of up to 0.023 mg/kg/day with an upper range of 0.51 mg/kg/day. The other accidentalexposure scenarios for the general public result in central estimates of dose from 0.00009 to0.0033 mg/kg/day with estimates of the upper ranges of exposure between 0.0068 and 0.067mg/kg/day. All of the accidental exposure scenarios involve relatively brief periods of exposureand most should be regarded as extreme, some to the extent of limited plausibility.
Because of the potential carcinogenicity of hexachlorobenzene a separate exposure assessment forthis compound is provided. General and incidental worker exposure scenarios as well as acuteexposure scenarios for the general public follow the same general methods used for clopyralid. Chronic exposure scenarios for the general public are based on modeling the runoff ofhexachlorobenzene from a treated site to nearby vegetation or water.
Hexachlorobenzene is a persistent ubiquitous environmental pollutant. Estimates ofhexachlorobenzene release to the environment exceed 240,000 kg/year. Based on the amount ofclopyralid currently used in Forest Service programs and the proportion of hexachlorobenzene inclopyralid, the amount of hexachlorobenzene released each year in Forest Service programs isabout 0.0034 kg. Thus, Forest Service programs contribute very little to the background levels ofhexachlorobenzene in the environment - i.e., about one part in one-hundred million (100,000,000)parts.
ATSDR (1998) reports that general background contamination of the environment withhexachlorobenzene results in long-term daily national average doses of about 0.000001 mg/kg/dayfor the general public. The exposure assessments based on the use of clopyralid by the ForestService result in long-term dose estimates for the general public that are below this amount byfactors of about 25,000 to several million. In the normal application of clopyralid, workers will beexposed to greater amount of hexachlorobenzene than members of the general public. Nonetheless, the central estimates of worker exposure under normal conditions to
3-7
hexachlorobenzene are below the background levels of exposure by factors of about onethousand. Upper ranges of worker exposure are below background levels of exposure by factorsof about 3 to 5. Thus, there is no basis for asserting that the use of clopyralid by the ForestService will result in substantial increases in the general exposure of either workers or members ofthe general public to hexachlorobenzene.
Accidental exposure scenarios for both workers and members of the general public do result inshort term exposures that are above the background dose of 0.000001 mg/kg/day. The highestdose estimate is about 0.002 mg/kg, the upper range of exposure for a worker wearingcontaminated gloves for one-hour. For members of the general public, the highest dose estimateis about 0.001 mg/kg and is associated with the short term consumption of contaminated fish. Aswith the exposure scenarios for clopyralid, all of the accidental exposure scenarios forhexachlorobenzene involve relatively brief periods of exposure and most should be regarded asextreme.
3.2.2. Workers. A summary of the exposure assessments for workers is presented in Table 3-1. Two types of exposure assessments are considered: general and accidental/incidental. The termgeneral exposure assessment is used to designate those exposures that involve estimates ofabsorbed dose based on the handling of a specified amount of a chemical during specific types ofapplications. The accidental/incidental exposure scenarios involve specific types of events thatcould occur during any type of application. Details regarding all of these exposure assessmentsare presented in the clopyralid worksheets that accompany this risk assessment, as indicated inTable 3-1. In Table 3-1 and other similar tables presented below, numbers greater than or equalto 0.000001 are expressed in standard decimal notation. Smaller numbers are expressed inscientific notations, such as 7e-07 which is equivalent to 7×10⁻⁷. Details of the conversion ofscientific to decimal notation are given on page ix of this report.
As discussed further in section 3.4, a separate set of exposure assessments and worksheets areprovided for hexachlorobenzene.
3.2.2.1. General Exposures -- As outlined in the program description (see chapter 2), this riskassessment is concerned primarily with backpack and boom spray ground applications. AlthoughTransline is labeled for aerial applications (helicopter only), the Forest Service is not using anddoes not plan to use that application method for Transline. Consequently, aerial applications arenot considered in this risk assessment.
The assumptions used in worker exposure assessments for both backpack and boom sprayapplications are detailed in worksheets C01 and C02. No worker exposure studies with clopyralid
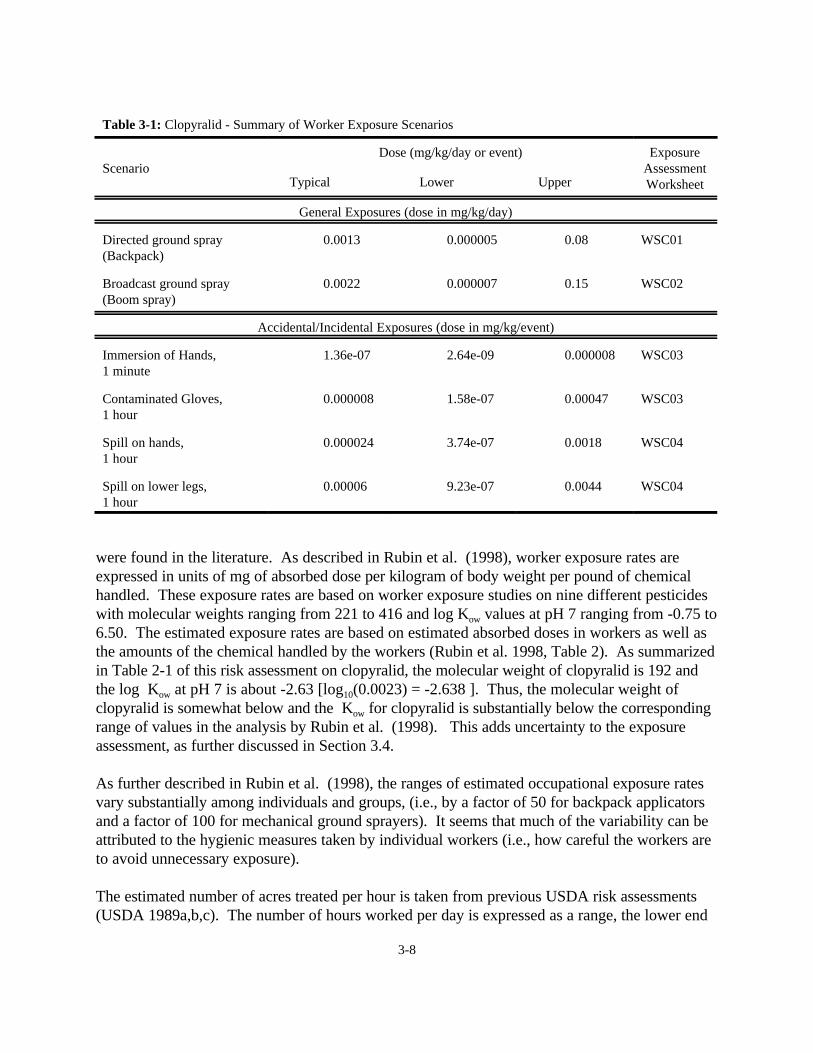
3-8
were found in the literature. As described in Rubin et al. (1998), worker exposure rates areexpressed in units of mg of absorbed dose per kilogram of body weight per pound of chemicalhandled. These exposure rates are based on worker exposure studies on nine different pesticideswith molecular weights ranging from 221 to 416 and log Kow values at pH 7 ranging from -0.75 to6.50. The estimated exposure rates are based on estimated absorbed doses in workers as well asthe amounts of the chemical handled by the workers (Rubin et al. 1998, Table 2). As summarizedin Table 2-1 of this risk assessment on clopyralid, the molecular weight of clopyralid is 192 andthe log Kow at pH 7 is about -2.63 [log10(0.0023) = -2.638 ]. Thus, the molecular weight ofclopyralid is somewhat below and the Kow for clopyralid is substantially below the correspondingrange of values in the analysis by Rubin et al. (1998). This adds uncertainty to the exposureassessment, as further discussed in Section 3.4.
As further described in Rubin et al. (1998), the ranges of estimated occupational exposure ratesvary substantially among individuals and groups, (i.e., by a factor of 50 for backpack applicatorsand a factor of 100 for mechanical ground sprayers). It seems that much of the variability can beattributed to the hygienic measures taken by individual workers (i.e., how careful the workers areto avoid unnecessary exposure).
The estimated number of acres treated per hour is taken from previous USDA risk assessments(USDA 1989a,b,c). The number of hours worked per day is expressed as a range, the lower end
Table 3-1: Clopyralid - Summary of Worker Exposure Scenarios
ScenarioDose (mg/kg/day or event) Exposure
AssessmentWorksheetTypical Lower Upper
General Exposures (dose in mg/kg/day)
Directed ground spray(Backpack)
0.0013 0.000005 0.08 WSC01
Broadcast ground spray(Boom spray)
0.0022 0.000007 0.15 WSC02
Accidental/Incidental Exposures (dose in mg/kg/event)
Immersion of Hands, 1 minute
1.36e-07 2.64e-09 0.000008 WSC03
Contaminated Gloves,1 hour
0.000008 1.58e-07 0.00047 WSC03
Spill on hands,1 hour
0.000024 3.74e-07 0.0018 WSC04
Spill on lower legs, 1 hour
0.00006 9.23e-07 0.0044 WSC04
3-9
of which, 6 hours per day, is based on an 8-hour work day with 1 hour at each end of the workday spent in activities that do not involve herbicide exposure. The upper end of the range, 8hours per day, is based on an extended (10-hour) work day, allowing for 1 hour at each end of thework day to be spent in activities that do not involve herbicide exposure.
It is recognized that the use of 6 hours as the lower range of time spent per day applyingherbicides is not a true lower limit. It is conceivable and perhaps common for workers to spendmuch less time in the actual application of a herbicide if they are engaged in other activities. Thus, using 6 hours can be regarded as conservative. In the absence of any publishedor otherwise documented work practice statistics to support the use of a lower limit, thisconservative approach is used.
The range of acres treated per hour and hours worked per day is used to calculate a range for thenumber of acres treated per day. For this calculation as well as others in this section involving themultiplication of ranges, the lower end of the resulting range is the product of the lower end ofone range and the lower end of the other range. Similarly, the upper end of the resulting range isthe product of the upper end of one range and the upper end of the other range. This approach istaken to encompass as broadly as possible the range of potential exposures.
The central estimate of the acres treated per day is taken as the arithmetic average of the range. Because of the relatively narrow limits of the ranges for backpack and boom spray workers, theuse of the arithmetic mean rather than some other measure of central tendency such as thegeometric mean has no marked effect on the risk assessment.
The range of application rates and the typical application rate are taken directly from the programdescription (see section 2.4). The central estimate of 0.1 lb clopyralid/acre is about the 1997average application rate of 0.11 lb/acre when clopyralid was used as the sole herbicide (see Table2-2). The upper end of the range of application rates is above the maximum labeled applicationbut is identical to the reported application rate of 1.0 lb/acre used by the Forest Service in nurseryweed control in 1997 (see Table 2-2).
The central estimate of the amount handled per day is calculated as the product of the centralestimate of the acres treated per day and the typical application rate. The ranges for the amountshandled per day are calculated as the product of the range of acres treated per day and the rangeof application rates.
Similarly, the central estimate of the daily absorbed dose is calculated as the product of the centralestimate of the exposure rate and the central estimate of the amount handled per day. The rangesof the daily absorbed dose are calculated as the product of the range of exposure rates and therange for the amounts handled per day.
3.2.2.2. Accidental Exposures -- Typical occupational exposures may involve multiple routes ofexposure (i.e., oral, dermal, and inhalation); nonetheless, dermal exposure is generally thepredominant route for herbicide applicators (van Hemmen 1992). Typical multi-route exposures
3-10
are encompassed by the methods used in section 3.2.2.1 on general exposures. Accidentalexposures, on the other hand, are most likely to involve splashing a solution of herbicides into theeyes or a variety of dermal exposure scenarios.
Clopyralid can cause irritant effects in the eyes (see section 3.1.6). The available literature doesnot include quantitative methods for characterizing exposure or responses associated withsplashing a solution of a chemical into the eyes; furthermore, reasonable approaches to modelingthis type of exposure scenario quantitatively are not apparent. Consequently, accidental exposurescenarios of this type are considered qualitatively in the risk characterization (section 3.4).
There are various methods for estimating absorbed doses associated with accidental dermalexposure (U.S. EPA 1992, Durkin et al. 1995,1998). Two general types of exposure aremodeled: those involving direct contact with a solution of the herbicide and those associated withaccidental spills of the herbicide onto the surface of the skin. Any number of specific exposurescenarios could be developed for direct contact or accidental spills by varying the amount orconcentration of the chemical on or in contact with the surface of the skin and by varying thesurface area of the skin that is contaminated.
For this risk assessment, two exposure scenarios are developed for each of the two types ofdermal exposure and the estimated absorbed dose for each scenario is expressed in units of mgchemical/kg body weight. Details of these exposure estimates are presented in the worksheetsappended to this risk assessment as specified in Table 3-1.
Exposure scenarios involving direct contact with solutions of the chemical are characterized byimmersion of the hands for 1 minute and wearing contaminated gloves for 1 hour. Generally, it isnot reasonable to assume or postulate that the hands or any other part of a worker will beimmersed in a solution of a herbicide for any period of time. On the other hand, contamination ofgloves or other clothing is quite plausible. For these exposure scenarios, the key element is theassumption that wearing gloves grossly contaminated with a chemical solution is equivalent toimmersing the hands in a solution. In either case, the concentration of the chemical in solutionthat is in contact with the surface of the skin and the resulting dermal absorption rate areessentially constant.
For both scenarios (the hand immersion and the contaminated glove), the assumption ofzero-order absorption kinetics is appropriate. Following the general recommendations of U.S.EPA (1992), Fick's first law is used to estimate dermal exposure.
Exposure scenarios involving chemical spills on to the skin are characterized by a spill on to thelower legs as well as a spill on to the hands. In these scenarios, it is assumed that a solution of thechemical is spilled on to a given surface area of skin and that a certain amount of the chemicaladheres to the skin. The absorbed dose is then calculated as the product of the amount of thechemical on the surface of the skin (i.e., the amount of liquid per unit surface area multiplied bythe surface area of the skin over which the spill occurs and the concentration of the chemical inthe liquid), the first-order absorption rate, and the duration of exposure. For both scenarios, it is
3-11
assumed that the contaminated skin is effectively cleaned after 1 hour. As with the exposureassessments based on Fick's first law, this product (mg of absorbed dose) is divided by bodyweight (kg) to yield an estimated dose in units of mg chemical/kg body weight. The specificequation used in these exposure assessments is taken from Durkin et al. (1998).
Confidence in these exposure assessments is diminished by the lack of experimental data on thedermal absorption of clopyralid. Nonetheless, the exposure scenario in which contaminatedgloves are worn for 1 hour is very similar to the exposure scenario in which a chemical solution isspilled on to the skin surface of the hands and cleaned after 1 hour. As indicated in Table 3-1, thecentral estimates as well as the upper and lower ranges of exposure for these two scenarios arewithin a factor of 4 of each other. This consistency between these two scenarios based ondifferent methods and data sets enhances, at least somewhat, confidence in the exposureassessments. In addition, as detailed in section 3.4 (risk characterization), the dose estimates forall of the accidental scenarios are far below the level of concern so that even very large errors inthe estimates would have little impact on the characterization of risk.
3.2.3. General Public.3.2.3.1. General Considerations -- Under normal conditions, members of the general publicshould not be exposed to substantial levels of clopyralid. Nonetheless, any number of exposurescenarios can be constructed for the general public, depending on various assumptions regardingapplication rates, dispersion, canopy interception, and human activity. Several highly conservativescenarios are developed for this risk assessment.
The two types of exposure scenarios developed for the general public include acute exposure andlonger-term or chronic exposure. All of the acute exposure scenarios are primarily accidental. They assume that an individual is exposed to the compound either during or shortly after itsapplication. Specific scenarios are developed for direct spray, dermal contact with contaminatedvegetation, as well as the consumption of contaminated fruit, water, and fish. Most of thesescenarios should be regarded as extreme, some to the point of limited plausibility. Thelonger-term or chronic exposure scenarios parallel the acute exposure scenarios for theconsumption of contaminated fruit, water, and fish but are based on estimated levels of exposurefor longer periods after application.
The exposure scenarios developed for the general public are summarized in Table 3-2. As withthe worker exposure scenarios, details of the assumptions and calculations involved in theseexposure assessments are given in the worksheets that accompany this risk assessment(worksheets D01-D09). The remainder of this section focuses on a qualitative description of therationale for and quality of the data supporting each of the assessments.
3.2.3.2. Direct Spray -- Direct sprays involving ground applications are modeled in a mannersimilar to accidental spills for workers (see section 3.2.2.2.). In other words, it is assumed thatthe individual is sprayed with a solution containing the compound and that an amount of thecompound remains on the skin and is absorbed by first-order kinetics. As with the similar workerexposure scenarios, the first-order absorption kinetics are estimated from the empirical
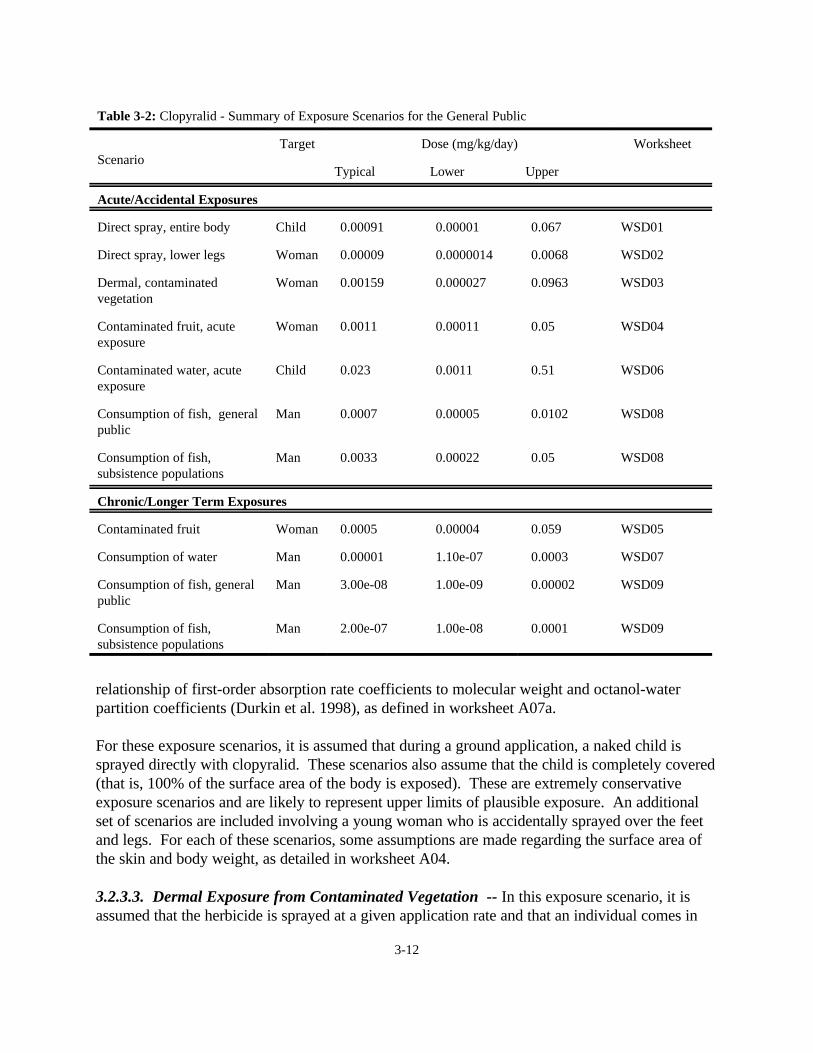
3-12
relationship of first-order absorption rate coefficients to molecular weight and octanol-waterpartition coefficients (Durkin et al. 1998), as defined in worksheet A07a.
For these exposure scenarios, it is assumed that during a ground application, a naked child issprayed directly with clopyralid. These scenarios also assume that the child is completely covered(that is, 100% of the surface area of the body is exposed). These are extremely conservativeexposure scenarios and are likely to represent upper limits of plausible exposure. An additionalset of scenarios are included involving a young woman who is accidentally sprayed over the feetand legs. For each of these scenarios, some assumptions are made regarding the surface area ofthe skin and body weight, as detailed in worksheet A04.
3.2.3.3. Dermal Exposure from Contaminated Vegetation -- In this exposure scenario, it isassumed that the herbicide is sprayed at a given application rate and that an individual comes in
Table 3-2: Clopyralid - Summary of Exposure Scenarios for the General Public
ScenarioTarget Dose (mg/kg/day) Worksheet
Typical Lower Upper
Acute/Accidental Exposures
Direct spray, entire body Child 0.00091 0.00001 0.067 WSD01
Direct spray, lower legs Woman 0.00009 0.0000014 0.0068 WSD02
Dermal, contaminatedvegetation
Woman 0.00159 0.000027 0.0963 WSD03
Contaminated fruit, acuteexposure
Woman 0.0011 0.00011 0.05 WSD04
Contaminated water, acuteexposure
Child 0.023 0.0011 0.51 WSD06
Consumption of fish, generalpublic
Man 0.0007 0.00005 0.0102 WSD08
Consumption of fish,subsistence populations
Man 0.0033 0.00022 0.05 WSD08
Chronic/Longer Term Exposures
Contaminated fruit Woman 0.0005 0.00004 0.059 WSD05
Consumption of water Man 0.00001 1.10e-07 0.0003 WSD07
Consumption of fish, generalpublic
Man 3.00e-08 1.00e-09 0.00002 WSD09
Consumption of fish,subsistence populations
Man 2.00e-07 1.00e-08 0.0001 WSD09
3-13
contact with sprayed vegetation or other contaminated surfaces at some period after the sprayoperation.
For these exposure scenarios, some estimates of dislodgeable residue and the rate of transfer fromthe contaminated vegetation to the surface of the skin must be available. No such data aredirectly available for clopyralid, and the estimation methods of Durkin et al. (1995) are used asdefined in worksheet D03. Other estimates used in this exposure scenario involve estimates ofbody weight, skin surface area, and first-order dermal absorption rates, as discussed in theprevious section.
3.2.3.4. Contaminated Water -- Water can be contaminated from runoff, as a result of leachingfrom contaminated soil, from a direct spill, or from unintentional contamination from aerialapplications. Clopyralid is stable in water over a range of pH from 5 to 9 (Woodburn 1987) andthe rate of hydrolysis in water is extremely slow - i.e., t½=261 days (Concha and Shepler 1994). In addition, clopyralid is extremely stable in anaerobic sediments, with no significant decay notedover a one year period (Hawes and Erhardt-Zabik 1995). Concern for water contamination isincreased because clopyralid is not tightly bound to most soils and thus may have a tendency toleach from soil into ground water (e.g., Cox et al. 1996; Cox et al. 1997; Pik et al. 1977;Woodburn and French., 1987).
For this risk assessment, the two types of estimates made for the concentration of clopyralid inambient water are acute/accidental exposure and longer-term exposure. The accidental exposurescenario is based on a spill of a fixed amount of clopyralid into a body of water of a fixed sizeassuming instantaneous mixing. The longer-term exposure scenario is based on monitoring datathat can be used to associate the application rate of clopyralid with clopyralid concentrations inambient water.
3.2.3.4.1. ACUTE EXPOSURE -- As detailed in worksheet D06, the acute exposure scenarioassumes that a young child (2- to 3-years old) consumes 1 L of contaminated water shortly afteran accidental spill of 200 gallons of a field solution into a pond that has an average depth of 1 mand a surface area of 1000 m2 or about one-quarter acre. Because this scenario is based on theassumption that exposure occurs shortly after the spill, no dissipation or degradation of clopyralidis considered.
This is an extremely conservative scenario dominated by arbitrary variability. The actualconcentrations in the water would depend heavily on the amount of compound spilled, the size ofthe water body into which it is spilled, the time at which water consumption occurs relative to thetime of the spill, and the amount of contaminated water that is consumed. As indicated in Table3-2, there is about a 500-fold difference in the upper and lower limits of the exposure assessment- i.e., 0.0011 mg/kg/day to 0.51 mg/kg/day. As detailed in worksheet D06, this wide range isattributable almost completely to the differences in field concentrations (a factor of 200) which isin turn attributable to the range in application rates (a factor of about 100 as detailed in worksheetD05). Differences in the estimated amounts of water that might be consumed (a factor of onlyabout 2.5) have relatively little impact on the exposure estimate.
3-14
3.2.3.4.2. LONGER-TERM EXPOSURE -- The scenario for chronic exposure to clopyralidfrom contaminated water is detailed in worksheet D07. This scenario assumes that an adult (70kg male) consumes contaminated ambient water for a lifetime. The levels of compound in thewater are estimated from monitoring data. Thus, environmental processes such as dissipation anddegradation are implicit in the assessment.
The most relevant monitoring data for this exposure scenario is the study by Leitch and Fagg(1985) in which clopyralid (LONTREL L) was aerially applied at a rate of about 2.5 lb a.i./acreover 56 hectares - i.e., about 140 acres [56 ha × 2.471 acres/ha = 138.376 acres]. As detailed inworksheet B07, this application rate is equivalent to an application rate of about 1.90 lb a.e./acre. Clopyralid was monitored in stream water during application and subsequently for 72 hours afterapplication at a site 0.5 kilometers downstream from the application site (see Leitch and Fagg1985, Figure 2, p. 203). The limit of detection in this study was 0.001 mg/L. During andimmediately after application, only trace levels of clopyralid were detected in the stream water,suggesting that direct spray of the stream was negligible. The highest levels of clopyralidoccurred during or shortly after storm events - i.e., rainfall at hourly rates of about 1 to 20mm/hour. The maximum level in the stream water was 0.017 mg/L. This occurred shortly afterthe initial rainfall event during which the highest rainfall rate was about 4 mm/hour. Heavyrainfalls during the following 24 hours resulted in much lower levels of clopyralid in the water. Generally, the monitored concentrations of clopyralid were near the limit of detection of 0.001mg/L. While Leitch and Fagg (1985) do not provide a tabular summary of the data, visualinspection of Figure 2 (p. 203) in the publication suggests that 0.004 mg/L, the geometric meanof the range from 0.001 mg/L to 0.017 mg/L [(0.017 × 0.001)0.5], is a reasonable estimate of acentral value for the concentration of clopyralid in stream water.
For this risk assessment, the monitoring data from Leitch and Fagg (1985) are used to estimatethe concentrations in ambient water that could be associated with the application of clopyralid. As detailed in worksheet B07, the central estimate is 0.0021 mg/L per lb a.e. clopyralid that isapplied per acre - i.e., units of (mg/L) ÷ (lb a.e./acre). The range for this estimate is from 0.00053to 0.0089 (mg/L) ÷ (lb a.e./acre).
This approach is clearly extremely conservative. The study by Leitch and Fagg (1985) involvedthe application of about 266 lbs a.e.. This is about the total amount of clopyralid used by theForest Service during all of 1997 when clopyralid was applied as the sole herbicide - i.e., 303.43lbs from Table 2-2. In addition, the monitoring data are from only a relatively brief period afterapplication but are used to estimate longer term exposures for humans. For the characterizationof potential human health effects (section 3.4), nonetheless, this extremely conservative approachmakes no difference because the exposure levels are far below those of toxicological concern.
3.2.3.5. Oral Exposure from Contaminated Fish -- Many chemicals may be concentrated orpartitioned from water into the tissues of animals or plants in the water. This process is referredto as bioconcentration. Generally, bioconcentration is measured as the ratio of the concentrationin the organism to the concentration in the water. For example, if the concentration in theorganism is 5 mg/kg and the concentration in the water is 1 mg/L, the bioconcentration factor
3-15
(BCF) is 5 L/kg [5 mg/kg ÷ 1 mg/L]. As with most absorption processes, bioconcentrationdepends initially on the duration of exposure but eventually reaches steady state. Detailsregarding the relationship of bioconcentration factor to standard pharmacokinetic principles areprovided in Calabrese and Baldwin (1993).
One study regarding the bioconcentration of clopyralid has been encountered. Bidlack (1982)exposed bluegill sunfish to 14C-labeled clopyralid for 28 days and found no indication ofbioconcentration. For exposure assessments based on the consumption of contaminated fish, aBCF of 1 is used (i.e., the concentration in the fish will be equal to the concentration in thewater).
For both the acute and longer-term exposure scenarios involving the consumption ofcontaminated fish, the water concentrations of clopyralid used are identical to the concentrationsused in the contaminated water scenarios (see section 3.2.3.4). The acute exposure scenario isbased on the assumption that an adult angler consumes fish taken from contaminated watershortly after an accidental spill of 200 gallons of a field solution into a pond that has an averagedepth of 1 m and a surface area of 1000 m2 or about one-quarter acre. No dissipation ordegradation is considered. Because of the available and well-documented information andsubstantial differences in the amount of caught fish consumed by the general public and nativeAmerican subsistence populations (U.S. EPA 1996), separate exposure estimates are made forthese two groups, as illustrated in worksheet D08. The chronic exposure scenario is constructedin a similar way, as detailed in worksheet D09, except that estimates of clopyralid concentrationsin ambient water are based on the monitoring data by Leitch and Fagg (1985).
3.2.3.6. Oral Exposure from Contaminated Vegetation -- None of the Forest Serviceapplications of clopyralid will involve the treatment of crops. Thus, under normal circumstancesand in most types of applications conducted as part of Forest Service programs, the consumptionof vegetation contaminated with clopyralid is unlikely. Nonetheless, any number of scenarioscould be developed involving either accidental spraying of crops or the spraying of edible wildvegetation, like berries. Again, in most instances and particularly for longer-term scenarios,treated vegetation would probably show signs of damage from exposure to clopyralid (section4.3.2.4), thereby reducing the likelihood of consumption that would lead to significant levels ofhuman exposure.
Notwithstanding that assertion, it is conceivable that individuals could consume contaminatedvegetation. One of the more plausible scenarios involves the consumption of contaminated berriesafter treatment of a right-of-way or some other area in which wild berries grow. The twoaccidental exposure scenarios developed for this exposure assessment include one scenario foracute exposure, as defined in worksheet D04 and one scenario for longer-term exposure, asdefined in worksheet D05. In both scenarios, the concentration of clopyralid on contaminatedvegetation is estimated using the empirical relationships between application rate andconcentration on vegetation developed by Hoerger and Kenaga (1972). These relationships aredefined in worksheet A05a. For the acute exposure scenario, the estimated residue level is takenas the product of the application rate and the residue rate given in worksheet A05a.
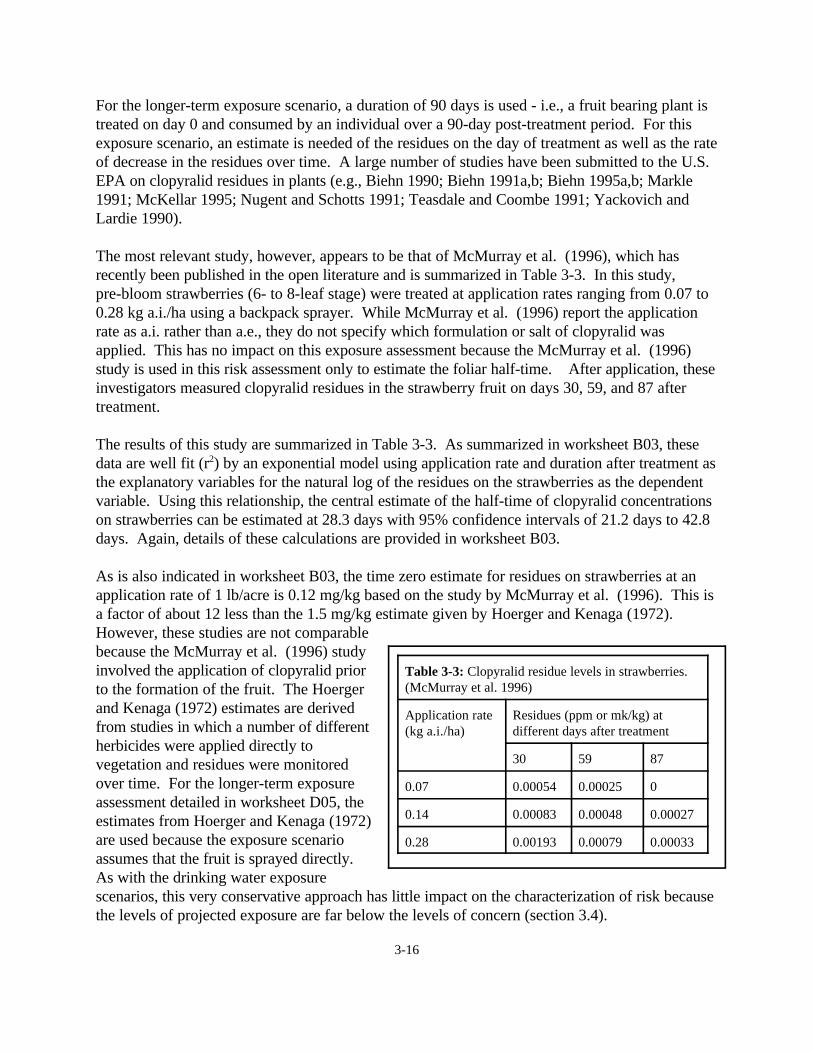
3-16
For the longer-term exposure scenario, a duration of 90 days is used - i.e., a fruit bearing plant istreated on day 0 and consumed by an individual over a 90-day post-treatment period. For thisexposure scenario, an estimate is needed of the residues on the day of treatment as well as the rateof decrease in the residues over time. A large number of studies have been submitted to the U.S.EPA on clopyralid residues in plants (e.g., Biehn 1990; Biehn 1991a,b; Biehn 1995a,b; Markle1991; McKellar 1995; Nugent and Schotts 1991; Teasdale and Coombe 1991; Yackovich andLardie 1990).
The most relevant study, however, appears to be that of McMurray et al. (1996), which hasrecently been published in the open literature and is summarized in Table 3-3. In this study,pre-bloom strawberries (6- to 8-leaf stage) were treated at application rates ranging from 0.07 to0.28 kg a.i./ha using a backpack sprayer. While McMurray et al. (1996) report the applicationrate as a.i. rather than a.e., they do not specify which formulation or salt of clopyralid wasapplied. This has no impact on this exposure assessment because the McMurray et al. (1996)study is used in this risk assessment only to estimate the foliar half-time. After application, theseinvestigators measured clopyralid residues in the strawberry fruit on days 30, 59, and 87 aftertreatment.
The results of this study are summarized in Table 3-3. As summarized in worksheet B03, thesedata are well fit (r2) by an exponential model using application rate and duration after treatment asthe explanatory variables for the natural log of the residues on the strawberries as the dependentvariable. Using this relationship, the central estimate of the half-time of clopyralid concentrationson strawberries can be estimated at 28.3 days with 95% confidence intervals of 21.2 days to 42.8days. Again, details of these calculations are provided in worksheet B03.
As is also indicated in worksheet B03, the time zero estimate for residues on strawberries at anapplication rate of 1 lb/acre is 0.12 mg/kg based on the study by McMurray et al. (1996). This isa factor of about 12 less than the 1.5 mg/kg estimate given by Hoerger and Kenaga (1972). However, these studies are not comparablebecause the McMurray et al. (1996) studyinvolved the application of clopyralid priorto the formation of the fruit. The Hoergerand Kenaga (1972) estimates are derivedfrom studies in which a number of differentherbicides were applied directly tovegetation and residues were monitoredover time. For the longer-term exposureassessment detailed in worksheet D05, theestimates from Hoerger and Kenaga (1972) are used because the exposure scenarioassumes that the fruit is sprayed directly. As with the drinking water exposurescenarios, this very conservative approach has little impact on the characterization of risk becausethe levels of projected exposure are far below the levels of concern (section 3.4).
Table 3-3: Clopyralid residue levels in strawberries.(McMurray et al. 1996)
Application rate(kg a.i./ha)
Residues (ppm or mk/kg) atdifferent days after treatment
30 59 87
0.07 0.00054 0.00025 0
0.14 0.00083 0.00048 0.00027
0.28 0.00193 0.00079 0.00033
3-17
For the acute exposure scenario, it is assumed that a woman consumes 1 lb (0.4536 kg) ofcontaminated fruit. Based on statistics summarized in U.S. EPA (1996) and presented inworksheet D04, this consumption rate is approximately the mid-range between the mean andupper 95% confidence interval for the total vegetable intake for a 64 kg woman. The range ofexposures presented in Table 3-2 is based on the range of concentrations on vegetation fromHoerger and Kenaga (1972) and the range of application rates for clopyralid. The longer-termexposure scenario is constructed in a similar way, except that the estimated exposures include therange of vegetable consumption (U.S. EPA 1996) as well as the range of concentrations onvegetation, the range of application rates for clopyralid, and the range of the confidence limits onfoliar half-time.
3.2.4. Hexachlorobenzene.As mentioned in section 2.2, technical grade clopyralid is contaminated with bothhexachlorobenzene (#2.5 ppm) and pentachlorobenzene (#0.3 ppm). In terms of the potential forsystemic toxic effects , the consequences of this contamination have a minimal impact on this riskassessment, as detailed in section 3.3.3.1, because of the very low levels of the chlorinatedbenzenes in technical grade clopyralid. However, hexachlorobenzene is classified as a carcinogen(section 3.1.5) and the U.S. EPA has recommended and derived a cancer potency factor for thiscompound (section 3.3.3.2).
In order to quantitatively consider the potential cancer risk posed by the use of technical gradeclopyralid in Forest Service programs, separate exposure assessments are required forhexachlorobenzene. Summaries of the exposure assessments for workers and members of thegeneral public are given in Tables 3-4 and 3-5, respectively. Details of these exposureassessments are presented in the hexachlorobenzene worksheets: worksheets C01 to C04 forworkers and D01 to D10 for members of the general public. The following discussion of theexposure assessments for hexachlorobenzene focuses on aspects of the exposure assessments thatdiffer substantially from those used for clopyralid. 3.2.4.1. Acute Exposures -- For all of the worker exposure assessments as well as the acuteexposure assessments for members of the general public, the exposure estimates follow the samegeneral methods used for the clopyralid exposure assessments, as detailed in sections 3.2.2 and3.2.3. The calculations for hexachlorobenzene are summarized in the hexachlorobenzeneworksheets appended to this risk assessment. The major differences in these exposureassessments for clopyralid and hexachlorobenzene involve lipophilicity and water solubility. Clopyralid is highly water soluble ($1000mg/L, Table 2-2). Consequently, clopyralid does nothave a tendency to partition into fatty tissue (Ko/w at pH 7 of about 0.0023) and thus its dermalabsorption, binding to soil, and bioconcentration are relatively low.
Hexachlorobenzene, on the other hand, is highly lipophilic. The Ko/w of hexachlorobenzene isabout 1,500,000 and the water solubility of hexachlorobenzene is only about 0.006 mg/L. Thus,hexachlorobenzene may be readily absorbed across the skin, will bind tightly to most soils, andwill bioconcentrate in fish (ATSDR 1998). Although the amount of hexachlorobenzene in
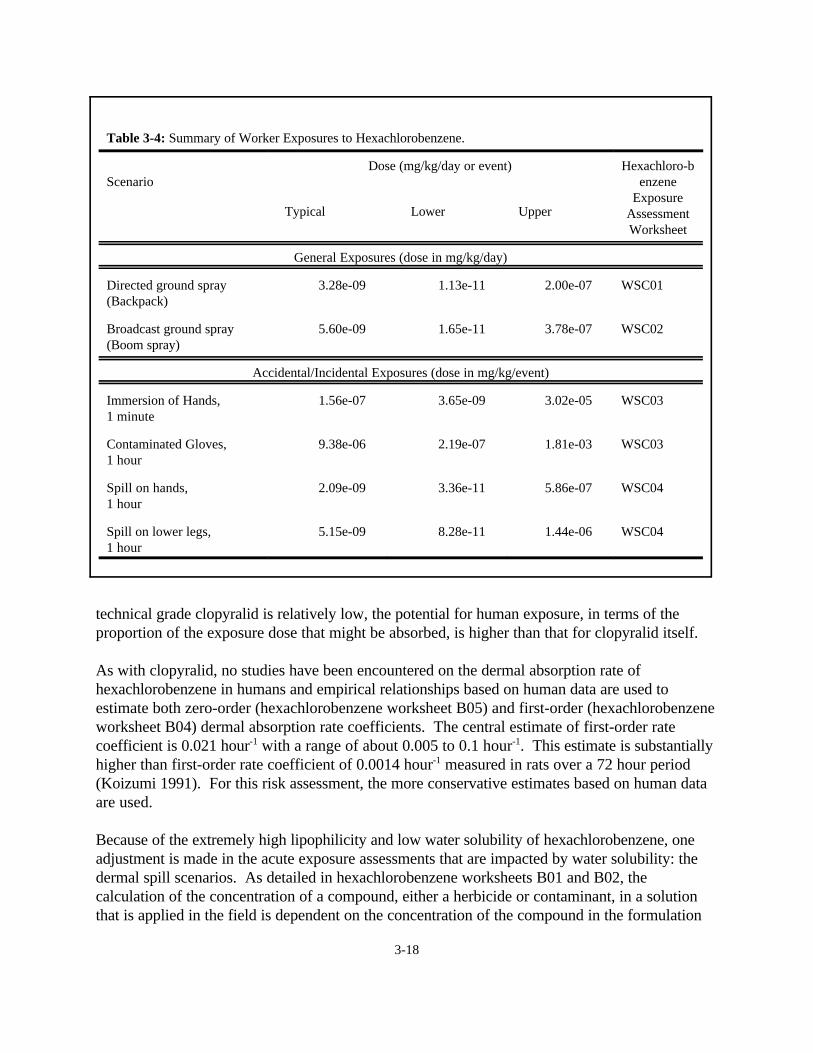
3-18
technical grade clopyralid is relatively low, the potential for human exposure, in terms of theproportion of the exposure dose that might be absorbed, is higher than that for clopyralid itself.
As with clopyralid, no studies have been encountered on the dermal absorption rate ofhexachlorobenzene in humans and empirical relationships based on human data are used toestimate both zero-order (hexachlorobenzene worksheet B05) and first-order (hexachlorobenzeneworksheet B04) dermal absorption rate coefficients. The central estimate of first-order ratecoefficient is 0.021 hour-1 with a range of about 0.005 to 0.1 hour-1. This estimate is substantiallyhigher than first-order rate coefficient of 0.0014 hour-1 measured in rats over a 72 hour period(Koizumi 1991). For this risk assessment, the more conservative estimates based on human dataare used.
Because of the extremely high lipophilicity and low water solubility of hexachlorobenzene, oneadjustment is made in the acute exposure assessments that are impacted by water solubility: thedermal spill scenarios. As detailed in hexachlorobenzene worksheets B01 and B02, thecalculation of the concentration of a compound, either a herbicide or contaminant, in a solutionthat is applied in the field is dependent on the concentration of the compound in the formulation
Table 3-4: Summary of Worker Exposures to Hexachlorobenzene.
ScenarioDose (mg/kg/day or event) Hexachloro-b
enzeneExposure
AssessmentWorksheet
Typical Lower Upper
General Exposures (dose in mg/kg/day)
Directed ground spray(Backpack)
3.28e-09 1.13e-11 2.00e-07 WSC01
Broadcast ground spray(Boom spray)
5.60e-09 1.65e-11 3.78e-07 WSC02
Accidental/Incidental Exposures (dose in mg/kg/event)
Immersion of Hands, 1 minute
1.56e-07 3.65e-09 3.02e-05 WSC03
Contaminated Gloves,1 hour
9.38e-06 2.19e-07 1.81e-03 WSC03
Spill on hands,1 hour
2.09e-09 3.36e-11 5.86e-07 WSC04
Spill on lower legs, 1 hour
5.15e-09 8.28e-11 1.44e-06 WSC04
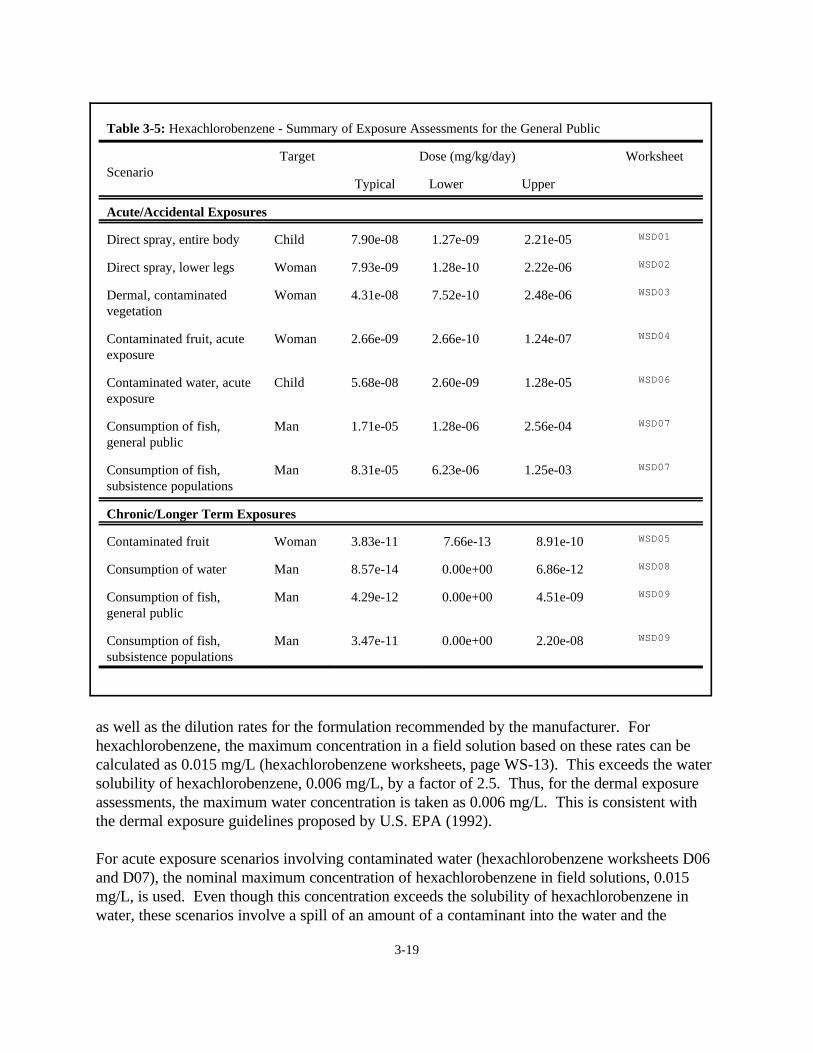
3-19
as well as the dilution rates for the formulation recommended by the manufacturer. Forhexachlorobenzene, the maximum concentration in a field solution based on these rates can becalculated as 0.015 mg/L (hexachlorobenzene worksheets, page WS-13). This exceeds the watersolubility of hexachlorobenzene, 0.006 mg/L, by a factor of 2.5. Thus, for the dermal exposureassessments, the maximum water concentration is taken as 0.006 mg/L. This is consistent withthe dermal exposure guidelines proposed by U.S. EPA (1992).
For acute exposure scenarios involving contaminated water (hexachlorobenzene worksheets D06and D07), the nominal maximum concentration of hexachlorobenzene in field solutions, 0.015mg/L, is used. Even though this concentration exceeds the solubility of hexachlorobenzene inwater, these scenarios involve a spill of an amount of a contaminant into the water and the
Table 3-5: Hexachlorobenzene - Summary of Exposure Assessments for the General Public
ScenarioTarget Dose (mg/kg/day) Worksheet
Typical Lower Upper
Acute/Accidental Exposures
Direct spray, entire body Child 7.90e-08 1.27e-09 2.21e-05 WSD01
Direct spray, lower legs Woman 7.93e-09 1.28e-10 2.22e-06 WSD02
Dermal, contaminatedvegetation
Woman 4.31e-08 7.52e-10 2.48e-06 WSD03
Contaminated fruit, acuteexposure
Woman 2.66e-09 2.66e-10 1.24e-07 WSD04
Contaminated water, acuteexposure
Child 5.68e-08 2.60e-09 1.28e-05 WSD06
Consumption of fish, general public
Man 1.71e-05 1.28e-06 2.56e-04 WSD07
Consumption of fish,subsistence populations
Man 8.31e-05 6.23e-06 1.25e-03 WSD07
Chronic/Longer Term Exposures
Contaminated fruit Woman 3.83e-11 7.66e-13 8.91e-10 WSD05
Consumption of water Man 8.57e-14 0.00e+00 6.86e-12 WSD08
Consumption of fish,general public
Man 4.29e-12 0.00e+00 4.51e-09 WSD09
Consumption of fish,subsistence populations
Man 3.47e-11 0.00e+00 2.20e-08 WSD09
3-20
assumption of instantaneous mixing. Thus, the estimates of the concentrations ofhexachlorobenzene in the ambient water are well below of solubility of hexachlorobenzene inwater.
As with clopyralid, both the acute and chronic scenarios for the consumption of fish contaminatedwith hexachlorobenzene (hexachlorobenzene worksheets D07 and D10) require estimates of abioconcentration factor - i.e., the concentration in fish divided by the concentration in water. Asreviewed in ATSDR (1998), reported bioconcentration factors in fish range from about 2,000 to20,000. For this risk assessment, a bioconcentration factor 10,000 is used in the exposureassessment.
The application of a bioconcentration factor of 10,000 to the acute exposure scenario forcontaminated fish (hexachlorobenzene D07) is clearly and perhaps grossly conservative. All ofthe bioconcentration factors reported in ATSDR (1998) involved exposure periods of at least onemonth. As detailed by Calabrese and Baldwin (1993, pp. 12-22), the kinetics of bioconcentrationin fish are essentially identical to standard pharmacokinetic first-order absorption and first-orderelimination models (e.g. Goldstein et al. 1974). Consequently, for compounds that are extensivelybioconcentrated, such as hexachlorobenzene, the levels in fish after one day will reflectbioconcentration factors that are typically much less than those seen after long-term exposures. The impact of this conservative assumption on this risk assessment is discussed further in section3.4.
3.2.4.2. General Considerations for Chronic Exposures -- The major source of exposure for thegeneral public to hexachlorobenzene involves the consumption of contaminated food. The totalamount of hexachlorobenzene released to the environment each year is approximately 334,174 kg. Of this amount, the presence of hexachlorobenzene as a contaminant in pesticides accounts forabout 5% of this release (17,366 kg/year) (ATSDR 1998). Based on current concentrations ofhexachlorobenzene in environmental media and food, daily doses of hexachlorobenzene - i.e.,background levels of exposure - are in the range of 0.000001 mg/kg/day mg/kg/day (ATSDR1998).
The use of clopyralid by the Forest Service is currently about 3000 lbs/year or about 1360 kg/year(section 2). Given a level of 2.5 ppm hexachlorobenzene in technical grade clopyralid, the amountof hexachlorobenzene released to the environment as a result of Forest Service programs is about0.0034 kg:
1360 kg × 0.0000025 = 0.0034 kg.
Thus, of the total amount of hexachlorobenzene released per year (334,174 kg), the proportionassociated with the use of clopyralid by the Forest Service is about 0.00000001,
0.0034 kg ÷ 334,174 kg = 0.00000001
or one in one-hundred million.
3-21
This leads to the obvious conclusion that the use of clopyralid by the Forest Service will notsubstantially contribute to any wide-spread increase of ambient levels of hexachlorobenzene.
Notwithstanding the above assessment, localized increases in hexachlorobenzene contaminationcould occur in the use of clopyralid in Forest Service programs. In other words, while the use ofclopyralid by the Forest Service will not result in any general increase in environmental levels ofhexachlorobenzene, this does not demonstrate that localized contamination would be insignificant. In order to better assess the potential impact or local contamination, three chronic exposurescenarios are considered quantitatively: contaminated vegetation, contaminated water, andcontaminated fish.
3.2.4.2. Chronic Exposures Involving Contaminated Vegetation -- Immediately after directfoliar application to vegetation, hexachlorobenzene will volatilize relatively rapidly from thesurface of the vegetation and relatively little will be absorbed and available for longer-termexposures. Once hexachlorobenzene is absorbed into the soil column, however, it is relativelypersistent, with reported half times in soil ranging from 3 to 6 years (ATSDR 1998). Thus, theprimary concern for chronic exposures to contaminated vegetation is soil contamination withsubsequent uptake by plants. This type of scenario requires estimates of long-term levels in soil aswell as bioconcentration factors for terrestrial plants.
The highest bioconcentration factor for the uptake of hexachlorobenzene from soil into plants is19 (ATSDR 1998). This BCF was measured in the edible portion of carrots and will be useddirectly for this exposure assessment (hexachlorobenzene worksheet D05).
The study by Beall (1976) is the most relevant and detailed study for estimating longer-termconcentrations of hexachlorobenzene in soil after directed foliar applications. In this study,hexachlorobenzene was applied using a mechanical sprayer at a rate equivalent to 10 ppm (mg/kg)in the top 5 cm of soil in a simulated pasture maintained for 19 months in a greenhouse. AlthoughBeall (1976) does not specify an application rate in units of quantity per unit area, such as lb/acre,the approximate application rate can be calculated. A 1 cm2 soil surface that is 5 cm deep has avolume of 5 cm3:
5 cm × 1 cm2 = 5 cm3.
The soil type used in the Beall (1976) study is specified as sandy loam but detailed soilcharacteristics are not provided in the publication. Taking a bulk density of 1.6 g/cm3 for sandyloam soil (Knisel et al. 1992), a 5 cm3 volume of soil would weigh 0.008 kg:
5 cm3 × 1.6g/cm3 = 8 g = 0.008 kg.
To achieve a nominal concentration of 10 mg hexachlorobenzene/kg soil, the amount applied to a1 cm2 surface of soil would be :
0.008 kg × 10 mg HCB/kg soil = 0.08 mg = 80 µg.
3-22
Thus, the application rate can be calculated as 80 µg/cm2 or about 7.1 lbs/acre [1.0 lb/acre =11.21 µg/cm2]:
80 µg/cm2 ÷ (11.21 µg/cm2 ÷ 1 lb/acre) = 7.136 lbs/acre.
Over the 19 month duration of this study, the concentration of hexachlorobenzene in the 2-4 cmsoil layer was initially 0.1124 mg/kg decreased linearly to 0.0876 mg/kg after one year. Thisdecrease is equivalent to a dissipation coefficient of 0.25 year-1:
0.0876 ÷ 0.1124 = e-kt
k = -ln(0.0876÷0.1124)/1 year = 0.25 year-1
which is equivalent to a half time of 2.8 years:
ln(2)÷0.25 year-1 = 2.78 years
This is reasonably consistent with other reported half times in soil of 3 to 6 years (ATSDR 1998).
For this risk assessment, the approximate average concentration of hexachlorobenzene in soil over the 1 year period, 0.1 ppm (mg/kg), will be used as the basis for estimating soil levels that couldbe associated with the application of hexachlorobenzene to vegetation. As detailed in worksheetB01, a deposition rate for hexachlorobenzene can be calculated at 0.00000025 lb a.i./acre basedon the typical clopyralid application rate of 0.1 lb a.e./acre. Thus, for the 2-4 cm layer of soil, theaverage concentration of hexachlorobenzene in soil over a one year period after the deposition of0.00000025 lb a.i./acre can be estimated at 0.000000003 or 3×10⁻⁹ ppm (mg/kg soil):
0.1 ppm × 0.00000025 lb HCB/acre ÷ 7.1 lbs HCB/acre = 0.000000003 ppm
Because of the relatively long half time of hexachlorobenzene, the potential impact of repeatedapplications must also be considered. Based on the plateau principle (e.g., Goldstein et al. 1974;O'Flaherty 1981), the concentration at infinite time (C4) relative to the concentration after the firsttreatment (C0) may be calculated as:
C4 ÷ C0 = 1÷(1-e-k )t)
where, k is the dissipation rate in units of reciprocal time and )t is the time interval betweentreatments. The reported half times of 3 to 6 years, correspond to dissipation rates of 0.11 to0.23 years [k = ln(2)÷t1/2]. Assuming treatments every year, the maximum build up would be afactor of about 5 to 10:
1÷(1-e-0.11 to 0.23 × 1 year) = 4.9 to 9.6.
3-23
Thus, in hexachlorobenzene worksheet D05, the concentration of hexachlorobenzene in soil of3×10-9 ppm is multiplied by 10 and a concentration of 3×10⁻⁸ ppm is used for the typicalapplication rate of 0.1 lb a.e. clopyralid/acre. As indicated in section 2, the lower and upperranges are based on application rates that vary by a factor of 10 from the typical rate.
3.2.4.3. Chronic Exposures Involving Contaminated Water -- Immediately after application ofa pesticide that is contaminated with hexachlorobenzene to soil or plants, there is not likely to beany immediate contamination of water attributable to the hexachlorobenzene in the contaminatedpesticide. Nonetheless, because of the persistence of hexachlorobenzene, it will remain in the soiland could be transferred to surface waters where most of the hexachlorobenzene will be bound tosediments or bioconcentrated in aquatic organisms (ATSDR 1998).
No monitoring studies have been encountered that permit a direct estimate of the amount ofhexachlorobenzene that would be found in ambient water as a result of applying a herbicidecontaminated with hexachlorobenzene. Nonetheless, there is ample monitoring data to indicatethat hexachlorobenzene can, over time, be transported to water either by runoff or byvolatilization with subsequent redeposition in rainwater. Because hexachlorobenzene binds tightlyto and is relatively immobile in soils, hexachlorobenzene is not likely to percolate through soilsand directly contaminate ground water (ATSDR 1998). While volatilization may be an importantroute of environmental transport, volatilized hexachlorobenzene will be rapidly dispersed andtransported over a relatively wide area. Although this will contribute to general backgroundlevels of hexachlorobenzene, the amounts of hexachlorobenzene released in Forest Serviceprograms will not substantially contribute to background levels of hexachlorobenzene (section3.2.4.2). Consequently, for this risk assessment, the contamination of ambient water is based onestimates of hexachlorobenzene runoff from contaminated soil.
In the absence of an appropriate monitoring study, the runoff of hexachlorobenzene to ambientwater is estimated using the GLEAMS model (Knisel et al. 1992). Details of the application ofthis model to estimating hexachlorobenzene runoff are provided in Appendix 7. The basicexposure scenario assumes that hexachlorobenzene, as a contaminant in clopyralid, is appliedalong a ten acre right-of-way that is 50 feet wide and 8712 feet long. For estimating runoff towater, it is assumed that a body of water runs along the length of the right-of-way and that theslope toward the water is 20 percent. Two types of soils are modeled: clay (high runoff potential)and sand (low runoff potential). Annual rainfall rates ranging from 5 to 250 inches are used toreflect the variability of regional rainfall rates based on statistics from the U.S. Weather Service(1998) covering the period from 1961 to 1990.
For both clay and sand, the specific model parameters are selected to yield high estimates ofpesticide runoff for each soil type. The model parameter having the greatest impact on runoff isthe runoff curve number, a parameter that is used to estimate runoff based on soil texture andother physical characteristics of the soil. For both clay and sand, the runoff curve numbers arebased on fallow straight row plots or hard packed surfaces.
3-24
As detailed in Appendix 7, runoff of hexachlorobenzene into surface water is not likely inrelatively arid areas - i.e., annual rainfall of less than 10 inches. Because of the general rather thansite-specific nature of the GLEAMS modeling, however, some runoff could occur in arid areasduring unusually severe rainfalls, at least at sites with high runoff potential. In areas of extremelyhigh rainfall - i.e., approaching 200 to 250 inches per year - annual runoff could range from about5% of the applied amount in sandy soils to about 10% of the applied amount in clay soils.
All of these runoff estimates from GLEAMS apply to the edge of the field. In other words, forclay at rainfall rate of 100 inches per year, GLEAMS estimates that about 5% of the appliedhexachlorobenzene will be transported off of the right-of-way. The GLEAMS model runs,however, do not provide any information on the transport of hexachlorobenzene beyond of theborders of the right-of-way. In the absence of a buffer zone, all of the hexachlorobenzene couldbe projected to go directly into the water. In the application of clopyralid, however, the ForestService uses a 100 foot buffer around surface water.
Any attempt to realistically model the impact of a buffer zone on water contamination would behighly site-specific. A simplifying assumption could be that all of the annual runoff occurs on thefirst day of each year, is evenly dispersed on the first 50 foot strip adjacent to the right-of-way,and thus available for runoff toward the body of water. Similarly, all of the runoff on this firstsection of buffer be assumed to occur on the first day of each year, be evenly dispersed on thesecond 50 foot strip adjacent to the body of water, and thus available for runoff into the body ofwater. Thus, 12% of the applied hexachlorobenzene would runoff the right-of-way to the firstsection of buffer, 12% of this runoff will runoff to the second section of buffer, and 12% of thisrunoff will be discharged into the water. Under this assumption, the proportion running into thewater each year would be approximately 0.002 of the amount applied to the right-of-way:
0.12 × 0.12 × 0.12 = 0.001728
While this might appear to be a highly conservative and protective assumption, it couldunderestimate exposure for sites in which the runoff from the right-of-way enters a channel or isotherwise more directly transported to surface water. Such site-specific factors cannot bespecifically addressed in any general exposure assessment. Thus, the impact of the buffer is notquantitatively considered in the exposure assessment.
The calculations for estimating the typical concentrations of hexachlorobenzene in ambient waterthat could be expected from the application of clopyralid at a rate of 0.1 lb a.e./acre along aright-of-way are detailed in appendix 7. These calculations essentially involve the application ofclopyralid along a 10 acre right-of-way adjacent to a 10 acre pond with an average depth of 1meter. This scenario assumes that the hexachlorobenzene is bound to soil and mixed in thebottom 1 cm of the pond sediment. This assumption is intentionally conservative. Increasing themixing depth will increase the amount of hexachlorobenzene bound to the sediment and hencedecrease the amount of hexachlorobenzene in water. The amount of hexachlorobenzene insediment relative to the amount in water is calculated from the soil sorption coefficient ofhexachlorobenzene of 100,000 (U.S. EPA 1998) (appendix 7). Because of the persistence of
3-25
hexachlorobenzene in the environment, modeled scenarios assumed the annual application ofclopyralid over a 20 year period.
The resulting estimates of concentration of hexachlorobenzene in surface water vary substantiallywith rainfall rates and the number of years over which clopyralid is applied. At an annual rainfallrate of 25 inches, about the national average, the estimated concentration of hexachlorobenzene inwater associated with runoff from clay after one year is about 5×10-13 mg/L. After 20 years ofannual applications, the modeled concentration is about 3×10-12 mg/L. At this rainfall rate (25inches/year), no runoff from sand is anticipated. Higher levels of water contamination areestimated in areas with higher rainfall rates. For example, at an annual rainfall rate of 150 inches,concentrations of hexachlorobenzene in water of about 7×10-11 mg/L to 1×10⁻¹⁰ mg/L areestimated as a result of runoff from sand and clay soils, respectively. At atypically high rainfallrates of 250 inches per year, concentrations increase to about 1×10⁻¹⁰ mg/L to 2×10⁻¹⁰ mg/L overa 20 year period.
For this risk assessment, the central estimate of the concentration of hexachlorobenzene in wateris taken as 3×10-12 mg/L - runoff from clay after a 20 year period with an annual rainfall rateclose to the national average. The upper range of the concentration of hexachlorobenzene inwater is taken as 2×10⁻¹⁰ mg/L - runoff from clay after a 20 year period with an annual rainfallrate of 250 inches, about 10 fold higher than the national average and substantially above upperrange of rainfall rates in the United States - i.e., 172.2 inches for Yakutat, Alaska (U.S. WeatherService 1998). This may be viewed as and probably is an extremely conservative worst-casescenario. Nonetheless, given the persistence of hexachlorobenzene in water, the seriousness ofthe endpoint for hexachlorobenzene - i.e., cancer - and the need to encompass as wide a range ofconditions as reasonably possible, this conservative approach seems justified. The lower range forwater contamination is taken as zero. This simply reflects that fact that under may conditions ofapplication - i.e., an arid region in an area relatively far removed from open water - contaminationof surface water is implausible.
As summarized in ATSDR (1998), monitored levels of hexachlorobenzene in ambient water ordrinking water in the Great Lakes region range from essentially zero (below the limits ofdetection) to about 0.2 nanograms/L or 2×10⁻¹⁰ mg/L. Thus, it appears that the use of clopyralidcontaminated with hexachlorobenzene in Forest Service programs could lead to the localizedcontamination of ambient water that is in the same range as general background levels ofcontamination.
3.2.4.3. Chronic Exposures Involving the Consumption of Contaminated Fish -- Calculation ofthe doses of hexachlorobenzene that might be associated with the consumption of contaminatedfish are detailed in hexachlorobenzene worksheet D09. These calculations are based on the sameexposure scenario and estimates of hexachlorobenzene concentrations in ambient water that aredetailed in the previous section as well as standard estimates of fish consumption data for thegeneral public as well as subsistence populations (worksheet A04).
3-26
The most important variable unique to this scenario is the bioconcentration factor. This exposure assessment uses a bioconcentration factor in fish of 10,000. ATSDR (1998) reportsbioconcentration factors that range from about 2000 to 20,000, depending on the species andexperimental design. As with the acute exposure scenario for contaminated fish, a BCF of 10,000is selected as a reasonably conservative estimate. The subsequent dose estimates vary linearlywith the bioconcentration factor. As discussed further in section 3.4.7.2, this relatively modestvariability in this factor has no substantial impact on the characterization of risk.
3.3. DOSE-RESPONSE ASSESSMENT3.3.1. Overview. The Office of Pesticide Programs of the U.S. EPA has derived an RfD of 0.5mg/kg/day for clopyralid. This RfD is based on a chronic rat NOAEL of 50 mg/kg/day and anuncertainty factor of 100. The rat NOAEL is well-supported by chronic NOAELs in dogs andmice as well as additional chronic NOAEL in rats. The NOAELs for chronic toxic effects arebelow the NOAELs for reproductive effects. Thus, doses at or below the RfD will be at or belowthe level of concern for reproductive effects.
The only ambiguity in the dose-response assessment for clopyralid concerns the critical effect -i.e., the adverse effect which will occur at the lowest dose level. No specific adverse effect hasbeen consistently observed in the available studies. Different studies in rats, mice, and dogs havenoted general decreases in body weight, increases in liver and kidney weight, as well as athickening in some epithelial tissue. Decreases in body weight and changes in organ weight arecommonly observed in chronic toxicity studies and can indicate either an adaptive or toxicresponse. Changes in epithelial tissue are less commonly observed and the toxicologicsignificance of this effect is unclear.
The data on the toxicity of clopyralid are adequate for additional dose-response or dose-severitymodeling. Because none of the anticipated exposures substantially exceed the RfD and the greatmajority of anticipated exposures are far below the RfD, such additional modeling is not necessaryfor the characterization of risk.
The contamination of technical grade clopyralid with hexachlorobenzene and pentachlorobenzenecan be quantitatively considered to a limited extent. The U.S. EPA has derived RfDs for bothpentachlorobenzene and hexachlorobenzene and a cancer potency factor for hexachlorobenzene. Based on the levels of contamination of technical grade clopyralid with these compounds and therelative potencies of these compounds to clopyralid, this contamination is not significant in termsof potential systemic toxic effects. This assessment, however, does not impact the potentialcarcinogenicity associated with hexachlorobenzene and this risk, based on the U.S. EPA’s cancerpotency parameter, is quantitatively considered in the risk characterization.
3.3.2. Existing Guidelines for Clopyralid. The U.S. EPA has not derived an agency-wide RfDfor clopyralid (U.S. EPA 1997a). Nonetheless, the Office of Pesticide Programs of the U.S. EPAhas derived an RfD of 0.5 mg/kg/day (U.S. EPA 1988a). This RfD is also discussed in Lade(1997). The RfD is based on a two-year rat feeding study in which groups of male and femalerats were administered clopyralid in the diet for 2 years at concentrations that resulted in daily
3-27
doses of 0 (control), 5, 15, 50 or 150 mg/kg/day. No gross signs of toxicity, changes in organ orbody weight, or histopathologic effects attributable to treatment were seen at doses of 50mg/kg/day or lower. At 150 mg/kg/day, the only effect noted was a decrease in the body weightof the female rats (Humiston et al. 1977). Thus, the U.S. EPA (1988a) designated the dose of 50mg/kg/day as a NOAEL and used an uncertainty factor of 100 (10 for species-to-speciesextrapolation and 10 for sensitive subgroups in the human population) to derive the RfD of 0.5mg/kg/day [50 mg/kg/day ÷ 100 = 0.5 mg/kg/day]. Because the study by Humiston et al. (1977)entailed a 2-year exposure period which approximates the life span of rats, there is no need for anadditional uncertainty factor to account for duration of exposure.
No other criteria for clopyralid have been found on INTERNET sites of any of the organizationsresponsible for setting environmental or occupational exposure recommendations, criteria orstandards - i.e., WHO, OSHA, NIOSH, or ACGIH. No published recommendations from theseagencies or organizations were encountered in the literature search, which included databasescovering the Federal Register.
As detailed in Appendix 3, the Humiston et al. (1977) study is supported by a number ofadditional subchronic and chronic studies in rats, mice, and dogs. The selection by the EPA of 50mg/kg/day as the NOEL on which to base the RfD is not contradicted by any of these otherbioassays. The only elaboration that might be made to the U.S. EPA RfD is that hyperplasia andthickening of the gastric epithelium was noted at a daily dose of 150 mg/kg/day in another chronicrat feeding study (Barna-Lloyd et al. 1986). In the bioassay by Barna-Lloyd et al. (1986),decreased body weight was observed at 1500 mg/kg/day but not at 150 mg/kg/day. In dogs,daily doses of 150 mg/kg/day over a period of 18 months resulted in increased relative liverweight in females only at 150 mg/kg with no effects being noted at 50 mg/kg/day (DowAgroSciences 1998).
Based on these data, the critical effect - i.e., the adverse effect which will occur at the lowest doselevel - is somewhat ambiguous. At a factor of 3 above the chronic NOAEL effects have beenreported on body weight (Humiston et al. 1977), liver weight (Dow AgroSciences 1998), and thegastric epithelium (Barna-Lloyd et al. 1986). Decreases in body weight and changes in organweight are commonly observed in chronic toxicity studies and can indicate either an adaptive ortoxic response. Changes in epithelial tissue are less commonly observed and the toxicologicsignificance of this effect is unclear.
The data in appendix 1 could be used to develop a more elaborate dose/response or dose/severityassessments with either explicit dose/response models or categorical regression analyses (e.g.,Dourson et al. 1997). However, as detailed in section 3.2, none of the exposure scenarios forclopyralid result in doses that substantially exceed the RfD. Consequently, an elaboration ofdose-response or dose-severity relationships is unnecessary.
3.3.3. Existing Guidelines for Hexachlorobenzene. 3.3.3.1. Systemic Toxicity -- Two contaminants are found in technical grade clopyralid:hexachlorobenzene (<2.5 ppm) and pentachlorobenzene (<0.3ppm) (section 3.1.9.1). No
3-28
guidelines, criteria, or standards have been encountered for pentachlorobenzene. The U.S. EPAhas derived an RfD and a cancer potency factor for hexachlorobenzene (U.S. EPA 1997b) as wellas an RfD for pentachlorobenzene (U.S. EPA 1988b). More recently, ATSDR (1998) has derivedacute, intermediate, and chronic MRLs for hexachlorobenzene.
The U.S. EPA RfD for hexachlorobenzene is 0.0008 mg/kg/day. This RfD is based on a130-week feeding study in male and female rats that also included a 90-day exposure to offspring. The U.S. EPA judged the NOAEL for liver effects at a dose of 0.08 mg/kg/day with a LOAEL at0.29 mg/kg/day. The LOAEL was characterized by U.S. EPA (1997b) as “an increase (p<0.05)in hepatic centrilobular basophilic chromogenesis” in the offspring of the chronically exposed rats. As with clopyralid and for the same reasons as with clopyralid, the U.S. EPA used an uncertaintyfactor of 100 to derive the RfD of 0.0008 mg/kg/day.
The U.S. EPA RfD for pentachlorobenzene is also 0.0008 mg/kg/day, identical to the RfD forhexachlorobenzene. This RfD is based on a subchronic feeding study in male and female rats inwhich hyaline droplets were seen in proximal kidney tubules at 8.3 mg/kg/day, the lowest dosetested. Thus, this study did not identify a NOAEL. The RfD is thus based on the LOAEL of 8.3mg/kg/day divided by an uncertainty factor of 10,000. The uncertainty factor of 10,000 is basedon four factors of 10 for interspecies variability, variability in the human population, the use of asubchronic rather than chronic study, and the use of a LOAEL rather than a NOAEL (U.S. EPA1988b).
ATSDR (1998) has derived an MRL for hexachlorobenzene of 0.00002 mg/kg/day, a factor of 40below the corresponding U.S. EPA RfD of 0.0008 mg/kg/day. This RfD is based on a LOAEL of0.016 mg/kg/day from a study in which Sprague-Dawley rats were administeredhexachlorobenzene in the diet for 130 weeks. The LOAEL is characterized as changes in liverhistology - i.e., peribiliary lymphocytosis and fibrosis. These changes were also seen in a largenumber of control animals but the effects were significantly increased (p<0.05) in animals exposedto hexachlorobenzene and the magnitude of the increase was dose-related. In deriving the MRL,ATSDR applied an uncertainty factor of 1000, three factors of 10 for interspecies variability,variability in the human population, and the use of a LOAEL rather than a NOAEL.
Based on the U.S. EPA RfDs for clopyralid, pentachlorobenzene, and hexachlorobenzene as wellas the available information on the levels of these chlorinated benzenes in technical gradeclopyralid, the toxicologic significance of the contamination of clopyralid withpentachlorobenzene and hexachlorobenzene can be assessed. RfDs can be treated as estimates oftoxicologically equivalent or equitoxic doses - i.e., all RfDs are doses that should cause noadverse effects. The ratio of equitoxic doses is one of the standard definitions of relative potency(e.g., Finney 1971). Using this definition, both pentachlorobenzene and hexachlorobenzene maybe regarded as about 600 times more potent than clopyralid:
0.5 mg/kg/day ÷ 0.0008 mg/kg/day = 625.
3-29
One common approach to assessing the hazards of chemical mixtures and the relative contributionthat each component makes to the mixture is the concept of potency weighted dose (e.g. Mumtazet al. 1994). This can be defined as the sum of the products of the relative potencies ($) andamounts or proportions (B) of each of the components in the mixture:
Dmix ' jn
i'1
#iBi
where the subscript, i, designates the ith component in the mixture. For technical grade clopyralid,estimates are available of the proportions of both hexachlorobenzene (2.5 ppm or 0.0000025) aswell as pentachlorobenzene (0.3 ppm or 0.0000003) [1 ppm = 0.000001]. The proportion ofclopyralid may be calculated by subtracting the proportions of each of these two contaminants:
1 - (0.0000025 + 0.0000003) = 0.9999972.
Since the toxicity of clopyralid relative to itself is unity (1) by definition, the potency weightedrelative toxicity of technical grade clopyralid can be calculated as:
clopyralid: 0.9999972 × 1 = 0.9999972 hexachlorobenzene: 0.0000025 × 625 = 0.0015625 pentachlorobenzene: 0.0000003 × 625 = 0.0001875
Total: 1.0017472
Thus, in terms of the toxicologic contribution of each component, clopyralid contributedapproximately 99.8 % [0.9999972 ÷ 1.0017472 = 0.998253] of the toxicity and the twochlorinated benzenes contribute approximately 0.2% of the toxicity.
The same type of calculation can be conducted using the MRL for hexachlorobenzene derived byATSDR (1998). Using this MRL, the potency of hexachlorobenzene relative to clopyralid is25,000:
0.5 mg/kg/day ÷ 0.00002 mg/kg/day = 25000.
Thus, the potency weighted relative toxicity of technical grade clopyralid can be calculated as:
clopyralid: 0.9999972 × 1 = 0.9999972 hexachlorobenzene: 0.0000025 × 25000 = 0.0625 pentachlorobenzene: 0.0000003 × 25000 = 0.015
Total: 1.0774972
Based on this more conservative estimate of the chronic toxic potency of hexachlorobenzene,clopyralid still accounts for approximately 93% [0.9999972÷1.0774972 = 0.9281] of the chronictoxic potency of the technical grade product. Thus, although the two chlorinated benzenes shouldbe regarded as much more potent toxicologically than clopyralid, the chlorinated benzenes do notappear to be present in a significant quantity with respect to systemic toxicity. In addition, all of
3-30
the toxicity studies on clopyralid used the technical grade clopyralid and thus encompass the likelytoxic contribution of the chlorinated benzene contaminants.
As noted above, ATSDR (1998) has also derived acute and intermediate MRLs forhexachlorobenzene. The acute MRL is 0.008 mg/kg/day, a factor of 10 above the chronic RfDderived by U.S. EPA. The Office of Drinking Water of the U.S. EPA has derived a maximumcontaminant level of 0.001 mg/L of drinking water and a maximum short term health advisory of0.05 mg/L of drinking water (U.S. EPA 1998).
3.3.3.2. Carcinogenic Potency -- In addition to systemic toxicity, hexachlorobenzene has beenshown to cause tumors of the liver, thyroid and kidney in three species of rodents - mice, rats, andhamsters (EXTOXNET 1996; U.S. EPA 1997b). Based on a two-year feeding study in rats, theU.S. EPA (1997b) derived a cancer slope factor for lifetime exposures of 1.6 (mg/kg/day)-1. Inother words, cancer risk over a lifetime is calculated as the product of the daily dose over alifetime and the potency parameter:
P = d $
and the lifetime daily dose associated with a given risk level is:
d = P÷$
Thus, the lifetime daily dose of hexachlorobenzene associated with a risk of one in one-million(1÷1,000,000 or (P=0.000001) is 0.000000625 mg/kg/day:
d(mg/kg/day) = 0.000001 ÷ (1.6 (mg/kg/day)-1).
As noted in section 3.1.5, clopyralid is not classified as a carcinogen. While it can be argued thatthe technical grade clopyralid used in the standard bioassays encompasses any toxicologic effectsthat could be caused by hexachlorobenzene, this argument is less compelling for carcinogeniceffects because, for most cancer causing agents, the cancer risk is conservatively viewed as anon-threshold phenomenon - i.e., zero risk is achieved only at zero dose.
The potency factor of 1.6 (mg/kg/day)-1 is intended to be applied to lifetime daily doses. Assummarized in section 3.2, many of the exposure assessments used in this risk assessment involvemuch shorter periods of time. Following the approach recommended by U.S. EPA (1997b, p.35), this risk assessment assumes that the average daily dose over a lifetime is the appropriatemeasure for the estimation of cancer risk. Thus, the lifetime potency of 1.6 (mg/kg/day)-1 isscaled linearly when applied to shorter periods of exposure. For example, taking 70 years [70years × 365 days/year = 25,550 days] as a reference life span, the potency parameter for aone-day exposure is calculated as 0.000063 (mg/kg/day)-1:
1.6 (mg/kg/day)-1 × (1 day ÷ 25,550 days) = 0.000062622 (mg/kg/day)-1.
3-31
For example, taking a dose of 0.001 mg/kg/day, the lifetime risk associated with a one-dayexposure at this dose would be calculated as 0.000000063:
0.000063 (mg/kg/day)-1 × 0.001 mg/kg/day = 0.000000063.
This method of estimating risk is used in the worksheets for hexachlorobenzene that are appendedto this document.
No explicit dose response assessment is made for the potential carcinogenic effects ofpentachlorobenzene. This is consistent with the approach taken by U.S. EPA (1988b) and reflectsthe fact the available data on pentachlorobenzene are inadequate to classify this compound as acarcinogen or to estimate carcinogenic potency. This is not the most conservative approach thatcould be taken. For example, because pentachlorobenzene and hexachlorobenzene arestructurally and toxicologically similar and because the chronic RfD for pentachlorobenzene isidentical to the RfD for hexachlorobenzene, a more conservative approach would be to assumethat pentachlorobenzene is a carcinogen and that the carcinogenic potency of pentachlorobenzeneis identical to that of hexachlorobenzene. If such an approach were taken, the cancer risks takenin this risk assessment would increase by 10 percent. In other words, pentachlorobenzene has thesame potency as hexachlorobenzene but it present at a ten-fold lower concentration relative tohexachlorobenzene. As detailed in the following section, this relatively modest difference haslittle impact on the characterization of cancer risk.
3.4. RISK CHARACTERIZATION3.4.1. Overview. The risk characterization for potential human health effects associated with theuse of clopyralid in Forest Service programs is relatively unambiguous. Based on the estimatedlevels of exposure and the criteria for chronic exposure developed by the U.S. EPA, there is noevidence that typical or accidental exposures will lead to dose levels that exceed the level ofconcern. In other words, all of the anticipated exposures - most of which involve highlyconservative assumptions - are at or below the RfD. The use of the RfD - which is designed to beprotective of chronic or lifetime exposures - is itself a very conservative component of this riskcharacterization because the duration of any plausible and substantial exposures is far less thanlifetime.
Irritation and damage to the skin and eyes can result from exposure to relatively high levels of clopyralid - i.e., placement of clopyralid directly onto the eye or skin. From a practicalperspective, eye or skin irritation is likely to be the only overt effect as a consequence ofmishandling clopyralid. These effects can be minimized or avoided by prudent industrial hygienepractices during the handling of clopyralid.
The only reservation attached to this assessment of clopyralid is that associated with any riskassessment: Absolute safety cannot be proven and the absence of risk can never bedemonstrated. No chemical, including clopyralid, has been studied for all possible effects and theuse of data from laboratory animals to estimate hazard or the lack of hazard to humans is aprocess that is fraught with uncertainty. Prudence dictates that normal and reasonable care should
3-32
be taken in the handling of this or any other chemical. Notwithstanding these reservations, theuse of clopyralid does not appear to pose any identifiable hazard to workers or the general publicin Forest Service programs.
The contamination of clopyralid with hexachlorobenzene does not appear to present anysubstantial cancer risk. Administratively, the Forest Service has adopted a cancer risk level of onein one-million (1÷1,000,000) as a trigger that would require special steps to mitigate exposure orrestrict and possibly eliminate use. Based on relatively conservative exposure assumptions, therisk levels estimated for members of the general public are below this trigger level. The highestrisk level is estimated at about 8 in 100 million ( 7.82e-08 or about 0.00000008), about a factor of12 below the level of concern. The exposure scenario associated with this risk level involves theconsumption of contaminated fish by subsistence populations - i.e., groups that consume relativelylarge amounts of contaminated fish. The consumption of fish contaminated withhexachlorobenzene is a primary exposure scenario of concern because of the tendency ofhexachlorobenzene to bioconcentrate from water into fish. This is also consistent with the generalobservation that exposure to hexachlorobenzene occurs primarily through the consumption ofcontaminated food.
For workers, the only cancer risk level that approaches a level of concern involves workerswearing contaminated gloves for one-hour. In this instance, the risk level is about one in ten-million [1.13e-07], about a factor of 10 below the Forest Service trigger level of one inone-million. As with the fish consumption scenario for members of the general public, thecontaminated glove scenario for workers leads to relatively high risks because of the tendency ofhexachlorobenzene to partition into fatty tissue.
Both of these relatively high risk scenarios are based on upper ranges of plausible exposures. Based on central estimates of exposure, the cancer risk levels are below the trigger level byfactors of about one-thousand (1000) to ten-million (10,000,000). In other words, the cancer riskestimates based on central or most likely estimates of exposure are in the range of about 1 inone-billion (1÷1,000,000,000) to less than 1 in one-trillion (1÷1,000,000,000,000).
In terms of potential toxic effects, the only scenarios of marginal concern with hexachlorobenzeneare the scenarios that approach the level of concern for cancer risk: consumption of contaminatedfish by members of the general public and workers wearing contaminated gloves. In all cases,however, projected exposures are below the RfD by at least a factor of five.
3.4.2. Workers. A quantitative summary of the risk characterization for workers associated withexposure to clopyralid is presented in Table 3-6. The quantitative risk characterization isexpressed as the hazard quotient, which is the ratio of the estimated exposure doses from Table3-1 to the RfD of 0.5 mg/kg/day, as derived in section 3.3.2. As in previous tables, numbersgreater than or equal to 0.000001 are expressed in standard decimal notation and smaller numbers
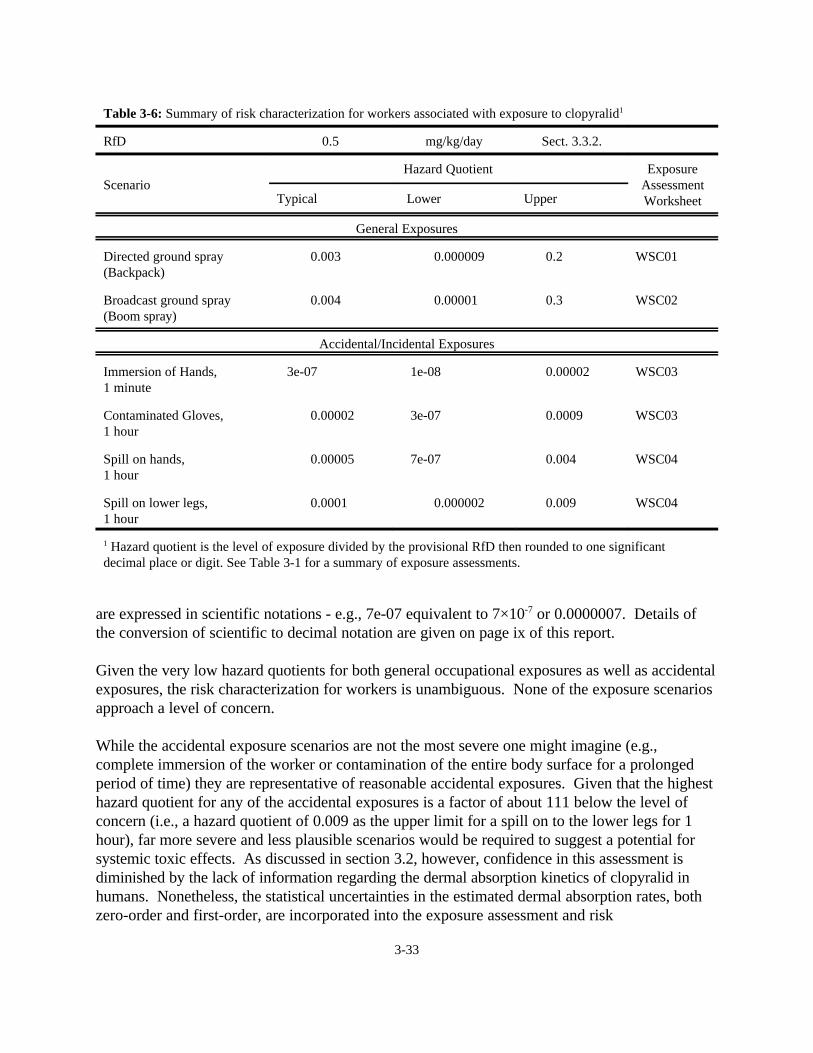
3-33
are expressed in scientific notations - e.g., 7e-07 equivalent to 7×10⁻⁷ or 0.0000007. Details ofthe conversion of scientific to decimal notation are given on page ix of this report.
Given the very low hazard quotients for both general occupational exposures as well as accidentalexposures, the risk characterization for workers is unambiguous. None of the exposure scenariosapproach a level of concern.
While the accidental exposure scenarios are not the most severe one might imagine (e.g.,complete immersion of the worker or contamination of the entire body surface for a prolongedperiod of time) they are representative of reasonable accidental exposures. Given that the highesthazard quotient for any of the accidental exposures is a factor of about 111 below the level ofconcern (i.e., a hazard quotient of 0.009 as the upper limit for a spill on to the lower legs for 1hour), far more severe and less plausible scenarios would be required to suggest a potential forsystemic toxic effects. As discussed in section 3.2, however, confidence in this assessment isdiminished by the lack of information regarding the dermal absorption kinetics of clopyralid inhumans. Nonetheless, the statistical uncertainties in the estimated dermal absorption rates, bothzero-order and first-order, are incorporated into the exposure assessment and risk
Table 3-6: Summary of risk characterization for workers associated with exposure to clopyralid1
RfD 0.5 mg/kg/day Sect. 3.3.2.
ScenarioHazard Quotient Exposure
AssessmentWorksheetTypical Lower Upper
General Exposures
Directed ground spray(Backpack)
0.003 0.000009 0.2 WSC01
Broadcast ground spray(Boom spray)
0.004 0.00001 0.3 WSC02
Accidental/Incidental Exposures
Immersion of Hands, 1 minute
3e-07 1e-08 0.00002 WSC03
Contaminated Gloves,1 hour
0.00002 3e-07 0.0009 WSC03
Spill on hands,1 hour
0.00005 7e-07 0.004 WSC04
Spill on lower legs, 1 hour
0.0001 0.000002 0.009 WSC04
1 Hazard quotient is the level of exposure divided by the provisional RfD then rounded to one significantdecimal place or digit. See Table 3-1 for a summary of exposure assessments.
3-34
characterization. Again, these estimates would have to be in error by a factor of over 100 inorder for the basic characterization of risk to change. In addition, the hazard quotients for theseacute occupational exposure are based on a chronic RfD. This adds and additional level ofconservatism and, given the very low hazard quotients for these scenarios, reenforces theconclusion that there is no basis for asserting that systemic toxic effects are plausible.
The hazard quotients for general occupational exposure scenarios are somewhat higher than thosefor the accidental exposure scenarios. Nonetheless, the upper limit of the hazard quotients forboth backpack and boom spray applications are below the level of concern - i..e., a hazard indexof 1. As discussed in section 3.2 and detailed in worksheets C01 and C02, these upper limits ofexposure are constructed using the highest anticipated application rate, the highest anticipatednumber of acres treated per day, and the upper limit of the occupational exposure rate. If any ofthese conservative assumptions are modified (e.g., the compound is applied at the typical ratherthan the maximum application rate) the hazard quotients would drop substantially. For example,the upper end of the range for the hazard quotient involving broadcast application is 0.3. This isbased on an application of 1 lb a.e./acre. At the typical application rate of 0.1 lb a.e./acre, thehazard quotient would be 0.03, a factor of about 30 below the level of concern.
The simple verbal interpretation of this quantitative characterization of risk is that even under themost conservative set of exposure assumptions, workers would not be exposed to levels ofclopyralid that are regarded as unacceptable. Under typical application conditions, levels ofexposure will be far below levels of concern.
As discussed in section 3.1.6, clopyralid can cause irritation and damage to the skin and eyes. Quantitative risk assessments for irritation are not derived; however, from a practical perspective,eye or skin irritation is likely to be the only overt effect as a consequence of mishandlingclopyralid. These effects can be minimized or avoided by prudent industrial hygiene practicesduring the handling of clopyralid.
3.4.3. General Public. The quantitative hazard characterization for the general public associatedwith exposure to clopyralid is summarized in Table 3-7. Like the quantitative riskcharacterization for workers, the quantitative risk characterization for the general public isexpressed as the hazard quotient using the RfD of 0.5 mg/kg/day.
None of the longer-term exposure scenarios approach a level of concern and none of theacute/accidental scenarios exceed a level of concern, based on central estimates of exposure,although the upper limit of the hazard quotient for the consumption of water after an accidentalspill reaches the level of concern.
Although there are several uncertainties in the longer-term exposure assessments for the generalpublic, as discussed in section 3.2, the upper limits for hazard quotients are sufficiently far below alevel of concern that the risk characterization is relatively unambiguous: based on the availableinformation and under the foreseeable conditions of application, there is no route of exposure or
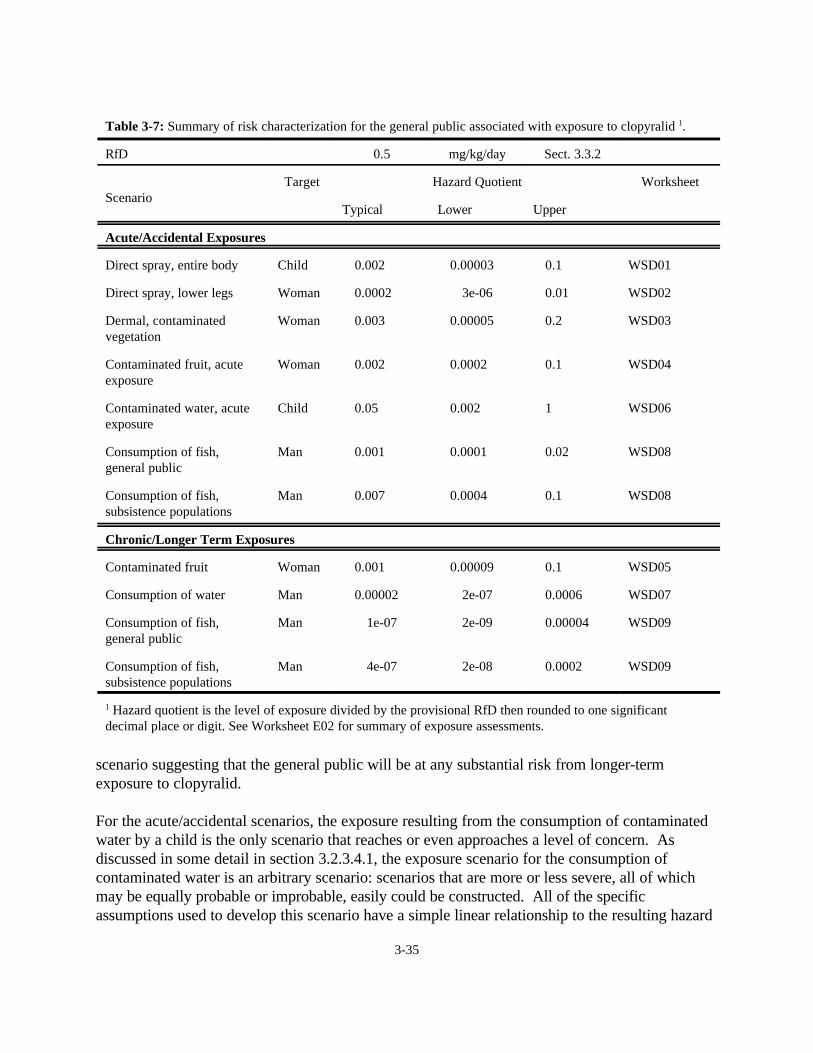
3-35
scenario suggesting that the general public will be at any substantial risk from longer-termexposure to clopyralid.
For the acute/accidental scenarios, the exposure resulting from the consumption of contaminatedwater by a child is the only scenario that reaches or even approaches a level of concern. Asdiscussed in some detail in section 3.2.3.4.1, the exposure scenario for the consumption ofcontaminated water is an arbitrary scenario: scenarios that are more or less severe, all of whichmay be equally probable or improbable, easily could be constructed. All of the specificassumptions used to develop this scenario have a simple linear relationship to the resulting hazard
Table 3-7: Summary of risk characterization for the general public associated with exposure to clopyralid 1.
RfD 0.5 mg/kg/day Sect. 3.3.2
ScenarioTarget Hazard Quotient Worksheet
Typical Lower Upper
Acute/Accidental Exposures
Direct spray, entire body Child 0.002 0.00003 0.1 WSD01
Direct spray, lower legs Woman 0.0002 3e-06 0.01 WSD02
Dermal, contaminatedvegetation
Woman 0.003 0.00005 0.2 WSD03
Contaminated fruit, acuteexposure
Woman 0.002 0.0002 0.1 WSD04
Contaminated water, acuteexposure
Child 0.05 0.002 1 WSD06
Consumption of fish, general public
Man 0.001 0.0001 0.02 WSD08
Consumption of fish,subsistence populations
Man 0.007 0.0004 0.1 WSD08
Chronic/Longer Term Exposures
Contaminated fruit Woman 0.001 0.00009 0.1 WSD05
Consumption of water Man 0.00002 2e-07 0.0006 WSD07
Consumption of fish,general public
Man 1e-07 2e-09 0.00004 WSD09
Consumption of fish,subsistence populations
Man 4e-07 2e-08 0.0002 WSD09
1 Hazard quotient is the level of exposure divided by the provisional RfD then rounded to one significantdecimal place or digit. See Worksheet E02 for summary of exposure assessments.
3-36
quotient. Thus, if the accidental spill were to involve 20 rather than 200 gallons of a field solutionof clopyralid, all of the hazard quotients would be a factor of 10 less. Nonetheless, this and otheracute scenarios help to identify the types of scenarios that are of greatest concern and maywarrant the greatest steps to mitigate. For clopyralid, such scenarios involve oral (contaminatedwater) rather than dermal (spills or accidental spray) exposure. As with the acute exposurescenarios for workers, the hazard quotients for the general public that involve acute exposurescenarios are inherently conservative in that they are based on the chronic RfD.
3.4.4. Sensitive Subgroups. There is no information to suggest that specific groups orindividuals may be especially sensitive to the systemic effects of clopyralid. As discussed insections 3.1.3 and 3.3.2, the likely critical effect of clopyralid in humans cannot be identifiedclearly. Clopyralid can cause decreased body weight, increases in kidney and liver weight,deceased red blood cell counts, as well as hyperplasia in gastric epithelial tissue. These effects,however, are not consistent among species or even between different studies in the same species. Thus, it is unclear if individuals with pre-existing diseases of the kidney, liver, or blood would beparticularly sensitive to clopyralid exposures, although individuals with any severe diseasecondition could be considered more sensitive to many toxic agents.
In addition, some individuals may suffer from multiple chemical sensitivity (e.g., ATSDR 1995). Such individuals may respond adversely to extremely low levels of chemicals and in a manner thatis atypical of the general population. There are no data or case reports, however, on idiosyncraticresponses to clopyralid.
3.4.5. Connected Actions. As indicated in section 3.1.10, clopyralid may be applied incombination with other herbicides, particularly in combination with 2,4-D or 2,4-D and picloram. There are no data in the literature suggesting that clopyralid will interact, either synergistically orantagonistically with these or other compounds.
3.4.6. Cumulative Effects. As noted above, this risk assessment specifically considers the effectof repeated exposure in that the chronic RfD is used as an index of acceptable exposure.Consequently, repeated exposure to levels below the toxic threshold should not be associatedwith cumulative toxic effects.
3.4.7. Hexachlorobenzene. 3.4.7.1. Workers -- Summaries of the exposure assessments and risk characterization for workersare given in the hexachlorobenzene worksheets that accompany this risk assessment. WorksheetE01 summarizes the exposure assessment for workers and is analogous to the correspondingworksheet for clopyralid. Worksheets E02a, E02b, and E02c summarize the risk characterizationfor workers.
Worksheet E02a presents the hazard quotients for workers. For acute exposures, the hazardquotient is the level of exposure divided by the acute MRL from ATSDR of 0.008 mg/kg/day. For chronic exposures, the hazard quotient is the level of exposure divided by the chronic RfD.
3-37
from U.S. EPA of 0.0008 mg/kg/day. For general worker exposures, the hazard quotients areapproximately three orders of magnitude below the corresponding hazard quotients for clopyralid(see Table 3-6). Even using the much more conservative chronic MRL for hexachlorobenzene of0.00002 mg/kg/day, none of the dose estimates approach a level of concern. Similarly, hazardquotients associated with spill scenarios are generally lower for hexachlorobenzene than thecorresponding scenarios for clopyralid. These comparisons are consistent with the generalassertion from section 3.3.3.1 that the amount of hexachlorobenzene in technical grade clopyralidit not toxicologically significant. Immersion scenarios for hexachlorobenzene, however, results inhigher estimated hazard quotients than the corresponding values for clopyralid. For the scenarioin which contaminated gloves are worn for 1 hour, the upper range of the estimated dose is belowthe acute MRL by a factor of 5. Thus, under reasonable work practices, none of the anticipatedaccidental or incidental exposures to hexachlorobenzene exceed the acute MRL.
Worksheet E02b presents the cancer risks - i.e., the levels of exposure from E01 multiplied by thecancer potency factor. In worksheet 02b, the cancer potency factor is adjusted to estimate dailyrisks by dividing the lifetime cancer potency factor of 1.6 (mg/kg/day)-1 by 25,500 days as detailedin section 3.3.3.2. The last worksheet for workers, worksheet 02c, presents the cancer riskrelative to a risk level of one in one-million - i.e., each risk level from worksheet 02b is divided byone million. A risk level of one in one-million or less has been administratively selected by theForest Service as a reference level for risk assessments. Thus, in worksheet 02c, any valuegreater than unity represents a risk that is considered unacceptable by the Forest Service.
For the general exposure scenarios, the upper limits of cancer risk are about 1×10-11 to 2×10-11 -i.e., one or two in one-hundred billion - for each day of exposure. Thus, using the upper levels ofexposure, a worker would have to handle clopyralid for 50000 to100000 days (1×10⁻⁶ ÷ 1×10-11
to 2×10-11) to reach a risk level of one in one-million (1×10⁻⁶). This is equivalent to about 140 to270 years. Based on daily risks associated with central estimates of exposure (i.e., risks of3.5×10-13), a worker would have to handle clopyralid for 3×10⁶ days [1×10⁻⁶ ÷3.5×10⁻¹³]. This isequivalent to 3,000,000 days or about 8000 years. For the accidental exposure scenarios, thehighest risk level is about 1×10⁻⁷.
While there are substantial uncertainties involved in any cancer risk assessment, the verbalinterpretation of this numeric risk characterization is relatively simple. There is no plausible basisfor asserting that the contamination of clopyralid with hexachlorobenzene will result in anysubstantial risk of cancer in workers applying clopyralid under normal circumstances.
For the accidental scenarios, however, the cancer risk associated with the upper range ofexposures for workers wearing contaminated gloves for one-hour yields a risk estimate of about1×10-7, a factor of only 10 below the level of concern. This relatively high risk reflects the likelytendency of hexachlorobenzene to partition from an aqueous solution into the skin.
3.4.7.2. General Public -- Summaries of the acute exposure assessments and risk characterizationfor the general public are given in the hexachlorobenzene worksheets that accompany this riskassessment and parallel those for the risk characterization for workers discussed in the previous
3-38
section: worksheet E03 summarizes the exposure assessments and worksheets E04a, E04b, andE04c summarize the risk characterizations.
Worksheet E04a presents the hazard quotients for the general public associated with the acuteexposure scenarios. As with the corresponding worksheet for workers, the hazard quotients foracute exposures are based on the acute ATSDR MRL of 0.008 mg/kg/day and the hazardquotients for chronic exposures are based on the U.S. EPA RfD of 0.0008 mg/kg/day. Allexposure scenarios result in hazard quotients that are below unity - i.e., the level of exposure isbelow the RfD. In addition, almost all of the exposure scenarios result in hazard quotients thatare substantially below the corresponding hazard quotient for clopyralid (Table 3-7). This isconsistent with the analysis presented in section 3.3.3.1, indicating that amount ofhexachlorobenzene in clopyralid is toxicologically insignificant. The only exceptions are the acute scenarios based on the consumption of contaminated fish. For these scenarios, the hazardquotients for hexachlorobenzene and clopyralid are comparable because hexachlorobenzene islikely to bioconcentrate in fish while clopyralid will not. In any event, the highest hazard quotientfor hexachlorobenzene is about 0.2, the upper range of the hazard quotient associated with theacute scenario for the consumption of contaminated fish by subsistence populations.
The cancer risk assessment for acute exposure scenarios involving the general public is given inworksheet E04b. As with the corresponding worksheets for workers, the last worksheet for thegeneral public, worksheet 04c, presents the cancer risk relative to a risk level of one inone-million. All scenarios, including the consumption of fish by subsistence populations, arebelow the reference risk level of one in one-million by factors of about 10 [acute scenario for theconsumption of contaminated fish] to several thousand. As with the hazard quotients, the highestcancer risks associated with acute exposures involve the consumption of contaminated fish bysubsistence populations.
As with the acute exposure scenarios, the consumption of contaminated fish leads to the highestrisk estimates for the longer-term scenarios involving the general public,. Based on typical fishconsumption values for members of the general public, the estimated lifetime cancer risks arebelow the reference risk level of one in one-million by factors of over 100 to nearly 150,000. Forsubsistence populations, the upper limit of risk is about a factor of 30 below the level of concern. Given the very conservative nature of the exposure assessment for this scenario, there does notappear to be a substantial cause for concern. This scenario, however, is based on the typicalapplication rate for clopyralid of 0.1 lb a.e./acre. At a ten fold higher application rate - i.e., 1 lbclopyralid a.e./acre, the cancer risk be only about a factor of three below the reference cancer risklevel of one in one-million..
This risk characterization must be interpreted in terms of the underlying assumptions. As detailedin appendix 7, the upper limits for all of the exposure scenarios involving contaminated water andfish are based on relatively conservative estimates of runoff at an annual rainfall rate of 250inches. This rainfall rate is implausible in most areas of the country. In addition, all of themodeling scenarios are based on assumptions that tend to maximize runoff and subsequent watercontamination. In relatively arid areas of the country or in areas with average rainfall rates, water
3-39
contamination would be substantially less. Furthermore, even at relatively high rates of rainfall,runoff may be insignificant under site-specific conditions that do not favor runoff or in cases inwhich the clopyralid is applied at sites far from surface water. This types of situational orsite-specific variability cannot be well-encompassed or well-represented in generic exposureassessments.
As discussed in section 3.3.3.2., no explicit dose response assessment is made for the potentialcarcinogenic effects of pentachlorobenzene, another impurity in clopyralid Based on thecomparison of apparent toxic potencies and the relative amounts of both hexachlorobenzene andpentachlorobenzene in clopyralid, a case could be made for suggesting that presence ofpentachlorobenzene in technical grade clopyralid could increase the cancer risk by 10%. Giventhe extremely low levels of estimated cancer risk, this has essentially no impact on the riskcharacterization.
The simple verbal interpretation of this risk characterization is that, in general, the contaminationof clopyralid with hexachlorobenzene does not appear to pose a risk to the general public. Theprolonged use of clopyralid at the highest plausible application rate, 1 lb a.e./acre, could approacha level of concern in areas with small ponds or lakes used for fishing and in areas with localconditions that favor runoff. In such cases, site-specific exposure assessments and/or monitoringof hexachlorobenzene concentrations in water could be considered.
4-1
4. ECOLOGICAL RISK ASSESSMENT
4.1. HAZARD IDENTIFICATION4.1.1. Overview. The toxicity of clopyralid is relatively well characterized in experimentalmammals but few wildlife species have been assayed relative to the large number of non-targetspecies that might be potentially affected by the use of clopyralid. Within this admittedlysubstantial reservation, clopyralid appears to be relatively non-toxic to terrestrial or aquaticanimals, is highly selective in its toxicity to terrestrial plants, and relatively non-toxic to aquaticplants. Thus, the potential for substantial effects on non-target species appears to be remote.Consistent with this assessment of toxicity to non-target species, one long-term (8-year) fieldstudy has been conducted that indicates no substantial or significant effects on species diversity(Rice et al. 1997).
The toxicity to non-target terrestrial animals is based almost exclusively on toxicity studies usingexperimental mammals - i.e., the same studies used in the human health risk assessment. Someadditional studies are available on birds, bees, and earthworms that generally support thecharacterization of clopyralid as relatively non-toxic. An additional study of the toxicity ofclopyralid to non-target invertebrates also suggests that clopyralid has a low potential for risk(Hassan et al. 1994). A caveat in the interpretation of this study is the limited detail in which theexperimental data are reported. As with terrestrial species, the available data on aquatic species,both plants and animals, suggest that clopyralid is relatively non-toxic.
The toxicity of clopyralid to terrestrial plants has been examined in substantial detail in studiesthat have been published in the open literature as well as studies that have been submitted to theU.S. EPA to support the registration of clopyralid. Clopyralid is a plant growth regulator andacts as a synthetic auxin or hormone, altering the plant’s metabolism and growth characteristics,causing a proliferation of abnormal growth that interferes with the transport of nutrientsthroughout the plant. This, in turn, can result in gross signs of damage and the death of theaffected plant. The phytotoxicity of clopyralid is relatively specific to broadleaf plants becauseclopyralid is rapidly absorbed across leaf surfaces but much less readily absorbed by the roots ofplants. For the same reason, clopyralid is much more toxic/effective in post-emergent treatments(i.e., foliar application) rather than pre-emergent treatment (i.e., application to soil).
Clopyralid does not bind tightly to soil and thus would seem to have a high potential for leaching. While there is little doubt that clopyralid will leach under conditions that favor leaching - i..e.,sandy soil, a sparse microbial population, and high rainfall - the potential for leaching or runoff isfunctionally reduced by the relatively rapid degradation of clopyralid in soil. A number of fieldlysimeter studies and the long-term field study by Rice et al. (1997) indicate that leaching andsubsequent contamination of ground water are likely to be minimal. This conclusion is alsoconsistent with a short-term monitoring study of clopyralid in surface water after aerialapplication (Leitch and Fagg 1985).
4-2
4.1.2. Toxicity to Terrestrial Organisms. 4.1.2.1. Mammals– As summarized in the human health risk assessment (see section 3), there areseveral toxicity studies in experimental mammals, specifically rats, mice, rabbits, and dogs,exposed to clopyralid. The acute toxicity of clopyralid is relatively low: about 3000 mg/kg forclopyralid produced by electrochemical process and >5000 mg/kg for clopyralid produced by thepenta process (LD50's).
Clopyralid is a plant toxin and its mode of action in plants is well understood; however its modeof action for causing toxicity in mammals is not determined and there is no consistent effect or setof effects that can be attributed to clopyralid. While the U.S. EPA (1997a) RfD uses decreasedbody weight in rats as a critical effect - i.e., the adverse effect occurring at the lowest dose level -effects on liver and kidney weight as well as changes in gastric epithelial tissue have been noted atcomparable dose levels.
4.1.2.2. Birds– As summarized in appendix 2, the acute toxicity of clopyralid has been assayedusing Mallard ducks and Bobwhite quail, both standard test species required by the U.S. EPA inthe registration of pesticides. Most of the acute studies involve dietary administration over shortperiods of time - i.e., 5 days. The LD50 data on experimental mammals, however, involve gavageadministration - i.e., placing the compound directly into the stomach by intubation. One gavagestudy in birds (Dow Chemical 1980) is available on the acute toxicity of clopyralid to Mallardducks. As indicated in appendix 2, the LD50 by gavage to this species was 1465 mg/kg bw. Sincethis study was conducted in the early 1980's, clopyralid from the older penta process was probablyused. Thus, this LD50 in birds is most directly comparable to the reported LD50 in rats of >5000mg/kg (Jeffrey et al. 1987b). As summarized in appendix 1, the study in rats by Jeffrey et al. (1987b) noted no mortality and no signs of toxicity after single gavage doses of 5000 mg/kg bwto 9 week old male and female Fischer rats. The lower LD50 of 1465 mg/kg bw in ducks (DowChemical 1980) suggests that clopyralid could be somewhat more toxic to birds than mammals.
This apparent difference, however, is based on the comparison of only two studies. As discussedin Section 3.1.2 with respect to the comparison of the acute toxicity of penta process andelectrochemical process clopyralid to rats, substantial random variation is found in the conduct ofacute toxicity studies on the same material in the same species. Thus, it is possible that thisapparent difference between birds and rats is attributable to chance rather than any underlyingconsistent difference in sensitivity among species or groups of species.
The dietary bioassay studies on birds can also be used to assess the potential contribution of themonoethanolamine moiety to the toxicity of Transline, the formulation used by the Forest Servicethat contains the monoethanolamine salt of clopyralid as the active ingredient. Acute dietarystudies can be used, albeit with substantial limitations, to compare the toxicity of clopyralid to thetoxicity of the monoethanolamine salt of clopyralid in Mallard ducks (Dow Chemical USA 1980;Dow AgroSciences 1998) and Bobwhite quail (Dow Chemical 1980; Dow AgroSciences 1998). The primary problem with all of these studies, however, is that none of the exposures resulted inadequate mortality for the estimation of an LC50 or LD50 (appendix 2). Nonetheless, these studies
4-3
suggest that the dietary LC50 values for both clopyralid and the monoethanolamine salt ofclopyralid are above the range of 2000 ppm to about 6000 ppm.
In addition to the standard acute toxicity studies, Dabbert et al. (1997) have found that directspray of bobwhite quail eggs at up to 0.56 kg a.e./ha caused no gross effects - i.e., viability,hatchability, body weight - and no effects on immune function in chicks.
4.1.2.3. Terrestrial Invertebrates– Several studies (Cole 1974; Dow Chemical 1980;DowChemical 1980; Hinken et al. 1986) have been conducted on the toxicity of clopyralid to bees - atest required by the U.S. EPA in the registration of pesticides - using both oral and direct contactexposures (appendix 3). In both cases, the LD50 to bees was greater than 0.1 mg/bee. Taking anaverage weight of 110 mg/bee from Hinken et al. (1986), the LD50 of 0.1 mg/bee corresponds toan LD50 of greater than 9090 mg/kg bw [0.1 mg/bee ÷ 110 mg/bee = 0.1 mg/bee ÷ 0.11 g/bee =0.1 mg/bee ÷ 0.00011 kg/bee = 909 mg/kg bw]. This order of toxicity is comparable to the LD50
values reported in experimental mammals (appendix 1) and birds (appendix 2).
Based on the results of a static bioassay on earthworms summarized in Dow AgroSciences(1998), the soil LC50 of clopyralid to earthworms is greater than 1000 ppm soil.
In addition to these standard bioassays, Hassan et al. (1994) have provided a summary of anapparently large series of bioassays and field trials on clopyralid as well as a number of otherpesticides using a variety of terrestrial invertebrates. The form of clopyralid used in this studywas Lontrel 100, a formulation of clopyralid that is no longer marketed commercially. While thispublication does not provide detailed dose, exposure, or response data, it does indicate thatclopyralid was classified by the study authors as harmless - a category that is defined by theseinvestigators as exposures which result in less than 30% mortality - to several insect parasites andpredatory mites in contact bioassays. Mortality rates of 25-50% were seen in Semiadalia11-notata (Coccinellidae) and Anthocoris nemoralis (Anthocoridae).
4.1.2.4. Terrestrial Plants (Macrophytes)– Clopyralid is a plant growth regulator and acts as asynthetic auxin or hormone, altering the plant’s metabolism and growth characteristics and oftencausing a proliferation of abnormal growth that interferes with the transport of nutrientsthroughout the plant. This, in turn, can result in gross signs of damage and the death of theaffected plant (Crosswhite et al. 1995). At the biochemical level, clopyralid has been shown toinhibit glutamine synthetase and NADPH reductase in pea and oat chloroplasts (Levchenko et al.1990). In the honey mesquite, clopyralid interferes with normal carbohydrate balance and thedecline and recovery of total nonstructural carbohydrates in stems and roots is similar to that seenafter hand cutting (Cralle and Bovey 1996 ).
Although clopyralid can be absorbed from both the leaves and the roots, foliar absorptionpredominates. In the sunflower and rapeseed, 97% foliar absorption occurs within 24 hours afterfoliar application (Hall and Vanden Born 1988). Thus, clopyralid is preferentially toxic tobroad-leaf weeds and relatively non-toxic to grasses (Bachman et al. 1995; Crosswhite et al.1995). Nonetheless, at sufficiently high soil concentrations, clopyralid can cause significant
4-4
damage by root absorption, particularly in seedlings (Clay et al. 1996). Root absorption appearsto occur by non-facilitated diffusion. The rate of uptake is greater at low pH, suggesting that theundissociated form is more readily absorbed than the anionic form (Devine et al. 1987).
A great deal of information is available on the toxicity of clopyralid to terrestrial plants. A largenumber of studies have been conducted on efficacy to target species, particularly honey mesquite(Bovey and Whisenant 1991; Bovey et al. 1988a,b; Bovey et al. 1990a,b; Bovey et al. 1991,Bovey et al. 1994; Cralle and Bovey 1996; Whisenant and Bovey 1993; Whisenant et al. 1993). Additional efficacy studies have been conducted on Canada thistle (Devine and VandenBorn1985; Devine and Vandenborn 1985), the field pansy Viola arvensis (Grundy et al. 1995), wildbuckwheat (Kloppenburg and Hall 1990a,b,c), hemp dogbane (Orfanedes and Wax 1991;Orfanedes et al. 1993), wild carrot (Stachler and Kells 1997) and spotted knapweed (Rice et al.1997). With the exception of the study by Rice et al. (1997), these studies are not directly usefulfor assessing potential effects on non-target species. Other than to acknowledge the efficacy ofthis compound and suggest the types of vegetation on which clopyralid might be most oftenapplied, these efficacy studies are not detailed further.
A large number of studies are also available on the toxicity of clopyralid to non-target vegetation. The studies that can be used to identify sensitive as well as resistant species are summarized inappendix 4. These studies support the generalization that clopyralid can be highly toxic tobroadleaf plants but is relatively non-toxic to grasses or grains. For example, at application ratesthat approach or exceed the upper range of 1 lb a.e./acre that might be used by the Forest Service,little damage is likely to be apparent in barley or wheat (O’Sullivan and Kossatz 1984a,b). Amore quantitative consideration of the dose-response relationships and species differences insensitivity to clopyralid is given in section 4.3.
While many of the toxicity studies on terrestrial plants are relatively short-term, some longer-termfield studies have been conducted. Rice et al. (1997) conducted an 8 year follow-up study ofplots treated with clopyralid at a rate of 0.28 kg a.e./ha by backpack sprayer for the control ofspotted knapweed (Centaurea maculosa). The formulation of clopyralid used was Stinger which,like Transline, contains the monoethanolamine salt of clopyralid. Four sites were examined, twocharacterized as fescue grassland and two as seral stage forest habitat. All sites were inwest-central Montana and were initially treated in 1989, with two of the sites (one of each type)being re-treated in 1993. Over the 8-year period, clopyralid had no substantial or statisticallysignificant effect on species diversity or species richness. Clopyralid was not detected in soilbelow 25cm. This is consistent with a number of field lysimeter studies that suggest thatclopyralid is not likely to leach deeply into soil layers and thus is not likely to contaminate groundwater. Although clopyralid has an apparently high potential mobility because it does not bindtightly to soil, the functionally low leaching potential is apparently due to rapid microbialmetabolism (Baloch-Haq et al. 1993; Bergstrom et al. 1991; Bovey and Richardson 1991), asdiscussed further in section 4.2.2.4.
4.1.2.5. Terrestrial Microorganisms– Relatively little information is available on the toxicity ofclopyralid to terrestrial microorganisms. At concentrations of 1-10 ppm soil, clopyralid had no
4-5
effect on nitrification, nitrogen fixation or degradation of carbonaceaus material (DowAgroSciences 1998). Applications of Lontrel EC, an emulsifiable concentrate of clopyralid, at 0.3kg a.i./ha had no substantial effect on spore germination in Colletotrichum gloeosporioides, abioherbicide for round-leaved mallow (Grant et al. 1990). Dodd and Jeffries (1989) report thatHarrier, a formulation of clopyralid with mecoprop (2-(4-chloro-2-methylphenoxy)-propanoicacid) and ioxynil (4-hydroxy-3,5-duodobezonitrile) inhibited the growth of a fungi - Glomusgeosporum - that is associated with winter wheat. This effect, however, was probably attributableto mecoprop, not clopyralid, because the same effect was seen with other herbicide mixturescontaining mecoprop. Clopyralid alone, however, was not tested.
4.1.3. Aquatic Organisms. 4.1.3.1. Fish– Standard toxicity bioassays to assess the effects of clopyralid on fish and otheraquatic species are summarized in appendix 5. For fish, only standard 96-hour acute toxicitybioassays are available. The lowest reported LC50 for clopyralid is 103 mg a.e./L in trout (DowChemical 1980). At least for aquatic species, the monoethanolamine salt of clopyralid appears tobe substantially less toxic than technical clopyralid. As indicated in appendix 5, 96-hour LC50
values for the monoethanolamine salt of clopyralid are in the range of 2900 mg a.i./L to 4700 mga.i./L, which is equivalent to 700-1645 mg a.e./L. Since clopyralid has a pKa of about 2 (Table2-1), it is reasonable to speculate that the apparently lower toxicity of the monoethanolamine saltof clopyralid is attributable to buffering of the water pH by the monoethanolamine moiety.
No longer-term toxicity studies are available on the toxicity of clopyralid to fish eggs or fry.
4.1.3.2. Amphibians– Neither the published literature nor the U.S. EPA files include dataregarding the toxicity of clopyralid to amphibian species.
4.1.3.3. Aquatic Invertebrates– The only species of aquatic invertebrate on which toxicity dataare available is Daphnia magna, a test species required by the U.S. EPA for the registration ofpesticides (appendix 5). The lowest reported LC50 for technical clopyralid to Daphnia is 232mg/L (Dow AgroSciences 1998), about a factor of 2 higher than the lowest reported LC50 in fishof 103.5 mg/L (Dow Chemical 1980) Unlike the case with fish, the monoethanolamine saltappears to only marginally reduce the toxicity of clopyralid - i.e., an LC50 of 350 mg a.e./L for thesalt and 232 mg a.e./L for the acid (appendix 5).
A standard chronic reproduction bioassay has been conducted in Daphnia magna using themonoethanolamine salt of clopyralid. The no observed effect concentration was 66 mg a.i./L,which is equivalent to 23.1 mg a.e./L (Dow AgroSciences 1998).
4.1.3.4. Aquatic Plants– Aquatic plants are more sensitive to clopyralid than fish or aquaticinvertebrates. The EC50 for growth inhibition in duckweed, an aquatic macrophyte, is 89 mg/L(Dow AgroSciences 1998). At lower concentrations, however, in the range of 0.01 to 0.1 mg/L,growth of other aquatic macrophytes is stimulated (Forsyth et al. 1997). The lowest report EC50
for growth inhibition of green algae is 6.9 mg/L.
4-6
4.1.3.5. Other Aquatic Microorganisms– There are no published or unpublished data regardingthe toxicity of clopyralid to aquatic bacteria or fungi.
4.2. EXPOSURE ASSESSMENT4.2.1. Terrestrial Animals. Terrestrial animals might be exposed to any appliedherbicide from direct spray, the ingestion of contaminated media (vegetation, prey species, orwater), grooming activities, or indirect contact with contaminated vegetation.
In this exposure assessment, estimates of oral exposure are expressed in the same units as theavailable toxicity data (i.e., oral LD50 and similar values). As in the human health risk assessment,these units are usually expressed as mg of agent per kg of body weight and abbreviated as mg/kgbody weight. For dermal exposure, the units of measure usually are expressed in mg of agent percm of surface area of the organism and abbreviated as mg/cm2. In estimating dose, however, adistinction is made between the exposure dose and the absorbed dose. The exposure dose is theamount of material on the organism (i.e., the product of the residue level in mg/cm2 and theamount of surface area exposed), which can be expressed either as mg/organism or mg/kg bodyweight. The absorbed dose is the proportion of the exposure dose that is actually taken in orabsorbed by the animal.
For the exposure assessments discussed below, general allometric relationships are used to modelexposure. In the biological sciences, allometry is the study of the relationship of body size ormass to various anatomical, physiological, or pharmacological parameters (e.g., Boxenbaum andD'Souza 1990). Allometric relationships take the general form:
y = aWx
where W is the weight of the animal, y is the variable to be estimated, and the model parametersare a and x.
For most allometric relationships used in this exposure assessment, such as the relationship ofbody weight to surface area as well as the consumption of food and water, x ranges fromapproximately 0.65 to 0.75. These relationships dictate that, for a fixed level of exposure (e.g.,levels of a chemical in food or water), small animals will receive a higher dose, in terms of mg/kgbody weight, than large animals will receive.
For many compounds, allometric relationships for interspecies sensitivity to toxicants indicate thatfor exposure levels expressed as mg toxicant per kg body weight (mg/kg body weight), largeanimals, compared with small animals, are more sensitive. For clopyralid, the availableinformation is not adequate to quantify species differences in sensitivity to clopyralid. As with thedose-response relationship, generic estimates of exposure are given for a small mammal. A bodyweight of 20 g is used for a small animal, which approximates the body weight of small mammalssuch as mice, voles, shrews, and bats. All body weight values are taken from U.S. EPA (1989),unless otherwise specified.
4-7
The exposure assessments for terrestrial animals are summarized in Table 4-1. As with the humanhealth exposure assessment, the computational details for each exposure assessment presented inthis section are provided in the attached worksheets (worksheets F01 through F06).
4.2.1.1. Direct Spray – In the broadcast application of any herbicide, wildlife species may besprayed directly. This scenario is similar to the accidental exposure scenarios for the generalpublic discussed in section 3.2.3.2. In a scenario involving exposure to direct spray, the extent ofdermal contact depends on the application rate, the surface area of the organism, and the rate ofabsorption.
For this risk assessment, three groups of direct spray exposure assessments are conducted. Thefirst, which is defined in worksheet F01, involves a 20 g mammal that is sprayed directly over onehalf of the body surface as the chemical is being applied. The range of application rates as well asthe typical application rate is used to define the amount deposited on the organism. The absorbeddose over the first day (i.e., a 24-hour period) is estimated using the assumption of first-orderdermal absorption. In the absence of any data regarding dermal absorption in a small mammal,the estimated absorption rate for humans is used (see section 3.1.7). An empirical relationshipbetween body weight and surface area (Boxenbaum and D’Souza 1990) is used to estimate thesurface area of the animal. The estimates of absorbed doses in this scenario may bracket plausiblelevels of exposure for small mammals based on uncertainties in the dermal absorption rate ofclopyralid.
Other, perhaps more substantial, uncertainties affect the estimates for absorbed dose. Forexample, the estimate based on first-order dermal absorption does not consider fugitive lossesfrom the surface of the animal and may overestimate the absorbed dose. Conversely, someanimals, particularly birds and mammals, groom frequently, and grooming may contribute to thetotal absorbed dose by direct ingestion of the compound residing on fur or feathers. Furthermore,other vertebrates, particularly amphibians, may have skin that is far more permeable than the skinof most mammals (Moore 1964).
Quantitative methods for considering the effects of grooming or increased dermal permeability arenot available. As a conservative upper limit, the second exposure scenario, detailed in worksheetF02, is developed in which complete absorption over day 1 of exposure is assumed.
Because of the relationship of body size to surface area, very small organisms, like bees and otherterrestrial insects, might be exposed to much greater amounts of clopyralid per unit body weight,compared with small mammals. Consequently, a third exposure assessment is developed using a
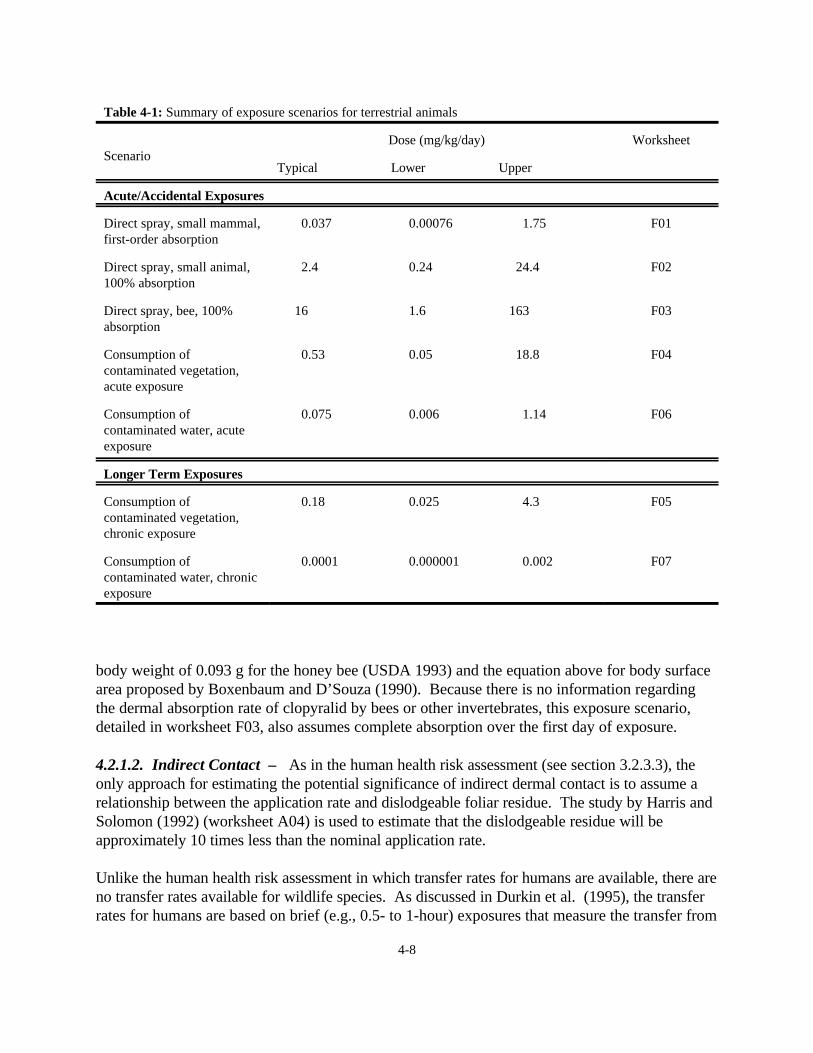
4-8
body weight of 0.093 g for the honey bee (USDA 1993) and the equation above for body surfacearea proposed by Boxenbaum and D’Souza (1990). Because there is no information regardingthe dermal absorption rate of clopyralid by bees or other invertebrates, this exposure scenario,detailed in worksheet F03, also assumes complete absorption over the first day of exposure.
4.2.1.2. Indirect Contact – As in the human health risk assessment (see section 3.2.3.3), theonly approach for estimating the potential significance of indirect dermal contact is to assume arelationship between the application rate and dislodgeable foliar residue. The study by Harris andSolomon (1992) (worksheet A04) is used to estimate that the dislodgeable residue will beapproximately 10 times less than the nominal application rate.
Unlike the human health risk assessment in which transfer rates for humans are available, there areno transfer rates available for wildlife species. As discussed in Durkin et al. (1995), the transferrates for humans are based on brief (e.g., 0.5- to 1-hour) exposures that measure the transfer from
Table 4-1: Summary of exposure scenarios for terrestrial animals
ScenarioDose (mg/kg/day) Worksheet
Typical Lower Upper
Acute/Accidental Exposures
Direct spray, small mammal,first-order absorption
0.037 0.00076 1.75 F01
Direct spray, small animal,100% absorption
2.4 0.24 24.4 F02
Direct spray, bee, 100%absorption
16 1.6 163 F03
Consumption ofcontaminated vegetation,acute exposure
0.53 0.05 18.8 F04
Consumption ofcontaminated water, acuteexposure
0.075 0.006 1.14 F06
Longer Term Exposures
Consumption ofcontaminated vegetation,chronic exposure
0.18 0.025 4.3 F05
Consumption ofcontaminated water, chronicexposure
0.0001 0.000001 0.002 F07
4-9
contaminated soil to uncontaminated skin. Wildlife, compared with humans, are likely to spendlonger periods of time in contact with contaminated vegetation.
It is reasonable to assume that for prolonged exposures an equilibrium may be reached betweenlevels on the skin, rates of absorption, and levels on contaminated vegetation, although there areno data regarding the kinetics of such a process. The bioconcentration data on clopyralid (section3.2.3.5) suggest that clopyralid is not likely to partition from the surface of contaminatedvegetation to the surface of skin, feathers, or fur. Thus, a plausible partition coefficient is unity(i.e., the concentration of the chemical on the surface of the animal will be equal to thedislodgeable residue on the vegetation).
Under these assumptions, the absorbed dose resulting from contact with contaminated vegetationwill be one-tenth that associated with comparable direct spray scenarios. As discussed in the riskcharacterization for ecological effects (section 4.4), the direct spray scenarios result in exposurelevels far below those of toxicological concern. Consequently, details of the indirect exposurescenarios for contaminated vegetation are not further elaborated in this document.
4.2.1.3. Ingestion of Contaminated Vegetation or Prey – For this component of theexposure assessment, the estimated amounts of residue on food are based on the relationshipbetween application rate and residue rates on leaves and leafy vegetables. For the lower andcentral estimates of absorbed dose, the ‘typical’ value given in worksheet A05a is used becauseHoerger and Kenaga (1972) do not provide estimates of the lower range of expected residues.
Allometric relationships and species specific data (U.S. EPA 1989) suggest that the amount offood consumed per day by a small mammal (i.e., an animal weighing approximately 20 g) is equalto about 15% of the mammal's total body weight. All of the estimates of ingested dose are basedon the assumption that 100% of the diet is contaminated. Under the assumption that only 10% ofthe diet is contaminated, the dose estimates decrease by a factor of 10. Details regarding thecalculations for these acute exposure scenarios are given in worksheet F04.
As discussed in section 4.4, the exposure estimates discussed above are of minimal concern foracute exposure. For estimating the effects of longer-term exposures, time-weighted averageconcentrations are used, which is similar to the approach taken in the human health riskassessment and using the same estimates of halftime of fruit (McMurray et al. 1996 detailed inworksheet B03) as were used in the corresponding human health risk assessment. Also, thelonger-term exposure scenario is based on a 90-day post-spray period and uses the geometricmean over this period as the central estimate of the exposed dose, as in the human health riskassessment. Like the acute exposure scenario, this exposure scenario assumes that 100% of thediet is contaminated. Details regarding the calculations for these chronic exposure scenarios aregiven in worksheet F05.
4.2.1.4. Ingestion of Contaminated Water -- Estimated concentrations of clopyralid in waterare identical to those used in the human health risk assessment (worksheet B07). The only majordifferences involve the weight of the animal and the amount of water consumed. There are
4-10
v 'D 2@g18n
orv ' 2.87@105@D 2
well-established relationships between body weight and water consumption across a wide range ofmammalian species [e.g., U.S. EPA (1989)]. Mice, weighing about 0.02 kg, consumeapproximately 0.005 L of water/day (i.e., 0.25 L/kg body weight/day). These values are used inthe exposure assessment for the small (20g) mammal. Unlike the human health risk assessment,estimates of the variability of water consumption are not available. Thus, for the acute scenario,the only factors affecting the variability of the ingested dose estimates include the field dilutionrates (i.e., the concentration of the chemical in the solution that is spilled) and the amount of solution that is spilled. As in the acute exposure scenario for the human health risk assessment,the amount of the spilled solution is taken as 200 gallons. In the chronic exposure scenario, thefactors that affect the variability are the water contamination rate, (see section 3.2.3.4.2) and theapplication rate. Details regarding these calculations are summarized in worksheet F06 (acuteexposure) and worksheet F07 (chronic exposure).
4.2.2. Terrestrial Plants. In general, the primary hazard to non-target terrestrialplants associated with the application of most herbicides is unintended direct deposition or spraydrift, particularly in aerial applications (e.g., Bird 1995).
4.2.2.1. Direct Spray – Unintended direct spray will result in an exposure level equivalent to theapplication rate. Many broadleaf plants that are sprayed directly with clopyralid at and, in somecases substantially below, the recommended application rate will be damaged (section 4.3.2.4).
4.2.2.2. Off-Site Drift – Data regarding the drift of clopyralid during ground or aerialapplications were not found in the literature. Because off-site drift is more or less a physicalprocess that depends on droplet size and meteorological conditions rather than the specificproperties of the herbicide, estimates of off-site drift can be made based on data for othercompounds. The potential for spray drift was investigated in numerous field studies reviewedrecently by Bird (1995), as summarized in worksheet A06. The monitoring studies involvedlow-flight agricultural applications of pesticides and employed various types of nozzles under awide range of meteorological conditions. The central estimates of off-site drift for single swathapplications, expressed as a proportion of the nominal application rate, were approximately 0.03at 100 feet, 0.002 at 500 feet, 0.0006 at 1000 feet, and 0.0002 at 2500 feet (Bird 1995, Figure 2,p. 204). Although multiple swath applications lead to higher rates of off-site deposition, they areless suitable for estimating drift from ground spray applications of clopyralid.
Another approach to estimating drift involves the use of Stoke’s law, which describes the viscousdrag on a moving sphere. According to Stoke’s law:
4-11
where v is the velocity of fall (cm sec-1), D is the diameter of the sphere (cm), g is the force ofgravity (980 cm sec-2), and n is the viscosity of air (1.9 @ 10-4 g sec-1 cm-1 at 20EC) (Goldstein et al.1974).
In typical backpack ground sprays, droplet sizes are greater than 100 µ, and the distance from thespray nozzle to the ground is 3 feet or less. In mechanical sprays, raindrop nozzles might be used. These nozzles generate droplets that are usually greater than 400 µ, and the maximum distanceabove the ground is about 6 feet. In both cases, the sprays are directed downward.
Thus, the amount of time required for a 100 µ droplet to fall 3 feet (91.4 cm) is approximately 3.2seconds,
91.4 ÷ (2.87 @ 105(0.01)2).
The comparable time for a 400 µ droplet to fall 6 feet (182.8 cm) is approximately 0.4 seconds,
182.8 ÷ (2.87 @ 105(0.04)2).
For most applications, the wind velocity will be no more than 5 miles/hour, which is equivalent toapproximately 7.5 feet/second (1 mile/hour = 1.467 feet/second). Assuming a wind directionperpendicular to the line of application, 100 µ particles falling from 3 feet above the surface coulddrift as far as 23 feet (3 seconds @ 7.5 feet/second). A raindrop or 400 µ particle applied at 6 feetabove the surface could drift about 3 feet (0.4 seconds @ 7.5 feet/second).
For backpack applications, wind speeds of up to 15 miles/hour are allowed in Forest Serviceprograms. At this wind speed, a 100 µ droplet can drift as far as 68 feet (3 seconds @ 15 @ 1.5feet/second). Smaller droplets will of course drift further, and the proportion of these particles inthe spray as well as the wind speed will affect the proportion of the applied herbicide that driftsoff-site.
4.2.2.4. Soil Contamination by Runoff – Other mechanisms of transport for herbicides involvemovement in the soil either by runoff or percolation. Clopyralid should have a substantialtendency to leach or percolate through soil because clopyralid is not tightly bound to most typesof soil. Conversely, because clopyralid is not readily bound to soil, the potential for clopyralidrunoff from the washing of soil particles containing bound clopyralid is relatively low (Woodburnand French. 1987).
Another factor that will reduce the possibility of either leaching or runoff is relatively rapiddegradation of clopyralid in soil. Baloch and Grant (1991a) studied the fate of 2,6-14C-pyridinelabeled clopyralid under laboratory conditions at a soil concentration of 0.3 mg/kg. Thisconcentration is referred to as the field rate. Five types of agricultural soils were used: sand, sandyloam, silt loam, sandy clay loam, and organic sandy loam. In addition, degradation was assayed at2 different temperatures (10EC and 20EC) and three soil moisture levels: 10%, 40%, and 60% ofmoisture holding capacity. Other than C02 and clopyralid, no soil metabolites were identified.
4-12
The results of this study are summarized in Table 4-2. In addition to these data, Baloch and Grant(1991a) also assayed the mineralization of clopyralid at different initial soil concentrations, 1mg/kg and 0.05 mg/kg, as well as the field concentration of 0.3 mg/kg. There was a clear trendfor increasing rates of mineralization as the initial soil concentration decreased. It is unclear if thisrelationship is attributable to changes in microbial acclimation or toxicity at higher initial soilconcentrations of clopyralid. As detailed in Baloch and Grant (1991b), the rates of disappearanceof clopyralid from soil correspond generally to the microbial biomass of the soil (r2.0.5 to 0.7). This pattern is similar to the less detailed studies by Smith and Aubin (1989) that reported halftimes of 10 to 47 days depending on temperature and soil composition. These results are alsosimilar to those in the study by Pik et al. (1977 ), in which clopyralid was applied at 0.95 or 1.9kg/ha in three different soil types: Loam, sandy loam, and luvisol. Fastest degradation (t1/2 of 2months) occurred in moist soil with high organic carbon content and the extent of leaching wasinversely related to organic carbon content.
The most relevant study for quantitatively assessing runoff and leaching potential appears to bethe publication by Elliott et al. (1998). This study was designed as a worst case scenario forclopyralid mobility. A clopyralid formulation, Lontrel, was applied using ground equipment at arate of 0.2 kg a.i./ha to a 4.6 ha field. In addition to natural rainfall, irrigation was started on day3 and totaled 300 mm (about 0.1 inch) of water in a 21 day period. The maximum concentrationin soil water was monitored at 187.3 µg/L and the maximum concentration in drainage water wasmonitored at 6.4 µg/L on day 26. In the period between day 9 and 35, only 1.5% of the appliedamount was washed off. Again, these results are consistent with field lysimeter studies thatsuggest that the rapid degradation of clopyralid in soil is the predominant factor in the functionallylow rate of both leaching and runoff. (Baloch-Haq et al. 1993; Bergstrom et al. 1991).
4.2.3. Aquatic Organisms. For aquatic organisms, the estimated amount of clopyralid inambient water and in water bodies associated with an accidental spill (see section 3.2.3.4) may beused as a very conservative estimate of exposure. As summarized in worksheet B07, theestimated rate of contamination of ambient water is 0.0021 (0.00053 to 0.0089) mg a.e./L at anapplication rate of 1 lb a.e./acre. This is the highest application rate considered in this riskassessment. As detailed in the dose-response assessment (section 4.3.3.1.), these concentrationsare far below those that might be associated with any chronic adverse effects in aquatic species.
For acute exposure scenarios (worksheet D06), the highest estimated concentration of clopyralidin water is 4.54 mg a.e./L. This is about a factor of 50 below the lowest reported LC50 for anyaquatic animal (232 mg a.e./L for Daphnia magna) and about a factor of two below the lowestreported EC50 in any aquatic plant (6.9 mg/L for Selenastrum capricornutum).
Given the relatively low level of toxicity of clopyralid to aquatic species, further elaboration of theexposure assessment for these species is unnecessary. For the characterization of risk, anexposure level of 0.0089 mg a.e./L (the upper limit from worksheet B07) is used to characterizethe risks associated with chronic exposure scenarios and 4.54 mg a.e./L (the upper limit fromworksheet D06) is used to characterize the risks associated with acute exposure scenarios.
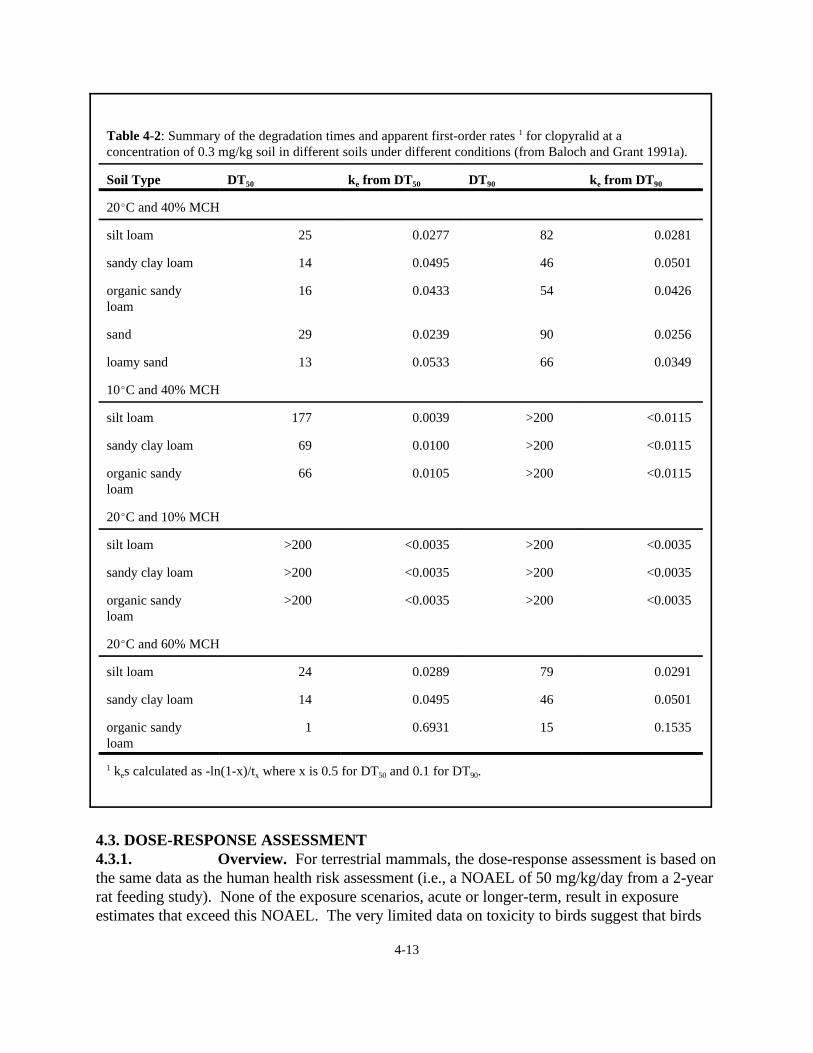
4-13
4.3. DOSE-RESPONSE ASSESSMENT4.3.1. Overview. For terrestrial mammals, the dose-response assessment is based onthe same data as the human health risk assessment (i.e., a NOAEL of 50 mg/kg/day from a 2-yearrat feeding study). None of the exposure scenarios, acute or longer-term, result in exposureestimates that exceed this NOAEL. The very limited data on toxicity to birds suggest that birds
Table 4-2: Summary of the degradation times and apparent first-order rates 1 for clopyralid at aconcentration of 0.3 mg/kg soil in different soils under different conditions (from Baloch and Grant 1991a).
Soil Type DT50 ke from DT50 DT90 ke from DT90
20EC and 40% MCH
silt loam 25 0.0277 82 0.0281
sandy clay loam 14 0.0495 46 0.0501
organic sandyloam
16 0.0433 54 0.0426
sand 29 0.0239 90 0.0256
loamy sand 13 0.0533 66 0.0349
10EC and 40% MCH
silt loam 177 0.0039 >200 <0.0115
sandy clay loam 69 0.0100 >200 <0.0115
organic sandyloam
66 0.0105 >200 <0.0115
20EC and 10% MCH
silt loam >200 <0.0035 >200 <0.0035
sandy clay loam >200 <0.0035 >200 <0.0035
organic sandyloam
>200 <0.0035 >200 <0.0035
20EC and 60% MCH
silt loam 24 0.0289 79 0.0291
sandy clay loam 14 0.0495 46 0.0501
organic sandyloam
1 0.6931 15 0.1535
1 kes calculated as -ln(1-x)/tx where x is 0.5 for DT50 and 0.1 for DT90.
4-14
may be somewhat more sensitive than mammals. The data on birds, however, are not as extensiveor of the same detail as the data on experimental mammals. The available data on terrestrialinvertebrate are also less complete than the data on mammals. Nonetheless, there is no indicationthat clopyralid is highly toxic to birds or terrestrial invertebrates.
The toxicity of clopyralid to terrestrial plants can be characterized relatively well and with littleambiguity. Clopyralid is more toxic to broadleaf plants than grains or grasses and is more toxic inpost-emergence applications - i.e., foliar spray - than pre-emergence applications - i.e., soiltreatment. Many non-target species - especially grains, grasses, and several types of trees - arenot likely to be affected by clopyralid even if the plants are sprayed at application rates of 0.1 lba.e./acre or greater. When applications are made prior to emergence - i.e., directly to the soilbefore the germination of the plant seeds - NOAELs for sensitive species such as soybeans, snapbeans, tomatoes, and sunflowers are in the range of 0.028 to 0.056 kg/ha. When applied directlyto the foliage - i.e., post-emergence - the NOAELs are about 0.00056 kg/ha. This difference isattributable to the very rapid absorption of clopyralid after direct foliar application.
Based on the results of acute bioassays, fish and aquatic invertebrates are equally sensitive toclopyralid. While there are no chronic studies available in fish, a chronic reproductive NOAEL ofabout 20 mg/L has been determined in Daphnia magna, a common aquatic invertebrate testspecies. Given the low levels of plausible exposure to clopyralid in water, this NOAEL can beused to characterize risk to both fish and aquatic invertebrates. Aquatic plants are somewhatmore sensitive than aquatic animals to clopyralid. The lowest reported LC50 for aquatic algae is6.9 mg/L, about a factor of 3 below the chronic NOAEL in Daphnia.
4.3.2. Toxicity to Terrestrial Organisms.4.3.2.1. Mammals– As summarized in the dose-response assessment for the human health riskassessment (section 3.3.3), the Office of Pesticide Programs of the U.S. EPA has derived an RfDof 0.5 mg/kg/day for clopyralid based on a two-year rat feeding study in which the NOAEL was50 mg/kg/day. All of the estimated mammalian exposures (Table 4-1) are below the NOEL of 50mg/kg/day and all of the central estimates of mammalian exposures are below the NOEL of 50mg/kg/day by a factor of over 40. Consequently, the dose of 50 mg/kg/day is used directly andwithout elaboration to assess the consequences of all exposures, acute and chronic.
4.3.2.2. Birds – As noted in section 4.1.2.2, one acute gavage LD50 values in Mallard ducks isabout a factor of 3 below a gavage dose in rats that resulted in no apparent signs of toxicity. Thissuggests that birds may be somewhat more sensitive to clopyralid than mammals but the datasupporting this suggestion are extremely limited. Given the normal variability in animal bioassays,the differences between feral and laboratory populations of animals, and the large number ofspecies that might be exposed to clopyralid, this relatively modest difference in the results of theacute oral bioassays adds relatively little to the inherent uncertainties of using the available data tocharacterize the risks that could be associated with the use of clopyralid to birds or any otherspecies. Consequently, a separate criteria for bird is not developed in this risk assessment - i.e.,the chronic of NOAEL of 50 mg/kg/day is used. Again, given the very large differences betweenthis NOAEL and any of the exposure assessments, birds would have to be much more sensitive to
4-15
clopyralid than mammals to alter the characterization of risk. Based on the admittedly limitedexperimental data, such large differences in toxicity are not apparent.
4.3.2.3. Terrestrial Invertebrates– As discussed in section 4.1.2.3, several studies indicate thatthe toxicity of clopyralid to bees is on the same order of magnitude and perhaps somewhat lessthan the toxicity of clopyralid to mammals - i.e., acute oral or contact LD50 values >9000 mg/kgbw. Based on a single study, the acute toxicity of clopyralid to earthworms also appears to below - i.e., soil LC50 >1000 ppm soil. While these data can be used to assess acute hazard, noquantitative consideration can be given to other potential subchronic or non-lethal effects.
The report by Hassan et al. (1994) on both laboratory bioassays and field trials with clopyraliddoes not suggest that clopyralid is likely to be remarkably hazardous to terrestrial invertebrates. However, this publication provides only a very brief summary of what appears to be a large andcomplex study on many invertebrates species. Consequently, it cannot be used quantitatively todevelop species specific dose/response relationships.
4.3.2.4. Terrestrial Plants (Macrophytes)-- As discussed in section 4.1.2.4, clopyralid isrelatively ineffective against grasses and grains but can be highly toxic to broadleaf plants, bothtarget and non-target. A summary of the dose-severity relationships for terrestrial plants is givenin Table 4-3. This table is based on the data presented in appendix 4. The first column of thistable gives the range of application rates. The next four columns represent four severitycategories: no effect, slight effect, moderate effect, and severe effect as defined in the key toTable 4-3. The definitions of these levels of severity are intended to broadly encompass thevarious types of observations specified in appendix 4.
Listings of the same plant group in multiple columns indicates species differences within thegroup. For example, at application rates of 0.2 to 0.5 lb a.i./acre, the responses of differentspecies of cacti are highly variable. Some species of cacti will evidence no effects, some willsuffer high levels of mortality, and other species will show intermediate responses (Crosswhite etal. 1995). Thus, in Table 4-3 cactus species are listed in each of the four severity columns in therow associated with application rates of >0.2 - 0.5 lb/acre. Table 4-3 does not attempt to capturetemporal relationships. For example, at an application rate of 0.28 kg a.i./ha, red maple evidencedsignificant visual injury at 60 to 150 days after treatment but these effects were transient and overthe longer term there was no effect on growth (Smith and Skroch 1995). In Table 4-3, red mapleis simply put into the severe response category for the appropriate range of application rates.
Several studies are available on a variety of different plant species in which clopyralid was appliedat rates that are in the range of the typical (0.1 lb a.e./acre) to the highest application rate (1.0 lba.e./acre). While these studies generally support the specificity of clopyralid to broadleaf plants,the likelihood of observing damage will vary within groups of plants depending on the species.For example, damage to grasses or grass-like grains at or near the upper range of the applicationrate may be minimal in some species of grains such as Glenlea wheat but apparent in other speciessuch as Meepawa wheat (O’Sullivan and Kossatz 1984a,b). Simiarly, near the typical application
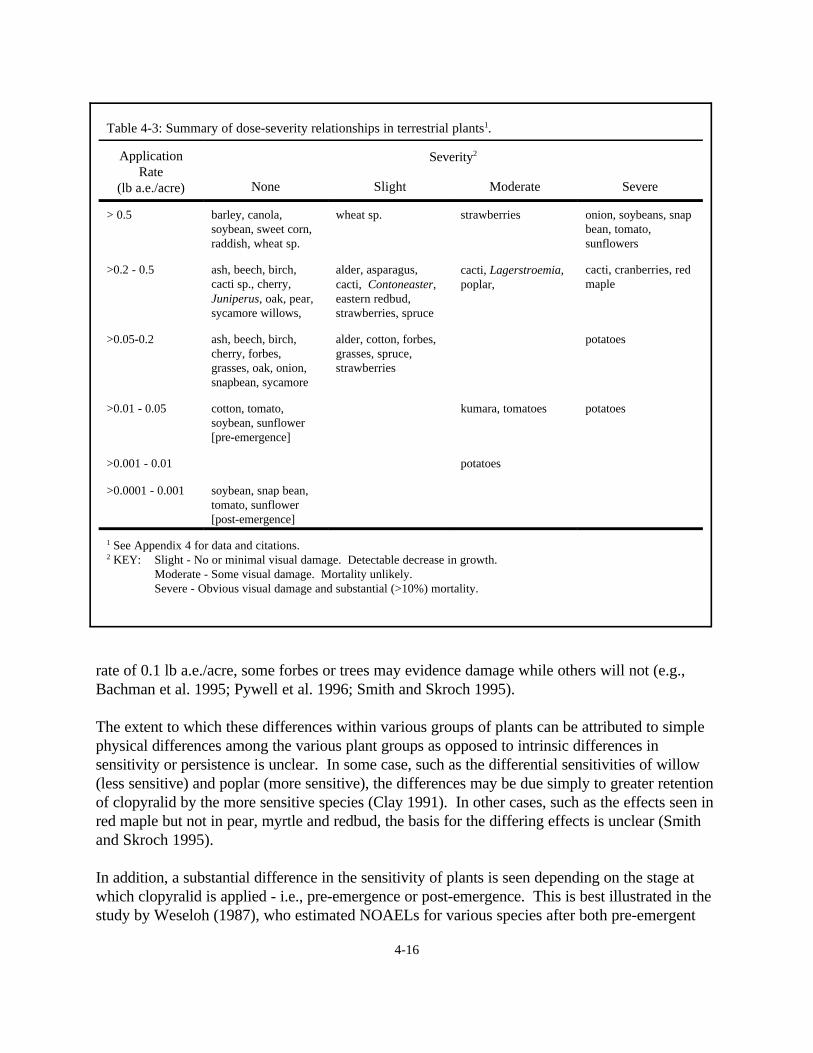
4-16
rate of 0.1 lb a.e./acre, some forbes or trees may evidence damage while others will not (e.g.,Bachman et al. 1995; Pywell et al. 1996; Smith and Skroch 1995).
The extent to which these differences within various groups of plants can be attributed to simplephysical differences among the various plant groups as opposed to intrinsic differences insensitivity or persistence is unclear. In some case, such as the differential sensitivities of willow(less sensitive) and poplar (more sensitive), the differences may be due simply to greater retentionof clopyralid by the more sensitive species (Clay 1991). In other cases, such as the effects seen inred maple but not in pear, myrtle and redbud, the basis for the differing effects is unclear (Smithand Skroch 1995).
In addition, a substantial difference in the sensitivity of plants is seen depending on the stage atwhich clopyralid is applied - i.e., pre-emergence or post-emergence. This is best illustrated in thestudy by Weseloh (1987), who estimated NOAELs for various species after both pre-emergent
Table 4-3: Summary of dose-severity relationships in terrestrial plants1.
ApplicationRate
(lb a.e./acre)
Severity2
None Slight Moderate Severe
> 0.5 barley, canola,soybean, sweet corn,raddish, wheat sp.
wheat sp. strawberries onion, soybeans, snapbean, tomato,sunflowers
>0.2 - 0.5 ash, beech, birch,cacti sp., cherry,Juniperus, oak, pear,sycamore willows,
alder, asparagus,cacti, Contoneaster,eastern redbud,strawberries, spruce
cacti, Lagerstroemia,poplar,
cacti, cranberries, redmaple
>0.05-0.2 ash, beech, birch,cherry, forbes,grasses, oak, onion,snapbean, sycamore
alder, cotton, forbes,grasses, spruce,strawberries
potatoes
>0.01 - 0.05 cotton, tomato,soybean, sunflower[pre-emergence]
kumara, tomatoes potatoes
>0.001 - 0.01 potatoes
>0.0001 - 0.001 soybean, snap bean,tomato, sunflower[post-emergence]
1 See Appendix 4 for data and citations.2 KEY: Slight - No or minimal visual damage. Detectable decrease in growth.
Moderate - Some visual damage. Mortality unlikely.Severe - Obvious visual damage and substantial (>10%) mortality.
4-17
and post-emergent applications. When applications were made prior to emergence - i.e., directlyto the soil before the germination of the plant seeds - NOAELs for sensitive species such assoybeans, snap beans, tomatoes, and sunflowers was in the range of 0.028 to 0.056 kg/ha. Whenapplied directly to the foliage - i.e., post-emergence - the NOAELs were much lower, in the rangeof 0.00056 kg/ha. As discussed in section 4.1.2.4, this difference is attributable to the very rapidabsorption of clopyralid after direct foliar application.
Because of the substantial differences in sensitivity among different groups of plants as well as the differences that are apparent within groups of plants, such as the cacti, general dose-response ordose-severity modeling combining all of the available data is not appropriate. Nonetheless, thedata summarized in Table 4-3 and detailed in appendix 4 cover the range of application that mightbe used by the Forest Service as well as much lower rates of application. These data are useddirectly in characterizing risks to non-target terrestrial plants (section 4.4).
4.3.2.5. Terrestrial Microorganisms– The available data on clopyralid are not sufficient for anyquantitative dose-response modeling for terrestrial microorganisms other than the apparentNOAEL of 1-10 mg/kg soil reported by Dow AgroSciences (1998).
4.3.3. Aquatic Organisms.4.3.3.1. Animals– As indicated in sections 4.1.3.1 through 4.1.3.3, fish and aquatic invertebratesappear to be equally sensitive to clopyralid. Although no chronic data are available on fish, thereis one chronic invertebrate study in Daphnia magna in which the NOAEL is 23.1 mg a.e./L. Thus, for this risk assessment, 23.1 mg a.e./L will be used as the benchmark concentration forboth fish and aquatic invertebrates - i.e., at this concentration, no adverse effects are anticipatedeven over prolonged periods of time.
For acute exposures, higher estimates of acutely toxic or non-toxic doses could be made. However, as discussed in section 4.2.3, the highest anticipated concentration of clopyralid inwater even after an accidental spill is 4.54 mg a.e./L. Since this is below the chronic NOAEL, noadditional elaboration of the dose-response relationship for aquatic animals seems justified.
4.3.3.2. Aquatic Plants– The relevant data on the toxicity of clopyralid to aquatic plants issummarized in appendix 5. The most sensitive aquatic plant species appears to be Selenastrumcapricornutum, with a 96-hour EC50 of 6.9 mg a.e./L base on a reduction in cell count relative tocontrols (Dill and Milazzo 1985). EC50 values for other freshwater algal species are generallygreater than 50 mg/L (Dow AgroSciences 1998). The more recent study by Forsyth et al. (1997), which reports NOAELs at 0.1 mg/L for two aquatic macrophytes, adds relatively little tothe dose-response assessment because, based on the other earlier studies, no effects would beanticipated at clopyralid concentrations of 0.1 mg/L.
4.3.3.3. Aquatic Microorganisms– There is no information that would permit a quantitativedose-response assessment for aquatic microorganisms.
4-18
4.4. RISK CHARACTERIZATION4.4.1. Overview. Clopyralid is a herbicide and the most likely damage to non-targetspecies will involve terrestrial plants. As is the case with any herbicide, the likelihood of damageto non-target plant species is related directly to the difference between the sensitivity of targetspecies—which dictates the application rate—and the sensitivity of the potential non-targetspecies. In this respect, the apparent selectively of clopyralid substantially narrows the number ofnon-target plants that might be affected. With clopyralid, some sensitive post-emergent plantscould be adversely effected by off-site drift over a relatively narrow band. Most species of trees,grains, or grasses, however, are not likely to be affected by off-site drift or even direct spray. This risk characterization is conservative in that the off-site drift estimates are derived fromstudies involving aerial application. Well-directed ground applications conducted underconditions that do not favor off-site drift will probably have no substantial or detectable impact onoff-site plant species outside of a very narrow range - i.e., less than and perhaps much less than 25feet.
Soil contamination by runoff, which could potentially harm off-site plant species, does not appearto be a major concern with clopyralid. Rains are most likely to cause clopyralid to leach into thesoil column rather than wash-off. The best available estimate of runoff is on the order of 0.015(1½%) of the applied amount. Because clopyralid is less effectively absorbed from roots thanfrom leaf surfaces, the consequences of runoff are likely to be less severe than those of drift. Inaddition, once in the soil column, clopyralid will be rapidly degraded except in arid soils with lowmicrobial populations. Thus, while damage to off-site plants from runoff cannot be ruled-outunder conditions that would be highly favorable to runoff, this is not likely to be a major problemwith clopyralid.
The potential for adverse effects on other non-target species appears to be remote. The weight ofevidence suggests that no adverse effects in terrestrial or aquatic animals are plausible usingtypical or even very conservative worst case exposure assumptions. Some inhibition of growth inaquatic plants would be possible in cases involving accidental spills. Such effects, however,would be transient.
As with the human health risk assessment, this characterization of risk must be qualified by thegeneral reservation for any risk assessment: Absolute safety cannot be proven and the absenceof risk can never be demonstrated. Clopyralid has been tested in only a limited number of speciesand under conditions that may not well-represent populations of free-ranging non-target animalsor some populations of non-target plants. Notwithstanding this limitation, the available data donot indicate that adverse effects are likely in terrestrial or aquatic animals from the use of thiscompound in Forest Service programs. Under normal and proper conditions of application,effects on non-target vegetation would likely be confined to sensitive plant species in or very nearto the treatment area.
4-19
4.4.2. Terrestrial Organisms. 4.4.2.1. Terrestrial Animals– The quantitative risk characterization for terrestrial animals issummarized in Table 4-4. Except for the direct spray scenario for the bee, all of the quantitativerisk characterizations apply to a 20 g mammal. In Table 4-4, the hazard quotient for eachscenario, except that for the honey bee, is calculated as the exposure estimate presented in Table4-1 divided by the chronic NOAEL for rats of 50 mg/kg/day, discussed in section 4.3.2.1. Insome respects, this approach may be regarded as extremely conservative, particularly in theapplication of the chronic NOAEL to acute exposure scenarios. For the honey bee, the hazardquotient is based on the non-lethal acute dose level of 1000 mg/kg from the study by Hinken et al. (1986).
As specified in Table 4-4, both the central estimates as well as the upper range of the hazardquotients associated with the longer-term exposure scenarios are below unity, indicating that toxiceffects are not likely to occur.
For acute exposures of small mammals, none of the central values for the hazard quotientapproach a level of concern. With regard to the upper limit of the estimated hazard quotients, the direct spray with 100% absorption and the consumption of contaminated vegetation, both ofwhich are acute exposure scenarios, approach a level of concern based on the chronic NOAEL. As indicated in Table 4-1, these hazard quotients are associated with dose levels of about 20mg/kg. This dose is a factor of 25 below the single gavage dose of 500 mg/kg that caused noovert signs of toxicity in rats (Gilbert and Crissman 1995) and a factor of over 100 below thelowest reported LD50 of 2675 mg/kg (Dow AgroSciences 1998).
The simple verbal interpretation of this quantitative risk characterization is similar to that of thehuman health risk assessment: the weight of evidence suggests that no adverse effects in mammalsare plausible using typical or even very conservative worst case exposure assumptions. As withthe human health risk assessment, this characterization of risk must be qualified. Clopyralid hasbeen tested in only a limited number of species and under conditions that may not well-represent populations of free-ranging non-target animals. Notwithstanding this limitation, the available dataare sufficient to assert that no adverse effects are anticipated in terrestrial animals from the use ofthis compound in Forest Service programs.
4.4.2.2. Terrestrial Plants– Clopyralid is an effective herbicide, at least for a number of differentbroadleaf weeds and adverse effects on some non-target plant species are plausible under certainapplication conditions and circumstances. As discussed in section 4.2.2, three kinds of exposureare considered in the assessment for non-target plants species: direct spray, drift, and watererosion.
As is the case with any herbicide, the likelihood of damage to non-target plant species is relateddirectly to the difference between the sensitivity of target species—which dictates the applicationrate—and the sensitivity of the potential non-target species. In this respect, the apparentselectivity of clopyralid substantially narrows the number of non-target plants that might beaffected. As summarized in Table 4-3, a number of different plant species - particularly grains,
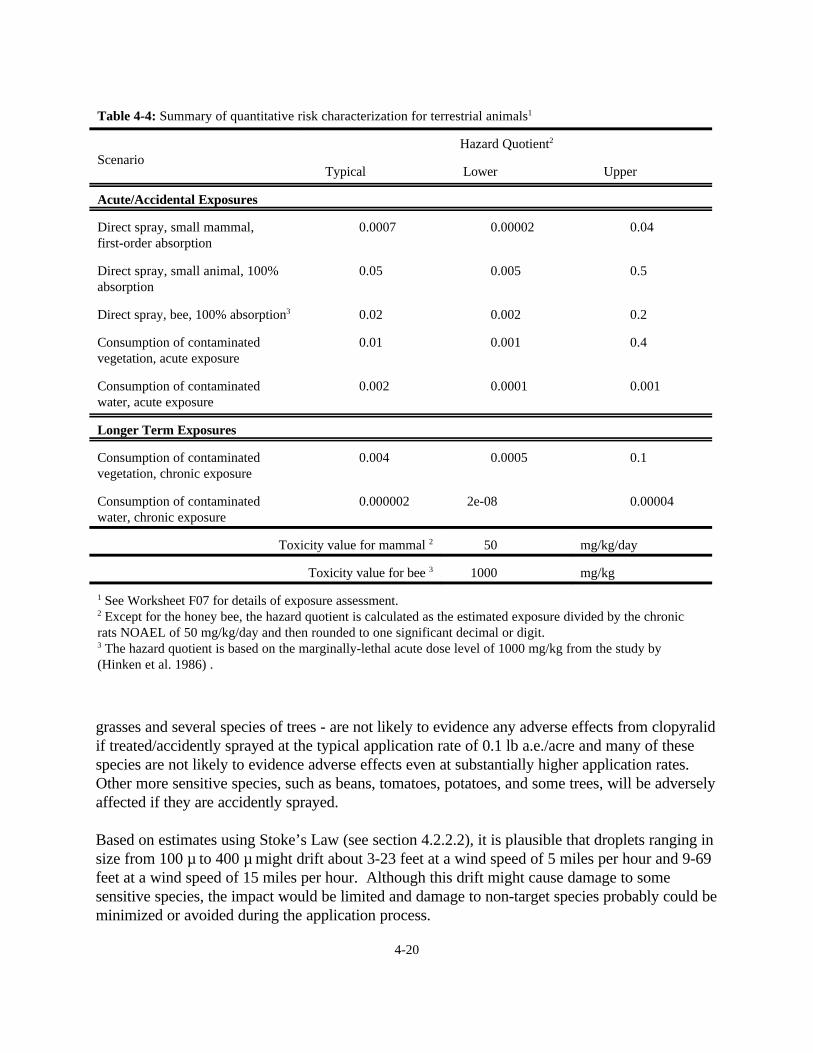
4-20
grasses and several species of trees - are not likely to evidence any adverse effects from clopyralidif treated/accidently sprayed at the typical application rate of 0.1 lb a.e./acre and many of thesespecies are not likely to evidence adverse effects even at substantially higher application rates. Other more sensitive species, such as beans, tomatoes, potatoes, and some trees, will be adverselyaffected if they are accidently sprayed.
Based on estimates using Stoke’s Law (see section 4.2.2.2), it is plausible that droplets ranging insize from 100 µ to 400 µ might drift about 3-23 feet at a wind speed of 5 miles per hour and 9-69feet at a wind speed of 15 miles per hour. Although this drift might cause damage to somesensitive species, the impact would be limited and damage to non-target species probably could beminimized or avoided during the application process.
Table 4-4: Summary of quantitative risk characterization for terrestrial animals1
ScenarioHazard Quotient2
Typical Lower Upper
Acute/Accidental Exposures
Direct spray, small mammal,first-order absorption
0.0007 0.00002 0.04
Direct spray, small animal, 100%absorption
0.05 0.005 0.5
Direct spray, bee, 100% absorption3 0.02 0.002 0.2
Consumption of contaminatedvegetation, acute exposure
0.01 0.001 0.4
Consumption of contaminatedwater, acute exposure
0.002 0.0001 0.001
Longer Term Exposures
Consumption of contaminatedvegetation, chronic exposure
0.004 0.0005 0.1
Consumption of contaminatedwater, chronic exposure
0.000002 2e-08 0.00004
Toxicity value for mammal 2 50 mg/kg/day
Toxicity value for bee 3 1000 mg/kg
1 See Worksheet F07 for details of exposure assessment.2 Except for the honey bee, the hazard quotient is calculated as the estimated exposure divided by the chronicrats NOAEL of 50 mg/kg/day and then rounded to one significant decimal or digit.3 The hazard quotient is based on the marginally-lethal acute dose level of 1000 mg/kg from the study by(Hinken et al. 1986) .
4-21
4.2.2.2 suggest that 0.03 of the nominal application rate could drift 100 feet off-site. At anapplication rate of 0.1 lb a.e./acre, this would correspond to an effective off-site application of0.003 lb a.e./acre. This rate is about a factor of 10 above the NOAELs for post-emergent foliarspray of sensitive species such as soybean, snap bean, tomato, and sunflower but well below theNOAELs for pre-emergent treatment. At 1000 feet off-site, the data summarized by Bird (1995)can be used to estimate an effective rate of 0.00006 lb a.e./acre [0.0006 ×0.1 lb a.e./acre], whichis below the post-emergence NOAEL for sensitive species by a factor of about 10.
The simple verbal interpretation for this quantitative risk characterization is that some sensitivepost-emergent plant species could be adversely affected by off-site drift over a relatively narrowband. Most species of trees, grains, or grasses, however, are not likely to be affected by off-sitedrift. This risk characterization is conservative in that the drift estimates from Bird (1995) arebased on aerial application. Well-directed ground applications conducted under conditions thatdo not favor off-site drift will probably have no impact on off-site plant species.
Soil contamination by runoff does not appear to be a major concern with clopyralid. As detailedin section 4.2.2.4, rains are most likely to cause clopyralid to leach into the soil column ratherthan wash-off. Based on the study by Elliott et al. (1998), the extent of runoff - i.e., 0.015 of theapplied amount. This is similar to the magnitude of off-site drift within 100 feet, 0.01 of theapplied amount (Bird 1995). As discussed in section 4.1.2.4, however, clopyralid is lesseffectively absorbed from roots than from leaf surfaces. The lesser toxicity of clopyralid as aresult of soil exposure relative to direct spray is also indicated in the study by Weseloh (1987). Thus, while damage from runoff cannot be ruled-out under conditions that would be highlyfavorable to runoff, this is not likely to be a major problem with clopyralid.
4.4.3. Aquatic Organisms. The risk assessment for aquatic organisms is relatively simple andunambiguous. Clopyralid appears to have a very low potential to cause any adverse effects in anyaquatic species. As detailed in section 4.2.3, concentrations of clopyralid in ambient water overprolonged periods of time are estimated to be no greater than 0.0089 mg/L. This is a factor ofabout 775 [6.9÷0.0089] below the lowest reported EC50 in any aquatic plant (6.9 mg/L forSelenastrum capricornutum) and about a factor of 2500 [23.1÷0.0089] below the chronicNOAEL for reproductive effects in Daphnia magna. Thus, while the available monitoring dataare limited and may not represent a wide range of environmental conditions, the exposureestimates would have to be in error by factors of 100 to over 1000 to substantially alter thecharacterization of risk.
In the accidental spill scenario used in this risk assessment (worksheet D06), the highest estimatedconcentration of clopyralid in water is 4.54 mg/L. Again, this is substantially below the lowestreported LC50 for any aquatic animal (232 mg a.e./L for Daphnia magna). Aquatic plants,however, could evidence at least transient effects. The concentration of 4.54 mg/L is less than afactor of two below the lowest reported EC50 in any aquatic plant (6.9 mg/L for Selenastrumcapricornutum). It seems reasonable to suspect the this species and other perhaps more sensitivespecies of algae would evidence a transient decrease in population in the event of a severe spill.
5-1
5. REFERENCES
ATSDR (Agency for Toxic Substances and Disease Registry). 1995. Multiple ChemicalSensitivity: A Scientif Overview. FL Mitchell (ed). Princeton Scientific Publishing Co., Inc.,Princeton, NY. 669 pp.
ATSDR (Agency for Toxic Substances and Disease Registry). 1998. Toxicological Profile onHexachlorobenzene. Toxicological Profiles on CD-ROM. CRCnetBase 1999. CRC Press, BocaRaton, Florida.
Bachman G; Wilson C; Whitwell T. 1995. Tolerance of containerized landscape plants to thepostemergence herbicides Stinger, Manage and Basagran. J. Enviorn. Hort. 13(3): 129-132.
Baloch RI; Grant RK. 1991a. The investigation of degradation and metabolism of clopyralid intwo standard and three agricultural soils. Monograph - British Crop Protection Council. (No. 4)pp. 101-108.
Baloch RI; Grant RK. 1991b. The effect of a range of environmental factors on the degradationrate of clopyralid in soil under aerobic conditions. Proceedings of the Brighton Crop ProtectionConference, Weeds. (Vol.) pp. 521-528.
Baloch-Haq R; Snel M; Jackson R; Brumhard B; Stork A; Dust M; Fuhr F. 1993. Comparison ofthe dissipation characteristics of clopyralid as determined by laboratory, field and lysimeterstudies. Brighton crop protection conference, weeds. Proceedings of an international conference,Brighton, UK. (Vol.) pp. 783-788.
Barna-Lloyd T; Szabo J; Rachunek B. 1986. Dowco 290: 2-year Rat Diet Chronic Toxicity andOncogenicity Study: Final Report: Report No. TXT:K-038252-25. Unpublished study preparedby Dow Chemical U.S.A. 945 pp. MRID No. 00162393.
Barna-Lloyd T; Szabo J. 1987. Dowco 290: 2-year Rat Diet Chronic Toxicity andOncogenicity Study: Addendum to Final Report: Report No.: TXT:K-038252-25, Part 2. Unpublished study prepared by Dow Chemical Co., Health & Environmental Sciences-- Texas. 31 pp. MRID No. 40265301.
Beall ML Jr. 1976. Persistence of aerially applied hexachlorobenzene on grass and soil. J EnvironQual. 5:367-369. (Cited in ATSDR 1998).
Bergstrom L; McGibbon A; Day S; Snel M. 1991. Leaching potential and decomposition ofclopyralid in Swedish soils under field conditions. Environmental Toxicology and Chemistry. 10(5):563-571.
5-2
Bidlack H. 1982. Determination of the Bioconcentration Factor for 3,6-dichloropicolinic Acid inBluegill Sunfish during continuous Aqueous Exposure: GH-C 1577. MRID No.00128464.
Biehn W. 1990. Clopyralid: Magnitude of Residue on Asparagus: Lab Project Number: 3115;Study ID 89:AR:007. Unpublished study prepared by IR-4 Northeast Region AnalyticalLaboratory, Cornell Univ. MRID No.41843901. 177 p.
Biehn W. 1991a. Clopyralid: Magnitude of Residue on Cabbage: Lab Project Number: 3513. Unpublished study prepared by IR-4 North- east Regional Analytical Laboratory. MRIDNo.41904401. 183 p.
Biehn W. 1991b. Clopyralid: Magnitude of Residue On Cabbage: Lab Project Number: 3513. Unpublished study prepared by IR-4 North- east Region Analytical Laboratory. MRIDNo.41904403. 120 p.
Biehn W. 1995a. Clopyralid-Magnitude of Residue on Asparagus, 1992 WA Trial: Lab ProjectNumber: A3115: 3115.92-NYR22: 3115.92-WA32. Unpublished study prepared by InterregionalResearch Project No. 4. MRID No.43571502. 165 p.
Biehn W. 1995b. Clopyralid: Magnitude of Residue on Asparagus, 1992 WA Trial: Lab ProjectNumber: A3115: 3115.92-NYR22: 3115.92-WA32. Unpublished study prepared by InterregionalResearch Project No. 4. MRID No.43577302. 165 p.
Bird SL. 1995. A compilation of aerial spray drift field study data for low-flight agriculturalapplication of pesticides. Chapter 18 in Agrochemical Environmental Fate: State of the Art. MLLeng, EMK Leovey, and PL Zubkoff (eds.), Lewis Publishers, Boca Raton, Florida, pp. 195-207.
Bosch A. 1991. Metabolism of [Carbon 14]-3,6-Dichloropicolinic Acid in Rats: Lab ProjectNumber: HWI 6148-115. Unpublished study prepared by Hazleton Wisconsin, Inc. MRIDNo.41790703. 115 p.
Boulding JR. 1995. Practical Handbook of Soil, Vadose Zone, and Ground-WaterContamination. Lewis Publishers, Boca Raton, Florida, 948 pp.
Bovey RW ; Richardson CW. 1991. Dissipation of clopyralid and picloram in soil and seep flowin the Blacklands of Texas. Journal of environmental quality. 20 (3):528-531.
Bovey RW; Whisenant SG. 1991. Control of honey mesquite with clopyralid, triclopyr, orclopyralid: triclopyr mixtures. Journal of Range Management. 44 (1):52-55.
Bovey RW; Hein H Jr; Meyer RE. 1988a. Phytotoxicity and uptake of clopyralid in honeymesquite (Prosopis glandulosa) as affected by adjuvants and other herbicides. Weed Science. 36(1):20-23.
5-3
Bovey RW; Hein H Jr; Meyer RE. 1988b. Mode of clopyralid uptake by honey mesquite(Prosopis glandulosa). Weed Science. 36 (3):269-272.
Bovey RW; Hein H Jr; Keeney FN; Whisenant SG. 1990a. Phytotoxicity and transport ofclopyralid from three formulations in honey mesquite. Journal of Plant Growth Regulation. 9(2):65-69.
Bovey RW; Meyer RE; Whisenant SG. 1990b. Effective simulated rainfall on herbicideperformance in huisache (Acacia farnesiana) and honey mesquite (Prosopis glandulosa). WeedTechnology. 4 (1):26-30.
Bovey RW; Stermer RA; Bouse LF. 1991. Spray deposition of clopyralid on honey mesquite. Weed Technology. 5 (3):499-503.
Bovey RW; Franz E; Whisenant SG. 1994. Influence of organosilicone surfactants and spraynozzle types on the fate and efficacy of clopyralid on honey mesquite (Prosopis glandulosa). Weed Science. 42 (4):658-664.
Boxenbaum J; D'Souza R. 1990. Interspecies pharmacokinetic scaling, biological design andneoteny. Adv. Drug Res. 19: 139-195.
Boxenbaum J; D'Souza R. 1990. Interspecies pharmacokinetic scaling, biological design andneoteny. Adv. Drug Res. 19: 139-195.
Breckenridge C; Lulham G; Araujo P; et al. 1984. A 12-month Oral Toxicity Study of3,6-Dichloropicolinic Acid in the Beagle Dog: Project No. 81347. Unpublished study preparedby Bio- Research Laboratories Ltd. MRID No.00158256. 360 p.
Budavari S. 1989. The Merck Index: An Encyclopedia of Chemicals, Drugs,and Biologicals,11th ed. Merck & Co., Inc., Rahway, New Jersey.
Budavari S. (Ed). 1989. The Merck Index: An Encyclopedia of Chemicals, Drugs,andBiologicals, 11th ed. Merck & Co., Inc., Rahway, New Jersey.
Burnmaster DE. 1998. Lognormal distribution for total water intake and tap water intake bypregnant and lactating women in the United States. Risk Analysis. 18(5): 215-219.
C&P Press (Chemical and Pharmaceutical Press). 1998. EPR II for Windows. ElectronicPesticide Reference.
Calabrese EJ; Baldwin LA. 1993. Performing Ecological Risk Assessments. Lewis Publishers,Boca Raton, LA, pp. 12-24.
5-4
Cantrell RL; Hyland JR. 1985. Application techniques. In: A Guide to Silvicultural HerbicideUse in the Southern United States. Auburn University School of Forestry, Alabama AgriculturalExperiment Station. November 1985. 612 pp.
Clay DV; Andrews L. 1984. The tolerance of strawberries to clopyralid: effect of crop age,herbicide dose and application date. Aspects of Applied Biology. 8:151-158.
Clay DV; Dixon FL; Morgan JL. 1996. Effect of post-spraying rainfall on the response of foresttree seedlings to herbicides. Aspects of Applied Biology. 4:39-46.
Clay DV. 1991. Response of poplar and willow to overall sprays of foliar-acting herbicides. Annals of Applied Biology. 118 (Suppl):82-83.
Clydesdale, FM. 1997. Food Additives: Toxicology, Regulation, and Properties. CRC Press,Boca Raton, Florida. CD-ROM Database.
Cole JH. 1974. The Acute Contact and Oral Toxicity to Worker Honey Bees of TechnicalDowco 290: DWC246/74726. (Unpublished study received Nov 12, 1980 under 464-563;prepared by Huntingdon Research Centre, England. MRID No.00059971.
Concha M; Shepler K. 1994. Photodegradation of (carbon 14)- Clopyralid in Buffered AqueousSolution at pH 7 by Natural Sunlight: Lab Project Number: 451W: ENV94048. Unpublishedstudy prepared by PTRL West, Inc. MRID No.43891401. 65 p.
Cox L; Walker A; Hermosin MC; Cornejo J. 1996. Measurement and simulation of themovement of thiazafluron, clopyralid and metamitron in soil columns. Weed Research (Oxford). 36 (5):419-429.
Cox L; Celis R; Hermosin MC; Becker A; Cornejo J. 1997. Porosity and herbicide leaching insoils amended with olive-mill wastewater. Agriculture, Ecosystems & Environment. 65(2):151-161.
Cralle HT; Bovey RW. 1996. Total nonstructural carbohydrates and regrowth in honey mesquite(Prosopis glandulosa) following hand defoliation or clopyralid treatment. Weed Science. 44(3):566-569.
Crosswhite FS; Feldman WR; Minch EW. 1995. Impact of herbicides on cacti. Desert Plants. 11 (4):9-31.
Dabbert CB; Mitchell RB; Oberheu DT. 1997. Northern bobwhite egg hatchability and chickimmunocompetence following a field application of clopyralid. Bulletin of EnvironmentalContamination and Toxicology. 58 (5):801-806.
5-5
Devine MD; Bestman HD; Vandenborn WH. 1987. Uptake and accumulation of the herbicideschlorsulfuron and clopyralid in excised pea root tissue. Plant Physiology. 85 (1):82-86.
Devine MD and Vandenborn WH. 1985. Absorption, translocation and foliar activity ofclopyralid and chlorsulfuron in Canada thistle (Cirsium arvense) and perennial sowthistle(Sonchus arvensis). Weed Science. 33 (4):524-530.
Dill D; Milazzo D. 1985. Evaluation of the Toxicity of Lontrel T Herbicide to the Green Alga,Selenastrum capricornutum Printz: ES-746. Unpublished study prepared by Dow ChemicalU.S.A. 16 p. MRID NO. 40081402.
Dodd JC; Jeffries P. 1989. Effects of herbicides on three vesicular-arbuscular fungi associatedwith winter wheat (Triticum aestivum L.). Biology and Fertility of Soils. 7 (2):113-119.
Dourson ML; Knauf LA; Durkin PR; Stiteler WM. 1997. Categorical regression of toxicity data:A case study using aldicarb. Reg. Toxicol. Pharmacol. 25:121-129.
Dow AgroSciences. 1998. Clopyralid: A North American Technical Profile. Sow AgroSciencesLLC, 9330 Zionsville Road. Indianapolis, IN 46268. Draft dated July 1998. Copy courtesy ofD. Lade.
Dow Chemical USA. 1980. Summary of Fish and Wildlife Data. Summary of studies 099724-Bthrough 099724-G. (Unpublished study received Nov 12, 1980 under 464-563; CDL:099724-A). MRID No.00059968.
Durkin PR; Rubin L; Withey J; Meylan W. 1995. Methods of assessing dermal absorption withemphasis on uptake from contaminated vegetation. Toxicol. Indust. Health. 11(1): 63-79.
Durkin P; Rubin L; Withey J; Meylan W; Nakatsugawa T. 1998. A reevaluation of methods forassessing dermal absorption. Manuscript under review. Draft dated May 18, 1998.
Elliott JA; Cessna AJ; Best KB; Nicholaichuk W; Tollefson LC. 1998. Leaching and preferentialflow of clopyralid under irrigation: field observations and simulation modeling. Journal ofEnvironmental Quality. 27 (1):124-131.
EXTOXNET. 1996. Pesticide Information Profile on Hexachlorobenzene. ExtensionToxicology Network: A Pesticide Information Project of Cooperative Extension Offices ofCornell University, Michigan State University, Oregon State University, and University ofCalifornia at Davis. Revised June, 1996. 5 pp. http://ace.orst.edu/info/extoxnet/pips/hexachlo.htm.
Finney DJ. 1971. Probit Analysis. New York: Cambridge University Press. 333 p.
5-6
Flynn GL. 1990. Physiochemical determinations of skin absorption. In: Principles ofRoute-to-Route Extrapolation for Risk Assessment. Gerity TR; Henry CJ (Eds). ElsevierScience Publishing Co., Inc., Amsterdam, The Netherlands. (Cited in U.S. EPA 1992).
Forsyth DJ; Martin PA; Shaw GG. 1997. Effects of herbicides on two submersed aquaticmacrophytes, Potamogeton pectinatus L. and Myriophyllum sibiricum Komarov, in a prairiewetland. Environmental Pollution. 95 (2):259-268.
Gaines TB. 1969. Acute toxicity of pesticides. Tox. Appl. Pharamacol. 14: 515-534.
Gilbert K; Crissman J. 1995. Lontrel TE Technical: Acute Oral Toxicity Study in Fischer 344Rats: Lab Project Number: K-038252-046A. Unpublished study prepared by The Dow ChemicalCo. MRID No.44114101. 60 p.
Gilbert K. 1995a. Lontrel TE Technical: Acute Dermal Toxicity Study in New Zealand WhiteRabbits: Lab Project Number: K-038252-046D. Unpublished study prepared by The DowChemical Co. MRID No.44114102. 31 p.
Gilbert K. 1995b. Lontrel TE Technical: Primary Eye Irritation Study in New Zealand WhiteRabbits: Lab Project Number: K-038252-046C. Unpublished study prepared by The DowChemical Co. MRID No.44114104. 18 p.
Gilbert K. 1995c. Lontrel TE Technical: Primary Dermal Irritation Study in New Zealand WhiteRabbits: Lab Project Number: K-038252-046B. Unpublished study prepared by The DowChemical Co. MRID No.44114105. 16 p.
Gilbert K. 1995d. Lontrel TE Technical: Dermal Sensitization Potential in the Hartley AlbinoGuinea Pig: Lab Project Number: K-038252-046E. Unpublished study prepared by The DowChemical Co. MRID No.44114106. 18 p.
Goldstein A; Aronow L; Kaman SM. 1974. Principles of Drug Action: The Basis ofPharmacology. 2nd ed. John Wiley and Sons, New York, NY. 854 p.
Grant NT; Prusinkiewicz E; Makowski RMD; Holmstron-Ruddick B; Mortensen K. 1990. Effect of selected pesticides on survival of Colletotrichum gloeosporioides f. sp. malvae, abioherbicide for round-leaved mallow (Malva pusilla). Weed Technology. 4 (4):701-715.
Grundy AC; Froud-Williams RJ; Boatman ND. 1995. Maternal effects in progeny of field pansy(Viola arvensis) subjected to different herbicide and nitrogen rates. Annals of Applied Biology. 127 (2):343-352.
Guo C. 1996. Metabolism of (carbon 14)-Clopyralid in Cabbage: Final Report: Lab ProjectNumber: 42568: RES95095. Unpublished study prepared by ABC Labs., Inc. MRIDNo.44212601. 107 p.
5-7
Hall JC; Vanden Born WH. 1988. The absence of a role of absorption, translocation, ormetabolism in the selectivity of picloram and clopyralid in two plant species. Weed Science. 36(1):9-14.
Hanley T; Berdasco N; Stebbins K; et al. 1990a. Clopyralid: Oral Gavage Teratology Study inNew Zealand White Rabbits: Lab Project Number: K-038252-039. Unpublished study preparedby The Dow Chemical Co. MRID No.41649801. 392 p.
Hanley T; Berdasco N; Stebbins K;. 1990b. Clopyralid: Oral Gavage Teratology Study in NewZealand White Rabbits: Lab Project Number: K-038252-041. Unpublished study prepared by TheDow Chemical Co. MRID No.41649802. 69 p.
Harris SA; Solomon KR. 1992. Human exposure to 2,4-D following controlled activities onrecently sprayed turf. J. Environ. Sci. Health. B27(1): 9-22.
Hassan SA; Bigler F; Bogenschutz H; Boller E; Brun J; Calis JNM; Coremans-Pelseneer J; DusoC. 1994. Results of the sixth joint pesticide testing programme of the IOBC/WPRS-workinggroup 'Pesticides and beneficial organisms'. Entomophaga. 39 (1):107-119.
Hawes K; Erhardt-Zabik S. 1995. The Anaerobic Aquatic Metabolism of Clopyralid: Lab ProjectNumber: ENV93076. Unpublished study prepared by DowElanco North American EnvironmentalChemistry Lab. MRID No.43891404. 42 p.
Hinken C; Dingledine J; Jaber M. 1986. Lontrel 35A Herbicide Concentrate: An Acute ContactToxicity Study with the Honey Bee: Project No.: 103-256. Unpublished study prepared byWildlife International Ltd. MRID No.40151612. 15 p.
Hoerger F; Kenaga EE. 1972. Pesticide residues on plants: Correlation of representative data asa basis for estimation of their magnitude in the environment. In: Environmental Quality andSafety, Volume I: Global Aspects of Toxicology and Technology as Applied to the Environment. F. Coulston and F. Kerte (eds.). Academic Press, New York, NY. pp. 9-28.
Hoffman G. 1995. Lontrel TE Technical: Acute Aerosol Inhalation Toxicity Study with Fischer344 Rats: Final Report: Lab Project Number: 95-5249: HET K-038252-047. Unpublished studyprepared by Pharmaco LSR. MRID No.44114103. 43 p.
Humiston CG; Jersey GC; Wade CE; et al. 1977. Dowco 290 (3,6-Dichloropicolinic acid):Results of a Two-Year Chronic Toxicity and Oncogenicity Study in Rats by the Dietary Route. (Unpublished study received Nov 12, 1980 under 464-563; submitted by Dow Chemical U.S.A.,Midland, Mich.; CDL:099732-B). MRID No. 00061376. [Summarized in U.S. EPA 1988; DowAgroSciences 1998].
5-8
ICRP (International Commission on Radiologic Protection). 1975. Report of the Task Group onReference Man. Recommendations of the International Commission on Radiological Protection(ICRP) Publ. No. 23. Pergamon Press, New York, NY.
Jacoby PW; Meadors CH; Clark LE. 1990. Effects of triclopyr, clopyralid and picloram ongrowth and production of cotton. Journal of Production Agriculture. 3 (3):297-301.
Jeffery M. 1987a. Lontrel T Herbicidal Chemical (Penta Process): Primary Eye Irritation Studyin New Zealand White Rabbits: Lab Project Number: K-038252-033C. Unpublished studyprepared by Dow Chemical Co. MRID No.41641304. 15 p.
Jeffery M. 1987b. Lontrel T Herbicidal Chemical (Penta Process): Primary Dermal IrritationStudy in New Zealand White Rabbits: Lab Project Number: K-38252-033B. Unpublished studyprepared by Dow Chemical Co. MRID No.41641305. 12 p.
Jeffery M. 1987c. Lontrel T Herbicidal Chemical (Penta Process): Dermal Sensitization Potentialin the Hartley Albino Guinea Pig: Lab Project Number: K-038252-033E. Unpublished studyprepared by Dow Chemical Co. MRID No.41641306. 13 p.
Jeffrey M; Battjes J; Zimmer M. 1987a. Lontrel 3A Herbicide: Acute Dermal Toxicity Study inNew Zealand White Rabbits: Final Report: Laboratory Project Study ID: M-003972-004. Unpublished study prepared by Dow Chemical Co. MRID No.40246301. 17 p.
Jeffrey M; Schuetz D; Johnson K. 1987b. Lontrel T Herbicidal Chemical (Penta Process): AcuteOral Toxicity Study in Fischer 344 Rats: Lab Project Number: K-038252-033A. Unpublishedstudy prepared by The Dow Chemical Co. MRID No.41641301. 15 p.
Kloppenburg DJ; Hall JC. 1990a. Effects of formulation and environment on absorption andtranslocation of clopyralid in Cirsium arvense (L.) Scop. and Polygonum convolvulus L. Weedresearch. 30: 9-20.
Kloppenburg DJ; Hall JC. 1990b. Penetration of clopyralid and related week acid herbicides intoand through isolated cuticular membranes of Euonymus fortunei. Weed research. 30: 431-438.
Kloppenburg DJ; Hall JC. 1990c. Efficacy of five different formulations of clopyralid on Cirsiumarvense (L.) Scop. and Polygonum convolvulus L. Weed research. 30: 227-234.
Knisel WG; Davis FM; Leonard RA. 1992. GLEAMS Version 2.0 User Manual. U.S.Department of Agriculture, Agricultural Research Service, Southeast Watershed ResearchLaboratory, Tifton, GA. 202pp.
Koizumi A. 1991. Experimental evidence for the possible exposure of workers tohexachlorobenzene by skin contamination. British J Indust. Med. 48:622-628.
5-9
Lade D. 1997. Supplemental Information for Establishment of Clopyralid Tolerances under theRequirements of the Food Quality Protection Act of 1996: Lab Project Number: DHL042397.Unpublished study prepared by DowE. MRID No.44264301. 15 p.
Lade DH. 1998. Regulatory Manager, Dow AgroSciences LLC. 9330 Zionsville Road,Indianapolis, IN. 46268-1054. Personal communication with P. Durkin, SERA Inc., September29, 1998.
Lawrie J; Clay DV. 1994. Tolerance of 2-year-old forestry trees to five herbicides. Forestry(Oxford). 67 (4):287-295.
Lawson HM; Wiseman JS; Wright GM. 1992. Seasonal and rotational implications of accidentalcontamination of potato crops with herbicides. Aspects of Applied Biology. (No. 3):173-180.
Leitch C; Fagg P. 1985. Clopyralid herbicide residues in streamwater after aerial spraying of aPinus radiata plantation. New Zealand Journal of Forestry Science. 15 (2):195-206.
Leng ML; Leovey EMK; Zubkoff PL. 1995. Agrochemical Environmental Fate: State of theArt.Lewis Publishers, Boca Raton, Florida, 410 pp.
Levchenko LA; Sadkov AP; Trokhimets VV; Pivovarova TS; Kovalenko II; Bogdanov GN. 1990. Influence of herbicides on the structuro-functional state of the chloroplasts. Biochemistry(New York). 55 (3, I):307-311.
Lucas WJ; Lobb PG. 1987. Response of potatoes, tomatoes and kumaras to foliar applicationsof MCPA, MCPB, 2,4-D, clopyralid and amitrole. Proceedings, New Zealand Weed and PestControl Conference. 59-63.
Manugistics. 1995. Statgraphics Pluss for Windows. Version 3. Available from Manugistics,Inc. Rockville, Maryland.
Markle G. 1991. Clopyralid: Magnitude of Residue on Mint: Lab Project Number: 2632. Unpublished study prepared by Oregon State Univ., IR-4 Western Region Satellite AnalyticalLab. MRID No.42044401. 272 p.
Masiunas JB; Orfanedes MS. 1991. Tolerance of sweet corn (Zea mays) to clopyralid andEF-689. Weed Technology. 5 (2):376-380.
Mason RW; Johnson BL. 1987. Ergonomic factors in chemical hazard control. In: Handbook ofHuman Factors. Salveny, G; ed. John Wiley and Sons, New York, NY. pp. 772-741.
McKellar R. 1995. Proposed Tolerances for Clopyralid in/on Sugar Beet Root, Tops andMolasses: Lab Project Number: GH-C 3657. Unpublished study prepared by DowElanco. MRIDNo.43717501. 11 p.
5-10
McMurray GL; Monks DW; Leidy RB. 1996. Clopyralid use in strawberries (Fragaria xananassa Duch.) grown on plastic mulch. Weed Science. 44 (2):350-354.
Mendenhall W; Scheaffer RF. 1973. Mathematical Statistics with Applications. Duxbury Press,North Scituate, Massachusetts. 461 pp. plus appendices.
Middleton MR. 1997. Data Analysis Using Microsoft Excel. Duxbury Press. Belmont CA. 289pp.
Moore JA. 1964. Physiology of the Amphibia. Academic Press, New York. 654 p. (Cited inUSDA 1993).
Mumtaz MM; DeRosa C; Durkin PR. 1994. Approaches and challenges in risk assessments ofchemical mixtures. In: Toxicology of Chemical Mixtures. Yang R (Ed). Academic Press,Chicago, IL. pp. 565-597.
Nix SJ. 1994. Urban Storm-water Modeling and Simulation. CRC Press, Inc., Boca Raton,Florida, 212 pp.
NRC (National Research Council). 1983. Risk assessment in the Federal government: managingthe process. Washington, DC: National Academy Press; 176 p. + app.
Nugent P; Schotts B. 1991. Determination of Clopyralid Residues in Corn Grain, Fodder, andGreen Forage: Lab Project Number: GH-C 2470: 88048AN: 88048. Unpublished study preparedby Dow Elanco. MRID No.41922301. 73 p.
O'Flaherty EJ. 1981. Toxicants and Drugs: Kinetics and Dynamics. John Wiley and Sons, NewYork, NY. 398 pp.
O'Sullivan PA; Kossatz VC. 1984a. Tolerance of Glenlea and Neepawa wheat to clopyralid. Canadian Journal of Plant Science. 64 (4):1023-1025.
O'Sullivan PA; Kossatz VC. 1984b. Control of Canada thistle and tolerance of barley to3,6-dichloropicolinic acid. Canadian Journal of Plant Science. 64 (1):215-217.
Oliver G; Bjerke E; Mackasey M; et al. 1988. Field Dissipation and Leaching of Clopyralid underRangeland Conditions: Lab. Proj. ID GHC-2070. Unpublished study prepared by Dow ChemicalU.S.A. MRID No.40676201. 55 p.
Orfanedes MS; Wax LM. 1991. Differential response of hemp dogbane (Apocynum cannabinum)to clopyralid, Dowco 433, and 2,4-D. Weed Technology. 5 (4):782-788.
5-11
Orfanedes MS; Wax LM; Liebl RA. 1993. Absence of a role for absorption, translocation, andmetabolism in differential sensitivity of hemp dogbane (Apocynum cannabinum) to two pyridineherbicides. Weed Science. 41 (1):1-6.
Pattern K; Wang J; Katz F; Riemer D; Kusek C; Hopen H. 1994. Cranberry tolerance toclopyralid. HortScience. 29 (10):1131-1132.
Petty D; Knuteson J. 1991. Field Dissipation and Leaching of Clopyralid under RangelandConditions: Supplement to GH-C 2070: Lab Project Number: 87057: GC-C 2070 ADD1. Unpublished study prepared by DowElanco. MRID No.42415401. 23 p.
Pik AJ; Peake E; Strosher MT; Hodgson GW. 1977. Fate of 3,6-dichloropicolinic acid in soils. Journal of Agricultural and Food Chemistry. 25 (5):1054-1061.
Pywell RF; Nowakowski M; Allchin EA; Aldous E. 1996. Preliminary studies of the effects ofselective herbicides on wild flower species. Aspects of Applied Biology. 4:149-156.
Reyes MR; Richard B; Fouss JL; Carter CE. 1994. Comparison of erosion predictions withGLEAMS, GLEAMS-WT, and GLEAMS-SWAT models for alluvial soils. USDA AgriculturalResearch Station. Tektran. http://www.nalusda.gov/ttic/tektran/data/000005/26/0000052632.html. March 31, 1994.
Rice PM; Toney JC; Bedunah DJ; Carlson CE. 1997. Plant community diversity and growthform responses to herbicide applications for control of Centaurea maculosa. Journal of AppliedEcology. 34 (6):1397-1412.
Roberts D; Phillips A; Blakeslee B; et al. 1996. Terrestrial Dissipation of Clopyralid in California:Lab Project Number: ENV95003. Unpublished study prepared by DowElanco and A&L GreatLakes Labs. MRID No.44184701. 208 p.
Rubin L; Mistretta P; Thomas D; Durkin P; Meylan W. 1998. A re-evaluation of methods forassessing occupational exposure in pesticide applicators. Manuscript under review.
Ruffle B; Burmaster DE; Anderson PD; Gordon HD. 1994. Lognormal distributions for fishconsumption by the general U.S. population. Risk Analy. 14(4): 395-404.
Schutz S; Weibbecker B; Hummel HE. 1996. Gas Chromatography-Mass spectrometry analysisof the herbicide clopyralid in differentially cultivated soils. Environ. Toxicol Chem. 15(2): 249-252. .
SERA (Syracuse Environmental Research Associates, Inc.). 1998. Methodology for HumanHealth Risk Assessments, SERA TR 96-21-07-03e, draft dated March 26, 1998. Prepared underUSDA/FS Contract 53-3187-5-12, Order No. 43-3187-7-0407. Syracuse EnvironmentalResearch Associates, Inc., Fayetteville, NY.
5-12
Smith AE; Aubin AJ. 1989. Persistence studies with the herbicide clopyralid in prairie soils atdifferent temperatures. Bulletin of Environmental Contamination and Toxicology. 42(5):670-675.
Smith LJ; Skroch WA. 1995. Turf herbicide injury to landscape trees as influenced by mulch. Journal of Environmental Horticulture. 13 (2):60-63.
Stachler JM; Kells JJ. 1997. Wild carrot (Daucus carota) control in no-tillage cropping systems. Weed Technology. 11 (3):444-452.
Streeter C; Lomax L; Battjes J. 1987. Lontrel T Herbicidal Chemical (Penta Process): An AcuteAerosol Inhalation Study in Fischer 344 Rats: Lab Project Number: K-038252-034. Unpublishedstudy prepared by Dow Chemical Co. MRID No.41641303. 20 p.
Streibig JC; Walker A; Blair AM; Anderson-Taylor G; Eagle DJ; Friedlander H; Hacker E;Iwanzik W; Kudsk P; Labhart C; Luscombe BM; Madafiglio G; Nel PC; Pestemer W; Rahman A;Retzlaff G; Rola J; Stefanovic L; Straathof HJM; Thies EP. 1995. Variability of bioassays withmetsulfuron methyl in soil. Weed Research. 35(4): 215-224.
Teasdale R; Coombe N. 1991. Clopyralid Residues in Sugarbeet Molasses and Molassed PulpSampled from Two Factories During 1989-1990 Campaign British Sugar, UK-1990: Lab ProjectNumber: R90-22: GHE-P-2317. Unpublished study prep. MRID No.41946701. 48 p.
U.S. EPA (U.S. Environmental Protection Agency). 1985. Development of StatisticalDistributions or Ranges of Standard Factors Used in Exposure Assessments, Report prepared byGCA Corp., Chapel Hill. Available from NTIS: PB85-242667. .
U.S. EPA (United States Environmental Protection Agency). 1988a. Pesticide tolerances forclopyralid. Federal Register. 53 (169):33488-3349.
U.S. EPA (United States Environmental Protection Agency). 1988b. Pentachlorobenzene: IRISEntry. Last update 3/1/88. Http://www.epa.gov/iris/subst/0085.htm.
U.S. EPA (U.S. Environmental Protection Agency). 1989. Recommendations for andDocumentation of Biological Values for use in Risk Assessment. U.S. EPA, EnvironmentalCriteria and Assessment Office, Office of Health and Environmental Assessment, Cincinnati, OH. ECAO-CIN-554. [pagination not continuous].
U.S. EPA (U.S. Environmental Protection Agency). 1992. Dermal Exposure Assessment:Principles and Applications. EPA/600/8-91/011B. Interim Report. Exposure Assessment Group,Office of Health and Environmental Assessment, Washington, DC.
U.S. EPA (U.S. Environmental Protection Agency). 1996. Exposure Factors Handbook. Officeof Research and Development, National Center for Environmental Assessment, U.S. EPA,
5-13
Washington, DC. EPA/600/P-95/002Ba-c. Avail. NTIS: PB97-117683, 97-117691, PB97-117709.
U.S. EPA (United States Environmental Protection Agency). 1997a. Office of PesticidePrograms Reference Dose Tracking Report for Clopyralid, 02/19/97, page 10. Copy courtesy ofGeorge Ghali, U.S. EPA/OPP.
U.S. EPA (United States Environmental Protection Agency). 1997b. Hexachlorobenzene: IRISEntry. Last update 3/1/97. http://www.epa.gov/iris/subst/0374.htm.
U.S. EPA (United States Environmental Protection Agency). 1998. Drinking Water and HealthTechnical Fact Sheet on Hexachlorobenzene. Last update 1/27/98. http://www.epa.gov/OGWDW/dwh/t-soc/hcb.html.
U.S. Weather Service. 1998. NWS Climate Tables, 1961-1990. http://www.nws.noaa.gov/climatex.shtml. Files downloaded on January 14, 1999.
USDA (U.S. Department of Agriculture/Forest Service). 1989a. Final Environmental ImpactStatement: Vegetation Management in the Coastal Plain/Piedmont, Management BulletinR8-MB-23, dated January, 1989. 1213 pp.
USDA (U.S. Department of Agriculture/Forest Service). 1989b. Draft Environmental ImpactStatement: Vegetation Management in the Ozark/Ouachita Mountains, Management BulletinR8-MB-23, dated June, 1989. 499 pp.
USDA (U.S. Department of Agriculture/Forest Service). 1989c. Final Environmental ImpactStatement: Vegetation Management in the Appalachian Mountains, Management BulletinR8-MB-38, dated July, 1989. 1104 pp. USDA/APHIS (U.S. Department of Agriculture/Animal and Plant Health Inspection Service).1993. Nontarget Risk Assessment for the MEDFLY Cooperative Eradication Program. USDAAnimal and Plant Health Inspection Service. February 1993.
USDA (United States Department of Agriculture/Forest Service). 1998. Final FY'97 UseSummary. Provided to SERA, Inc. by Dr. Paul Mistretta, USDA Forest Service, Atlanta GA. 7pp.
van Hemmen JJ. 1992. Agricultural pesticide exposure data bases for risk assessment. Rev.Environ. Contam. Toxicol. 126: 1-85.
Vedula U; Stebbins K; Stott W. 1990. Clopyralid: Probe and 21-Day Dermal Toxicity Study inNew Zealand White Rabbits: Lab Project Number: K-038252-044. Unpublished study preparedby The Dow Chemical Co. MRID No.41790701. 164 p.
5-14
Weseloh J. 1987. A Summary of Three Greenhouse Trials To Deter- mine the Effects ofClopyralid, 3,6-Dichloro-2-pyridinecarboxylic Acid, on Seed Germination, Seedling Emergence,and Vegetative Vigor of Six Dicotyledonae and Four Monocotyledonae Crop Cultivars. Unpublished study prepared by Dow Chemical U.S.A. 158 pp. MRID No. 40081401.
West B; Willigan DA. 1976. 18-Month Mouse Oncology Study: Laboratory Reference No.A-896. Final rept. (Unpublished study received Nov 12, 1980 under 464-563; prepared byBiometric Testing, Inc. and others, submitted by Dow Chemical U.S.A., Midland, Mich.;CDL:099732-C). MRID No. 00061377.
Whisenant SG; Bovey RW. 1993. Water quality effects on stability and phytotoxicity of picloramand clopyralid. Journal of Range Management. 46 (3):254-256.
Whisenant SG; Bouse LF; Crane RA; Bovey RW. 1993. Droplet size and spray volume effectson honey mesquite mortality with clopyralid. Journal of Range Management. 46 (3):257-261.
Winegardner DL. 1996. An Introduction to Soils for Environmental Professionals. CRC Press,Boca Raton, Florida. 270 pp.
Wolfram Research. 1997. Mathematica Version 3.0.1. Available from Wolfram Research, Inc. Champaign, IL.
Woodburn K; French B. 1987. A Soil Sorption/Desorption Study of Clopyralid: LaboratoryProject ID: GH-C 1873. Unpublished study prepared by Dow Chemical U.S.A. MRIDNo.40095701. 47 p.
Woodburn K. 1987. Clopyralid--The Hydrolysis of Clopyralid in Sterile, Buffered Water: LabProject Number: LEH060893. Unpublished study prepared by Dow Chemical U. S. A. MRIDNo.42805701. 19 p. Yackovich P; Lardie T. 1990. A 10-1/2 Month Rotational Crops Study With [14C] LabeledClopyralid: Lab Project Number: GH-C 2409. Unpublished study prepared by DowElanco. MRID No.41971101. 74 p.
Yackovich P; Lardie T; Brink D. 1993. A 10-1/2 Month Rotational Crops Study with (carbon14)-Labeled Clopyralid: Lab Project Number: GH-C 2992. Unpublished study prepared byDowElanco. MRID No.42815001. 81 p.
Young J; BarnaLloyd T; Davis N. 1986. Dowco 290: 2-Year Dietary ChronicToxicity-oncogenicity Study in Mice: ?Including Interim Report, Histopathology Data andIndividual Animal Data: Final Report: Report No. TXT:K-038252-24. Unpublished study prepared by Dow Chemical Co., Lake Jackson Research Center. 1582 pp. MRID No. 00157783.
6-1
6. GLOSSARY
Absorption -- The process by which the agent is able to pass through the body membranes and enter thebloodstream. The main routes by which toxic agents are absorbed are the gastrointestinal tract, lungs, andskin.
Acute exposure -- A single exposure or multiple exposure occurring within a short time (24 hours or less).
Additive effect -- A situation in which the combined effects of two chemicals is equal to the sum of theeffect of each chemical given alone. The effect most commonly observed when two chemicals are giventogether is an additive effect.
Adjuvant(s) -- Formulation factors used to enhance the pharmacological or toxic agent effect of the activeingredient.
Adsorption -- The tendency of one chemical to adhere to another material.
Adverse-effect level (AEL) -- Signs of toxicity that must be detected by invasive methods, externalmonitoring devices, or prolonged systematic observations. Symptoms that are not accompanied by grosslyobservable signs of toxicity. In contrast to Frank-effect level.
Alkaline phosphatase – An enzyme that occurs in various normal and malignant tissues. The activity ofthe enzyme in blood is useful in diagnosing many illnesses.
Allometric -- pertaining to allometry, the study and measure of growth. In toxicology, the study of therelationship of body size to various physiological, pharmacological, pharmacokinetic, or toxicodynamicprocesses among species.
Amphibian – A cold-blooded vertebrate capable of operating on land and in water.
Arid – A terrestrial region lacking moisture, or a climate in which the rainfall is not sufficient to supportthe growth of trees or woody plants.
Assay -- A kind of test (noun); to test (verb).
Bioconcentration factor (BCF) -- The concentration of a compound in an aquatic orgainism divided bythe concentration in the ambient water of the organism.
Biologically sensitive -- A term used to identify a group of individuals who, because of their developmentalstage or some other biological condition, are more susceptible than the general population to a chemical orbiological agent in the environment.
Broadleaf weed -- A nonwoody dicotyledonous plant with wide bladed leaves designated as a pest speciesin gardens, farms, or forests.
6-2
Cancer potency parameter -- A model-dependent measure of cancer potency (mg/kg/day)-1 over lifetimeexposure. [Often expressed as a q1
* which is the upper 95% confidence limit of the first dose coefficient(q1) from the multistage model.]
Carcinogen -- A chemical capable of inducing cancer.
Carcinoma -- A malignant tumor.
Carrier -- In commercial formulations of insecticides or control agents, a substance added to theformulation to make it easier to handle or apply.
Chronic exposure -- Long-term exposure studies often used to determine the carcinogenic potential ofchemicals. These studies are usually performed in rats, mice, or dogs and extend over the average lifetimeof the species (for a rat, exposure is 2 years).
Conifer -- An order of the Gymnospermae, comprising a wide range of trees, mostly evergreens that bearcones and have needle-shaped or scalelike leaves; timber commercially identified as softwood.
Connected actions -- Exposure to other chemical and biological agents in addition to exposure to thecontrol agent during program activities to control vegetation.
Contaminants -- For chemicals, impurities present in a commercial grade chemical. For biological agents,other agents that may be present in a commercial product.
Controls -- In toxicology or epidemiology studies, a population that is not exposed to the potentially toxicagent under study.
Creatine – An organic acid composed of nitrogen. It supplies the energy required for muscle contraction.
Creatinine – The end product of the metabolism of creatine. It is found in muscle and blood and isexcreted in the urine.
Cumulative exposures -- Exposures that may last for several days to several months or exposuresresulting from program activities that are repeated more than once during a year or for several consecutiveyears.
Dams – A term used to designate females of some species such as rats.
Degraded -- Broken down or destroyed.
Dermal -- Pertaining to the skin.
Dislodgeable residues – The residue of a chemical or biological agent on foliage as a result of aerial orground spray applications, which can be removed readily from the foliage by washing, rubbing or havingsome other form of direct contact with the treated vegetation.
6-3
Dose-response assessment -- A description of the relationship between the dose of a chemical and theincidence of occurrence or intensity of an effect. In general, this relationship is plotted by statisticalmethods. Separate plots are made for experimental data obtained on different species or strains within aspecies.
Drift -- That portion of a sprayed chemical that is moved by wind off a target site.
EC50 -- A concentration that causes 50% inhibition or reduction. As used in this document, this valuesrefers to a 50% inhibition of growth.
EC100 -- A concentration that causes complete inhibition or reduction. As used in this document, thisvalues refers to a complete inhibition of growth.
Electrochemical process -- A newer manufacturing process for clopyralid. Details of the method areproprietary.
Empirical -- Refers to an observed, but not necessarily fully understood, relationship in contrast to ahypothesized or theoretical relationship.
Enzymes -- A biological catalyst; a protein, produced by an organism itself, that enables the splitting (asin digestion) or fusion of other chemicals.
Epidemiology study -- A study of a human population or human populations. In toxicology, a studywhich examines the relationship of exposures to one or more potentially toxic agent to adverse healtheffects in human populations.
Exposure assessment -- The process of estimating the extent to which a population will come into contactwith a chemical or biological agent.
Extrapolation -- The use of a model to make estimates outside of the observable range.
Fetal anomaly – An abnormal condition in a fetus, which is usually the result of a congenital defect.
Forbes – a non-grass or broadleaf herb.
Formulation -- A commercial preparation of a chemical including any inerts or contaminants.
Frank effects -- Obvious signs of toxicity.
Frank-effect level (FEL) -- The dose or concentration of a chemical or biological agent that causes grossand immediately observable signs of toxicity.
Gavage -- The placement of a toxic agent directly into the stomach of an animal, using a gastric tube.
Genotoxic -- Causing direct damage to genetic material. Associated with carcinogenicity.
6-4
Geometric mean -- The measure of an average value often applied to numbers for which a log normaldistribution is assumed.
Gestation -- The period between conception and birth; in humans, the period known as pregnancy.
Half-time or half-life -- For compounds that are eliminated by first-order kinetics, the time required for theconcentration of the chemical to decrease by one-half.
Hazard quotient (HQ) -- The ratio of the estimated level of exposure to the RfD or some other index ofacceptable exposure.
Hazard identification -- The process of identifying the array of potential effects that an agent may inducein an exposed human population.
Hematological -- Pertaining to the blood.
Hematology -- One or more measurements regarding the state or quality of the blood.
Henry's law constant -- An index of the tendency of a compound to volatilize from aqueous solutions.
Herbaceous -- A plant that does not develop persistent woody tissue above the ground (annual, biennial,or perennial, but whose aerial portion naturally dies back to the ground at the end of a growing season. They include such categories as grasses and grass-like vegetation.
Herbicide -- A chemical used to control, suppress, or kill plants, or to severely interrupt their normalgrowth processes.
Histopathology -- Signs of tissue damage that can be observed only by microscopic examination.
Hydrolysis -- Decomposition or alteration of a chemical substance by water.
Hydroxylation -- The addition of a hydrogen-oxygen or hydroxy (-OH) group to one of the rings. Hydroxylation increases the water solubility of aromatic compounds. Particularly when followed byconjugation with other water soluble compounds in the body, such as sugars or amino acids, hydroxylationgreatly facilitates the elimination of the compound in the urine or bile.
Hymolytic anemia – A medical condition in which the number of red blood cells is decreased due tointravascular fragmentation or destruction.
In vivo -- Occurring in the living organism.
In vitro -- Isolated from the living organism and artificially maintained, as in a test tube.
Inerts -- Adjuvants or additives in commercial formulations of glyphosate that are not readily active withthe other components of the mixture.
6-5
Interpolation -- The use of mathematical models within the range of observations
Intraperitoneal -- Injection into the abdominal cavity.
Invertebrate -- An animal that does not have a spine (backbone).
Irritant effect -- A reversible effect, compared with a corrosive effect.
LC50 (lethal concentration50) -- A calculated concentration of a chemical in air to which exposure for aspecific length of time is expected to cause death in 50% of a defined experimental animal population.
LD50 (lethal dose50) -- The dose of a chemical calculated to cause death in 50% of a defined experimentalanimal population over a specified observation period. The observation period is typically 14 days.
Lowest-observed-adverse-effect level (LOAEL) -- The lowest dose of a chemical in a study, or group ofstudies, that produces statistically or biologically significant increases in frequency or severity of adverseeffects between the exposed population and its appropriate control.
Lymphatic – Pertaining to lymph, a lymph vessel, or a lymph node.
Lymph – A clear water fluid containing white blood cells. Lymph circulates throughout the lymphaticsystem, removing bacteria and certain proteins from body tissue. It also is responsible for transporting fatfrom the small intestine and suppling mature lymphocytes to the blood.
Macrophyte – Terrestrial plant
Malignant -- Cancerous.
Margin of safety (MOS) -- The ratio between an effect or no effect level in an animal and the estimatedhuman dose.
Metabolite -- A compound formed as a result of the metabolism or biochemical change of anothercompound.
Metameter – Literally, the unit of measure. Used in dose-response or exposure assessments to describethe most relevant way of expressing dose or exposure.
Microorganisms -- A generic term for all organisms consisting only of a single cell, such as bacteria,viruses, and fungi.
Microsomal -- Pertaining to portions of cell preparations commonly associated with the oxidativemetabolism of chemicals.
Minimal risk level (MRL) – A route-specific (oral or inhalation) and duration- specific estimate of anexposure level that is not likely to be associated with adverse effects in the general population, includingsensitive subgroups.
6-6
Mitochondria -- Subcellular organelles involved in the conversion of food to stored chemical energy.
Most sensitive effect -- The adverse effect observed at the lowest dose level, given the available data. Thisis an important concept in risk assessment because, by definition, if the most sensitive effect is prevented,no other effects will develop. Thus, RfDs and other similar values are normally based on doses at whichthe most sensitive effect is not likely to develop.
Multiple chemical sensitivity -- A syndrome that affects individuals who are extremely sensitive tochemicals at extremely low levels of exposure.
Mutagenicity -- The ability to cause genetic damage (that is damage to DNA or RNA). A mutagen issubstance that causes mutations. A mutation is change in the genetic material in a body cell. Mutationscan lead to birth defects, miscarriages, or cancer.
Non-target -- Any plant or animal that a treatment inadvertently or unavoidably harms.
No-observed-adverse-effect level (NOAEL) -- The dose of a chemical at which no statistically orbiologically significant increases in frequency or severity of adverse effects were observed between the exposed population and its appropriate control. Effects may be produced at this dose, but they are notconsidered to be adverse.
No-observed-effect level (NOEL) -- The dose of a chemical at no treatment-related effects wereobserved.
Normal distribution -- One of several standard patterns used in statistics to describe the way in whichvariability occurs in a populations.
Octanol-water partition coefficient (Kow) -- The equilibrium ratio of the concentrations of a chemical inn-octanol and water, in dilute solution.
Ocular -- Pertaining to the eye.
Parenteral -- Any form of injection.
Partition -- In chemistry, the process by which a compound or mixture moves between two or more media.
Pathogen – A living organism that causes disease; for example, a fungus or bacteria.
Pathway -- In metabolism, a sequence of metabolic reactions.
Penta process -- The original manufacturing process for clopyralid. Details of the method are proprietary.
Perennial -- A plant species having a life span of more than 2 years.
Permeability – The property or condition of being permeable. In this risk assessment, dermal permeabilityrefers to the degree to which a chemical or herbicide in contact with the skin is able to penetrate the skin.
6-7
pH -- The negative log of the hydrogen ion concentration. A high pH (>7) is alkaline or basic and a lowpH (<7) is acidic.
pKa -- The negative log of the hydrogen ion concentration or pH at which 50% of a weak acid isdissociated.
Pharmacokinetics -- The quantitative study of metabolism (i.e., the processes of absorption, distribution,biotransformation, elimination).
Prospective -- looking ahead. In epidemiology, referring to a study in which the populations for study areidentified prior to exposure to a presumptive toxic agent, in contrast to a retrospective study.
Pup – The offspring or young of various animal species.
Release -- A work done to free desirable trees from competition with overstory trees, less desirable trees orgrasses, and other forms of vegetative growth.
Reference dose (RfD) -- Oral dose (mg/kg/day) not likely to be associated with adverse effects overlifetime exposure, in the general population, including sensitive subgroups.
Relative weight -- The weight of an organ, such as the liver or kidney, divided by the total body weight ofthe animal.
Reproductive effects -- Adverse effects on the reproductive system that may result from exposure to achemical or biological agent. The toxicity of the agents may be directed to the reproductive organs or therelated endocrine system. The manifestations of these effects may be noted as alterations in sexualbehavior, fertility, pregnancy outcomes, or modifications in other functions dependent on the integrity ofthis system.
Resorption -- Removal by absorption. Often used in describing the unsuccessful development andsubsequent removal of post-implantation embryos.
Retrospective -- looking behind. In epidemiology, referring to a study in which the populations for studyare identified after exposure to a presumptive toxic agent, in contrast to a prospective study.
RfD -- A daily dose which is not anticipated to cause any adverse effects in a human population over alifetime of exposure. These values are derived by the U.S. EPA.
Right-of-way -- A corridor of low growing shrubs or grasses that facilitate the maintenance and protectionof utility power lines and provide transport pathways for humans or wildlife.
Route of exposure -- The way in which a chemical or biological agent enters the body. Most typicalroutes include oral (eating or drinking), dermal (contact of the agent with the skin), and inhalation.
Scientific notation -- The method of expressing quantities as the product of number between 1 and 10multiplied by 10 raised to some power. For example, in scientific notation, 1 kg = 1,000 g would beexpressed as 1 kg = 1 x 10³ g and 1 mg = 0.001 would be expressed as 1 mg = 1 x 10⁻³.
6-8
Sensitive subgroup -- Subpopulations that are much more sensitive than the general public to certainagents in the environment.
Sensitization – A condition in which one is or becomes hypersensitive or reactive to an agent throughrepeated exposure.
Site preparation -- The removal of competition and conditioning of the soil to enhance the survival andgrowth of seedlings or to enhance the seed germination.
Species-to-species extrapolation -- A method involving the use of exposure data on one species (usuallyan experimental mammal) to estimate the effects of exposure in another species (usually humans).
Subchronic exposure -- An exposure duration that can last for different periods of time, but 90 days is themost common test duration. The subchronic study is usually performed in two species (rat and dog) by theroute of intended use or exposure.
Substrate -- With reference to enzymes, the chemical that the enzyme acts upon.
Synergistic effect -- A situation is which the combined effects of two chemicals is much greater than thesum of the effect of each agent given alone.
Systemic toxicity -- Effects that require absorption and distribution of a toxic agent to a site distant fromits entry point at which point effects are produced. Systemic effects are the obverse of local effects.
Teratogenic -- Causing structural defects that affect the development of an organism; causing birthdefects.
Teratology -- The study of malformations induced during development from conception to birth.
Terrestrial – Anything that lives on land as opposed to living in an aquatic environment.
Threshold -- The maximum dose or concentration level of a chemical or biological agent that will notcause an effect in the organism.
Thymus – A small gland that is the site of T-cell production. The gland is composed largely of lymphatictissue and is situated behind the breastbone. The gland play an important role in the human immunesystem.
Toxicity -- The inherent ability of an agent to affect living organisms adversely.
Uncertainty factor (UF) -- A factor used in operationally deriving the RfD and similar values fromexperimental data. UFs are intended to account or (1) the variation in sensitivity among members of thehuman population; (2) the uncertainty in extrapolating animal data to the case of humans; (3) theuncertainty in extrapolating from data obtained in a study that is less than lifetime exposure; and (4) theuncertainty in using LOAEL data rather than NOAEL data. Usually each of these factors is set equal to10. See table 2-4 for additional details.

6-9
Vehicle -- A substance (usually a liquid) used as a medium for suspending or dissolving the activeingredient. Commonly used vehicles include water, acetone, and corn oil.
Vertebrate -- An animal that has a spinal column (backbone).
Volatile -- Referring to compounds or substances that have a tendency to vaporize. A material that willevaporate quickly.
7-1
7. INDEX
Note: Page number starting with ClWS and HxWS refer to the worksheets for clopyralid andhexachlorobenzene, respectively. Page numbers starting with A refer to the appendices.
Aabsorbed dose . . . HxWS-5, HxWS-17, HxWS-18,
HxWS-21, HxWS-22, HxWS-23absorption . . . . . . HxWS-14, HxWS-16, HxWS-19,
HxWS-20, HxWS-21, HxWS-22, HxWS-23
accidental exposure . . . . . 3-6, 3-7, 3-9, 3-10, 3-13, 3-15, 3-31, 3-33, 3-34, 3-37,
4-7, ClWS-50, ClWS-51, ClWS-61, ClWS-62, HxWS-38, HxWS-39,
HxWS-40, HxWS-41accidental spills . . . . . . . . . . . 3-4, 3-10, 3-11, 4-18adjuvant . . . . . . . . . . . . . . . . . . . . . . . . . . 3-5, 5-2AEL . . . . . . . . . . . . . . . 3-2, 3-5, 3-26, 3-27, 3-28,
4-13, 4-14, 4-15, 4-16, 4-17, 4-19, 4-21, A4-4, ClWS-62
aerial application . . . . . . . . . 2-4, 2-5, 2-6, 3-6, 3-7, 3-13, 4-1, 4-10, 4-18, 4-21,
ClWS-10, HxWS-1, HxWS-8algae . . . . . . . . . . . . . . . . . . . 4-5, 4-13, 4-21, A5-2algal species . . . . . . . . . . . . . . . . . . . . . . . . . . 4-17allometric . . . . . . . . . . . . . . . . . . . . . . . . . 4-6, 4-9amphibian . . . . . . . . . . . . . . . . . . . . . . . . . 4-5, 4-7application rate . . HxWS-17, HxWS-18, HxWS-23,
HxWS-25, HxWS-26application method . . . . . . . . . . . . . . . 2-5, 3-6, 3-7aquatic animal . . . . . . . 4-1, 4-12, 4-13, 4-17, 4-18,
4-21aquatic invertebrate . . . 4-5, 4-13, 4-17, 5-15, A5-1aquatic plant . . . . . . . . . 4-1, 4-5, 4-12, 4-13, 4-17,
4-18, 4-21, 5-15, A5-1
Bbackpack . . . . . . . . . . . . . . . . HxWS-36, HxWS-37BCF . . . . . . 3-15, 3-21, 3-26, ClWS-23, ClWS-42,
ClWS-43, ClWS-44, ClWS-45, ClWS-46, HxWS-13, HxWS-29, HxWS-30,
HxWS-31, HxWS-33bees . . . . . . . . . . . . . . . . . . 4-1, 4-3, 4-7, 4-8, 4-15,
5-4, A3-1bioassay . . . . . . . . . . . . . . 3-1, 3-3, 3-27, 3-30, 4-2,
4-5, 4-13, 4-14, 4-15, 5-12
bioconcentration factor . . . . 3-15, 3-20, 3-21, 3-26,5-2, ClWS-23, ClWS-42, ClWS-43,
ClWS-45, ClWS-46, ClWS-47, HxWS-13, HxWS-29, HxWS-30,
HxWS-33birds . . . . . . . . . . . . . . . . . 4-1, 4-2, 4-3, 4-7, 4-13,
4-14, 4-15, 5-15, A2-1blood . . . . . . . . . . . . . . . . . . . . 3-1, 3-2, 3-36, A1-4boom spray . . . . . . . . . . . . . 2-4, 2-5, 3-6, 3-7, 3-9,
3-34, ClWS-11, ClWS-28, ClWS-48, ClWS-49, HxWS-2, HxWS-18, HxWS-35,
HxWS-36, HxWS-37broadcast foliar . . . . . . . . . . . . . . . . . . . . . 2-4, 2-5broadleaf . . . . . . . . . . . . . 2-4, 2-5, 4-1, 4-10, 4-13,
4-15, 4-19
Ccactus . . . . . . . . . . . . . . . . . . . . . . . . . . . . . . . 4-15cancer . . . . . . . . . . . . . 3-3, 3-17, 3-25, 3-26, 3-28,
3-30, 3-31, 3-32, 3-37, 3-38, 3-39, HxWS-2, HxWS-13, HxWS-36,
HxWS-40, HxWS-41carcinogen . . . . . . . . . . . . . 3-1, 3-3, 3-5, 3-6, 3-17,
3-26, 3-30, 3-31, 3-39carcinogenicity . . . . . . . . . . . . . 3-1, 3-3, 3-6, 3-26chemical background statement . . . . . . . . . . . . . 1-1cherry . . . . . . . . . . . . . . . . . . . . . . . . . . . . . . . A4-2child . . . . . . . . . . . . . . 3-12, 3-13, 3-35, ClWS-11,
ClWS-16, ClWS-31, ClWS-38, ClWS-50, ClWS-51, HxWS-2,
HxWS-6, HxWS-21, HxWS-27, HxWS-39, HxWS-40, HxWS-41
chronic exposure . . . . . . . . . . HxWS-2, HxWS-26, HxWS-32, HxWS-33
clay . . . . . . . . . . . . . . . 3-23, 3-24, 3-25, 4-4, 4-11, 4-16, 5-4, 5-9, A4-1, A4-2,
A7-3, A7-5, A7-6contaminated gloves . . 3-7, 3-10, 3-11, 3-32, 3-37,
ClWS-29, ClWS-48, ClWS-49, HxWS-19, HxWS-34,
HxWS-35, HxWS-36
contaminated vegetation . . . . . . . . . . . . HxWS-26, HxWS-38, HxWS-39,
7-2
HxWS-40, HxWS-41contaminated water . . . . . . . . ClWS-61, ClWS-62,
HxWS-2, HxWS-27, HxWS-28, HxWS-29, HxWS-32,
HxWS-38, HxWS-39, HxWS-40, HxWS-41conjunctiva . . . . . . . . . . . . . . . . . . . . . . . 3-3, A1-8connected actions . . . . . . . . . . . . . . . . . . . . . . 3-36contaminants . . . . . . . . . . . . . . 2-4, 2-5, 3-5, 3-27,
3-29, 3-30contaminated vegetation . . . . HxWS-26, HxWS-38,
HxWS-39, HxWS-40, HxWS-41contaminated water . . . . . . . . ClWS-61, ClWS-62,
HxWS-2, HxWS-27, HxWS-28, HxWS-29, HxWS-32, HxWS-38,
HxWS-39, HxWS-40, HxWS-41cornea . . . . . . . . . . . . . . . . . . . . . . . . . . . 3-3, A1-8
DDaphnia . . . . . . . 4-5, 4-12, 4-13, 4-17, 4-21, A5-1degradation . . . . . . . . . . . . . . HxWS-27, HxWS-29deposition . . . . . . . 3-4, 3-22, 3-23, 4-10, 5-3, A1-9dermal absorption . . . . . . . . . ClWS-52, ClWS-53,
HxWS-1, HxWS-14, HxWS-16, HxWS-19, HxWS-20, HxWS-21,
HxWS-22, HxWS-23dermal exposure . . . . . . . 3-3, 3-4, 3-9, 3-10, 3-12,
3-19, 4-6, 5-12, ClWS-11, ClWS-21, ClWS-29, ClWS-34, HxWS-2, HxWS-24
direct contact . . . . . . . . . . 3-10, 4-3, 4-6, 4-8, A3-1directed foliar . . . . . . . . 3-21, ClWS-11, ClWS-27,
HxWS-2, HxWS-17direct spray . . . . . . ClWS-55, ClWS-61, ClWS-62,
HxWS-2, HxWS-21, HxWS-22, HxWS-38, HxWS-39, HxWS-40,
HxWS-41dislodgeable residue . . . . . . . . . . . . 3-13, 4-8, 4-9,
ClWS-17, ClWS-33, HxWS-7, HxWS-23
distribution . . . . . . . . . . . 5-3, 5-11, 5-12, ClWS-23dissipation . . . . . . . . . . . . . . . ClWS-59, ClWS-60,
HxWS-23, HxWS-25, HxWS-27, HxWS-29
Eelectrochemical process . . 2-4, 3-1, 3-3, 4-2, A1-2,
A1-7, A1-8, A1-10embryo . . . . . . . . . . . . . . . . . . . . . . . . . . . . . . A1-3
eye . . . . . . . . . . . . . . . . . 3-3, 3-10, 3-31, 3-34, 5-2, 5-6, 5-8, 5-11, A1-8, A7-3
Ffeathers . . . . . . . . . . . . . . . . . . . . . . . . . . . 4-7, 4-9field concentration . . . . . . . . . . . . . 2-8, 3-13, 4-12,
ClWS-38, ClWS-39, ClWS-59, HxWS-28
FEL . . . . . . . . . . . . . . . . . . . . . . . . . . . . . . . . . . 5-4Fick's first law . . . . . . . . . . . . . . . . . 3-4, 3-10, 3-11fish . . . . . . . . . . . . . . . . . . . . . . . . . . . . . HxWS-41foliage . . . . . . . . . . . . . . . . . . . . . . . . . . 4-13, 4-17foliar absorption . . . . . . . . . . . . . . . . . . . . . . . . 4-3foliar application . . . . . . . 2-5, 3-21, 4-1, 4-3, 4-13,
4-17, 5-9forbes . . . . . . . . . . . . . . . . . . . . . . . . . . . . . . . 4-16formulation . . . . . . . . . . . . . 1-1, 2-4, 2-5, 3-5, 3-6,
3-16, 3-19, 4-2, 4-3, 4-12, 5-3, 5-8, A5-1
fruit . . . . . . . . . . . . . . . . . . . . HxWS-8, HxWS-25, HxWS-38, HxWS-39,
HxWS-40, HxWS-41fry . . . . . . . . . . . . . . . . . . . . . . . . . . . . . . . . . . . 4-5fur . . . . . . . . . . . . . . . . . . . . 1-1, 2-5, 2-6, 3-2, 3-3,
3-7, 3-8, 3-10, 3-20, 3-26, 3-39, 4-4, 4-9, 4-11, 4-12, 5-5
Ggavage . . . . . . . . . . . . . . . 3-2, 3-3, 4-2, 4-13, 4-19,
5-7, A1-1general public . . . . ClWS-43, ClWS-45, ClWS-46,
ClWS-50, ClWS-51, HxWS-1, HxWS-2, HxWS-6, HxWS-21,
HxWS-29, HxWS-30, HxWS-33, HxWS-38, HxWS-39, HxWS-40, HxWS-41
geometric mean . . . 3-9, 3-14, 4-9, A7-1, ClWS-36, ClWS-37, ClWS-57
germination . . . . . . . . . 4-5, 4-13, 4-17, 5-14, A4-4gestation . . . . . . . . . . . . . . . . . . . . . . . . A1-2, A1-3GLEAMS . . . . . . . . . . 3-23, 3-24, 5-8, 5-11, 5-15,
A7-1, A7-2, A7-3, A7-4, A7-5, HxWS-32, HxWS-33
gloves . . . . . . . . . . . . . 3-7, 3-10, 3-11, 3-32, 3-37, ClWS-29, ClWS-48, ClWS-49,
HxWS-19, HxWS-34, HxWS-35, HxWS-36grain . . . . . . . . . . . . . . 4-4, 4-13, 4-15, 4-18, 4-20,
4-21, 5-10, ClWS-18, HxWS-8
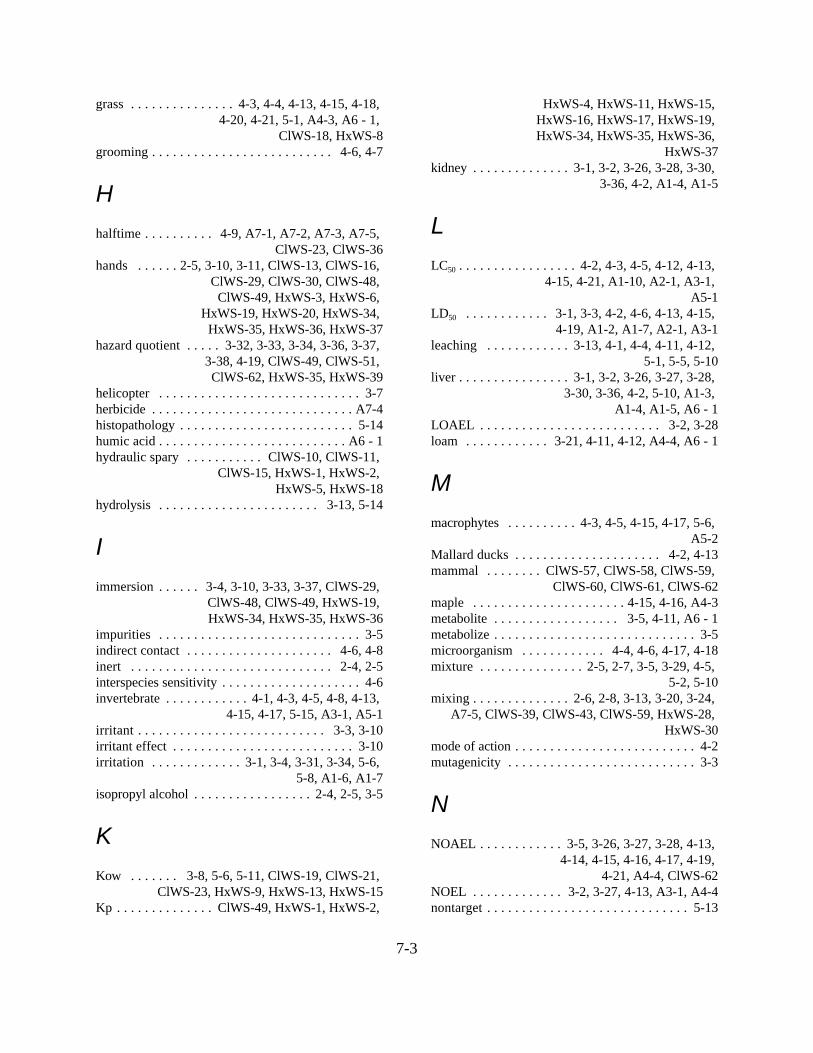
7-3
grass . . . . . . . . . . . . . . . 4-3, 4-4, 4-13, 4-15, 4-18, 4-20, 4-21, 5-1, A4-3, A6 - 1,
ClWS-18, HxWS-8grooming . . . . . . . . . . . . . . . . . . . . . . . . . . 4-6, 4-7
Hhalftime . . . . . . . . . . 4-9, A7-1, A7-2, A7-3, A7-5,
ClWS-23, ClWS-36hands . . . . . . 2-5, 3-10, 3-11, ClWS-13, ClWS-16,
ClWS-29, ClWS-30, ClWS-48, ClWS-49, HxWS-3, HxWS-6,
HxWS-19, HxWS-20, HxWS-34, HxWS-35, HxWS-36, HxWS-37
hazard quotient . . . . . 3-32, 3-33, 3-34, 3-36, 3-37, 3-38, 4-19, ClWS-49, ClWS-51, ClWS-62, HxWS-35, HxWS-39
helicopter . . . . . . . . . . . . . . . . . . . . . . . . . . . . . 3-7herbicide . . . . . . . . . . . . . . . . . . . . . . . . . . . . . A7-4histopathology . . . . . . . . . . . . . . . . . . . . . . . . . 5-14humic acid . . . . . . . . . . . . . . . . . . . . . . . . . . . A6 - 1hydraulic spary . . . . . . . . . . . ClWS-10, ClWS-11,
ClWS-15, HxWS-1, HxWS-2, HxWS-5, HxWS-18
hydrolysis . . . . . . . . . . . . . . . . . . . . . . . 3-13, 5-14
Iimmersion . . . . . . 3-4, 3-10, 3-33, 3-37, ClWS-29,
ClWS-48, ClWS-49, HxWS-19, HxWS-34, HxWS-35, HxWS-36
impurities . . . . . . . . . . . . . . . . . . . . . . . . . . . . . 3-5indirect contact . . . . . . . . . . . . . . . . . . . . . 4-6, 4-8inert . . . . . . . . . . . . . . . . . . . . . . . . . . . . . 2-4, 2-5interspecies sensitivity . . . . . . . . . . . . . . . . . . . . 4-6invertebrate . . . . . . . . . . . . 4-1, 4-3, 4-5, 4-8, 4-13,
4-15, 4-17, 5-15, A3-1, A5-1irritant . . . . . . . . . . . . . . . . . . . . . . . . . . . 3-3, 3-10irritant effect . . . . . . . . . . . . . . . . . . . . . . . . . . 3-10irritation . . . . . . . . . . . . . 3-1, 3-4, 3-31, 3-34, 5-6,
5-8, A1-6, A1-7isopropyl alcohol . . . . . . . . . . . . . . . . . 2-4, 2-5, 3-5
KKow . . . . . . . 3-8, 5-6, 5-11, ClWS-19, ClWS-21,
ClWS-23, HxWS-9, HxWS-13, HxWS-15Kp . . . . . . . . . . . . . . ClWS-49, HxWS-1, HxWS-2,
HxWS-4, HxWS-11, HxWS-15, HxWS-16, HxWS-17, HxWS-19, HxWS-34, HxWS-35, HxWS-36,
HxWS-37kidney . . . . . . . . . . . . . . 3-1, 3-2, 3-26, 3-28, 3-30,
3-36, 4-2, A1-4, A1-5
LLC50 . . . . . . . . . . . . . . . . . 4-2, 4-3, 4-5, 4-12, 4-13,
4-15, 4-21, A1-10, A2-1, A3-1, A5-1
LD50 . . . . . . . . . . . . 3-1, 3-3, 4-2, 4-6, 4-13, 4-15, 4-19, A1-2, A1-7, A2-1, A3-1
leaching . . . . . . . . . . . . 3-13, 4-1, 4-4, 4-11, 4-12, 5-1, 5-5, 5-10
liver . . . . . . . . . . . . . . . . 3-1, 3-2, 3-26, 3-27, 3-28, 3-30, 3-36, 4-2, 5-10, A1-3,
A1-4, A1-5, A6 - 1LOAEL . . . . . . . . . . . . . . . . . . . . . . . . . . 3-2, 3-28loam . . . . . . . . . . . . 3-21, 4-11, 4-12, A4-4, A6 - 1
Mmacrophytes . . . . . . . . . . 4-3, 4-5, 4-15, 4-17, 5-6,
A5-2Mallard ducks . . . . . . . . . . . . . . . . . . . . . 4-2, 4-13mammal . . . . . . . . ClWS-57, ClWS-58, ClWS-59,
ClWS-60, ClWS-61, ClWS-62maple . . . . . . . . . . . . . . . . . . . . . . 4-15, 4-16, A4-3metabolite . . . . . . . . . . . . . . . . . . 3-5, 4-11, A6 - 1metabolize . . . . . . . . . . . . . . . . . . . . . . . . . . . . . 3-5microorganism . . . . . . . . . . . . 4-4, 4-6, 4-17, 4-18mixture . . . . . . . . . . . . . . . 2-5, 2-7, 3-5, 3-29, 4-5,
5-2, 5-10mixing . . . . . . . . . . . . . . 2-6, 2-8, 3-13, 3-20, 3-24,
A7-5, ClWS-39, ClWS-43, ClWS-59, HxWS-28, HxWS-30
mode of action . . . . . . . . . . . . . . . . . . . . . . . . . . 4-2mutagenicity . . . . . . . . . . . . . . . . . . . . . . . . . . . 3-3
NNOAEL . . . . . . . . . . . . 3-5, 3-26, 3-27, 3-28, 4-13,
4-14, 4-15, 4-16, 4-17, 4-19, 4-21, A4-4, ClWS-62
NOEL . . . . . . . . . . . . . 3-2, 3-27, 4-13, A3-1, A4-4nontarget . . . . . . . . . . . . . . . . . . . . . . . . . . . . . 5-13
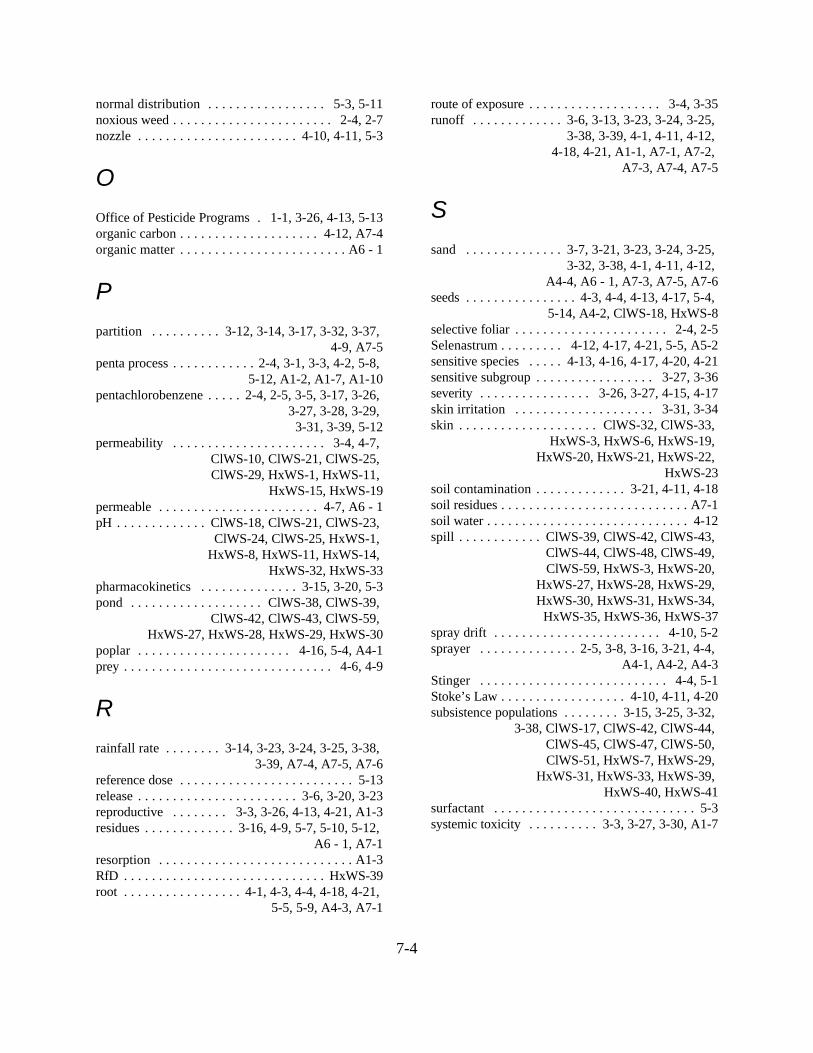
7-4
normal distribution . . . . . . . . . . . . . . . . . 5-3, 5-11noxious weed . . . . . . . . . . . . . . . . . . . . . . . 2-4, 2-7nozzle . . . . . . . . . . . . . . . . . . . . . . . 4-10, 4-11, 5-3
OOffice of Pesticide Programs . 1-1, 3-26, 4-13, 5-13organic carbon . . . . . . . . . . . . . . . . . . . . 4-12, A7-4organic matter . . . . . . . . . . . . . . . . . . . . . . . . A6 - 1
Ppartition . . . . . . . . . . 3-12, 3-14, 3-17, 3-32, 3-37,
4-9, A7-5penta process . . . . . . . . . . . . 2-4, 3-1, 3-3, 4-2, 5-8,
5-12, A1-2, A1-7, A1-10pentachlorobenzene . . . . . 2-4, 2-5, 3-5, 3-17, 3-26,
3-27, 3-28, 3-29, 3-31, 3-39, 5-12
permeability . . . . . . . . . . . . . . . . . . . . . . 3-4, 4-7, ClWS-10, ClWS-21, ClWS-25, ClWS-29, HxWS-1, HxWS-11,
HxWS-15, HxWS-19permeable . . . . . . . . . . . . . . . . . . . . . . . 4-7, A6 - 1pH . . . . . . . . . . . . . ClWS-18, ClWS-21, ClWS-23,
ClWS-24, ClWS-25, HxWS-1, HxWS-8, HxWS-11, HxWS-14,
HxWS-32, HxWS-33pharmacokinetics . . . . . . . . . . . . . . 3-15, 3-20, 5-3pond . . . . . . . . . . . . . . . . . . . ClWS-38, ClWS-39,
ClWS-42, ClWS-43, ClWS-59, HxWS-27, HxWS-28, HxWS-29, HxWS-30
poplar . . . . . . . . . . . . . . . . . . . . . . 4-16, 5-4, A4-1prey . . . . . . . . . . . . . . . . . . . . . . . . . . . . . . 4-6, 4-9
Rrainfall rate . . . . . . . . 3-14, 3-23, 3-24, 3-25, 3-38,
3-39, A7-4, A7-5, A7-6reference dose . . . . . . . . . . . . . . . . . . . . . . . . . 5-13release . . . . . . . . . . . . . . . . . . . . . . . 3-6, 3-20, 3-23reproductive . . . . . . . . 3-3, 3-26, 4-13, 4-21, A1-3residues . . . . . . . . . . . . . 3-16, 4-9, 5-7, 5-10, 5-12,
A6 - 1, A7-1resorption . . . . . . . . . . . . . . . . . . . . . . . . . . . . A1-3RfD . . . . . . . . . . . . . . . . . . . . . . . . . . . . . HxWS-39root . . . . . . . . . . . . . . . . . 4-1, 4-3, 4-4, 4-18, 4-21,
5-5, 5-9, A4-3, A7-1
route of exposure . . . . . . . . . . . . . . . . . . . 3-4, 3-35runoff . . . . . . . . . . . . . 3-6, 3-13, 3-23, 3-24, 3-25,
3-38, 3-39, 4-1, 4-11, 4-12, 4-18, 4-21, A1-1, A7-1, A7-2,
A7-3, A7-4, A7-5
Ssand . . . . . . . . . . . . . . 3-7, 3-21, 3-23, 3-24, 3-25,
3-32, 3-38, 4-1, 4-11, 4-12, A4-4, A6 - 1, A7-3, A7-5, A7-6
seeds . . . . . . . . . . . . . . . . 4-3, 4-4, 4-13, 4-17, 5-4, 5-14, A4-2, ClWS-18, HxWS-8
selective foliar . . . . . . . . . . . . . . . . . . . . . . 2-4, 2-5Selenastrum . . . . . . . . . 4-12, 4-17, 4-21, 5-5, A5-2sensitive species . . . . . 4-13, 4-16, 4-17, 4-20, 4-21sensitive subgroup . . . . . . . . . . . . . . . . . 3-27, 3-36severity . . . . . . . . . . . . . . . . 3-26, 3-27, 4-15, 4-17skin irritation . . . . . . . . . . . . . . . . . . . . 3-31, 3-34skin . . . . . . . . . . . . . . . . . . . . ClWS-32, ClWS-33,
HxWS-3, HxWS-6, HxWS-19, HxWS-20, HxWS-21, HxWS-22,
HxWS-23soil contamination . . . . . . . . . . . . . 3-21, 4-11, 4-18soil residues . . . . . . . . . . . . . . . . . . . . . . . . . . . A7-1soil water . . . . . . . . . . . . . . . . . . . . . . . . . . . . . 4-12spill . . . . . . . . . . . . ClWS-39, ClWS-42, ClWS-43,
ClWS-44, ClWS-48, ClWS-49, ClWS-59, HxWS-3, HxWS-20,
HxWS-27, HxWS-28, HxWS-29, HxWS-30, HxWS-31, HxWS-34,
HxWS-35, HxWS-36, HxWS-37spray drift . . . . . . . . . . . . . . . . . . . . . . . . 4-10, 5-2sprayer . . . . . . . . . . . . . . 2-5, 3-8, 3-16, 3-21, 4-4,
A4-1, A4-2, A4-3Stinger . . . . . . . . . . . . . . . . . . . . . . . . . . . 4-4, 5-1Stoke’s Law . . . . . . . . . . . . . . . . . . 4-10, 4-11, 4-20subsistence populations . . . . . . . . 3-15, 3-25, 3-32,
3-38, ClWS-17, ClWS-42, ClWS-44, ClWS-45, ClWS-47, ClWS-50, ClWS-51, HxWS-7, HxWS-29,
HxWS-31, HxWS-33, HxWS-39, HxWS-40, HxWS-41
surfactant . . . . . . . . . . . . . . . . . . . . . . . . . . . . . 5-3systemic toxicity . . . . . . . . . . 3-3, 3-27, 3-30, A1-7
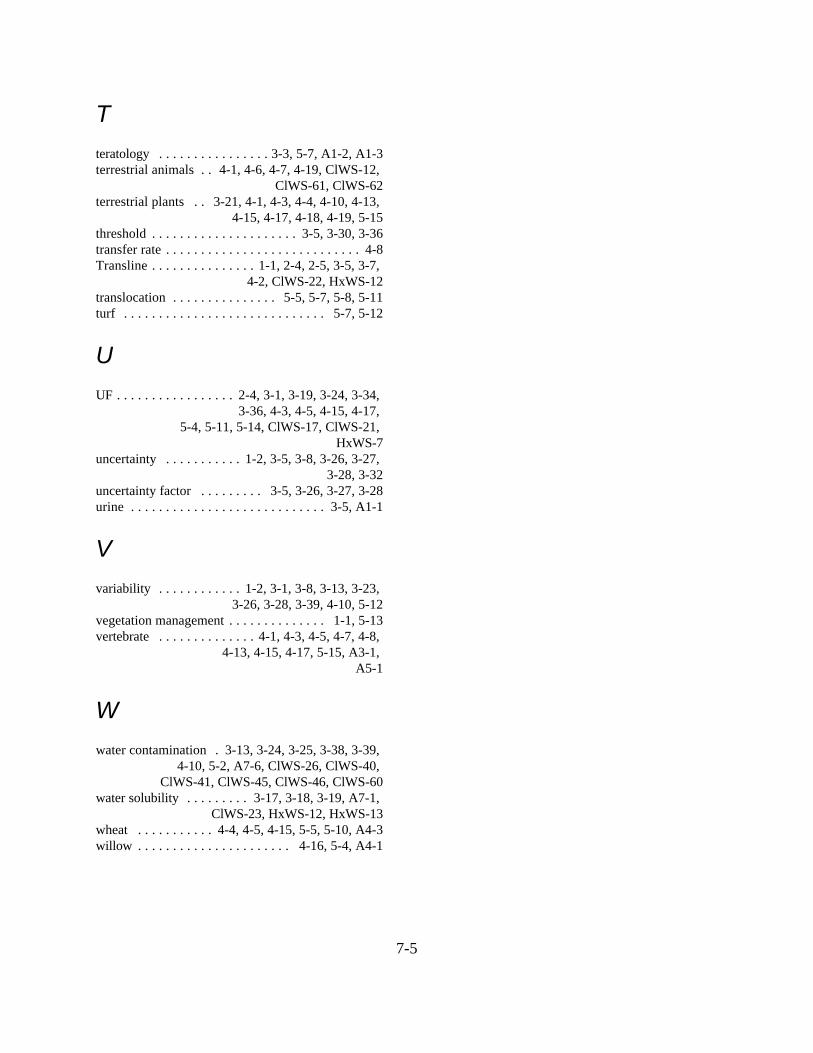
7-5
Tteratology . . . . . . . . . . . . . . . . 3-3, 5-7, A1-2, A1-3terrestrial animals . . 4-1, 4-6, 4-7, 4-19, ClWS-12,
ClWS-61, ClWS-62terrestrial plants . . 3-21, 4-1, 4-3, 4-4, 4-10, 4-13,
4-15, 4-17, 4-18, 4-19, 5-15threshold . . . . . . . . . . . . . . . . . . . . . 3-5, 3-30, 3-36transfer rate . . . . . . . . . . . . . . . . . . . . . . . . . . . . 4-8Transline . . . . . . . . . . . . . . . 1-1, 2-4, 2-5, 3-5, 3-7,
4-2, ClWS-22, HxWS-12translocation . . . . . . . . . . . . . . . 5-5, 5-7, 5-8, 5-11turf . . . . . . . . . . . . . . . . . . . . . . . . . . . . . 5-7, 5-12
UUF . . . . . . . . . . . . . . . . . 2-4, 3-1, 3-19, 3-24, 3-34,
3-36, 4-3, 4-5, 4-15, 4-17, 5-4, 5-11, 5-14, ClWS-17, ClWS-21,
HxWS-7uncertainty . . . . . . . . . . . 1-2, 3-5, 3-8, 3-26, 3-27,
3-28, 3-32uncertainty factor . . . . . . . . . 3-5, 3-26, 3-27, 3-28urine . . . . . . . . . . . . . . . . . . . . . . . . . . . . 3-5, A1-1
Vvariability . . . . . . . . . . . . 1-2, 3-1, 3-8, 3-13, 3-23,
3-26, 3-28, 3-39, 4-10, 5-12vegetation management . . . . . . . . . . . . . . 1-1, 5-13vertebrate . . . . . . . . . . . . . . 4-1, 4-3, 4-5, 4-7, 4-8,
4-13, 4-15, 4-17, 5-15, A3-1, A5-1
Wwater contamination . 3-13, 3-24, 3-25, 3-38, 3-39,
4-10, 5-2, A7-6, ClWS-26, ClWS-40, ClWS-41, ClWS-45, ClWS-46, ClWS-60
water solubility . . . . . . . . . 3-17, 3-18, 3-19, A7-1, ClWS-23, HxWS-12, HxWS-13
wheat . . . . . . . . . . . 4-4, 4-5, 4-15, 5-5, 5-10, A4-3willow . . . . . . . . . . . . . . . . . . . . . . 4-16, 5-4, A4-1
APPENDICES
Appendix 1: Toxicity of clopyralid to mammals.Appendix 2: Toxicity of clopyralid to birds after oral administration.Appendix 3: Toxicity of clopyralid to terrestrial invertebrates.Appendix 4: Toxicity of clopyralid to non-target terrestrial plants.Appendix 5: Toxicity to fish, aquatic invertebrates, and aquatic plants.Appendix 6: Field studies on the fate of clopyralid in soil.Appendix 7: GLEAMS modeling of hexachlorobenzene runoff.
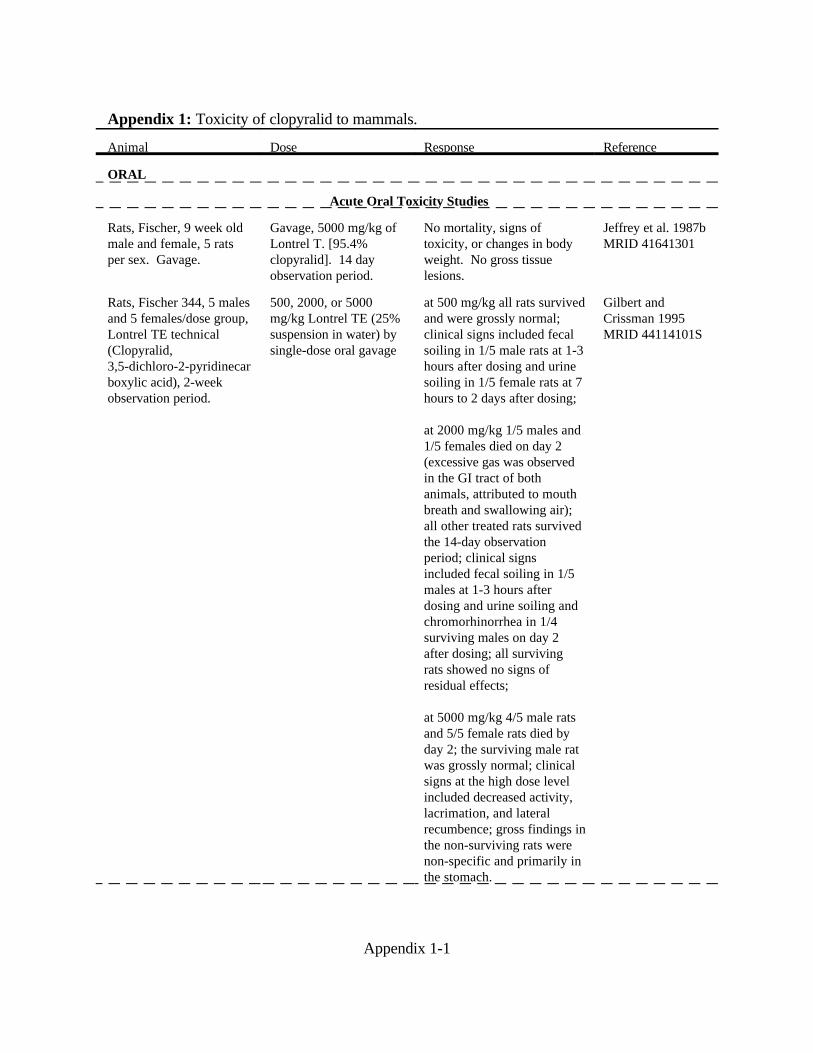
Appendix 1-1
Appendix 1: Toxicity of clopyralid to mammals.
Animal Dose Response Reference
ORAL
Acute Oral Toxicity Studies
Rats, Fischer, 9 week oldmale and female, 5 ratsper sex. Gavage.
Gavage, 5000 mg/kg ofLontrel T. [95.4%clopyralid]. 14 dayobservation period.
No mortality, signs oftoxicity, or changes in bodyweight. No gross tissuelesions.
Jeffrey et al. 1987bMRID 41641301
Rats, Fischer 344, 5 malesand 5 females/dose group,Lontrel TE technical(Clopyralid,3,5-dichloro-2-pyridinecarboxylic acid), 2-weekobservation period.
500, 2000, or 5000mg/kg Lontrel TE (25%suspension in water) bysingle-dose oral gavage
at 500 mg/kg all rats survivedand were grossly normal;clinical signs included fecalsoiling in 1/5 male rats at 1-3hours after dosing and urinesoiling in 1/5 female rats at 7hours to 2 days after dosing;
at 2000 mg/kg 1/5 males and1/5 females died on day 2(excessive gas was observedin the GI tract of bothanimals, attributed to mouthbreath and swallowing air);all other treated rats survivedthe 14-day observationperiod; clinical signsincluded fecal soiling in 1/5males at 1-3 hours afterdosing and urine soiling andchromorhinorrhea in 1/4surviving males on day 2 after dosing; all survivingrats showed no signs ofresidual effects;
at 5000 mg/kg 4/5 male ratsand 5/5 female rats died byday 2; the surviving male ratwas grossly normal; clinicalsigns at the high dose levelincluded decreased activity,lacrimation, and lateralrecumbence; gross findings inthe non-surviving rats werenon-specific and primarily inthe stomach.
Gilbert andCrissman 1995MRID 44114101S
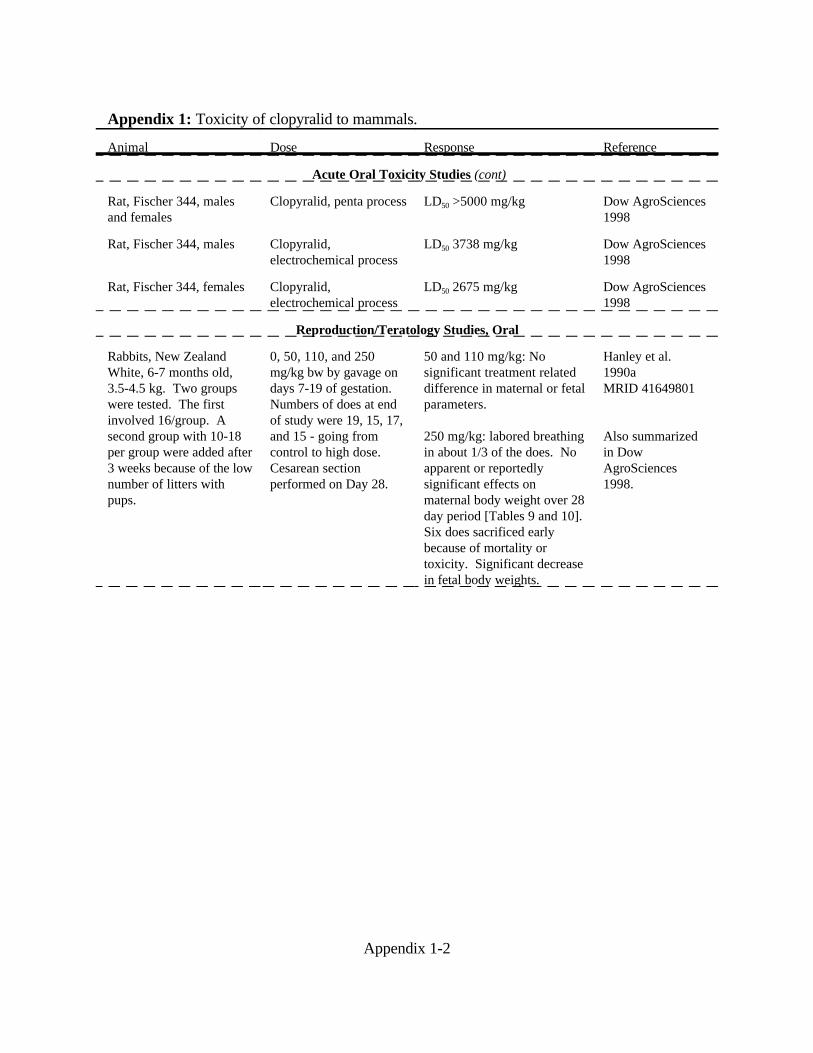
Appendix 1: Toxicity of clopyralid to mammals.
Animal Dose Response Reference
Appendix 1-2
Acute Oral Toxicity Studies (cont)
Rat, Fischer 344, malesand females
Clopyralid, penta process LD50 >5000 mg/kg Dow AgroSciences1998
Rat, Fischer 344, males Clopyralid,electrochemical process
LD50 3738 mg/kg Dow AgroSciences1998
Rat, Fischer 344, females Clopyralid,electrochemical process
LD50 2675 mg/kg Dow AgroSciences1998
Reproduction/Teratology Studies, Oral
Rabbits, New ZealandWhite, 6-7 months old,3.5-4.5 kg. Two groupswere tested. The firstinvolved 16/group. Asecond group with 10-18per group were added after3 weeks because of the lownumber of litters withpups.
0, 50, 110, and 250mg/kg bw by gavage ondays 7-19 of gestation. Numbers of does at endof study were 19, 15, 17,and 15 - going fromcontrol to high dose.Cesarean sectionperformed on Day 28.
50 and 110 mg/kg: Nosignificant treatment relateddifference in maternal or fetalparameters.
250 mg/kg: labored breathingin about 1/3 of the does. Noapparent or reportedlysignificant effects onmaternal body weight over 28day period [Tables 9 and 10]. Six does sacrificed earlybecause of mortality ortoxicity. Significant decreasein fetal body weights.
Hanley et al.1990aMRID 41649801
Also summarizedin DowAgroSciences1998.
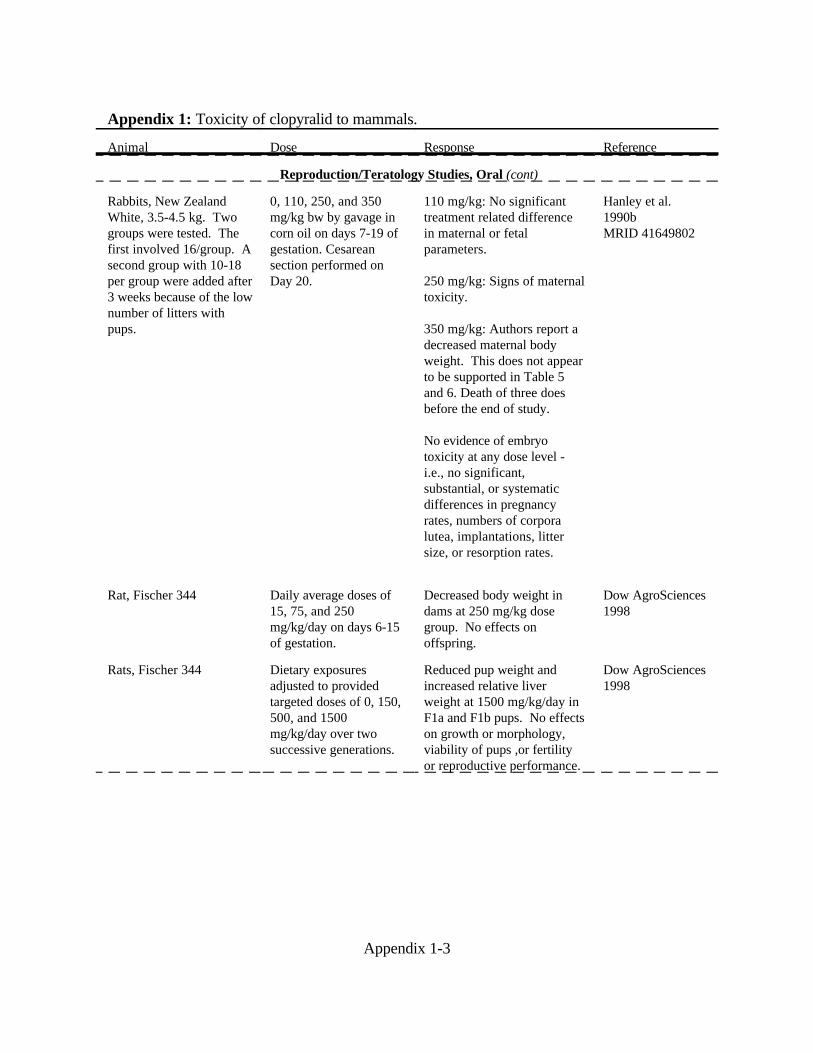
Appendix 1: Toxicity of clopyralid to mammals.
Animal Dose Response Reference
Appendix 1-3
Reproduction/Teratology Studies, Oral (cont)
Rabbits, New ZealandWhite, 3.5-4.5 kg. Twogroups were tested. Thefirst involved 16/group. Asecond group with 10-18per group were added after3 weeks because of the lownumber of litters withpups.
0, 110, 250, and 350mg/kg bw by gavage incorn oil on days 7-19 ofgestation. Cesareansection performed onDay 20.
110 mg/kg: No significanttreatment related differencein maternal or fetalparameters.
250 mg/kg: Signs of maternaltoxicity.
350 mg/kg: Authors report adecreased maternal bodyweight. This does not appearto be supported in Table 5and 6. Death of three doesbefore the end of study.
No evidence of embryotoxicity at any dose level -i.e., no significant,substantial, or systematicdifferences in pregnancyrates, numbers of corporalutea, implantations, littersize, or resorption rates.
Hanley et al.1990bMRID 41649802
Rat, Fischer 344 Daily average doses of15, 75, and 250mg/kg/day on days 6-15of gestation.
Decreased body weight indams at 250 mg/kg dosegroup. No effects onoffspring.
Dow AgroSciences1998
Rats, Fischer 344 Dietary exposuresadjusted to providedtargeted doses of 0, 150, 500, and 1500mg/kg/day over twosuccessive generations.
Reduced pup weight andincreased relative liverweight at 1500 mg/kg/day inF1a and F1b pups. No effectson growth or morphology,viability of pups ,or fertilityor reproductive performance.
Dow AgroSciences1998
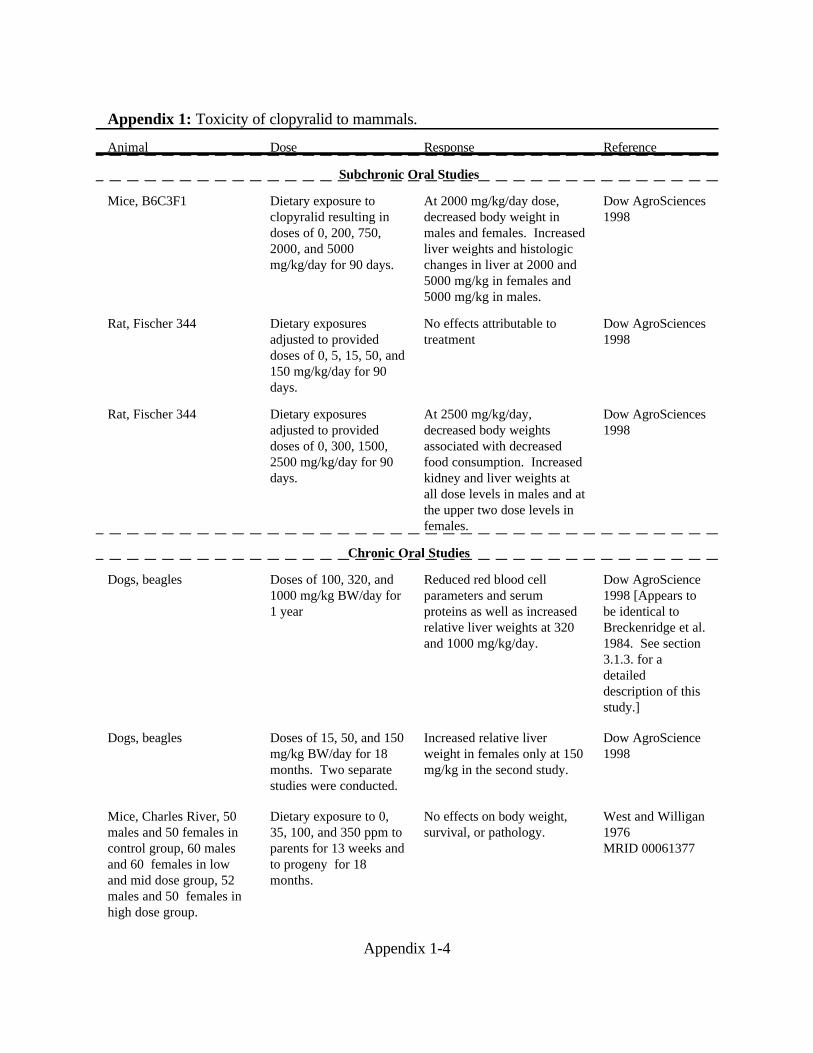
Appendix 1: Toxicity of clopyralid to mammals.
Animal Dose Response Reference
Appendix 1-4
Subchronic Oral Studies
Mice, B6C3F1 Dietary exposure toclopyralid resulting indoses of 0, 200, 750,2000, and 5000mg/kg/day for 90 days.
At 2000 mg/kg/day dose,decreased body weight inmales and females. Increasedliver weights and histologicchanges in liver at 2000 and5000 mg/kg in females and5000 mg/kg in males.
Dow AgroSciences1998
Rat, Fischer 344 Dietary exposuresadjusted to provideddoses of 0, 5, 15, 50, and150 mg/kg/day for 90days.
No effects attributable totreatment
Dow AgroSciences1998
Rat, Fischer 344 Dietary exposuresadjusted to provideddoses of 0, 300, 1500,2500 mg/kg/day for 90days.
At 2500 mg/kg/day,decreased body weightsassociated with decreasedfood consumption. Increasedkidney and liver weights atall dose levels in males and atthe upper two dose levels infemales.
Dow AgroSciences1998
Chronic Oral Studies
Dogs, beagles Doses of 100, 320, and1000 mg/kg BW/day for1 year
Reduced red blood cellparameters and serumproteins as well as increasedrelative liver weights at 320and 1000 mg/kg/day.
Dow AgroScience1998 [Appears tobe identical toBreckenridge et al.1984. See section3.1.3. for adetaileddescription of thisstudy.]
Dogs, beagles Doses of 15, 50, and 150mg/kg BW/day for 18months. Two separatestudies were conducted.
Increased relative liverweight in females only at 150mg/kg in the second study.
Dow AgroScience1998
Mice, Charles River, 50males and 50 females incontrol group, 60 malesand 60 females in lowand mid dose group, 52males and 50 females inhigh dose group.
Dietary exposure to 0,35, 100, and 350 ppm toparents for 13 weeks andto progeny for 18months.
No effects on body weight,survival, or pathology.
West and Willigan1976MRID 00061377
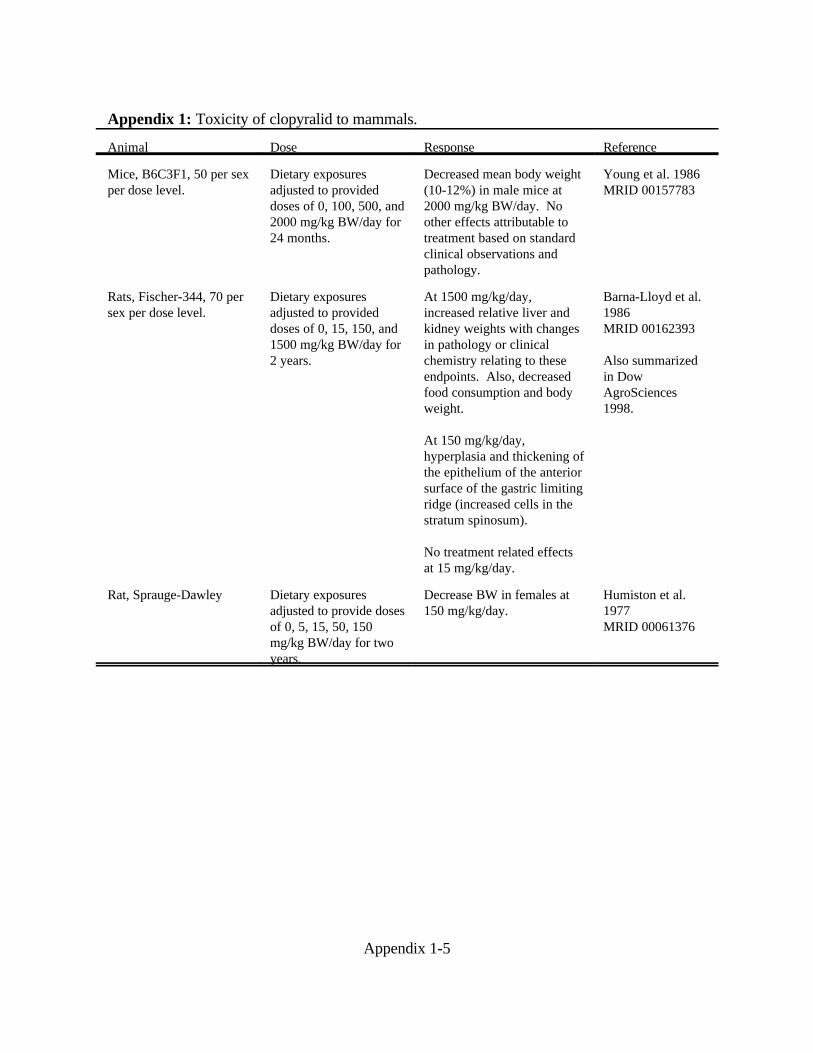
Appendix 1: Toxicity of clopyralid to mammals.
Animal Dose Response Reference
Appendix 1-5
Mice, B6C3F1, 50 per sexper dose level.
Dietary exposuresadjusted to provideddoses of 0, 100, 500, and2000 mg/kg BW/day for24 months.
Decreased mean body weight(10-12%) in male mice at2000 mg/kg BW/day. Noother effects attributable totreatment based on standardclinical observations andpathology.
Young et al. 1986MRID 00157783
Rats, Fischer-344, 70 persex per dose level.
Dietary exposuresadjusted to provideddoses of 0, 15, 150, and1500 mg/kg BW/day for2 years.
At 1500 mg/kg/day,increased relative liver andkidney weights with changesin pathology or clinicalchemistry relating to theseendpoints. Also, decreasedfood consumption and bodyweight.
At 150 mg/kg/day,hyperplasia and thickening ofthe epithelium of the anteriorsurface of the gastric limitingridge (increased cells in thestratum spinosum).
No treatment related effectsat 15 mg/kg/day.
Barna-Lloyd et al.1986MRID 00162393
Also summarizedin DowAgroSciences1998.
Rat, Sprauge-Dawley Dietary exposuresadjusted to provide dosesof 0, 5, 15, 50, 150mg/kg BW/day for twoyears.
Decrease BW in females at150 mg/kg/day.
Humiston et al.1977MRID 00061376
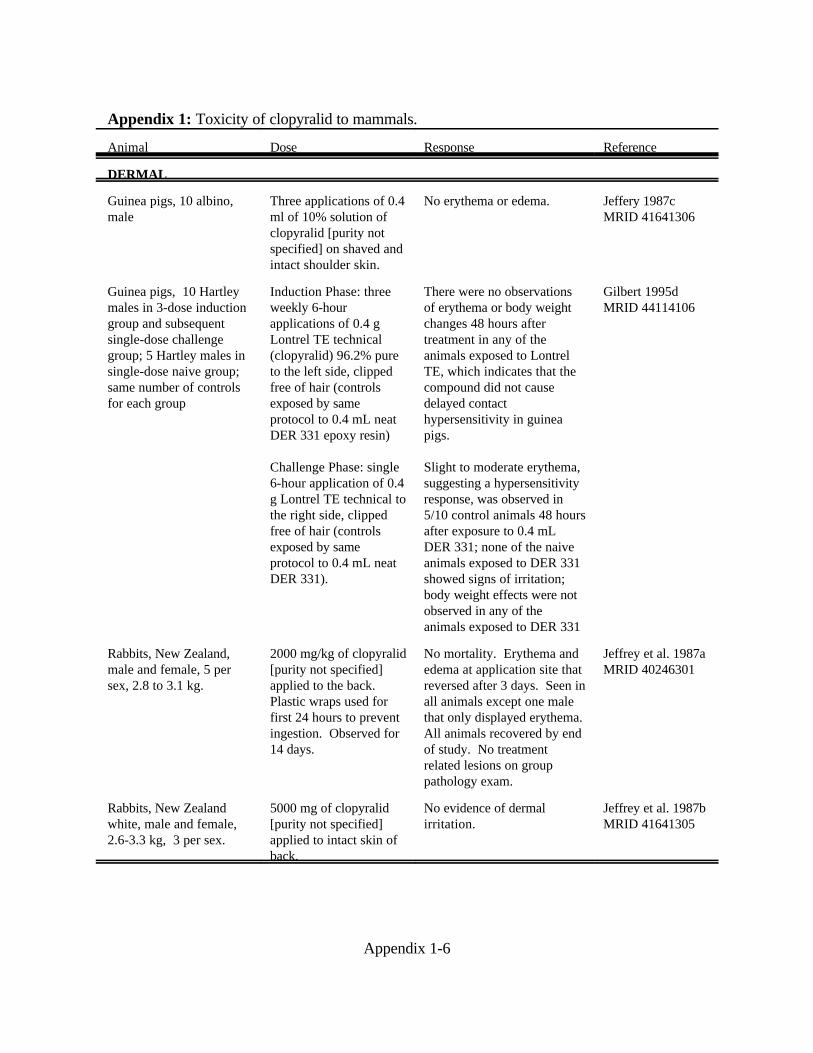
Appendix 1: Toxicity of clopyralid to mammals.
Animal Dose Response Reference
Appendix 1-6
DERMAL
Guinea pigs, 10 albino,male
Three applications of 0.4ml of 10% solution ofclopyralid [purity notspecified] on shaved andintact shoulder skin.
No erythema or edema. Jeffery 1987cMRID 41641306
Guinea pigs, 10 Hartleymales in 3-dose inductiongroup and subsequentsingle-dose challengegroup; 5 Hartley males insingle-dose naive group;same number of controlsfor each group
Induction Phase: threeweekly 6-hourapplications of 0.4 gLontrel TE technical(clopyralid) 96.2% pureto the left side, clippedfree of hair (controlsexposed by sameprotocol to 0.4 mL neatDER 331 epoxy resin)
Challenge Phase: single6-hour application of 0.4g Lontrel TE technical tothe right side, clippedfree of hair (controlsexposed by sameprotocol to 0.4 mL neatDER 331).
There were no observationsof erythema or body weightchanges 48 hours aftertreatment in any of theanimals exposed to LontrelTE, which indicates that thecompound did not causedelayed contacthypersensitivity in guineapigs.
Slight to moderate erythema,suggesting a hypersensitivityresponse, was observed in5/10 control animals 48 hoursafter exposure to 0.4 mLDER 331; none of the naiveanimals exposed to DER 331showed signs of irritation;body weight effects were notobserved in any of theanimals exposed to DER 331
Gilbert 1995dMRID 44114106
Rabbits, New Zealand,male and female, 5 persex, 2.8 to 3.1 kg.
2000 mg/kg of clopyralid[purity not specified]applied to the back. Plastic wraps used forfirst 24 hours to preventingestion. Observed for14 days.
No mortality. Erythema andedema at application site thatreversed after 3 days. Seen inall animals except one malethat only displayed erythema. All animals recovered by endof study. No treatmentrelated lesions on grouppathology exam.
Jeffrey et al. 1987aMRID 40246301
Rabbits, New Zealandwhite, male and female,2.6-3.3 kg, 3 per sex.
5000 mg of clopyralid[purity not specified]applied to intact skin ofback.
No evidence of dermalirritation.
Jeffrey et al. 1987bMRID 41641305
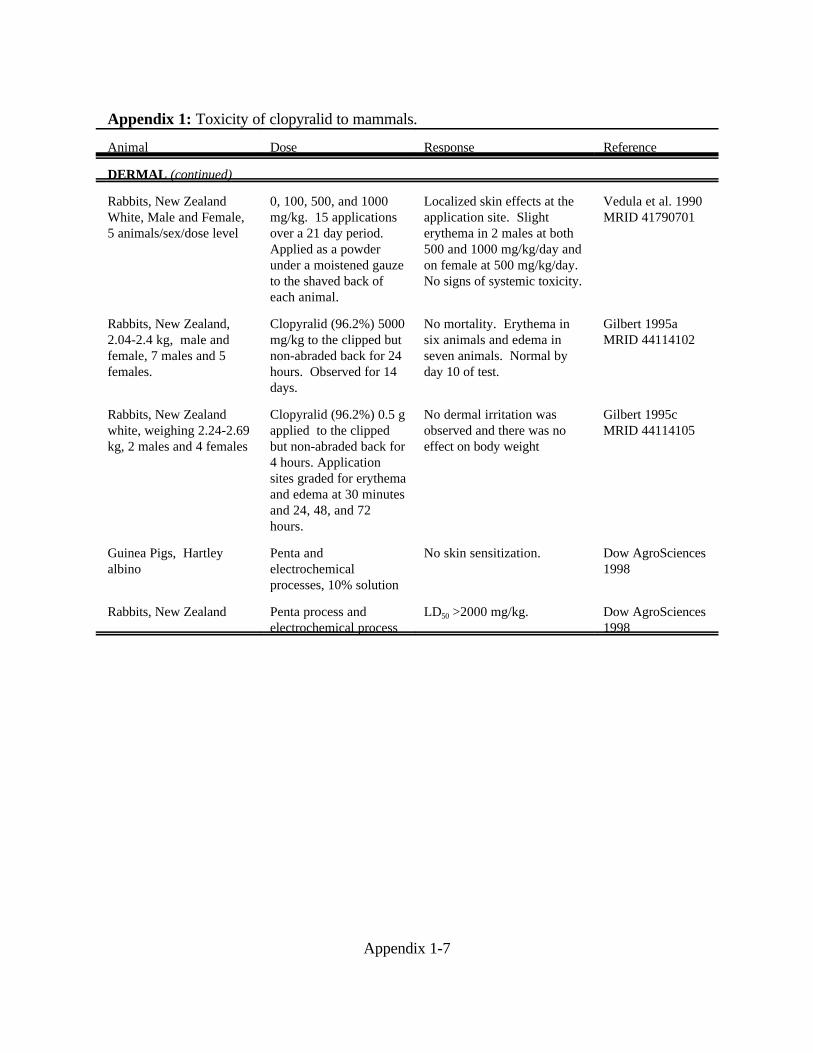
Appendix 1: Toxicity of clopyralid to mammals.
Animal Dose Response Reference
Appendix 1-7
DERMAL (continued)
Rabbits, New ZealandWhite, Male and Female,5 animals/sex/dose level
0, 100, 500, and 1000mg/kg. 15 applicationsover a 21 day period. Applied as a powderunder a moistened gauzeto the shaved back ofeach animal.
Localized skin effects at theapplication site. Slighterythema in 2 males at both500 and 1000 mg/kg/day andon female at 500 mg/kg/day.No signs of systemic toxicity.
Vedula et al. 1990MRID 41790701
Rabbits, New Zealand,2.04-2.4 kg, male andfemale, 7 males and 5females.
Clopyralid (96.2%) 5000mg/kg to the clipped butnon-abraded back for 24hours. Observed for 14days.
No mortality. Erythema insix animals and edema inseven animals. Normal byday 10 of test.
Gilbert 1995aMRID 44114102
Rabbits, New Zealandwhite, weighing 2.24-2.69kg, 2 males and 4 females
Clopyralid (96.2%) 0.5 gapplied to the clippedbut non-abraded back for4 hours. Applicationsites graded for erythemaand edema at 30 minutesand 24, 48, and 72hours.
No dermal irritation wasobserved and there was noeffect on body weight
Gilbert 1995cMRID 44114105
Guinea Pigs, Hartleyalbino
Penta andelectrochemicalprocesses, 10% solution
No skin sensitization. Dow AgroSciences1998
Rabbits, New Zealand Penta process andelectrochemical process
LD50 >2000 mg/kg. Dow AgroSciences1998
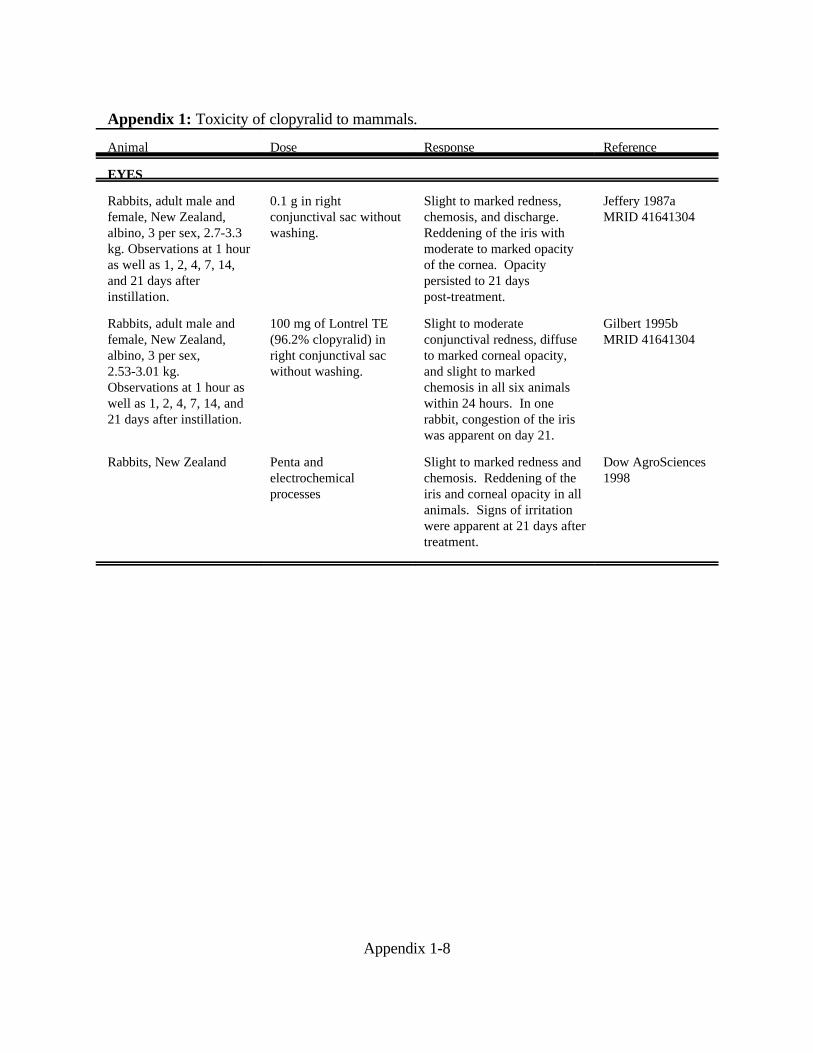
Appendix 1: Toxicity of clopyralid to mammals.
Animal Dose Response Reference
Appendix 1-8
EYES
Rabbits, adult male andfemale, New Zealand,albino, 3 per sex, 2.7-3.3kg. Observations at 1 houras well as 1, 2, 4, 7, 14,and 21 days afterinstillation.
0.1 g in rightconjunctival sac withoutwashing.
Slight to marked redness, chemosis, and discharge. Reddening of the iris withmoderate to marked opacityof the cornea. Opacitypersisted to 21 dayspost-treatment.
Jeffery 1987aMRID 41641304
Rabbits, adult male andfemale, New Zealand,albino, 3 per sex,2.53-3.01 kg.Observations at 1 hour aswell as 1, 2, 4, 7, 14, and21 days after instillation.
100 mg of Lontrel TE(96.2% clopyralid) inright conjunctival sacwithout washing.
Slight to moderateconjunctival redness, diffuseto marked corneal opacity,and slight to markedchemosis in all six animalswithin 24 hours. In onerabbit, congestion of the iriswas apparent on day 21.
Gilbert 1995bMRID 41641304
Rabbits, New Zealand Penta andelectrochemicalprocesses
Slight to marked redness andchemosis. Reddening of theiris and corneal opacity in allanimals. Signs of irritationwere apparent at 21 days aftertreatment.
Dow AgroSciences1998
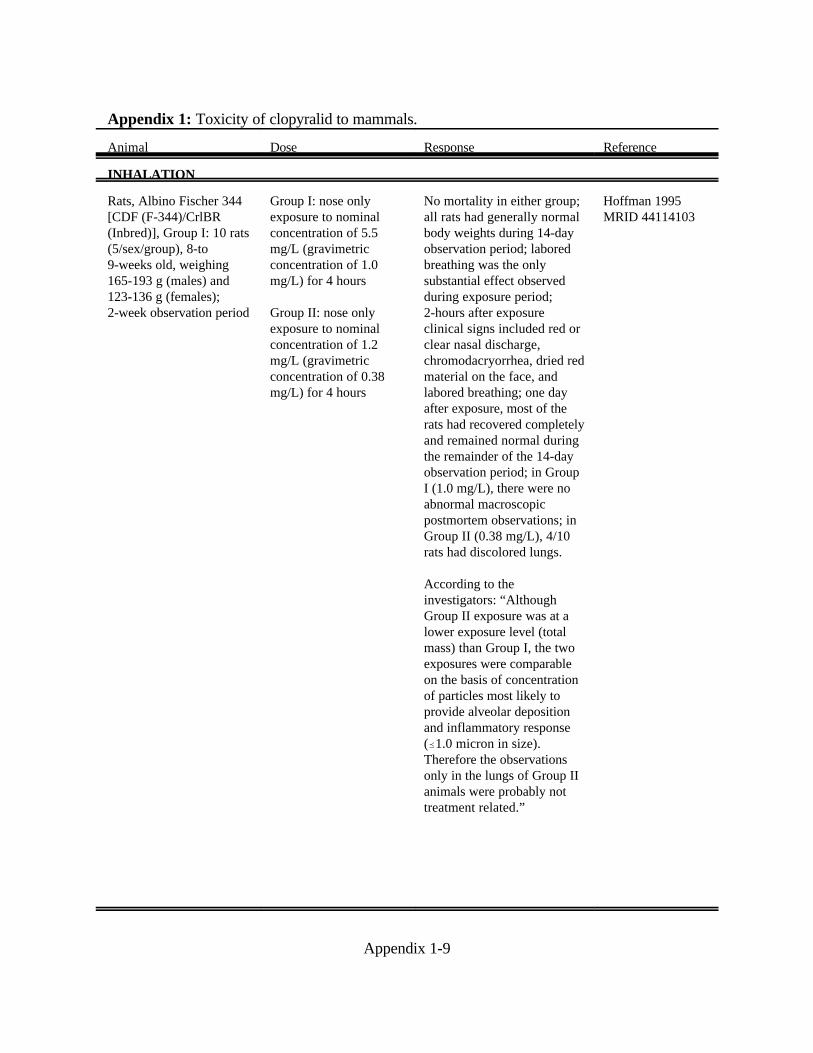
Appendix 1: Toxicity of clopyralid to mammals.
Animal Dose Response Reference
Appendix 1-9
INHALATION
Rats, Albino Fischer 344[CDF (F-344)/CrlBR(Inbred)], Group I: 10 rats(5/sex/group), 8-to9-weeks old, weighing165-193 g (males) and123-136 g (females);2-week observation period
Group I: nose onlyexposure to nominalconcentration of 5.5mg/L (gravimetricconcentration of 1.0mg/L) for 4 hours
Group II: nose onlyexposure to nominalconcentration of 1.2mg/L (gravimetricconcentration of 0.38mg/L) for 4 hours
No mortality in either group;all rats had generally normalbody weights during 14-dayobservation period; laboredbreathing was the onlysubstantial effect observedduring exposure period;2-hours after exposureclinical signs included red orclear nasal discharge,chromodacryorrhea, dried redmaterial on the face, andlabored breathing; one dayafter exposure, most of therats had recovered completelyand remained normal duringthe remainder of the 14-dayobservation period; in GroupI (1.0 mg/L), there were noabnormal macroscopicpostmortem observations; inGroup II (0.38 mg/L), 4/10rats had discolored lungs.
According to theinvestigators: “AlthoughGroup II exposure was at alower exposure level (totalmass) than Group I, the twoexposures were comparableon the basis of concentrationof particles most likely toprovide alveolar depositionand inflammatory response(˜1.0 micron in size). Therefore the observationsonly in the lungs of Group IIanimals were probably nottreatment related.”
Hoffman 1995MRID 44114103
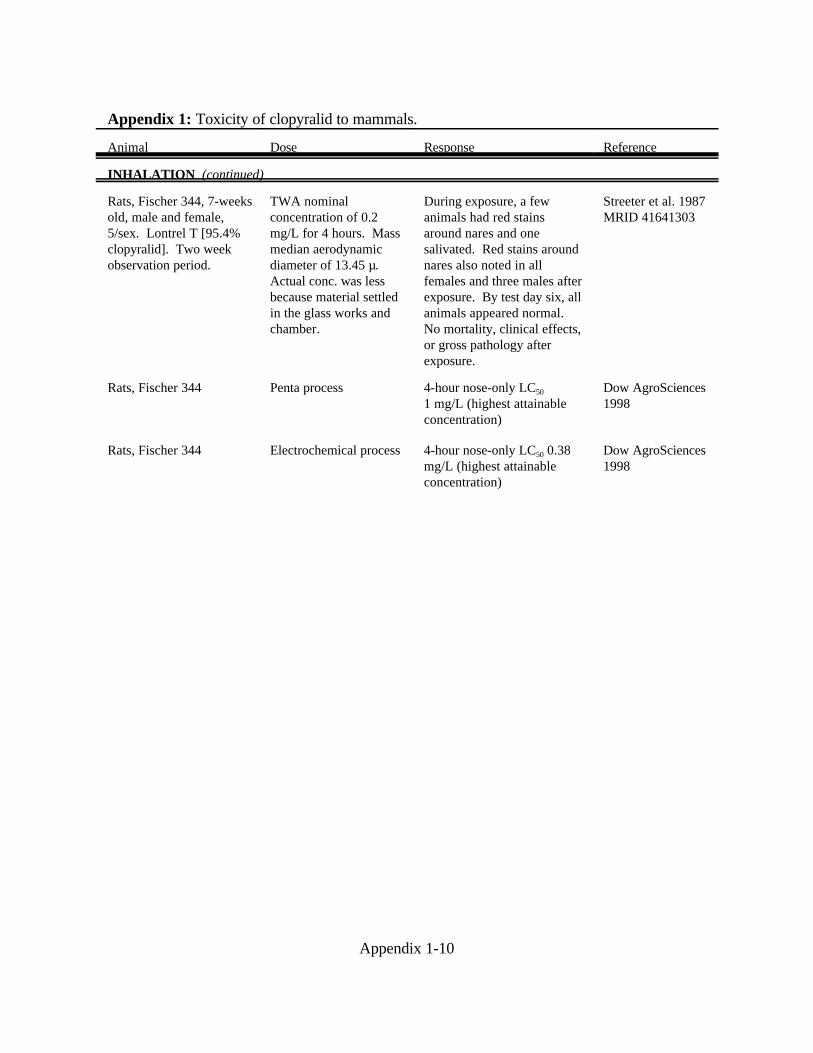
Appendix 1: Toxicity of clopyralid to mammals.
Animal Dose Response Reference
Appendix 1-10
INHALATION (continued)
Rats, Fischer 344, 7-weeksold, male and female,5/sex. Lontrel T [95.4%clopyralid]. Two weekobservation period.
TWA nominalconcentration of 0.2mg/L for 4 hours. Massmedian aerodynamicdiameter of 13.45 µ. Actual conc. was lessbecause material settledin the glass works andchamber.
During exposure, a fewanimals had red stainsaround nares and onesalivated. Red stains aroundnares also noted in allfemales and three males afterexposure. By test day six, allanimals appeared normal. No mortality, clinical effects,or gross pathology afterexposure.
Streeter et al. 1987MRID 41641303
Rats, Fischer 344 Penta process 4-hour nose-only LC50
1 mg/L (highest attainableconcentration)
Dow AgroSciences1998
Rats, Fischer 344 Electrochemical process 4-hour nose-only LC50 0.38mg/L (highest attainableconcentration)
Dow AgroSciences1998
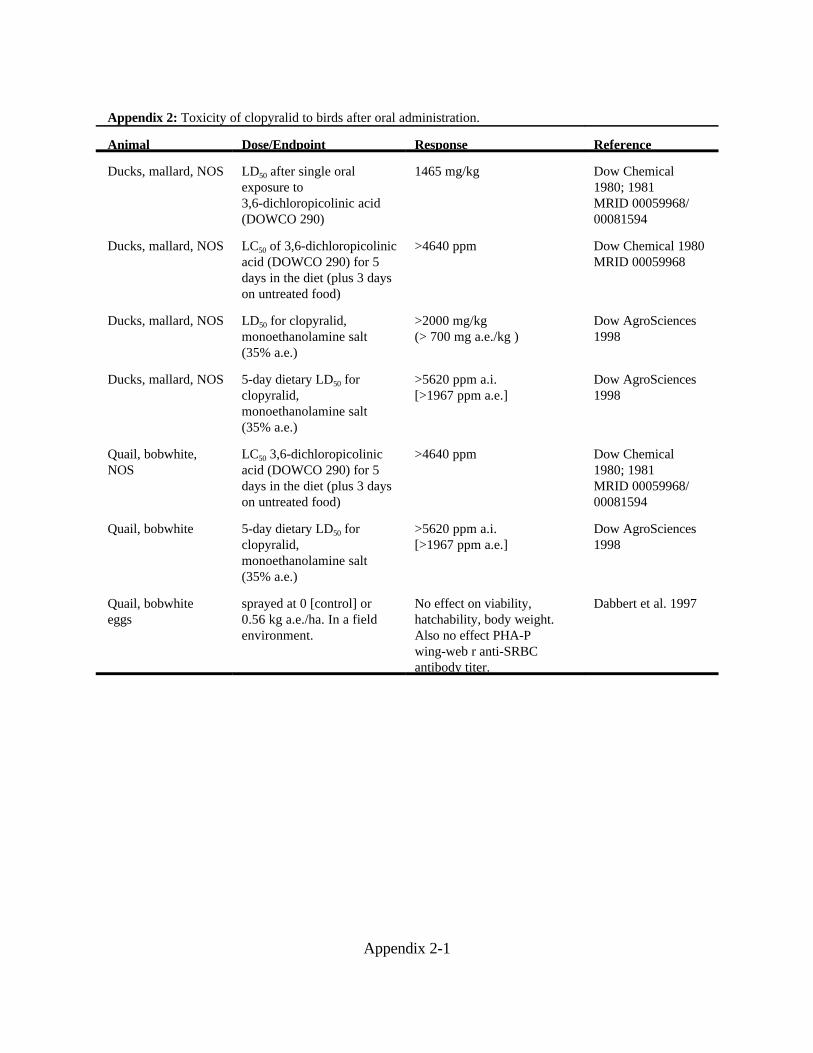
Appendix 2-1
Appendix 2: Toxicity of clopyralid to birds after oral administration.
Animal Dose/Endpoint Response Reference
Ducks, mallard, NOS LD50 after single oralexposure to3,6-dichloropicolinic acid(DOWCO 290)
1465 mg/kg Dow Chemical1980; 1981MRID 00059968/00081594
Ducks, mallard, NOS LC50 of 3,6-dichloropicolinicacid (DOWCO 290) for 5days in the diet (plus 3 dayson untreated food)
>4640 ppm Dow Chemical 1980MRID 00059968
Ducks, mallard, NOS LD50 for clopyralid,monoethanolamine salt(35% a.e.)
>2000 mg/kg(> 700 mg a.e./kg )
Dow AgroSciences1998
Ducks, mallard, NOS 5-day dietary LD50 forclopyralid,monoethanolamine salt(35% a.e.)
>5620 ppm a.i.[>1967 ppm a.e.]
Dow AgroSciences1998
Quail, bobwhite,NOS
LC50 3,6-dichloropicolinicacid (DOWCO 290) for 5days in the diet (plus 3 dayson untreated food)
>4640 ppm Dow Chemical1980; 1981MRID 00059968/00081594
Quail, bobwhite 5-day dietary LD50 forclopyralid,monoethanolamine salt(35% a.e.)
>5620 ppm a.i.[>1967 ppm a.e.]
Dow AgroSciences1998
Quail, bobwhite eggs
sprayed at 0 [control] or0.56 kg a.e./ha. In a fieldenvironment.
No effect on viability,hatchability, body weight. Also no effect PHA-Pwing-web r anti-SRBCantibody titer.
Dabbert et al. 1997
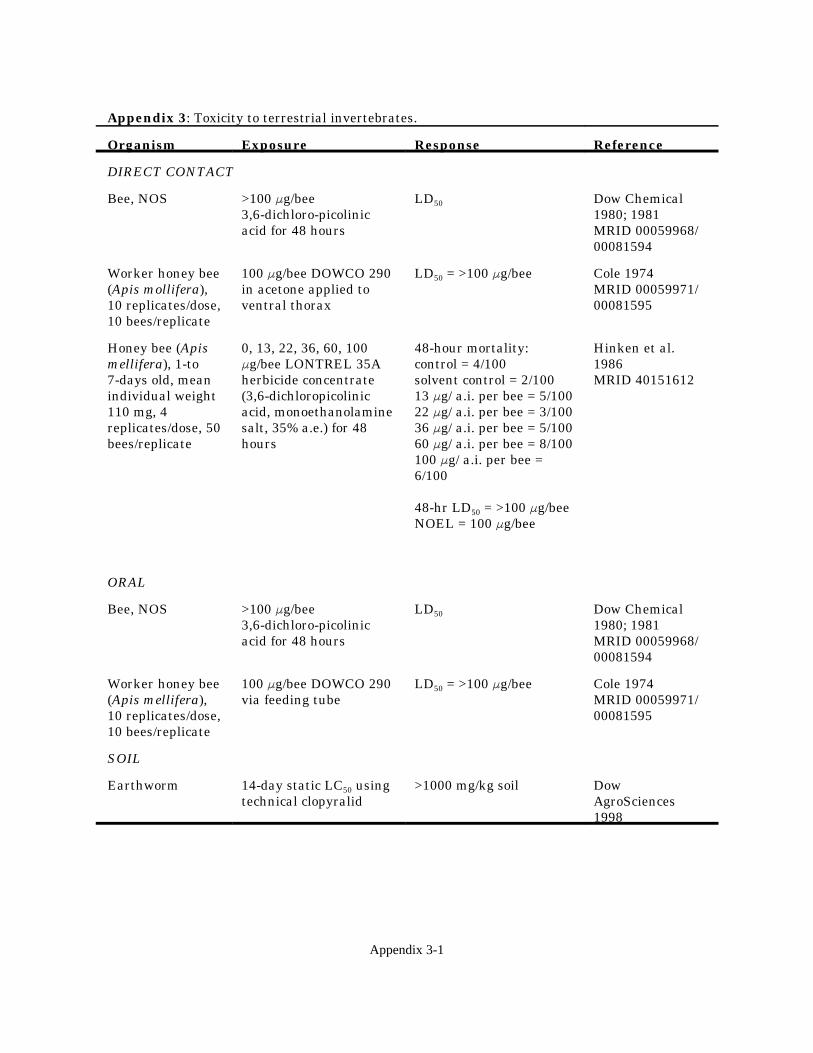
Appendix 3-1
Appendix 3: Toxicity to terrestrial invertebrates.
Organism Exposure Response Reference
DIRECT CONTACT
Bee, NOS >100 Fg/bee3,6-dichloro-picolinicacid for 48 hours
LD50 Dow Chemical1980; 1981MRID 00059968/00081594
Worker honey bee(Apis mollifera),10 replicates/dose,10 bees/replicate
100 Fg/bee DOWCO 290in acetone applied toventral thorax
LD50 = >100 Fg/bee Cole 1974MRID 00059971/00081595
Honey bee (Apismellifera), 1-to7-days old, meanindividual weight110 mg, 4replicates/dose, 50bees/replicate
0, 13, 22, 36, 60, 100Fg/bee LONTREL 35Aherbicide concentrate(3,6-dichloropicolinicacid, monoethanolaminesalt, 35% a.e.) for 48hours
48-hour mortality:control = 4/100solvent control = 2/10013 Fg/ a.i. per bee = 5/10022 Fg/ a.i. per bee = 3/10036 Fg/ a.i. per bee = 5/10060 Fg/ a.i. per bee = 8/100100 Fg/ a.i. per bee =6/100
48-hr LD50 = >100 Fg/beeNOEL = 100 Fg/bee
Hinken et al.1986MRID 40151612
ORAL
Bee, NOS >100 Fg/bee3,6-dichloro-picolinicacid for 48 hours
LD50 Dow Chemical1980; 1981MRID 00059968/00081594
Worker honey bee(Apis mellifera),10 replicates/dose,10 bees/replicate
100 Fg/bee DOWCO 290via feeding tube
LD50 = >100 Fg/bee Cole 1974MRID 00059971/00081595
SOIL
Earthworm 14-day static LC50 usingtechnical clopyralid
>1000 mg/kg soil DowAgroSciences1998
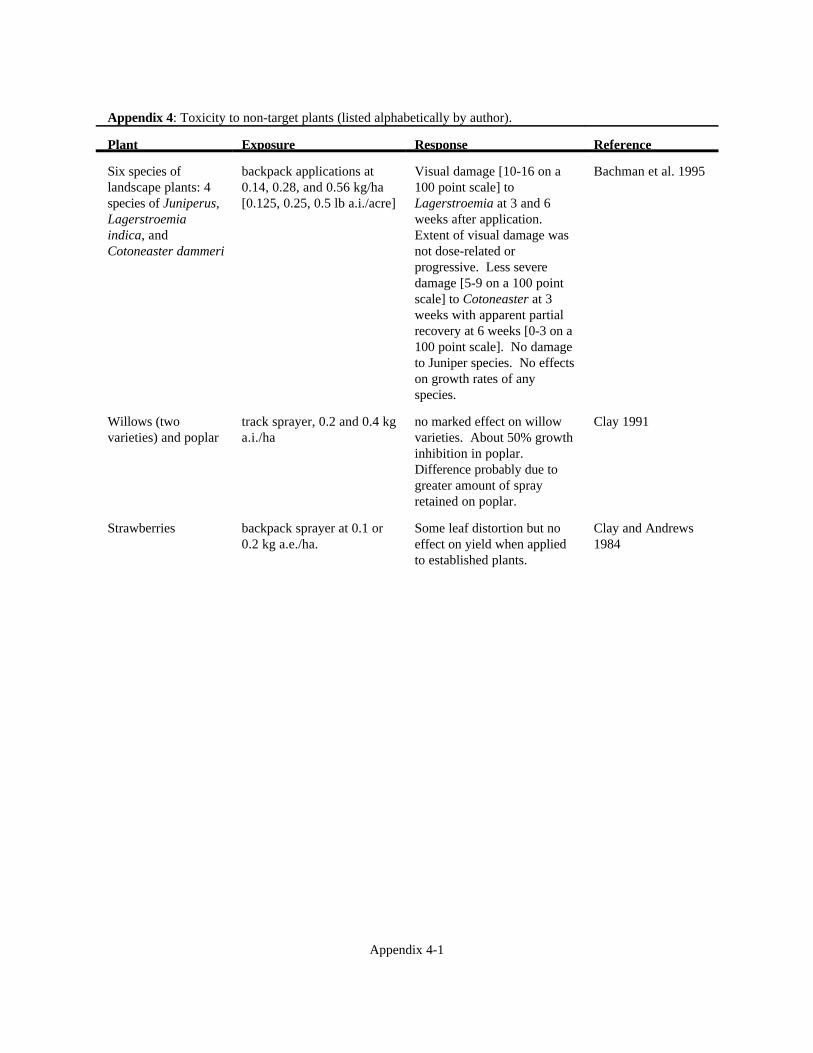
Appendix 4-1
Appendix 4: Toxicity to non-target plants (listed alphabetically by author).
Plant Exposure Response Reference
Six species oflandscape plants: 4species of Juniperus,Lagerstroemiaindica, andCotoneaster dammeri
backpack applications at0.14, 0.28, and 0.56 kg/ha[0.125, 0.25, 0.5 lb a.i./acre]
Visual damage [10-16 on a100 point scale] toLagerstroemia at 3 and 6weeks after application. Extent of visual damage wasnot dose-related orprogressive. Less severedamage [5-9 on a 100 pointscale] to Cotoneaster at 3weeks with apparent partialrecovery at 6 weeks [0-3 on a100 point scale]. No damageto Juniper species. No effectson growth rates of anyspecies.
Bachman et al. 1995
Willows (twovarieties) and poplar
track sprayer, 0.2 and 0.4 kga.i./ha
no marked effect on willowvarieties. About 50% growthinhibition in poplar. Difference probably due togreater amount of sprayretained on poplar.
Clay 1991
Strawberries backpack sprayer at 0.1 or0.2 kg a.e./ha.
Some leaf distortion but noeffect on yield when appliedto established plants.
Clay and Andrews1984
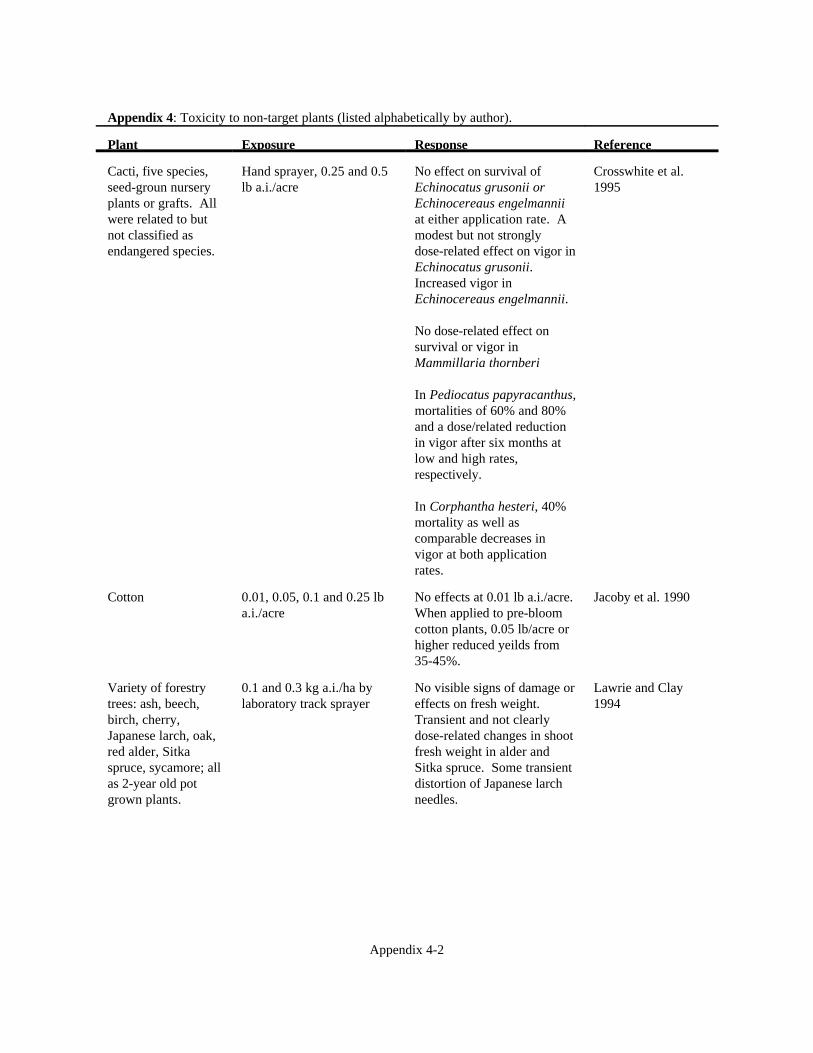
Appendix 4: Toxicity to non-target plants (listed alphabetically by author).
Plant Exposure Response Reference
Appendix 4-2
Cacti, five species,seed-groun nurseryplants or grafts. Allwere related to butnot classified asendangered species.
Hand sprayer, 0.25 and 0.5lb a.i./acre
No effect on survival ofEchinocatus grusonii orEchinocereaus engelmanniiat either application rate. Amodest but not stronglydose-related effect on vigor inEchinocatus grusonii.Increased vigor inEchinocereaus engelmannii.
No dose-related effect onsurvival or vigor inMammillaria thornberi
In Pediocatus papyracanthus,mortalities of 60% and 80%and a dose/related reductionin vigor after six months atlow and high rates,respectively.
In Corphantha hesteri, 40%mortality as well ascomparable decreases invigor at both applicationrates.
Crosswhite et al.1995
Cotton 0.01, 0.05, 0.1 and 0.25 lba.i./acre
No effects at 0.01 lb a.i./acre. When applied to pre-bloomcotton plants, 0.05 lb/acre orhigher reduced yeilds from35-45%.
Jacoby et al. 1990
Variety of forestrytrees: ash, beech,birch, cherry,Japanese larch, oak,red alder, Sitkaspruce, sycamore; allas 2-year old potgrown plants.
0.1 and 0.3 kg a.i./ha bylaboratory track sprayer
No visible signs of damage oreffects on fresh weight.Transient and not clearlydose-related changes in shootfresh weight in alder andSitka spruce. Some transientdistortion of Japanese larchneedles.
Lawrie and Clay1994
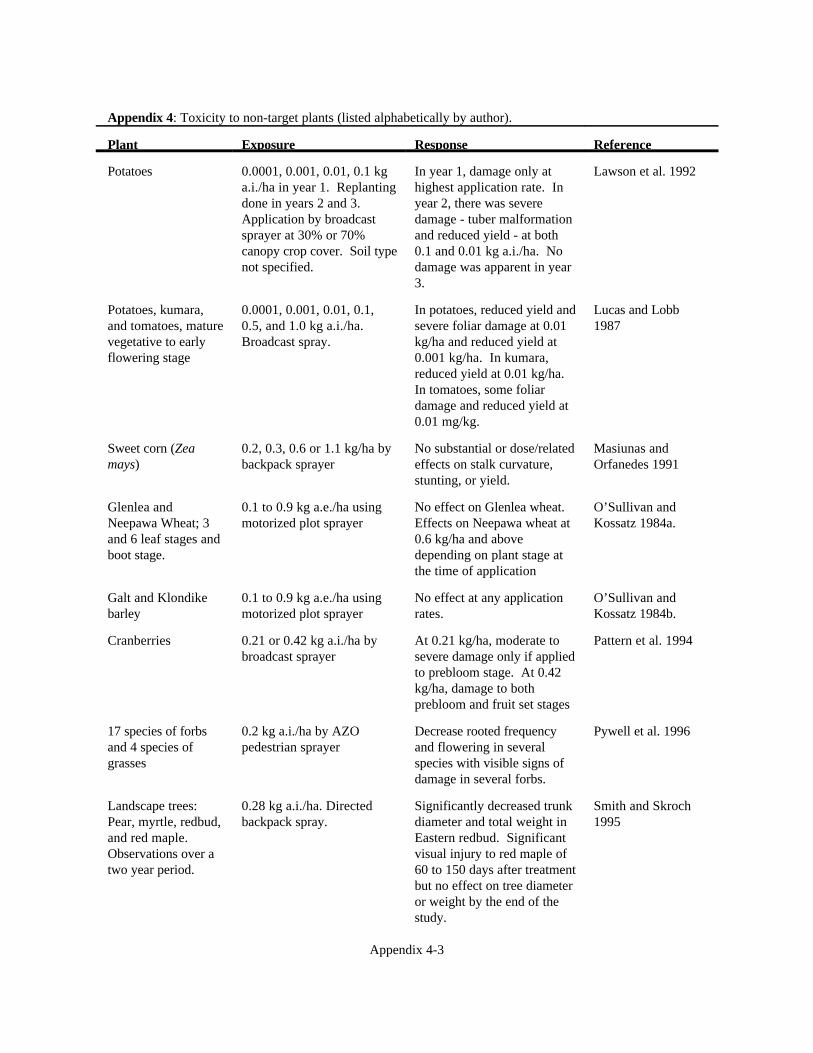
Appendix 4: Toxicity to non-target plants (listed alphabetically by author).
Plant Exposure Response Reference
Appendix 4-3
Potatoes 0.0001, 0.001, 0.01, 0.1 kga.i./ha in year 1. Replantingdone in years 2 and 3. Application by broadcastsprayer at 30% or 70%canopy crop cover. Soil typenot specified.
In year 1, damage only athighest application rate. Inyear 2, there was severedamage - tuber malformationand reduced yield - at both0.1 and 0.01 kg a.i./ha. Nodamage was apparent in year3.
Lawson et al. 1992
Potatoes, kumara,and tomatoes, maturevegetative to earlyflowering stage
0.0001, 0.001, 0.01, 0.1,0.5, and 1.0 kg a.i./ha. Broadcast spray.
In potatoes, reduced yield andsevere foliar damage at 0.01kg/ha and reduced yield at0.001 kg/ha. In kumara,reduced yield at 0.01 kg/ha.In tomatoes, some foliardamage and reduced yield at0.01 mg/kg.
Lucas and Lobb1987
Sweet corn (Zeamays)
0.2, 0.3, 0.6 or 1.1 kg/ha bybackpack sprayer
No substantial or dose/relatedeffects on stalk curvature,stunting, or yield.
Masiunas andOrfanedes 1991
Glenlea andNeepawa Wheat; 3and 6 leaf stages andboot stage.
0.1 to 0.9 kg a.e./ha usingmotorized plot sprayer
No effect on Glenlea wheat. Effects on Neepawa wheat at0.6 kg/ha and abovedepending on plant stage atthe time of application
O’Sullivan andKossatz 1984a.
Galt and Klondikebarley
0.1 to 0.9 kg a.e./ha usingmotorized plot sprayer
No effect at any applicationrates.
O’Sullivan andKossatz 1984b.
Cranberries 0.21 or 0.42 kg a.i./ha bybroadcast sprayer
At 0.21 kg/ha, moderate tosevere damage only if appliedto prebloom stage. At 0.42kg/ha, damage to bothprebloom and fruit set stages
Pattern et al. 1994
17 species of forbsand 4 species ofgrasses
0.2 kg a.i./ha by AZOpedestrian sprayer
Decrease rooted frequencyand flowering in severalspecies with visible signs ofdamage in several forbs.
Pywell et al. 1996
Landscape trees:Pear, myrtle, redbud,and red maple. Observations over atwo year period.
0.28 kg a.i./ha. Directedbackpack spray.
Significantly decreased trunkdiameter and total weight inEastern redbud. Significantvisual injury to red maple of60 to 150 days after treatmentbut no effect on tree diameteror weight by the end of thestudy.
Smith and Skroch1995
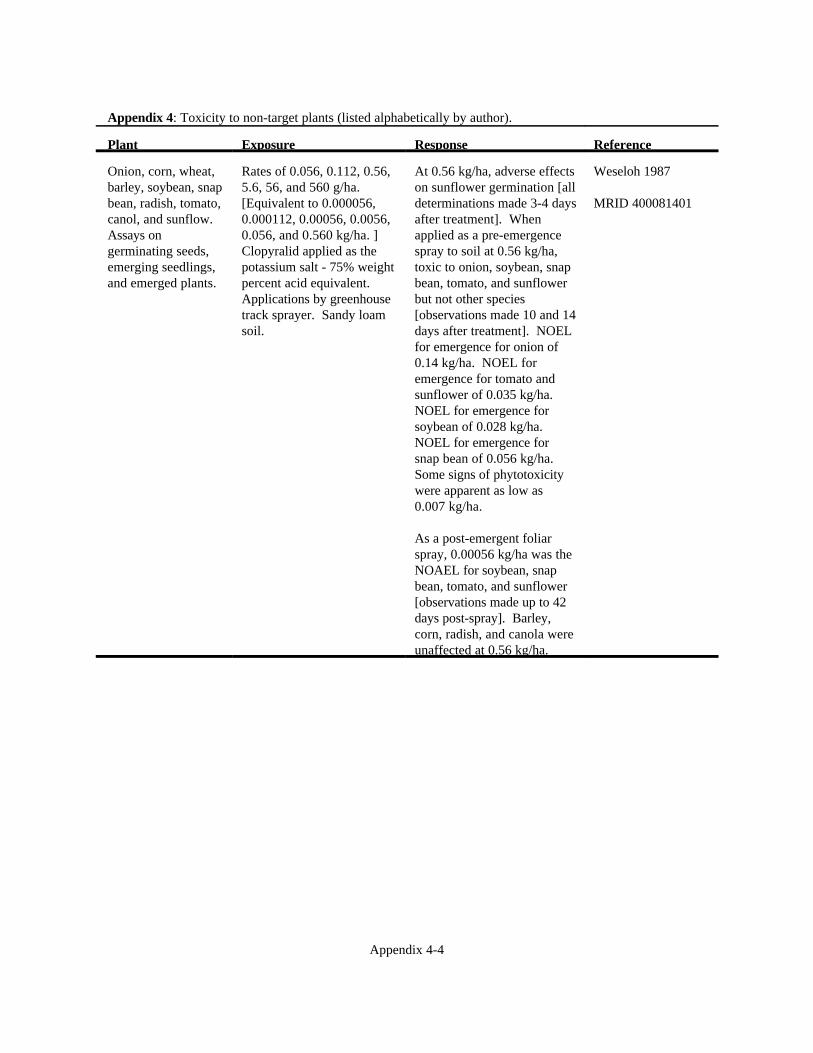
Appendix 4: Toxicity to non-target plants (listed alphabetically by author).
Plant Exposure Response Reference
Appendix 4-4
Onion, corn, wheat,barley, soybean, snapbean, radish, tomato,canol, and sunflow. Assays ongerminating seeds,emerging seedlings,and emerged plants.
Rates of 0.056, 0.112, 0.56,5.6, 56, and 560 g/ha. [Equivalent to 0.000056,0.000112, 0.00056, 0.0056,0.056, and 0.560 kg/ha. ] Clopyralid applied as thepotassium salt - 75% weightpercent acid equivalent. Applications by greenhousetrack sprayer. Sandy loamsoil.
At 0.56 kg/ha, adverse effectson sunflower germination [alldeterminations made 3-4 daysafter treatment]. Whenapplied as a pre-emergencespray to soil at 0.56 kg/ha,toxic to onion, soybean, snapbean, tomato, and sunflowerbut not other species[observations made 10 and 14days after treatment]. NOELfor emergence for onion of0.14 kg/ha. NOEL foremergence for tomato andsunflower of 0.035 kg/ha. NOEL for emergence forsoybean of 0.028 kg/ha. NOEL for emergence forsnap bean of 0.056 kg/ha. Some signs of phytotoxicitywere apparent as low as0.007 kg/ha.
As a post-emergent foliarspray, 0.00056 kg/ha was theNOAEL for soybean, snapbean, tomato, and sunflower[observations made up to 42days post-spray]. Barley,corn, radish, and canola wereunaffected at 0.56 kg/ha.
Weseloh 1987
MRID 400081401
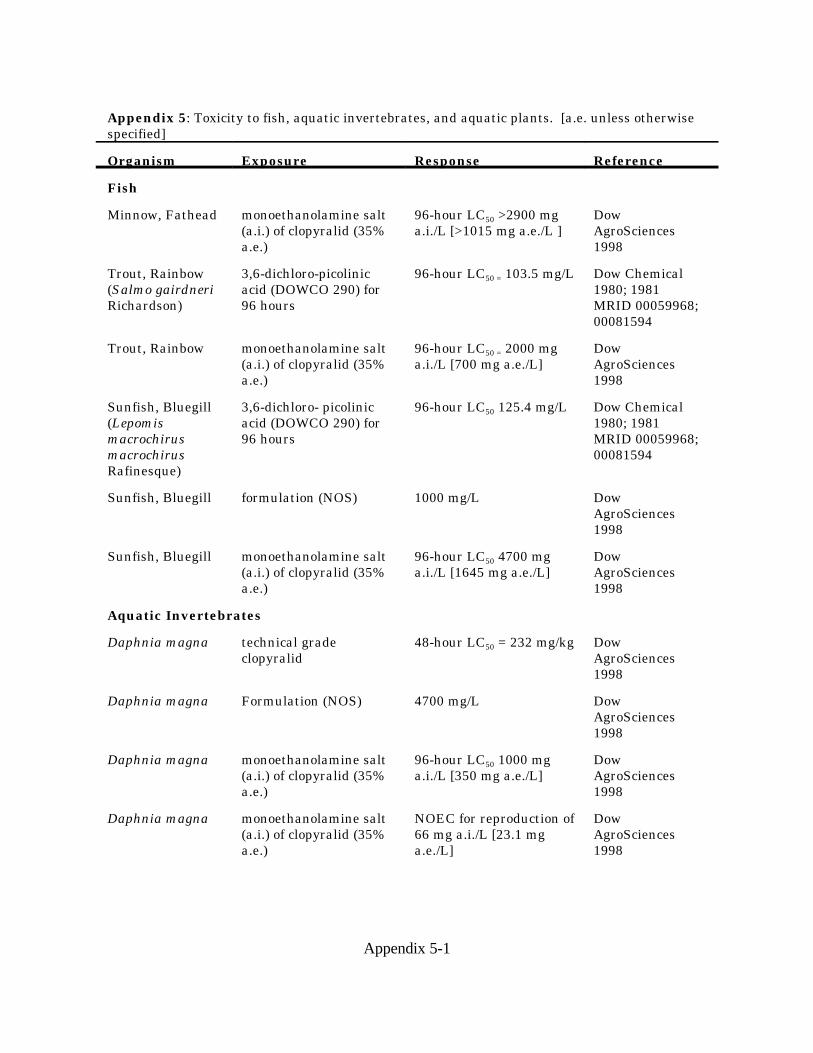
Appendix 5-1
Appendix 5: Toxicity to fish, aquatic invertebrates, and aquatic plants. [a.e. unless otherwisespecified]
Organism Exposure Response Reference
Fish
Minnow, Fathead monoethanolamine salt(a.i.) of clopyralid (35%a.e.)
96-hour LC50 >2900 mga.i./L [>1015 mg a.e./L ]
DowAgroSciences1998
Trout, Rainbow(Salmo gairdneriRichardson)
3,6-dichloro-picolinicacid (DOWCO 290) for96 hours
96-hour LC50 = 103.5 mg/L Dow Chemical1980; 1981MRID 00059968;00081594
Trout, Rainbow monoethanolamine salt(a.i.) of clopyralid (35%a.e.)
96-hour LC50 = 2000 mga.i./L [700 mg a.e./L]
DowAgroSciences1998
Sunfish, Bluegill(LepomismacrochirusmacrochirusRafinesque)
3,6-dichloro- picolinicacid (DOWCO 290) for96 hours
96-hour LC50 125.4 mg/L Dow Chemical1980; 1981MRID 00059968;00081594
Sunfish, Bluegill formulation (NOS) 1000 mg/L DowAgroSciences1998
Sunfish, Bluegill monoethanolamine salt(a.i.) of clopyralid (35%a.e.)
96-hour LC50 4700 mga.i./L [1645 mg a.e./L]
DowAgroSciences1998
Aquatic Invertebrates
Daphnia magna technical gradeclopyralid
48-hour LC50 = 232 mg/kg DowAgroSciences1998
Daphnia magna Formulation (NOS) 4700 mg/L DowAgroSciences1998
Daphnia magna monoethanolamine salt(a.i.) of clopyralid (35%a.e.)
96-hour LC50 1000 mga.i./L [350 mg a.e./L]
DowAgroSciences1998
Daphnia magna monoethanolamine salt(a.i.) of clopyralid (35%a.e.)
NOEC for reproduction of66 mg a.i./L [23.1 mga.e./L]
DowAgroSciences1998
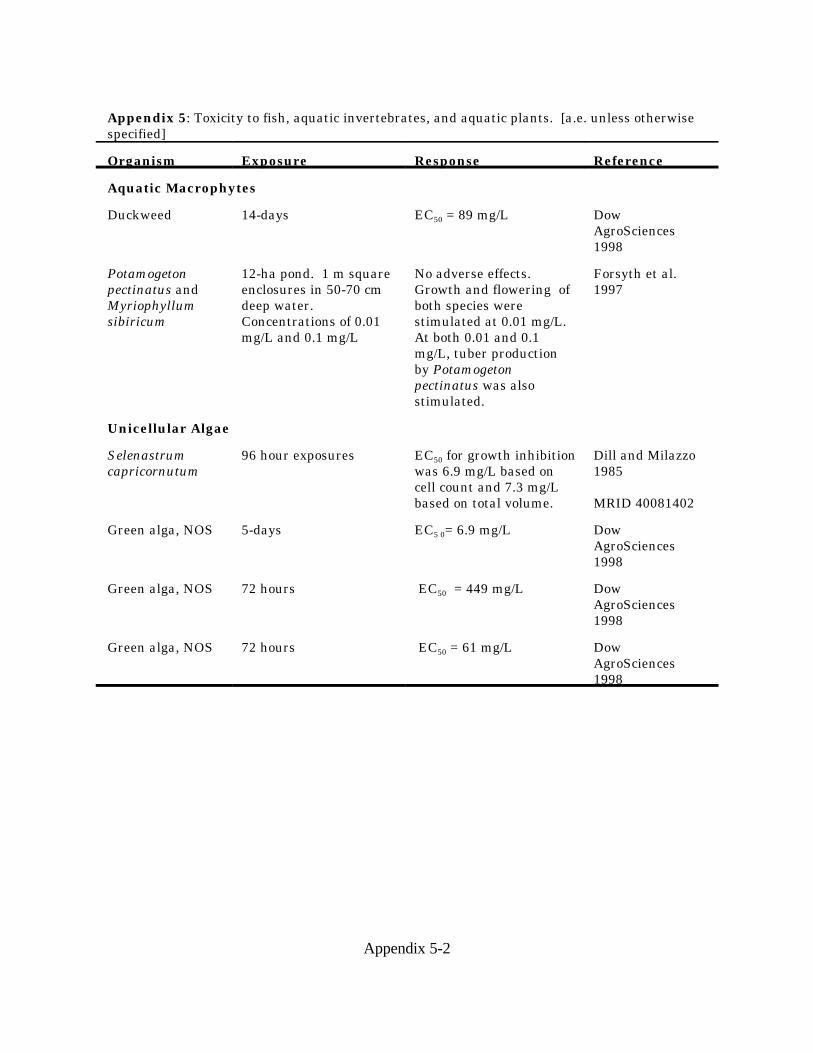
Appendix 5: Toxicity to fish, aquatic invertebrates, and aquatic plants. [a.e. unless otherwisespecified]
Organism Exposure Response Reference
Appendix 5-2
Aquatic Macrophytes
Duckweed 14-days EC50 = 89 mg/L DowAgroSciences1998
Potamogetonpectinatus andMyriophyllumsibiricum
12-ha pond. 1 m squareenclosures in 50-70 cmdeep water. Concentrations of 0.01mg/L and 0.1 mg/L
No adverse effects. Growth and flowering ofboth species werestimulated at 0.01 mg/L. At both 0.01 and 0.1mg/L, tuber productionby Potamogetonpectinatus was alsostimulated.
Forsyth et al.1997
Unicellular Algae
Selenastrumcapricornutum
96 hour exposures EC50 for growth inhibitionwas 6.9 mg/L based oncell count and 7.3 mg/Lbased on total volume.
Dill and Milazzo1985
MRID 40081402
Green alga, NOS 5-days EC5 0= 6.9 mg/L DowAgroSciences1998
Green alga, NOS 72 hours EC50 = 449 mg/L DowAgroSciences1998
Green alga, NOS 72 hours EC50 = 61 mg/L DowAgroSciences1998
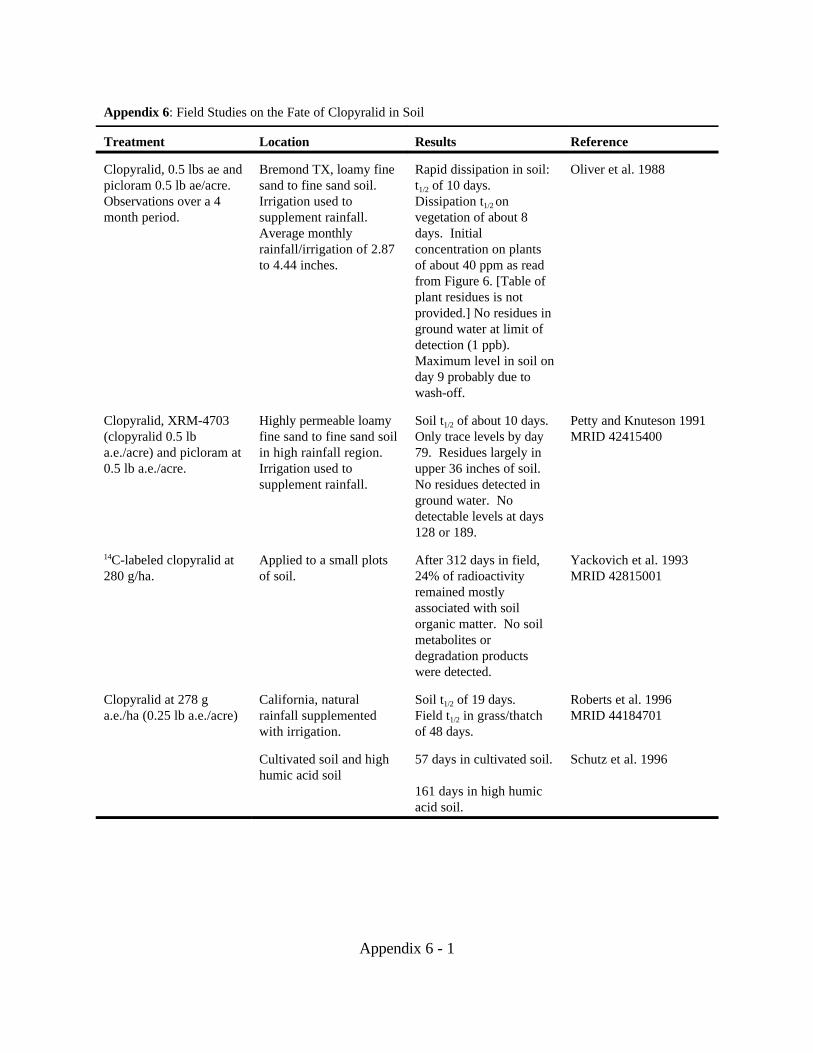
Appendix 6 - 1
Appendix 6: Field Studies on the Fate of Clopyralid in Soil
Treatment Location Results Reference
Clopyralid, 0.5 lbs ae andpicloram 0.5 lb ae/acre. Observations over a 4month period.
Bremond TX, loamy finesand to fine sand soil. Irrigation used tosupplement rainfall. Average monthlyrainfall/irrigation of 2.87to 4.44 inches.
Rapid dissipation in soil:t1/2 of 10 days. Dissipation t1/2 onvegetation of about 8days. Initialconcentration on plantsof about 40 ppm as readfrom Figure 6. [Table ofplant residues is notprovided.] No residues inground water at limit ofdetection (1 ppb). Maximum level in soil onday 9 probably due towash-off.
Oliver et al. 1988
Clopyralid, XRM-4703(clopyralid 0.5 lba.e./acre) and picloram at0.5 lb a.e./acre.
Highly permeable loamyfine sand to fine sand soilin high rainfall region. Irrigation used tosupplement rainfall.
Soil t1/2 of about 10 days. Only trace levels by day79. Residues largely inupper 36 inches of soil. No residues detected inground water. Nodetectable levels at days128 or 189.
Petty and Knuteson 1991MRID 42415400
14C-labeled clopyralid at280 g/ha.
Applied to a small plotsof soil.
After 312 days in field,24% of radioactivityremained mostlyassociated with soilorganic matter. No soilmetabolites ordegradation productswere detected.
Yackovich et al. 1993MRID 42815001
Clopyralid at 278 ga.e./ha (0.25 lb a.e./acre)
California, naturalrainfall supplementedwith irrigation.
Soil t1/2 of 19 days.Field t1/2 in grass/thatchof 48 days.
Roberts et al. 1996MRID 44184701
Cultivated soil and highhumic acid soil
57 days in cultivated soil.
161 days in high humicacid soil.
Schutz et al. 1996
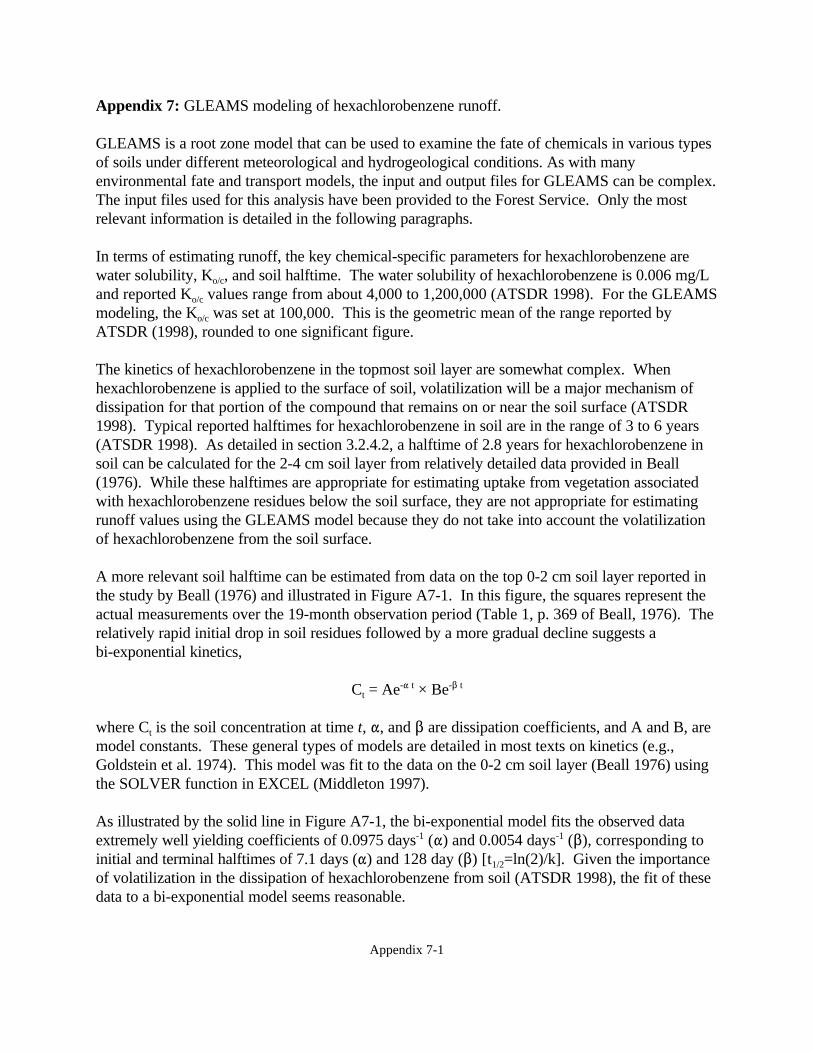
Appendix 7-1
Appendix 7: GLEAMS modeling of hexachlorobenzene runoff.
GLEAMS is a root zone model that can be used to examine the fate of chemicals in various typesof soils under different meteorological and hydrogeological conditions. As with manyenvironmental fate and transport models, the input and output files for GLEAMS can be complex. The input files used for this analysis have been provided to the Forest Service. Only the mostrelevant information is detailed in the following paragraphs.
In terms of estimating runoff, the key chemical-specific parameters for hexachlorobenzene arewater solubility, Ko/c, and soil halftime. The water solubility of hexachlorobenzene is 0.006 mg/Land reported Ko/c values range from about 4,000 to 1,200,000 (ATSDR 1998). For the GLEAMSmodeling, the Ko/c was set at 100,000. This is the geometric mean of the range reported byATSDR (1998), rounded to one significant figure.
The kinetics of hexachlorobenzene in the topmost soil layer are somewhat complex. Whenhexachlorobenzene is applied to the surface of soil, volatilization will be a major mechanism ofdissipation for that portion of the compound that remains on or near the soil surface (ATSDR1998). Typical reported halftimes for hexachlorobenzene in soil are in the range of 3 to 6 years(ATSDR 1998). As detailed in section 3.2.4.2, a halftime of 2.8 years for hexachlorobenzene insoil can be calculated for the 2-4 cm soil layer from relatively detailed data provided in Beall(1976). While these halftimes are appropriate for estimating uptake from vegetation associatedwith hexachlorobenzene residues below the soil surface, they are not appropriate for estimatingrunoff values using the GLEAMS model because they do not take into account the volatilizationof hexachlorobenzene from the soil surface.
A more relevant soil halftime can be estimated from data on the top 0-2 cm soil layer reported inthe study by Beall (1976) and illustrated in Figure A7-1. In this figure, the squares represent theactual measurements over the 19-month observation period (Table 1, p. 369 of Beall, 1976). Therelatively rapid initial drop in soil residues followed by a more gradual decline suggests abi-exponential kinetics,
Ct = Ae-" t × Be-$ t
where Ct is the soil concentration at time t, ", and $ are dissipation coefficients, and A and B, aremodel constants. These general types of models are detailed in most texts on kinetics (e.g.,Goldstein et al. 1974). This model was fit to the data on the 0-2 cm soil layer (Beall 1976) usingthe SOLVER function in EXCEL (Middleton 1997).
As illustrated by the solid line in Figure A7-1, the bi-exponential model fits the observed dataextremely well yielding coefficients of 0.0975 days-1 (") and 0.0054 days-1 ($), corresponding toinitial and terminal halftimes of 7.1 days (") and 128 day ($) [t1/2=ln(2)/k]. Given the importanceof volatilization in the dissipation of hexachlorobenzene from soil (ATSDR 1998), the fit of thesedata to a bi-exponential model seems reasonable.
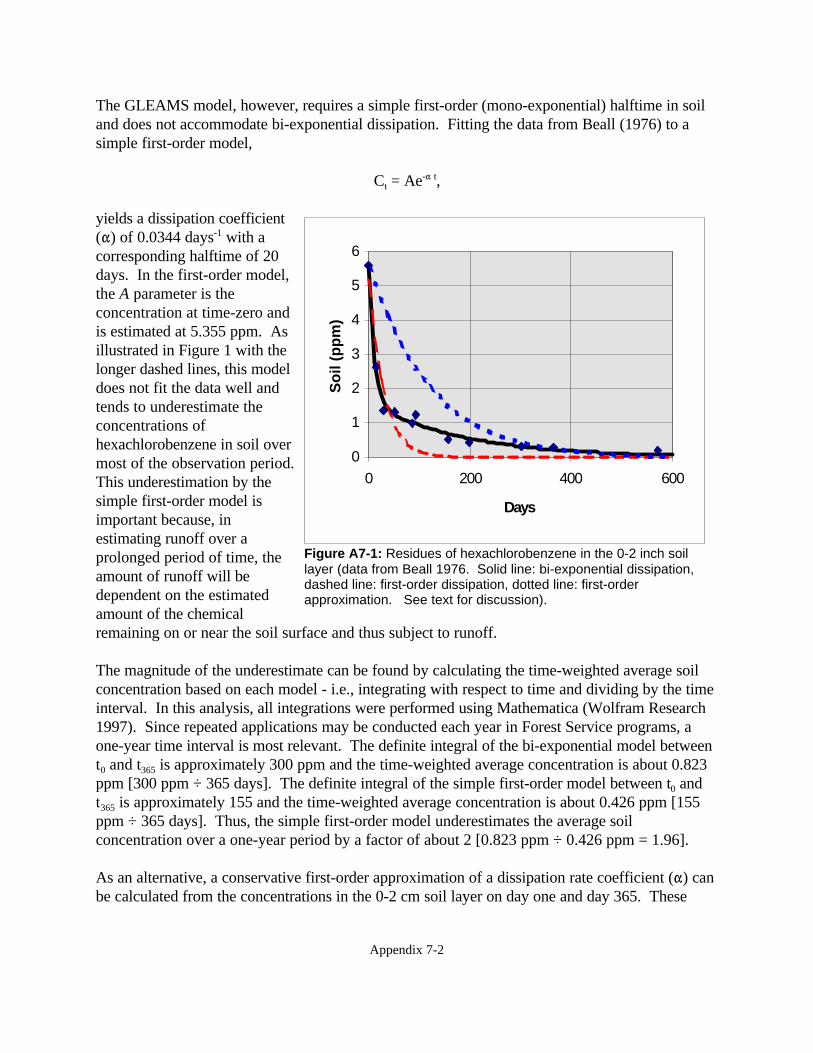
Appendix 7-2
0
1
2
3
4
5
6
0 200 400 600
Days
So
il (p
pm
)
Figure A7-1: Residues of hexachlorobenzene in the 0-2 inch soillayer (data from Beall 1976. Solid line: bi-exponential dissipation,dashed line: first-order dissipation, dotted line: first-orderapproximation. See text for discussion).
The GLEAMS model, however, requires a simple first-order (mono-exponential) halftime in soiland does not accommodate bi-exponential dissipation. Fitting the data from Beall (1976) to asimple first-order model,
Ct = Ae-" t,
yields a dissipation coefficient(") of 0.0344 days-1 with acorresponding halftime of 20days. In the first-order model,the A parameter is theconcentration at time-zero andis estimated at 5.355 ppm. Asillustrated in Figure 1 with thelonger dashed lines, this modeldoes not fit the data well andtends to underestimate theconcentrations ofhexachlorobenzene in soil overmost of the observation period. This underestimation by thesimple first-order model isimportant because, inestimating runoff over aprolonged period of time, theamount of runoff will bedependent on the estimatedamount of the chemicalremaining on or near the soil surface and thus subject to runoff.
The magnitude of the underestimate can be found by calculating the time-weighted average soilconcentration based on each model - i.e., integrating with respect to time and dividing by the timeinterval. In this analysis, all integrations were performed using Mathematica (Wolfram Research1997). Since repeated applications may be conducted each year in Forest Service programs, aone-year time interval is most relevant. The definite integral of the bi-exponential model betweent0 and t365 is approximately 300 ppm and the time-weighted average concentration is about 0.823ppm [300 ppm ÷ 365 days]. The definite integral of the simple first-order model between t0 andt365 is approximately 155 and the time-weighted average concentration is about 0.426 ppm [155ppm ÷ 365 days]. Thus, the simple first-order model underestimates the average soilconcentration over a one-year period by a factor of about 2 [0.823 ppm ÷ 0.426 ppm = 1.96].
As an alternative, a conservative first-order approximation of a dissipation rate coefficient (") canbe calculated from the concentrations in the 0-2 cm soil layer on day one and day 365. These
Appendix 7-3
values are 5.5992 ppm and 0.2654 ppm, respectively (Table 1, p. 369 of Beall, 1976). Thefirst-order approximation of the dissipation rate coefficient (") is thus:
-ln(0.2654÷5.5992)/365 -1 day = 0.00837 days-1
which corresponds to a halftime of 82.7 days. This approximation is illustrated by the shortdashed line in Figure 1 and is above either of the lines generated from the bi-exponential or simplefirst-order methods. Consequently, using this approximation will result in over-estimates of theamount of hexachlorobenzene available for runoff in the upper layer of soil. The definite integralof the first-order approximation between t0 and t365 is 638 ppm and the time-weighted averageconcentration is about 1.75 ppm [638 ppm ÷ 365 days]. Thus, the magnitude of the overestimaterelative to the bi-exponential model is about a factor of 2 [1.75 ppm ÷ 0.823 ppm = 2.126]. Because GLEAMS requires a simple first-order halftime, the first-order approximation of 83 daysis used.
The only other noteworthy chemical-specific parameters required by GLEAMS involve foliarinterception, foliar wash-off, and foliar half-time. For all GLEAMS models used in this exposureassessment, foliar interception is set to zero - i.e., the assumption is made that all of the appliedhexachlorobenzene reaches the soil surface. Because of this assumption, foliar wash-off and foliarhalf-time do not impact the estimates. As will the use of soil halftimes, this will over-estimate theamount deposited on soil and hence the amount available for runoff.
No attempt is made to correct for these over-estimates because of the tendency of GLEAMS tounder-estimate runoff. For example, Reyes et al. (1994) have noted that GLEAMS and variousmodifications to the GLEAMS model under-estimate runoff losses by factors of about 2 to 3. Thus, while some of the chemical-specific assumptions used in the GLEAMS modeling will tendto over-estimate runoff, these factors will be at least partially offset by the tendency of theGLEAMS model to underestimate runoff.
Two types of soils are modeled: clay (high runoff potential) and sand (low runoff potential). Twoerosion parameter files and two hydrology parameter files are used, one each for clay and sand. Both sets of files specify a 10 acre (435,600 sq. ft.) area that is 50 feet wide and 8712 feet long -e.g., a right-of-way. For estimating runoff to water, it is assumed that a body of water runs alongthe length of the right-of-way and that the slope toward the water is 20 percent. Because of thegeneral rather than site-specific nature of this exposure assessment, only a single overland profileis used. Additional parameters specified in this file are consistent with a clay or sand with littleresistance to runoff. The most sensitive hydrological parameters affecting runoff are organiccarbon and runoff curve numbers, both of which are directly related to runoff. As with theparameters used in the pesticide file, the parameters used in these files should lead to relativelyhigh but reasonable estimates of pesticide runoff for each soil type. Specific parameter valueswere selected based on reference tables provided in the documentation for GLEAMS (Knisel etal. 1992) as well as texts dealing with runoff (Boulding 1995; Leng et al. 1995; Nix 1994;Winegardner 1996).
Appendix 7-4
Rainfall also has a substantial influence on runoff and GLEAMS requires daily rainfall data files. National monthly rainfall statistics covering the period from 1961 to 1990 were obtained from theU.S. Weather Service (1998). Based on these files, national annual summary statistics weregenerated in a DBASE file. Average annual rainfall ranged from a low of 0.3 inches (lower rangefor Yuma, Arizona) to 172.2 inches (upper range for Yakutat, Alaska) with a mean averageannual rainfall of 27.69 inches.. Based on these statistics, model runs for both clay and sandy soilwere conducted using precipitation rates of 5, 10, 25, 50, 100, 150, 200, and 250 inches per year.
Each GLEAMS model run was conducted over a 20 year period, with applications ofhexachlorobenzene contaminated herbicide on Julian day 002 of years 1 through 20. For eachyear, equal amounts of rainfall were generated every tenth day to yield the average annual rainfall.This approach was taken because most runoff as well as soil erosion will occur during periods ofrelatively intense rainfall. Combined with the pesticide, erosion, and hydrology parametersdiscussed above, this should yield relatively high but still plausible estimates of runoff.
As summarized in worksheet B01, the typical application rate for clopyralid is 0.1 lb a.e./acre andthis corresponds to a functional application rate for hexachlorobenzene of 0.00000025 lb/acre -i.e., 2.5 ppm hexachlorobenzene in technical grade clopyralid. GLEAMS does not permitapplication rates in the range of 0.00000025 lb/acre. Thus, for the GLEAMS runs, an applicationrate of 1 lb/acre was used and the outputs were adjusted by a factor of 0.00000025.
Consistent with the information on hexachlorobenzene reviewed by ATSDR (1998), all off-sitemovement of hexachlorobenzene occurred in runoff and no losses occurred through percolation. Also consistent with general patterns of pesticide runoff (e.g., Knisel et al. 1992), the proportionof runoff was greater for clay than sandy soil and directly proportional to rainfall. For clay, norunoff occurred at annual rainfall rates of 5 or 10 inches. For sand, no runoff occurred at annualrainfall rates of 5, 10, or 50 inches.
The runoff rates provided by GLEAMS are in units of g/ha (output field 601). Based on a 50 footwide ROW, one hectare (10,760 ft2) is about 215 feet long [10,760 ft2÷50 ft =215.2 feet]. Usinga 50 foot wide standing body of water adjacent to the ROW, the volume of water can becalculated from the dimensions - 215 ft (65.532 meters) by 50 ft (15.24 meters) by 1 meter deep -as 1,000,000 liters:
65.532 m × 15.24 m × 1 m = 998.70 m3 . 1000 m3 × 1000 L/m3 = 1,000,000 L.
For any time, t, amount of hexachlorobenzene in water At in units of g/ha is calculated as:
At = At-1 - (At-1*ke) + *
where * is the amount added at time t by runoff read from the GLEAM output files.
ATSDR (1998) gives reported halftimes for hexachlorobenzene in surface water ranging from 2.7to 5.7 years, corresponding to dissipation rates of 0.122 year-1 to 0.256 year-1 or 0.00031 day-1 to
Appendix 7-5
0.00070 day-1. Thus, the value of ke used in the above equation is taken at 0.19 year-1 or 0.0005day-1, the mid-range of ke’s based on halftimes in surface water.
The amount added at time t by runoff, *, is adjusted using two factors. The first factor of0.00000025 adjusts to an application rate of 0.00000025 lb hexachlorobenzene/acre which, asdiscussed above, is associated with an application rate of 0.1 lb clopyralid a.e./acre.
The second factor is 0.000999 [1÷1001], which is used to account for the partitioning ofhexachlorobenzene to sediment. This factor is derived from the soil-water partition coefficient of100000 from U.S. EPA (1998). This value is defined as the ratio of the concentration ofhexachlorobenzene in soil (mg/kg soil) to the concentration of hexachlorobenzene in water (mg/Lwater). Assuming a 1 cm (0.01 meter) mixing depth for sediment and a 1 meter water depth, theamount of hexachlorobenzene in water relative to the amount in sediment is thus 1000:
100,000 × 0.01÷1 = 1000.
Thus, of the total amount of hexachlorobenzene transported to water, a proportion of 0.000999[1÷1001] will be in the aqueous phase.
Using these factors, the amount of runoff each day that is added to water, *, was calculated as:
* = R × 0.00000025 × 0.000999
where R is the amount read from the GLEAMS output file.
The concentration in water at time t (Ct) in units of picograms/L is then calculated as:
Ct (pg/L) = At (g/ha) × 1,000,000,000 pg/g ÷ 1,000,000 L/ha.
Units of picograms per liter (pg/L), which is equivalent to 10-12 g/L or 10-9 mg/L, were usedbecause of the extremely low concentrations of hexachlorobenzene in water.
Based on the GLEAMS model runs and the above calculations, the estimated concentrations ofhexachlorobenzene in water associated with a clopyralid application rate of 0.1 lb a.e./acre inareas with clay and sand soil are illustrated in Figures A7-2 and A7-3, respectively. At an annualrainfall rate of 25 inches, about the national average, the estimated concentration ofhexachlorobenzene in water associated with runoff from clay is 0.000526 picograms/L or about5×10-13mg/L. After 20 years of annual applications, the modeled concentration is 0.003169picograms/L or about 3×10-12mg/L. At this rainfall rate (25 inches/year), no runoff from sand isanticipated. As illustrated in Figures A-2 and A-3, higher levels of water contamination areestimated in areas with higher rainfall rates. For example, at an annual rainfall rate of 150 inches,water concentrations of about 0.07 to 0.1 picograms/L or 7×10-11 mg/L to 1×10⁻¹⁰ mg/L areestimated for sand and clay soils, respectively. At atypically high rainfall rates of 250 inches per
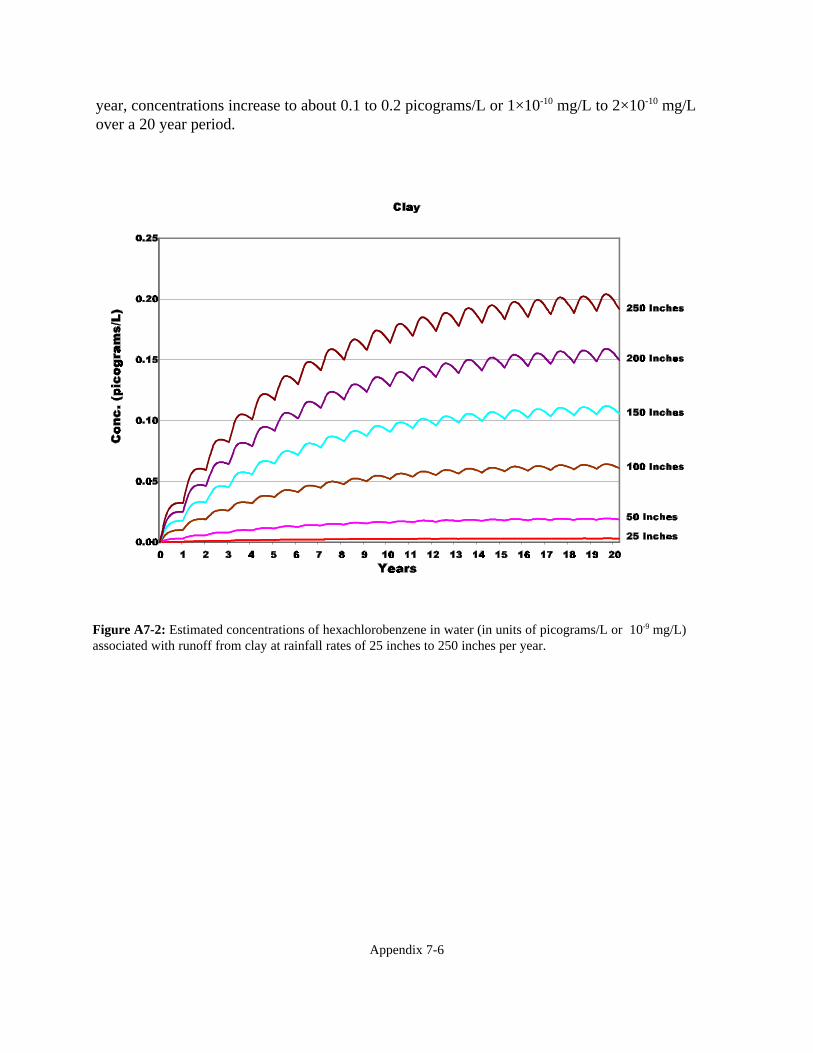
Appendix 7-6
Figure A7-2: Estimated concentrations of hexachlorobenzene in water (in units of picograms/L or 10-9 mg/L)associated with runoff from clay at rainfall rates of 25 inches to 250 inches per year.
year, concentrations increase to about 0.1 to 0.2 picograms/L or 1×10⁻¹⁰ mg/L to 2×10⁻¹⁰ mg/Lover a 20 year period.
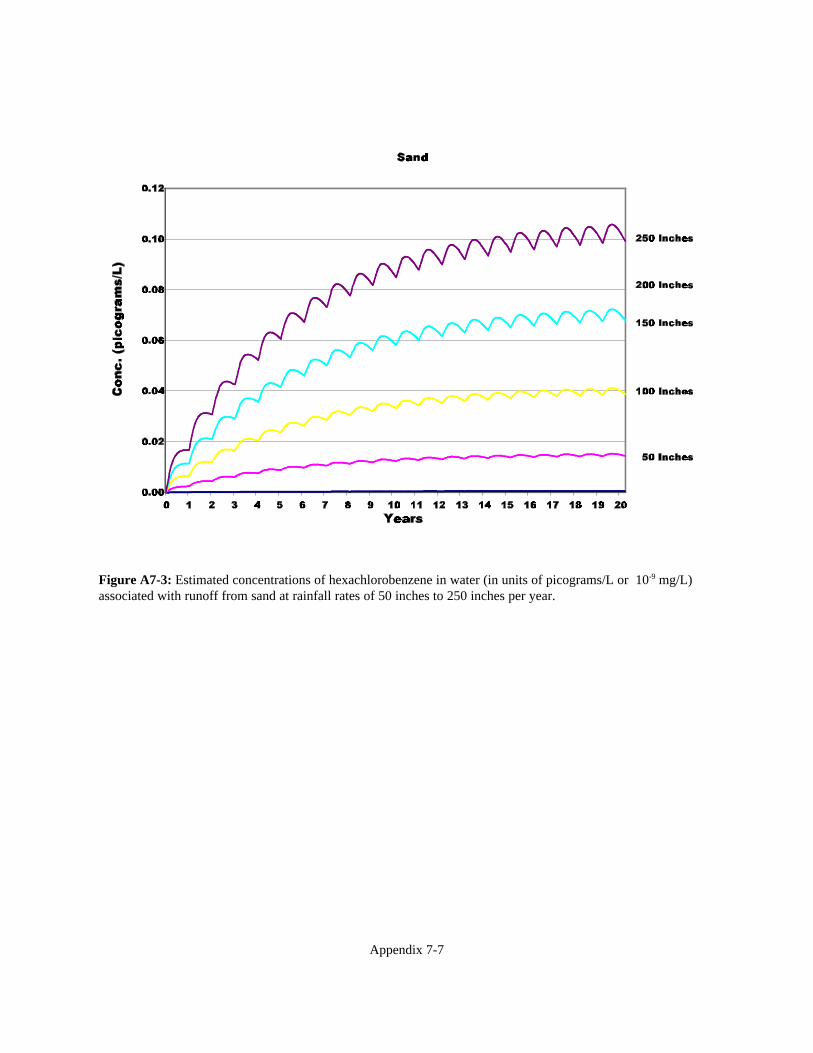
Appendix 7-7
Figure A7-3: Estimated concentrations of hexachlorobenzene in water (in units of picograms/L or 10-9 mg/L)associated with runoff from sand at rainfall rates of 50 inches to 250 inches per year.

WORKSHEETS FOR WORKSHEETS FOR ClopyralidClopyralid
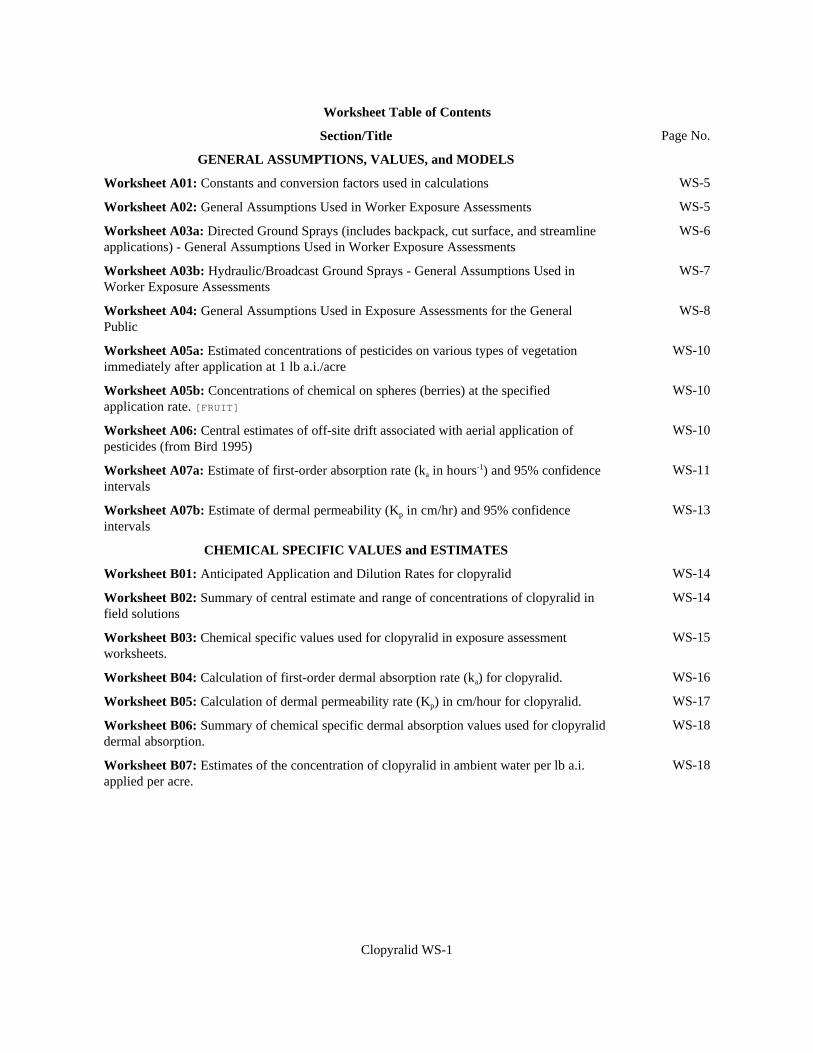
Clopyralid WS-1
Worksheet Table of Contents
Section/Title Page No.
GENERAL ASSUMPTIONS, VALUES, and MODELS
Worksheet A01: Constants and conversion factors used in calculations WS-5
Worksheet A02: General Assumptions Used in Worker Exposure Assessments WS-5
Worksheet A03a: Directed Ground Sprays (includes backpack, cut surface, and streamlineapplications) - General Assumptions Used in Worker Exposure Assessments
WS-6
Worksheet A03b: Hydraulic/Broadcast Ground Sprays - General Assumptions Used inWorker Exposure Assessments
WS-7
Worksheet A04: General Assumptions Used in Exposure Assessments for the GeneralPublic
WS-8
Worksheet A05a: Estimated concentrations of pesticides on various types of vegetationimmediately after application at 1 lb a.i./acre
WS-10
Worksheet A05b: Concentrations of chemical on spheres (berries) at the specifiedapplication rate. [FRUIT]
WS-10
Worksheet A06: Central estimates of off-site drift associated with aerial application ofpesticides (from Bird 1995)
WS-10
Worksheet A07a: Estimate of first-order absorption rate (ka in hours-1) and 95% confidenceintervals
WS-11
Worksheet A07b: Estimate of dermal permeability (Kp in cm/hr) and 95% confidenceintervals
WS-13
CHEMICAL SPECIFIC VALUES and ESTIMATES
Worksheet B01: Anticipated Application and Dilution Rates for clopyralid WS-14
Worksheet B02: Summary of central estimate and range of concentrations of clopyralid infield solutions
WS-14
Worksheet B03: Chemical specific values used for clopyralid in exposure assessmentworksheets.
WS-15
Worksheet B04: Calculation of first-order dermal absorption rate (ka) for clopyralid. WS-16
Worksheet B05: Calculation of dermal permeability rate (Kp) in cm/hour for clopyralid. WS-17
Worksheet B06: Summary of chemical specific dermal absorption values used for clopyraliddermal absorption.
WS-18
Worksheet B07: Estimates of the concentration of clopyralid in ambient water per lb a.i.applied per acre.
WS-18
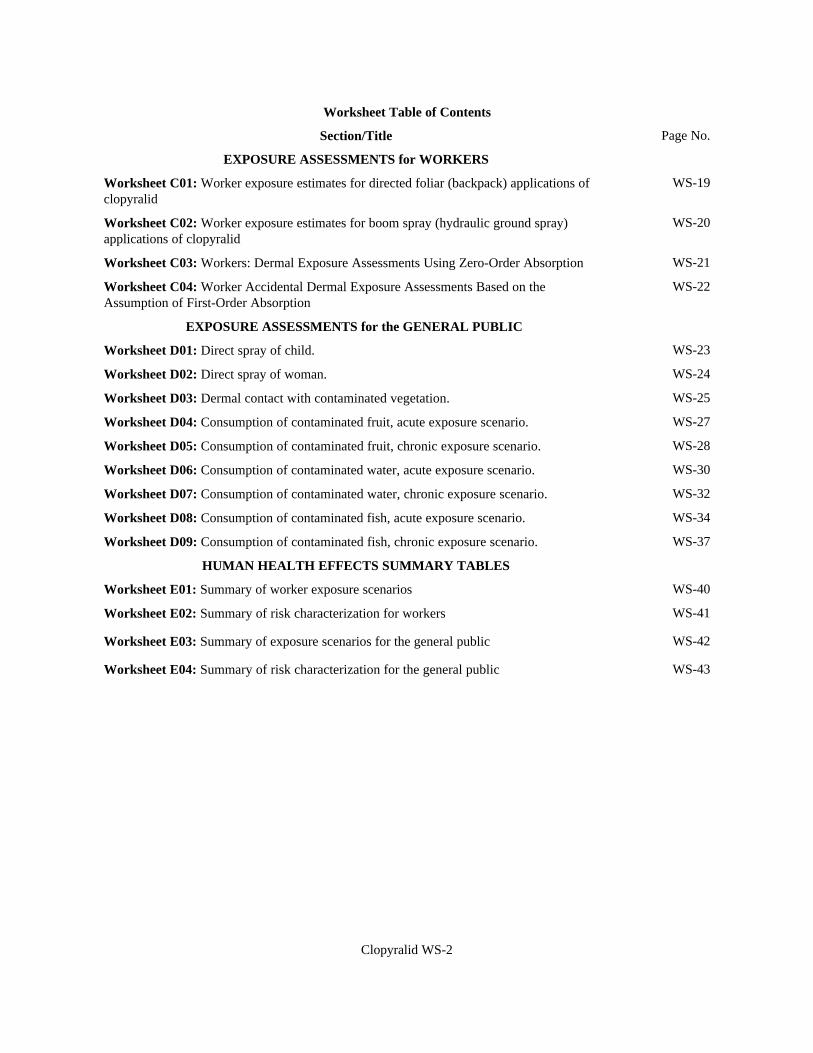
Worksheet Table of Contents
Section/Title Page No.
Clopyralid WS-2
EXPOSURE ASSESSMENTS for WORKERS
Worksheet C01: Worker exposure estimates for directed foliar (backpack) applications ofclopyralid
WS-19
Worksheet C02: Worker exposure estimates for boom spray (hydraulic ground spray)applications of clopyralid
WS-20
Worksheet C03: Workers: Dermal Exposure Assessments Using Zero-Order Absorption WS-21
Worksheet C04: Worker Accidental Dermal Exposure Assessments Based on theAssumption of First-Order Absorption
WS-22
EXPOSURE ASSESSMENTS for the GENERAL PUBLIC
Worksheet D01: Direct spray of child. WS-23
Worksheet D02: Direct spray of woman. WS-24
Worksheet D03: Dermal contact with contaminated vegetation. WS-25
Worksheet D04: Consumption of contaminated fruit, acute exposure scenario. WS-27
Worksheet D05: Consumption of contaminated fruit, chronic exposure scenario. WS-28
Worksheet D06: Consumption of contaminated water, acute exposure scenario. WS-30
Worksheet D07: Consumption of contaminated water, chronic exposure scenario. WS-32
Worksheet D08: Consumption of contaminated fish, acute exposure scenario. WS-34
Worksheet D09: Consumption of contaminated fish, chronic exposure scenario. WS-37
HUMAN HEALTH EFFECTS SUMMARY TABLES
Worksheet E01: Summary of worker exposure scenarios WS-40
Worksheet E02: Summary of risk characterization for workers WS-41
Worksheet E03: Summary of exposure scenarios for the general public WS-42
Worksheet E04: Summary of risk characterization for the general public WS-43
Worksheet Table of Contents
Section/Title Page No.
Clopyralid WS-3
EXPOSURE ASSESSMENTS for Terrestrial Species
Worksheet F01: Direct spray of small mammal assuming first-order absorption kinetics. WS-44
Worksheet F02: Direct spray of small mammal assuming 100% absorption over the first 24hour period.
WS-46
Worksheet F03: Direct spray of bee assuming 100% absorption over the first 24 hour period. WS-47
Worksheet F04: Consumption of contaminated fruit by a small mammal, acute exposurescenario.
WS-48
Worksheet F05: Consumption of contaminated vegetation by a small mammal, chronicexposure scenario.
WS-49
Worksheet F06: Consumption of contaminated water by a small mammal, acute exposurescenario
WS-51
Worksheet F07: Consumption of contaminated water, chronic exposure scenario. WS-52
Summary Tables for Terrestrial Species
Worksheet G01: Summary of Exposure Scenarios for terrestrial animals WS-53
Worksheet G02: Summary of quantitative risk characterization for terrestrial animals. WS-54
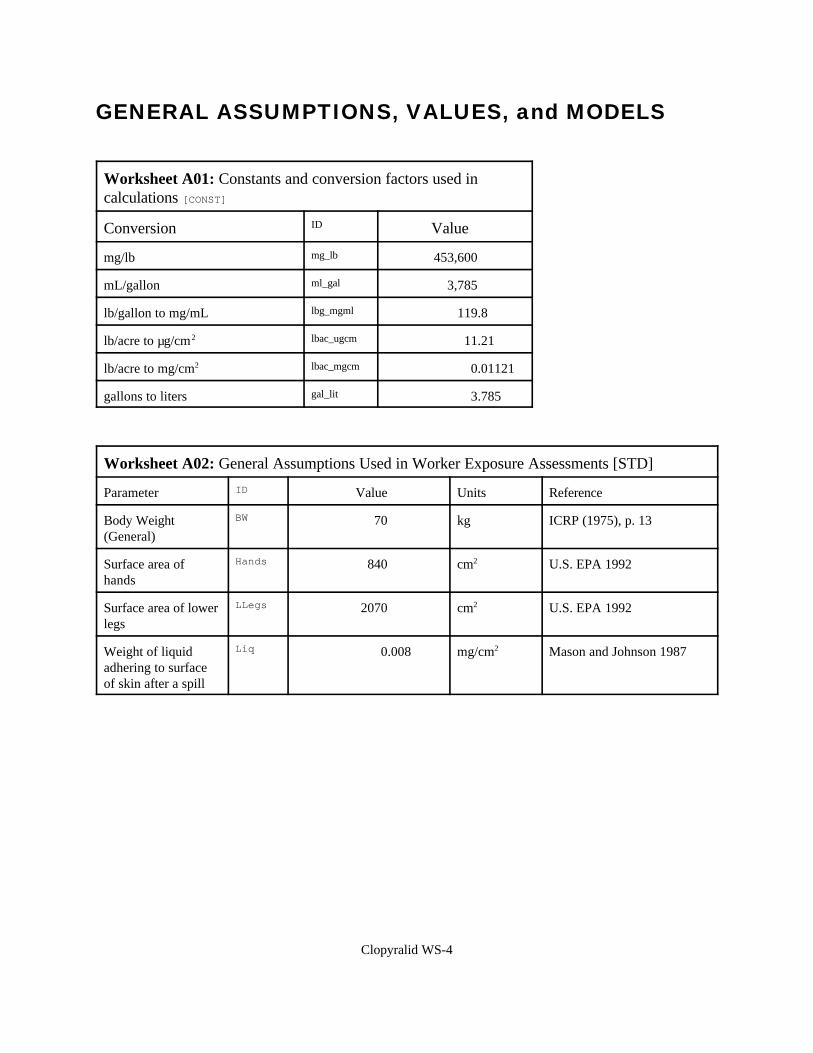
Clopyralid WS-4
GENERAL ASSUMPTIONS, VALUES, and MODELS
Worksheet A01: Constants and conversion factors used incalculations [CONST]
Conversion ID Value
mg/lb mg_lb 453,600
mL/gallon ml_gal 3,785
lb/gallon to mg/mL lbg_mgml 119.8
lb/acre to µg/cm2 lbac_ugcm 11.21
lb/acre to mg/cm2 lbac_mgcm 0.01121
gallons to liters gal_lit 3.785
Worksheet A02: General Assumptions Used in Worker Exposure Assessments [STD]
Parameter ID Value Units Reference
Body Weight(General)
BW 70 kg ICRP (1975), p. 13
Surface area ofhands
Hands 840 cm2 U.S. EPA 1992
Surface area of lowerlegs
LLegs 2070 cm2 U.S. EPA 1992
Weight of liquidadhering to surfaceof skin after a spill
Liq 0.008 mg/cm2 Mason and Johnson 1987
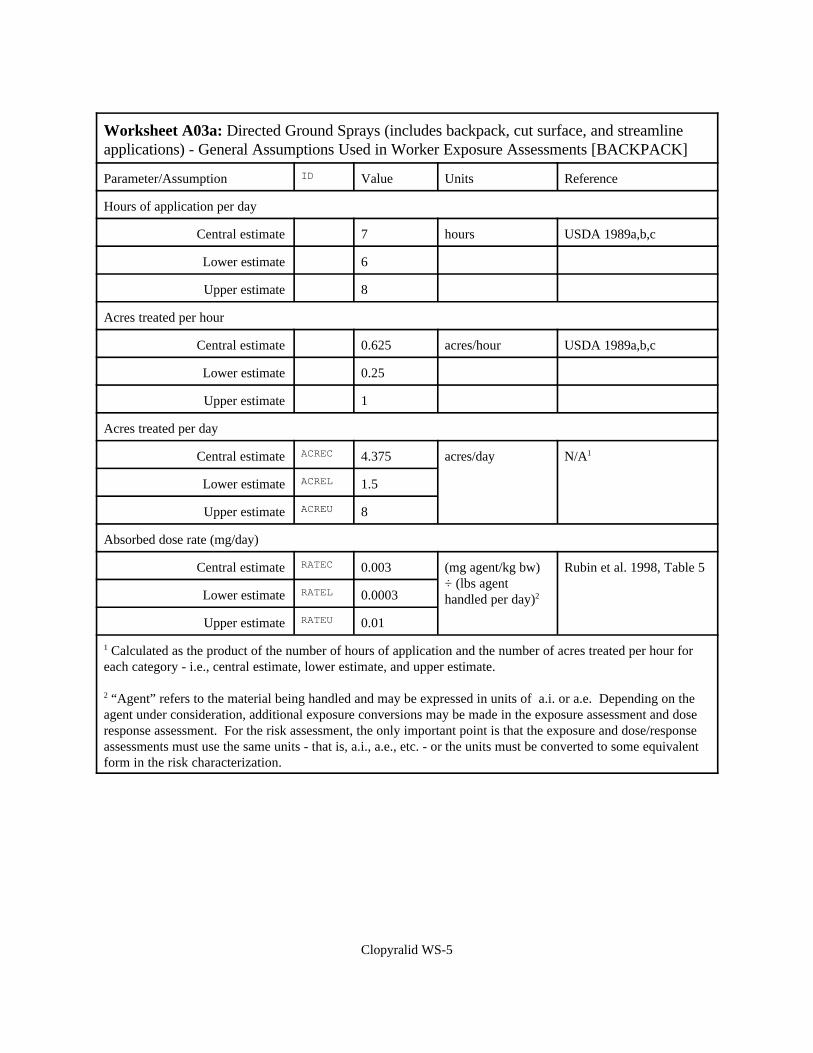
Clopyralid WS-5
Worksheet A03a: Directed Ground Sprays (includes backpack, cut surface, and streamlineapplications) - General Assumptions Used in Worker Exposure Assessments [BACKPACK]
Parameter/Assumption ID Value Units Reference
Hours of application per day
Central estimate 7 hours USDA 1989a,b,c
Lower estimate 6
Upper estimate 8
Acres treated per hour
Central estimate 0.625 acres/hour USDA 1989a,b,c
Lower estimate 0.25
Upper estimate 1
Acres treated per day
Central estimate ACREC 4.375 acres/day N/A1
Lower estimate ACREL 1.5
Upper estimate ACREU 8
Absorbed dose rate (mg/day)
Central estimate RATEC 0.003 (mg agent/kg bw)÷ (lbs agenthandled per day)2
Rubin et al. 1998, Table 5
Lower estimate RATEL 0.0003
Upper estimate RATEU 0.01
1 Calculated as the product of the number of hours of application and the number of acres treated per hour foreach category - i.e., central estimate, lower estimate, and upper estimate.
2 “Agent” refers to the material being handled and may be expressed in units of a.i. or a.e. Depending on theagent under consideration, additional exposure conversions may be made in the exposure assessment and doseresponse assessment. For the risk assessment, the only important point is that the exposure and dose/responseassessments must use the same units - that is, a.i., a.e., etc. - or the units must be converted to some equivalentform in the risk characterization.

Clopyralid WS-6
Worksheet A03b: Hydraulic/Broadcast Ground Sprays - General Assumptions Used inWorker Exposure Assessments [HYDSPRAY]
Parameter/Assumption ID Value Units Reference
Hours of application per day
Central estimate 7 hours USDA 1989a,b,c
Lower estimate 6
Upper estimate 8
Acres treated per hour
Central estimate 16 acres/hour USDA 1989a,b,c
Lower estimate 11
Upper estimate 21
Acres treated per day
Central estimate ACREC 112 acres/day N/A1
Lower estimate ACREL 66
Upper estimate ACREU 168
Absorbed dose rate
Central estimate RATEC 0.0002 (mg agent/kg bw)÷ (lbs agenthandled per day) 2
Rubin et al. 1998, Table 5
Lower estimate RATEL 0.00001
Upper estimate RATEU 0.0009
1 Calculated as the product of the number of hours of application and the number of acres treated per hour foreach category - i.e., central estimate, lower estimate, and upper estimate.
2 “Agent” refers to the material being handled and may be expressed in units of a.i. or a.e. Depending on theagent under consideration, additional exposure conversions may be made in the exposure assessment and doseresponse assessment. For the risk assessment, the only important point is that the exposure and dose/responseassessments must use the same units - that is, a.i., a.e., etc. - or the units must be converted to some equivalentform in the risk characterization.
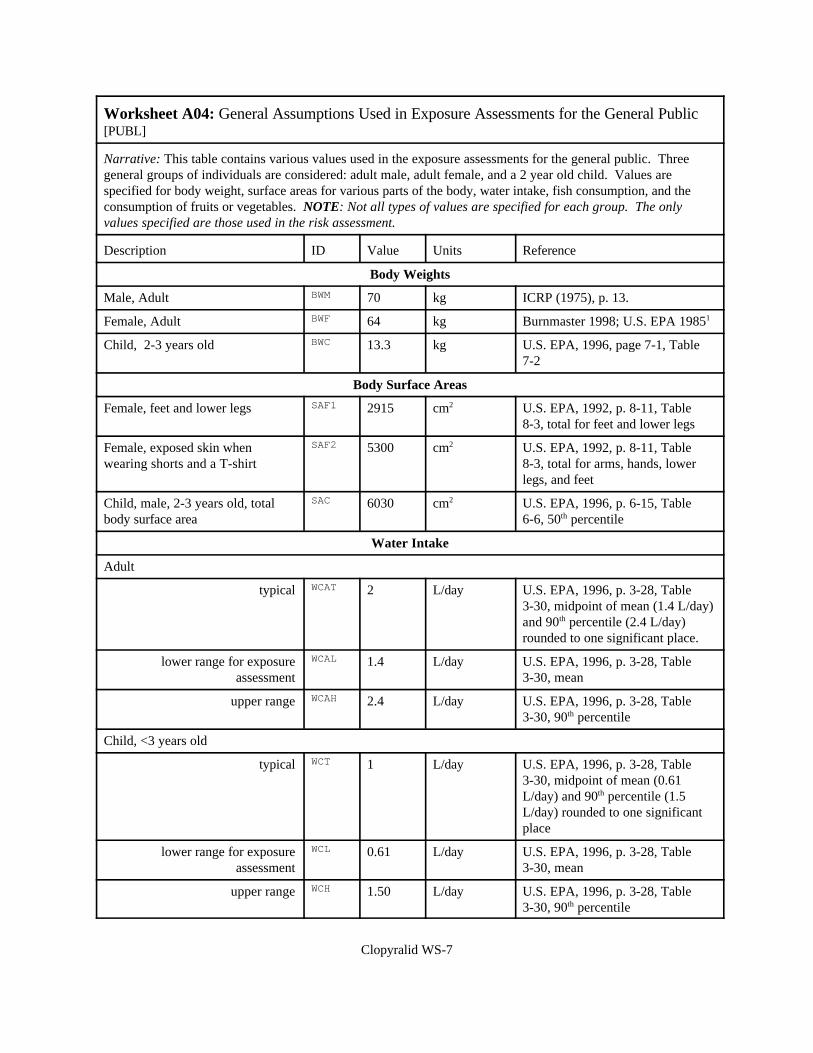
Clopyralid WS-7
Worksheet A04: General Assumptions Used in Exposure Assessments for the General Public[PUBL]
Narrative: This table contains various values used in the exposure assessments for the general public. Threegeneral groups of individuals are considered: adult male, adult female, and a 2 year old child. Values arespecified for body weight, surface areas for various parts of the body, water intake, fish consumption, and theconsumption of fruits or vegetables. NOTE: Not all types of values are specified for each group. The onlyvalues specified are those used in the risk assessment.
Description ID Value Units Reference
Body Weights
Male, Adult BWM 70 kg ICRP (1975), p. 13.
Female, Adult BWF 64 kg Burnmaster 1998; U.S. EPA 19851
Child, 2-3 years old BWC 13.3 kg U.S. EPA, 1996, page 7-1, Table7-2
Body Surface Areas
Female, feet and lower legs SAF1 2915 cm2 U.S. EPA, 1992, p. 8-11, Table8-3, total for feet and lower legs
Female, exposed skin whenwearing shorts and a T-shirt
SAF2 5300 cm2 U.S. EPA, 1992, p. 8-11, Table8-3, total for arms, hands, lowerlegs, and feet
Child, male, 2-3 years old, totalbody surface area
SAC 6030 cm2 U.S. EPA, 1996, p. 6-15, Table6-6, 50th percentile
Water Intake
Adult
typical WCAT 2 L/day U.S. EPA, 1996, p. 3-28, Table3-30, midpoint of mean (1.4 L/day)and 90th percentile (2.4 L/day)rounded to one significant place.
lower range for exposureassessment
WCAL 1.4 L/day U.S. EPA, 1996, p. 3-28, Table3-30, mean
upper range WCAH 2.4 L/day U.S. EPA, 1996, p. 3-28, Table3-30, 90th percentile
Child, <3 years old
typical WCT 1 L/day U.S. EPA, 1996, p. 3-28, Table3-30, midpoint of mean (0.61L/day) and 90th percentile (1.5L/day) rounded to one significantplace
lower range for exposureassessment
WCL 0.61 L/day U.S. EPA, 1996, p. 3-28, Table3-30, mean
upper range WCH 1.50 L/day U.S. EPA, 1996, p. 3-28, Table3-30, 90th percentile
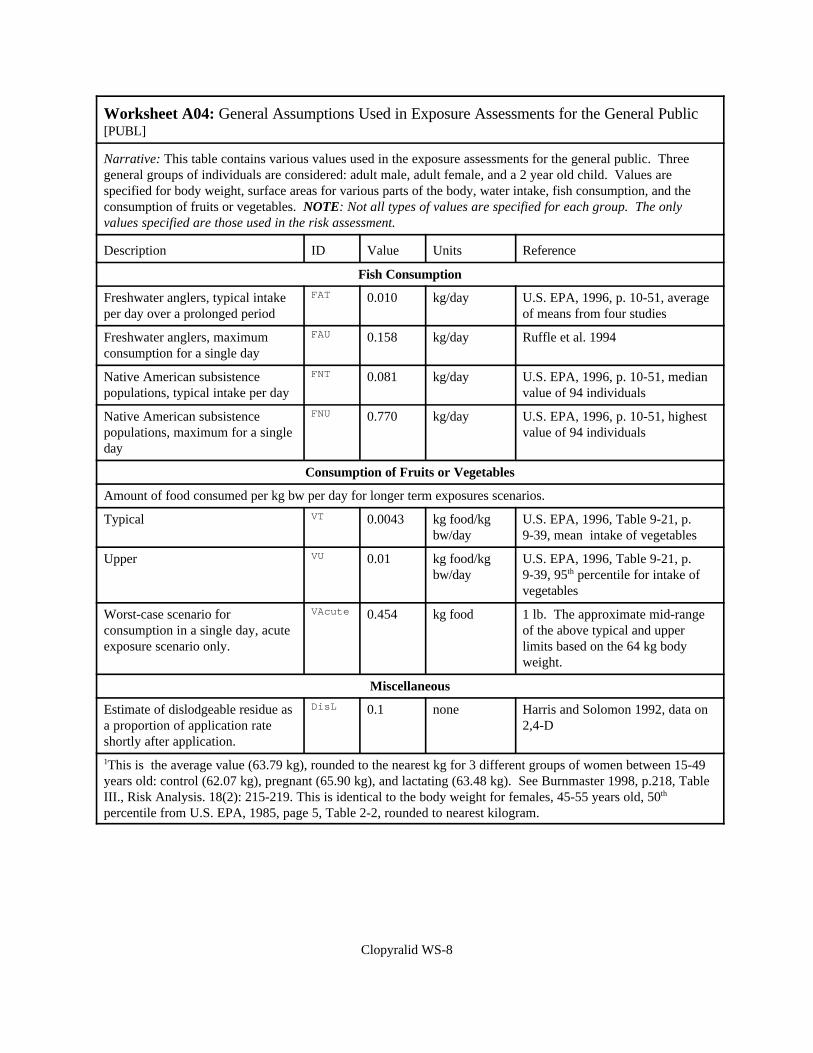
Worksheet A04: General Assumptions Used in Exposure Assessments for the General Public[PUBL]
Narrative: This table contains various values used in the exposure assessments for the general public. Threegeneral groups of individuals are considered: adult male, adult female, and a 2 year old child. Values arespecified for body weight, surface areas for various parts of the body, water intake, fish consumption, and theconsumption of fruits or vegetables. NOTE: Not all types of values are specified for each group. The onlyvalues specified are those used in the risk assessment.
Description ID Value Units Reference
Clopyralid WS-8
Fish Consumption
Freshwater anglers, typical intakeper day over a prolonged period
FAT 0.010 kg/day U.S. EPA, 1996, p. 10-51, averageof means from four studies
Freshwater anglers, maximumconsumption for a single day
FAU 0.158 kg/day Ruffle et al. 1994
Native American subsistencepopulations, typical intake per day
FNT 0.081 kg/day U.S. EPA, 1996, p. 10-51, medianvalue of 94 individuals
Native American subsistencepopulations, maximum for a singleday
FNU 0.770 kg/day U.S. EPA, 1996, p. 10-51, highestvalue of 94 individuals
Consumption of Fruits or Vegetables
Amount of food consumed per kg bw per day for longer term exposures scenarios.
Typical VT 0.0043 kg food/kgbw/day
U.S. EPA, 1996, Table 9-21, p.9-39, mean intake of vegetables
Upper VU 0.01 kg food/kgbw/day
U.S. EPA, 1996, Table 9-21, p.9-39, 95th percentile for intake ofvegetables
Worst-case scenario forconsumption in a single day, acuteexposure scenario only.
VAcute 0.454 kg food 1 lb. The approximate mid-rangeof the above typical and upperlimits based on the 64 kg bodyweight.
Miscellaneous
Estimate of dislodgeable residue asa proportion of application rateshortly after application.
DisL 0.1 none Harris and Solomon 1992, data on2,4-D
1This is the average value (63.79 kg), rounded to the nearest kg for 3 different groups of women between 15-49years old: control (62.07 kg), pregnant (65.90 kg), and lactating (63.48 kg). See Burnmaster 1998, p.218, TableIII., Risk Analysis. 18(2): 215-219. This is identical to the body weight for females, 45-55 years old, 50th
percentile from U.S. EPA, 1985, page 5, Table 2-2, rounded to nearest kilogram.
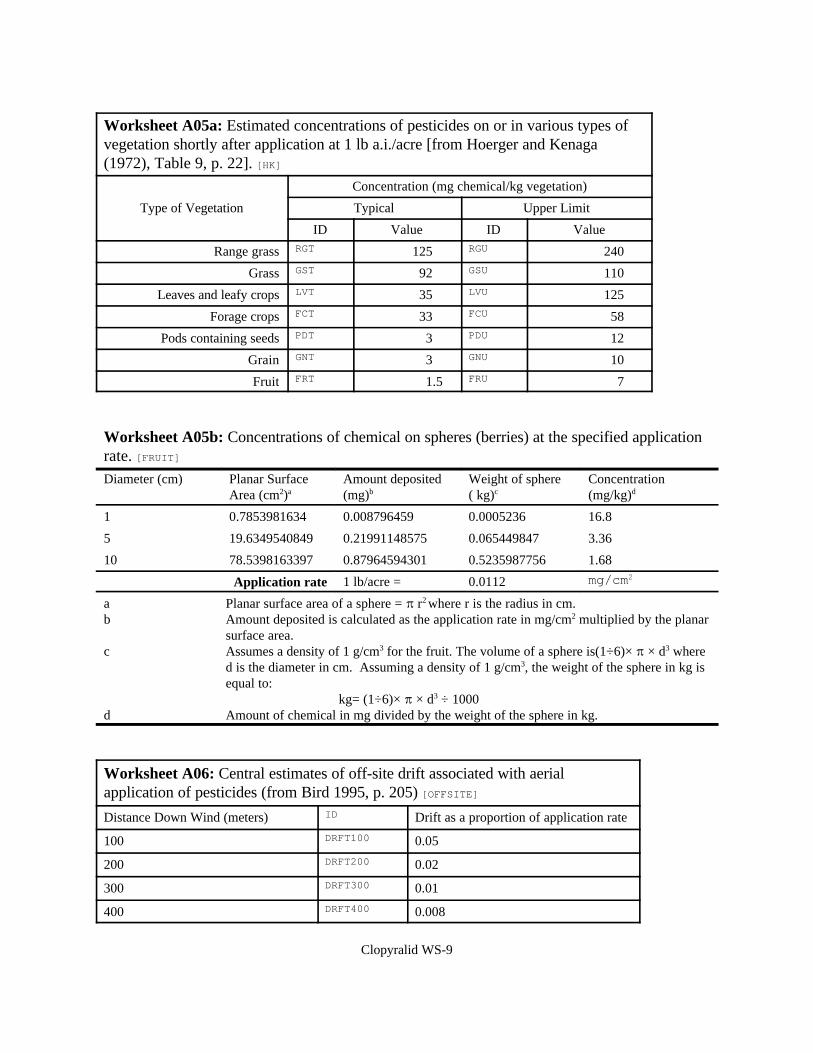
Clopyralid WS-9
Worksheet A05a: Estimated concentrations of pesticides on or in various types ofvegetation shortly after application at 1 lb a.i./acre [from Hoerger and Kenaga(1972), Table 9, p. 22]. [HK]
Type of Vegetation
Concentration (mg chemical/kg vegetation)
Typical Upper Limit
ID Value ID Value
Range grass RGT 125 RGU 240
Grass GST 92 GSU 110
Leaves and leafy crops LVT 35 LVU 125
Forage crops FCT 33 FCU 58
Pods containing seeds PDT 3 PDU 12
Grain GNT 3 GNU 10
Fruit FRT 1.5 FRU 7
Worksheet A05b: Concentrations of chemical on spheres (berries) at the specified applicationrate. [FRUIT]
Diameter (cm) Planar SurfaceArea (cm2)a
Amount deposited(mg)b
Weight of sphere( kg)c
Concentration(mg/kg)d
1 0.7853981634 0.008796459 0.0005236 16.8
5 19.6349540849 0.21991148575 0.065449847 3.36
10 78.5398163397 0.87964594301 0.5235987756 1.68
Application rate 1 lb/acre = 0.0112 mg/cm2
a Planar surface area of a sphere = B r2 where r is the radius in cm.b Amount deposited is calculated as the application rate in mg/cm2 multiplied by the planar
surface area.c Assumes a density of 1 g/cm3 for the fruit. The volume of a sphere is(1÷6)× B × d3 where
d is the diameter in cm. Assuming a density of 1 g/cm3, the weight of the sphere in kg isequal to:
kg= (1÷6)× B × d3 ÷ 1000d Amount of chemical in mg divided by the weight of the sphere in kg.
Worksheet A06: Central estimates of off-site drift associated with aerialapplication of pesticides (from Bird 1995, p. 205) [OFFSITE]
Distance Down Wind (meters) ID Drift as a proportion of application rate
100 DRFT100 0.05
200 DRFT200 0.02
300 DRFT300 0.01
400 DRFT400 0.008
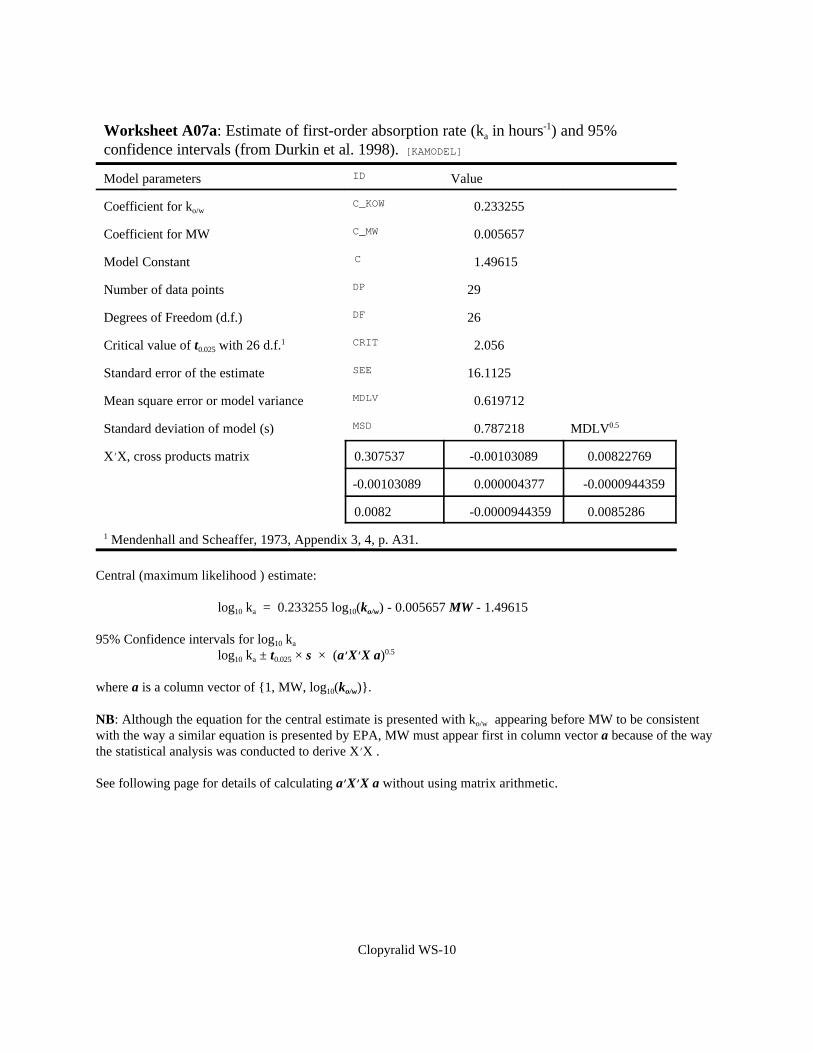
Clopyralid WS-10
Worksheet A07a: Estimate of first-order absorption rate (ka in hours-1) and 95%confidence intervals (from Durkin et al. 1998). [KAMODEL]
Model parameters ID Value
Coefficient for ko/wC_KOW 0.233255
Coefficient for MW C_MW 0.005657
Model Constant C 1.49615
Number of data points DP 29
Degrees of Freedom (d.f.) DF 26
Critical value of t0.025 with 26 d.f.1 CRIT 2.056
Standard error of the estimate SEE 16.1125
Mean square error or model variance MDLV 0.619712
Standard deviation of model (s) MSD 0.787218 MDLV0.5
XNX, cross products matrix 0.307537 -0.00103089 0.00822769
-0.00103089 0.000004377 -0.0000944359
0.0082 -0.0000944359 0.0085286
1 Mendenhall and Scheaffer, 1973, Appendix 3, 4, p. A31.
Central (maximum likelihood ) estimate:
log10 ka = 0.233255 log10(ko/w) - 0.005657 MW - 1.49615
95% Confidence intervals for log10 ka
log10 ka ± t0.025 × s × (aNNXNNX a)0.5
where a is a column vector of {1, MW, log10(ko/w)}.
NB: Although the equation for the central estimate is presented with ko/w appearing before MW to be consistentwith the way a similar equation is presented by EPA, MW must appear first in column vector a because of the waythe statistical analysis was conducted to derive XNX .
See following page for details of calculating aNNXNNX a without using matrix arithmetic.
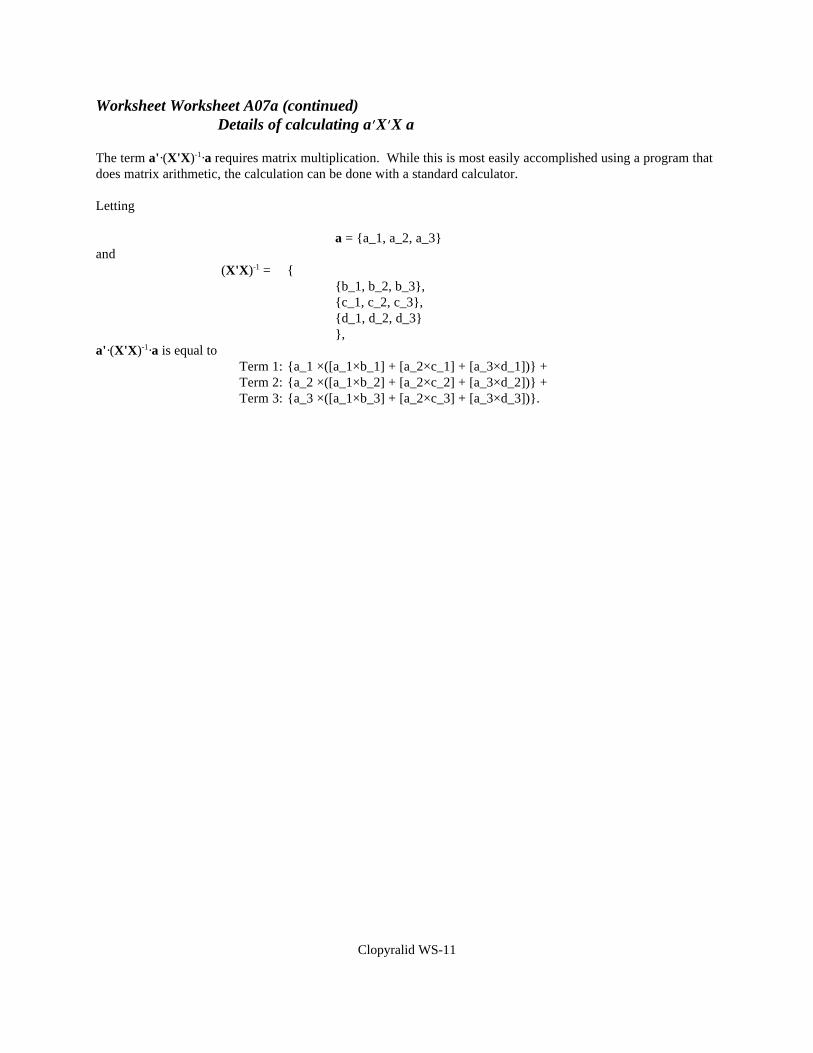
Clopyralid WS-11
Worksheet Worksheet A07a (continued)Details of calculating aNNXNNX a
The term a'·(X'X)-1·a requires matrix multiplication. While this is most easily accomplished using a program thatdoes matrix arithmetic, the calculation can be done with a standard calculator.
Letting
a = {a_1, a_2, a_3} and
(X'X)-1 = {{b_1, b_2, b_3},{c_1, c_2, c_3},{d_1, d_2, d_3}},
a'·(X'X)-1·a is equal toTerm 1: {a_1 ×([a_1×b_1] + [a_2×c_1] + [a_3×d_1])} + Term 2: {a_2 ×([a_1×b_2] + [a_2×c_2] + [a_3×d_2])} +Term 3: {a_3 ×([a_1×b_3] + [a_2×c_3] + [a_3×d_3])}.
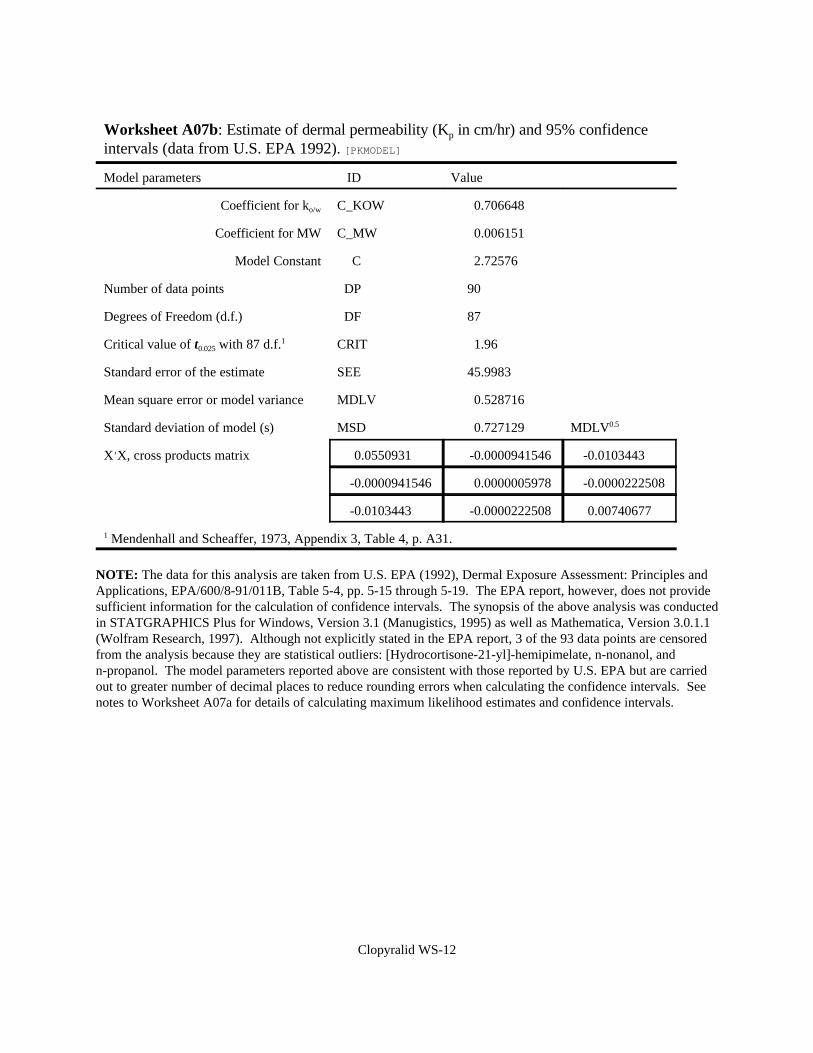
Clopyralid WS-12
Worksheet A07b: Estimate of dermal permeability (Kp in cm/hr) and 95% confidenceintervals (data from U.S. EPA 1992). [PKMODEL]
Model parameters ID Value
Coefficient for ko/w C_KOW 0.706648
Coefficient for MW C_MW 0.006151
Model Constant C 2.72576
Number of data points DP 90
Degrees of Freedom (d.f.) DF 87
Critical value of t0.025 with 87 d.f.1 CRIT 1.96
Standard error of the estimate SEE 45.9983
Mean square error or model variance MDLV 0.528716
Standard deviation of model (s) MSD 0.727129 MDLV0.5
XNX, cross products matrix 0.0550931 -0.0000941546 -0.0103443
-0.0000941546 0.0000005978 -0.0000222508
-0.0103443 -0.0000222508 0.00740677
1 Mendenhall and Scheaffer, 1973, Appendix 3, Table 4, p. A31.
NOTE: The data for this analysis are taken from U.S. EPA (1992), Dermal Exposure Assessment: Principles andApplications, EPA/600/8-91/011B, Table 5-4, pp. 5-15 through 5-19. The EPA report, however, does not providesufficient information for the calculation of confidence intervals. The synopsis of the above analysis was conductedin STATGRAPHICS Plus for Windows, Version 3.1 (Manugistics, 1995) as well as Mathematica, Version 3.0.1.1(Wolfram Research, 1997). Although not explicitly stated in the EPA report, 3 of the 93 data points are censoredfrom the analysis because they are statistical outliers: [Hydrocortisone-21-yl]-hemipimelate, n-nonanol, andn-propanol. The model parameters reported above are consistent with those reported by U.S. EPA but are carriedout to greater number of decimal places to reduce rounding errors when calculating the confidence intervals. Seenotes to Worksheet A07a for details of calculating maximum likelihood estimates and confidence intervals.
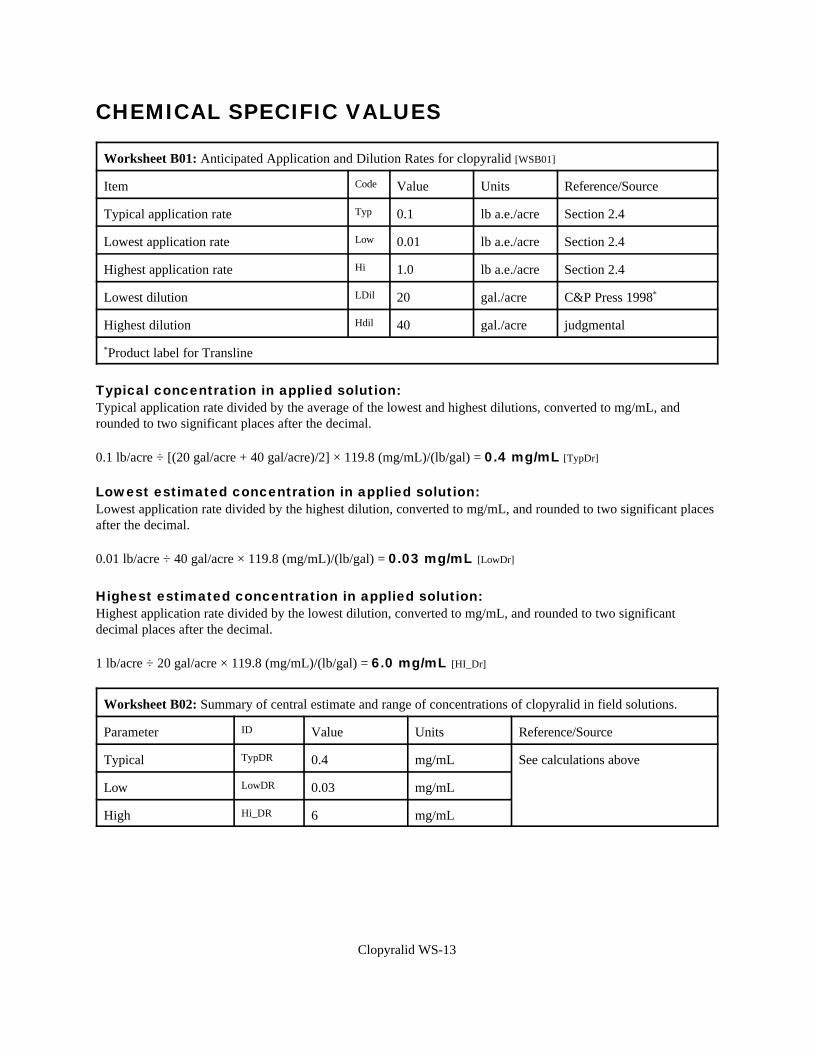
Clopyralid WS-13
CHEMICAL SPECIFIC VALUES
Worksheet B01: Anticipated Application and Dilution Rates for clopyralid [WSB01]
Item Code Value Units Reference/Source
Typical application rate Typ 0.1 lb a.e./acre Section 2.4
Lowest application rate Low 0.01 lb a.e./acre Section 2.4
Highest application rate Hi 1.0 lb a.e./acre Section 2.4
Lowest dilution LDil 20 gal./acre C&P Press 1998*
Highest dilution Hdil 40 gal./acre judgmental
*Product label for Transline
Typical concentration in applied solution:Typical application rate divided by the average of the lowest and highest dilutions, converted to mg/mL, androunded to two significant places after the decimal.
0.1 lb/acre ÷ [(20 gal/acre + 40 gal/acre)/2] × 119.8 (mg/mL)/(lb/gal) = 0.4 mg/mL [TypDr]
Lowest estimated concentration in applied solution:Lowest application rate divided by the highest dilution, converted to mg/mL, and rounded to two significant placesafter the decimal.
0.01 lb/acre ÷ 40 gal/acre × 119.8 (mg/mL)/(lb/gal) = 0.03 mg/mL [LowDr]
Highest estimated concentration in applied solution:Highest application rate divided by the lowest dilution, converted to mg/mL, and rounded to two significantdecimal places after the decimal.
1 lb/acre ÷ 20 gal/acre × 119.8 (mg/mL)/(lb/gal) = 6.0 mg/mL [HI_Dr]
Worksheet B02: Summary of central estimate and range of concentrations of clopyralid in field solutions.
Parameter ID Value Units Reference/Source
Typical TypDR 0.4 mg/mL See calculations above
Low LowDR 0.03 mg/mL
High Hi_DR 6 mg/mL
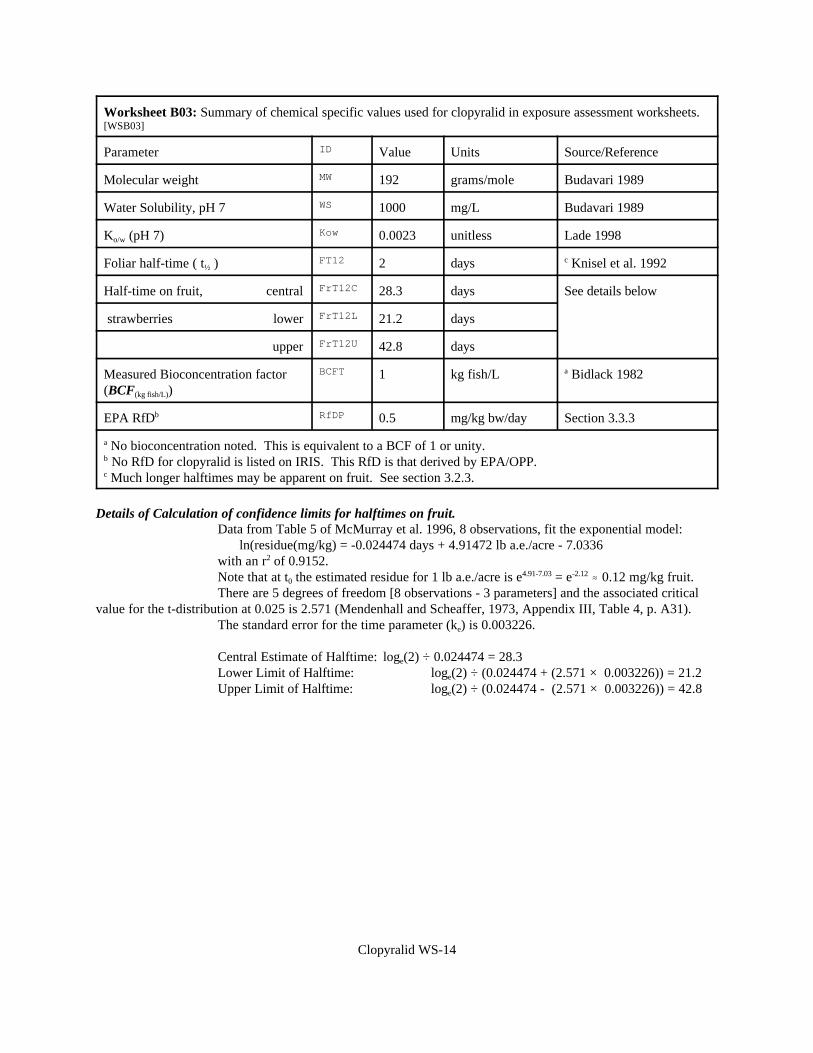
Clopyralid WS-14
Worksheet B03: Summary of chemical specific values used for clopyralid in exposure assessment worksheets.[WSB03]
Parameter ID Value Units Source/Reference
Molecular weight MW 192 grams/mole Budavari 1989
Water Solubility, pH 7 WS 1000 mg/L Budavari 1989
Ko/w (pH 7) Kow 0.0023 unitless Lade 1998
Foliar half-time ( t½ ) FT12 2 days c Knisel et al. 1992
Half-time on fruit, central FrT12C 28.3 days See details below
strawberries lower FrT12L 21.2 days
upper FrT12U 42.8 days
Measured Bioconcentration factor(BCF(kg fish/L))
BCFT 1 kg fish/L a Bidlack 1982
EPA RfDb RfDP 0.5 mg/kg bw/day Section 3.3.3
a No bioconcentration noted. This is equivalent to a BCF of 1 or unity.b No RfD for clopyralid is listed on IRIS. This RfD is that derived by EPA/OPP.c Much longer halftimes may be apparent on fruit. See section 3.2.3.
Details of Calculation of confidence limits for halftimes on fruit.Data from Table 5 of McMurray et al. 1996, 8 observations, fit the exponential model:
ln(residue(mg/kg) = -0.024474 days + 4.91472 lb a.e./acre - 7.0336with an r2 of 0.9152.Note that at t0 the estimated residue for 1 lb a.e./acre is e4.91-7.03 = e-2.12 . 0.12 mg/kg fruit.There are 5 degrees of freedom [8 observations - 3 parameters] and the associated critical
value for the t-distribution at 0.025 is 2.571 (Mendenhall and Scheaffer, 1973, Appendix III, Table 4, p. A31).The standard error for the time parameter (ke) is 0.003226.
Central Estimate of Halftime: loge(2) ÷ 0.024474 = 28.3Lower Limit of Halftime: loge(2) ÷ (0.024474 + (2.571 × 0.003226)) = 21.2Upper Limit of Halftime: loge(2) ÷ (0.024474 - (2.571 × 0.003226)) = 42.8
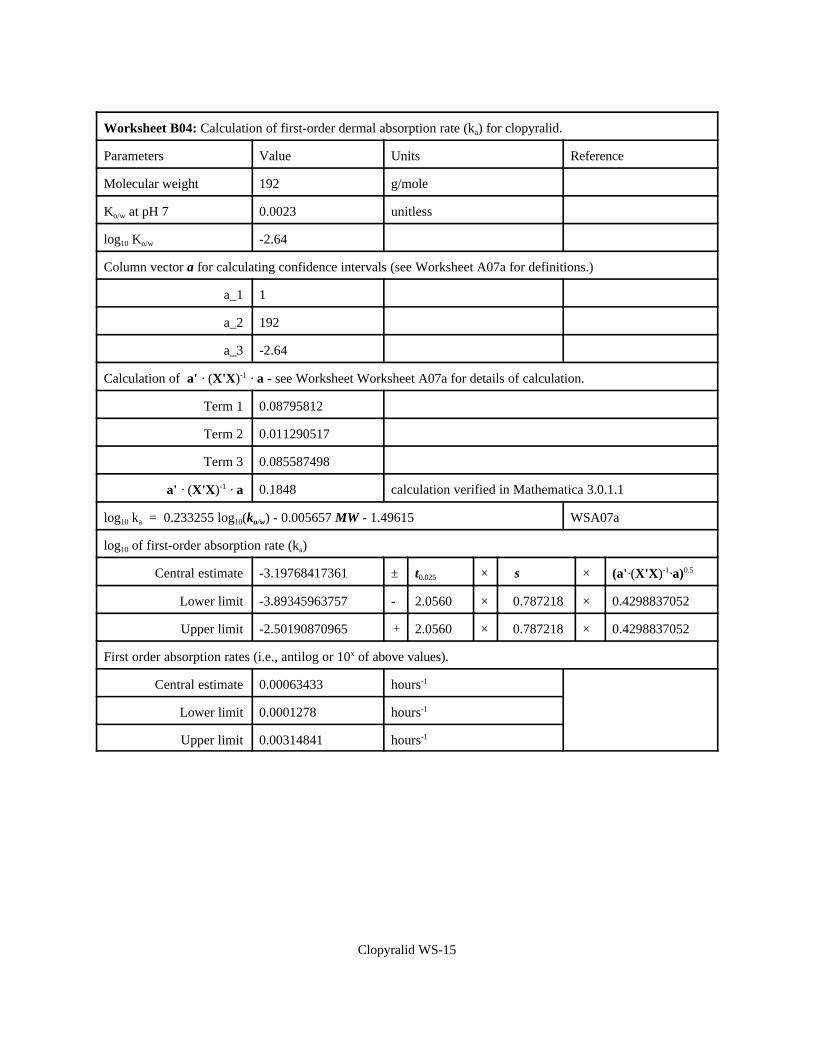
Clopyralid WS-15
Worksheet B04: Calculation of first-order dermal absorption rate (ka) for clopyralid.
Parameters Value Units Reference
Molecular weight 192 g/mole
Ko/w at pH 7 0.0023 unitless
log10 Ko/w -2.64
Column vector a for calculating confidence intervals (see Worksheet A07a for definitions.)
a_1 1
a_2 192
a_3 -2.64
Calculation of a' · (X'X)-1 · a - see Worksheet Worksheet A07a for details of calculation.
Term 1 0.08795812
Term 2 0.011290517
Term 3 0.085587498
a' · (X'X)-1 · a 0.1848 calculation verified in Mathematica 3.0.1.1
log10 ka = 0.233255 log10(ko/w) - 0.005657 MW - 1.49615 WSA07a
log10 of first-order absorption rate (ka)
Central estimate -3.19768417361 ± t0.025 × s × (a'·(X'X)-1·a)0.5
Lower limit -3.89345963757 - 2.0560 × 0.787218 × 0.4298837052
Upper limit -2.50190870965 % 2.0560 × 0.787218 × 0.4298837052
First order absorption rates (i.e., antilog or 10x of above values).
Central estimate 0.00063433 hours-1
Lower limit 0.0001278 hours-1
Upper limit 0.00314841 hours-1
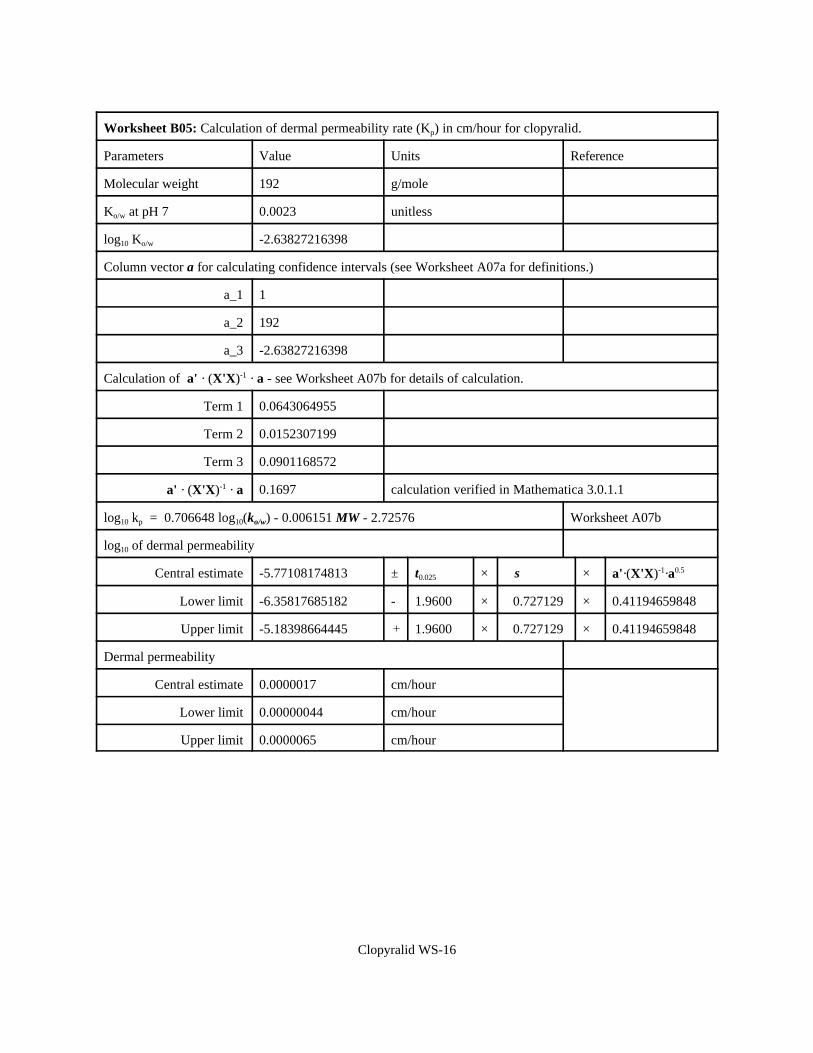
Clopyralid WS-16
Worksheet B05: Calculation of dermal permeability rate (Kp) in cm/hour for clopyralid.
Parameters Value Units Reference
Molecular weight 192 g/mole
Ko/w at pH 7 0.0023 unitless
log10 Ko/w -2.63827216398
Column vector a for calculating confidence intervals (see Worksheet A07a for definitions.)
a_1 1
a_2 192
a_3 -2.63827216398
Calculation of a' · (X'X)-1 · a - see Worksheet A07b for details of calculation.
Term 1 0.0643064955
Term 2 0.0152307199
Term 3 0.0901168572
a' · (X'X)-1 · a 0.1697 calculation verified in Mathematica 3.0.1.1
log10 kp = 0.706648 log10(ko/w) - 0.006151 MW - 2.72576 Worksheet A07b
log10 of dermal permeability
Central estimate -5.77108174813 ± t0.025 × s × a'·(X'X)-1·a0.5
Lower limit -6.35817685182 - 1.9600 × 0.727129 × 0.41194659848
Upper limit -5.18398664445 % 1.9600 × 0.727129 × 0.41194659848
Dermal permeability
Central estimate 0.0000017 cm/hour
Lower limit 0.00000044 cm/hour
Upper limit 0.0000065 cm/hour
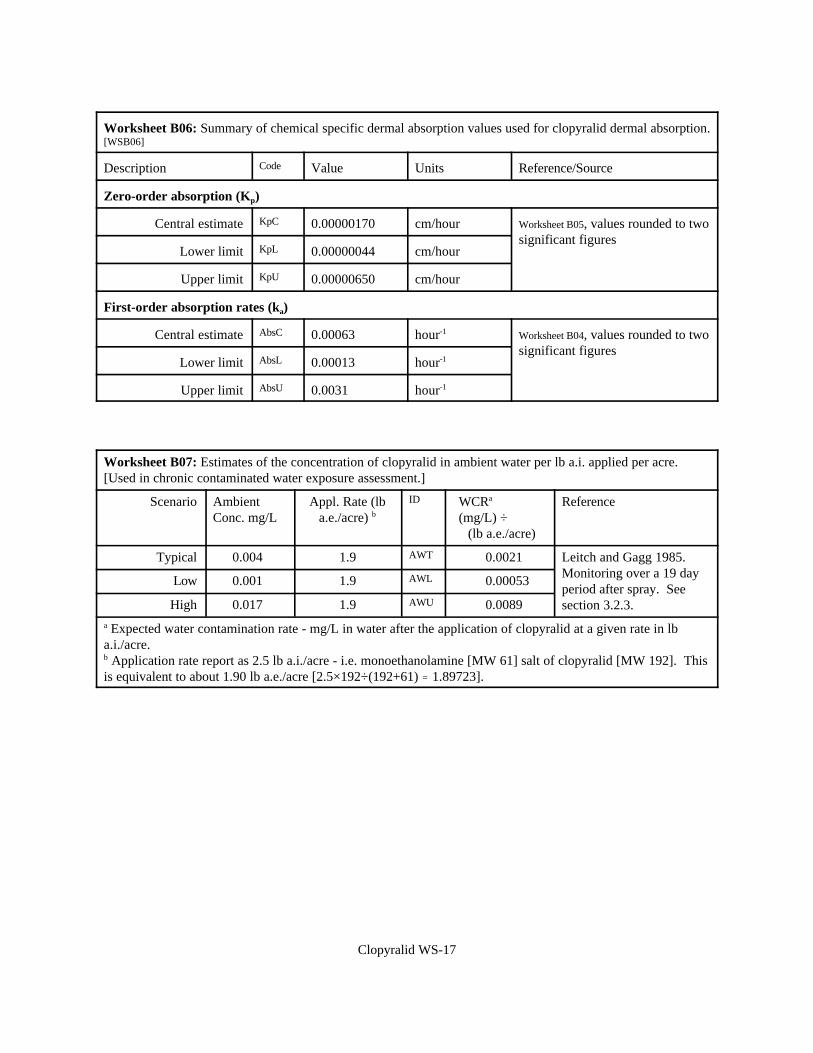
Clopyralid WS-17
Worksheet B06: Summary of chemical specific dermal absorption values used for clopyralid dermal absorption.[WSB06]
Description Code Value Units Reference/Source
Zero-order absorption (Kp)
Central estimate KpC 0.00000170 cm/hour Worksheet B05, values rounded to twosignificant figures
Lower limit KpL 0.00000044 cm/hour
Upper limit KpU 0.00000650 cm/hour
First-order absorption rates (ka)
Central estimate AbsC 0.00063 hour-1 Worksheet B04, values rounded to twosignificant figures
Lower limit AbsL 0.00013 hour-1
Upper limit AbsU 0.0031 hour-1
Worksheet B07: Estimates of the concentration of clopyralid in ambient water per lb a.i. applied per acre.[Used in chronic contaminated water exposure assessment.]
Scenario AmbientConc. mg/L
Appl. Rate (lba.e./acre) b
ID WCRa
(mg/L) ÷(lb a.e./acre)
Reference
Typical 0.004 1.9 AWT 0.0021 Leitch and Gagg 1985. Monitoring over a 19 dayperiod after spray. Seesection 3.2.3.
Low 0.001 1.9 AWL 0.00053
High 0.017 1.9 AWU 0.0089
a Expected water contamination rate - mg/L in water after the application of clopyralid at a given rate in lba.i./acre.b Application rate report as 2.5 lb a.i./acre - i.e. monoethanolamine [MW 61] salt of clopyralid [MW 192]. Thisis equivalent to about 1.90 lb a.e./acre [2.5×192÷(192+61) . 1.89723].
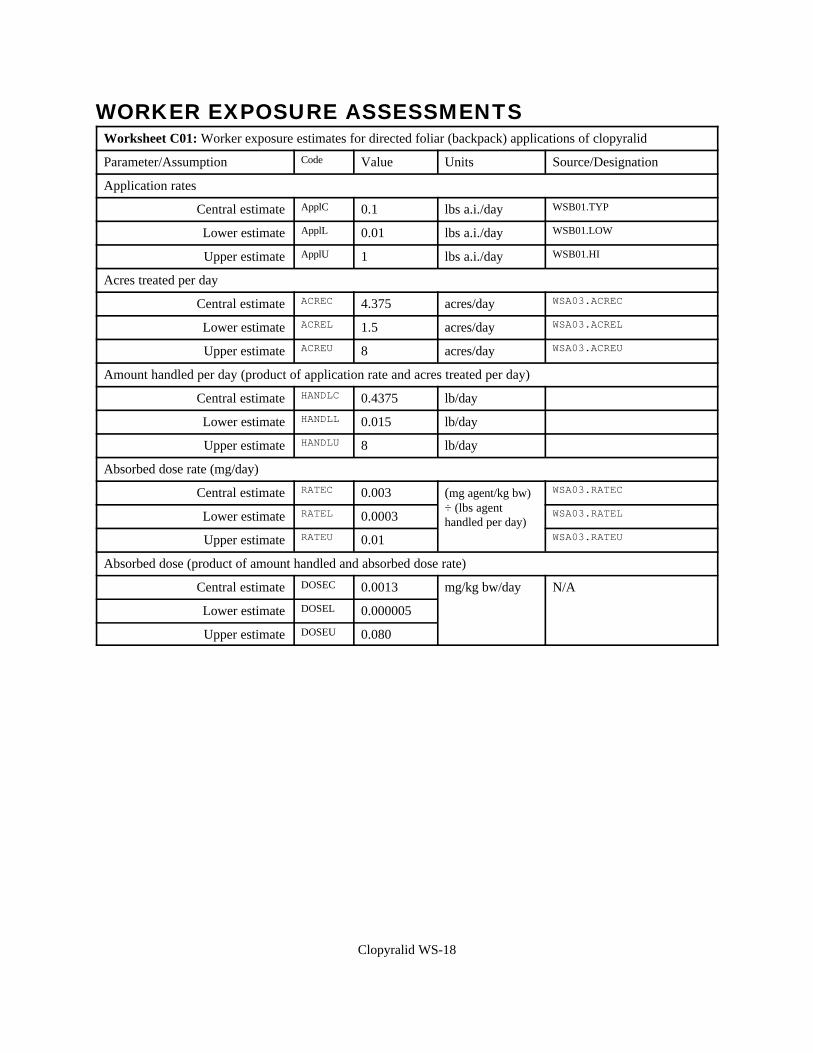
Clopyralid WS-18
WORKER EXPOSURE ASSESSMENTSWorksheet C01: Worker exposure estimates for directed foliar (backpack) applications of clopyralid
Parameter/Assumption Code Value Units Source/Designation
Application rates
Central estimate ApplC 0.1 lbs a.i./day WSB01.TYP
Lower estimate ApplL 0.01 lbs a.i./day WSB01.LOW
Upper estimate ApplU 1 lbs a.i./day WSB01.HI
Acres treated per day
Central estimate ACREC 4.375 acres/day WSA03.ACREC
Lower estimate ACREL 1.5 acres/day WSA03.ACREL
Upper estimate ACREU 8 acres/day WSA03.ACREU
Amount handled per day (product of application rate and acres treated per day)
Central estimate HANDLC 0.4375 lb/day
Lower estimate HANDLL 0.015 lb/day
Upper estimate HANDLU 8 lb/day
Absorbed dose rate (mg/day)
Central estimate RATEC 0.003 (mg agent/kg bw)÷ (lbs agenthandled per day)
WSA03.RATEC
Lower estimate RATEL 0.0003 WSA03.RATEL
Upper estimate RATEU 0.01 WSA03.RATEU
Absorbed dose (product of amount handled and absorbed dose rate)
Central estimate DOSEC 0.0013 mg/kg bw/day N/A
Lower estimate DOSEL 0.000005
Upper estimate DOSEU 0.080
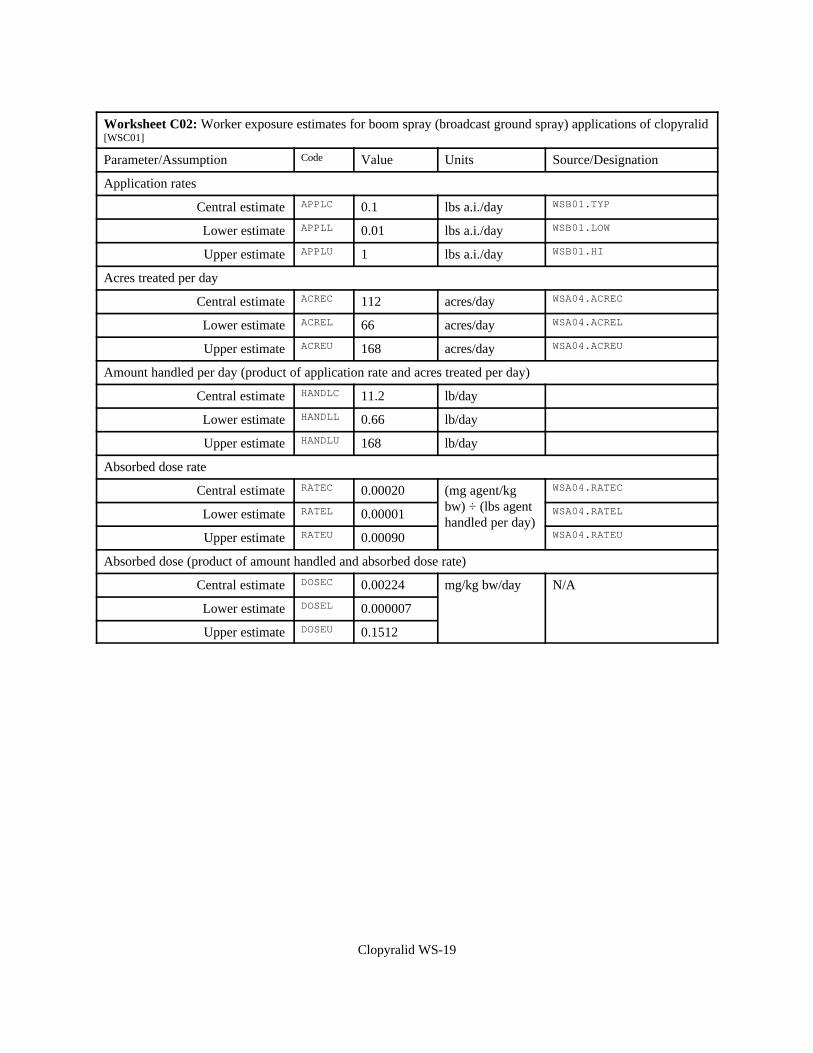
Clopyralid WS-19
Worksheet C02: Worker exposure estimates for boom spray (broadcast ground spray) applications of clopyralid[WSC01]
Parameter/Assumption Code Value Units Source/Designation
Application rates
Central estimate APPLC 0.1 lbs a.i./day WSB01.TYP
Lower estimate APPLL 0.01 lbs a.i./day WSB01.LOW
Upper estimate APPLU 1 lbs a.i./day WSB01.HI
Acres treated per day
Central estimate ACREC 112 acres/day WSA04.ACREC
Lower estimate ACREL 66 acres/day WSA04.ACREL
Upper estimate ACREU 168 acres/day WSA04.ACREU
Amount handled per day (product of application rate and acres treated per day)
Central estimate HANDLC 11.2 lb/day
Lower estimate HANDLL 0.66 lb/day
Upper estimate HANDLU 168 lb/day
Absorbed dose rate
Central estimate RATEC 0.00020 (mg agent/kgbw) ÷ (lbs agenthandled per day)
WSA04.RATEC
Lower estimate RATEL 0.00001 WSA04.RATEL
Upper estimate RATEU 0.00090 WSA04.RATEU
Absorbed dose (product of amount handled and absorbed dose rate)
Central estimate DOSEC 0.00224 mg/kg bw/day N/A
Lower estimate DOSEL 0.000007
Upper estimate DOSEU 0.1512
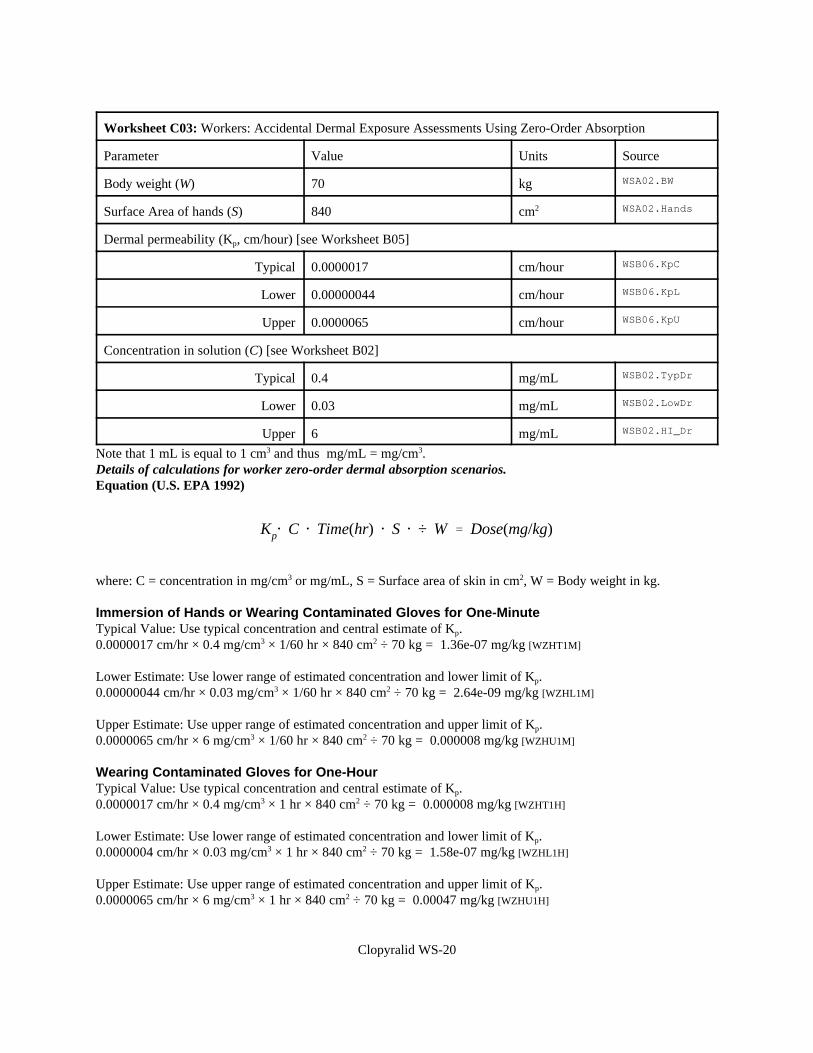
Clopyralid WS-20
Kp@ C @ Time(hr) @ S @ ÷ W ' Dose(mg/kg)
Worksheet C03: Workers: Accidental Dermal Exposure Assessments Using Zero-Order Absorption
Parameter Value Units Source
Body weight (W) 70 kg WSA02.BW
Surface Area of hands (S) 840 cm2 WSA02.Hands
Dermal permeability (Kp, cm/hour) [see Worksheet B05]
Typical 0.0000017 cm/hour WSB06.KpC
Lower 0.00000044 cm/hour WSB06.KpL
Upper 0.0000065 cm/hour WSB06.KpU
Concentration in solution (C) [see Worksheet B02]
Typical 0.4 mg/mL WSB02.TypDr
Lower 0.03 mg/mL WSB02.LowDr
Upper 6 mg/mL WSB02.HI_Dr
Note that 1 mL is equal to 1 cm3 and thus mg/mL = mg/cm3.Details of calculations for worker zero-order dermal absorption scenarios.Equation (U.S. EPA 1992)
where: C = concentration in mg/cm3 or mg/mL, S = Surface area of skin in cm2, W = Body weight in kg.
Immersion of Hands or Wearing Contaminated Gloves for One-MinuteTypical Value: Use typical concentration and central estimate of Kp.0.0000017 cm/hr × 0.4 mg/cm3 × 1/60 hr × 840 cm2 ÷ 70 kg = 1.36e-07 mg/kg [WZHT1M]
Lower Estimate: Use lower range of estimated concentration and lower limit of Kp.0.00000044 cm/hr × 0.03 mg/cm3 × 1/60 hr × 840 cm2 ÷ 70 kg = 2.64e-09 mg/kg [WZHL1M]
Upper Estimate: Use upper range of estimated concentration and upper limit of Kp.0.0000065 cm/hr × 6 mg/cm3 × 1/60 hr × 840 cm2 ÷ 70 kg = 0.000008 mg/kg [WZHU1M]
Wearing Contaminated Gloves for One-HourTypical Value: Use typical concentration and central estimate of Kp.0.0000017 cm/hr × 0.4 mg/cm3 × 1 hr × 840 cm2 ÷ 70 kg = 0.000008 mg/kg [WZHT1H]
Lower Estimate: Use lower range of estimated concentration and lower limit of Kp.0.0000004 cm/hr × 0.03 mg/cm3 × 1 hr × 840 cm2 ÷ 70 kg = 1.58e-07 mg/kg [WZHL1H]
Upper Estimate: Use upper range of estimated concentration and upper limit of Kp.0.0000065 cm/hr × 6 mg/cm3 × 1 hr × 840 cm2 ÷ 70 kg = 0.00047 mg/kg [WZHU1H]
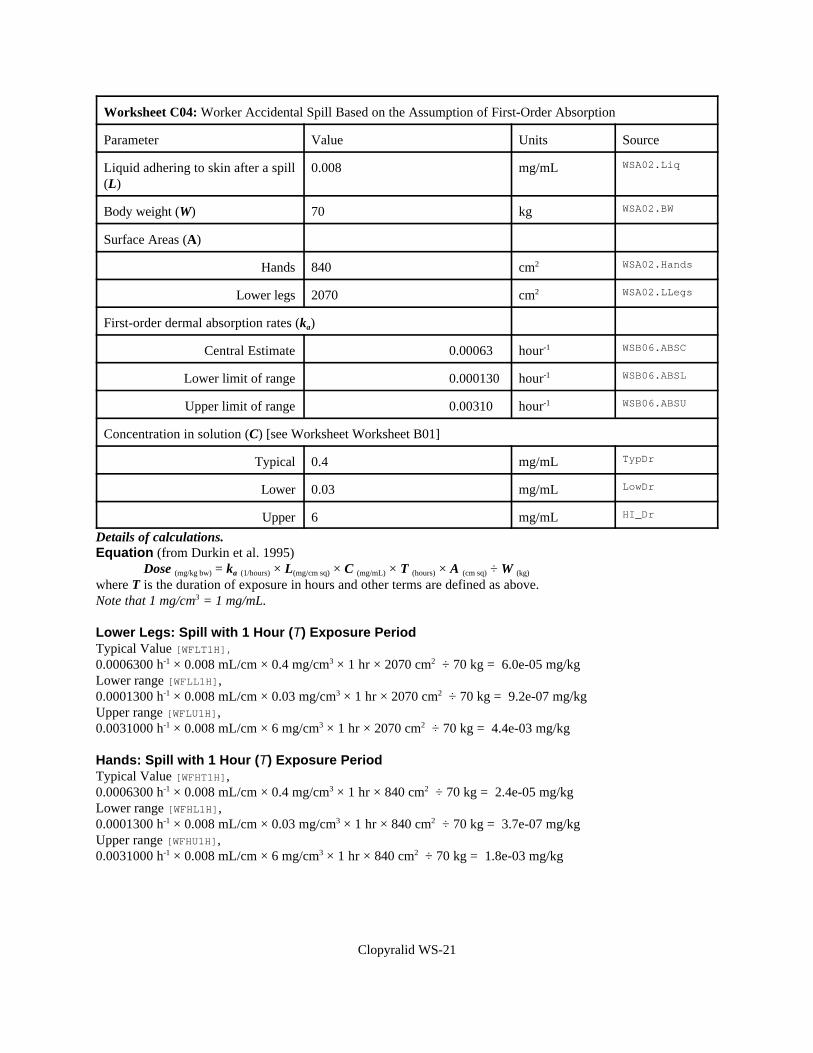
Clopyralid WS-21
Worksheet C04: Worker Accidental Spill Based on the Assumption of First-Order Absorption
Parameter Value Units Source
Liquid adhering to skin after a spill(L)
0.008 mg/mL WSA02.Liq
Body weight (W) 70 kg WSA02.BW
Surface Areas (A)
Hands 840 cm2 WSA02.Hands
Lower legs 2070 cm2 WSA02.LLegs
First-order dermal absorption rates (ka)
Central Estimate 0.00063 hour-1 WSB06.ABSC
Lower limit of range 0.000130 hour-1 WSB06.ABSL
Upper limit of range 0.00310 hour-1 WSB06.ABSU
Concentration in solution (C) [see Worksheet Worksheet B01]
Typical 0.4 mg/mL TypDr
Lower 0.03 mg/mL LowDr
Upper 6 mg/mL HI_Dr
Details of calculations.Equation (from Durkin et al. 1995)
Dose (mg/kg bw) = ka (1/hours) × L(mg/cm sq) × C (mg/mL) × T (hours) × A (cm sq) ÷ W (kg)
where T is the duration of exposure in hours and other terms are defined as above. Note that 1 mg/cm3 = 1 mg/mL.
Lower Legs: Spill with 1 Hour (T) Exposure PeriodTypical Value [WFLT1H],0.0006300 h-1 × 0.008 mL/cm × 0.4 mg/cm3 × 1 hr × 2070 cm2 ÷ 70 kg = 6.0e-05 mg/kg Lower range [WFLL1H],0.0001300 h-1 × 0.008 mL/cm × 0.03 mg/cm3 × 1 hr × 2070 cm2 ÷ 70 kg = 9.2e-07 mg/kg Upper range [WFLU1H],0.0031000 h-1 × 0.008 mL/cm × 6 mg/cm3 × 1 hr × 2070 cm2 ÷ 70 kg = 4.4e-03 mg/kg
Hands: Spill with 1 Hour (T) Exposure PeriodTypical Value [WFHT1H],0.0006300 h-1 × 0.008 mL/cm × 0.4 mg/cm3 × 1 hr × 840 cm2 ÷ 70 kg = 2.4e-05 mg/kg Lower range [WFHL1H],0.0001300 h-1 × 0.008 mL/cm × 0.03 mg/cm3 × 1 hr × 840 cm2 ÷ 70 kg = 3.7e-07 mg/kg Upper range [WFHU1H],0.0031000 h-1 × 0.008 mL/cm × 6 mg/cm3 × 1 hr × 840 cm2 ÷ 70 kg = 1.8e-03 mg/kg
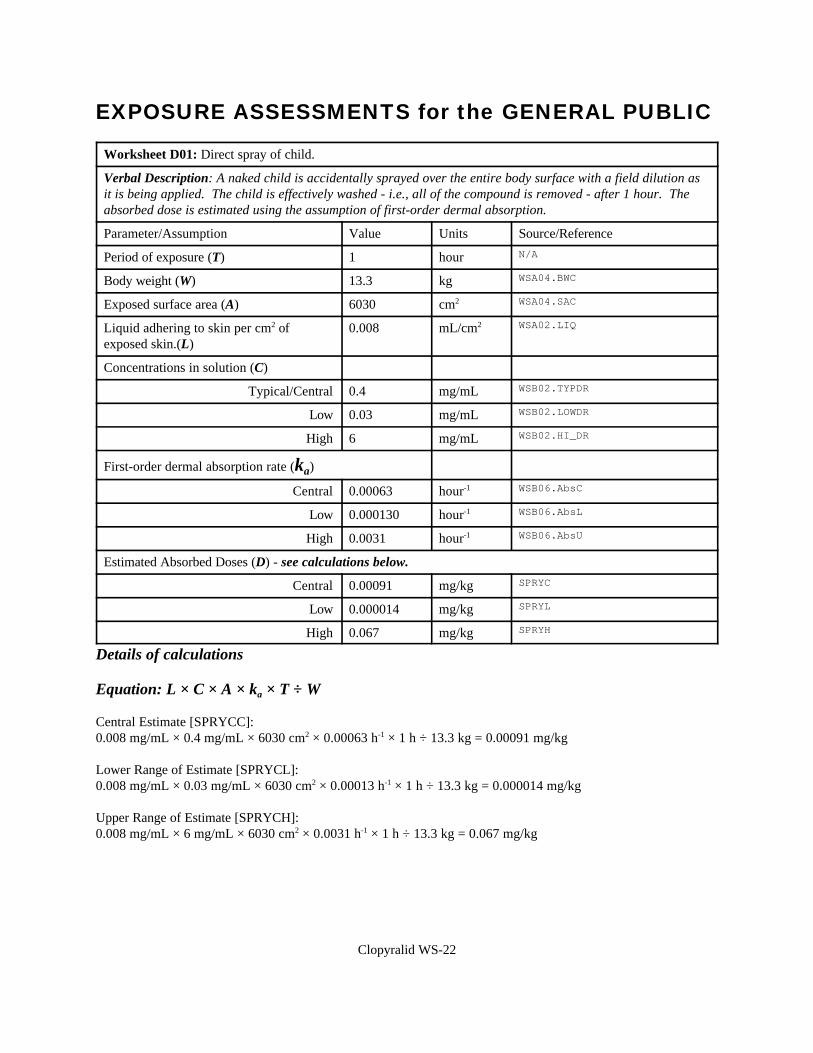
Clopyralid WS-22
EXPOSURE ASSESSMENTS for the GENERAL PUBLIC
Worksheet D01: Direct spray of child.
Verbal Description: A naked child is accidentally sprayed over the entire body surface with a field dilution asit is being applied. The child is effectively washed - i.e., all of the compound is removed - after 1 hour. Theabsorbed dose is estimated using the assumption of first-order dermal absorption.
Parameter/Assumption Value Units Source/Reference
Period of exposure (T) 1 hour N/A
Body weight (W) 13.3 kg WSA04.BWC
Exposed surface area (A) 6030 cm2 WSA04.SAC
Liquid adhering to skin per cm2 ofexposed skin.(L)
0.008 mL/cm2 WSA02.LIQ
Concentrations in solution (C)
Typical/Central 0.4 mg/mL WSB02.TYPDR
Low 0.03 mg/mL WSB02.LOWDR
High 6 mg/mL WSB02.HI_DR
First-order dermal absorption rate (ka)
Central 0.00063 hour-1 WSB06.AbsC
Low 0.000130 hour-1 WSB06.AbsL
High 0.0031 hour-1 WSB06.AbsU
Estimated Absorbed Doses (D) - see calculations below.
Central 0.00091 mg/kg SPRYC
Low 0.000014 mg/kg SPRYL
High 0.067 mg/kg SPRYH
Details of calculations
Equation: L × C × A × ka × T ÷ W
Central Estimate [SPRYCC]:0.008 mg/mL × 0.4 mg/mL × 6030 cm2 × 0.00063 h-1 × 1 h ÷ 13.3 kg = 0.00091 mg/kg
Lower Range of Estimate [SPRYCL]:0.008 mg/mL × 0.03 mg/mL × 6030 cm2 × 0.00013 h-1 × 1 h ÷ 13.3 kg = 0.000014 mg/kg
Upper Range of Estimate [SPRYCH]:0.008 mg/mL × 6 mg/mL × 6030 cm2 × 0.0031 h-1 × 1 h ÷ 13.3 kg = 0.067 mg/kg
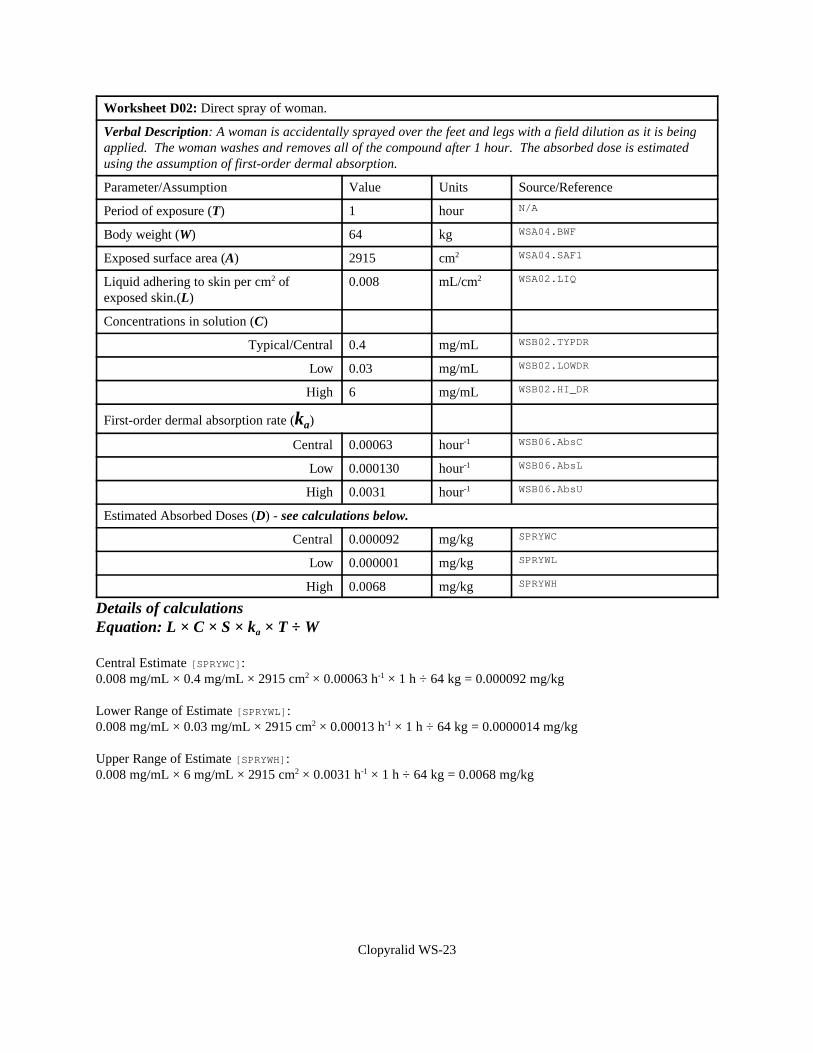
Clopyralid WS-23
Worksheet D02: Direct spray of woman.
Verbal Description: A woman is accidentally sprayed over the feet and legs with a field dilution as it is beingapplied. The woman washes and removes all of the compound after 1 hour. The absorbed dose is estimatedusing the assumption of first-order dermal absorption.
Parameter/Assumption Value Units Source/Reference
Period of exposure (T) 1 hour N/A
Body weight (W) 64 kg WSA04.BWF
Exposed surface area (A) 2915 cm2 WSA04.SAF1
Liquid adhering to skin per cm2 ofexposed skin.(L)
0.008 mL/cm2 WSA02.LIQ
Concentrations in solution (C)
Typical/Central 0.4 mg/mL WSB02.TYPDR
Low 0.03 mg/mL WSB02.LOWDR
High 6 mg/mL WSB02.HI_DR
First-order dermal absorption rate (ka)
Central 0.00063 hour-1 WSB06.AbsC
Low 0.000130 hour-1 WSB06.AbsL
High 0.0031 hour-1 WSB06.AbsU
Estimated Absorbed Doses (D) - see calculations below.
Central 0.000092 mg/kg SPRYWC
Low 0.000001 mg/kg SPRYWL
High 0.0068 mg/kg SPRYWH
Details of calculationsEquation: L × C × S × ka × T ÷ W
Central Estimate [SPRYWC]:0.008 mg/mL × 0.4 mg/mL × 2915 cm2 × 0.00063 h-1 × 1 h ÷ 64 kg = 0.000092 mg/kg
Lower Range of Estimate [SPRYWL]:0.008 mg/mL × 0.03 mg/mL × 2915 cm2 × 0.00013 h-1 × 1 h ÷ 64 kg = 0.0000014 mg/kg
Upper Range of Estimate [SPRYWH]:0.008 mg/mL × 6 mg/mL × 2915 cm2 × 0.0031 h-1 × 1 h ÷ 64 kg = 0.0068 mg/kg
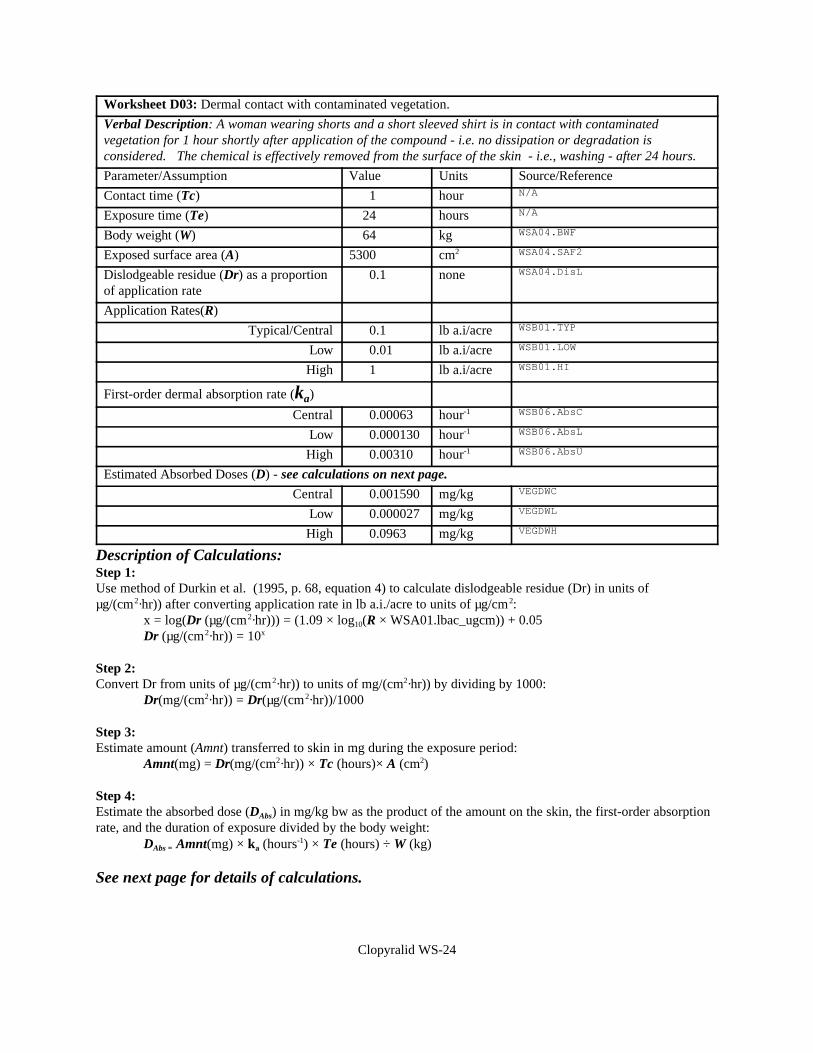
Clopyralid WS-24
Worksheet D03: Dermal contact with contaminated vegetation.
Verbal Description: A woman wearing shorts and a short sleeved shirt is in contact with contaminatedvegetation for 1 hour shortly after application of the compound - i.e. no dissipation or degradation isconsidered. The chemical is effectively removed from the surface of the skin - i.e., washing - after 24 hours.
Parameter/Assumption Value Units Source/Reference
Contact time (Tc) 1 hour N/A
Exposure time (Te) 24 hours N/A
Body weight (W) 64 kg WSA04.BWF
Exposed surface area (A) 5300 cm2 WSA04.SAF2
Dislodgeable residue (Dr) as a proportionof application rate
0.1 none WSA04.DisL
Application Rates(R)
Typical/Central 0.1 lb a.i/acre WSB01.TYP
Low 0.01 lb a.i/acre WSB01.LOW
High 1 lb a.i/acre WSB01.HI
First-order dermal absorption rate (ka)
Central 0.00063 hour-1 WSB06.AbsC
Low 0.000130 hour-1 WSB06.AbsL
High 0.00310 hour-1 WSB06.AbsU
Estimated Absorbed Doses (D) - see calculations on next page.
Central 0.001590 mg/kg VEGDWC
Low 0.000027 mg/kg VEGDWL
High 0.0963 mg/kg VEGDWH
Description of Calculations:Step 1:Use method of Durkin et al. (1995, p. 68, equation 4) to calculate dislodgeable residue (Dr) in units of µg/(cm2·hr)) after converting application rate in lb a.i./acre to units of µg/cm2:
x = log(Dr (µg/(cm2·hr))) = (1.09 × log10(R × WSA01.lbac_ugcm)) + 0.05Dr (µg/(cm2·hr)) = 10x
Step 2:Convert Dr from units of µg/(cm2·hr)) to units of mg/(cm2·hr)) by dividing by 1000:
Dr(mg/(cm2·hr)) = Dr(µg/(cm2·hr))/1000
Step 3:Estimate amount (Amnt) transferred to skin in mg during the exposure period:
Amnt(mg) = Dr(mg/(cm2·hr)) × Tc (hours)× A (cm2)
Step 4:Estimate the absorbed dose (DAbs) in mg/kg bw as the product of the amount on the skin, the first-order absorptionrate, and the duration of exposure divided by the body weight:
DAbs = Amnt(mg) × ka (hours-1) × Te (hours) ÷ W (kg)
See next page for details of calculations.
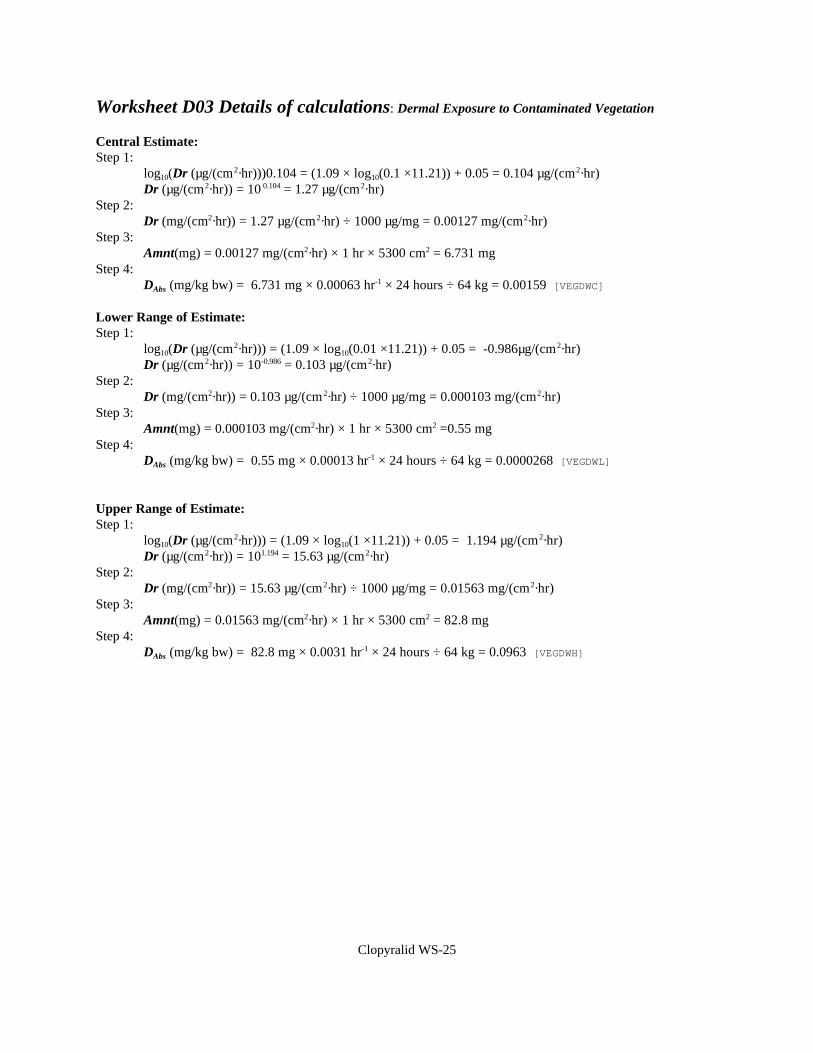
Clopyralid WS-25
Worksheet D03 Details of calculations: Dermal Exposure to Contaminated Vegetation
Central Estimate:Step 1:
log10(Dr (µg/(cm2·hr)))0.104 = (1.09 × log10(0.1 ×11.21)) + 0.05 = 0.104 µg/(cm2·hr)Dr (µg/(cm2·hr)) = 10 0.104 = 1.27 µg/(cm2·hr)
Step 2:Dr (mg/(cm2·hr)) = 1.27 µg/(cm2·hr) ÷ 1000 µg/mg = 0.00127 mg/(cm2·hr)
Step 3:Amnt(mg) = 0.00127 mg/(cm2·hr) × 1 hr × 5300 cm2 = 6.731 mg
Step 4:DAbs (mg/kg bw) = 6.731 mg × 0.00063 hr-1 × 24 hours ÷ 64 kg = 0.00159 [VEGDWC]
Lower Range of Estimate:Step 1:
log10(Dr (µg/(cm2·hr))) = (1.09 × log10(0.01 ×11.21)) + 0.05 = -0.986µg/(cm2·hr)Dr (µg/(cm2·hr)) = 10-0.986 = 0.103 µg/(cm2·hr)
Step 2:Dr (mg/(cm2·hr)) = 0.103 µg/(cm2·hr) ÷ 1000 µg/mg = 0.000103 mg/(cm2·hr)
Step 3:Amnt(mg) = 0.000103 mg/(cm2·hr) × 1 hr × 5300 cm2 =0.55 mg
Step 4:DAbs (mg/kg bw) = 0.55 mg × 0.00013 hr-1 × 24 hours ÷ 64 kg = 0.0000268 [VEGDWL]
Upper Range of Estimate:Step 1:
log10(Dr (µg/(cm2·hr))) = (1.09 × log10(1 ×11.21)) + 0.05 = 1.194 µg/(cm2·hr)Dr (µg/(cm2·hr)) = 101.194 = 15.63 µg/(cm2·hr)
Step 2:Dr (mg/(cm2·hr)) = 15.63 µg/(cm2·hr) ÷ 1000 µg/mg = 0.01563 mg/(cm2·hr)
Step 3:Amnt(mg) = 0.01563 mg/(cm2·hr) × 1 hr × 5300 cm2 = 82.8 mg
Step 4:DAbs (mg/kg bw) = 82.8 mg × 0.0031 hr-1 × 24 hours ÷ 64 kg = 0.0963 [VEGDWH]
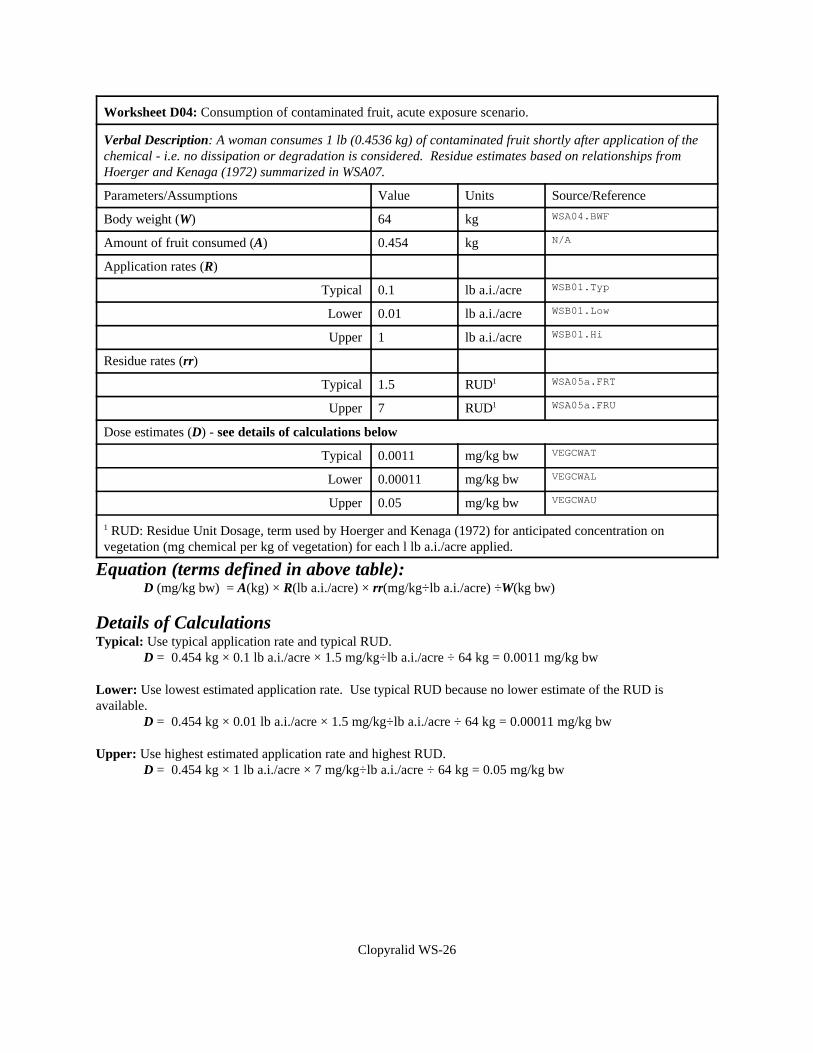
Clopyralid WS-26
Worksheet D04: Consumption of contaminated fruit, acute exposure scenario.
Verbal Description: A woman consumes 1 lb (0.4536 kg) of contaminated fruit shortly after application of thechemical - i.e. no dissipation or degradation is considered. Residue estimates based on relationships fromHoerger and Kenaga (1972) summarized in WSA07.
Parameters/Assumptions Value Units Source/Reference
Body weight (W) 64 kg WSA04.BWF
Amount of fruit consumed (A) 0.454 kg N/A
Application rates (R)
Typical 0.1 lb a.i./acre WSB01.Typ
Lower 0.01 lb a.i./acre WSB01.Low
Upper 1 lb a.i./acre WSB01.Hi
Residue rates (rr)
Typical 1.5 RUD1 WSA05a.FRT
Upper 7 RUD1 WSA05a.FRU
Dose estimates (D) - see details of calculations below
Typical 0.0011 mg/kg bw VEGCWAT
Lower 0.00011 mg/kg bw VEGCWAL
Upper 0.05 mg/kg bw VEGCWAU
1 RUD: Residue Unit Dosage, term used by Hoerger and Kenaga (1972) for anticipated concentration onvegetation (mg chemical per kg of vegetation) for each l lb a.i./acre applied.
Equation (terms defined in above table):D (mg/kg bw) = A(kg) × R(lb a.i./acre) × rr(mg/kg÷lb a.i./acre) ÷W(kg bw)
Details of CalculationsTypical: Use typical application rate and typical RUD.
D = 0.454 kg × 0.1 lb a.i./acre × 1.5 mg/kg÷lb a.i./acre ÷ 64 kg = 0.0011 mg/kg bw
Lower: Use lowest estimated application rate. Use typical RUD because no lower estimate of the RUD isavailable.
D = 0.454 kg × 0.01 lb a.i./acre × 1.5 mg/kg÷lb a.i./acre ÷ 64 kg = 0.00011 mg/kg bw
Upper: Use highest estimated application rate and highest RUD.D = 0.454 kg × 1 lb a.i./acre × 7 mg/kg÷lb a.i./acre ÷ 64 kg = 0.05 mg/kg bw
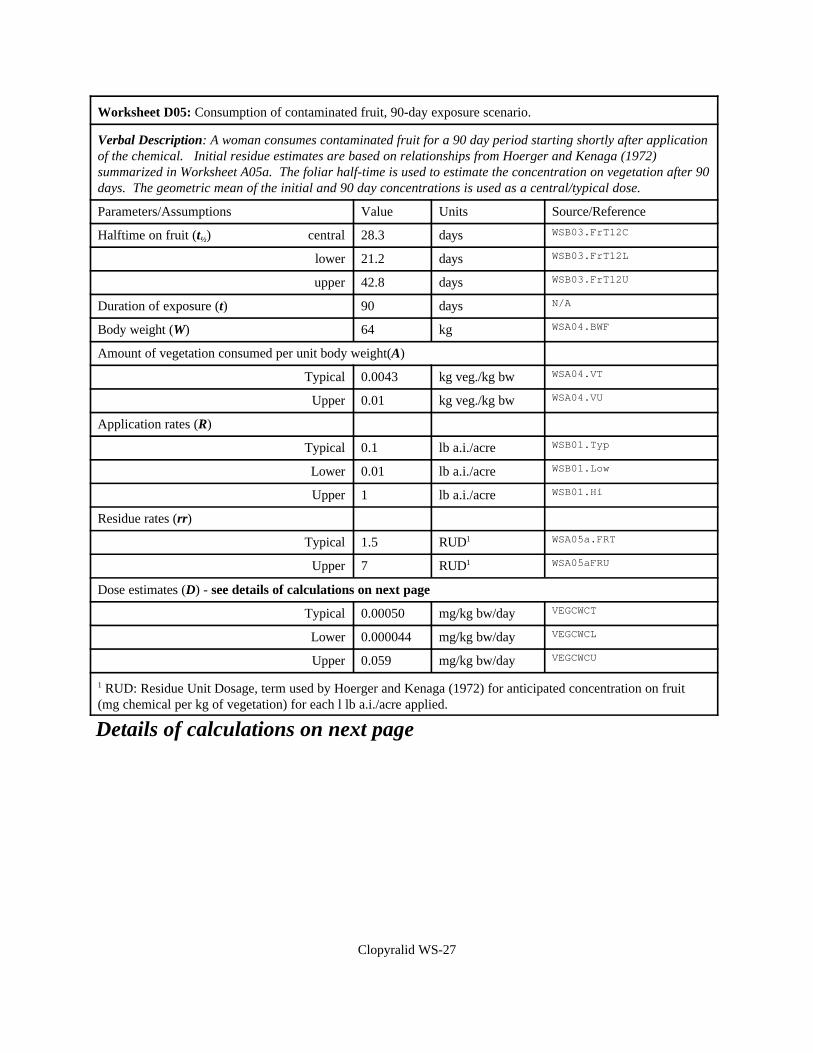
Clopyralid WS-27
Worksheet D05: Consumption of contaminated fruit, 90-day exposure scenario.
Verbal Description: A woman consumes contaminated fruit for a 90 day period starting shortly after applicationof the chemical. Initial residue estimates are based on relationships from Hoerger and Kenaga (1972)summarized in Worksheet A05a. The foliar half-time is used to estimate the concentration on vegetation after 90days. The geometric mean of the initial and 90 day concentrations is used as a central/typical dose.
Parameters/Assumptions Value Units Source/Reference
Halftime on fruit (t½) central 28.3 days WSB03.FrT12C
lower 21.2 days WSB03.FrT12L
upper 42.8 days WSB03.FrT12U
Duration of exposure (t) 90 days N/A
Body weight (W) 64 kg WSA04.BWF
Amount of vegetation consumed per unit body weight(A)
Typical 0.0043 kg veg./kg bw WSA04.VT
Upper 0.01 kg veg./kg bw WSA04.VU
Application rates (R)
Typical 0.1 lb a.i./acre WSB01.Typ
Lower 0.01 lb a.i./acre WSB01.Low
Upper 1 lb a.i./acre WSB01.Hi
Residue rates (rr)
Typical 1.5 RUD1 WSA05a.FRT
Upper 7 RUD1 WSA05aFRU
Dose estimates (D) - see details of calculations on next page
Typical 0.00050 mg/kg bw/day VEGCWCT
Lower 0.000044 mg/kg bw/day VEGCWCL
Upper 0.059 mg/kg bw/day VEGCWCU
1 RUD: Residue Unit Dosage, term used by Hoerger and Kenaga (1972) for anticipated concentration on fruit(mg chemical per kg of vegetation) for each l lb a.i./acre applied.
Details of calculations on next page
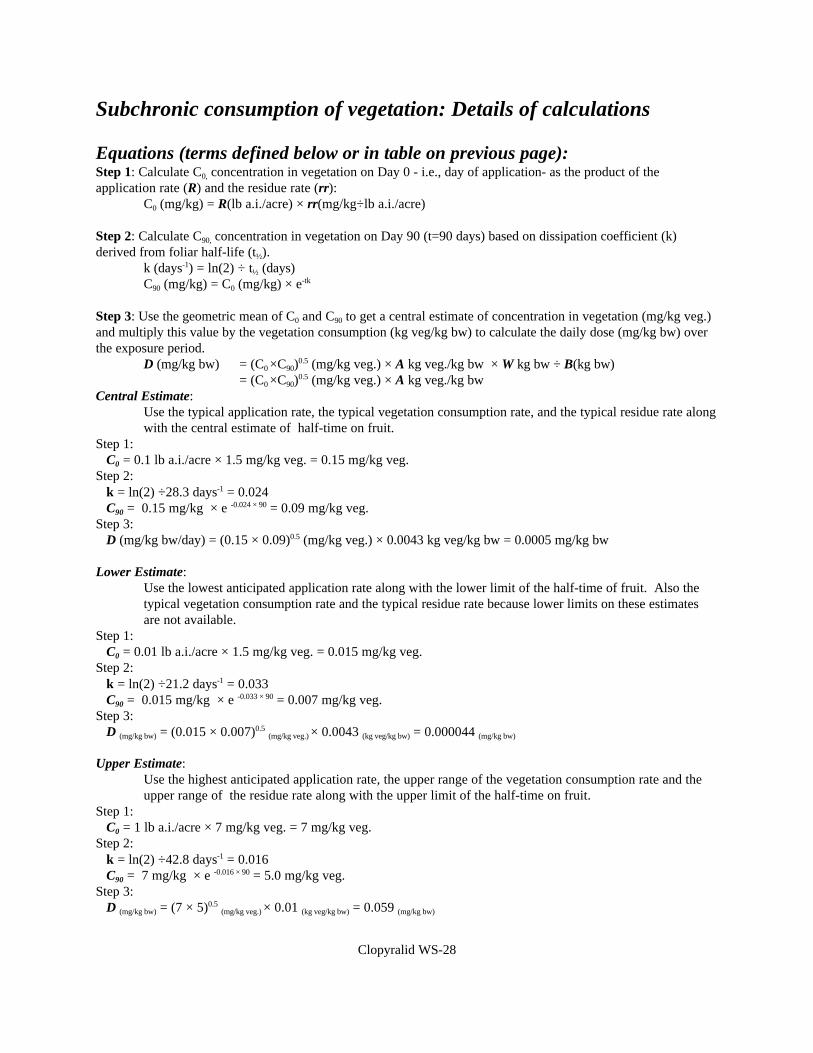
Clopyralid WS-28
Subchronic consumption of vegetation: Details of calculations
Equations (terms defined below or in table on previous page):Step 1: Calculate C0, concentration in vegetation on Day 0 - i.e., day of application- as the product of theapplication rate (R) and the residue rate (rr):
C0 (mg/kg) = R(lb a.i./acre) × rr(mg/kg÷lb a.i./acre)
Step 2: Calculate C90, concentration in vegetation on Day 90 (t=90 days) based on dissipation coefficient (k)derived from foliar half-life (t½).
k (days-1) = ln(2) ÷ t½ (days)C90 (mg/kg) = C0 (mg/kg) × e-tk
Step 3: Use the geometric mean of C0 and C90 to get a central estimate of concentration in vegetation (mg/kg veg.)and multiply this value by the vegetation consumption (kg veg/kg bw) to calculate the daily dose (mg/kg bw) overthe exposure period.
D (mg/kg bw) = (C0 ×C90)0.5 (mg/kg veg.) × A kg veg./kg bw × W kg bw ÷ B(kg bw)
= (C0 ×C90)0.5 (mg/kg veg.) × A kg veg./kg bw
Central Estimate:Use the typical application rate, the typical vegetation consumption rate, and the typical residue rate alongwith the central estimate of half-time on fruit.
Step 1: C0 = 0.1 lb a.i./acre × 1.5 mg/kg veg. = 0.15 mg/kg veg.Step 2: k = ln(2) ÷28.3 days-1 = 0.024 C90 = 0.15 mg/kg × e -0.024 × 90 = 0.09 mg/kg veg.Step 3: D (mg/kg bw/day) = (0.15 × 0.09)0.5 (mg/kg veg.) × 0.0043 kg veg/kg bw = 0.0005 mg/kg bw
Lower Estimate:Use the lowest anticipated application rate along with the lower limit of the half-time of fruit. Also thetypical vegetation consumption rate and the typical residue rate because lower limits on these estimatesare not available.
Step 1: C0 = 0.01 lb a.i./acre × 1.5 mg/kg veg. = 0.015 mg/kg veg.Step 2: k = ln(2) ÷21.2 days-1 = 0.033 C90 = 0.015 mg/kg × e -0.033 × 90 = 0.007 mg/kg veg.Step 3: D (mg/kg bw) = (0.015 × 0.007)0.5 (mg/kg veg.) × 0.0043 (kg veg/kg bw) = 0.000044 (mg/kg bw)
Upper Estimate:Use the highest anticipated application rate, the upper range of the vegetation consumption rate and theupper range of the residue rate along with the upper limit of the half-time on fruit.
Step 1: C0 = 1 lb a.i./acre × 7 mg/kg veg. = 7 mg/kg veg.Step 2: k = ln(2) ÷42.8 days-1 = 0.016 C90 = 7 mg/kg × e -0.016 × 90 = 5.0 mg/kg veg.Step 3: D (mg/kg bw) = (7 × 5)0.5 (mg/kg veg.) × 0.01 (kg veg/kg bw) = 0.059 (mg/kg bw)
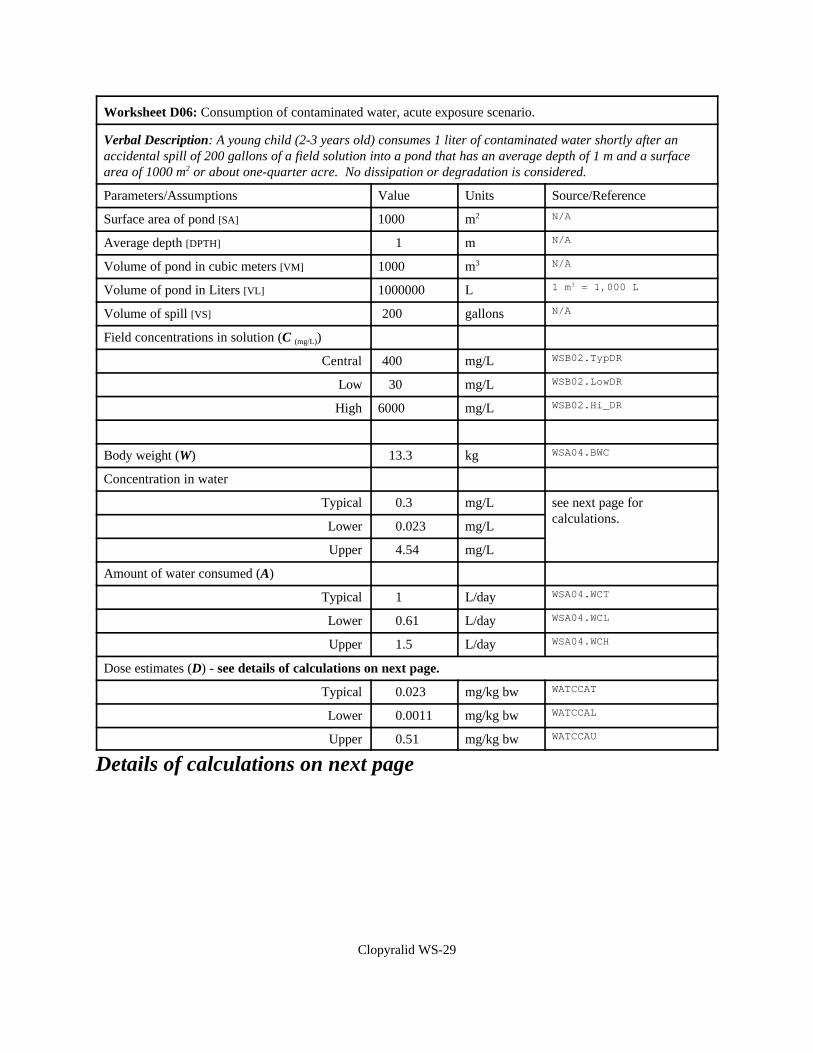
Clopyralid WS-29
Worksheet D06: Consumption of contaminated water, acute exposure scenario.
Verbal Description: A young child (2-3 years old) consumes 1 liter of contaminated water shortly after anaccidental spill of 200 gallons of a field solution into a pond that has an average depth of 1 m and a surfacearea of 1000 m2 or about one-quarter acre. No dissipation or degradation is considered.
Parameters/Assumptions Value Units Source/Reference
Surface area of pond [SA] 1000 m2 N/A
Average depth [DPTH] 1 m N/A
Volume of pond in cubic meters [VM] 1000 m3 N/A
Volume of pond in Liters [VL] 1000000 L 1 m3 = 1,000 L
Volume of spill [VS] 200 gallons N/A
Field concentrations in solution (C (mg/L))
Central 400 mg/L WSB02.TypDR
Low 30 mg/L WSB02.LowDR
High 6000 mg/L WSB02.Hi_DR
Body weight (W) 13.3 kg WSA04.BWC
Concentration in water
Typical 0.3 mg/L see next page forcalculations.
Lower 0.023 mg/L
Upper 4.54 mg/L
Amount of water consumed (A)
Typical 1 L/day WSA04.WCT
Lower 0.61 L/day WSA04.WCL
Upper 1.5 L/day WSA04.WCH
Dose estimates (D) - see details of calculations on next page.
Typical 0.023 mg/kg bw WATCCAT
Lower 0.0011 mg/kg bw WATCCAL
Upper 0.51 mg/kg bw WATCCAU
Details of calculations on next page
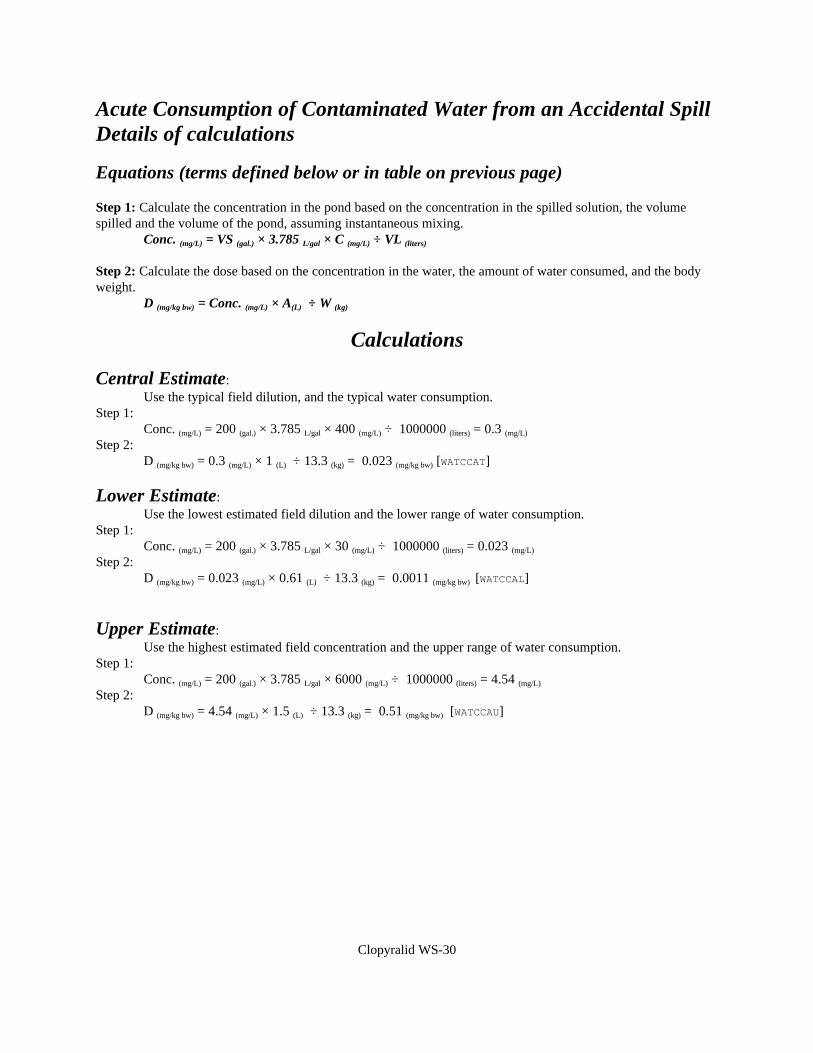
Clopyralid WS-30
Acute Consumption of Contaminated Water from an Accidental SpillDetails of calculations
Equations (terms defined below or in table on previous page)
Step 1: Calculate the concentration in the pond based on the concentration in the spilled solution, the volumespilled and the volume of the pond, assuming instantaneous mixing.
Conc. (mg/L) = VS (gal.) × 3.785 L/gal × C (mg/L) ÷ VL (liters)
Step 2: Calculate the dose based on the concentration in the water, the amount of water consumed, and the bodyweight.
D (mg/kg bw) = Conc. (mg/L) × A(L) ÷ W (kg)
Calculations
Central Estimate:Use the typical field dilution, and the typical water consumption.
Step 1:Conc. (mg/L) = 200 (gal.) × 3.785 L/gal × 400 (mg/L) ÷ 1000000 (liters) = 0.3 (mg/L)
Step 2:D (mg/kg bw) = 0.3 (mg/L) × 1 (L) ÷ 13.3 (kg) = 0.023 (mg/kg bw) [WATCCAT]
Lower Estimate:Use the lowest estimated field dilution and the lower range of water consumption.
Step 1:Conc. (mg/L) = 200 (gal.) × 3.785 L/gal × 30 (mg/L) ÷ 1000000 (liters) = 0.023 (mg/L)
Step 2:D (mg/kg bw) = 0.023 (mg/L) × 0.61 (L) ÷ 13.3 (kg) = 0.0011 (mg/kg bw) [WATCCAL]
Upper Estimate:Use the highest estimated field concentration and the upper range of water consumption.
Step 1:Conc. (mg/L) = 200 (gal.) × 3.785 L/gal × 6000 (mg/L) ÷ 1000000 (liters) = 4.54 (mg/L)
Step 2:D (mg/kg bw) = 4.54 (mg/L) × 1.5 (L) ÷ 13.3 (kg) = 0.51 (mg/kg bw) [WATCCAU]
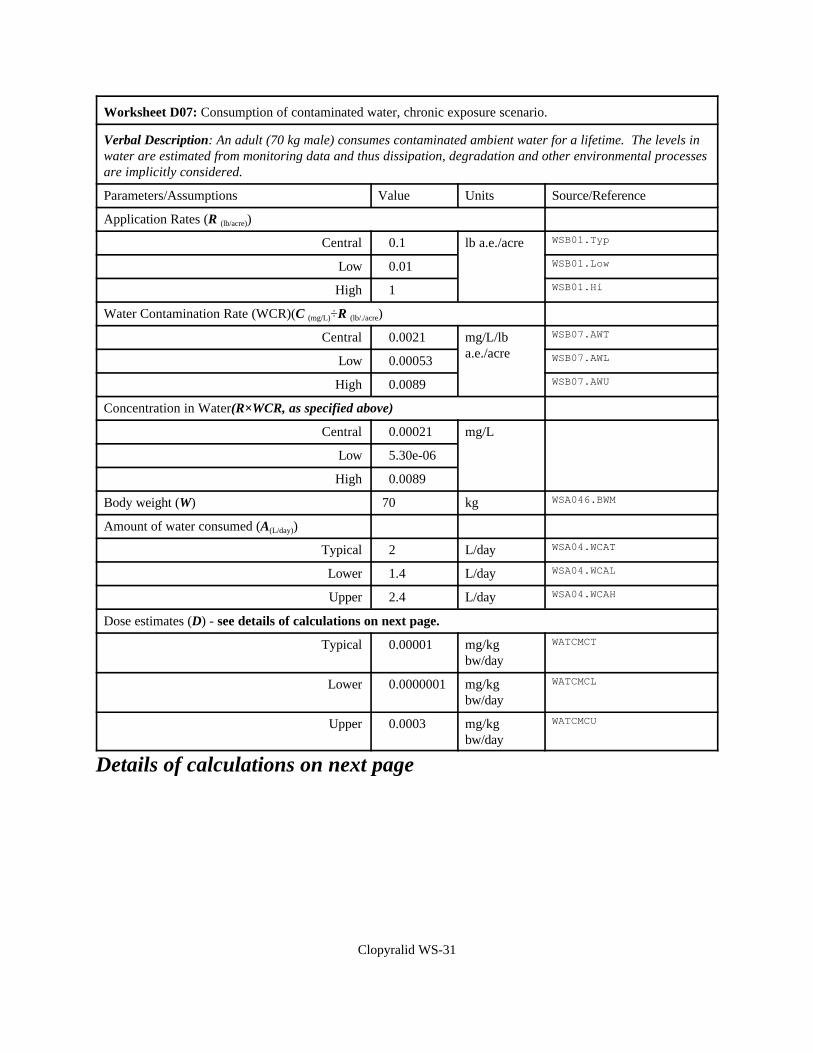
Clopyralid WS-31
Worksheet D07: Consumption of contaminated water, chronic exposure scenario.
Verbal Description: An adult (70 kg male) consumes contaminated ambient water for a lifetime. The levels inwater are estimated from monitoring data and thus dissipation, degradation and other environmental processesare implicitly considered.
Parameters/Assumptions Value Units Source/Reference
Application Rates (R (lb/acre))
Central 0.1 lb a.e./acre WSB01.Typ
Low 0.01 WSB01.Low
High 1 WSB01.Hi
Water Contamination Rate (WCR)(C (mg/L)÷R (lb/./acre)
Central 0.0021 mg/L/lba.e./acre
WSB07.AWT
Low 0.00053 WSB07.AWL
High 0.0089 WSB07.AWU
Concentration in Water(R×WCR, as specified above)
Central 0.00021 mg/L
Low 5.30e-06
High 0.0089
Body weight (W) 70 kg WSA046.BWM
Amount of water consumed (A(L/day))
Typical 2 L/day WSA04.WCAT
Lower 1.4 L/day WSA04.WCAL
Upper 2.4 L/day WSA04.WCAH
Dose estimates (D) - see details of calculations on next page.
Typical 0.00001 mg/kgbw/day
WATCMCT
Lower 0.0000001 mg/kgbw/day
WATCMCL
Upper 0.0003 mg/kgbw/day
WATCMCU
Details of calculations on next page
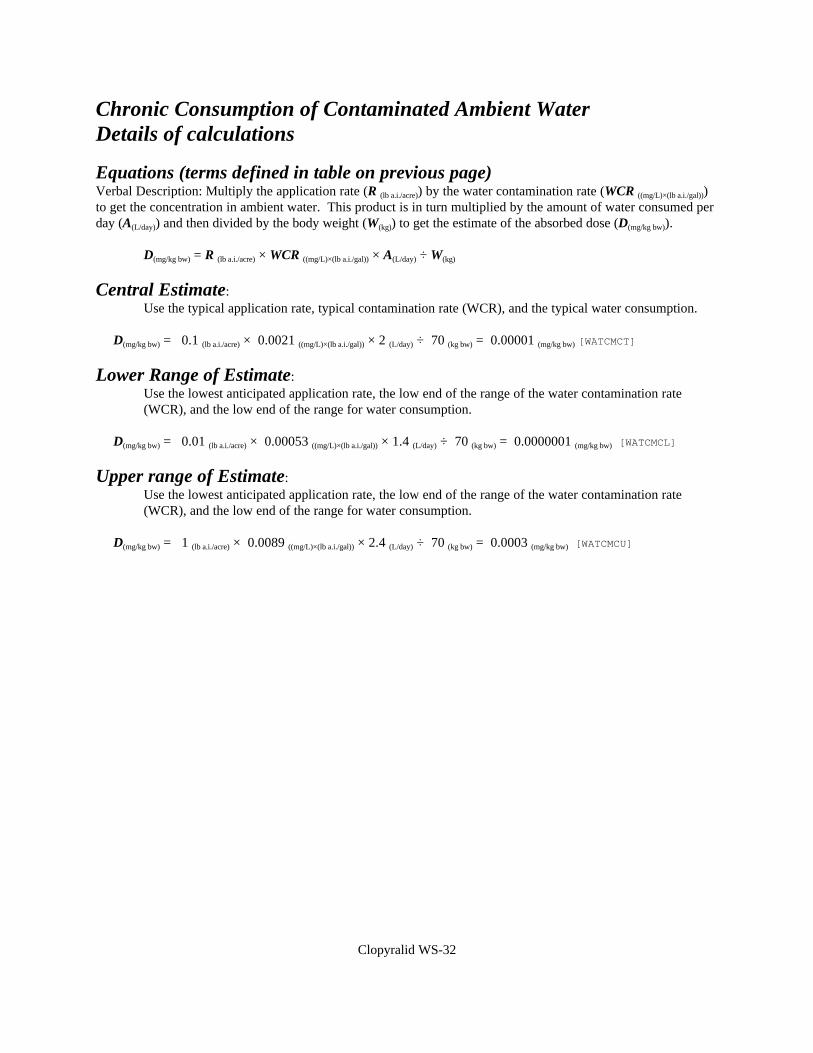
Clopyralid WS-32
Chronic Consumption of Contaminated Ambient WaterDetails of calculations
Equations (terms defined in table on previous page)Verbal Description: Multiply the application rate (R (lb a.i./acre)) by the water contamination rate (WCR ((mg/L)×(lb a.i./gal)))to get the concentration in ambient water. This product is in turn multiplied by the amount of water consumed perday (A(L/day)) and then divided by the body weight (W(kg)) to get the estimate of the absorbed dose (D(mg/kg bw)).
D(mg/kg bw) = R (lb a.i./acre) × WCR ((mg/L)×(lb a.i./gal)) × A(L/day) ÷ W(kg)
Central Estimate:Use the typical application rate, typical contamination rate (WCR), and the typical water consumption.
D(mg/kg bw) = 0.1 (lb a.i./acre) × 0.0021 ((mg/L)×(lb a.i./gal)) × 2 (L/day) ÷ 70 (kg bw) = 0.00001 (mg/kg bw) [WATCMCT]
Lower Range of Estimate:Use the lowest anticipated application rate, the low end of the range of the water contamination rate(WCR), and the low end of the range for water consumption.
D(mg/kg bw) = 0.01 (lb a.i./acre) × 0.00053 ((mg/L)×(lb a.i./gal)) × 1.4 (L/day) ÷ 70 (kg bw) = 0.0000001 (mg/kg bw) [WATCMCL]
Upper range of Estimate:Use the lowest anticipated application rate, the low end of the range of the water contamination rate(WCR), and the low end of the range for water consumption.
D(mg/kg bw) = 1 (lb a.i./acre) × 0.0089 ((mg/L)×(lb a.i./gal)) × 2.4 (L/day) ÷ 70 (kg bw) = 0.0003 (mg/kg bw) [WATCMCU]
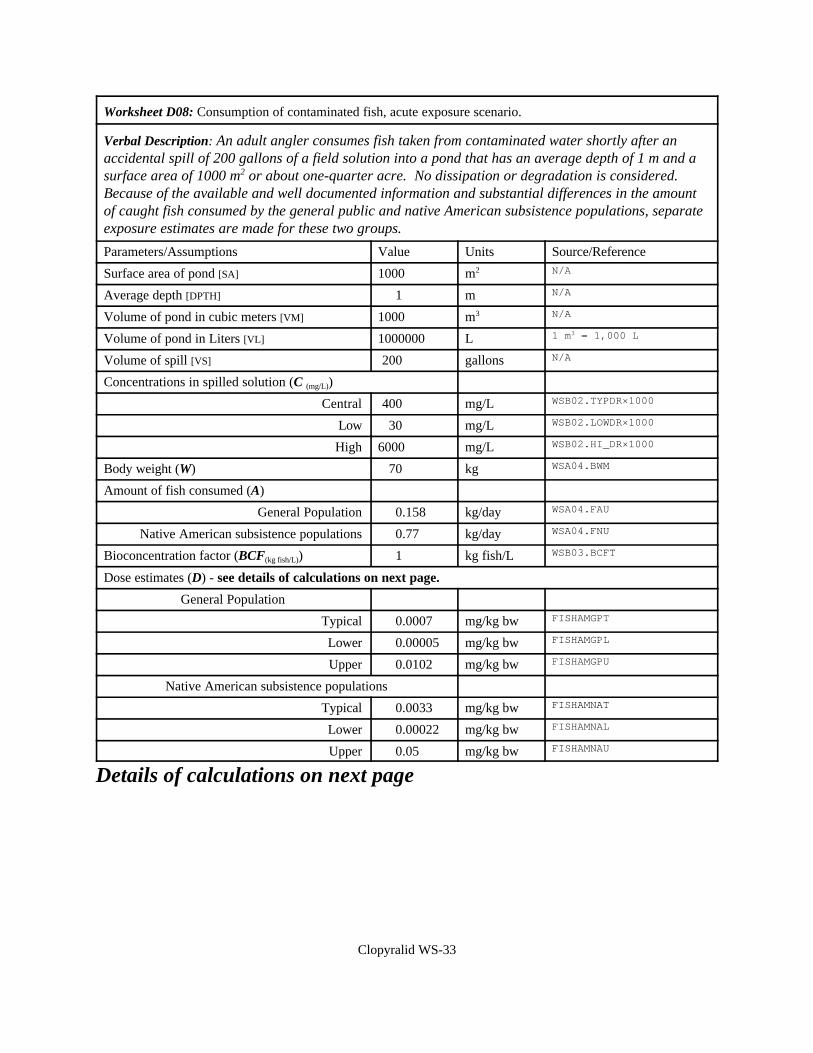
Clopyralid WS-33
Worksheet D08: Consumption of contaminated fish, acute exposure scenario.
Verbal Description: An adult angler consumes fish taken from contaminated water shortly after anaccidental spill of 200 gallons of a field solution into a pond that has an average depth of 1 m and asurface area of 1000 m2 or about one-quarter acre. No dissipation or degradation is considered. Because of the available and well documented information and substantial differences in the amountof caught fish consumed by the general public and native American subsistence populations, separateexposure estimates are made for these two groups.
Parameters/Assumptions Value Units Source/Reference
Surface area of pond [SA] 1000 m2 N/A
Average depth [DPTH] 1 m N/A
Volume of pond in cubic meters [VM] 1000 m3 N/A
Volume of pond in Liters [VL] 1000000 L 1 m3 = 1,000 L
Volume of spill [VS] 200 gallons N/A
Concentrations in spilled solution (C (mg/L))
Central 400 mg/L WSB02.TYPDR×1000
Low 30 mg/L WSB02.LOWDR×1000
High 6000 mg/L WSB02.HI_DR×1000
Body weight (W) 70 kg WSA04.BWM
Amount of fish consumed (A)
General Population 0.158 kg/day WSA04.FAU
Native American subsistence populations 0.77 kg/day WSA04.FNU
Bioconcentration factor (BCF(kg fish/L)) 1 kg fish/L WSB03.BCFT
Dose estimates (D) - see details of calculations on next page.
General Population
Typical 0.0007 mg/kg bw FISHAMGPT
Lower 0.00005 mg/kg bw FISHAMGPL
Upper 0.0102 mg/kg bw FISHAMGPU
Native American subsistence populations
Typical 0.0033 mg/kg bw FISHAMNAT
Lower 0.00022 mg/kg bw FISHAMNAL
Upper 0.05 mg/kg bw FISHAMNAU
Details of calculations on next page
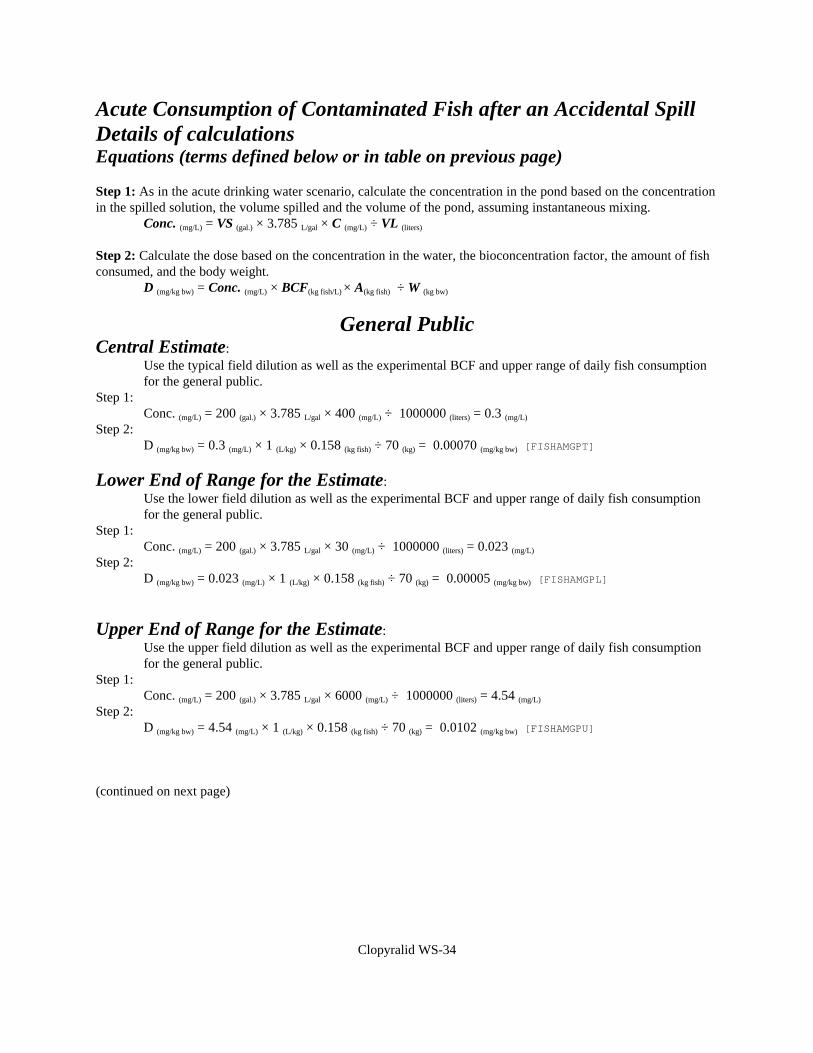
Clopyralid WS-34
Acute Consumption of Contaminated Fish after an Accidental SpillDetails of calculationsEquations (terms defined below or in table on previous page)
Step 1: As in the acute drinking water scenario, calculate the concentration in the pond based on the concentrationin the spilled solution, the volume spilled and the volume of the pond, assuming instantaneous mixing.
Conc. (mg/L) = VS (gal.) × 3.785 L/gal × C (mg/L) ÷ VL (liters)
Step 2: Calculate the dose based on the concentration in the water, the bioconcentration factor, the amount of fishconsumed, and the body weight.
D (mg/kg bw) = Conc. (mg/L) × BCF(kg fish/L) × A(kg fish) ÷ W (kg bw)
General PublicCentral Estimate:
Use the typical field dilution as well as the experimental BCF and upper range of daily fish consumptionfor the general public.
Step 1:Conc. (mg/L) = 200 (gal.) × 3.785 L/gal × 400 (mg/L) ÷ 1000000 (liters) = 0.3 (mg/L)
Step 2:D (mg/kg bw) = 0.3 (mg/L) × 1 (L/kg) × 0.158 (kg fish) ÷ 70 (kg) = 0.00070 (mg/kg bw) [FISHAMGPT]
Lower End of Range for the Estimate:Use the lower field dilution as well as the experimental BCF and upper range of daily fish consumptionfor the general public.
Step 1:Conc. (mg/L) = 200 (gal.) × 3.785 L/gal × 30 (mg/L) ÷ 1000000 (liters) = 0.023 (mg/L)
Step 2:D (mg/kg bw) = 0.023 (mg/L) × 1 (L/kg) × 0.158 (kg fish) ÷ 70 (kg) = 0.00005 (mg/kg bw) [FISHAMGPL]
Upper End of Range for the Estimate:Use the upper field dilution as well as the experimental BCF and upper range of daily fish consumptionfor the general public.
Step 1:Conc. (mg/L) = 200 (gal.) × 3.785 L/gal × 6000 (mg/L) ÷ 1000000 (liters) = 4.54 (mg/L)
Step 2:D (mg/kg bw) = 4.54 (mg/L) × 1 (L/kg) × 0.158 (kg fish) ÷ 70 (kg) = 0.0102 (mg/kg bw) [FISHAMGPU]
(continued on next page)
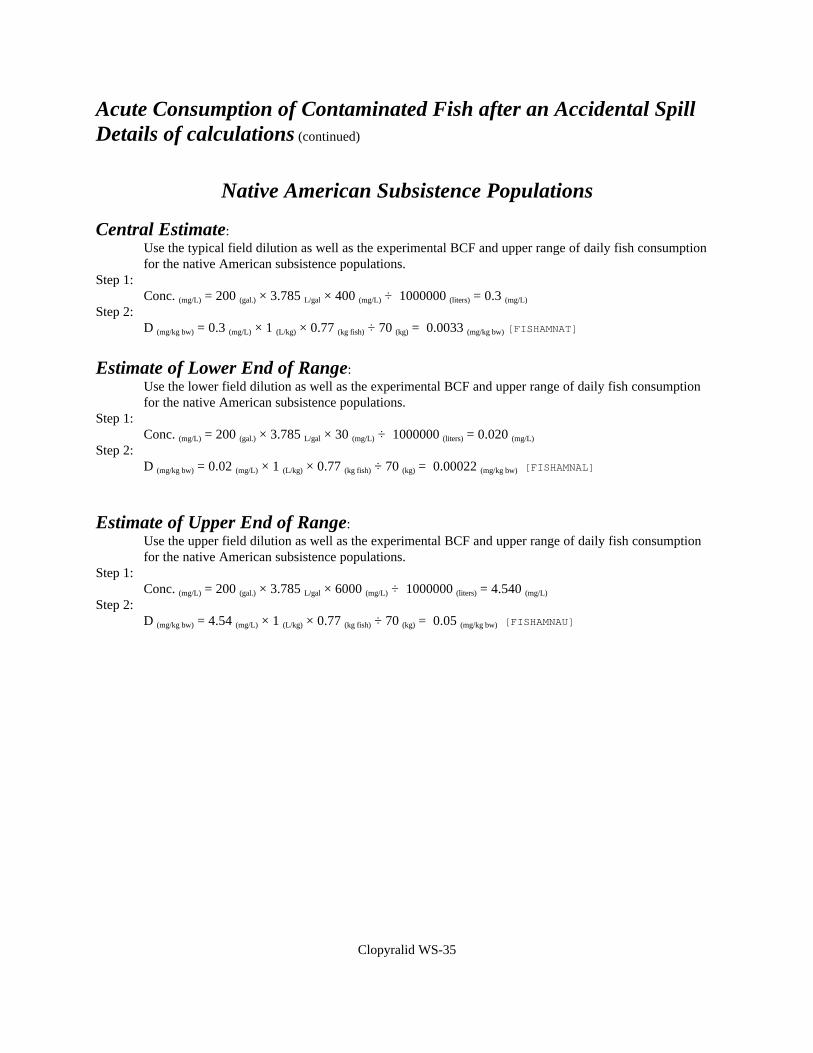
Clopyralid WS-35
Acute Consumption of Contaminated Fish after an Accidental SpillDetails of calculations (continued)
Native American Subsistence Populations
Central Estimate:Use the typical field dilution as well as the experimental BCF and upper range of daily fish consumptionfor the native American subsistence populations.
Step 1:Conc. (mg/L) = 200 (gal.) × 3.785 L/gal × 400 (mg/L) ÷ 1000000 (liters) = 0.3 (mg/L)
Step 2:D (mg/kg bw) = 0.3 (mg/L) × 1 (L/kg) × 0.77 (kg fish) ÷ 70 (kg) = 0.0033 (mg/kg bw) [FISHAMNAT]
Estimate of Lower End of Range:Use the lower field dilution as well as the experimental BCF and upper range of daily fish consumptionfor the native American subsistence populations.
Step 1:Conc. (mg/L) = 200 (gal.) × 3.785 L/gal × 30 (mg/L) ÷ 1000000 (liters) = 0.020 (mg/L)
Step 2:D (mg/kg bw) = 0.02 (mg/L) × 1 (L/kg) × 0.77 (kg fish) ÷ 70 (kg) = 0.00022 (mg/kg bw) [FISHAMNAL]
Estimate of Upper End of Range:Use the upper field dilution as well as the experimental BCF and upper range of daily fish consumptionfor the native American subsistence populations.
Step 1:Conc. (mg/L) = 200 (gal.) × 3.785 L/gal × 6000 (mg/L) ÷ 1000000 (liters) = 4.540 (mg/L)
Step 2:D (mg/kg bw) = 4.54 (mg/L) × 1 (L/kg) × 0.77 (kg fish) ÷ 70 (kg) = 0.05 (mg/kg bw) [FISHAMNAU]
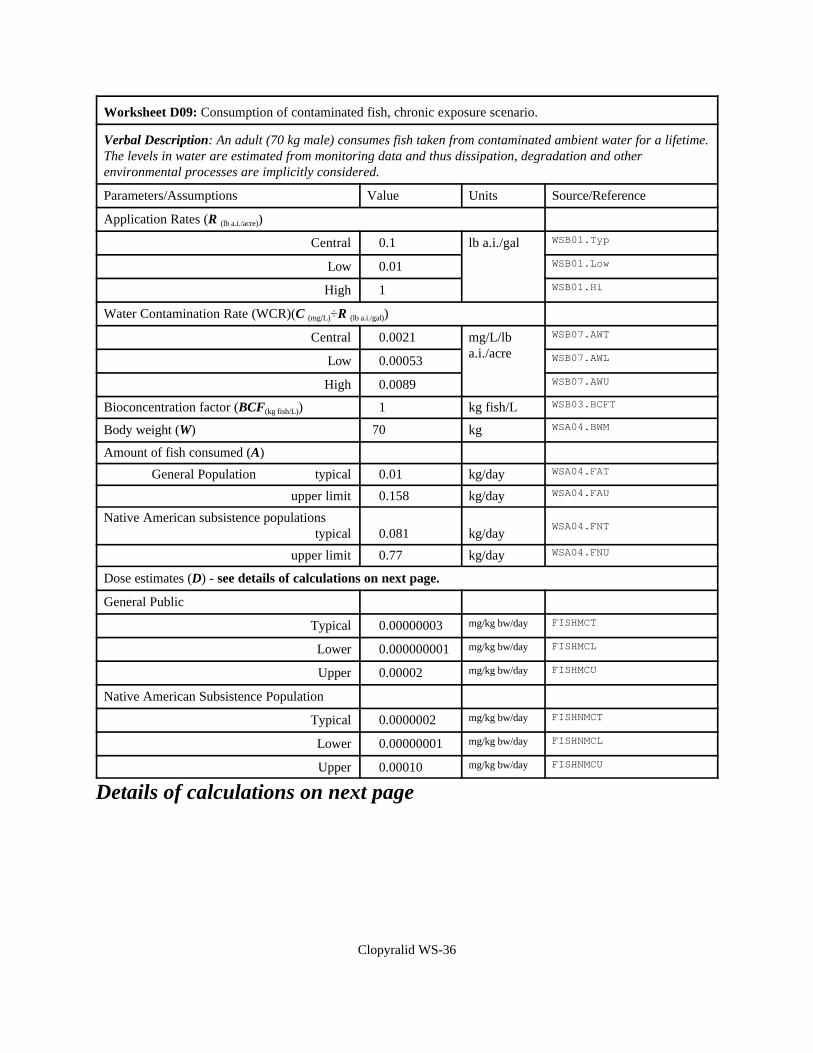
Clopyralid WS-36
Worksheet D09: Consumption of contaminated fish, chronic exposure scenario.
Verbal Description: An adult (70 kg male) consumes fish taken from contaminated ambient water for a lifetime. The levels in water are estimated from monitoring data and thus dissipation, degradation and otherenvironmental processes are implicitly considered.
Parameters/Assumptions Value Units Source/Reference
Application Rates (R (lb a.i./acre))
Central 0.1 lb a.i./gal WSB01.Typ
Low 0.01 WSB01.Low
High 1 WSB01.Hi
Water Contamination Rate (WCR)(C (mg/L)÷R (lb a.i./gal))
Central 0.0021 mg/L/lba.i./acre
WSB07.AWT
Low 0.00053 WSB07.AWL
High 0.0089 WSB07.AWU
Bioconcentration factor (BCF(kg fish/L)) 1 kg fish/L WSB03.BCFT
Body weight (W) 70 kg WSA04.BWM
Amount of fish consumed (A)
General Population typical 0.01 kg/day WSA04.FAT
upper limit 0.158 kg/day WSA04.FAU
Native American subsistence populationstypical 0.081 kg/day
WSA04.FNT
upper limit 0.77 kg/day WSA04.FNU
Dose estimates (D) - see details of calculations on next page.
General Public
Typical 0.00000003 mg/kg bw/day FISHMCT
Lower 0.000000001 mg/kg bw/day FISHMCL
Upper 0.00002 mg/kg bw/day FISHMCU
Native American Subsistence Population
Typical 0.0000002 mg/kg bw/day FISHNMCT
Lower 0.00000001 mg/kg bw/day FISHNMCL
Upper 0.00010 mg/kg bw/day FISHNMCU
Details of calculations on next page
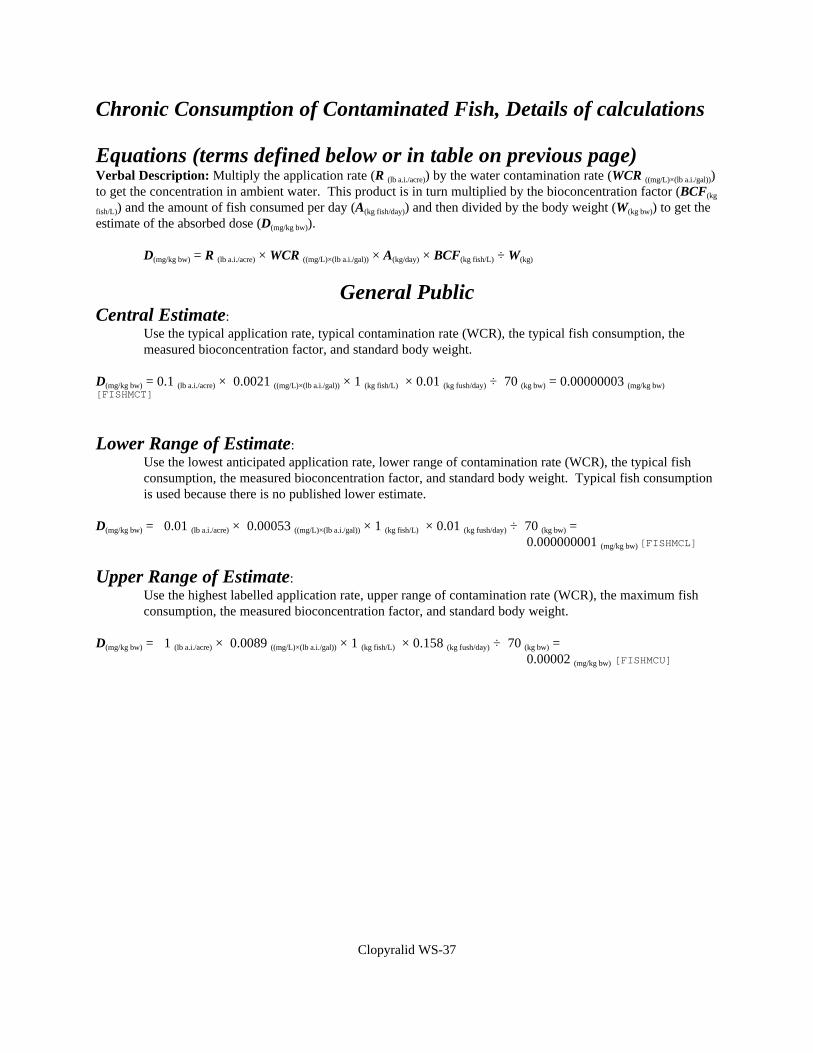
Clopyralid WS-37
Chronic Consumption of Contaminated Fish, Details of calculations
Equations (terms defined below or in table on previous page)Verbal Description: Multiply the application rate (R (lb a.i./acre)) by the water contamination rate (WCR ((mg/L)×(lb a.i./gal)))to get the concentration in ambient water. This product is in turn multiplied by the bioconcentration factor (BCF(kg
fish/L)) and the amount of fish consumed per day (A(kg fish/day)) and then divided by the body weight (W(kg bw)) to get theestimate of the absorbed dose (D(mg/kg bw)).
D(mg/kg bw) = R (lb a.i./acre) × WCR ((mg/L)×(lb a.i./gal)) × A(kg/day) × BCF(kg fish/L) ÷ W(kg)
General PublicCentral Estimate:
Use the typical application rate, typical contamination rate (WCR), the typical fish consumption, themeasured bioconcentration factor, and standard body weight.
D(mg/kg bw) = 0.1 (lb a.i./acre) × 0.0021 ((mg/L)×(lb a.i./gal)) × 1 (kg fish/L) × 0.01 (kg fush/day) ÷ 70 (kg bw) = 0.00000003 (mg/kg bw)[FISHMCT]
Lower Range of Estimate:Use the lowest anticipated application rate, lower range of contamination rate (WCR), the typical fishconsumption, the measured bioconcentration factor, and standard body weight. Typical fish consumptionis used because there is no published lower estimate.
D(mg/kg bw) = 0.01 (lb a.i./acre) × 0.00053 ((mg/L)×(lb a.i./gal)) × 1 (kg fish/L) × 0.01 (kg fush/day) ÷ 70 (kg bw) = 0.000000001 (mg/kg bw) [FISHMCL]
Upper Range of Estimate:Use the highest labelled application rate, upper range of contamination rate (WCR), the maximum fishconsumption, the measured bioconcentration factor, and standard body weight.
D(mg/kg bw) = 1 (lb a.i./acre) × 0.0089 ((mg/L)×(lb a.i./gal)) × 1 (kg fish/L) × 0.158 (kg fush/day) ÷ 70 (kg bw) = 0.00002 (mg/kg bw) [FISHMCU]
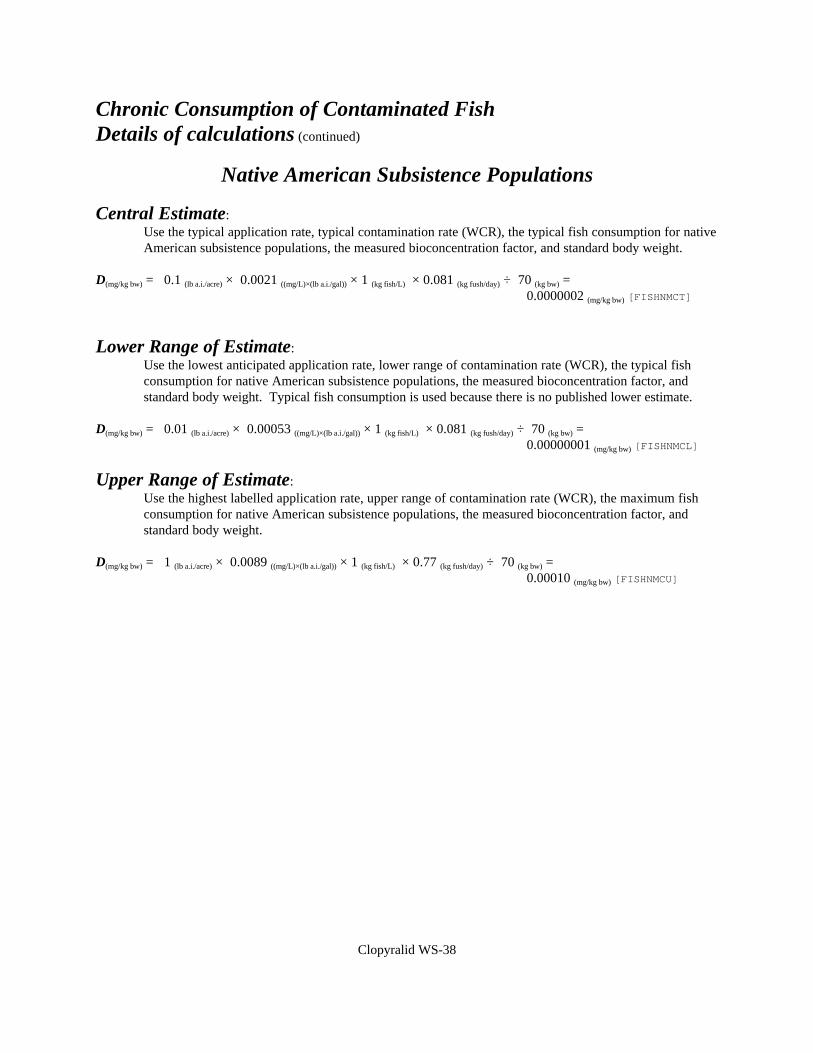
Clopyralid WS-38
Chronic Consumption of Contaminated FishDetails of calculations (continued)
Native American Subsistence Populations
Central Estimate:Use the typical application rate, typical contamination rate (WCR), the typical fish consumption for nativeAmerican subsistence populations, the measured bioconcentration factor, and standard body weight.
D(mg/kg bw) = 0.1 (lb a.i./acre) × 0.0021 ((mg/L)×(lb a.i./gal)) × 1 (kg fish/L) × 0.081 (kg fush/day) ÷ 70 (kg bw) = 0.0000002 (mg/kg bw) [FISHNMCT]
Lower Range of Estimate:Use the lowest anticipated application rate, lower range of contamination rate (WCR), the typical fishconsumption for native American subsistence populations, the measured bioconcentration factor, andstandard body weight. Typical fish consumption is used because there is no published lower estimate.
D(mg/kg bw) = 0.01 (lb a.i./acre) × 0.00053 ((mg/L)×(lb a.i./gal)) × 1 (kg fish/L) × 0.081 (kg fush/day) ÷ 70 (kg bw) = 0.00000001 (mg/kg bw) [FISHNMCL]
Upper Range of Estimate:Use the highest labelled application rate, upper range of contamination rate (WCR), the maximum fishconsumption for native American subsistence populations, the measured bioconcentration factor, andstandard body weight.
D(mg/kg bw) = 1 (lb a.i./acre) × 0.0089 ((mg/L)×(lb a.i./gal)) × 1 (kg fish/L) × 0.77 (kg fush/day) ÷ 70 (kg bw) = 0.00010 (mg/kg bw) [FISHNMCU]
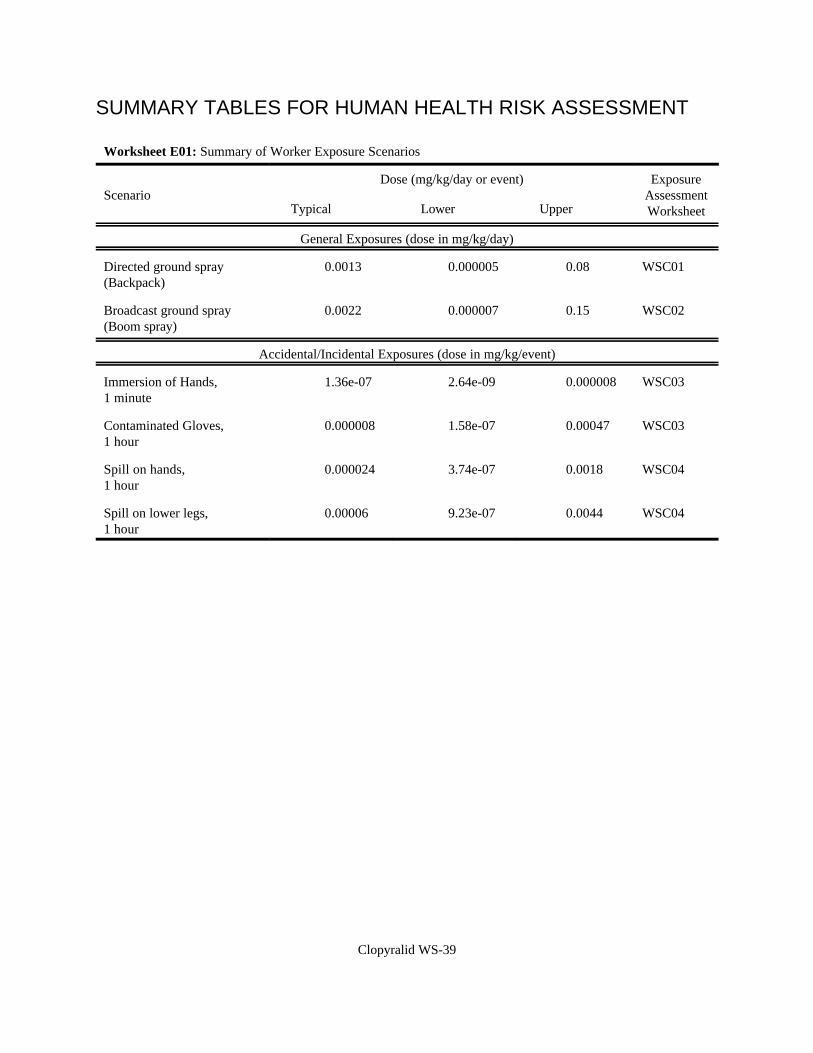
Clopyralid WS-39
SUMMARY TABLES FOR HUMAN HEALTH RISK ASSESSMENT
Worksheet E01: Summary of Worker Exposure Scenarios
ScenarioDose (mg/kg/day or event) Exposure
AssessmentWorksheetTypical Lower Upper
General Exposures (dose in mg/kg/day)
Directed ground spray(Backpack)
0.0013 0.000005 0.08 WSC01
Broadcast ground spray(Boom spray)
0.0022 0.000007 0.15 WSC02
Accidental/Incidental Exposures (dose in mg/kg/event)
Immersion of Hands, 1 minute
1.36e-07 2.64e-09 0.000008 WSC03
Contaminated Gloves,1 hour
0.000008 1.58e-07 0.00047 WSC03
Spill on hands,1 hour
0.000024 3.74e-07 0.0018 WSC04
Spill on lower legs, 1 hour
0.00006 9.23e-07 0.0044 WSC04
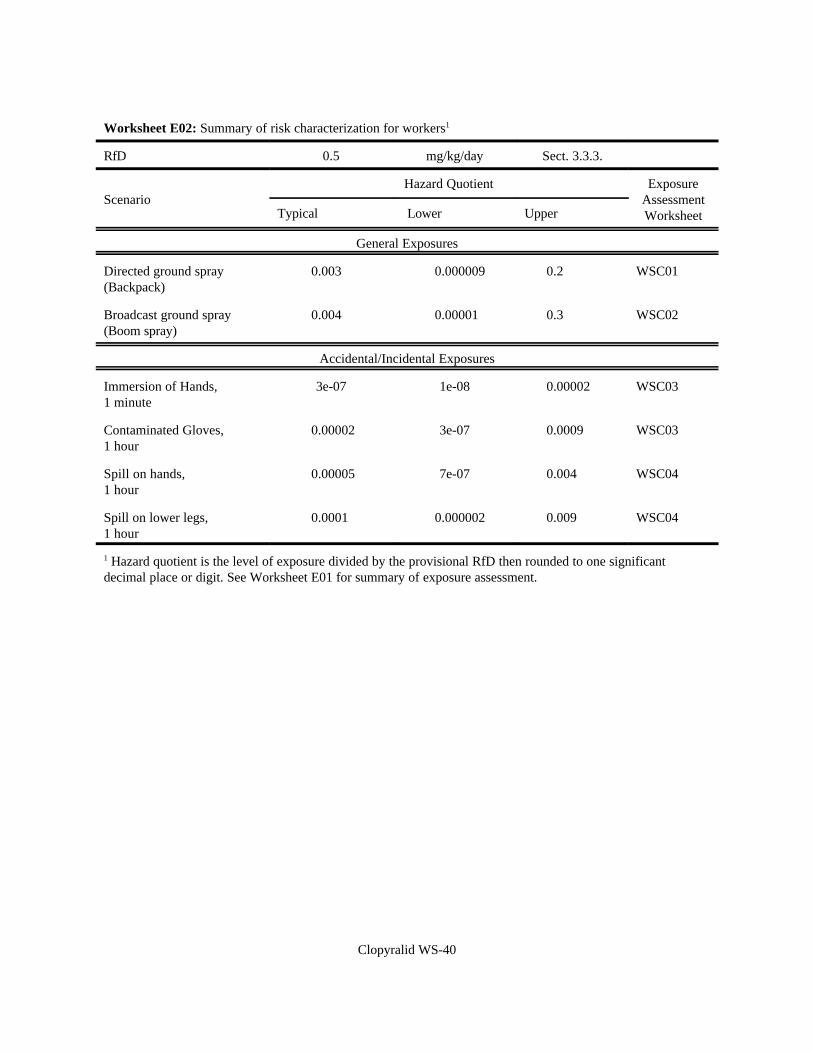
Clopyralid WS-40
Worksheet E02: Summary of risk characterization for workers1
RfD 0.5 mg/kg/day Sect. 3.3.3.
ScenarioHazard Quotient Exposure
AssessmentWorksheetTypical Lower Upper
General Exposures
Directed ground spray(Backpack)
0.003 0.000009 0.2 WSC01
Broadcast ground spray(Boom spray)
0.004 0.00001 0.3 WSC02
Accidental/Incidental Exposures
Immersion of Hands, 1 minute
3e-07 1e-08 0.00002 WSC03
Contaminated Gloves,1 hour
0.00002 3e-07 0.0009 WSC03
Spill on hands,1 hour
0.00005 7e-07 0.004 WSC04
Spill on lower legs, 1 hour
0.0001 0.000002 0.009 WSC04
1 Hazard quotient is the level of exposure divided by the provisional RfD then rounded to one significantdecimal place or digit. See Worksheet E01 for summary of exposure assessment.

Clopyralid WS-41
Worksheet E03: Summary of Exposure Scenarios for the General Public
ScenarioTarget Dose (mg/kg/day) Worksheet
Typical Lower Upper
Acute/Accidental Exposures
Direct spray, entire body Child 0.00091 0.00001 0.067 WSD01
Direct spray, lower legs Woman 0.00009 0.0000014 0.0068 WSD02
Dermal, contaminatedvegetation
Woman 0.00159 0.000027 0.0963 WSD03
Contaminated fruit, acuteexposure
Woman 0.0011 0.00011 0.05 WSD04
Contaminated water, acuteexposure
Child 0.023 0.0011 0.51 WSD06
Consumption of fish, generalpublic
Man 0.0007 0.00005 0.0102 WSD08
Consumption of fish,subsistence populations
Man 0.0033 0.00022 0.05 WSD08
Chronic/Longer Term Exposures
Contaminated fruit Woman 0.0005 0.00004 0.059 WSD05
Consumption of water Man 0.00001 1.10e-07 0.0003 WSD07
Consumption of fish, generalpublic
Man 3.00e-08 1.00e-09 0.00002 WSD09
Consumption of fish,subsistence populations
Man 2.00e-07 1.00e-08 0.0001 WSD09
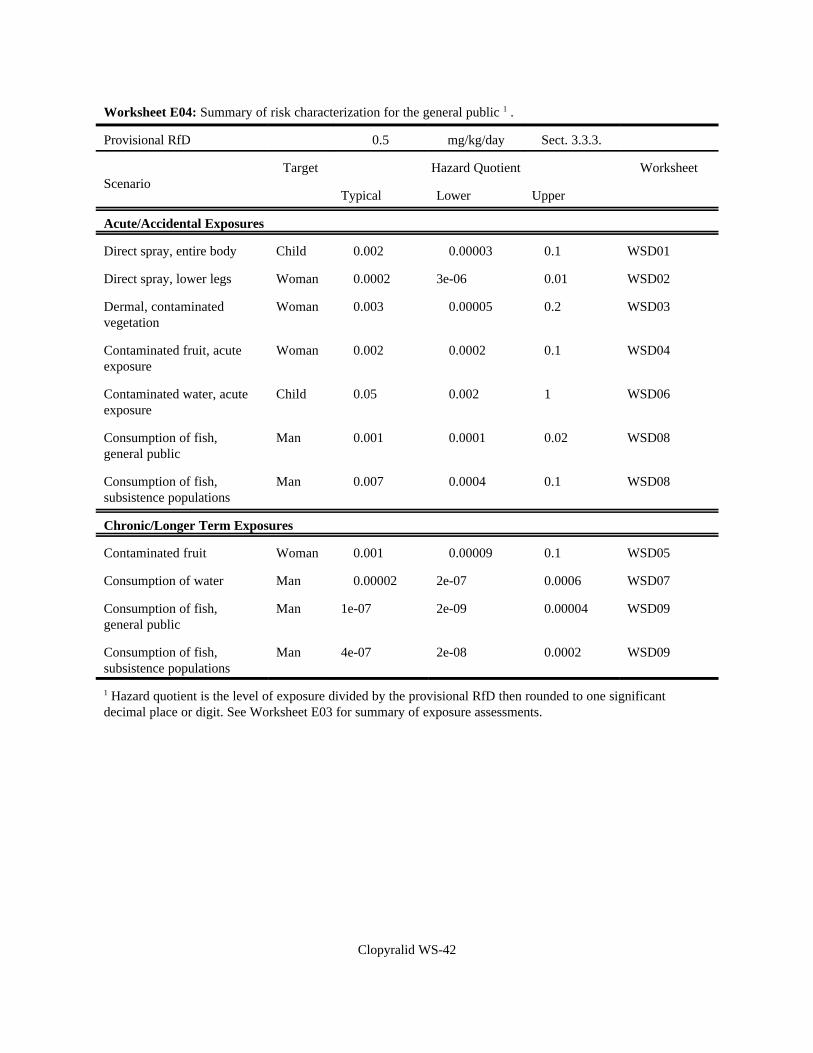
Clopyralid WS-42
Worksheet E04: Summary of risk characterization for the general public 1 .
Provisional RfD 0.5 mg/kg/day Sect. 3.3.3.
ScenarioTarget Hazard Quotient Worksheet
Typical Lower Upper
Acute/Accidental Exposures
Direct spray, entire body Child 0.002 0.00003 0.1 WSD01
Direct spray, lower legs Woman 0.0002 3e-06 0.01 WSD02
Dermal, contaminatedvegetation
Woman 0.003 0.00005 0.2 WSD03
Contaminated fruit, acuteexposure
Woman 0.002 0.0002 0.1 WSD04
Contaminated water, acuteexposure
Child 0.05 0.002 1 WSD06
Consumption of fish, general public
Man 0.001 0.0001 0.02 WSD08
Consumption of fish,subsistence populations
Man 0.007 0.0004 0.1 WSD08
Chronic/Longer Term Exposures
Contaminated fruit Woman 0.001 0.00009 0.1 WSD05
Consumption of water Man 0.00002 2e-07 0.0006 WSD07
Consumption of fish,general public
Man 1e-07 2e-09 0.00004 WSD09
Consumption of fish,subsistence populations
Man 4e-07 2e-08 0.0002 WSD09
1 Hazard quotient is the level of exposure divided by the provisional RfD then rounded to one significantdecimal place or digit. See Worksheet E03 for summary of exposure assessments.
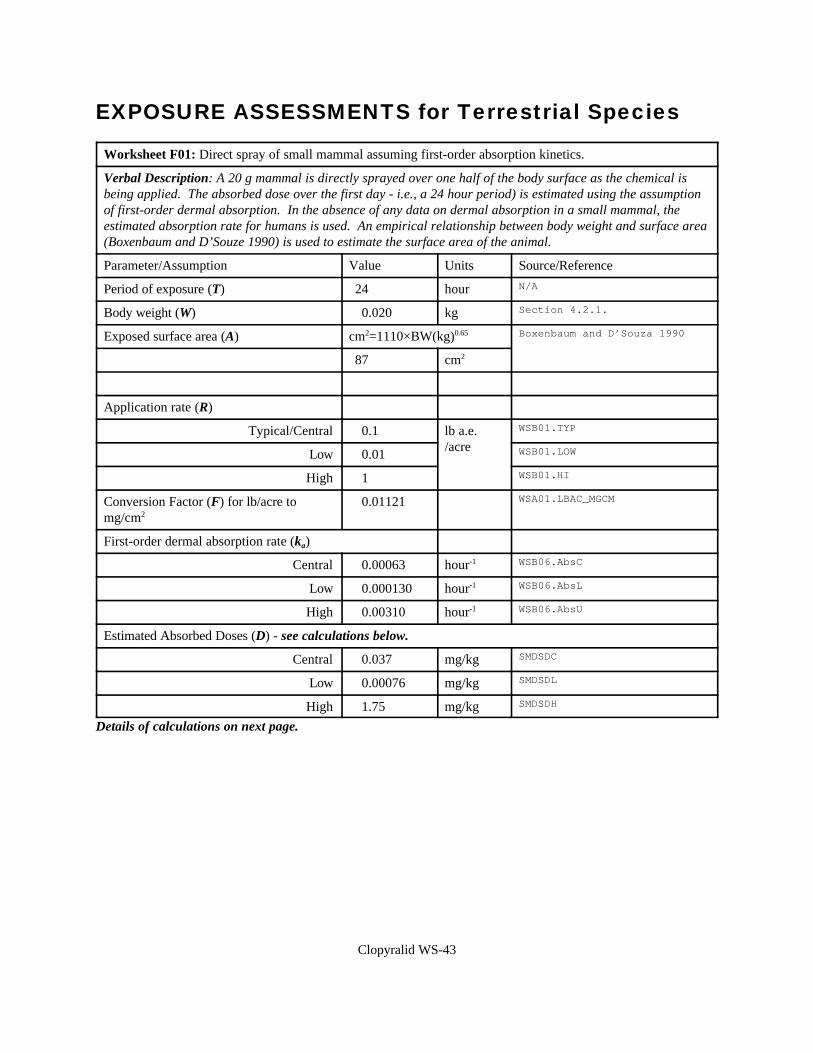
Clopyralid WS-43
EXPOSURE ASSESSMENTS for Terrestrial Species
Worksheet F01: Direct spray of small mammal assuming first-order absorption kinetics.
Verbal Description: A 20 g mammal is directly sprayed over one half of the body surface as the chemical isbeing applied. The absorbed dose over the first day - i.e., a 24 hour period) is estimated using the assumptionof first-order dermal absorption. In the absence of any data on dermal absorption in a small mammal, theestimated absorption rate for humans is used. An empirical relationship between body weight and surface area(Boxenbaum and D’Souze 1990) is used to estimate the surface area of the animal.
Parameter/Assumption Value Units Source/Reference
Period of exposure (T) 24 hour N/A
Body weight (W) 0.020 kg Section 4.2.1.
Exposed surface area (A) cm2=1110×BW(kg)0.65 Boxenbaum and D’Souza 1990
87 cm2
Application rate (R)
Typical/Central 0.1 lb a.e./acre
WSB01.TYP
Low 0.01 WSB01.LOW
High 1 WSB01.HI
Conversion Factor (F) for lb/acre tomg/cm2
0.01121 WSA01.LBAC_MGCM
First-order dermal absorption rate (ka)
Central 0.00063 hour-1 WSB06.AbsC
Low 0.000130 hour-1 WSB06.AbsL
High 0.00310 hour-1 WSB06.AbsU
Estimated Absorbed Doses (D) - see calculations below.
Central 0.037 mg/kg SMDSDC
Low 0.00076 mg/kg SMDSDL
High 1.75 mg/kg SMDSDH
Details of calculations on next page.
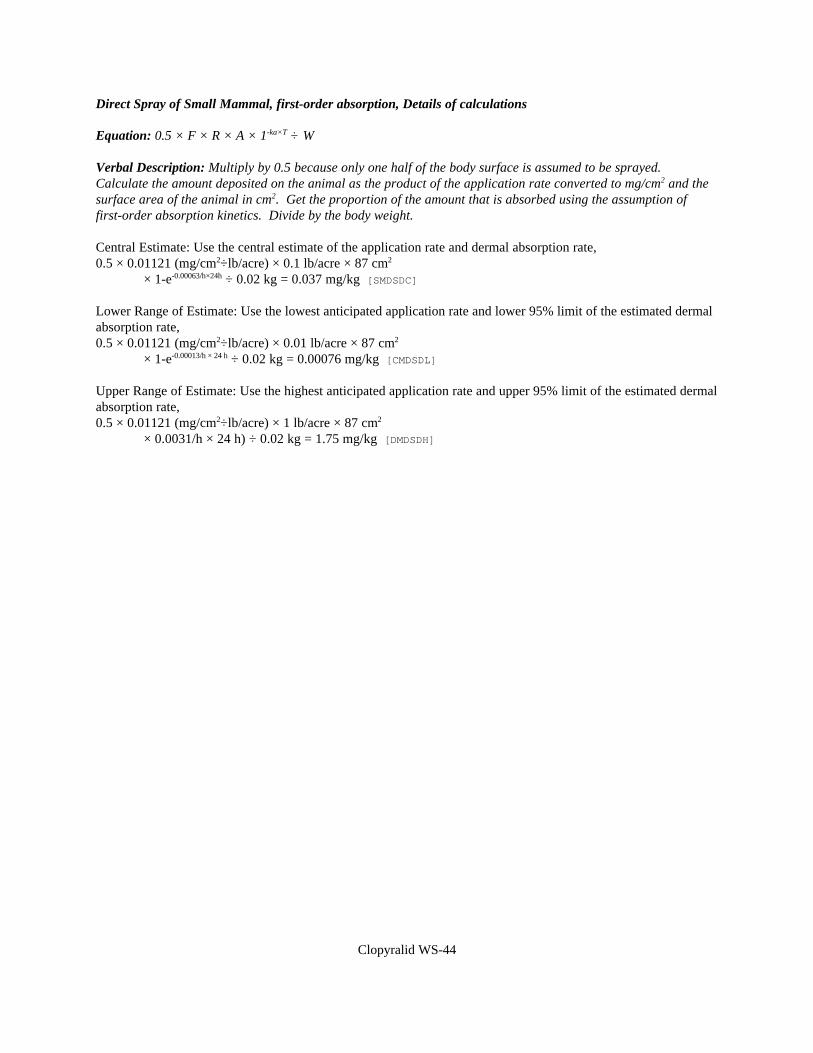
Clopyralid WS-44
Direct Spray of Small Mammal, first-order absorption, Details of calculations
Equation: 0.5 × F × R × A × 1-ka×T ÷ W
Verbal Description: Multiply by 0.5 because only one half of the body surface is assumed to be sprayed. Calculate the amount deposited on the animal as the product of the application rate converted to mg/cm2 and thesurface area of the animal in cm2. Get the proportion of the amount that is absorbed using the assumption offirst-order absorption kinetics. Divide by the body weight.
Central Estimate: Use the central estimate of the application rate and dermal absorption rate,0.5 × 0.01121 (mg/cm2÷lb/acre) × 0.1 lb/acre × 87 cm2
× 1-e-0.00063/h×24h ÷ 0.02 kg = 0.037 mg/kg [SMDSDC]
Lower Range of Estimate: Use the lowest anticipated application rate and lower 95% limit of the estimated dermalabsorption rate,0.5 × 0.01121 (mg/cm2÷lb/acre) × 0.01 lb/acre × 87 cm2
× 1-e-0.00013/h × 24 h ÷ 0.02 kg = 0.00076 mg/kg [CMDSDL]
Upper Range of Estimate: Use the highest anticipated application rate and upper 95% limit of the estimated dermalabsorption rate,0.5 × 0.01121 (mg/cm2÷lb/acre) × 1 lb/acre × 87 cm2
× 0.0031/h × 24 h) ÷ 0.02 kg = 1.75 mg/kg [DMDSDH]
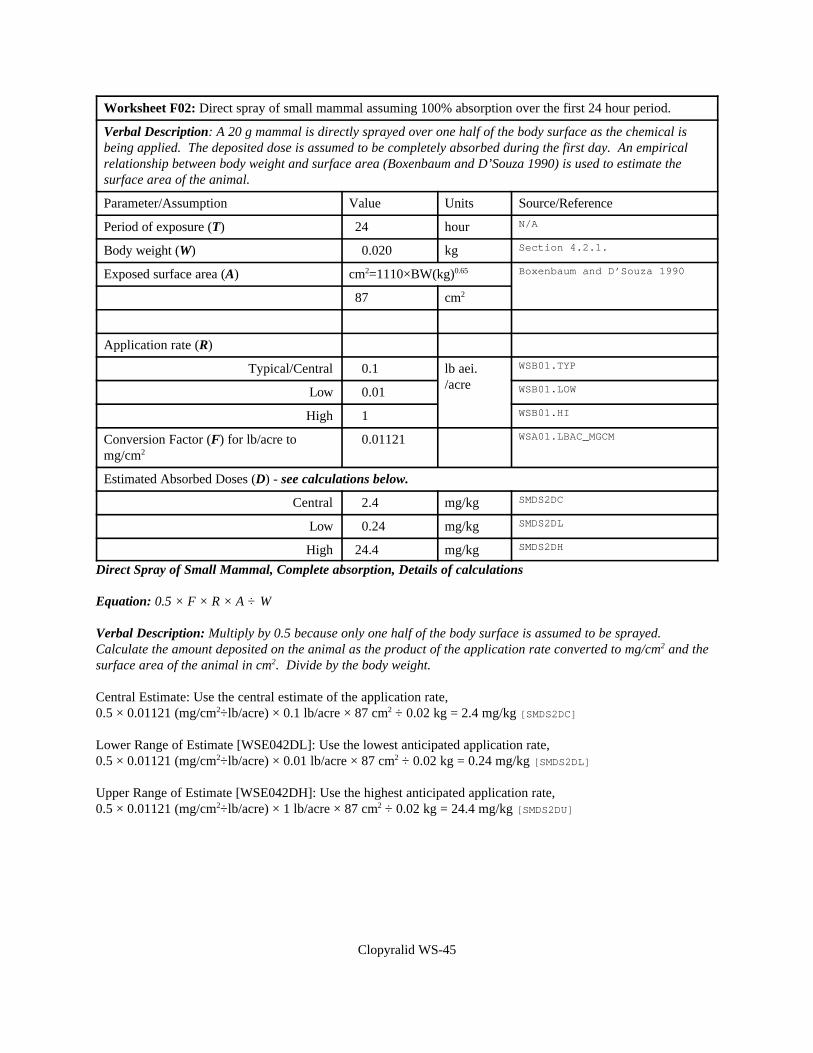
Clopyralid WS-45
Worksheet F02: Direct spray of small mammal assuming 100% absorption over the first 24 hour period.
Verbal Description: A 20 g mammal is directly sprayed over one half of the body surface as the chemical isbeing applied. The deposited dose is assumed to be completely absorbed during the first day. An empiricalrelationship between body weight and surface area (Boxenbaum and D’Souza 1990) is used to estimate thesurface area of the animal.
Parameter/Assumption Value Units Source/Reference
Period of exposure (T) 24 hour N/A
Body weight (W) 0.020 kg Section 4.2.1.
Exposed surface area (A) cm2=1110×BW(kg)0.65 Boxenbaum and D’Souza 1990
87 cm2
Application rate (R)
Typical/Central 0.1 lb aei./acre
WSB01.TYP
Low 0.01 WSB01.LOW
High 1 WSB01.HI
Conversion Factor (F) for lb/acre tomg/cm2
0.01121 WSA01.LBAC_MGCM
Estimated Absorbed Doses (D) - see calculations below.
Central 2.4 mg/kg SMDS2DC
Low 0.24 mg/kg SMDS2DL
High 24.4 mg/kg SMDS2DH
Direct Spray of Small Mammal, Complete absorption, Details of calculations
Equation: 0.5 × F × R × A ÷ W
Verbal Description: Multiply by 0.5 because only one half of the body surface is assumed to be sprayed. Calculate the amount deposited on the animal as the product of the application rate converted to mg/cm2 and thesurface area of the animal in cm2. Divide by the body weight.
Central Estimate: Use the central estimate of the application rate,0.5 × 0.01121 (mg/cm2÷lb/acre) × 0.1 lb/acre × 87 cm2 ÷ 0.02 kg = 2.4 mg/kg [SMDS2DC]
Lower Range of Estimate [WSE042DL]: Use the lowest anticipated application rate,0.5 × 0.01121 (mg/cm2÷lb/acre) × 0.01 lb/acre × 87 cm2 ÷ 0.02 kg = 0.24 mg/kg [SMDS2DL]
Upper Range of Estimate [WSE042DH]: Use the highest anticipated application rate,0.5 × 0.01121 (mg/cm2÷lb/acre) × 1 lb/acre × 87 cm2 ÷ 0.02 kg = 24.4 mg/kg [SMDS2DU]
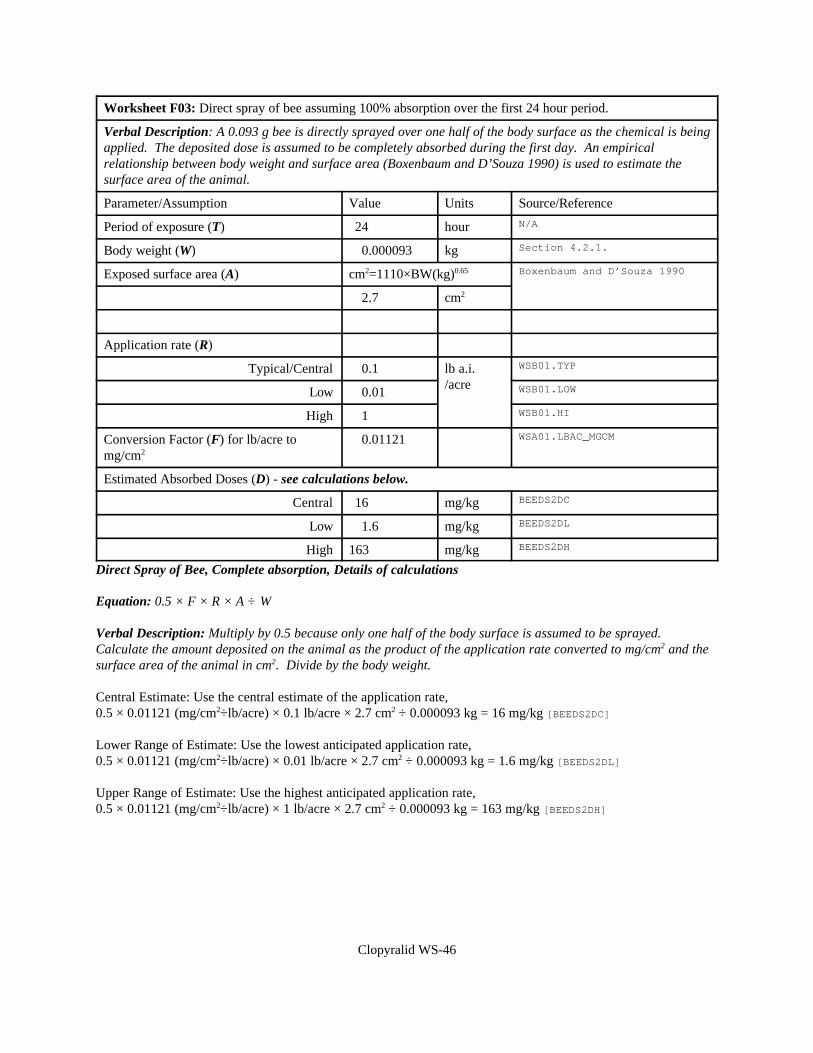
Clopyralid WS-46
Worksheet F03: Direct spray of bee assuming 100% absorption over the first 24 hour period.
Verbal Description: A 0.093 g bee is directly sprayed over one half of the body surface as the chemical is beingapplied. The deposited dose is assumed to be completely absorbed during the first day. An empiricalrelationship between body weight and surface area (Boxenbaum and D’Souza 1990) is used to estimate thesurface area of the animal.
Parameter/Assumption Value Units Source/Reference
Period of exposure (T) 24 hour N/A
Body weight (W) 0.000093 kg Section 4.2.1.
Exposed surface area (A) cm2=1110×BW(kg)0.65 Boxenbaum and D’Souza 1990
2.7 cm2
Application rate (R)
Typical/Central 0.1 lb a.i./acre
WSB01.TYP
Low 0.01 WSB01.LOW
High 1 WSB01.HI
Conversion Factor (F) for lb/acre tomg/cm2
0.01121 WSA01.LBAC_MGCM
Estimated Absorbed Doses (D) - see calculations below.
Central 16 mg/kg BEEDS2DC
Low 1.6 mg/kg BEEDS2DL
High 163 mg/kg BEEDS2DH
Direct Spray of Bee, Complete absorption, Details of calculations
Equation: 0.5 × F × R × A ÷ W
Verbal Description: Multiply by 0.5 because only one half of the body surface is assumed to be sprayed. Calculate the amount deposited on the animal as the product of the application rate converted to mg/cm2 and thesurface area of the animal in cm2. Divide by the body weight.
Central Estimate: Use the central estimate of the application rate,0.5 × 0.01121 (mg/cm2÷lb/acre) × 0.1 lb/acre × 2.7 cm2 ÷ 0.000093 kg = 16 mg/kg [BEEDS2DC]
Lower Range of Estimate: Use the lowest anticipated application rate,0.5 × 0.01121 (mg/cm2÷lb/acre) × 0.01 lb/acre × 2.7 cm2 ÷ 0.000093 kg = 1.6 mg/kg [BEEDS2DL]
Upper Range of Estimate: Use the highest anticipated application rate,0.5 × 0.01121 (mg/cm2÷lb/acre) × 1 lb/acre × 2.7 cm2 ÷ 0.000093 kg = 163 mg/kg [BEEDS2DH]
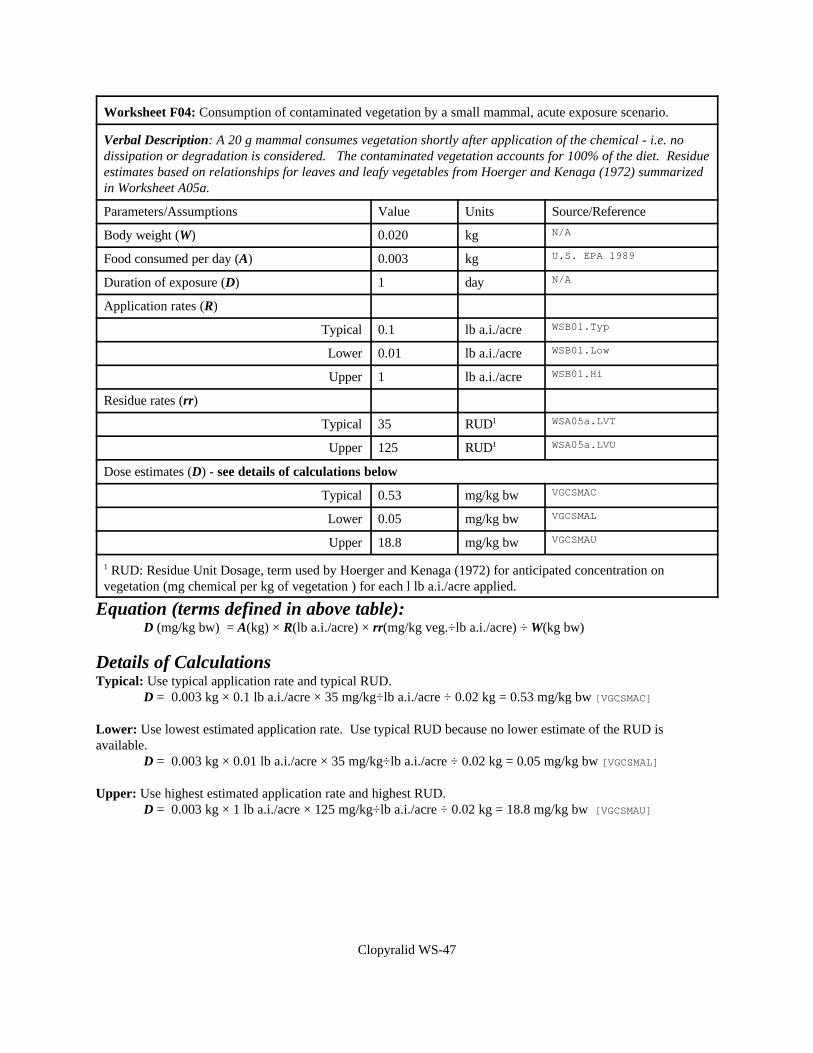
Clopyralid WS-47
Worksheet F04: Consumption of contaminated vegetation by a small mammal, acute exposure scenario.
Verbal Description: A 20 g mammal consumes vegetation shortly after application of the chemical - i.e. nodissipation or degradation is considered. The contaminated vegetation accounts for 100% of the diet. Residueestimates based on relationships for leaves and leafy vegetables from Hoerger and Kenaga (1972) summarizedin Worksheet A05a.
Parameters/Assumptions Value Units Source/Reference
Body weight (W) 0.020 kg N/A
Food consumed per day (A) 0.003 kg U.S. EPA 1989
Duration of exposure (D) 1 day N/A
Application rates (R)
Typical 0.1 lb a.i./acre WSB01.Typ
Lower 0.01 lb a.i./acre WSB01.Low
Upper 1 lb a.i./acre WSB01.Hi
Residue rates (rr)
Typical 35 RUD1 WSA05a.LVT
Upper 125 RUD1 WSA05a.LVU
Dose estimates (D) - see details of calculations below
Typical 0.53 mg/kg bw VGCSMAC
Lower 0.05 mg/kg bw VGCSMAL
Upper 18.8 mg/kg bw VGCSMAU
1 RUD: Residue Unit Dosage, term used by Hoerger and Kenaga (1972) for anticipated concentration onvegetation (mg chemical per kg of vegetation ) for each l lb a.i./acre applied.
Equation (terms defined in above table):D (mg/kg bw) = A(kg) × R(lb a.i./acre) × rr(mg/kg veg.÷lb a.i./acre) ÷ W(kg bw)
Details of CalculationsTypical: Use typical application rate and typical RUD.
D = 0.003 kg × 0.1 lb a.i./acre × 35 mg/kg÷lb a.i./acre ÷ 0.02 kg = 0.53 mg/kg bw [VGCSMAC]
Lower: Use lowest estimated application rate. Use typical RUD because no lower estimate of the RUD isavailable.
D = 0.003 kg × 0.01 lb a.i./acre × 35 mg/kg÷lb a.i./acre ÷ 0.02 kg = 0.05 mg/kg bw [VGCSMAL]
Upper: Use highest estimated application rate and highest RUD.D = 0.003 kg × 1 lb a.i./acre × 125 mg/kg÷lb a.i./acre ÷ 0.02 kg = 18.8 mg/kg bw [VGCSMAU]
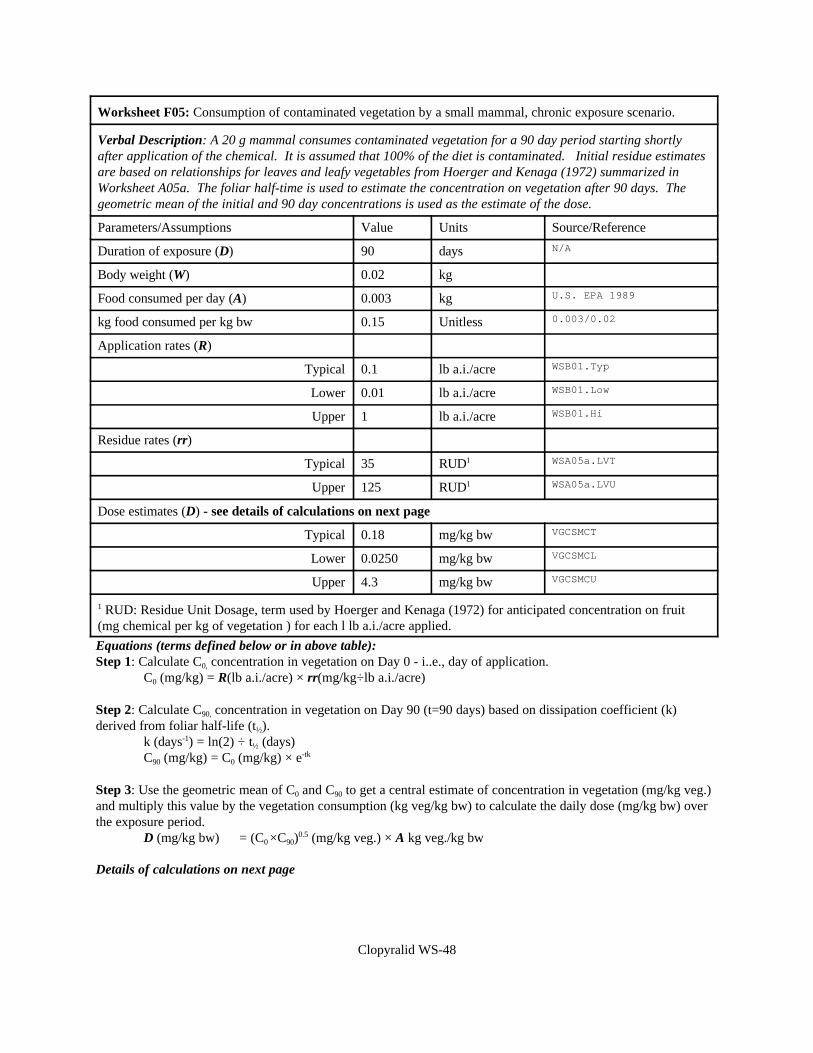
Clopyralid WS-48
Worksheet F05: Consumption of contaminated vegetation by a small mammal, chronic exposure scenario.
Verbal Description: A 20 g mammal consumes contaminated vegetation for a 90 day period starting shortlyafter application of the chemical. It is assumed that 100% of the diet is contaminated. Initial residue estimatesare based on relationships for leaves and leafy vegetables from Hoerger and Kenaga (1972) summarized inWorksheet A05a. The foliar half-time is used to estimate the concentration on vegetation after 90 days. Thegeometric mean of the initial and 90 day concentrations is used as the estimate of the dose.
Parameters/Assumptions Value Units Source/Reference
Duration of exposure (D) 90 days N/A
Body weight (W) 0.02 kg
Food consumed per day (A) 0.003 kg U.S. EPA 1989
kg food consumed per kg bw 0.15 Unitless 0.003/0.02
Application rates (R)
Typical 0.1 lb a.i./acre WSB01.Typ
Lower 0.01 lb a.i./acre WSB01.Low
Upper 1 lb a.i./acre WSB01.Hi
Residue rates (rr)
Typical 35 RUD1 WSA05a.LVT
Upper 125 RUD1 WSA05a.LVU
Dose estimates (D) - see details of calculations on next page
Typical 0.18 mg/kg bw VGCSMCT
Lower 0.0250 mg/kg bw VGCSMCL
Upper 4.3 mg/kg bw VGCSMCU
1 RUD: Residue Unit Dosage, term used by Hoerger and Kenaga (1972) for anticipated concentration on fruit(mg chemical per kg of vegetation ) for each l lb a.i./acre applied.
Equations (terms defined below or in above table):Step 1: Calculate C0, concentration in vegetation on Day 0 - i..e., day of application.
C0 (mg/kg) = R(lb a.i./acre) × rr(mg/kg÷lb a.i./acre)
Step 2: Calculate C90, concentration in vegetation on Day 90 (t=90 days) based on dissipation coefficient (k)derived from foliar half-life (t½).
k (days-1) = ln(2) ÷ t½ (days)C90 (mg/kg) = C0 (mg/kg) × e-tk
Step 3: Use the geometric mean of C0 and C90 to get a central estimate of concentration in vegetation (mg/kg veg.)and multiply this value by the vegetation consumption (kg veg/kg bw) to calculate the daily dose (mg/kg bw) overthe exposure period.
D (mg/kg bw) = (C0 ×C90)0.5 (mg/kg veg.) × A kg veg./kg bw
Details of calculations on next page
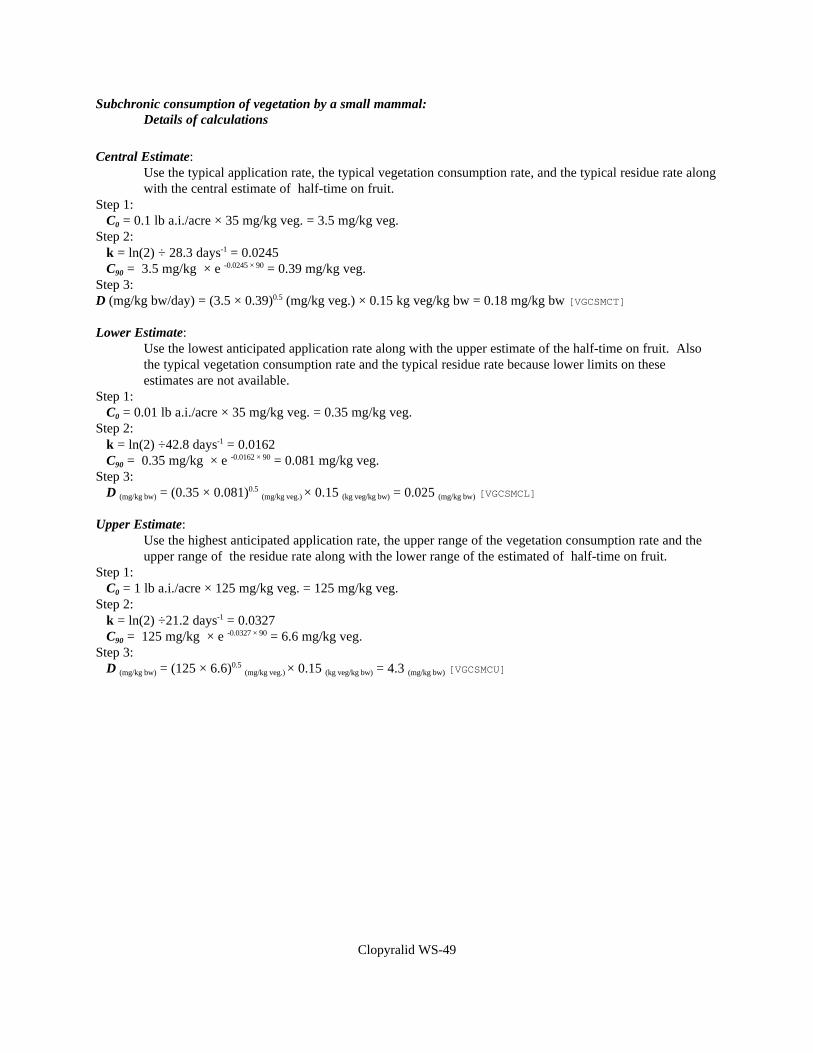
Clopyralid WS-49
Subchronic consumption of vegetation by a small mammal:Details of calculations
Central Estimate:Use the typical application rate, the typical vegetation consumption rate, and the typical residue rate alongwith the central estimate of half-time on fruit.
Step 1: C0 = 0.1 lb a.i./acre × 35 mg/kg veg. = 3.5 mg/kg veg.Step 2: k = ln(2) ÷ 28.3 days-1 = 0.0245 C90 = 3.5 mg/kg × e -0.0245 × 90 = 0.39 mg/kg veg.Step 3:D (mg/kg bw/day) = (3.5 × 0.39)0.5 (mg/kg veg.) × 0.15 kg veg/kg bw = 0.18 mg/kg bw [VGCSMCT]
Lower Estimate:Use the lowest anticipated application rate along with the upper estimate of the half-time on fruit. Alsothe typical vegetation consumption rate and the typical residue rate because lower limits on theseestimates are not available.
Step 1: C0 = 0.01 lb a.i./acre × 35 mg/kg veg. = 0.35 mg/kg veg.Step 2: k = ln(2) ÷42.8 days-1 = 0.0162 C90 = 0.35 mg/kg × e -0.0162 × 90 = 0.081 mg/kg veg.Step 3: D (mg/kg bw) = (0.35 × 0.081)0.5 (mg/kg veg.) × 0.15 (kg veg/kg bw) = 0.025 (mg/kg bw) [VGCSMCL]
Upper Estimate:Use the highest anticipated application rate, the upper range of the vegetation consumption rate and theupper range of the residue rate along with the lower range of the estimated of half-time on fruit.
Step 1: C0 = 1 lb a.i./acre × 125 mg/kg veg. = 125 mg/kg veg.Step 2: k = ln(2) ÷21.2 days-1 = 0.0327 C90 = 125 mg/kg × e -0.0327 × 90 = 6.6 mg/kg veg.Step 3: D (mg/kg bw) = (125 × 6.6)0.5 (mg/kg veg.) × 0.15 (kg veg/kg bw) = 4.3 (mg/kg bw) [VGCSMCU]
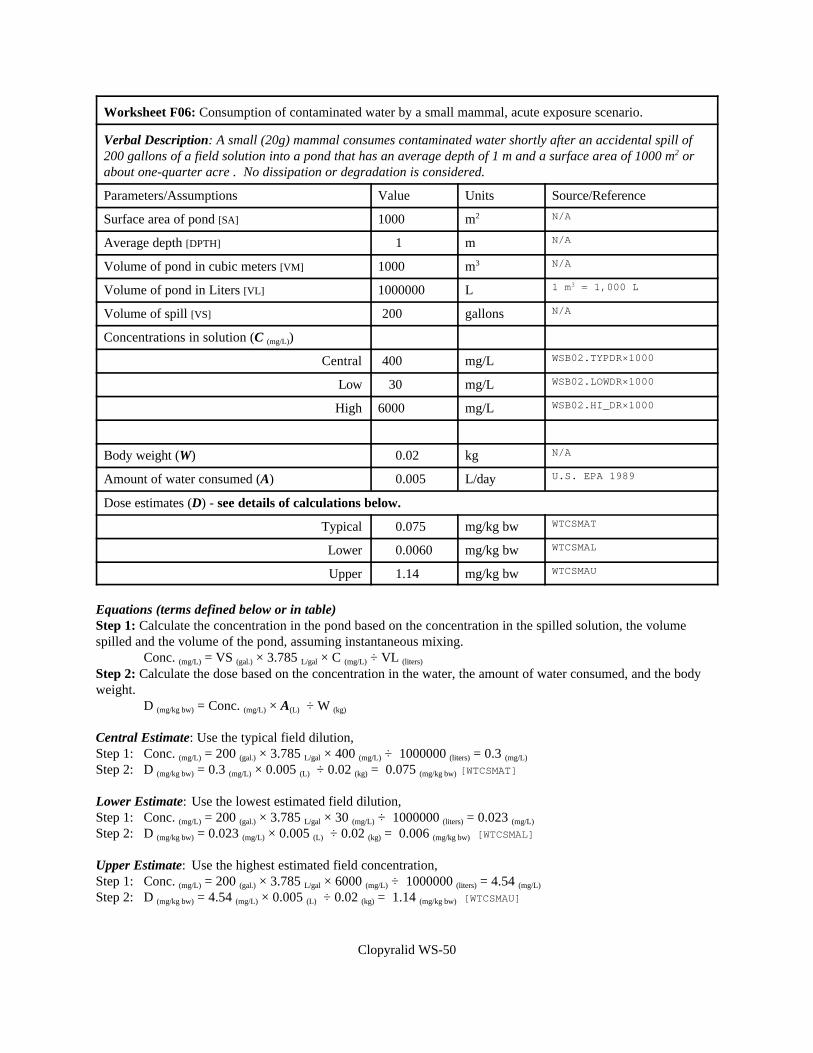
Clopyralid WS-50
Worksheet F06: Consumption of contaminated water by a small mammal, acute exposure scenario.
Verbal Description: A small (20g) mammal consumes contaminated water shortly after an accidental spill of200 gallons of a field solution into a pond that has an average depth of 1 m and a surface area of 1000 m2 orabout one-quarter acre . No dissipation or degradation is considered.
Parameters/Assumptions Value Units Source/Reference
Surface area of pond [SA] 1000 m2 N/A
Average depth [DPTH] 1 m N/A
Volume of pond in cubic meters [VM] 1000 m3 N/A
Volume of pond in Liters [VL] 1000000 L 1 m3 = 1,000 L
Volume of spill [VS] 200 gallons N/A
Concentrations in solution (C (mg/L))
Central 400 mg/L WSB02.TYPDR×1000
Low 30 mg/L WSB02.LOWDR×1000
High 6000 mg/L WSB02.HI_DR×1000
Body weight (W) 0.02 kg N/A
Amount of water consumed (A) 0.005 L/day U.S. EPA 1989
Dose estimates (D) - see details of calculations below.
Typical 0.075 mg/kg bw WTCSMAT
Lower 0.0060 mg/kg bw WTCSMAL
Upper 1.14 mg/kg bw WTCSMAU
Equations (terms defined below or in table)Step 1: Calculate the concentration in the pond based on the concentration in the spilled solution, the volumespilled and the volume of the pond, assuming instantaneous mixing.
Conc. (mg/L) = VS (gal.) × 3.785 L/gal × C (mg/L) ÷ VL (liters)
Step 2: Calculate the dose based on the concentration in the water, the amount of water consumed, and the bodyweight.
D (mg/kg bw) = Conc. (mg/L) × A(L) ÷ W (kg)
Central Estimate: Use the typical field dilution,Step 1: Conc. (mg/L) = 200 (gal.) × 3.785 L/gal × 400 (mg/L) ÷ 1000000 (liters) = 0.3 (mg/L)
Step 2: D (mg/kg bw) = 0.3 (mg/L) × 0.005 (L) ÷ 0.02 (kg) = 0.075 (mg/kg bw) [WTCSMAT]
Lower Estimate: Use the lowest estimated field dilution,Step 1: Conc. (mg/L) = 200 (gal.) × 3.785 L/gal × 30 (mg/L) ÷ 1000000 (liters) = 0.023 (mg/L)
Step 2: D (mg/kg bw) = 0.023 (mg/L) × 0.005 (L) ÷ 0.02 (kg) = 0.006 (mg/kg bw) [WTCSMAL]
Upper Estimate: Use the highest estimated field concentration,Step 1: Conc. (mg/L) = 200 (gal.) × 3.785 L/gal × 6000 (mg/L) ÷ 1000000 (liters) = 4.54 (mg/L)
Step 2: D (mg/kg bw) = 4.54 (mg/L) × 0.005 (L) ÷ 0.02 (kg) = 1.14 (mg/kg bw) [WTCSMAU]
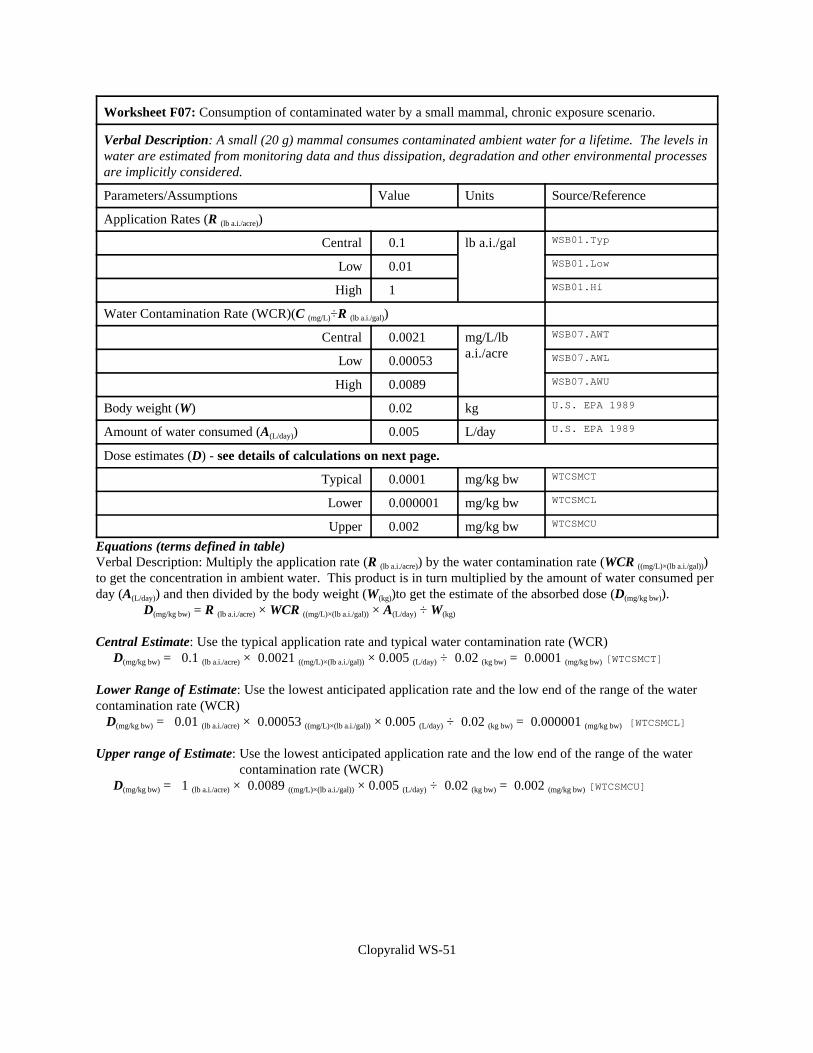
Clopyralid WS-51
Worksheet F07: Consumption of contaminated water by a small mammal, chronic exposure scenario.
Verbal Description: A small (20 g) mammal consumes contaminated ambient water for a lifetime. The levels inwater are estimated from monitoring data and thus dissipation, degradation and other environmental processesare implicitly considered.
Parameters/Assumptions Value Units Source/Reference
Application Rates (R (lb a.i./acre))
Central 0.1 lb a.i./gal WSB01.Typ
Low 0.01 WSB01.Low
High 1 WSB01.Hi
Water Contamination Rate (WCR)(C (mg/L)÷R (lb a.i./gal))
Central 0.0021 mg/L/lba.i./acre
WSB07.AWT
Low 0.00053 WSB07.AWL
High 0.0089 WSB07.AWU
Body weight (W) 0.02 kg U.S. EPA 1989
Amount of water consumed (A(L/day)) 0.005 L/day U.S. EPA 1989
Dose estimates (D) - see details of calculations on next page.
Typical 0.0001 mg/kg bw WTCSMCT
Lower 0.000001 mg/kg bw WTCSMCL
Upper 0.002 mg/kg bw WTCSMCU
Equations (terms defined in table)Verbal Description: Multiply the application rate (R (lb a.i./acre)) by the water contamination rate (WCR ((mg/L)×(lb a.i./gal)))to get the concentration in ambient water. This product is in turn multiplied by the amount of water consumed perday (A(L/day)) and then divided by the body weight (W(kg))to get the estimate of the absorbed dose (D(mg/kg bw)).
D(mg/kg bw) = R (lb a.i./acre) × WCR ((mg/L)×(lb a.i./gal)) × A(L/day) ÷ W(kg)
Central Estimate: Use the typical application rate and typical water contamination rate (WCR) D(mg/kg bw) = 0.1 (lb a.i./acre) × 0.0021 ((mg/L)×(lb a.i./gal)) × 0.005 (L/day) ÷ 0.02 (kg bw) = 0.0001 (mg/kg bw) [WTCSMCT]
Lower Range of Estimate: Use the lowest anticipated application rate and the low end of the range of the watercontamination rate (WCR) D(mg/kg bw) = 0.01 (lb a.i./acre) × 0.00053 ((mg/L)×(lb a.i./gal)) × 0.005 (L/day) ÷ 0.02 (kg bw) = 0.000001 (mg/kg bw) [WTCSMCL]
Upper range of Estimate: Use the lowest anticipated application rate and the low end of the range of the watercontamination rate (WCR)
D(mg/kg bw) = 1 (lb a.i./acre) × 0.0089 ((mg/L)×(lb a.i./gal)) × 0.005 (L/day) ÷ 0.02 (kg bw) = 0.002 (mg/kg bw) [WTCSMCU]
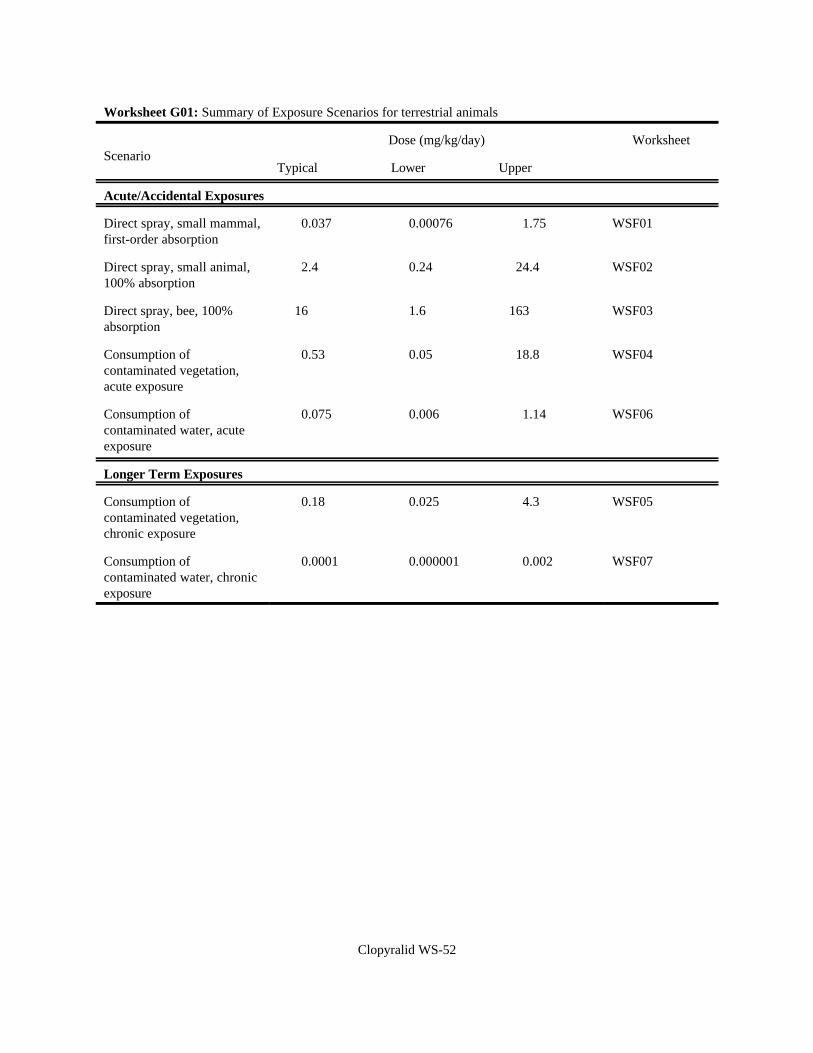
Clopyralid WS-52
Worksheet G01: Summary of Exposure Scenarios for terrestrial animals
ScenarioDose (mg/kg/day) Worksheet
Typical Lower Upper
Acute/Accidental Exposures
Direct spray, small mammal,first-order absorption
0.037 0.00076 1.75 WSF01
Direct spray, small animal,100% absorption
2.4 0.24 24.4 WSF02
Direct spray, bee, 100%absorption
16 1.6 163 WSF03
Consumption ofcontaminated vegetation,acute exposure
0.53 0.05 18.8 WSF04
Consumption ofcontaminated water, acuteexposure
0.075 0.006 1.14 WSF06
Longer Term Exposures
Consumption ofcontaminated vegetation,chronic exposure
0.18 0.025 4.3 WSF05
Consumption ofcontaminated water, chronicexposure
0.0001 0.000001 0.002 WSF07
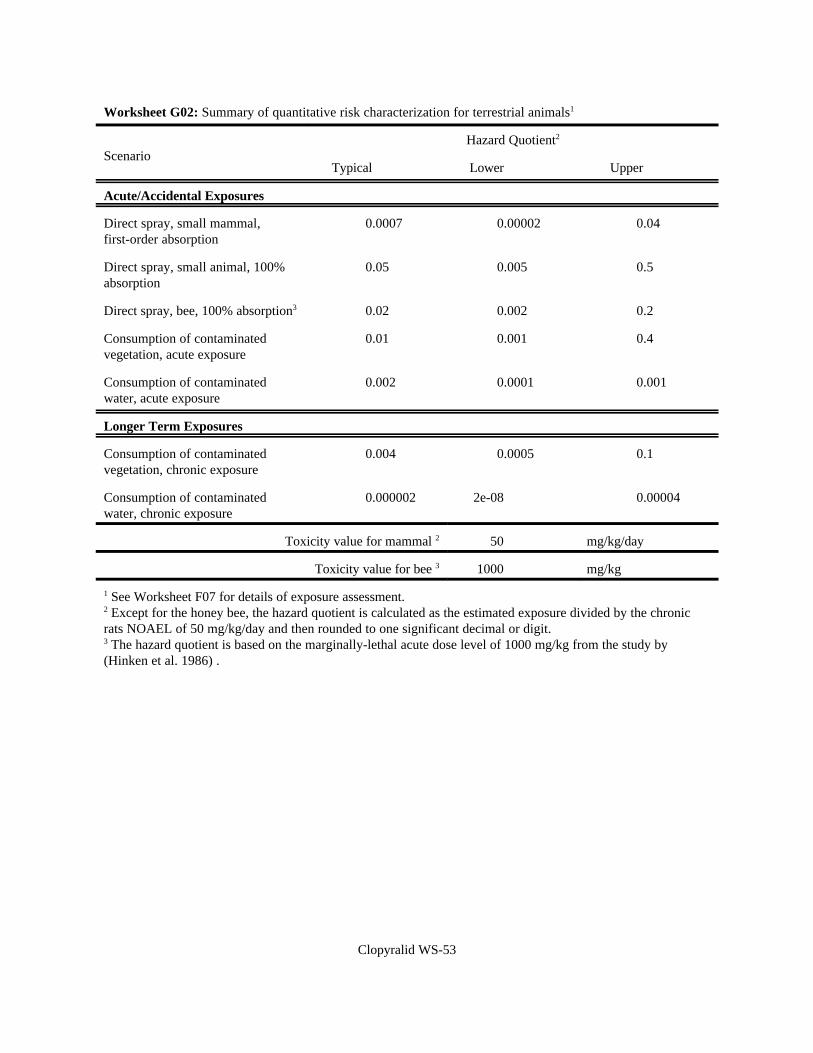
Clopyralid WS-53
Worksheet G02: Summary of quantitative risk characterization for terrestrial animals1
ScenarioHazard Quotient2
Typical Lower Upper
Acute/Accidental Exposures
Direct spray, small mammal,first-order absorption
0.0007 0.00002 0.04
Direct spray, small animal, 100%absorption
0.05 0.005 0.5
Direct spray, bee, 100% absorption3 0.02 0.002 0.2
Consumption of contaminatedvegetation, acute exposure
0.01 0.001 0.4
Consumption of contaminatedwater, acute exposure
0.002 0.0001 0.001
Longer Term Exposures
Consumption of contaminatedvegetation, chronic exposure
0.004 0.0005 0.1
Consumption of contaminatedwater, chronic exposure
0.000002 2e-08 0.00004
Toxicity value for mammal 2 50 mg/kg/day
Toxicity value for bee 3 1000 mg/kg
1 See Worksheet F07 for details of exposure assessment.2 Except for the honey bee, the hazard quotient is calculated as the estimated exposure divided by the chronicrats NOAEL of 50 mg/kg/day and then rounded to one significant decimal or digit.3 The hazard quotient is based on the marginally-lethal acute dose level of 1000 mg/kg from the study by(Hinken et al. 1986) .

WORKSHEETS FOR WORKSHEETS FOR HexachlorobenzeneHexachlorobenzene
in Clopyralidin Clopyralid
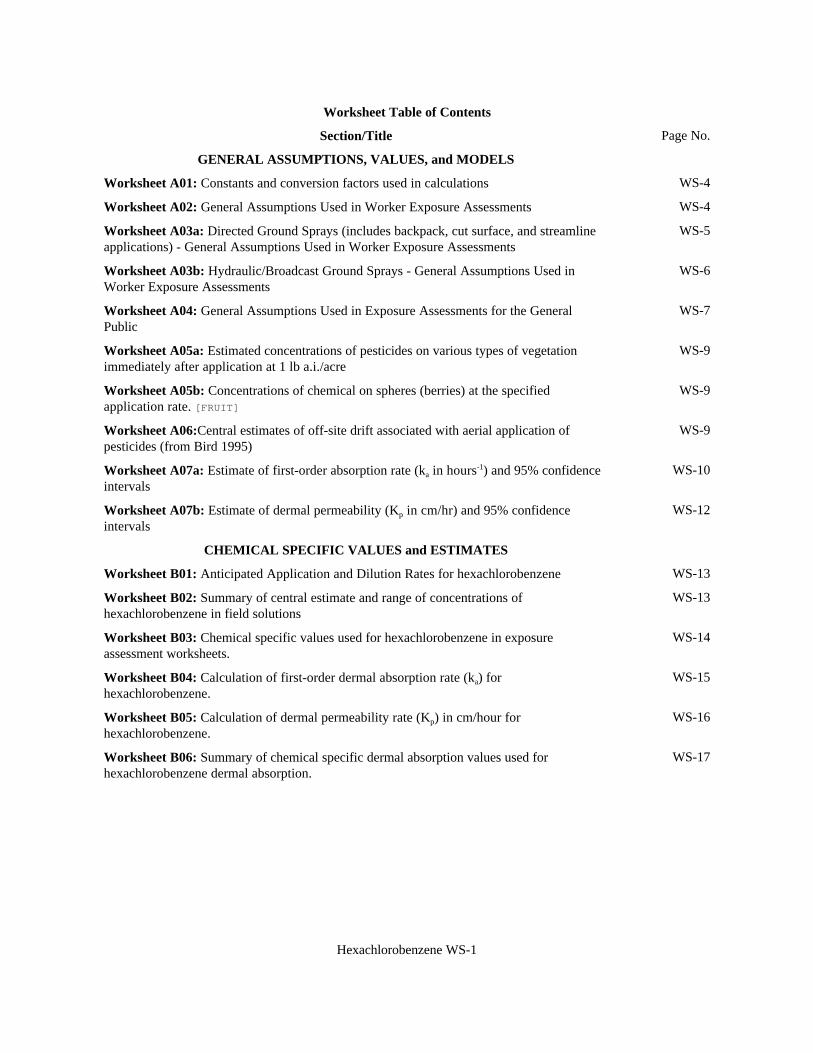
Hexachlorobenzene WS-1
Worksheet Table of Contents
Section/Title Page No.
GENERAL ASSUMPTIONS, VALUES, and MODELS
Worksheet A01: Constants and conversion factors used in calculations WS-4
Worksheet A02: General Assumptions Used in Worker Exposure Assessments WS-4
Worksheet A03a: Directed Ground Sprays (includes backpack, cut surface, and streamlineapplications) - General Assumptions Used in Worker Exposure Assessments
WS-5
Worksheet A03b: Hydraulic/Broadcast Ground Sprays - General Assumptions Used inWorker Exposure Assessments
WS-6
Worksheet A04: General Assumptions Used in Exposure Assessments for the GeneralPublic
WS-7
Worksheet A05a: Estimated concentrations of pesticides on various types of vegetationimmediately after application at 1 lb a.i./acre
WS-9
Worksheet A05b: Concentrations of chemical on spheres (berries) at the specifiedapplication rate. [FRUIT]
WS-9
Worksheet A06:Central estimates of off-site drift associated with aerial application ofpesticides (from Bird 1995)
WS-9
Worksheet A07a: Estimate of first-order absorption rate (ka in hours-1) and 95% confidenceintervals
WS-10
Worksheet A07b: Estimate of dermal permeability (Kp in cm/hr) and 95% confidenceintervals
WS-12
CHEMICAL SPECIFIC VALUES and ESTIMATES
Worksheet B01: Anticipated Application and Dilution Rates for hexachlorobenzene WS-13
Worksheet B02: Summary of central estimate and range of concentrations ofhexachlorobenzene in field solutions
WS-13
Worksheet B03: Chemical specific values used for hexachlorobenzene in exposureassessment worksheets.
WS-14
Worksheet B04: Calculation of first-order dermal absorption rate (ka) forhexachlorobenzene.
WS-15
Worksheet B05: Calculation of dermal permeability rate (Kp) in cm/hour forhexachlorobenzene.
WS-16
Worksheet B06: Summary of chemical specific dermal absorption values used forhexachlorobenzene dermal absorption.
WS-17
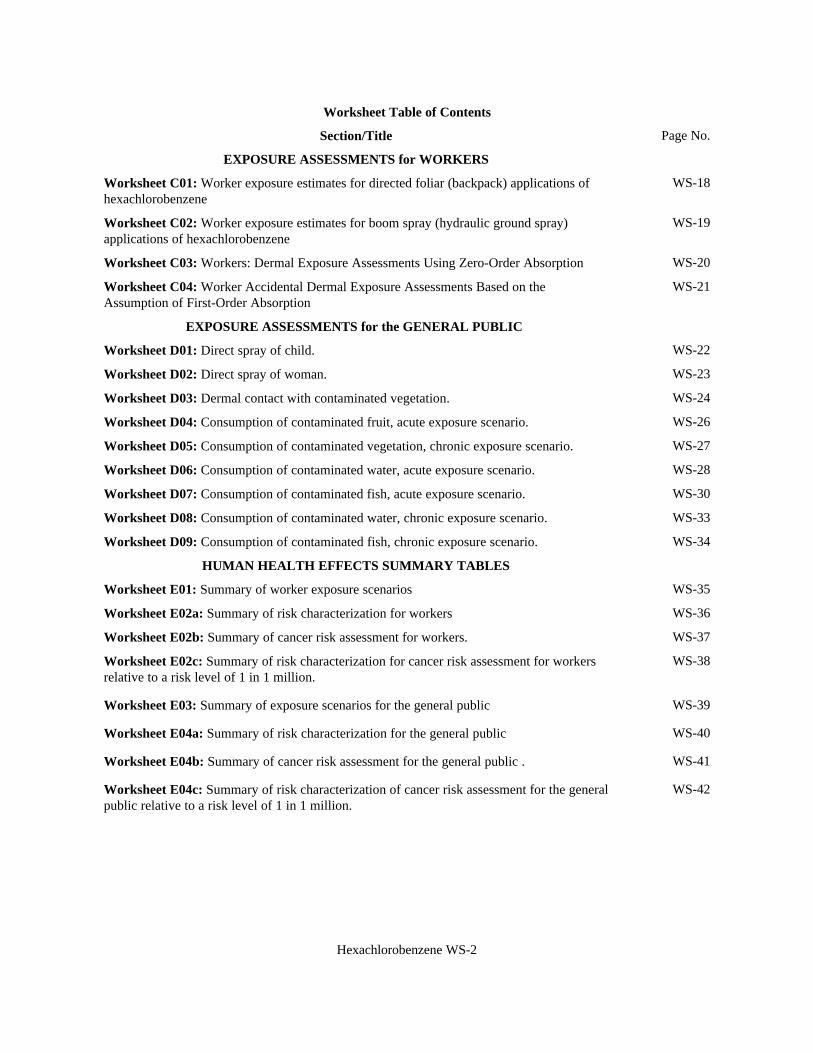
Worksheet Table of Contents
Section/Title Page No.
Hexachlorobenzene WS-2
EXPOSURE ASSESSMENTS for WORKERS
Worksheet C01: Worker exposure estimates for directed foliar (backpack) applications ofhexachlorobenzene
WS-18
Worksheet C02: Worker exposure estimates for boom spray (hydraulic ground spray)applications of hexachlorobenzene
WS-19
Worksheet C03: Workers: Dermal Exposure Assessments Using Zero-Order Absorption WS-20
Worksheet C04: Worker Accidental Dermal Exposure Assessments Based on theAssumption of First-Order Absorption
WS-21
EXPOSURE ASSESSMENTS for the GENERAL PUBLIC
Worksheet D01: Direct spray of child. WS-22
Worksheet D02: Direct spray of woman. WS-23
Worksheet D03: Dermal contact with contaminated vegetation. WS-24
Worksheet D04: Consumption of contaminated fruit, acute exposure scenario. WS-26
Worksheet D05: Consumption of contaminated vegetation, chronic exposure scenario. WS-27
Worksheet D06: Consumption of contaminated water, acute exposure scenario. WS-28
Worksheet D07: Consumption of contaminated fish, acute exposure scenario. WS-30
Worksheet D08: Consumption of contaminated water, chronic exposure scenario. WS-33
Worksheet D09: Consumption of contaminated fish, chronic exposure scenario. WS-34
HUMAN HEALTH EFFECTS SUMMARY TABLES
Worksheet E01: Summary of worker exposure scenarios WS-35
Worksheet E02a: Summary of risk characterization for workers WS-36
Worksheet E02b: Summary of cancer risk assessment for workers. WS-37
Worksheet E02c: Summary of risk characterization for cancer risk assessment for workersrelative to a risk level of 1 in 1 million.
WS-38
Worksheet E03: Summary of exposure scenarios for the general public WS-39
Worksheet E04a: Summary of risk characterization for the general public WS-40
Worksheet E04b: Summary of cancer risk assessment for the general public . WS-41
Worksheet E04c: Summary of risk characterization of cancer risk assessment for the generalpublic relative to a risk level of 1 in 1 million.
WS-42

Hexachlorobenzene WS-3
GENERAL ASSUMPTIONS, VALUES, and MODELS
Worksheet A01: Constants and conversion factors used incalculations [CONST]
Conversion ID Value
mg/lb mg_lb 453,600
mL/gallon ml_gal 3,785
lb/gallon to mg/mL lbg_mgml 119.8
lb/acre to µg/cm2 lbac_ugcm 11.21
lb/acre to mg/cm2 lbac_mgcm 0.01121
gallons to liters gal_lit 3.785
Worksheet A02: General Assumptions Used in Worker Exposure Assessments [STD]
Parameter ID Value Units Reference
Body Weight(General)
BW 70 kg ICRP (1975), p. 13
Surface area ofhands
Hands 840 cm2 U.S. EPA 1992
Surface area of lowerlegs
LLegs 2070 cm2 U.S. EPA 1992
Weight of liquidadhering to surfaceof skin after a spill
Liq 0.008 mg/cm2 Mason and Johnson 1987
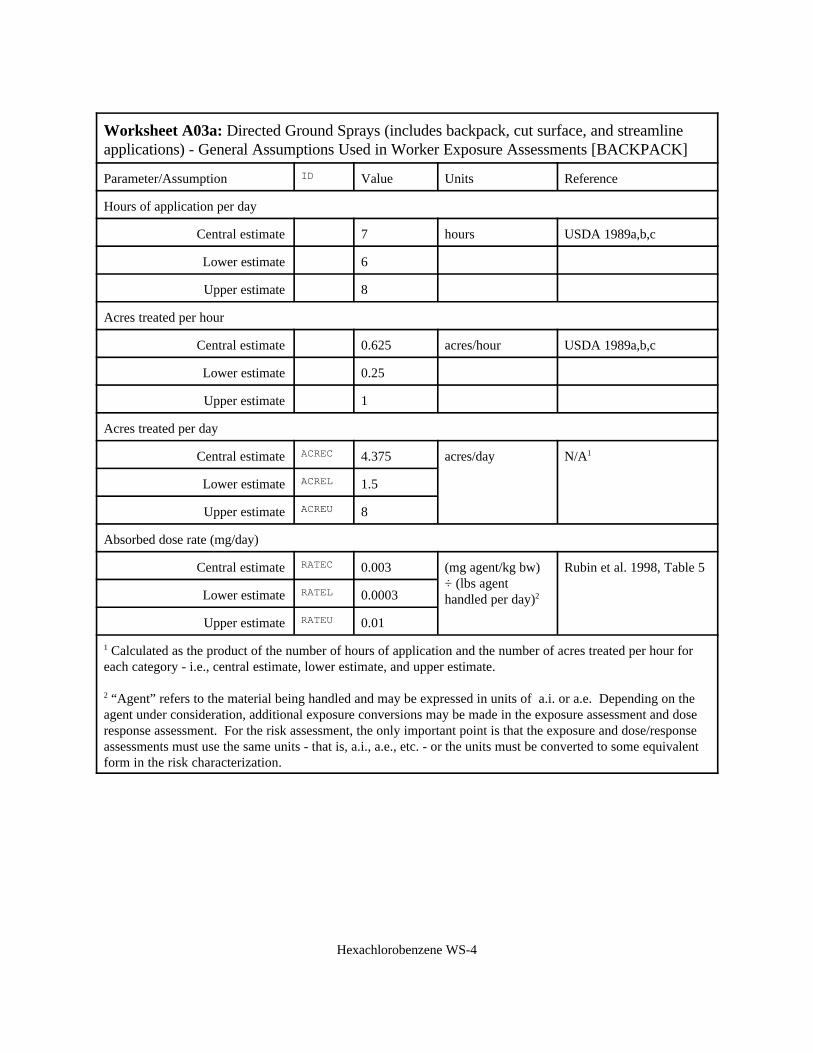
Hexachlorobenzene WS-4
Worksheet A03a: Directed Ground Sprays (includes backpack, cut surface, and streamlineapplications) - General Assumptions Used in Worker Exposure Assessments [BACKPACK]
Parameter/Assumption ID Value Units Reference
Hours of application per day
Central estimate 7 hours USDA 1989a,b,c
Lower estimate 6
Upper estimate 8
Acres treated per hour
Central estimate 0.625 acres/hour USDA 1989a,b,c
Lower estimate 0.25
Upper estimate 1
Acres treated per day
Central estimate ACREC 4.375 acres/day N/A1
Lower estimate ACREL 1.5
Upper estimate ACREU 8
Absorbed dose rate (mg/day)
Central estimate RATEC 0.003 (mg agent/kg bw)÷ (lbs agenthandled per day)2
Rubin et al. 1998, Table 5
Lower estimate RATEL 0.0003
Upper estimate RATEU 0.01
1 Calculated as the product of the number of hours of application and the number of acres treated per hour foreach category - i.e., central estimate, lower estimate, and upper estimate.
2 “Agent” refers to the material being handled and may be expressed in units of a.i. or a.e. Depending on theagent under consideration, additional exposure conversions may be made in the exposure assessment and doseresponse assessment. For the risk assessment, the only important point is that the exposure and dose/responseassessments must use the same units - that is, a.i., a.e., etc. - or the units must be converted to some equivalentform in the risk characterization.
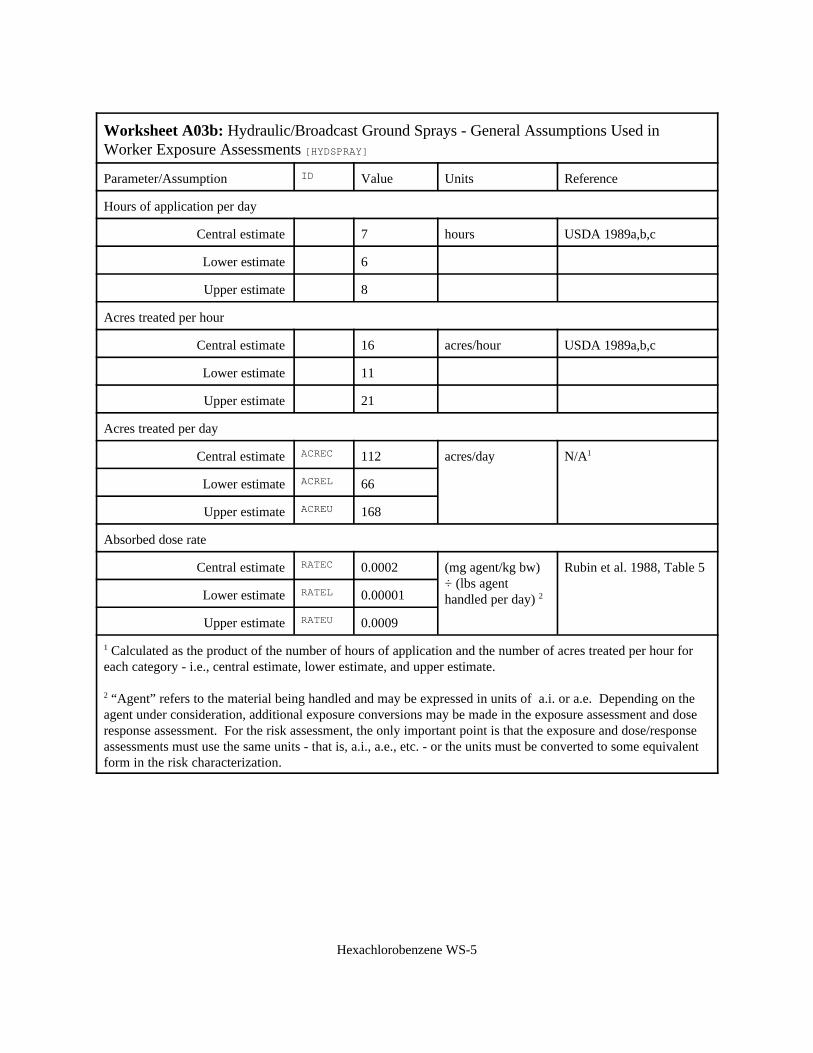
Hexachlorobenzene WS-5
Worksheet A03b: Hydraulic/Broadcast Ground Sprays - General Assumptions Used inWorker Exposure Assessments [HYDSPRAY]
Parameter/Assumption ID Value Units Reference
Hours of application per day
Central estimate 7 hours USDA 1989a,b,c
Lower estimate 6
Upper estimate 8
Acres treated per hour
Central estimate 16 acres/hour USDA 1989a,b,c
Lower estimate 11
Upper estimate 21
Acres treated per day
Central estimate ACREC 112 acres/day N/A1
Lower estimate ACREL 66
Upper estimate ACREU 168
Absorbed dose rate
Central estimate RATEC 0.0002 (mg agent/kg bw)÷ (lbs agenthandled per day) 2
Rubin et al. 1988, Table 5
Lower estimate RATEL 0.00001
Upper estimate RATEU 0.0009
1 Calculated as the product of the number of hours of application and the number of acres treated per hour foreach category - i.e., central estimate, lower estimate, and upper estimate.
2 “Agent” refers to the material being handled and may be expressed in units of a.i. or a.e. Depending on theagent under consideration, additional exposure conversions may be made in the exposure assessment and doseresponse assessment. For the risk assessment, the only important point is that the exposure and dose/responseassessments must use the same units - that is, a.i., a.e., etc. - or the units must be converted to some equivalentform in the risk characterization.

Hexachlorobenzene WS-6
Worksheet A04: General Assumptions Used in Exposure Assessments for the General Public[PUBL]
Narrative: This table contains various values used in the exposure assessments for the general public. Threegeneral groups of individuals are considered: adult male, adult female, and a 2 year old child. Values arespecified for body weight, surface areas for various parts of the body, water intake, fish consumption, and theconsumption of fruits or vegetables. NOTE: Not all types of value are specified for each group. The only valuesspecified are those used in the risk assessment.
Description ID Value Units Reference
Body Weights
Male, Adult BWM 70 kg ICRP (1975), p. 13.
Female, Adult BWF 64 kg Burnmaster 1998; U.S. EPA 19851
Child, 2-3 years old BWC 13.3 kg U.S. EPA, 1996, page 7-1, Table 7-2
Body Surface Areas
Female, feet and lower legs SAF1 2915 cm2 U.S. EPA, 1992a, p. 8-11, Table 8-3, total for feet and lower legs
Female, exposed skin whenwearing shorts and a T-shirt
SAF2 5300 cm2 U.S. EPA, 1992a, p. 8-11, Table 8-3, total for arms, hands, lower legs,and feet.
Child, male, 2-3 years old, totalbody surface area
SAC 6030 cm2 U.S. EPA, 1996, p. 6-15, Table 6-6, 50th percentile.
Water Intake
Adult
typical WCAT 2 L/day U.S. EPA, 1996, p. 3-28, Table 3-30, midpoint of mean (1.4 L/day)and 90th percentile (2.4 L/day)rounded to one significant place.
lower range for exposureassessment
WCAL 1.4 L/day U.S. EPA, 1996, p. 3-28, Table 3-30, mean
upper range WCAH 2.4 L/day U.S. EPA, 1996, p. 3-28, Table 3-30, 90th percentile
Child, <3 years old
typical WCT 1 L/day U.S. EPA, 1996, p. 3-28, Table 3-30, midpoint of mean (0.61L/day)and 90th percentile (1.5 L/day)rounded to one significant place.
lower range for exposureassessment
WCL 0.61 L/day U.S. EPA, 1996, p. 3-28, Table 3-30, mean
upper range WCH 1.50 L/day U.S. EPA, 1996, p. 3-28, Table 3-30, 90th percentile

Worksheet A04: General Assumptions Used in Exposure Assessments for the General Public[PUBL]
Narrative: This table contains various values used in the exposure assessments for the general public. Threegeneral groups of individuals are considered: adult male, adult female, and a 2 year old child. Values arespecified for body weight, surface areas for various parts of the body, water intake, fish consumption, and theconsumption of fruits or vegetables. NOTE: Not all types of value are specified for each group. The only valuesspecified are those used in the risk assessment.
Description ID Value Units Reference
Hexachlorobenzene WS-7
Fish Consumption
Freshwater anglers, typical intakeper day over a prolonged period
FAT 0.010 kg/day U.S. EPA, 1996, p. 10-51, averageof means from four studies
Freshwater anglers, maximumconsumption for a single day
FAU 0.158 kg/day Ruffle et al. 1994
Native American subsistencepopulations, typical intake per day
FNT 0.081 kg/day U.S. EPA, 1996, p. 10-51, medianvalue of 94 individuals
Native American subsistencepopulations, maximum for a singleday
FNU 0.770 kg/day U.S. EPA, 1996, p. 10-51, highestvalue of 94 individuals
Consumption of Fruits or Vegetables
Amount of food consumed per kg bw per day for longer term exposures scenarios.
Typical VT 0.0043 kg food/kgbw/day
U.S. EPA, 1996, Table 9-21, p. 9-39, mean intake of vegetables
Upper VU 0.01 kg food/kgbw/day
U.S. EPA, 1996, Table 9-21, p. 9-39, 95th percentile for intake ofvegetables
Worst-case scenario forconsumption in a single day, acuteexposure scenario only.
VAcute 0.454 kg food 1 lb. The approximate mid rangeof the above typical and upperlimits based on the 64 kg bodyweight.
Miscellaneous
Estimate of dislodgeable residue asa proportion of application rateshortly after application.
DisL 0.1 none Harris and Solomon 1992, data on2,4-D
1This is the average value (63.79 kg), rounded to the nearest kg for 3 different groups of women between 15-49years old: control (62.07 kg), pregnant (65.90 kg), and lactating (63.48 kg). See Burnmaster 1998, p.218, TableIII., Risk Analysis. 18(2): 215-219. This is identical to the body weight for females, 45-55 years old, 50th
percentile from U.S. EPA, 1985, page 5, Table 2-2, rounded to nearest kilogram.
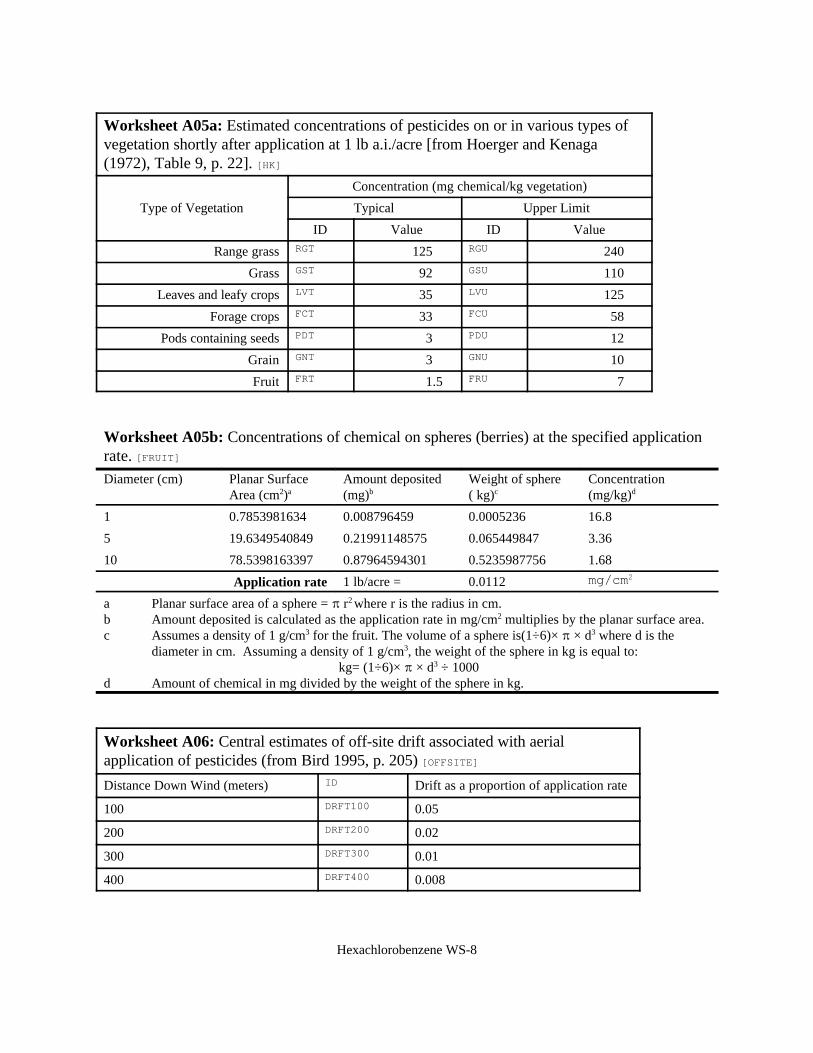
Hexachlorobenzene WS-8
Worksheet A05a: Estimated concentrations of pesticides on or in various types ofvegetation shortly after application at 1 lb a.i./acre [from Hoerger and Kenaga(1972), Table 9, p. 22]. [HK]
Type of Vegetation
Concentration (mg chemical/kg vegetation)
Typical Upper Limit
ID Value ID Value
Range grass RGT 125 RGU 240
Grass GST 92 GSU 110
Leaves and leafy crops LVT 35 LVU 125
Forage crops FCT 33 FCU 58
Pods containing seeds PDT 3 PDU 12
Grain GNT 3 GNU 10
Fruit FRT 1.5 FRU 7
Worksheet A05b: Concentrations of chemical on spheres (berries) at the specified applicationrate. [FRUIT]
Diameter (cm) Planar SurfaceArea (cm2)a
Amount deposited(mg)b
Weight of sphere( kg)c
Concentration(mg/kg)d
1 0.7853981634 0.008796459 0.0005236 16.8
5 19.6349540849 0.21991148575 0.065449847 3.36
10 78.5398163397 0.87964594301 0.5235987756 1.68
Application rate 1 lb/acre = 0.0112 mg/cm2
a Planar surface area of a sphere = B r2 where r is the radius in cm.b Amount deposited is calculated as the application rate in mg/cm2 multiplies by the planar surface area.c Assumes a density of 1 g/cm3 for the fruit. The volume of a sphere is(1÷6)× B × d3 where d is the
diameter in cm. Assuming a density of 1 g/cm3, the weight of the sphere in kg is equal to: kg= (1÷6)× B × d3 ÷ 1000
d Amount of chemical in mg divided by the weight of the sphere in kg.
Worksheet A06: Central estimates of off-site drift associated with aerialapplication of pesticides (from Bird 1995, p. 205) [OFFSITE]
Distance Down Wind (meters) ID Drift as a proportion of application rate
100 DRFT100 0.05
200 DRFT200 0.02
300 DRFT300 0.01
400 DRFT400 0.008
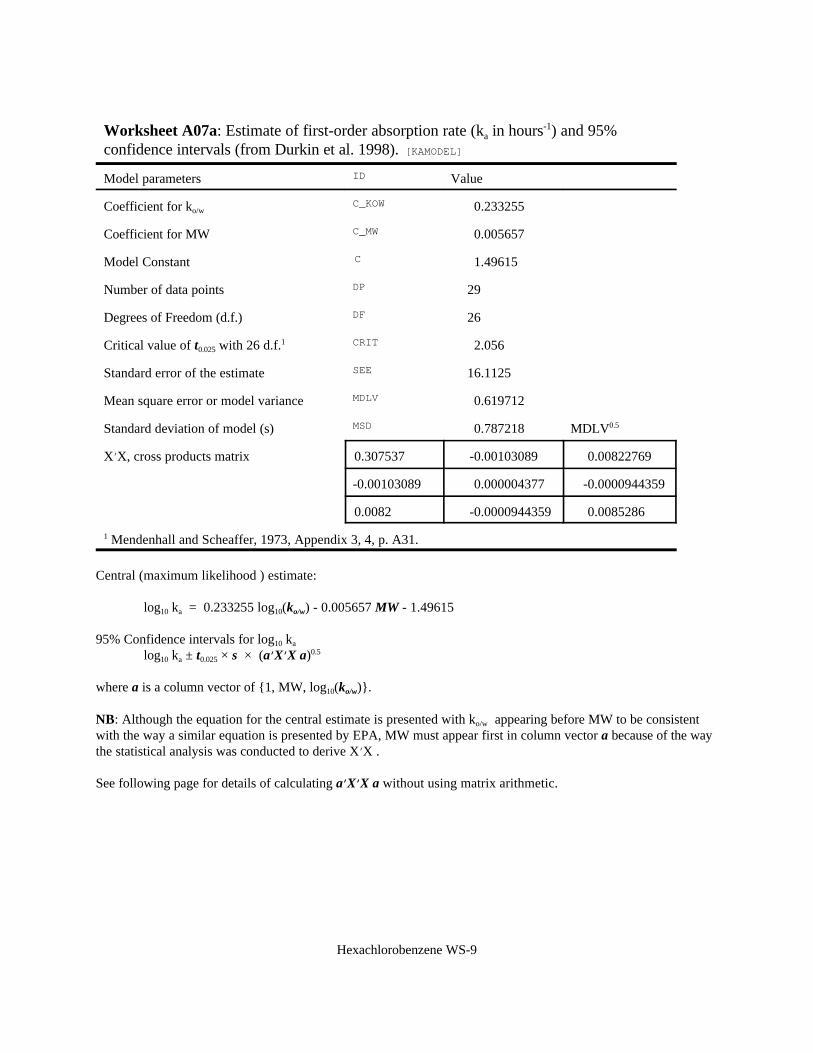
Hexachlorobenzene WS-9
Worksheet A07a: Estimate of first-order absorption rate (ka in hours-1) and 95%confidence intervals (from Durkin et al. 1998). [KAMODEL]
Model parameters ID Value
Coefficient for ko/wC_KOW 0.233255
Coefficient for MW C_MW 0.005657
Model Constant C 1.49615
Number of data points DP 29
Degrees of Freedom (d.f.) DF 26
Critical value of t0.025 with 26 d.f.1 CRIT 2.056
Standard error of the estimate SEE 16.1125
Mean square error or model variance MDLV 0.619712
Standard deviation of model (s) MSD 0.787218 MDLV0.5
XNX, cross products matrix 0.307537 -0.00103089 0.00822769
-0.00103089 0.000004377 -0.0000944359
0.0082 -0.0000944359 0.0085286
1 Mendenhall and Scheaffer, 1973, Appendix 3, 4, p. A31.
Central (maximum likelihood ) estimate:
log10 ka = 0.233255 log10(ko/w) - 0.005657 MW - 1.49615
95% Confidence intervals for log10 ka
log10 ka ± t0.025 × s × (aNNXNNX a)0.5
where a is a column vector of {1, MW, log10(ko/w)}.
NB: Although the equation for the central estimate is presented with ko/w appearing before MW to be consistentwith the way a similar equation is presented by EPA, MW must appear first in column vector a because of the waythe statistical analysis was conducted to derive XNX .
See following page for details of calculating aNNXNNX a without using matrix arithmetic.
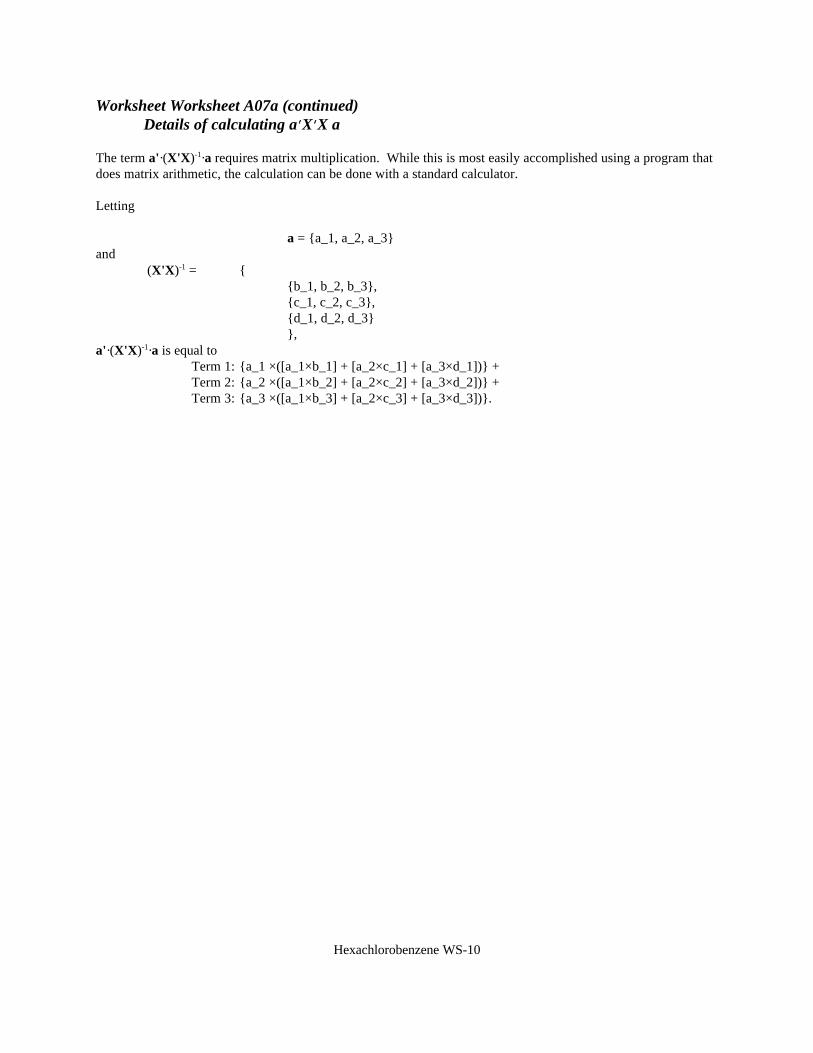
Hexachlorobenzene WS-10
Worksheet Worksheet A07a (continued)Details of calculating aNNXNNX a
The term a'·(X'X)-1·a requires matrix multiplication. While this is most easily accomplished using a program thatdoes matrix arithmetic, the calculation can be done with a standard calculator.
Letting
a = {a_1, a_2, a_3} and
(X'X)-1 = {{b_1, b_2, b_3},{c_1, c_2, c_3},{d_1, d_2, d_3}},
a'·(X'X)-1·a is equal toTerm 1: {a_1 ×([a_1×b_1] + [a_2×c_1] + [a_3×d_1])} + Term 2: {a_2 ×([a_1×b_2] + [a_2×c_2] + [a_3×d_2])} +Term 3: {a_3 ×([a_1×b_3] + [a_2×c_3] + [a_3×d_3])}.
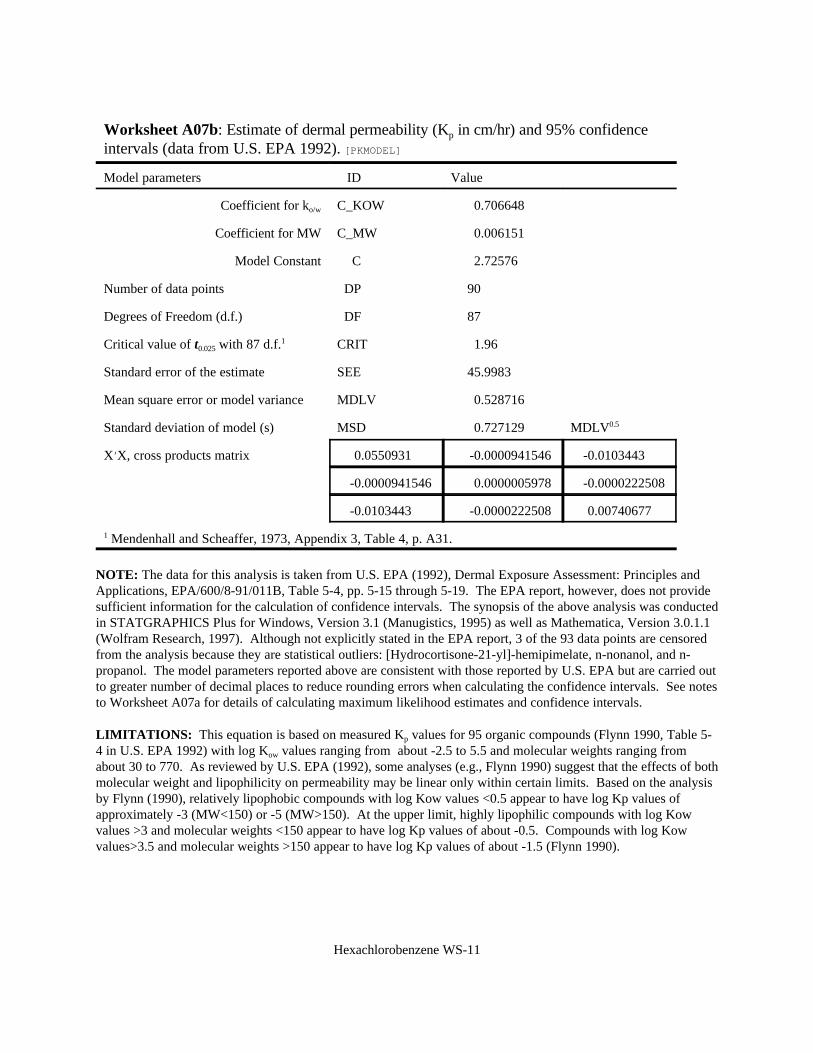
Hexachlorobenzene WS-11
Worksheet A07b: Estimate of dermal permeability (Kp in cm/hr) and 95% confidenceintervals (data from U.S. EPA 1992). [PKMODEL]
Model parameters ID Value
Coefficient for ko/w C_KOW 0.706648
Coefficient for MW C_MW 0.006151
Model Constant C 2.72576
Number of data points DP 90
Degrees of Freedom (d.f.) DF 87
Critical value of t0.025 with 87 d.f.1 CRIT 1.96
Standard error of the estimate SEE 45.9983
Mean square error or model variance MDLV 0.528716
Standard deviation of model (s) MSD 0.727129 MDLV0.5
XNX, cross products matrix 0.0550931 -0.0000941546 -0.0103443
-0.0000941546 0.0000005978 -0.0000222508
-0.0103443 -0.0000222508 0.00740677
1 Mendenhall and Scheaffer, 1973, Appendix 3, Table 4, p. A31.
NOTE: The data for this analysis is taken from U.S. EPA (1992), Dermal Exposure Assessment: Principles andApplications, EPA/600/8-91/011B, Table 5-4, pp. 5-15 through 5-19. The EPA report, however, does not providesufficient information for the calculation of confidence intervals. The synopsis of the above analysis was conductedin STATGRAPHICS Plus for Windows, Version 3.1 (Manugistics, 1995) as well as Mathematica, Version 3.0.1.1(Wolfram Research, 1997). Although not explicitly stated in the EPA report, 3 of the 93 data points are censoredfrom the analysis because they are statistical outliers: [Hydrocortisone-21-yl]-hemipimelate, n-nonanol, and n-propanol. The model parameters reported above are consistent with those reported by U.S. EPA but are carried outto greater number of decimal places to reduce rounding errors when calculating the confidence intervals. See notesto Worksheet A07a for details of calculating maximum likelihood estimates and confidence intervals.
LIMITATIONS: This equation is based on measured Kp values for 95 organic compounds (Flynn 1990, Table 5-4 in U.S. EPA 1992) with log Kow values ranging from about -2.5 to 5.5 and molecular weights ranging fromabout 30 to 770. As reviewed by U.S. EPA (1992), some analyses (e.g., Flynn 1990) suggest that the effects of bothmolecular weight and lipophilicity on permeability may be linear only within certain limits. Based on the analysisby Flynn (1990), relatively lipophobic compounds with log Kow values <0.5 appear to have log Kp values ofapproximately -3 (MW<150) or -5 (MW>150). At the upper limit, highly lipophilic compounds with log Kowvalues >3 and molecular weights <150 appear to have log Kp values of about -0.5. Compounds with log Kowvalues>3.5 and molecular weights >150 appear to have log Kp values of about -1.5 (Flynn 1990).
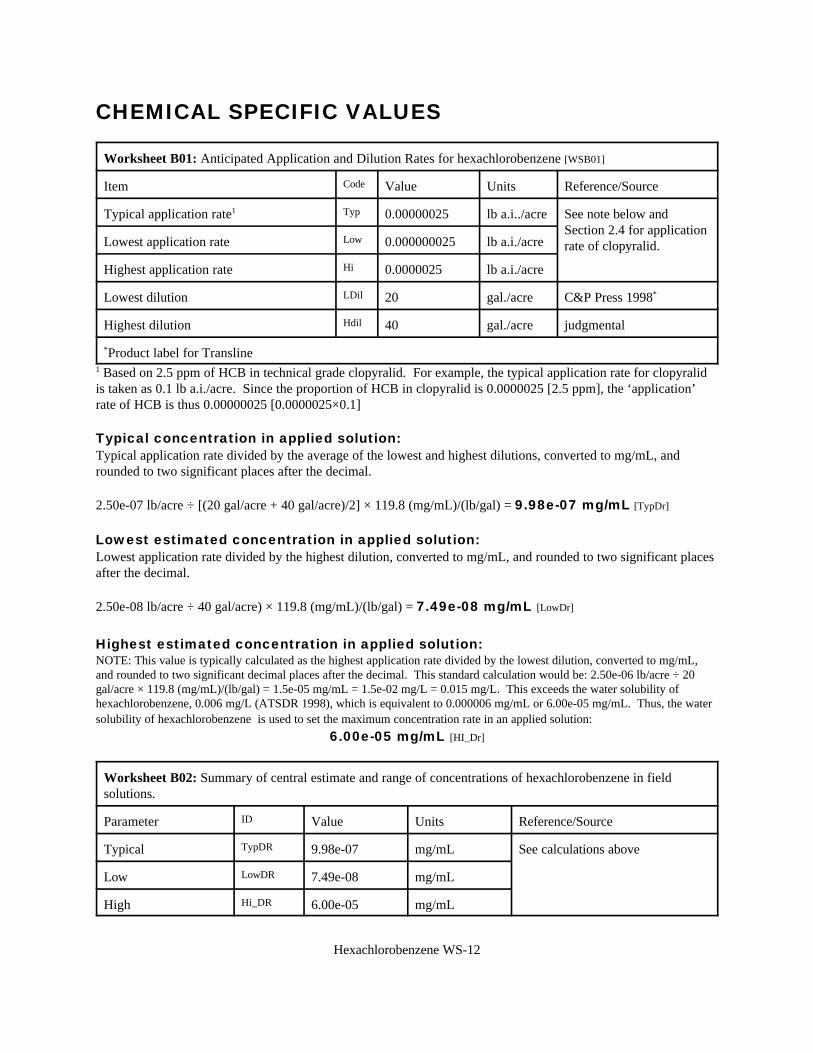
Hexachlorobenzene WS-12
CHEMICAL SPECIFIC VALUES
Worksheet B01: Anticipated Application and Dilution Rates for hexachlorobenzene [WSB01]
Item Code Value Units Reference/Source
Typical application rate1 Typ 0.00000025 lb a.i../acre See note below andSection 2.4 for applicationrate of clopyralid.Lowest application rate Low 0.000000025 lb a.i./acre
Highest application rate Hi 0.0000025 lb a.i./acre
Lowest dilution LDil 20 gal./acre C&P Press 1998*
Highest dilution Hdil 40 gal./acre judgmental
*Product label for Transline1 Based on 2.5 ppm of HCB in technical grade clopyralid. For example, the typical application rate for clopyralidis taken as 0.1 lb a.i./acre. Since the proportion of HCB in clopyralid is 0.0000025 [2.5 ppm], the ‘application’rate of HCB is thus 0.00000025 [0.0000025×0.1]
Typical concentration in applied solution:Typical application rate divided by the average of the lowest and highest dilutions, converted to mg/mL, androunded to two significant places after the decimal.
2.50e-07 lb/acre ÷ [(20 gal/acre + 40 gal/acre)/2] × 119.8 (mg/mL)/(lb/gal) = 9.98e-07 mg/mL [TypDr]
Lowest estimated concentration in applied solution:Lowest application rate divided by the highest dilution, converted to mg/mL, and rounded to two significant placesafter the decimal.
2.50e-08 lb/acre ÷ 40 gal/acre) × 119.8 (mg/mL)/(lb/gal) = 7.49e-08 mg/mL [LowDr]
Highest estimated concentration in applied solution:NOTE: This value is typically calculated as the highest application rate divided by the lowest dilution, converted to mg/mL,and rounded to two significant decimal places after the decimal. This standard calculation would be: 2.50e-06 lb/acre ÷ 20gal/acre × 119.8 (mg/mL)/(lb/gal) = 1.5e-05 mg/mL = 1.5e-02 mg/L = 0.015 mg/L. This exceeds the water solubility ofhexachlorobenzene, 0.006 mg/L (ATSDR 1998), which is equivalent to 0.000006 mg/mL or 6.00e-05 mg/mL. Thus, the watersolubility of hexachlorobenzene is used to set the maximum concentration rate in an applied solution:
6.00e-05 mg/mL [HI_Dr]
Worksheet B02: Summary of central estimate and range of concentrations of hexachlorobenzene in fieldsolutions.
Parameter ID Value Units Reference/Source
Typical TypDR 9.98e-07 mg/mL See calculations above
Low LowDR 7.49e-08 mg/mL
High Hi_DR 6.00e-05 mg/mL
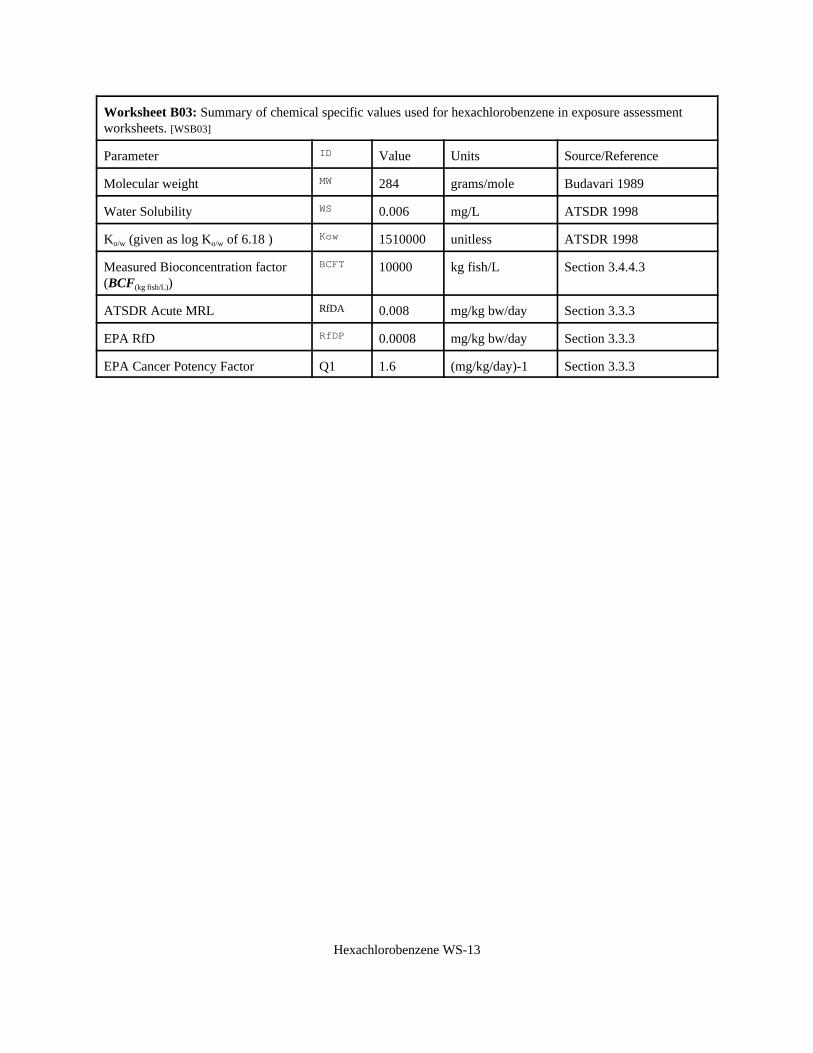
Hexachlorobenzene WS-13
Worksheet B03: Summary of chemical specific values used for hexachlorobenzene in exposure assessmentworksheets. [WSB03]
Parameter ID Value Units Source/Reference
Molecular weight MW 284 grams/mole Budavari 1989
Water Solubility WS 0.006 mg/L ATSDR 1998
Ko/w (given as log Ko/w of 6.18 ) Kow 1510000 unitless ATSDR 1998
Measured Bioconcentration factor(BCF(kg fish/L))
BCFT 10000 kg fish/L Section 3.4.4.3
ATSDR Acute MRL RfDA 0.008 mg/kg bw/day Section 3.3.3
EPA RfD RfDP 0.0008 mg/kg bw/day Section 3.3.3
EPA Cancer Potency Factor Q1 1.6 (mg/kg/day)-1 Section 3.3.3
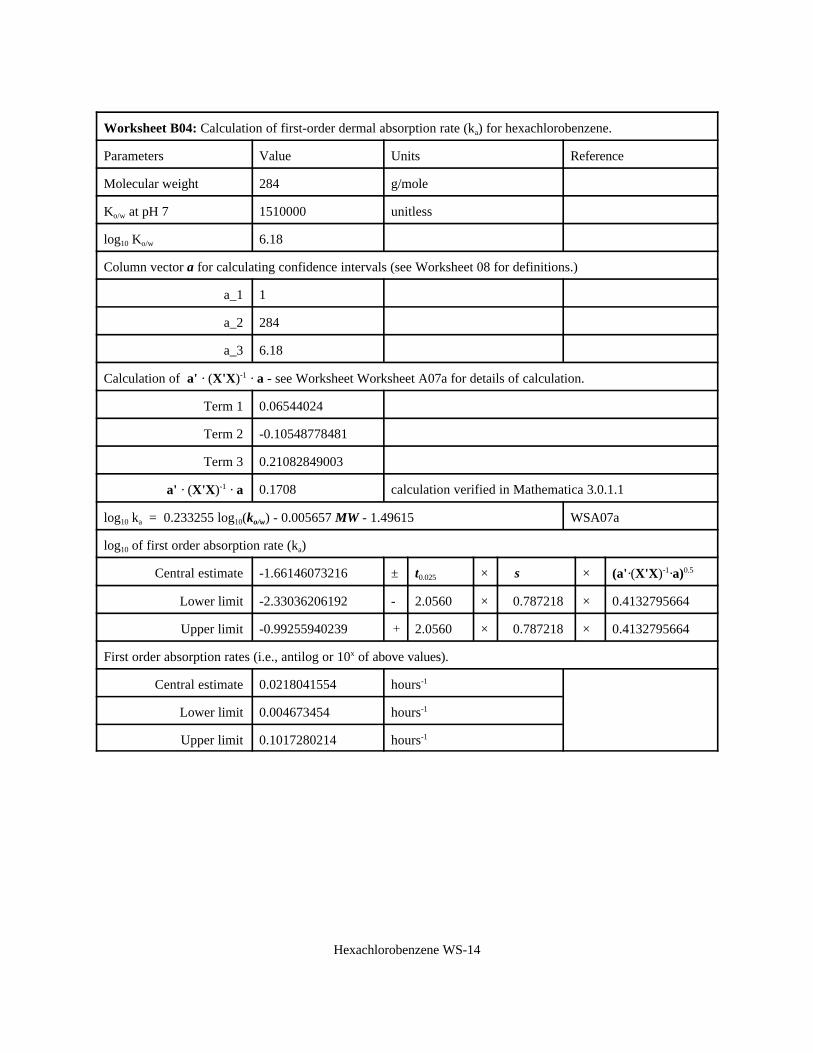
Hexachlorobenzene WS-14
Worksheet B04: Calculation of first-order dermal absorption rate (ka) for hexachlorobenzene.
Parameters Value Units Reference
Molecular weight 284 g/mole
Ko/w at pH 7 1510000 unitless
log10 Ko/w 6.18
Column vector a for calculating confidence intervals (see Worksheet 08 for definitions.)
a_1 1
a_2 284
a_3 6.18
Calculation of a' · (X'X)-1 · a - see Worksheet Worksheet A07a for details of calculation.
Term 1 0.06544024
Term 2 -0.10548778481
Term 3 0.21082849003
a' · (X'X)-1 · a 0.1708 calculation verified in Mathematica 3.0.1.1
log10 ka = 0.233255 log10(ko/w) - 0.005657 MW - 1.49615 WSA07a
log10 of first order absorption rate (ka)
Central estimate -1.66146073216 ± t0.025 × s × (a'·(X'X)-1·a)0.5
Lower limit -2.33036206192 - 2.0560 × 0.787218 × 0.4132795664
Upper limit -0.99255940239 % 2.0560 × 0.787218 × 0.4132795664
First order absorption rates (i.e., antilog or 10x of above values).
Central estimate 0.0218041554 hours-1
Lower limit 0.004673454 hours-1
Upper limit 0.1017280214 hours-1
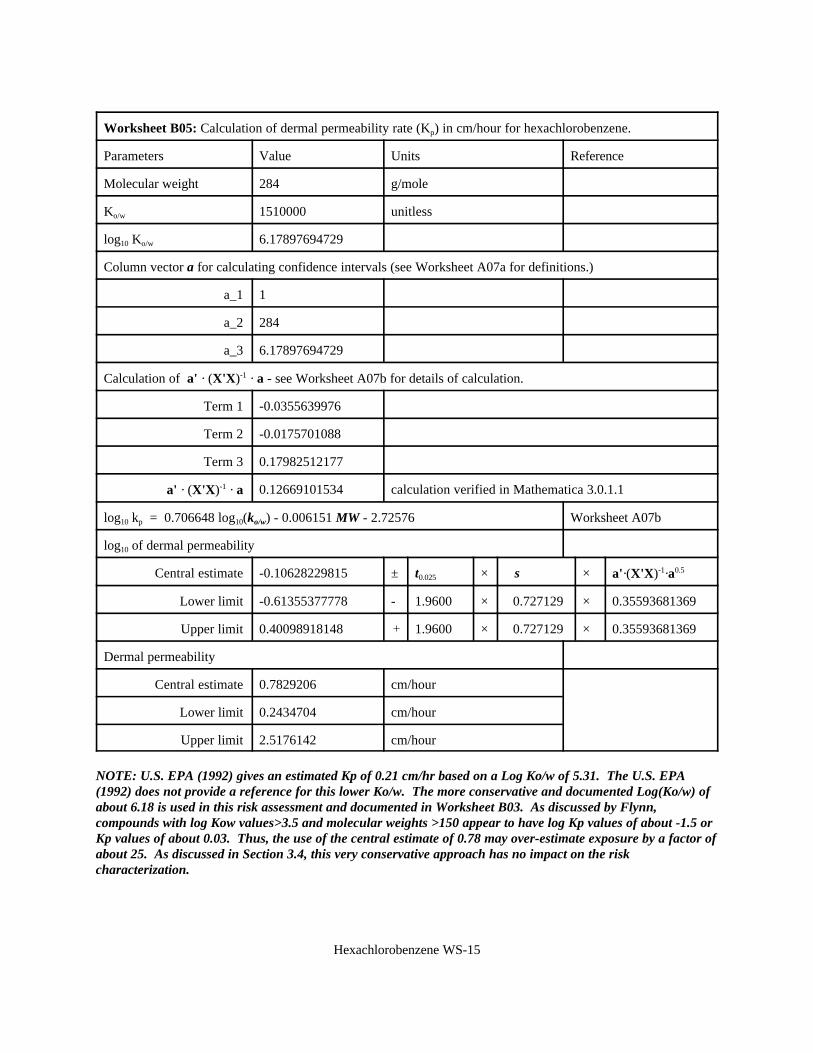
Hexachlorobenzene WS-15
Worksheet B05: Calculation of dermal permeability rate (Kp) in cm/hour for hexachlorobenzene.
Parameters Value Units Reference
Molecular weight 284 g/mole
Ko/w 1510000 unitless
log10 Ko/w 6.17897694729
Column vector a for calculating confidence intervals (see Worksheet A07a for definitions.)
a_1 1
a_2 284
a_3 6.17897694729
Calculation of a' · (X'X)-1 · a - see Worksheet A07b for details of calculation.
Term 1 -0.0355639976
Term 2 -0.0175701088
Term 3 0.17982512177
a' · (X'X)-1 · a 0.12669101534 calculation verified in Mathematica 3.0.1.1
log10 kp = 0.706648 log10(ko/w) - 0.006151 MW - 2.72576 Worksheet A07b
log10 of dermal permeability
Central estimate -0.10628229815 ± t0.025 × s × a'·(X'X)-1·a0.5
Lower limit -0.61355377778 - 1.9600 × 0.727129 × 0.35593681369
Upper limit 0.40098918148 % 1.9600 × 0.727129 × 0.35593681369
Dermal permeability
Central estimate 0.7829206 cm/hour
Lower limit 0.2434704 cm/hour
Upper limit 2.5176142 cm/hour
NOTE: U.S. EPA (1992) gives an estimated Kp of 0.21 cm/hr based on a Log Ko/w of 5.31. The U.S. EPA(1992) does not provide a reference for this lower Ko/w. The more conservative and documented Log(Ko/w) ofabout 6.18 is used in this risk assessment and documented in Worksheet B03. As discussed by Flynn,compounds with log Kow values>3.5 and molecular weights >150 appear to have log Kp values of about -1.5 orKp values of about 0.03. Thus, the use of the central estimate of 0.78 may over-estimate exposure by a factor ofabout 25. As discussed in Section 3.4, this very conservative approach has no impact on the riskcharacterization.
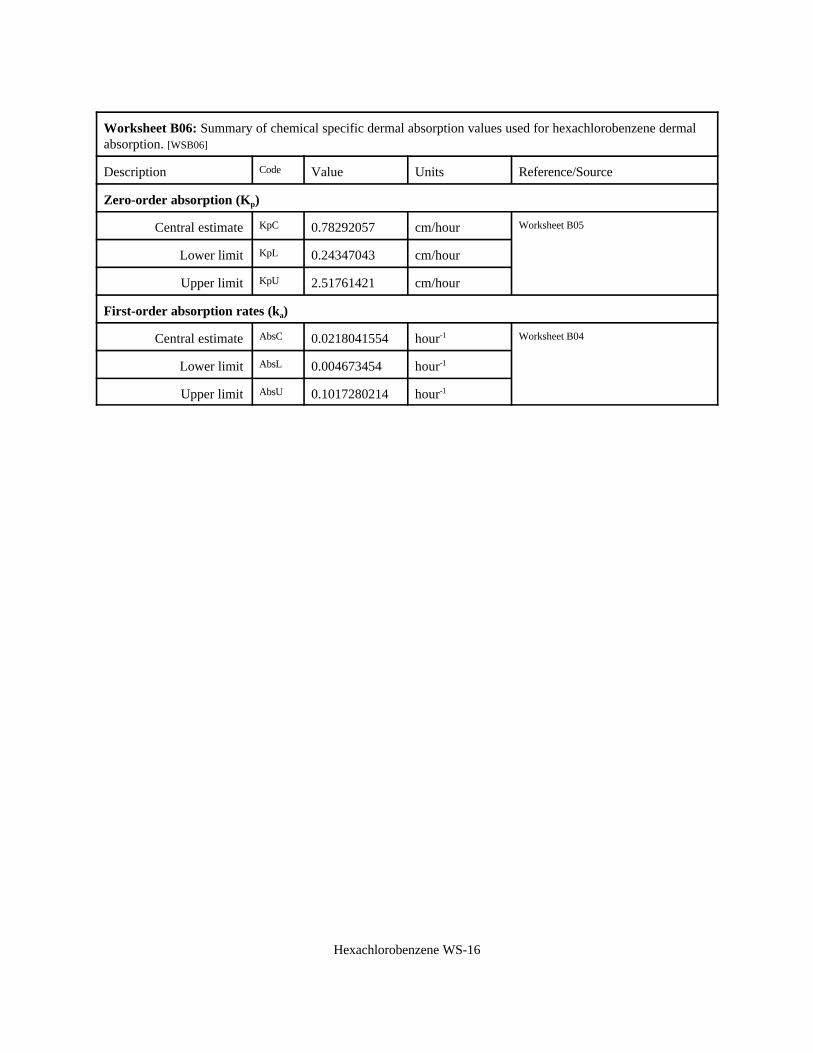
Hexachlorobenzene WS-16
Worksheet B06: Summary of chemical specific dermal absorption values used for hexachlorobenzene dermalabsorption. [WSB06]
Description Code Value Units Reference/Source
Zero-order absorption (Kp)
Central estimate KpC 0.78292057 cm/hour Worksheet B05
Lower limit KpL 0.24347043 cm/hour
Upper limit KpU 2.51761421 cm/hour
First-order absorption rates (ka)
Central estimate AbsC 0.0218041554 hour-1 Worksheet B04
Lower limit AbsL 0.004673454 hour-1
Upper limit AbsU 0.1017280214 hour-1
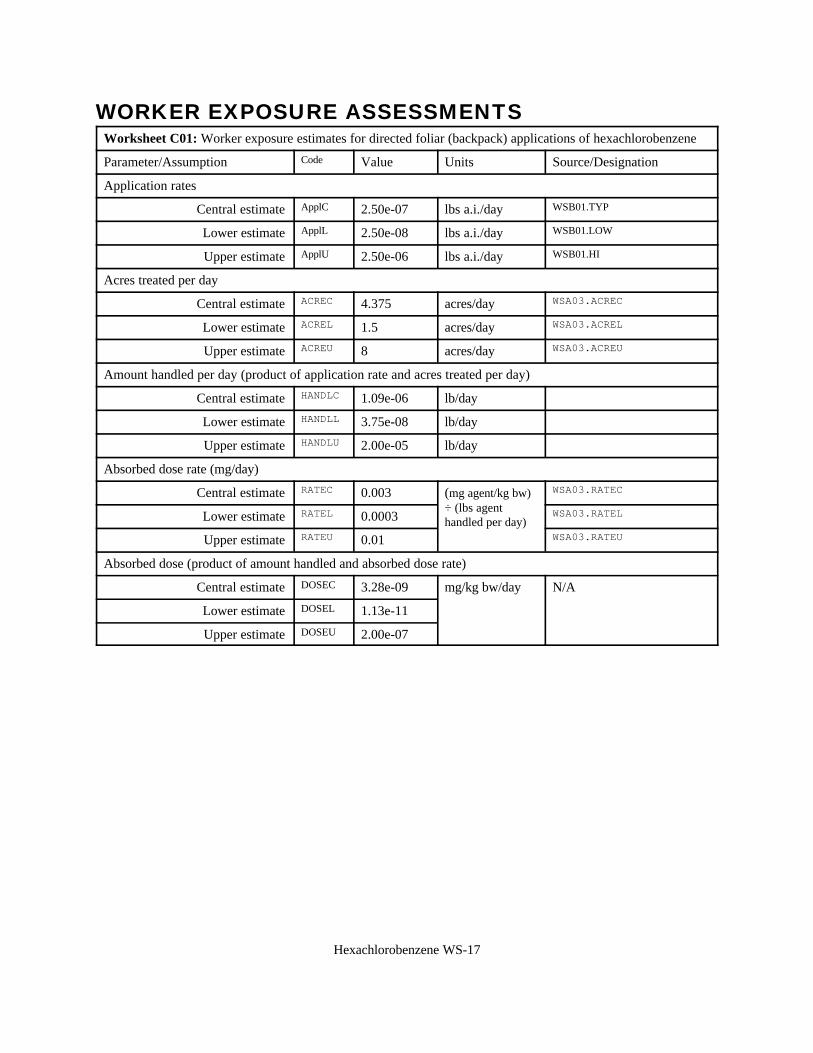
Hexachlorobenzene WS-17
WORKER EXPOSURE ASSESSMENTSWorksheet C01: Worker exposure estimates for directed foliar (backpack) applications of hexachlorobenzene
Parameter/Assumption Code Value Units Source/Designation
Application rates
Central estimate ApplC 2.50e-07 lbs a.i./day WSB01.TYP
Lower estimate ApplL 2.50e-08 lbs a.i./day WSB01.LOW
Upper estimate ApplU 2.50e-06 lbs a.i./day WSB01.HI
Acres treated per day
Central estimate ACREC 4.375 acres/day WSA03.ACREC
Lower estimate ACREL 1.5 acres/day WSA03.ACREL
Upper estimate ACREU 8 acres/day WSA03.ACREU
Amount handled per day (product of application rate and acres treated per day)
Central estimate HANDLC 1.09e-06 lb/day
Lower estimate HANDLL 3.75e-08 lb/day
Upper estimate HANDLU 2.00e-05 lb/day
Absorbed dose rate (mg/day)
Central estimate RATEC 0.003 (mg agent/kg bw)÷ (lbs agenthandled per day)
WSA03.RATEC
Lower estimate RATEL 0.0003 WSA03.RATEL
Upper estimate RATEU 0.01 WSA03.RATEU
Absorbed dose (product of amount handled and absorbed dose rate)
Central estimate DOSEC 3.28e-09 mg/kg bw/day N/A
Lower estimate DOSEL 1.13e-11
Upper estimate DOSEU 2.00e-07
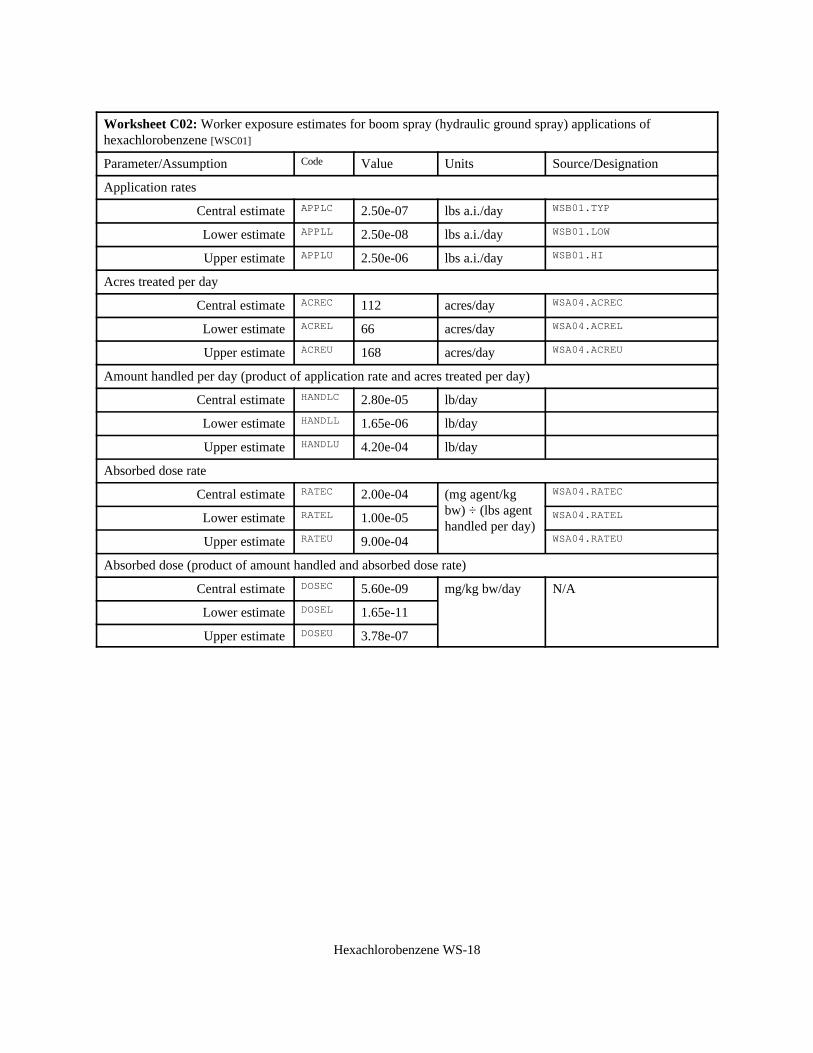
Hexachlorobenzene WS-18
Worksheet C02: Worker exposure estimates for boom spray (hydraulic ground spray) applications ofhexachlorobenzene [WSC01]
Parameter/Assumption Code Value Units Source/Designation
Application rates
Central estimate APPLC 2.50e-07 lbs a.i./day WSB01.TYP
Lower estimate APPLL 2.50e-08 lbs a.i./day WSB01.LOW
Upper estimate APPLU 2.50e-06 lbs a.i./day WSB01.HI
Acres treated per day
Central estimate ACREC 112 acres/day WSA04.ACREC
Lower estimate ACREL 66 acres/day WSA04.ACREL
Upper estimate ACREU 168 acres/day WSA04.ACREU
Amount handled per day (product of application rate and acres treated per day)
Central estimate HANDLC 2.80e-05 lb/day
Lower estimate HANDLL 1.65e-06 lb/day
Upper estimate HANDLU 4.20e-04 lb/day
Absorbed dose rate
Central estimate RATEC 2.00e-04 (mg agent/kgbw) ÷ (lbs agenthandled per day)
WSA04.RATEC
Lower estimate RATEL 1.00e-05 WSA04.RATEL
Upper estimate RATEU 9.00e-04 WSA04.RATEU
Absorbed dose (product of amount handled and absorbed dose rate)
Central estimate DOSEC 5.60e-09 mg/kg bw/day N/A
Lower estimate DOSEL 1.65e-11
Upper estimate DOSEU 3.78e-07
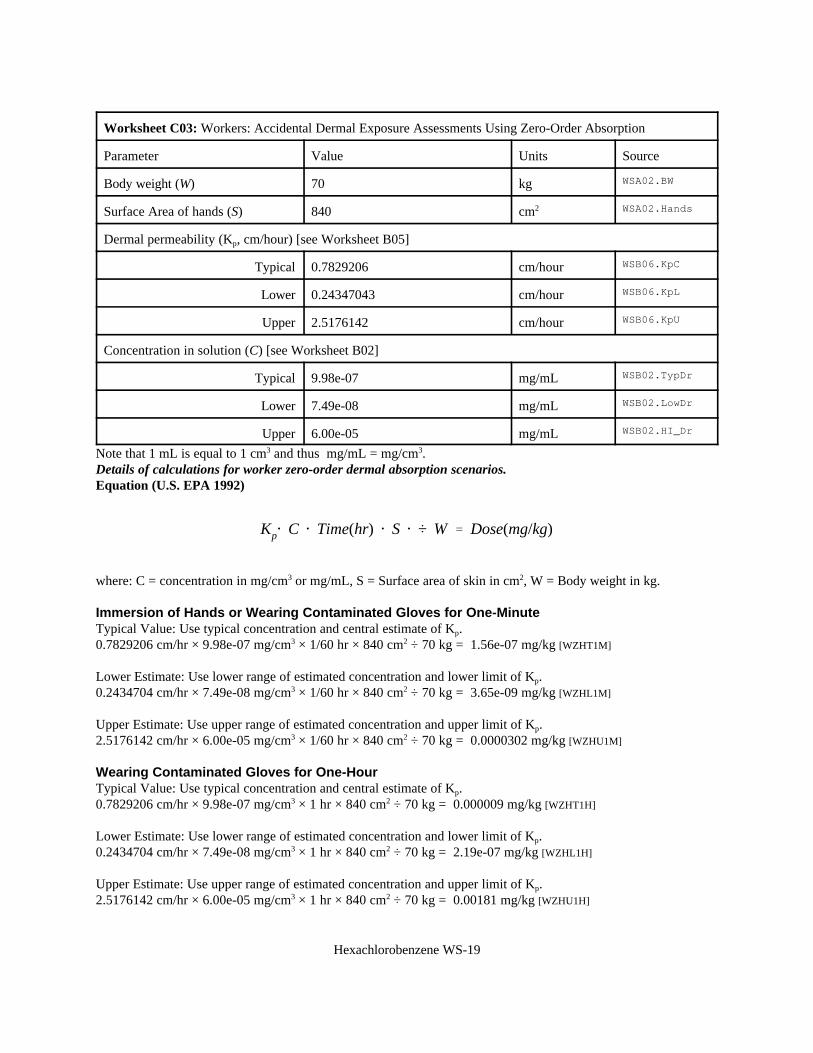
Hexachlorobenzene WS-19
Kp@ C @ Time(hr) @ S @ ÷ W ' Dose(mg/kg)
Worksheet C03: Workers: Accidental Dermal Exposure Assessments Using Zero-Order Absorption
Parameter Value Units Source
Body weight (W) 70 kg WSA02.BW
Surface Area of hands (S) 840 cm2 WSA02.Hands
Dermal permeability (Kp, cm/hour) [see Worksheet B05]
Typical 0.7829206 cm/hour WSB06.KpC
Lower 0.24347043 cm/hour WSB06.KpL
Upper 2.5176142 cm/hour WSB06.KpU
Concentration in solution (C) [see Worksheet B02]
Typical 9.98e-07 mg/mL WSB02.TypDr
Lower 7.49e-08 mg/mL WSB02.LowDr
Upper 6.00e-05 mg/mL WSB02.HI_Dr
Note that 1 mL is equal to 1 cm3 and thus mg/mL = mg/cm3.Details of calculations for worker zero-order dermal absorption scenarios.Equation (U.S. EPA 1992)
where: C = concentration in mg/cm3 or mg/mL, S = Surface area of skin in cm2, W = Body weight in kg.
Immersion of Hands or Wearing Contaminated Gloves for One-MinuteTypical Value: Use typical concentration and central estimate of Kp.0.7829206 cm/hr × 9.98e-07 mg/cm3 × 1/60 hr × 840 cm2 ÷ 70 kg = 1.56e-07 mg/kg [WZHT1M]
Lower Estimate: Use lower range of estimated concentration and lower limit of Kp.0.2434704 cm/hr × 7.49e-08 mg/cm3 × 1/60 hr × 840 cm2 ÷ 70 kg = 3.65e-09 mg/kg [WZHL1M]
Upper Estimate: Use upper range of estimated concentration and upper limit of Kp.2.5176142 cm/hr × 6.00e-05 mg/cm3 × 1/60 hr × 840 cm2 ÷ 70 kg = 0.0000302 mg/kg [WZHU1M]
Wearing Contaminated Gloves for One-HourTypical Value: Use typical concentration and central estimate of Kp.0.7829206 cm/hr × 9.98e-07 mg/cm3 × 1 hr × 840 cm2 ÷ 70 kg = 0.000009 mg/kg [WZHT1H]
Lower Estimate: Use lower range of estimated concentration and lower limit of Kp.0.2434704 cm/hr × 7.49e-08 mg/cm3 × 1 hr × 840 cm2 ÷ 70 kg = 2.19e-07 mg/kg [WZHL1H]
Upper Estimate: Use upper range of estimated concentration and upper limit of Kp.2.5176142 cm/hr × 6.00e-05 mg/cm3 × 1 hr × 840 cm2 ÷ 70 kg = 0.00181 mg/kg [WZHU1H]
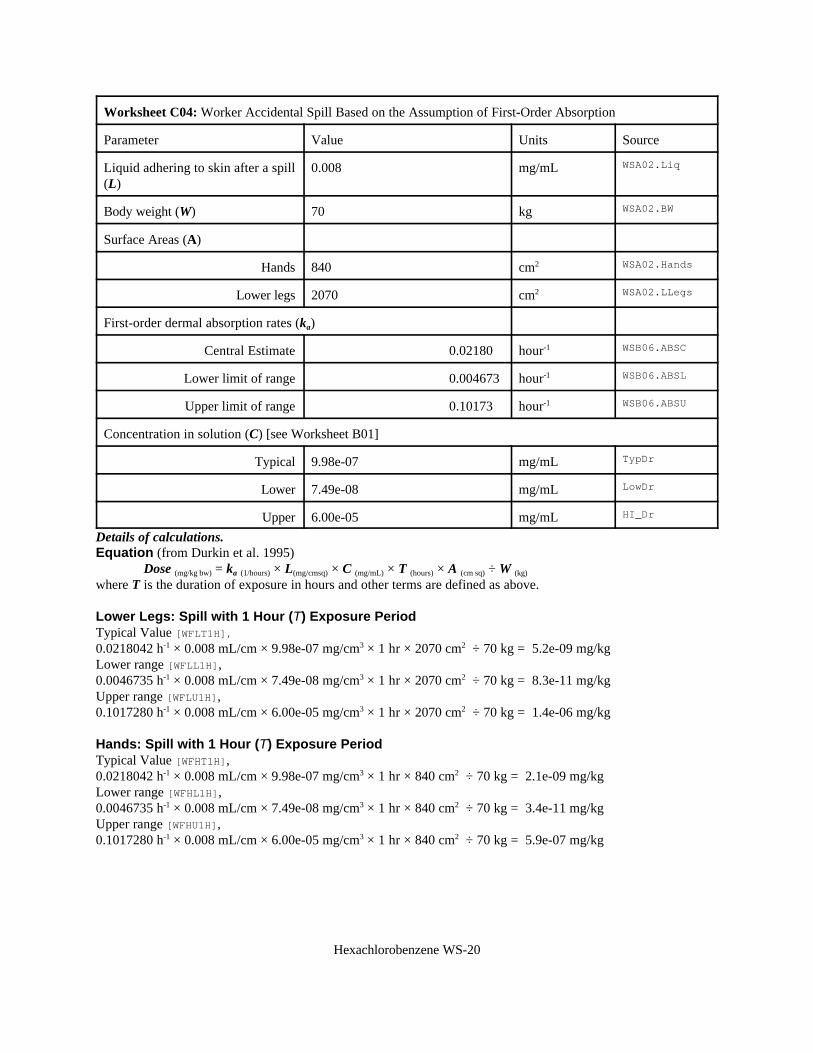
Hexachlorobenzene WS-20
Worksheet C04: Worker Accidental Spill Based on the Assumption of First-Order Absorption
Parameter Value Units Source
Liquid adhering to skin after a spill(L)
0.008 mg/mL WSA02.Liq
Body weight (W) 70 kg WSA02.BW
Surface Areas (A)
Hands 840 cm2 WSA02.Hands
Lower legs 2070 cm2 WSA02.LLegs
First-order dermal absorption rates (ka)
Central Estimate 0.02180 hour-1 WSB06.ABSC
Lower limit of range 0.004673 hour-1 WSB06.ABSL
Upper limit of range 0.10173 hour-1 WSB06.ABSU
Concentration in solution (C) [see Worksheet B01]
Typical 9.98e-07 mg/mL TypDr
Lower 7.49e-08 mg/mL LowDr
Upper 6.00e-05 mg/mL HI_Dr
Details of calculations.Equation (from Durkin et al. 1995)
Dose (mg/kg bw) = ka (1/hours) × L(mg/cmsq) × C (mg/mL) × T (hours) × A (cm sq) ÷ W (kg)
where T is the duration of exposure in hours and other terms are defined as above.
Lower Legs: Spill with 1 Hour (T) Exposure PeriodTypical Value [WFLT1H],0.0218042 h-1 × 0.008 mL/cm × 9.98e-07 mg/cm3 × 1 hr × 2070 cm2 ÷ 70 kg = 5.2e-09 mg/kg Lower range [WFLL1H],0.0046735 h-1 × 0.008 mL/cm × 7.49e-08 mg/cm3 × 1 hr × 2070 cm2 ÷ 70 kg = 8.3e-11 mg/kg Upper range [WFLU1H],0.1017280 h-1 × 0.008 mL/cm × 6.00e-05 mg/cm3 × 1 hr × 2070 cm2 ÷ 70 kg = 1.4e-06 mg/kg
Hands: Spill with 1 Hour (T) Exposure PeriodTypical Value [WFHT1H],0.0218042 h-1 × 0.008 mL/cm × 9.98e-07 mg/cm3 × 1 hr × 840 cm2 ÷ 70 kg = 2.1e-09 mg/kg Lower range [WFHL1H],0.0046735 h-1 × 0.008 mL/cm × 7.49e-08 mg/cm3 × 1 hr × 840 cm2 ÷ 70 kg = 3.4e-11 mg/kg Upper range [WFHU1H],0.1017280 h-1 × 0.008 mL/cm × 6.00e-05 mg/cm3 × 1 hr × 840 cm2 ÷ 70 kg = 5.9e-07 mg/kg
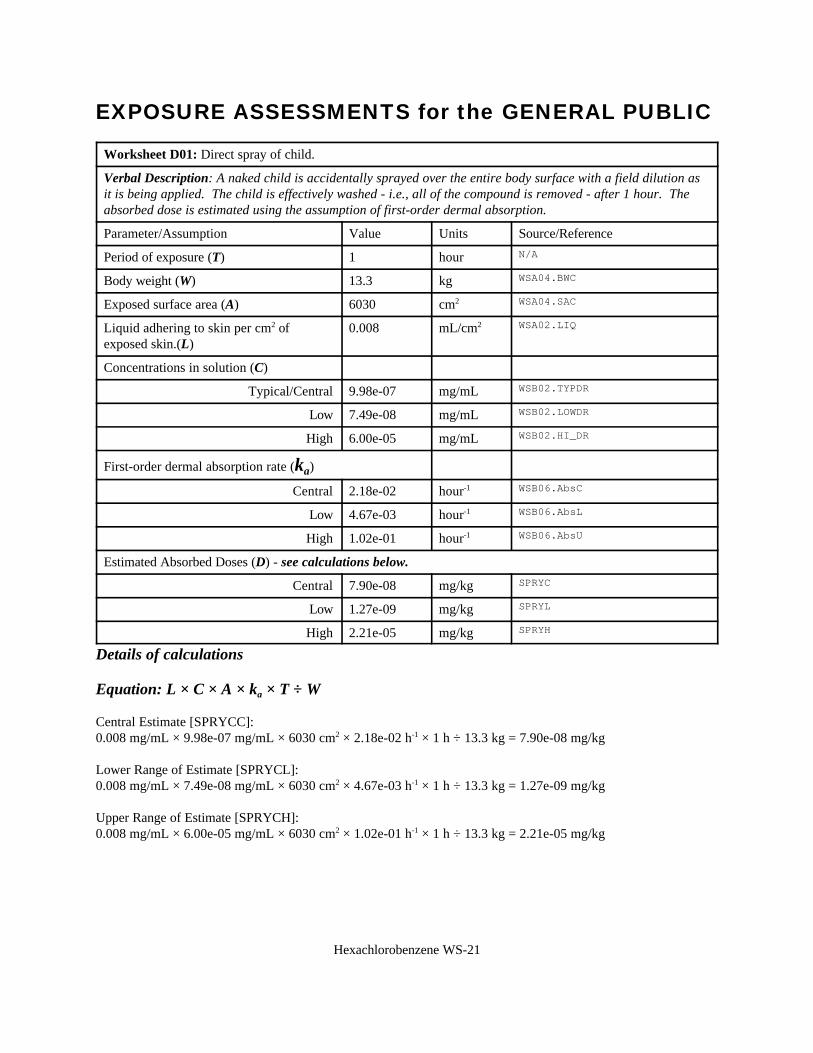
Hexachlorobenzene WS-21
EXPOSURE ASSESSMENTS for the GENERAL PUBLIC
Worksheet D01: Direct spray of child.
Verbal Description: A naked child is accidentally sprayed over the entire body surface with a field dilution asit is being applied. The child is effectively washed - i.e., all of the compound is removed - after 1 hour. Theabsorbed dose is estimated using the assumption of first-order dermal absorption.
Parameter/Assumption Value Units Source/Reference
Period of exposure (T) 1 hour N/A
Body weight (W) 13.3 kg WSA04.BWC
Exposed surface area (A) 6030 cm2 WSA04.SAC
Liquid adhering to skin per cm2 ofexposed skin.(L)
0.008 mL/cm2 WSA02.LIQ
Concentrations in solution (C)
Typical/Central 9.98e-07 mg/mL WSB02.TYPDR
Low 7.49e-08 mg/mL WSB02.LOWDR
High 6.00e-05 mg/mL WSB02.HI_DR
First-order dermal absorption rate (ka)
Central 2.18e-02 hour-1 WSB06.AbsC
Low 4.67e-03 hour-1 WSB06.AbsL
High 1.02e-01 hour-1 WSB06.AbsU
Estimated Absorbed Doses (D) - see calculations below.
Central 7.90e-08 mg/kg SPRYC
Low 1.27e-09 mg/kg SPRYL
High 2.21e-05 mg/kg SPRYH
Details of calculations
Equation: L × C × A × ka × T ÷ W
Central Estimate [SPRYCC]:0.008 mg/mL × 9.98e-07 mg/mL × 6030 cm2 × 2.18e-02 h-1 × 1 h ÷ 13.3 kg = 7.90e-08 mg/kg
Lower Range of Estimate [SPRYCL]:0.008 mg/mL × 7.49e-08 mg/mL × 6030 cm2 × 4.67e-03 h-1 × 1 h ÷ 13.3 kg = 1.27e-09 mg/kg
Upper Range of Estimate [SPRYCH]:0.008 mg/mL × 6.00e-05 mg/mL × 6030 cm2 × 1.02e-01 h-1 × 1 h ÷ 13.3 kg = 2.21e-05 mg/kg
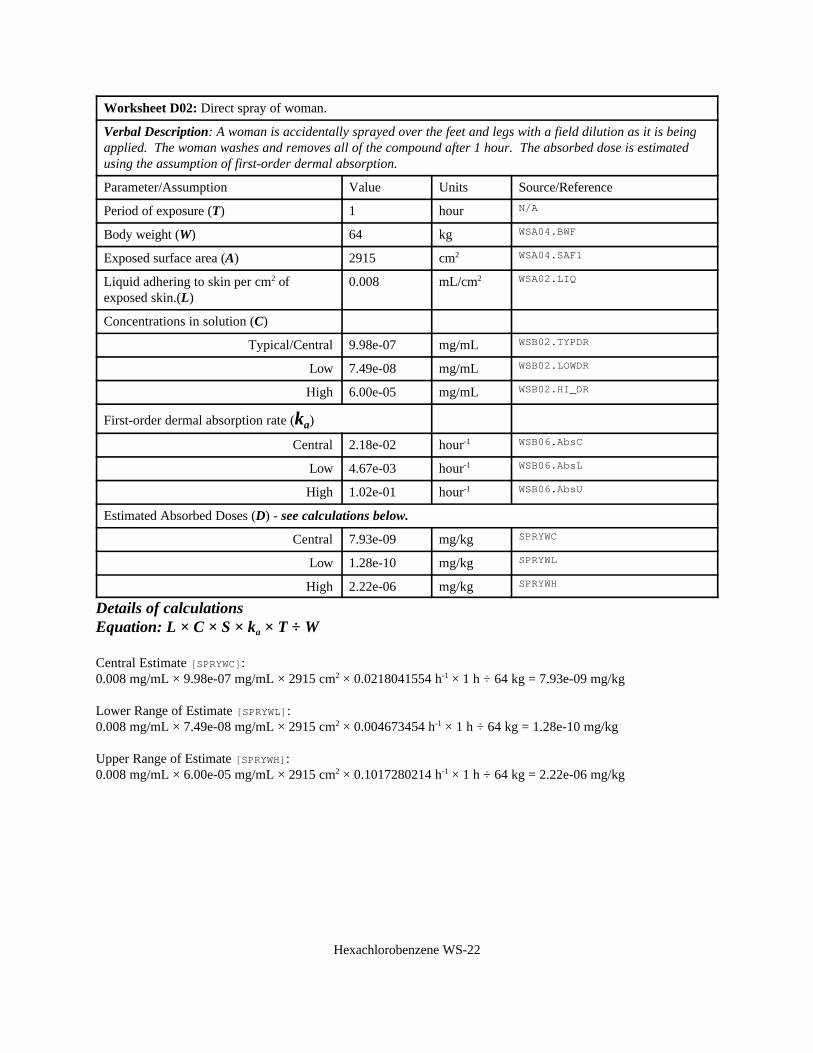
Hexachlorobenzene WS-22
Worksheet D02: Direct spray of woman.
Verbal Description: A woman is accidentally sprayed over the feet and legs with a field dilution as it is beingapplied. The woman washes and removes all of the compound after 1 hour. The absorbed dose is estimatedusing the assumption of first-order dermal absorption.
Parameter/Assumption Value Units Source/Reference
Period of exposure (T) 1 hour N/A
Body weight (W) 64 kg WSA04.BWF
Exposed surface area (A) 2915 cm2 WSA04.SAF1
Liquid adhering to skin per cm2 ofexposed skin.(L)
0.008 mL/cm2 WSA02.LIQ
Concentrations in solution (C)
Typical/Central 9.98e-07 mg/mL WSB02.TYPDR
Low 7.49e-08 mg/mL WSB02.LOWDR
High 6.00e-05 mg/mL WSB02.HI_DR
First-order dermal absorption rate (ka)
Central 2.18e-02 hour-1 WSB06.AbsC
Low 4.67e-03 hour-1 WSB06.AbsL
High 1.02e-01 hour-1 WSB06.AbsU
Estimated Absorbed Doses (D) - see calculations below.
Central 7.93e-09 mg/kg SPRYWC
Low 1.28e-10 mg/kg SPRYWL
High 2.22e-06 mg/kg SPRYWH
Details of calculationsEquation: L × C × S × ka × T ÷ W
Central Estimate [SPRYWC]:0.008 mg/mL × 9.98e-07 mg/mL × 2915 cm2 × 0.0218041554 h-1 × 1 h ÷ 64 kg = 7.93e-09 mg/kg
Lower Range of Estimate [SPRYWL]:0.008 mg/mL × 7.49e-08 mg/mL × 2915 cm2 × 0.004673454 h-1 × 1 h ÷ 64 kg = 1.28e-10 mg/kg
Upper Range of Estimate [SPRYWH]:0.008 mg/mL × 6.00e-05 mg/mL × 2915 cm2 × 0.1017280214 h-1 × 1 h ÷ 64 kg = 2.22e-06 mg/kg
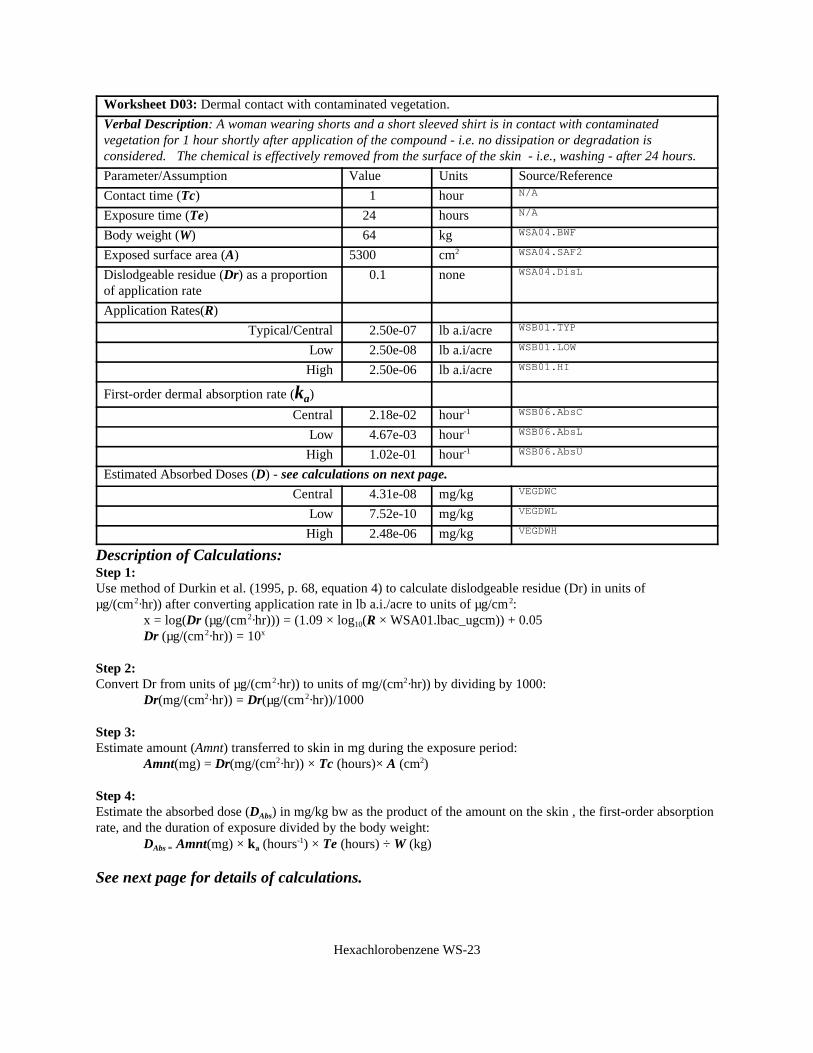
Hexachlorobenzene WS-23
Worksheet D03: Dermal contact with contaminated vegetation.
Verbal Description: A woman wearing shorts and a short sleeved shirt is in contact with contaminatedvegetation for 1 hour shortly after application of the compound - i.e. no dissipation or degradation isconsidered. The chemical is effectively removed from the surface of the skin - i.e., washing - after 24 hours.
Parameter/Assumption Value Units Source/Reference
Contact time (Tc) 1 hour N/A
Exposure time (Te) 24 hours N/A
Body weight (W) 64 kg WSA04.BWF
Exposed surface area (A) 5300 cm2 WSA04.SAF2
Dislodgeable residue (Dr) as a proportionof application rate
0.1 none WSA04.DisL
Application Rates(R)
Typical/Central 2.50e-07 lb a.i/acre WSB01.TYP
Low 2.50e-08 lb a.i/acre WSB01.LOW
High 2.50e-06 lb a.i/acre WSB01.HI
First-order dermal absorption rate (ka)
Central 2.18e-02 hour-1 WSB06.AbsC
Low 4.67e-03 hour-1 WSB06.AbsL
High 1.02e-01 hour-1 WSB06.AbsU
Estimated Absorbed Doses (D) - see calculations on next page.
Central 4.31e-08 mg/kg VEGDWC
Low 7.52e-10 mg/kg VEGDWL
High 2.48e-06 mg/kg VEGDWH
Description of Calculations:Step 1:Use method of Durkin et al. (1995, p. 68, equation 4) to calculate dislodgeable residue (Dr) in units of µg/(cm2·hr)) after converting application rate in lb a.i./acre to units of µg/cm2:
x = log(Dr (µg/(cm2·hr))) = (1.09 × log10(R × WSA01.lbac_ugcm)) + 0.05Dr (µg/(cm2·hr)) = 10x
Step 2:Convert Dr from units of µg/(cm2·hr)) to units of mg/(cm2·hr)) by dividing by 1000:
Dr(mg/(cm2·hr)) = Dr(µg/(cm2·hr))/1000
Step 3:Estimate amount (Amnt) transferred to skin in mg during the exposure period:
Amnt(mg) = Dr(mg/(cm2·hr)) × Tc (hours)× A (cm2)
Step 4:Estimate the absorbed dose (DAbs) in mg/kg bw as the product of the amount on the skin , the first-order absorptionrate, and the duration of exposure divided by the body weight:
DAbs = Amnt(mg) × ka (hours-1) × Te (hours) ÷ W (kg)
See next page for details of calculations.
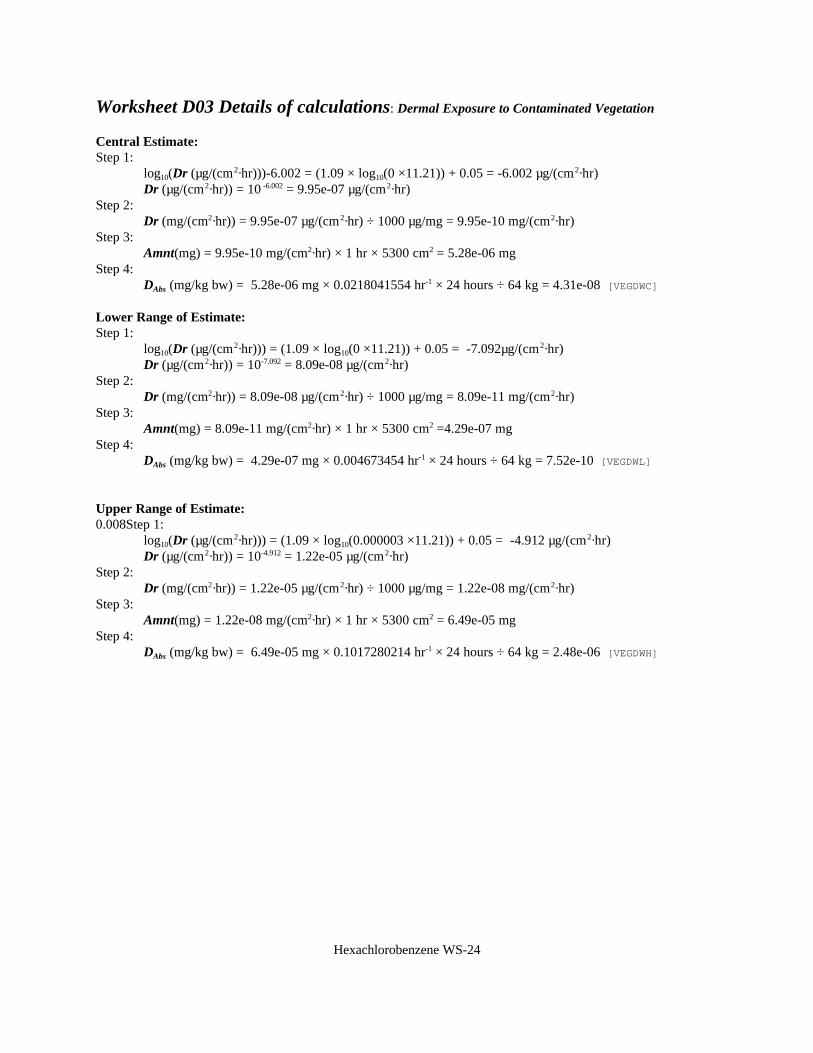
Hexachlorobenzene WS-24
Worksheet D03 Details of calculations: Dermal Exposure to Contaminated Vegetation
Central Estimate:Step 1:
log10(Dr (µg/(cm2·hr)))-6.002 = (1.09 × log10(0 ×11.21)) + 0.05 = -6.002 µg/(cm2·hr)Dr (µg/(cm2·hr)) = 10 -6.002 = 9.95e-07 µg/(cm2·hr)
Step 2:Dr (mg/(cm2·hr)) = 9.95e-07 µg/(cm2·hr) ÷ 1000 µg/mg = 9.95e-10 mg/(cm2·hr)
Step 3:Amnt(mg) = 9.95e-10 mg/(cm2·hr) × 1 hr × 5300 cm2 = 5.28e-06 mg
Step 4:DAbs (mg/kg bw) = 5.28e-06 mg × 0.0218041554 hr-1 × 24 hours ÷ 64 kg = 4.31e-08 [VEGDWC]
Lower Range of Estimate:Step 1:
log10(Dr (µg/(cm2·hr))) = (1.09 × log10(0 ×11.21)) + 0.05 = -7.092µg/(cm2·hr)Dr (µg/(cm2·hr)) = 10-7.092 = 8.09e-08 µg/(cm2·hr)
Step 2:Dr (mg/(cm2·hr)) = 8.09e-08 µg/(cm2·hr) ÷ 1000 µg/mg = 8.09e-11 mg/(cm2·hr)
Step 3:Amnt(mg) = 8.09e-11 mg/(cm2·hr) × 1 hr × 5300 cm2 =4.29e-07 mg
Step 4:DAbs (mg/kg bw) = 4.29e-07 mg × 0.004673454 hr-1 × 24 hours ÷ 64 kg = 7.52e-10 [VEGDWL]
Upper Range of Estimate:0.008Step 1:
log10(Dr (µg/(cm2·hr))) = (1.09 × log10(0.000003 ×11.21)) + 0.05 = -4.912 µg/(cm2·hr)Dr (µg/(cm2·hr)) = 10-4.912 = 1.22e-05 µg/(cm2·hr)
Step 2:Dr (mg/(cm2·hr)) = 1.22e-05 µg/(cm2·hr) ÷ 1000 µg/mg = 1.22e-08 mg/(cm2·hr)
Step 3:Amnt(mg) = 1.22e-08 mg/(cm2·hr) × 1 hr × 5300 cm2 = 6.49e-05 mg
Step 4:DAbs (mg/kg bw) = 6.49e-05 mg × 0.1017280214 hr-1 × 24 hours ÷ 64 kg = 2.48e-06 [VEGDWH]
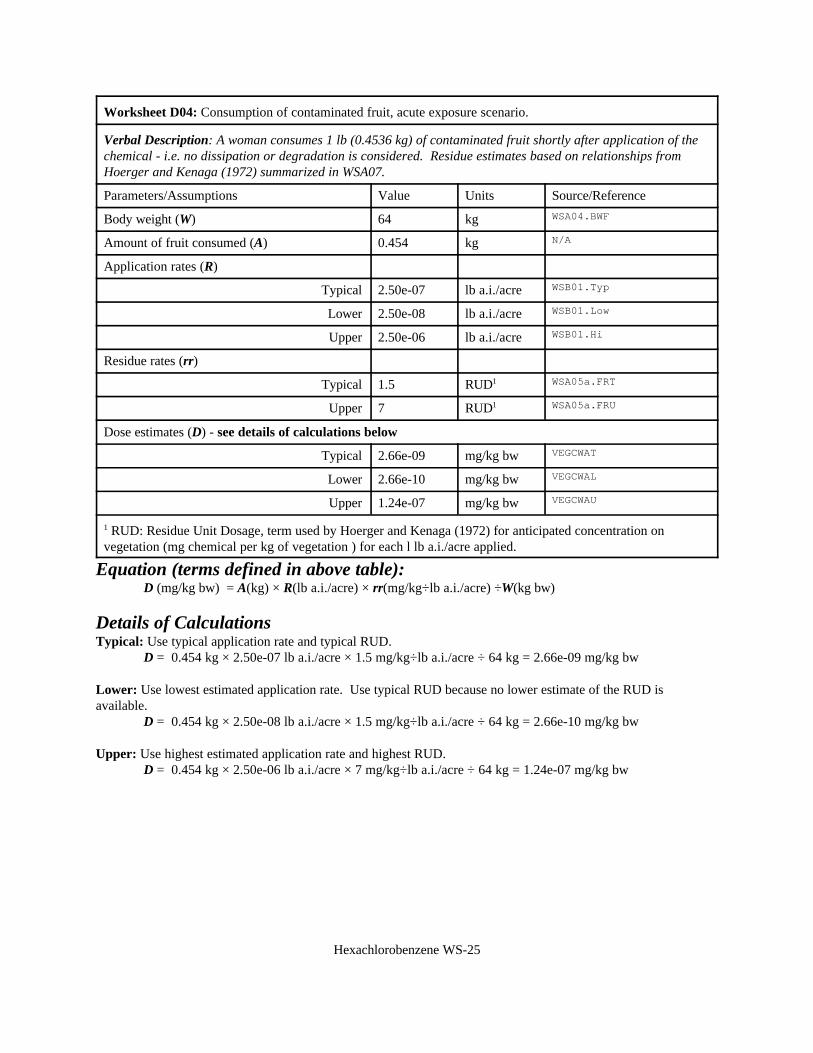
Hexachlorobenzene WS-25
Worksheet D04: Consumption of contaminated fruit, acute exposure scenario.
Verbal Description: A woman consumes 1 lb (0.4536 kg) of contaminated fruit shortly after application of thechemical - i.e. no dissipation or degradation is considered. Residue estimates based on relationships fromHoerger and Kenaga (1972) summarized in WSA07.
Parameters/Assumptions Value Units Source/Reference
Body weight (W) 64 kg WSA04.BWF
Amount of fruit consumed (A) 0.454 kg N/A
Application rates (R)
Typical 2.50e-07 lb a.i./acre WSB01.Typ
Lower 2.50e-08 lb a.i./acre WSB01.Low
Upper 2.50e-06 lb a.i./acre WSB01.Hi
Residue rates (rr)
Typical 1.5 RUD1 WSA05a.FRT
Upper 7 RUD1 WSA05a.FRU
Dose estimates (D) - see details of calculations below
Typical 2.66e-09 mg/kg bw VEGCWAT
Lower 2.66e-10 mg/kg bw VEGCWAL
Upper 1.24e-07 mg/kg bw VEGCWAU
1 RUD: Residue Unit Dosage, term used by Hoerger and Kenaga (1972) for anticipated concentration onvegetation (mg chemical per kg of vegetation ) for each l lb a.i./acre applied.
Equation (terms defined in above table):D (mg/kg bw) = A(kg) × R(lb a.i./acre) × rr(mg/kg÷lb a.i./acre) ÷W(kg bw)
Details of CalculationsTypical: Use typical application rate and typical RUD.
D = 0.454 kg × 2.50e-07 lb a.i./acre × 1.5 mg/kg÷lb a.i./acre ÷ 64 kg = 2.66e-09 mg/kg bw
Lower: Use lowest estimated application rate. Use typical RUD because no lower estimate of the RUD isavailable.
D = 0.454 kg × 2.50e-08 lb a.i./acre × 1.5 mg/kg÷lb a.i./acre ÷ 64 kg = 2.66e-10 mg/kg bw
Upper: Use highest estimated application rate and highest RUD.D = 0.454 kg × 2.50e-06 lb a.i./acre × 7 mg/kg÷lb a.i./acre ÷ 64 kg = 1.24e-07 mg/kg bw
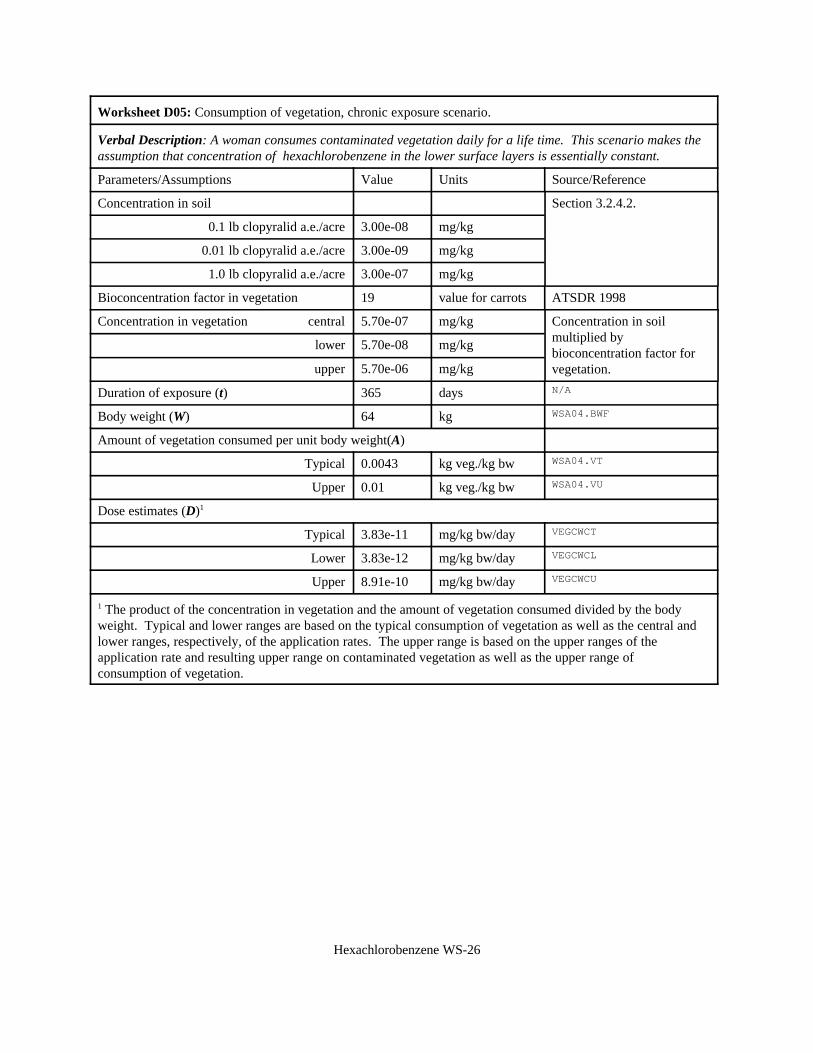
Hexachlorobenzene WS-26
Worksheet D05: Consumption of vegetation, chronic exposure scenario.
Verbal Description: A woman consumes contaminated vegetation daily for a life time. This scenario makes theassumption that concentration of hexachlorobenzene in the lower surface layers is essentially constant.
Parameters/Assumptions Value Units Source/Reference
Concentration in soil Section 3.2.4.2.
0.1 lb clopyralid a.e./acre 3.00e-08 mg/kg
0.01 lb clopyralid a.e./acre 3.00e-09 mg/kg
1.0 lb clopyralid a.e./acre 3.00e-07 mg/kg
Bioconcentration factor in vegetation 19 value for carrots ATSDR 1998
Concentration in vegetation central 5.70e-07 mg/kg Concentration in soilmultiplied bybioconcentration factor forvegetation.
lower 5.70e-08 mg/kg
upper 5.70e-06 mg/kg
Duration of exposure (t) 365 days N/A
Body weight (W) 64 kg WSA04.BWF
Amount of vegetation consumed per unit body weight(A)
Typical 0.0043 kg veg./kg bw WSA04.VT
Upper 0.01 kg veg./kg bw WSA04.VU
Dose estimates (D)1
Typical 3.83e-11 mg/kg bw/day VEGCWCT
Lower 3.83e-12 mg/kg bw/day VEGCWCL
Upper 8.91e-10 mg/kg bw/day VEGCWCU
1 The product of the concentration in vegetation and the amount of vegetation consumed divided by the bodyweight. Typical and lower ranges are based on the typical consumption of vegetation as well as the central andlower ranges, respectively, of the application rates. The upper range is based on the upper ranges of theapplication rate and resulting upper range on contaminated vegetation as well as the upper range of consumption of vegetation.
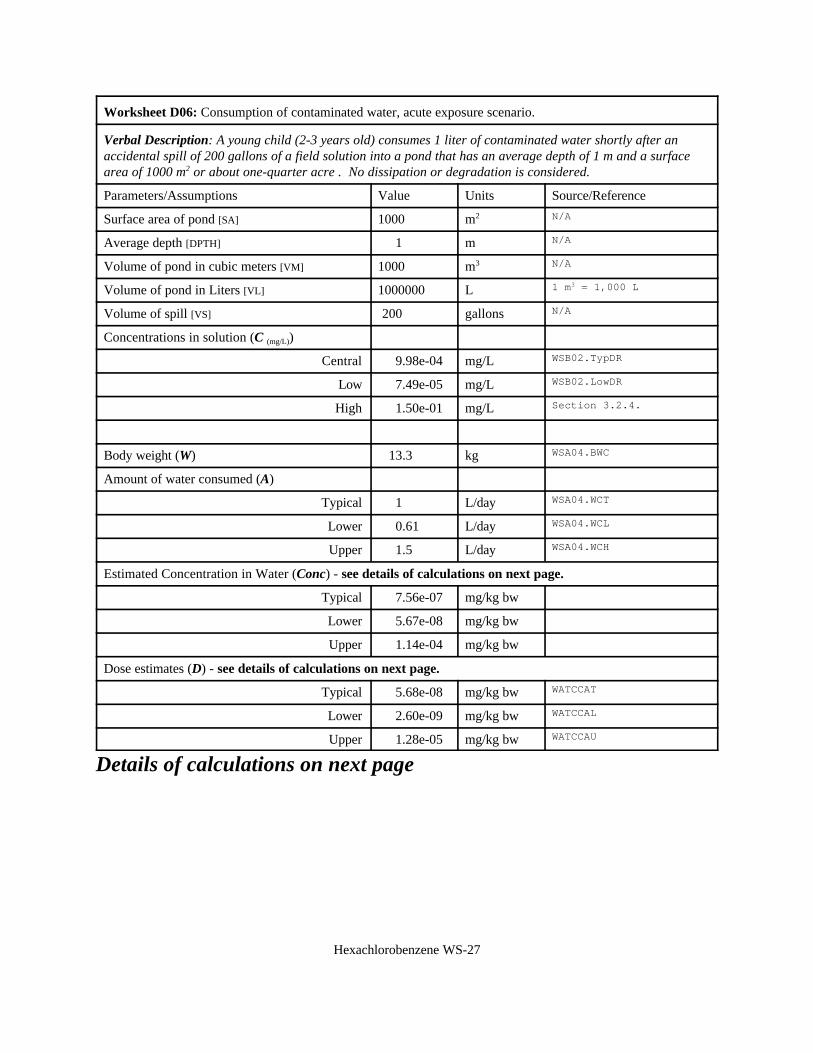
Hexachlorobenzene WS-27
Worksheet D06: Consumption of contaminated water, acute exposure scenario.
Verbal Description: A young child (2-3 years old) consumes 1 liter of contaminated water shortly after anaccidental spill of 200 gallons of a field solution into a pond that has an average depth of 1 m and a surfacearea of 1000 m2 or about one-quarter acre . No dissipation or degradation is considered.
Parameters/Assumptions Value Units Source/Reference
Surface area of pond [SA] 1000 m2 N/A
Average depth [DPTH] 1 m N/A
Volume of pond in cubic meters [VM] 1000 m3 N/A
Volume of pond in Liters [VL] 1000000 L 1 m3 = 1,000 L
Volume of spill [VS] 200 gallons N/A
Concentrations in solution (C (mg/L))
Central 9.98e-04 mg/L WSB02.TypDR
Low 7.49e-05 mg/L WSB02.LowDR
High 1.50e-01 mg/L Section 3.2.4.
Body weight (W) 13.3 kg WSA04.BWC
Amount of water consumed (A)
Typical 1 L/day WSA04.WCT
Lower 0.61 L/day WSA04.WCL
Upper 1.5 L/day WSA04.WCH
Estimated Concentration in Water (Conc) - see details of calculations on next page.
Typical 7.56e-07 mg/kg bw
Lower 5.67e-08 mg/kg bw
Upper 1.14e-04 mg/kg bw
Dose estimates (D) - see details of calculations on next page.
Typical 5.68e-08 mg/kg bw WATCCAT
Lower 2.60e-09 mg/kg bw WATCCAL
Upper 1.28e-05 mg/kg bw WATCCAU
Details of calculations on next page
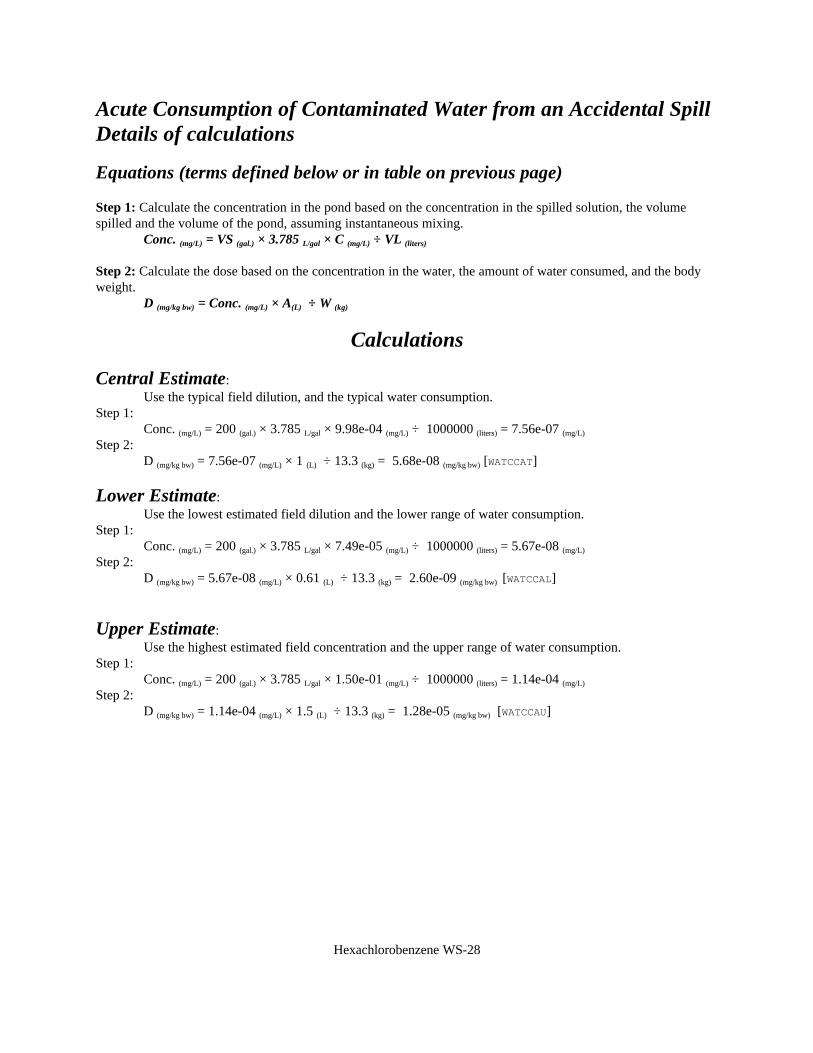
Hexachlorobenzene WS-28
Acute Consumption of Contaminated Water from an Accidental SpillDetails of calculations
Equations (terms defined below or in table on previous page)
Step 1: Calculate the concentration in the pond based on the concentration in the spilled solution, the volumespilled and the volume of the pond, assuming instantaneous mixing.
Conc. (mg/L) = VS (gal.) × 3.785 L/gal × C (mg/L) ÷ VL (liters)
Step 2: Calculate the dose based on the concentration in the water, the amount of water consumed, and the bodyweight.
D (mg/kg bw) = Conc. (mg/L) × A(L) ÷ W (kg)
Calculations
Central Estimate:Use the typical field dilution, and the typical water consumption.
Step 1:Conc. (mg/L) = 200 (gal.) × 3.785 L/gal × 9.98e-04 (mg/L) ÷ 1000000 (liters) = 7.56e-07 (mg/L)
Step 2:D (mg/kg bw) = 7.56e-07 (mg/L) × 1 (L) ÷ 13.3 (kg) = 5.68e-08 (mg/kg bw) [WATCCAT]
Lower Estimate:Use the lowest estimated field dilution and the lower range of water consumption.
Step 1:Conc. (mg/L) = 200 (gal.) × 3.785 L/gal × 7.49e-05 (mg/L) ÷ 1000000 (liters) = 5.67e-08 (mg/L)
Step 2:D (mg/kg bw) = 5.67e-08 (mg/L) × 0.61 (L) ÷ 13.3 (kg) = 2.60e-09 (mg/kg bw) [WATCCAL]
Upper Estimate:Use the highest estimated field concentration and the upper range of water consumption.
Step 1:Conc. (mg/L) = 200 (gal.) × 3.785 L/gal × 1.50e-01 (mg/L) ÷ 1000000 (liters) = 1.14e-04 (mg/L)
Step 2:D (mg/kg bw) = 1.14e-04 (mg/L) × 1.5 (L) ÷ 13.3 (kg) = 1.28e-05 (mg/kg bw) [WATCCAU]
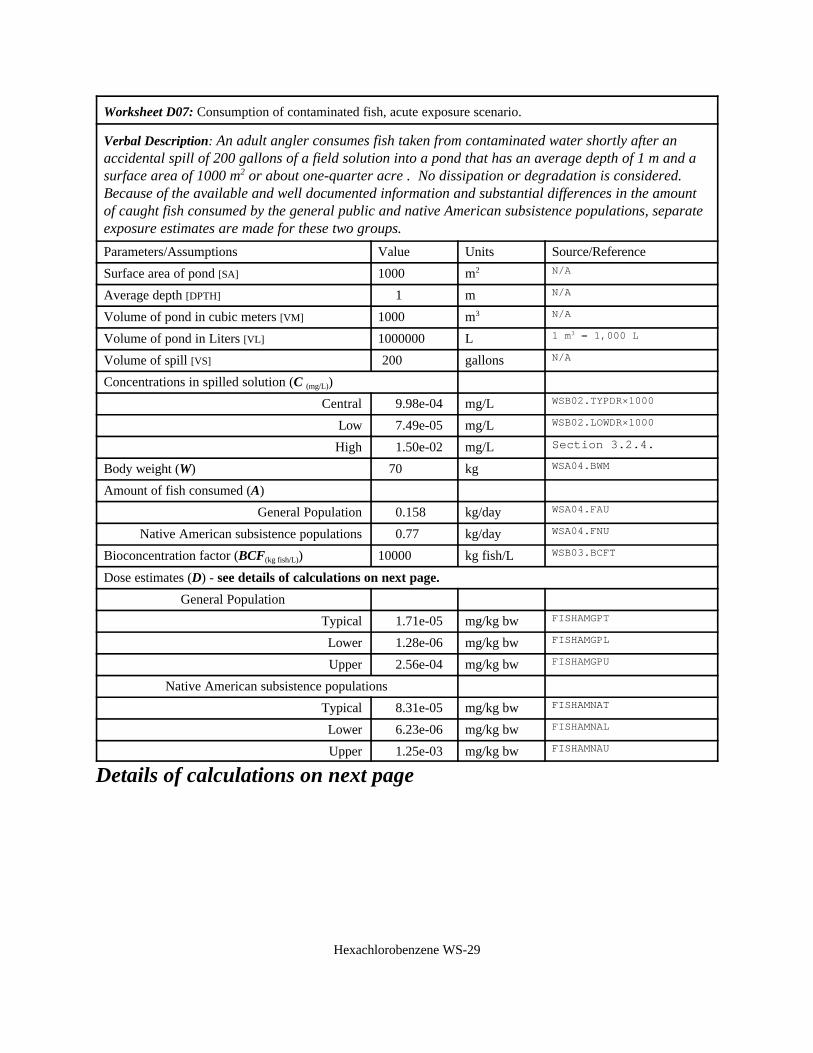
Hexachlorobenzene WS-29
Worksheet D07: Consumption of contaminated fish, acute exposure scenario.
Verbal Description: An adult angler consumes fish taken from contaminated water shortly after anaccidental spill of 200 gallons of a field solution into a pond that has an average depth of 1 m and asurface area of 1000 m2 or about one-quarter acre . No dissipation or degradation is considered. Because of the available and well documented information and substantial differences in the amountof caught fish consumed by the general public and native American subsistence populations, separateexposure estimates are made for these two groups.
Parameters/Assumptions Value Units Source/Reference
Surface area of pond [SA] 1000 m2 N/A
Average depth [DPTH] 1 m N/A
Volume of pond in cubic meters [VM] 1000 m3 N/A
Volume of pond in Liters [VL] 1000000 L 1 m3 = 1,000 L
Volume of spill [VS] 200 gallons N/A
Concentrations in spilled solution (C (mg/L))
Central 9.98e-04 mg/L WSB02.TYPDR×1000
Low 7.49e-05 mg/L WSB02.LOWDR×1000
High 1.50e-02 mg/L Section 3.2.4.
Body weight (W) 70 kg WSA04.BWM
Amount of fish consumed (A)
General Population 0.158 kg/day WSA04.FAU
Native American subsistence populations 0.77 kg/day WSA04.FNU
Bioconcentration factor (BCF(kg fish/L)) 10000 kg fish/L WSB03.BCFT
Dose estimates (D) - see details of calculations on next page.
General Population
Typical 1.71e-05 mg/kg bw FISHAMGPT
Lower 1.28e-06 mg/kg bw FISHAMGPL
Upper 2.56e-04 mg/kg bw FISHAMGPU
Native American subsistence populations
Typical 8.31e-05 mg/kg bw FISHAMNAT
Lower 6.23e-06 mg/kg bw FISHAMNAL
Upper 1.25e-03 mg/kg bw FISHAMNAU
Details of calculations on next page
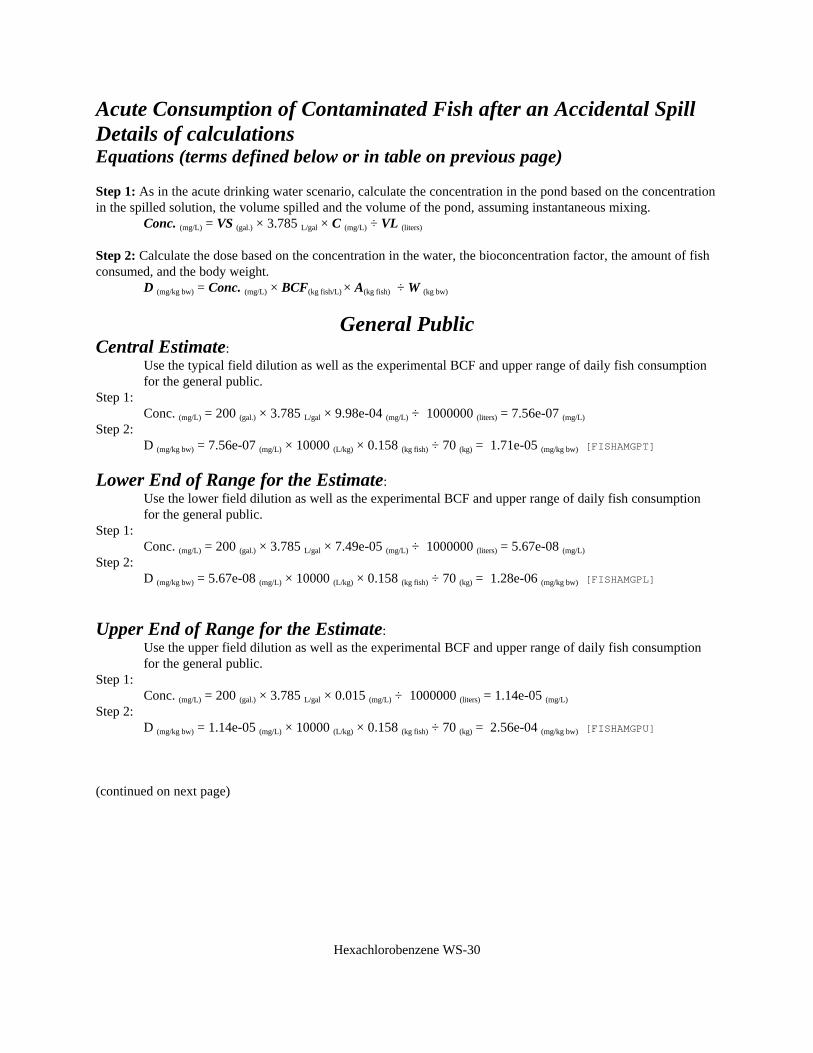
Hexachlorobenzene WS-30
Acute Consumption of Contaminated Fish after an Accidental SpillDetails of calculationsEquations (terms defined below or in table on previous page)
Step 1: As in the acute drinking water scenario, calculate the concentration in the pond based on the concentrationin the spilled solution, the volume spilled and the volume of the pond, assuming instantaneous mixing.
Conc. (mg/L) = VS (gal.) × 3.785 L/gal × C (mg/L) ÷ VL (liters)
Step 2: Calculate the dose based on the concentration in the water, the bioconcentration factor, the amount of fishconsumed, and the body weight.
D (mg/kg bw) = Conc. (mg/L) × BCF(kg fish/L) × A(kg fish) ÷ W (kg bw)
General PublicCentral Estimate:
Use the typical field dilution as well as the experimental BCF and upper range of daily fish consumptionfor the general public.
Step 1:Conc. (mg/L) = 200 (gal.) × 3.785 L/gal × 9.98e-04 (mg/L) ÷ 1000000 (liters) = 7.56e-07 (mg/L)
Step 2:D (mg/kg bw) = 7.56e-07 (mg/L) × 10000 (L/kg) × 0.158 (kg fish) ÷ 70 (kg) = 1.71e-05 (mg/kg bw) [FISHAMGPT]
Lower End of Range for the Estimate:Use the lower field dilution as well as the experimental BCF and upper range of daily fish consumptionfor the general public.
Step 1:Conc. (mg/L) = 200 (gal.) × 3.785 L/gal × 7.49e-05 (mg/L) ÷ 1000000 (liters) = 5.67e-08 (mg/L)
Step 2:D (mg/kg bw) = 5.67e-08 (mg/L) × 10000 (L/kg) × 0.158 (kg fish) ÷ 70 (kg) = 1.28e-06 (mg/kg bw) [FISHAMGPL]
Upper End of Range for the Estimate:Use the upper field dilution as well as the experimental BCF and upper range of daily fish consumptionfor the general public.
Step 1:Conc. (mg/L) = 200 (gal.) × 3.785 L/gal × 0.015 (mg/L) ÷ 1000000 (liters) = 1.14e-05 (mg/L)
Step 2:D (mg/kg bw) = 1.14e-05 (mg/L) × 10000 (L/kg) × 0.158 (kg fish) ÷ 70 (kg) = 2.56e-04 (mg/kg bw) [FISHAMGPU]
(continued on next page)
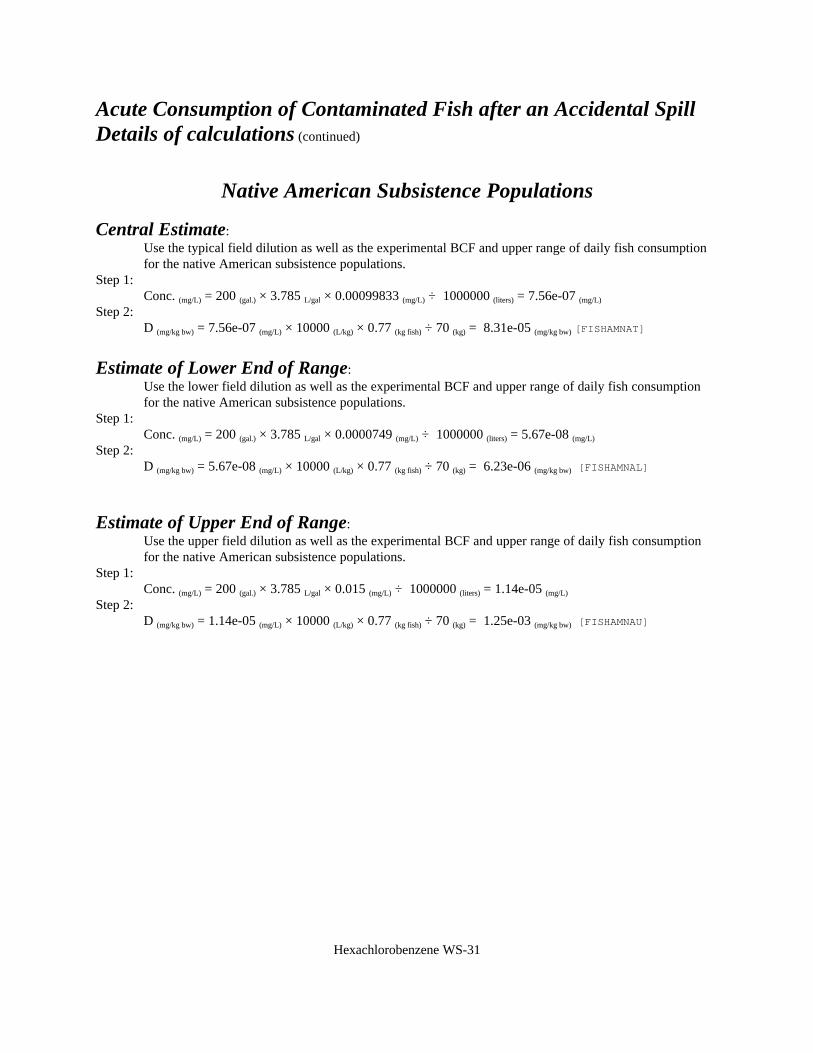
Hexachlorobenzene WS-31
Acute Consumption of Contaminated Fish after an Accidental SpillDetails of calculations (continued)
Native American Subsistence Populations
Central Estimate:Use the typical field dilution as well as the experimental BCF and upper range of daily fish consumptionfor the native American subsistence populations.
Step 1:Conc. (mg/L) = 200 (gal.) × 3.785 L/gal × 0.00099833 (mg/L) ÷ 1000000 (liters) = 7.56e-07 (mg/L)
Step 2:D (mg/kg bw) = 7.56e-07 (mg/L) × 10000 (L/kg) × 0.77 (kg fish) ÷ 70 (kg) = 8.31e-05 (mg/kg bw) [FISHAMNAT]
Estimate of Lower End of Range:Use the lower field dilution as well as the experimental BCF and upper range of daily fish consumptionfor the native American subsistence populations.
Step 1:Conc. (mg/L) = 200 (gal.) × 3.785 L/gal × 0.0000749 (mg/L) ÷ 1000000 (liters) = 5.67e-08 (mg/L)
Step 2:D (mg/kg bw) = 5.67e-08 (mg/L) × 10000 (L/kg) × 0.77 (kg fish) ÷ 70 (kg) = 6.23e-06 (mg/kg bw) [FISHAMNAL]
Estimate of Upper End of Range:Use the upper field dilution as well as the experimental BCF and upper range of daily fish consumptionfor the native American subsistence populations.
Step 1:Conc. (mg/L) = 200 (gal.) × 3.785 L/gal × 0.015 (mg/L) ÷ 1000000 (liters) = 1.14e-05 (mg/L)
Step 2:D (mg/kg bw) = 1.14e-05 (mg/L) × 10000 (L/kg) × 0.77 (kg fish) ÷ 70 (kg) = 1.25e-03 (mg/kg bw) [FISHAMNAU]
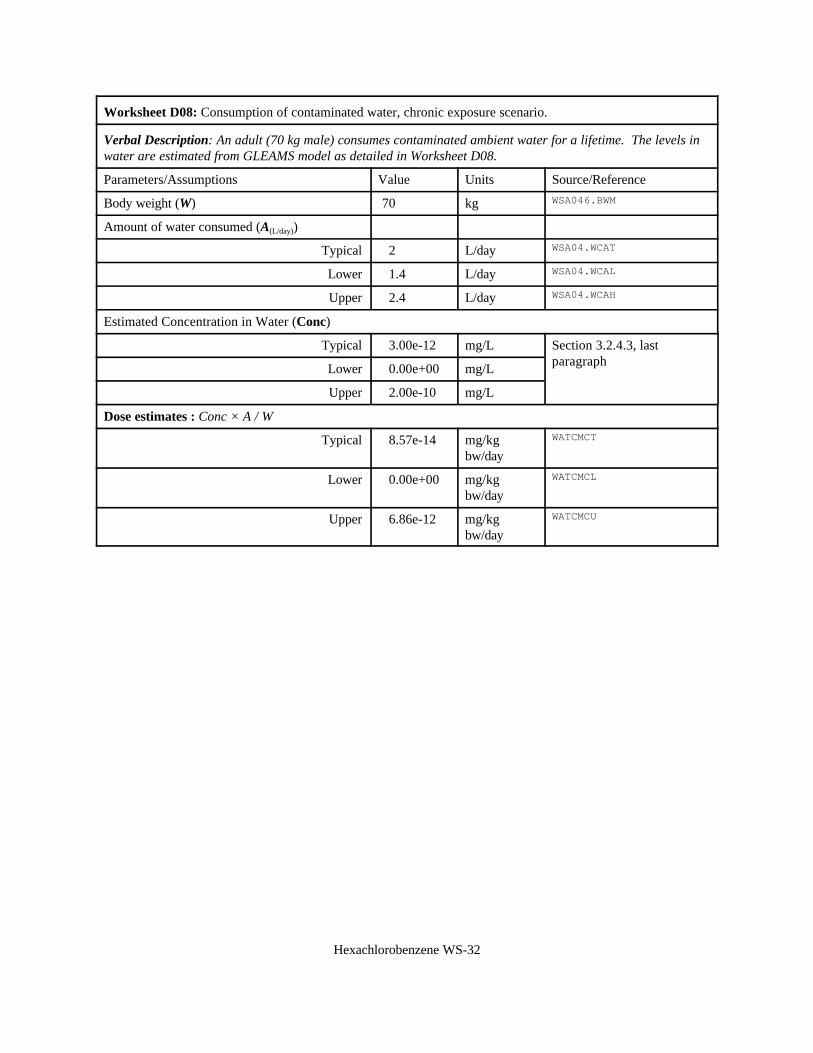
Hexachlorobenzene WS-32
Worksheet D08: Consumption of contaminated water, chronic exposure scenario.
Verbal Description: An adult (70 kg male) consumes contaminated ambient water for a lifetime. The levels inwater are estimated from GLEAMS model as detailed in Worksheet D08.
Parameters/Assumptions Value Units Source/Reference
Body weight (W) 70 kg WSA046.BWM
Amount of water consumed (A(L/day))
Typical 2 L/day WSA04.WCAT
Lower 1.4 L/day WSA04.WCAL
Upper 2.4 L/day WSA04.WCAH
Estimated Concentration in Water (Conc)
Typical 3.00e-12 mg/L Section 3.2.4.3, lastparagraph
Lower 0.00e+00 mg/L
Upper 2.00e-10 mg/L
Dose estimates : Conc × A / W
Typical 8.57e-14 mg/kgbw/day
WATCMCT
Lower 0.00e+00 mg/kgbw/day
WATCMCL
Upper 6.86e-12 mg/kgbw/day
WATCMCU
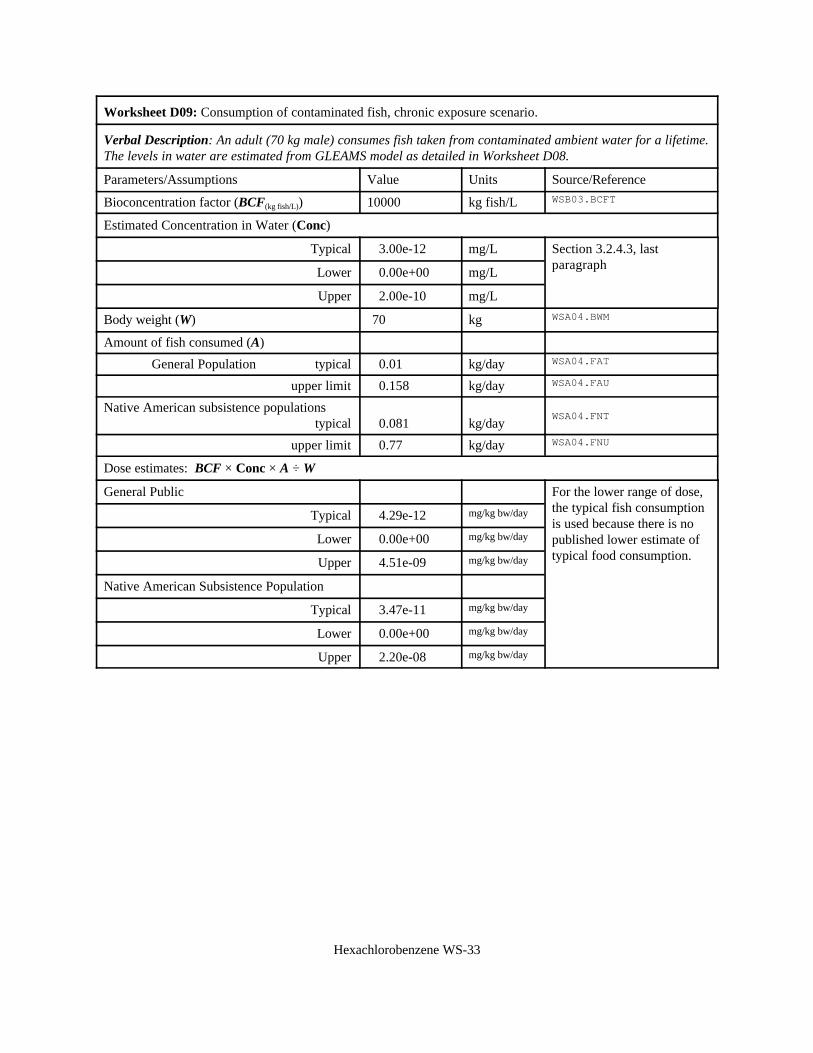
Hexachlorobenzene WS-33
Worksheet D09: Consumption of contaminated fish, chronic exposure scenario.
Verbal Description: An adult (70 kg male) consumes fish taken from contaminated ambient water for a lifetime. The levels in water are estimated from GLEAMS model as detailed in Worksheet D08.
Parameters/Assumptions Value Units Source/Reference
Bioconcentration factor (BCF(kg fish/L)) 10000 kg fish/L WSB03.BCFT
Estimated Concentration in Water (Conc)
Typical 3.00e-12 mg/L Section 3.2.4.3, lastparagraph
Lower 0.00e+00 mg/L
Upper 2.00e-10 mg/L
Body weight (W) 70 kg WSA04.BWM
Amount of fish consumed (A)
General Population typical 0.01 kg/day WSA04.FAT
upper limit 0.158 kg/day WSA04.FAU
Native American subsistence populationstypical 0.081 kg/day
WSA04.FNT
upper limit 0.77 kg/day WSA04.FNU
Dose estimates: BCF × Conc × A ÷ W
General Public For the lower range of dose,the typical fish consumptionis used because there is nopublished lower estimate oftypical food consumption.
Typical 4.29e-12 mg/kg bw/day
Lower 0.00e+00 mg/kg bw/day
Upper 4.51e-09 mg/kg bw/day
Native American Subsistence Population
Typical 3.47e-11 mg/kg bw/day
Lower 0.00e+00 mg/kg bw/day
Upper 2.20e-08 mg/kg bw/day
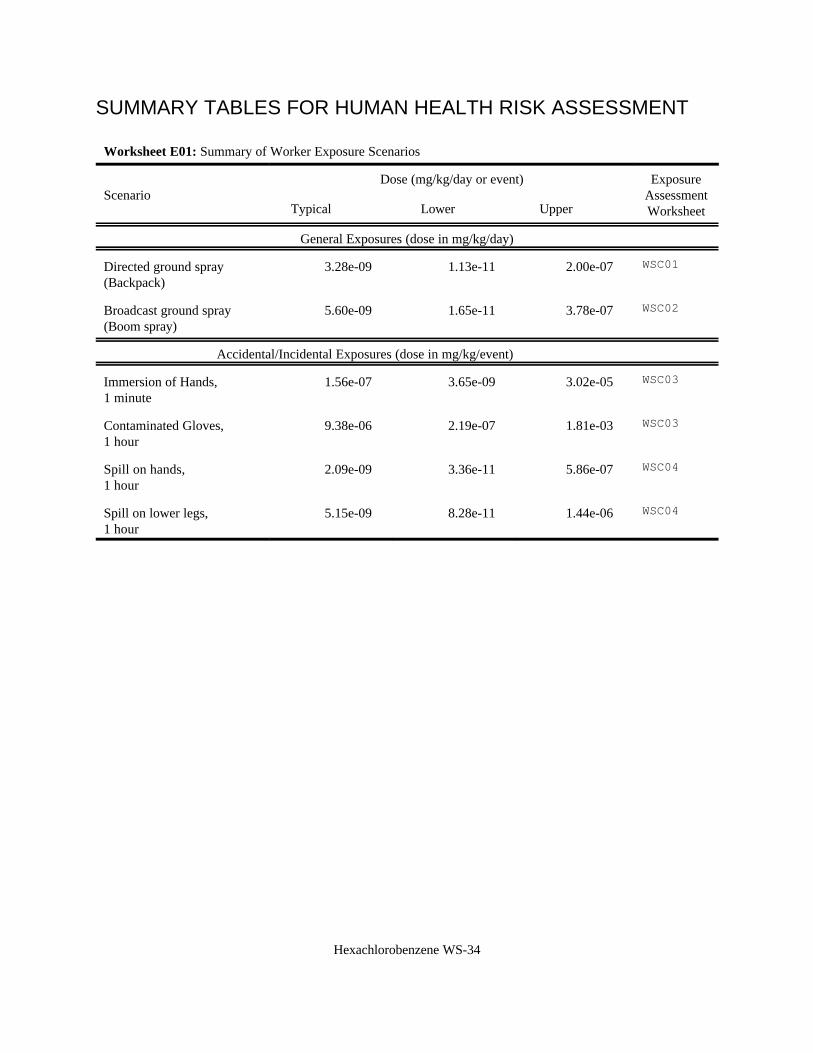
Hexachlorobenzene WS-34
SUMMARY TABLES FOR HUMAN HEALTH RISK ASSESSMENT
Worksheet E01: Summary of Worker Exposure Scenarios
ScenarioDose (mg/kg/day or event) Exposure
AssessmentWorksheetTypical Lower Upper
General Exposures (dose in mg/kg/day)
Directed ground spray(Backpack)
3.28e-09 1.13e-11 2.00e-07 WSC01
Broadcast ground spray(Boom spray)
5.60e-09 1.65e-11 3.78e-07 WSC02
Accidental/Incidental Exposures (dose in mg/kg/event)
Immersion of Hands, 1 minute
1.56e-07 3.65e-09 3.02e-05 WSC03
Contaminated Gloves,1 hour
9.38e-06 2.19e-07 1.81e-03 WSC03
Spill on hands,1 hour
2.09e-09 3.36e-11 5.86e-07 WSC04
Spill on lower legs, 1 hour
5.15e-09 8.28e-11 1.44e-06 WSC04
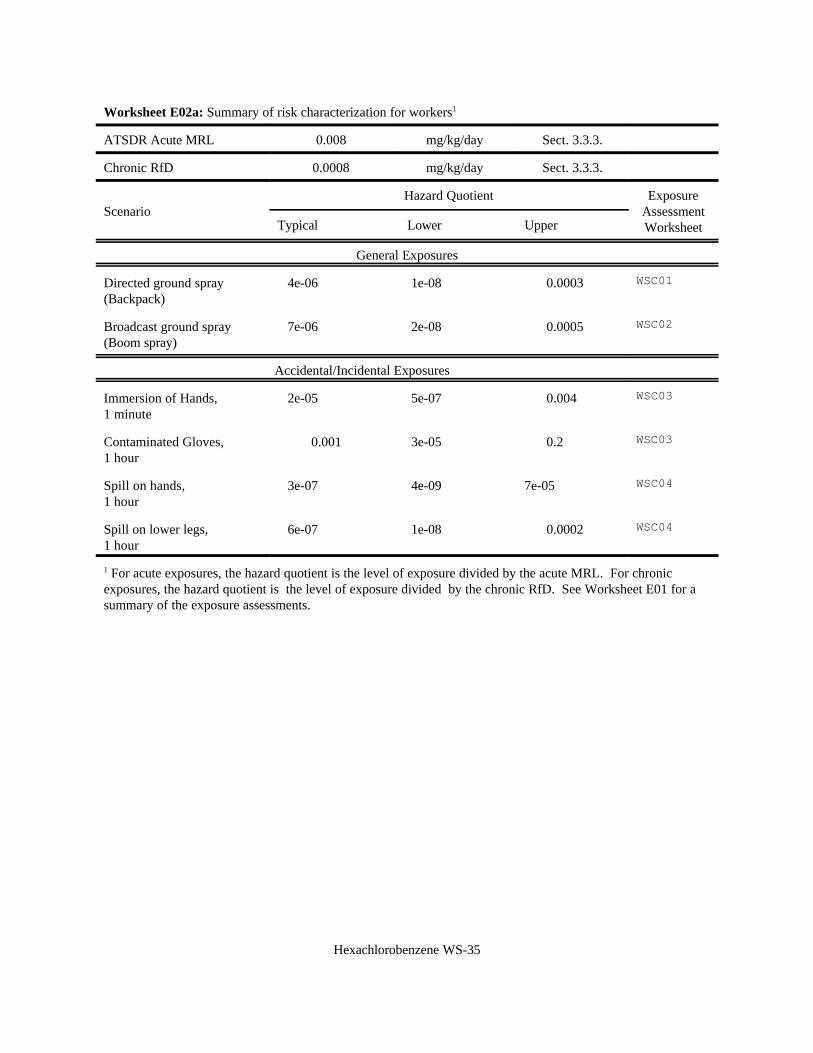
Hexachlorobenzene WS-35
Worksheet E02a: Summary of risk characterization for workers1
ATSDR Acute MRL 0.008 mg/kg/day Sect. 3.3.3.
Chronic RfD 0.0008 mg/kg/day Sect. 3.3.3.
ScenarioHazard Quotient Exposure
AssessmentWorksheetTypical Lower Upper
General Exposures
Directed ground spray(Backpack)
4e-06 1e-08 0.0003 WSC01
Broadcast ground spray(Boom spray)
7e-06 2e-08 0.0005 WSC02
Accidental/Incidental Exposures
Immersion of Hands, 1 minute
2e-05 5e-07 0.004 WSC03
Contaminated Gloves,1 hour
0.001 3e-05 0.2 WSC03
Spill on hands,1 hour
3e-07 4e-09 7e-05 WSC04
Spill on lower legs, 1 hour
6e-07 1e-08 0.0002 WSC04
1 For acute exposures, the hazard quotient is the level of exposure divided by the acute MRL. For chronicexposures, the hazard quotient is the level of exposure divided by the chronic RfD. See Worksheet E01 for asummary of the exposure assessments.
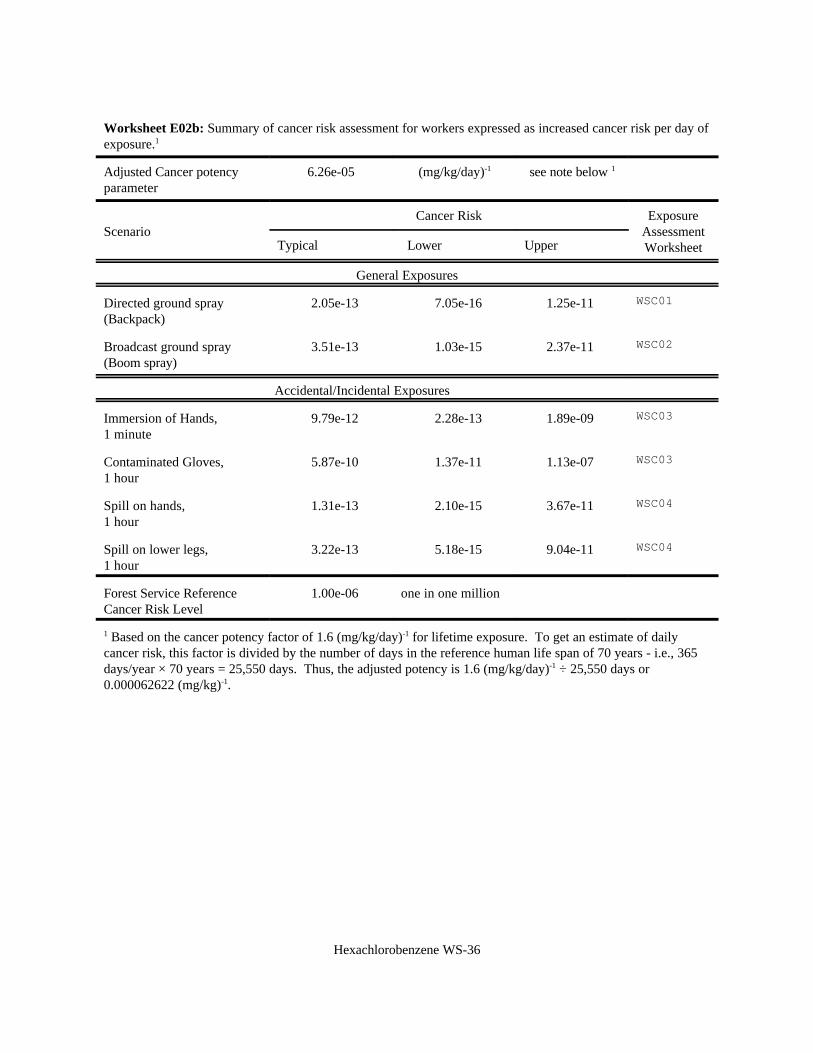
Hexachlorobenzene WS-36
Worksheet E02b: Summary of cancer risk assessment for workers expressed as increased cancer risk per day ofexposure.1
Adjusted Cancer potencyparameter
6.26e-05 (mg/kg/day)-1 see note below 1
ScenarioCancer Risk Exposure
AssessmentWorksheetTypical Lower Upper
General Exposures
Directed ground spray(Backpack)
2.05e-13 7.05e-16 1.25e-11 WSC01
Broadcast ground spray(Boom spray)
3.51e-13 1.03e-15 2.37e-11 WSC02
Accidental/Incidental Exposures
Immersion of Hands, 1 minute
9.79e-12 2.28e-13 1.89e-09 WSC03
Contaminated Gloves,1 hour
5.87e-10 1.37e-11 1.13e-07 WSC03
Spill on hands,1 hour
1.31e-13 2.10e-15 3.67e-11 WSC04
Spill on lower legs, 1 hour
3.22e-13 5.18e-15 9.04e-11 WSC04
Forest Service ReferenceCancer Risk Level
1.00e-06 one in one million
1 Based on the cancer potency factor of 1.6 (mg/kg/day)-1 for lifetime exposure. To get an estimate of dailycancer risk, this factor is divided by the number of days in the reference human life span of 70 years - i.e., 365days/year × 70 years = 25,550 days. Thus, the adjusted potency is 1.6 (mg/kg/day)-1 ÷ 25,550 days or0.000062622 (mg/kg)-1.
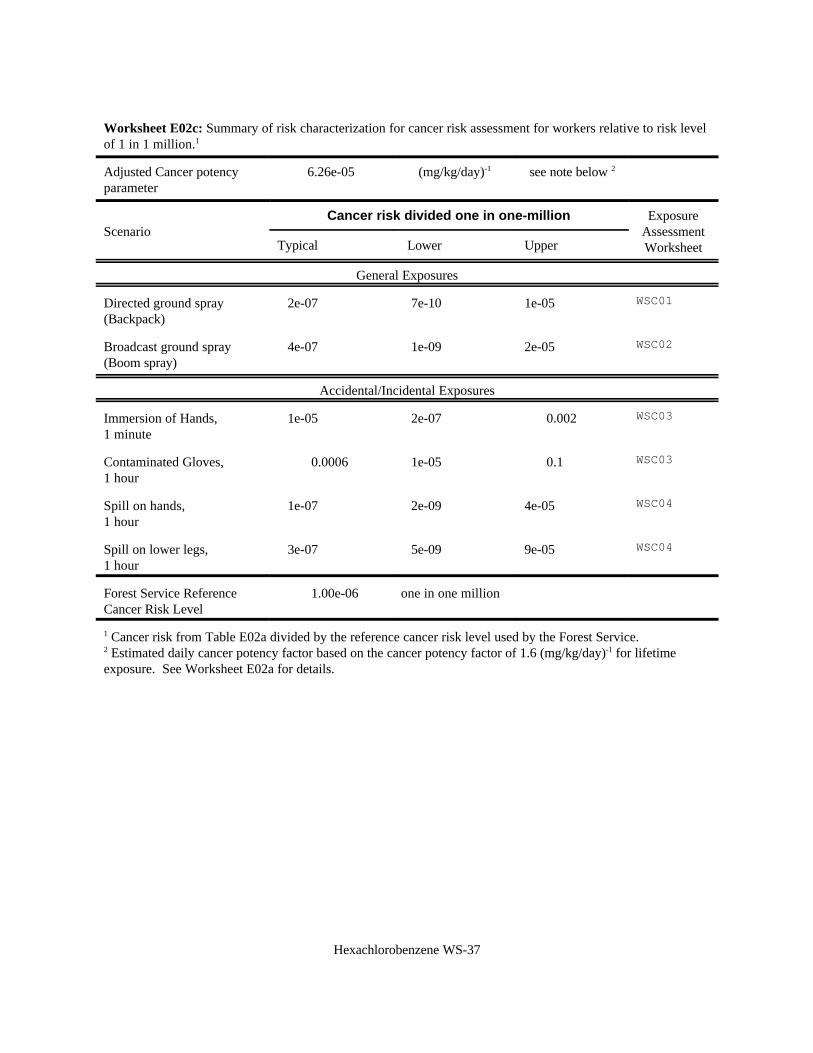
Hexachlorobenzene WS-37
Worksheet E02c: Summary of risk characterization for cancer risk assessment for workers relative to risk levelof 1 in 1 million.1
Adjusted Cancer potencyparameter
6.26e-05 (mg/kg/day)-1 see note below 2
ScenarioCancer risk divided one in one-million Exposure
AssessmentWorksheetTypical Lower Upper
General Exposures
Directed ground spray(Backpack)
2e-07 7e-10 1e-05 WSC01
Broadcast ground spray(Boom spray)
4e-07 1e-09 2e-05 WSC02
Accidental/Incidental Exposures
Immersion of Hands, 1 minute
1e-05 2e-07 0.002 WSC03
Contaminated Gloves,1 hour
0.0006 1e-05 0.1 WSC03
Spill on hands,1 hour
1e-07 2e-09 4e-05 WSC04
Spill on lower legs, 1 hour
3e-07 5e-09 9e-05 WSC04
Forest Service ReferenceCancer Risk Level
1.00e-06 one in one million
1 Cancer risk from Table E02a divided by the reference cancer risk level used by the Forest Service.2 Estimated daily cancer potency factor based on the cancer potency factor of 1.6 (mg/kg/day)-1 for lifetimeexposure. See Worksheet E02a for details.
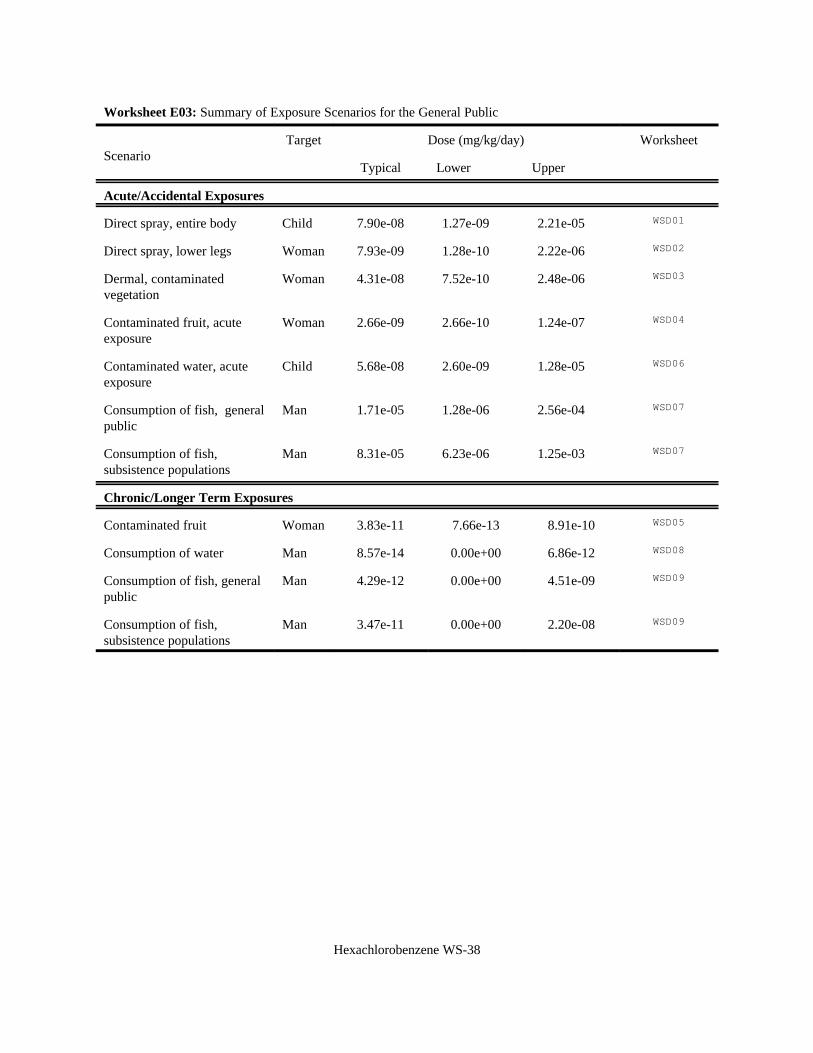
Hexachlorobenzene WS-38
Worksheet E03: Summary of Exposure Scenarios for the General Public
ScenarioTarget Dose (mg/kg/day) Worksheet
Typical Lower Upper
Acute/Accidental Exposures
Direct spray, entire body Child 7.90e-08 1.27e-09 2.21e-05 WSD01
Direct spray, lower legs Woman 7.93e-09 1.28e-10 2.22e-06 WSD02
Dermal, contaminatedvegetation
Woman 4.31e-08 7.52e-10 2.48e-06 WSD03
Contaminated fruit, acuteexposure
Woman 2.66e-09 2.66e-10 1.24e-07 WSD04
Contaminated water, acuteexposure
Child 5.68e-08 2.60e-09 1.28e-05 WSD06
Consumption of fish, generalpublic
Man 1.71e-05 1.28e-06 2.56e-04 WSD07
Consumption of fish,subsistence populations
Man 8.31e-05 6.23e-06 1.25e-03 WSD07
Chronic/Longer Term Exposures
Contaminated fruit Woman 3.83e-11 7.66e-13 8.91e-10 WSD05
Consumption of water Man 8.57e-14 0.00e+00 6.86e-12 WSD08
Consumption of fish, generalpublic
Man 4.29e-12 0.00e+00 4.51e-09 WSD09
Consumption of fish,subsistence populations
Man 3.47e-11 0.00e+00 2.20e-08 WSD09
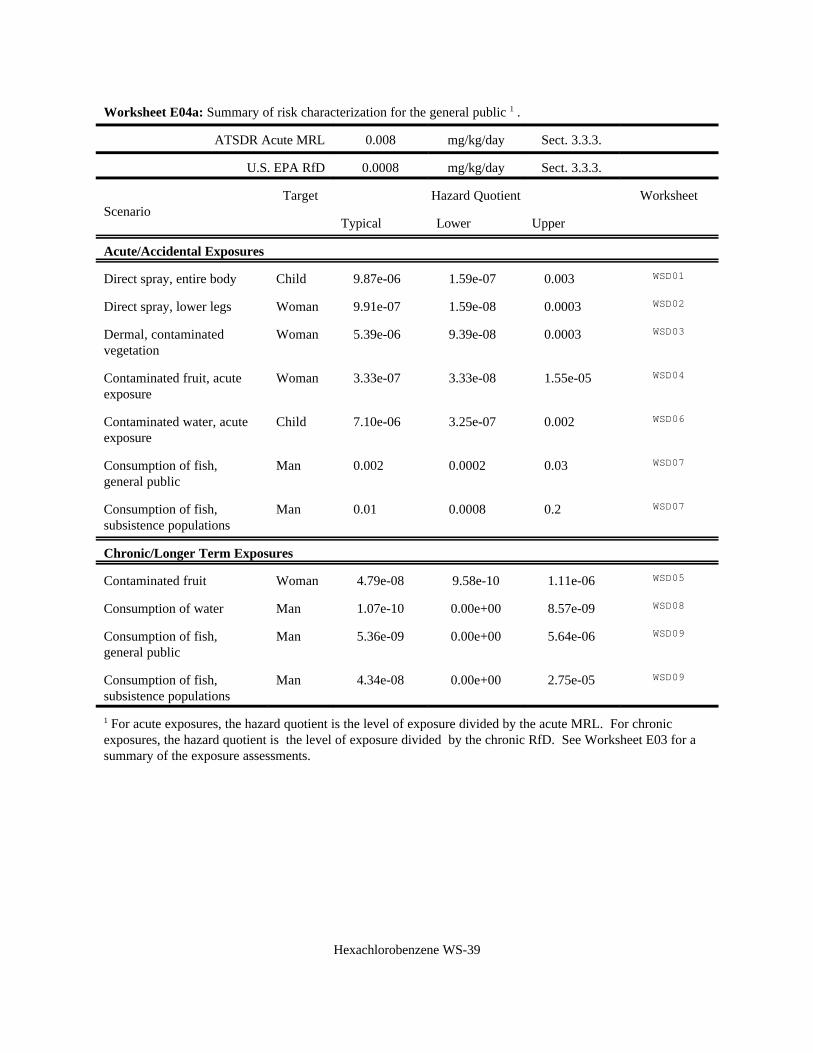
Hexachlorobenzene WS-39
Worksheet E04a: Summary of risk characterization for the general public 1 .
ATSDR Acute MRL 0.008 mg/kg/day Sect. 3.3.3.
U.S. EPA RfD 0.0008 mg/kg/day Sect. 3.3.3.
ScenarioTarget Hazard Quotient Worksheet
Typical Lower Upper
Acute/Accidental Exposures
Direct spray, entire body Child 9.87e-06 1.59e-07 0.003 WSD01
Direct spray, lower legs Woman 9.91e-07 1.59e-08 0.0003 WSD02
Dermal, contaminatedvegetation
Woman 5.39e-06 9.39e-08 0.0003 WSD03
Contaminated fruit, acuteexposure
Woman 3.33e-07 3.33e-08 1.55e-05 WSD04
Contaminated water, acuteexposure
Child 7.10e-06 3.25e-07 0.002 WSD06
Consumption of fish, general public
Man 0.002 0.0002 0.03 WSD07
Consumption of fish,subsistence populations
Man 0.01 0.0008 0.2 WSD07
Chronic/Longer Term Exposures
Contaminated fruit Woman 4.79e-08 9.58e-10 1.11e-06 WSD05
Consumption of water Man 1.07e-10 0.00e+00 8.57e-09 WSD08
Consumption of fish,general public
Man 5.36e-09 0.00e+00 5.64e-06 WSD09
Consumption of fish,subsistence populations
Man 4.34e-08 0.00e+00 2.75e-05 WSD09
1 For acute exposures, the hazard quotient is the level of exposure divided by the acute MRL. For chronicexposures, the hazard quotient is the level of exposure divided by the chronic RfD. See Worksheet E03 for asummary of the exposure assessments.
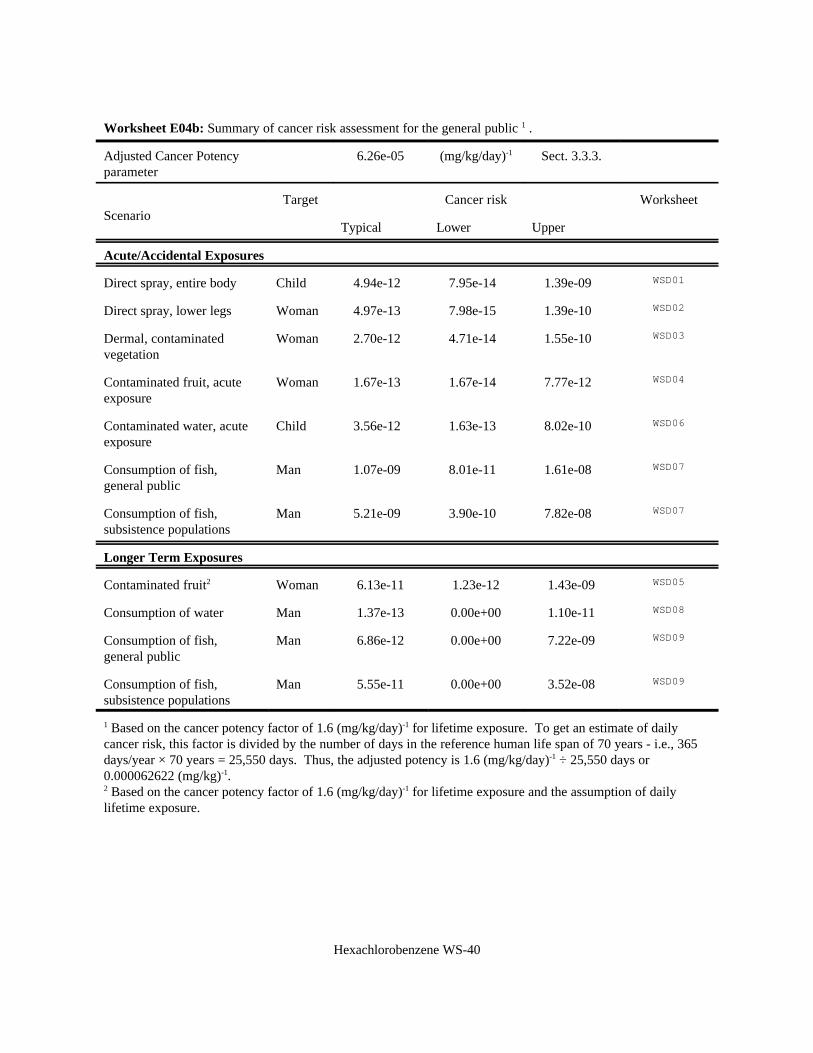
Hexachlorobenzene WS-40
Worksheet E04b: Summary of cancer risk assessment for the general public 1 .
Adjusted Cancer Potencyparameter
6.26e-05 (mg/kg/day)-1 Sect. 3.3.3.
ScenarioTarget Cancer risk Worksheet
Typical Lower Upper
Acute/Accidental Exposures
Direct spray, entire body Child 4.94e-12 7.95e-14 1.39e-09 WSD01
Direct spray, lower legs Woman 4.97e-13 7.98e-15 1.39e-10 WSD02
Dermal, contaminatedvegetation
Woman 2.70e-12 4.71e-14 1.55e-10 WSD03
Contaminated fruit, acuteexposure
Woman 1.67e-13 1.67e-14 7.77e-12 WSD04
Contaminated water, acuteexposure
Child 3.56e-12 1.63e-13 8.02e-10 WSD06
Consumption of fish, general public
Man 1.07e-09 8.01e-11 1.61e-08 WSD07
Consumption of fish,subsistence populations
Man 5.21e-09 3.90e-10 7.82e-08 WSD07
Longer Term Exposures
Contaminated fruit2 Woman 6.13e-11 1.23e-12 1.43e-09 WSD05
Consumption of water Man 1.37e-13 0.00e+00 1.10e-11 WSD08
Consumption of fish,general public
Man 6.86e-12 0.00e+00 7.22e-09 WSD09
Consumption of fish,subsistence populations
Man 5.55e-11 0.00e+00 3.52e-08 WSD09
1 Based on the cancer potency factor of 1.6 (mg/kg/day)-1 for lifetime exposure. To get an estimate of dailycancer risk, this factor is divided by the number of days in the reference human life span of 70 years - i.e., 365days/year × 70 years = 25,550 days. Thus, the adjusted potency is 1.6 (mg/kg/day)-1 ÷ 25,550 days or0.000062622 (mg/kg)-1.2 Based on the cancer potency factor of 1.6 (mg/kg/day)-1 for lifetime exposure and the assumption of dailylifetime exposure.
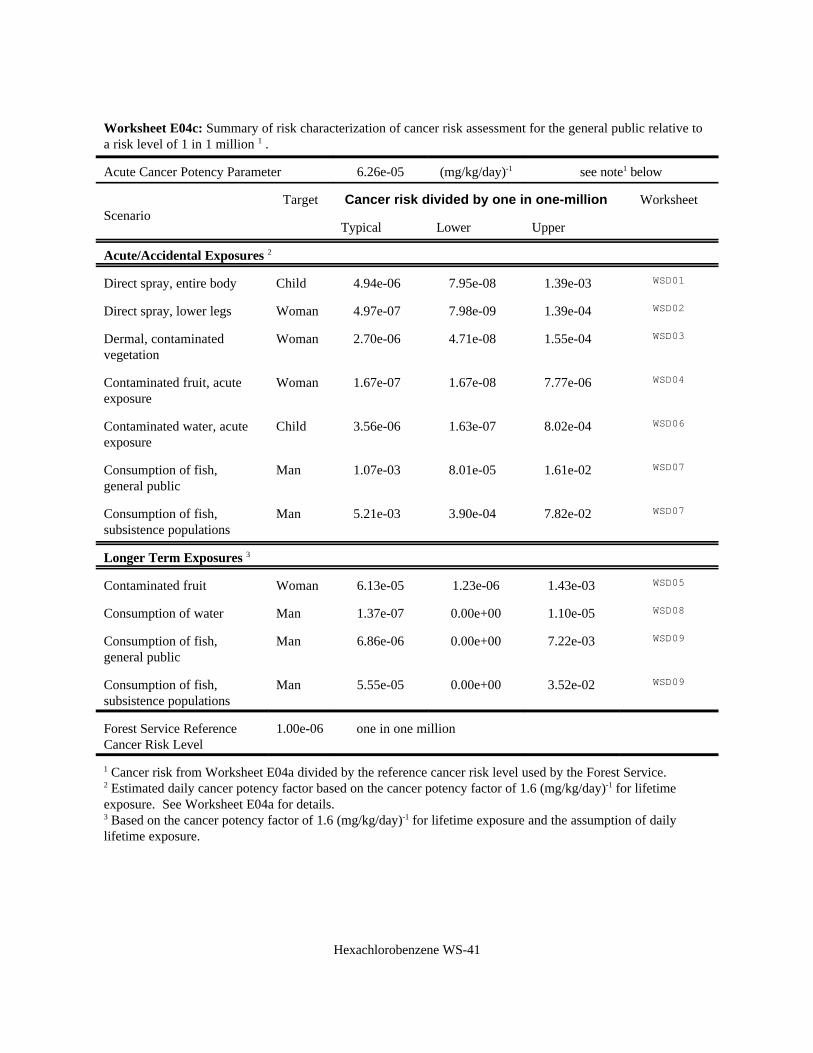
Hexachlorobenzene WS-41
Worksheet E04c: Summary of risk characterization of cancer risk assessment for the general public relative toa risk level of 1 in 1 million 1 .
Acute Cancer Potency Parameter 6.26e-05 (mg/kg/day)-1 see note1 below
ScenarioTarget Cancer risk divided by one in one-million Worksheet
Typical Lower Upper
Acute/Accidental Exposures 2
Direct spray, entire body Child 4.94e-06 7.95e-08 1.39e-03 WSD01
Direct spray, lower legs Woman 4.97e-07 7.98e-09 1.39e-04 WSD02
Dermal, contaminatedvegetation
Woman 2.70e-06 4.71e-08 1.55e-04 WSD03
Contaminated fruit, acuteexposure
Woman 1.67e-07 1.67e-08 7.77e-06 WSD04
Contaminated water, acuteexposure
Child 3.56e-06 1.63e-07 8.02e-04 WSD06
Consumption of fish, general public
Man 1.07e-03 8.01e-05 1.61e-02 WSD07
Consumption of fish,subsistence populations
Man 5.21e-03 3.90e-04 7.82e-02 WSD07
Longer Term Exposures 3
Contaminated fruit Woman 6.13e-05 1.23e-06 1.43e-03 WSD05
Consumption of water Man 1.37e-07 0.00e+00 1.10e-05 WSD08
Consumption of fish,general public
Man 6.86e-06 0.00e+00 7.22e-03 WSD09
Consumption of fish,subsistence populations
Man 5.55e-05 0.00e+00 3.52e-02 WSD09
Forest Service ReferenceCancer Risk Level
1.00e-06 one in one million
1 Cancer risk from Worksheet E04a divided by the reference cancer risk level used by the Forest Service.2 Estimated daily cancer potency factor based on the cancer potency factor of 1.6 (mg/kg/day)-1 for lifetimeexposure. See Worksheet E04a for details.3 Based on the cancer potency factor of 1.6 (mg/kg/day)-1 for lifetime exposure and the assumption of dailylifetime exposure.