Embed Size (px)
Citation preview
Contents of this document are for non-US residents only
Wealth and Investment
Management
Important Information: Please note that the contents of this document are intended for non-US residents only.
In Focus: Markets as we see them
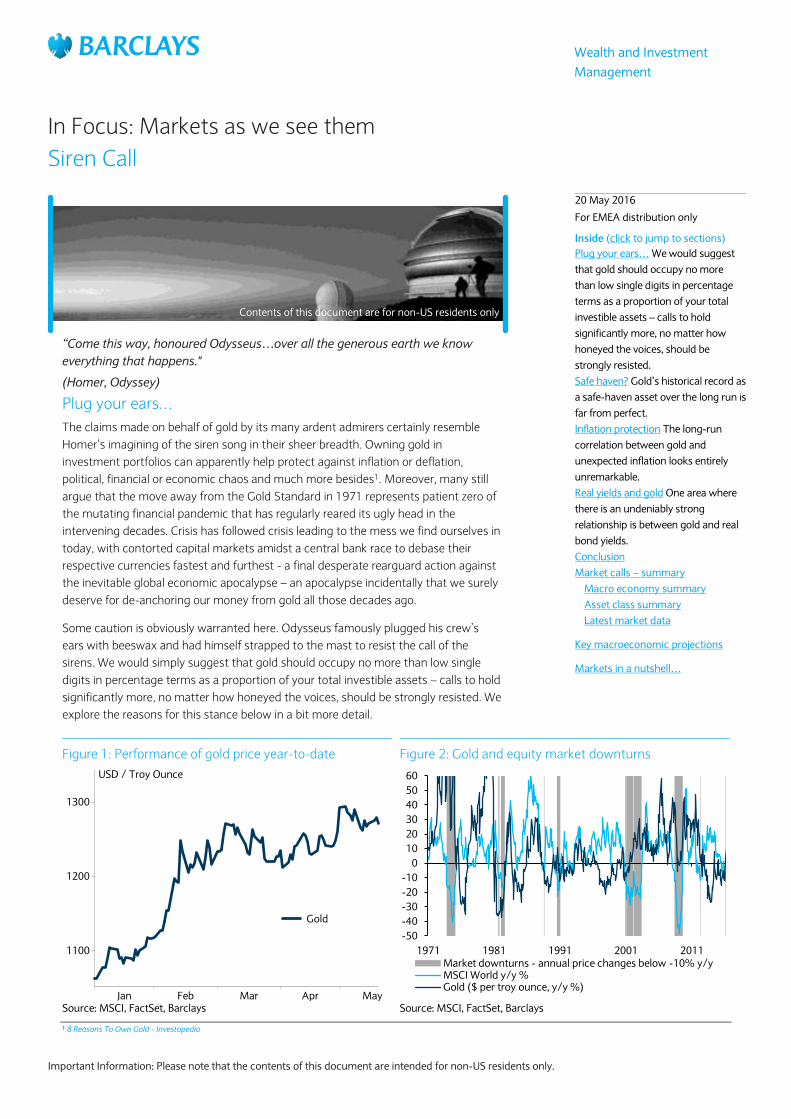
Siren Call
“Come this way, honoured Odysseus…over all the generous earth we know
everything that happens."
(Homer, Odyssey)
Plug your ears…
The claims made on behalf of gold by its many ardent admirers certainly resemble
Homer’s imagining of the siren song in their sheer breadth. Owning gold in
investment portfolios can apparently help protect against inflation or deflation,
political, financial or economic chaos and much more besides1. Moreover, many still
argue that the move away from the Gold Standard in 1971 represents patient zero of
the mutating financial pandemic that has regularly reared its ugly head in the
intervening decades. Crisis has followed crisis leading to the mess we find ourselves in
today, with contorted capital markets amidst a central bank race to debase their
respective currencies fastest and furthest - a final desperate rearguard action against
the inevitable global economic apocalypse – an apocalypse incidentally that we surely
deserve for de-anchoring our money from gold all those decades ago.
Some caution is obviously warranted here. Odysseus famously plugged his crew’s
ears with beeswax and had himself strapped to the mast to resist the call of the
sirens. We would simply suggest that gold should occupy no more than low single
digits in percentage terms as a proportion of your total investible assets – calls to hold
significantly more, no matter how honeyed the voices, should be strongly resisted. We
explore the reasons for this stance below in a bit more detail.
1 8 Reasons To Own Gold - Investopedia
20 May 2016
For EMEA distribution only
Inside (click to jump to sections)
Plug your ears… We would suggest
that gold should occupy no more
than low single digits in percentage
terms as a proportion of your total
investible assets – calls to hold
significantly more, no matter how
honeyed the voices, should be
strongly resisted.
Safe haven? Gold’s historical record as
a safe-haven asset over the long run is
far from perfect.
Inflation protection The long-run
correlation between gold and
unexpected inflation looks entirely
unremarkable.
Real yields and gold One area where
there is an undeniably strong
relationship is between gold and real
bond yields.
Conclusion
Market calls – summary
Macro economy summary
Asset class summary
Latest market data
Key macroeconomic projections
Markets in a nutshell…
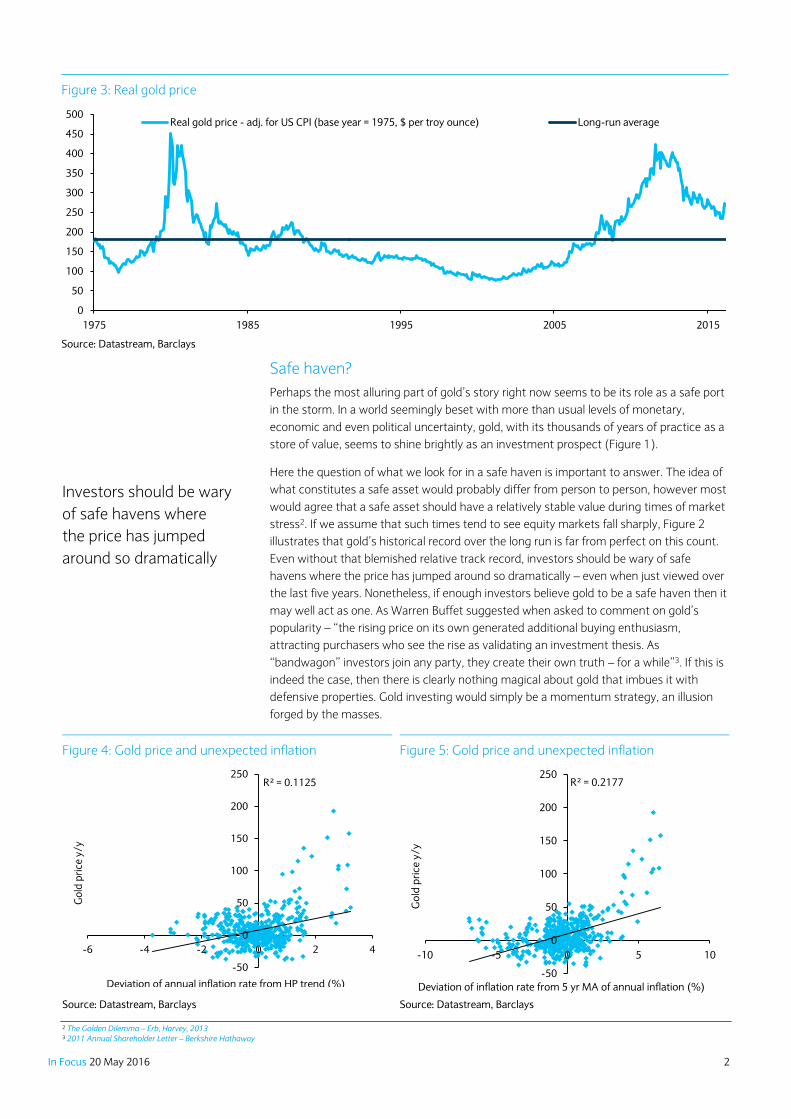
Figure 1: Performance of gold price year-to-date Figure 2: Gold and equity market downturns
Source: MSCI, FactSet, Barclays Source: MSCI, FactSet, Barclays
1100
1300
1200
Mar Apr May
2016
Jan Feb
Gold
USD / Troy Ounce
-50
-40
-30
-20
-10
0
10
20
30
40
50
60
1971 1981 1991 2001 2011Market downturns - annual price changes below -10% y/yMSCI World y/y %Gold ($ per troy ounce, y/y %)
In Focus 20 May 2016 2
Safe haven?
Perhaps the most alluring part of gold’s story right now seems to be its role as a safe port
in the storm. In a world seemingly beset with more than usual levels of monetary,
economic and even political uncertainty, gold, with its thousands of years of practice as a
store of value, seems to shine brightly as an investment prospect (Figure 1).
Here the question of what we look for in a safe haven is important to answer. The idea of
what constitutes a safe asset would probably differ from person to person, however most
would agree that a safe asset should have a relatively stable value during times of market
stress2. If we assume that such times tend to see equity markets fall sharply, Figure 2
illustrates that gold’s historical record over the long run is far from perfect on this count.
Even without that blemished relative track record, investors should be wary of safe
havens where the price has jumped around so dramatically – even when just viewed over
the last five years. Nonetheless, if enough investors believe gold to be a safe haven then it
may well act as one. As Warren Buffet suggested when asked to comment on gold’s
popularity – “the rising price on its own generated additional buying enthusiasm,
attracting purchasers who see the rise as validating an investment thesis. As
“bandwagon” investors join any party, they create their own truth – for a while”3. If this is
indeed the case, then there is clearly nothing magical about gold that imbues it with
defensive properties. Gold investing would simply be a momentum strategy, an illusion
forged by the masses.
2 The Golden Dilemma – Erb, Harvey, 2013 3 2011 Annual Shareholder Letter – Berkshire Hathaway
Figure 4: Gold price and unexpected inflation Figure 5: Gold price and unexpected inflation
Source: Datastream, Barclays Source: Datastream, Barclays
R² = 0.1125
-50
0
50
100
150
200
250
-6 -4 -2 0 2 4
Go
ld p
rice
y/
y
Deviation of annual inflation rate from HP trend (%)
R² = 0.2177
-50
0
50
100
150
200
250
-10 -5 0 5 10
Go
ld p
ric
e y
/y
Deviation of inflation rate from 5 yr MA of annual inflation (%)
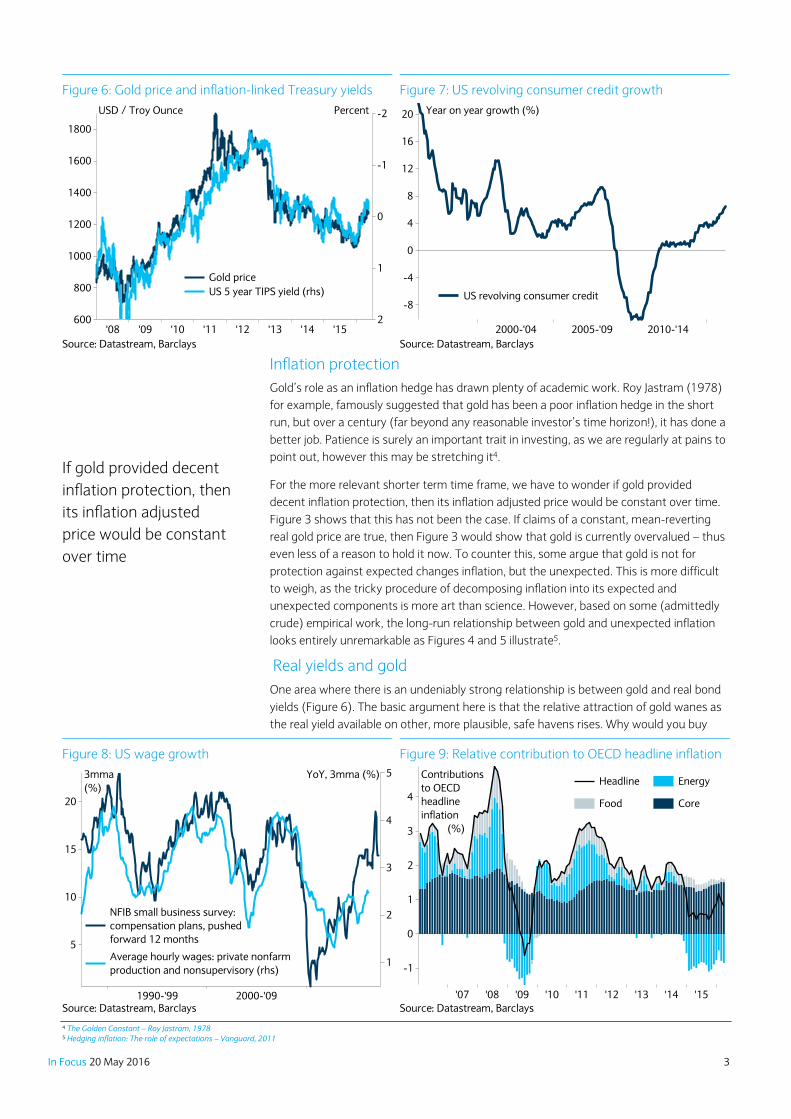
Figure 3: Real gold price
Source: Datastream, Barclays
0
50
100
150
200
250
300
350
400
450
500
1975 1985 1995 2005 2015
Real gold price - adj. for US CPI (base year = 1975, $ per troy ounce) Long-run average
Investors should be wary
of safe havens where
the price has jumped
around so dramatically
In Focus 20 May 2016 3
Inflation protection
Gold’s role as an inflation hedge has drawn plenty of academic work. Roy Jastram (1978)
for example, famously suggested that gold has been a poor inflation hedge in the short
run, but over a century (far beyond any reasonable investor’s time horizon!), it has done a
better job. Patience is surely an important trait in investing, as we are regularly at pains to
point out, however this may be stretching it4.
For the more relevant shorter term time frame, we have to wonder if gold provided
decent inflation protection, then its inflation adjusted price would be constant over time.
Figure 3 shows that this has not been the case. If claims of a constant, mean-reverting
real gold price are true, then Figure 3 would show that gold is currently overvalued – thus
even less of a reason to hold it now. To counter this, some argue that gold is not for
protection against expected changes inflation, but the unexpected. This is more difficult
to weigh, as the tricky procedure of decomposing inflation into its expected and
unexpected components is more art than science. However, based on some (admittedly
crude) empirical work, the long-run relationship between gold and unexpected inflation
looks entirely unremarkable as Figures 4 and 5 illustrate5.
Real yields and gold
One area where there is an undeniably strong relationship is between gold and real bond
yields (Figure 6). The basic argument here is that the relative attraction of gold wanes as
the real yield available on other, more plausible, safe havens rises. Why would you buy
4 The Golden Constant – Roy Jastram, 1978 5 Hedging inflation: The role of expectations – Vanguard, 2011
Figure 8: US wage growth Figure 9: Relative contribution to OECD headline inflation
Source: Datastream, Barclays Source: Datastream, Barclays
5
10
15
20
2
3
4
5
1
1990-'99 2000-'09
NFIB small business survey:
compensation plans, pushed
forward 12 months
Average hourly wages: private nonfarm
production and nonsupervisory (rhs)
3mma
(%)
YoY, 3mma (%)
0
2
3
4
1
-1
'13'12'11'10'09 '15'08 '14'07
Headline
Food
Energy
Core
Contributions
to OECD
headline
inflation
(%)
Figure 6: Gold price and inflation-linked Treasury yields Figure 7: US revolving consumer credit growth
Source: Datastream, Barclays Source: Datastream, Barclays
800
1600
1800
1000
600
1200
1400
0
2
-2
1
-1
'13'12'11'10'09 '15'08 '14
Gold price
US 5 year TIPS yield (rhs)
USD / Troy Ounce Percent
0
4
-4
8
-8
12
16
20
2005-'09 2010-'142000-'04
US revolving consumer credit
Year on year growth (%)
If gold provided decent
inflation protection, then
its inflation adjusted
price would be constant
over time
In Focus 20 May 2016 4
gold, which throws off no cashflows or coupons, when you can lend the US government
money with a yield above inflation so to speak? As real and nominal bond yields have
plunged lower this year, gold has prospered.
So what are the chances that this will remain the case? Real and nominal yields to remain
depressed allowing gold to continue to shine in portfolios? Readers will know well that we
see inflation picking up over the course of the year, particularly in the US economy.
Revolving credit is picking up (Figure 7), wages are too (Figure 8) and just as oil prices
exerted significant downwards pressure on inflation indices over the last 2 years (Figure
9), so will they exert upward pressure as we continue to annualize those dramatic falls.
Figure 10 represents a very rough guess at the potential effects on US inflation, all else
being equal, if oil prices just stay where they are through this year.
So assuming this is right and inflation does start to pick up, does this mean that real
yields will move higher? We have suggested that even with the return of some inflation,
the bond market may not become disorderly, with levels of central bank ownership
important. Nonetheless, term premia 6have been falling alongside inflation for the last
several decades to now pretty invisible levels (Figure 11)7. We suspect that as inflation
starts to return, a less historically remarkable term premium for government bonds may
also follow, pushing real yields higher. We would hesitate to suggest how quickly such a
risk premium would return, however, this sits behind our recommendation that gold
should not occupy large parts of diversified investment portfolio. Claims on its behalf look
6 Term premium - the compensation that investors require for bearing the risk that short-term Treasury yields do not evolve as they expected 7 Treasury Term Premia – Federal Reserve Bank of New York
Figure 11: US term premia
Source: Datastream, Barclays
-1
0
1
2
3
4
5
6
1961 1971 1981 1991 2001 2011
US 1y Treasury term premium US 5y Treasury term premium US 10y Treasury term premium %
Figure 10: US headline inflation, assuming oil price maintains current price of $50/bbl
Source: Datastream, Barclays
-3
-2
-1
0
1
2
3
4
5
6
7
Jan-00 Jan-03 Jan-06 Jan-09 Jan-12 Jan-15
US CPI y/y % US CPI y/y % - assuming brent oil price remains constant at 50$ until March 2017
Readers will know well
that we see inflation
picking up over the
course of the year,
particularly in the US
economy
In Focus 20 May 2016 5
thin on the evidence set out above.
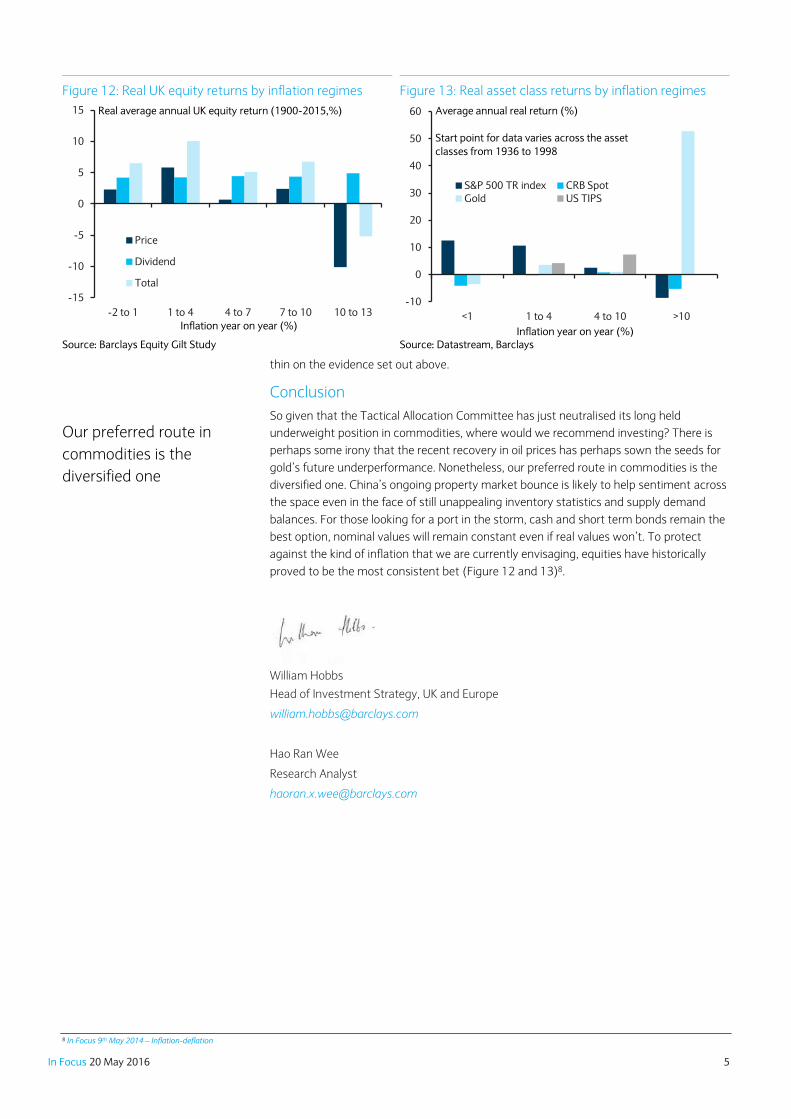
Conclusion
So given that the Tactical Allocation Committee has just neutralised its long held
underweight position in commodities, where would we recommend investing? There is
perhaps some irony that the recent recovery in oil prices has perhaps sown the seeds for
gold’s future underperformance. Nonetheless, our preferred route in commodities is the
diversified one. China’s ongoing property market bounce is likely to help sentiment across
the space even in the face of still unappealing inventory statistics and supply demand
balances. For those looking for a port in the storm, cash and short term bonds remain the
best option, nominal values will remain constant even if real values won’t. To protect
against the kind of inflation that we are currently envisaging, equities have historically
proved to be the most consistent bet (Figure 12 and 13)8.
William Hobbs
Head of Investment Strategy, UK and Europe
Hao Ran Wee
Research Analyst
8 In Focus 9th May 2014 – Inflation-deflation
Figure 12: Real UK equity returns by inflation regimes Figure 13: Real asset class returns by inflation regimes
Source: Barclays Equity Gilt Study Source: Datastream, Barclays
-15
-10
-5
0
5
10
15
-2 to 1 1 to 4 4 to 7 7 to 10 10 to 13
Price
Dividend
Total
Inflation year on year (%)
Real average annual UK equity return (1900-2015,%)
-10
0
10
20
30
40
50
60
<1 1 to 4 4 to 10 >10
S&P 500 TR index CRB SpotGold US TIPS
Inflation year on year (%)
Average annual real return (%)
Start point for data varies across the asset
classes from 1936 to 1998
Our preferred route in
commodities is the
diversified one
In Focus 20 May 2016 6
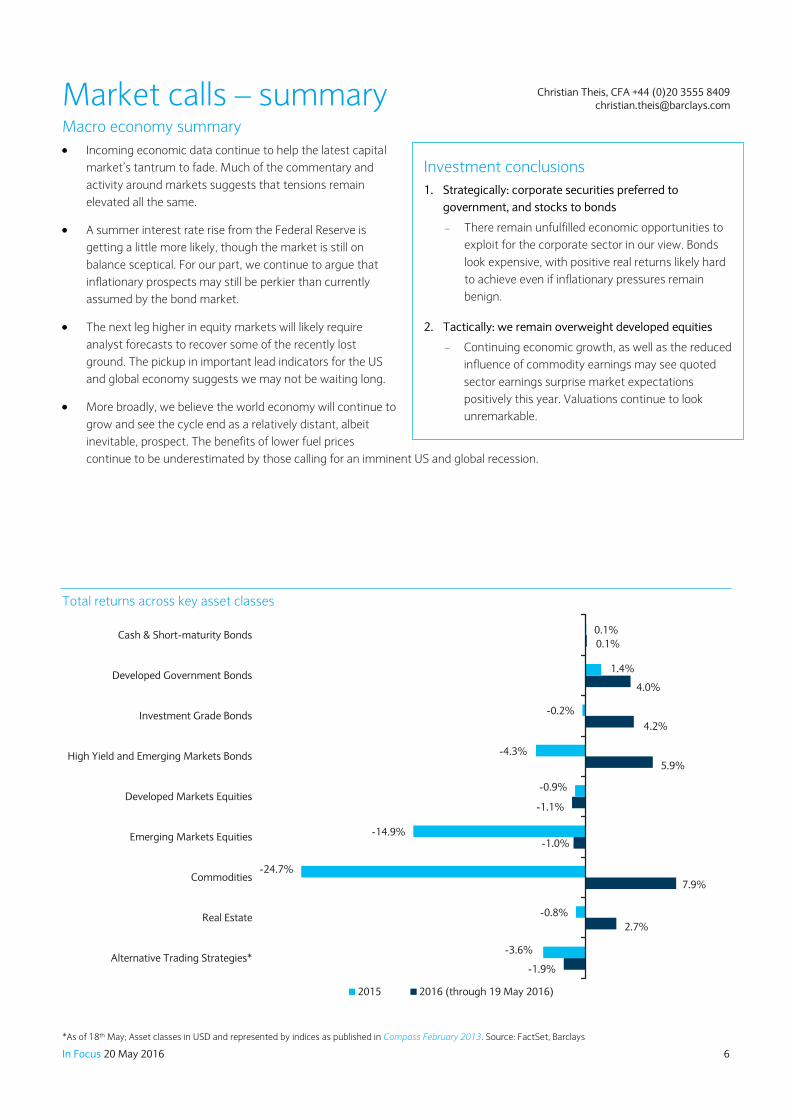
Investment conclusions
1. Strategically: corporate securities preferred to
government, and stocks to bonds
There remain unfulfilled economic opportunities to
exploit for the corporate sector in our view. Bonds
look expensive, with positive real returns likely hard
to achieve even if inflationary pressures remain
benign.
2. Tactically: we remain overweight developed equities
Continuing economic growth, as well as the reduced
influence of commodity earnings may see quoted
sector earnings surprise market expectations
positively this year. Valuations continue to look
unremarkable.
Market calls – summary Macro economy summary
Incoming economic data continue to help the latest capital
market’s tantrum to fade. Much of the commentary and
activity around markets suggests that tensions remain
elevated all the same.
A summer interest rate rise from the Federal Reserve is
getting a little more likely, though the market is still on
balance sceptical. For our part, we continue to argue that
inflationary prospects may still be perkier than currently
assumed by the bond market.
The next leg higher in equity markets will likely require
analyst forecasts to recover some of the recently lost
ground. The pickup in important lead indicators for the US
and global economy suggests we may not be waiting long.
More broadly, we believe the world economy will continue to
grow and see the cycle end as a relatively distant, albeit
inevitable, prospect. The benefits of lower fuel prices
continue to be underestimated by those calling for an imminent US and global recession.
Total returns across key asset classes
-1.9%
2.7%
7.9%
-1.0%
-1.1%
5.9%
4.2%
4.0%
0.1%
-3.6%
-0.8%
-24.7%
-14.9%
-0.9%
-4.3%
-0.2%
1.4%
0.1%
Alternative Trading Strategies*
Real Estate
Commodities
Emerging Markets Equities
Developed Markets Equities
High Yield and Emerging Markets Bonds
Investment Grade Bonds
Developed Government Bonds
Cash & Short-maturity Bonds
2015 2016 (through 19 May 2016)
*As of 18th May; Asset classes in USD and represented by indices as published in Compass February 2013. Source: FactSet, Barclays
Christian Theis, CFA +44 (0)20 3555 8409

In Focus 20 May 2016 7
Asset class summary We maintain a Strategic Asset Allocation for five risk profiles, based on our outlook for each
of the asset classes. Our Tactical Allocation Committee (TAC), comprised of our senior
investment strategists and portfolio managers, regularly assesses the need for tactical
adjustments to those allocations, based on our shorter-term (three to six month) outlook.
Here, we share our latest thinking on our key tactical tilts.
Developed Markets Equities: Decreased to Overweight from Strong Overweight
(18 April 2016)
Developed equity markets have rallied substantially from the lows plumbed earlier in the
year. The TAC’s decision to further increase the recommended exposure to equities at the
expense of cash on the 20th January thus paid off and the opportunity was taken to take
some profits in developed equities. We remain overweight the asset class, as we believe that
there is further upside, with excessively pessimistic earnings forecasts likely to be corrected
over the course of the next six months. We continue to believe that while the next US and
global economic recession is of course inevitable, it is not imminent.
We still advise investors not to underestimate the US consumer, particularly with real
disposable income growing at such a healthy pace. This may surprise those again calling for
US profit margins to continue rolling over. Such forecasts may both understate the negative
effect of energy sector earnings over the last year and a half and overstate its future role
given the sector’s now much diminished contribution to quoted index earnings.
Our favoured developed equity regions remain for the moment the US and Europe ex-UK.
With regards to the US, earnings expectations look achievable and valuations unremarkable,
while the reduced influence of energy sector earnings should be helpful as noted above.
Emerging Markets Equities: Neutral
The TAC moved their recommended position in Emerging Markets Equities up to Neutral in
January. The case for further meaningful downside is now harder to make in the context of
the underperformance already suffered by the space over the last several years. Much bad
news is already factored into our view, while the potential for a further dramatic ascent of the
US dollar, helpful in stoking fears of a repeat of the late 1990s, is also somewhat diminished
given a less extreme valuation.
Within Emerging Market Equities, Asia remains our preferred region, with Korea, Taiwan and
China (Offshore) our highest conviction country bets on a strategic basis. The expected pick
up in global trade is central to this view. We continue to watch US imports for any signs of
this.
Cash & Short-Maturity Bonds: Neutral
Given the recent severe market disturbances, cash continues to play a pivotal portfolio
insulation role. While the fixed income universe remains unattractive at current extreme
valuations, cash offers a source of funds to invest into other asset classes when appropriate
opportunities arise. Evidence of some returning inflation in the US needs to be watched very
carefully obviously.
Our favoured developed
equity regions remain
for the moment the US
and Europe ex-UK
In Focus 20 May 2016 8
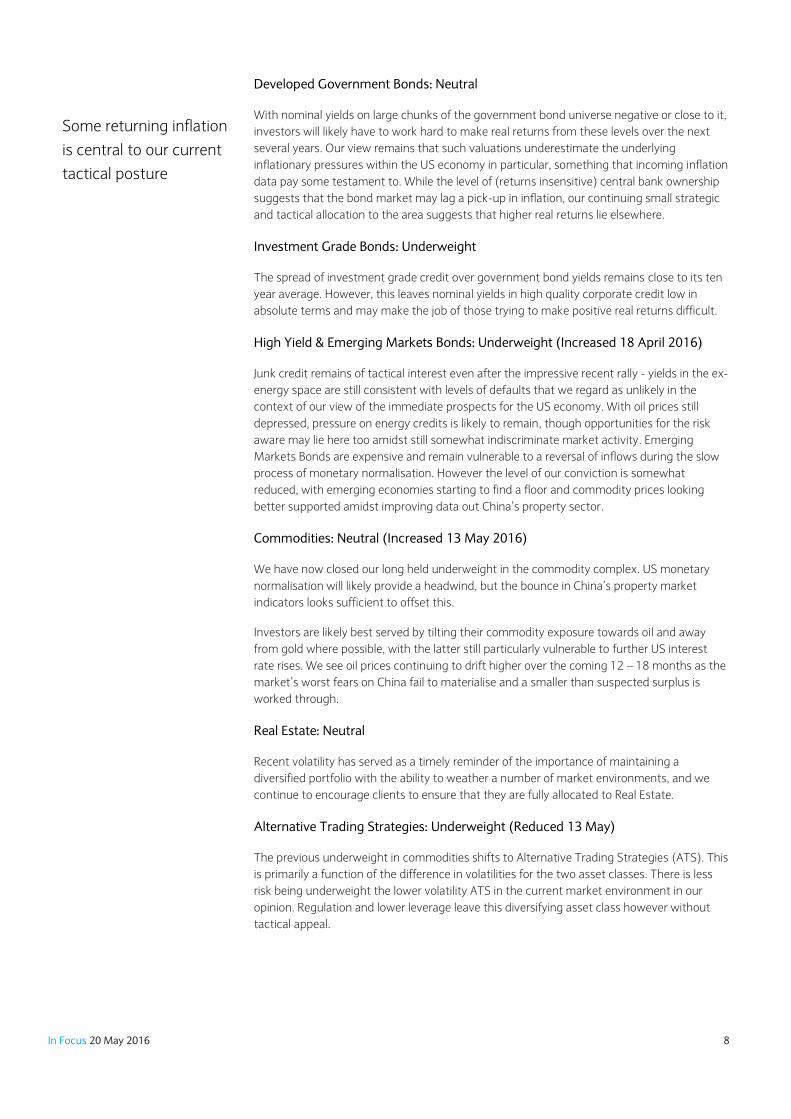
Developed Government Bonds: Neutral
With nominal yields on large chunks of the government bond universe negative or close to it,
investors will likely have to work hard to make real returns from these levels over the next
several years. Our view remains that such valuations underestimate the underlying
inflationary pressures within the US economy in particular, something that incoming inflation
data pay some testament to. While the level of (returns insensitive) central bank ownership
suggests that the bond market may lag a pick-up in inflation, our continuing small strategic
and tactical allocation to the area suggests that higher real returns lie elsewhere.
Investment Grade Bonds: Underweight
The spread of investment grade credit over government bond yields remains close to its ten
year average. However, this leaves nominal yields in high quality corporate credit low in
absolute terms and may make the job of those trying to make positive real returns difficult.
High Yield & Emerging Markets Bonds: Underweight (Increased 18 April 2016)
Junk credit remains of tactical interest even after the impressive recent rally - yields in the ex-
energy space are still consistent with levels of defaults that we regard as unlikely in the
context of our view of the immediate prospects for the US economy. With oil prices still
depressed, pressure on energy credits is likely to remain, though opportunities for the risk
aware may lie here too amidst still somewhat indiscriminate market activity. Emerging
Markets Bonds are expensive and remain vulnerable to a reversal of inflows during the slow
process of monetary normalisation. However the level of our conviction is somewhat
reduced, with emerging economies starting to find a floor and commodity prices looking
better supported amidst improving data out China’s property sector.
Commodities: Neutral (Increased 13 May 2016)
We have now closed our long held underweight in the commodity complex. US monetary
normalisation will likely provide a headwind, but the bounce in China’s property market
indicators looks sufficient to offset this.
Investors are likely best served by tilting their commodity exposure towards oil and away
from gold where possible, with the latter still particularly vulnerable to further US interest
rate rises. We see oil prices continuing to drift higher over the coming 12 – 18 months as the
market’s worst fears on China fail to materialise and a smaller than suspected surplus is
worked through.
Real Estate: Neutral
Recent volatility has served as a timely reminder of the importance of maintaining a
diversified portfolio with the ability to weather a number of market environments, and we
continue to encourage clients to ensure that they are fully allocated to Real Estate.
Alternative Trading Strategies: Underweight (Reduced 13 May)
The previous underweight in commodities shifts to Alternative Trading Strategies (ATS). This
is primarily a function of the difference in volatilities for the two asset classes. There is less
risk being underweight the lower volatility ATS in the current market environment in our
opinion. Regulation and lower leverage leave this diversifying asset class however without
tactical appeal.
Some returning inflation
is central to our current
tactical posture
In Focus 20 May 2016 9
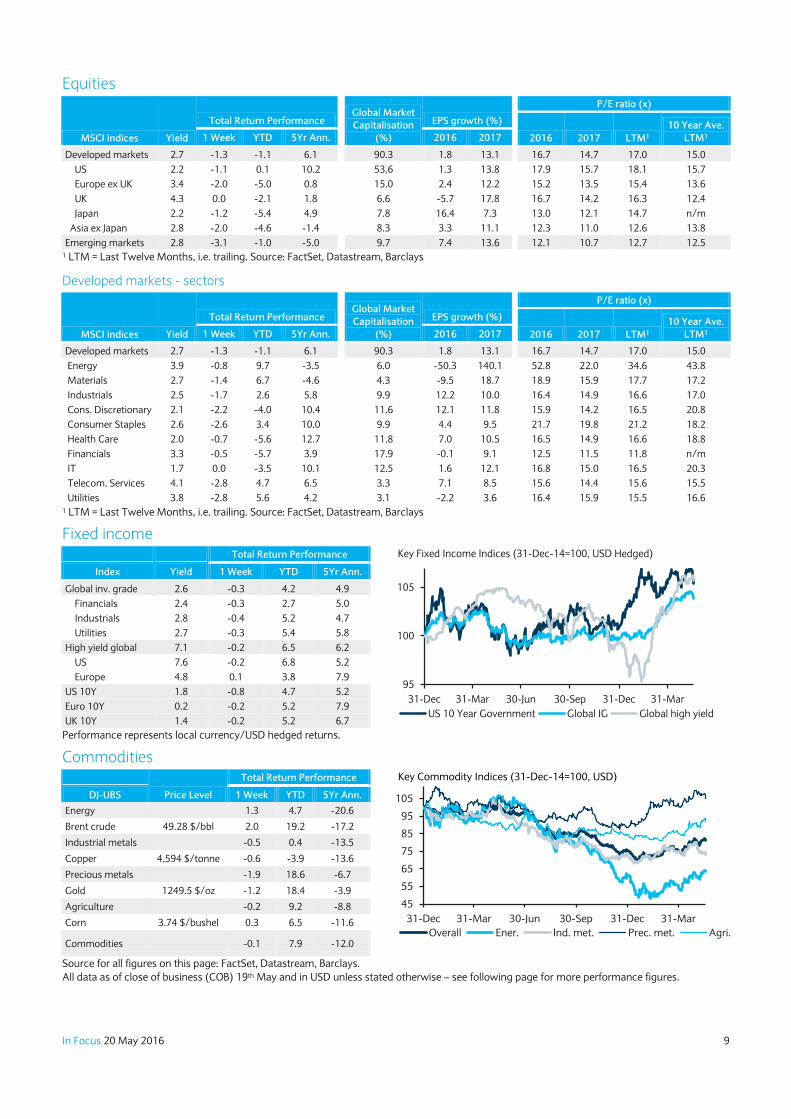
Equities
MSCI indices Yield
Total Return Performance
Global Market
Capitalisation
(%)
EPS growth (%)
P/E ratio (x)
2016 2017 LTM1
10 Year Ave.
LTM1 1 Week YTD 5Yr Ann. 2016 2017
Developed markets 2.7 -1.3 -1.1 6.1 90.3 1.8 13.1 16.7 14.7 17.0 15.0
US 2.2 -1.1 0.1 10.2 53.6 1.3 13.8 17.9 15.7 18.1 15.7
Europe ex UK 3.4 -2.0 -5.0 0.8 15.0 2.4 12.2 15.2 13.5 15.4 13.6
UK 4.3 0.0 -2.1 1.8 6.6 -5.7 17.8 16.7 14.2 16.3 12.4
Japan 2.2 -1.2 -5.4 4.9 7.8 16.4 7.3 13.0 12.1 14.7 n/m
Asia ex Japan 2.8 -2.0 -4.6 -1.4 8.3 3.3 11.1 12.3 11.0 12.6 13.8
Emerging markets 2.8 -3.1 -1.0 -5.0 9.7 7.4 13.6 12.1 10.7 12.7 12.5 1 LTM = Last Twelve Months, i.e. trailing. Source: FactSet, Datastream, Barclays
Developed markets - sectors
MSCI indices Yield
Total Return Performance
Global Market
Capitalisation
(%)
EPS growth (%)
P/E ratio (x)
2016 2017 LTM1
10 Year Ave.
LTM1 1 Week YTD 5Yr Ann. 2016 2017
Developed markets 2.7 -1.3 -1.1 6.1 90.3 1.8 13.1 16.7 14.7 17.0 15.0
Energy 3.9 -0.8 9.7 -3.5 6.0 -50.3 140.1 52.8 22.0 34.6 43.8
Materials 2.7 -1.4 6.7 -4.6 4.3 -9.5 18.7 18.9 15.9 17.7 17.2
Industrials 2.5 -1.7 2.6 5.8 9.9 12.2 10.0 16.4 14.9 16.6 17.0
Cons. Discretionary 2.1 -2.2 -4.0 10.4 11.6 12.1 11.8 15.9 14.2 16.5 20.8
Consumer Staples 2.6 -2.6 3.4 10.0 9.9 4.4 9.5 21.7 19.8 21.2 18.2
Health Care 2.0 -0.7 -5.6 12.7 11.8 7.0 10.5 16.5 14.9 16.6 18.8
Financials 3.3 -0.5 -5.7 3.9 17.9 -0.1 9.1 12.5 11.5 11.8 n/m
IT 1.7 0.0 -3.5 10.1 12.5 1.6 12.1 16.8 15.0 16.5 20.3
Telecom. Services 4.1 -2.8 4.7 6.5 3.3 7.1 8.5 15.6 14.4 15.6 15.5
Utilities 3.8 -2.8 5.6 4.2 3.1 -2.2 3.6 16.4 15.9 15.5 16.6 1 LTM = Last Twelve Months, i.e. trailing. Source: FactSet, Datastream, Barclays
Fixed income Total Return Performance
95
100
105
31-Dec 31-Mar 30-Jun 30-Sep 31-Dec 31-Mar
US 10 Year Government Global IG Global high yield
Key Fixed Income Indices (31-Dec-14=100, USD Hedged)
Index Yield 1 Week YTD 5Yr Ann.
Global inv. grade 2.6 -0.3 4.2 4.9
Financials 2.4 -0.3 2.7 5.0
Industrials 2.8 -0.4 5.2 4.7
Utilities 2.7 -0.3 5.4 5.8
High yield global 7.1 -0.2 6.5 6.2
US 7.6 -0.2 6.8 5.2
Europe 4.8 0.1 3.8 7.9
US 10Y 1.8 -0.8 4.7 5.2
Euro 10Y 0.2 -0.2 5.2 7.9
UK 10Y 1.4 -0.2 5.2 6.7
Performance represents local currency/USD hedged returns.
Commodities
Price Level
Total Return Performance
45
55
65
75
85
95
105
31-Dec 31-Mar 30-Jun 30-Sep 31-Dec 31-Mar
Overall Ener. Ind. met. Prec. met. Agri.
Key Commodity Indices (31-Dec-14=100, USD)
DJ-UBS 1 Week YTD 5Yr Ann.
Energy 1.3 4.7 -20.6
Brent crude 49.28 $/bbl 2.0 19.2 -17.2
Industrial metals -0.5 0.4 -13.5
Copper 4,594 $/tonne -0.6 -3.9 -13.6
Precious metals -1.9 18.6 -6.7
Gold 1249.5 $/oz -1.2 18.4 -3.9
Agriculture -0.2 9.2 -8.8
Corn 3.74 $/bushel 0.3 6.5 -11.6
Commodities -0.1 7.9 -12.0
Source for all figures on this page: FactSet, Datastream, Barclays.
All data as of close of business (COB) 19th May and in USD unless stated otherwise – see following page for more performance figures.
In Focus 20 May 2016 10
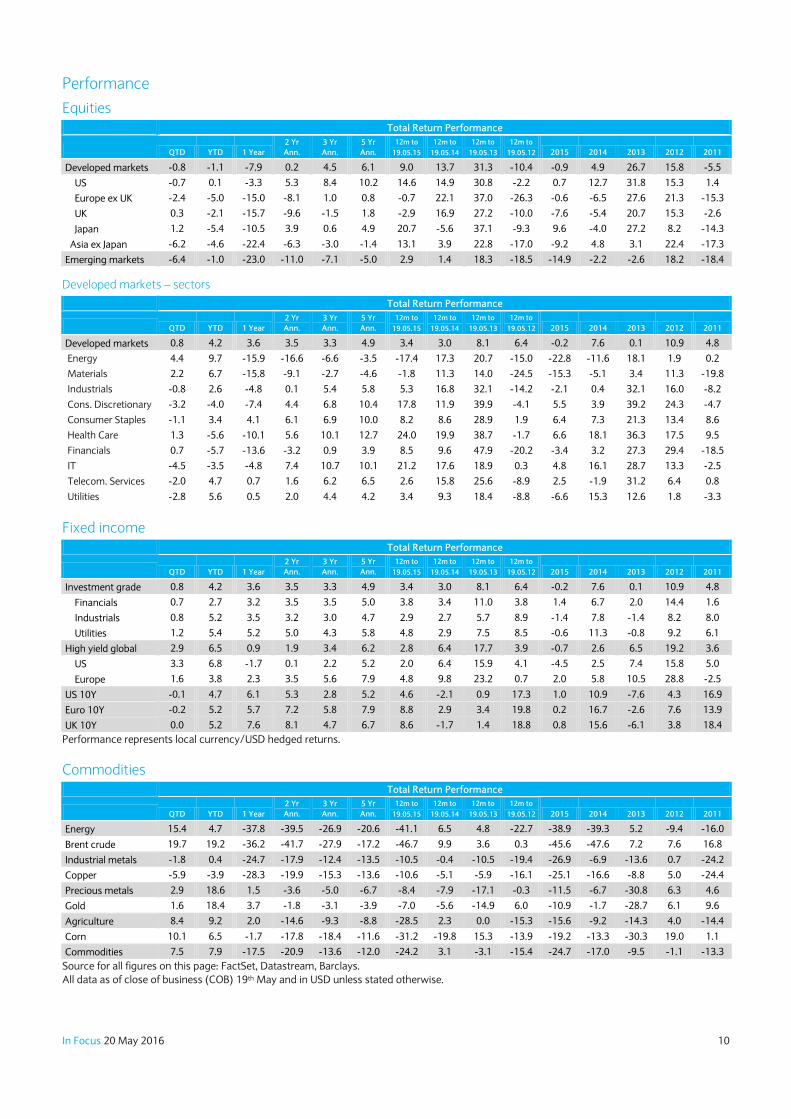
Performance
Equities
Total Return Performance
QTD YTD 1 Year
2 Yr
Ann.
3 Yr
Ann.
5 Yr
Ann.
12m to
19.05.15
12m to
19.05.14
12m to
19.05.13
12m to
19.05.12 2015 2014 2013 2012 2011
Developed markets -0.8 -1.1 -7.9 0.2 4.5 6.1 9.0 13.7 31.3 -10.4 -0.9 4.9 26.7 15.8 -5.5
US -0.7 0.1 -3.3 5.3 8.4 10.2 14.6 14.9 30.8 -2.2 0.7 12.7 31.8 15.3 1.4
Europe ex UK -2.4 -5.0 -15.0 -8.1 1.0 0.8 -0.7 22.1 37.0 -26.3 -0.6 -6.5 27.6 21.3 -15.3
UK 0.3 -2.1 -15.7 -9.6 -1.5 1.8 -2.9 16.9 27.2 -10.0 -7.6 -5.4 20.7 15.3 -2.6
Japan 1.2 -5.4 -10.5 3.9 0.6 4.9 20.7 -5.6 37.1 -9.3 9.6 -4.0 27.2 8.2 -14.3
Asia ex Japan -6.2 -4.6 -22.4 -6.3 -3.0 -1.4 13.1 3.9 22.8 -17.0 -9.2 4.8 3.1 22.4 -17.3
Emerging markets -6.4 -1.0 -23.0 -11.0 -7.1 -5.0 2.9 1.4 18.3 -18.5 -14.9 -2.2 -2.6 18.2 -18.4
Developed markets – sectors
Total Return Performance
QTD YTD 1 Year
2 Yr
Ann.
3 Yr
Ann.
5 Yr
Ann.
12m to
19.05.15
12m to
19.05.14
12m to
19.05.13
12m to
19.05.12 2015 2014 2013 2012 2011
Developed markets 0.8 4.2 3.6 3.5 3.3 4.9 3.4 3.0 8.1 6.4 -0.2 7.6 0.1 10.9 4.8
Energy 4.4 9.7 -15.9 -16.6 -6.6 -3.5 -17.4 17.3 20.7 -15.0 -22.8 -11.6 18.1 1.9 0.2
Materials 2.2 6.7 -15.8 -9.1 -2.7 -4.6 -1.8 11.3 14.0 -24.5 -15.3 -5.1 3.4 11.3 -19.8
Industrials -0.8 2.6 -4.8 0.1 5.4 5.8 5.3 16.8 32.1 -14.2 -2.1 0.4 32.1 16.0 -8.2
Cons. Discretionary -3.2 -4.0 -7.4 4.4 6.8 10.4 17.8 11.9 39.9 -4.1 5.5 3.9 39.2 24.3 -4.7
Consumer Staples -1.1 3.4 4.1 6.1 6.9 10.0 8.2 8.6 28.9 1.9 6.4 7.3 21.3 13.4 8.6
Health Care 1.3 -5.6 -10.1 5.6 10.1 12.7 24.0 19.9 38.7 -1.7 6.6 18.1 36.3 17.5 9.5
Financials 0.7 -5.7 -13.6 -3.2 0.9 3.9 8.5 9.6 47.9 -20.2 -3.4 3.2 27.3 29.4 -18.5
IT -4.5 -3.5 -4.8 7.4 10.7 10.1 21.2 17.6 18.9 0.3 4.8 16.1 28.7 13.3 -2.5
Telecom. Services -2.0 4.7 0.7 1.6 6.2 6.5 2.6 15.8 25.6 -8.9 2.5 -1.9 31.2 6.4 0.8
Utilities -2.8 5.6 0.5 2.0 4.4 4.2 3.4 9.3 18.4 -8.8 -6.6 15.3 12.6 1.8 -3.3
Fixed income
Total Return Performance
QTD YTD 1 Year
2 Yr
Ann.
3 Yr
Ann.
5 Yr
Ann.
12m to
19.05.15
12m to
19.05.14
12m to
19.05.13
12m to
19.05.12 2015 2014 2013 2012 2011
Investment grade 0.8 4.2 3.6 3.5 3.3 4.9 3.4 3.0 8.1 6.4 -0.2 7.6 0.1 10.9 4.8
Financials 0.7 2.7 3.2 3.5 3.5 5.0 3.8 3.4 11.0 3.8 1.4 6.7 2.0 14.4 1.6
Industrials 0.8 5.2 3.5 3.2 3.0 4.7 2.9 2.7 5.7 8.9 -1.4 7.8 -1.4 8.2 8.0
Utilities 1.2 5.4 5.2 5.0 4.3 5.8 4.8 2.9 7.5 8.5 -0.6 11.3 -0.8 9.2 6.1
High yield global 2.9 6.5 0.9 1.9 3.4 6.2 2.8 6.4 17.7 3.9 -0.7 2.6 6.5 19.2 3.6
US 3.3 6.8 -1.7 0.1 2.2 5.2 2.0 6.4 15.9 4.1 -4.5 2.5 7.4 15.8 5.0
Europe 1.6 3.8 2.3 3.5 5.6 7.9 4.8 9.8 23.2 0.7 2.0 5.8 10.5 28.8 -2.5
US 10Y -0.1 4.7 6.1 5.3 2.8 5.2 4.6 -2.1 0.9 17.3 1.0 10.9 -7.6 4.3 16.9
Euro 10Y -0.2 5.2 5.7 7.2 5.8 7.9 8.8 2.9 3.4 19.8 0.2 16.7 -2.6 7.6 13.9
UK 10Y 0.0 5.2 7.6 8.1 4.7 6.7 8.6 -1.7 1.4 18.8 0.8 15.6 -6.1 3.8 18.4
Performance represents local currency/USD hedged returns.
Commodities
Total Return Performance
QTD YTD 1 Year
2 Yr
Ann.
3 Yr
Ann.
5 Yr
Ann.
12m to
19.05.15
12m to
19.05.14
12m to
19.05.13
12m to
19.05.12 2015 2014 2013 2012 2011
Energy 15.4 4.7 -37.8 -39.5 -26.9 -20.6 -41.1 6.5 4.8 -22.7 -38.9 -39.3 5.2 -9.4 -16.0
Brent crude 19.7 19.2 -36.2 -41.7 -27.9 -17.2 -46.7 9.9 3.6 0.3 -45.6 -47.6 7.2 7.6 16.8
Industrial metals -1.8 0.4 -24.7 -17.9 -12.4 -13.5 -10.5 -0.4 -10.5 -19.4 -26.9 -6.9 -13.6 0.7 -24.2
Copper -5.9 -3.9 -28.3 -19.9 -15.3 -13.6 -10.6 -5.1 -5.9 -16.1 -25.1 -16.6 -8.8 5.0 -24.4
Precious metals 2.9 18.6 1.5 -3.6 -5.0 -6.7 -8.4 -7.9 -17.1 -0.3 -11.5 -6.7 -30.8 6.3 4.6
Gold 1.6 18.4 3.7 -1.8 -3.1 -3.9 -7.0 -5.6 -14.9 6.0 -10.9 -1.7 -28.7 6.1 9.6
Agriculture 8.4 9.2 2.0 -14.6 -9.3 -8.8 -28.5 2.3 0.0 -15.3 -15.6 -9.2 -14.3 4.0 -14.4
Corn 10.1 6.5 -1.7 -17.8 -18.4 -11.6 -31.2 -19.8 15.3 -13.9 -19.2 -13.3 -30.3 19.0 1.1
Commodities 7.5 7.9 -17.5 -20.9 -13.6 -12.0 -24.2 3.1 -3.1 -15.4 -24.7 -17.0 -9.5 -1.1 -13.3
Source for all figures on this page: FactSet, Datastream, Barclays.
All data as of close of business (COB) 19th May and in USD unless stated otherwise.
In Focus 20 May 2016 11
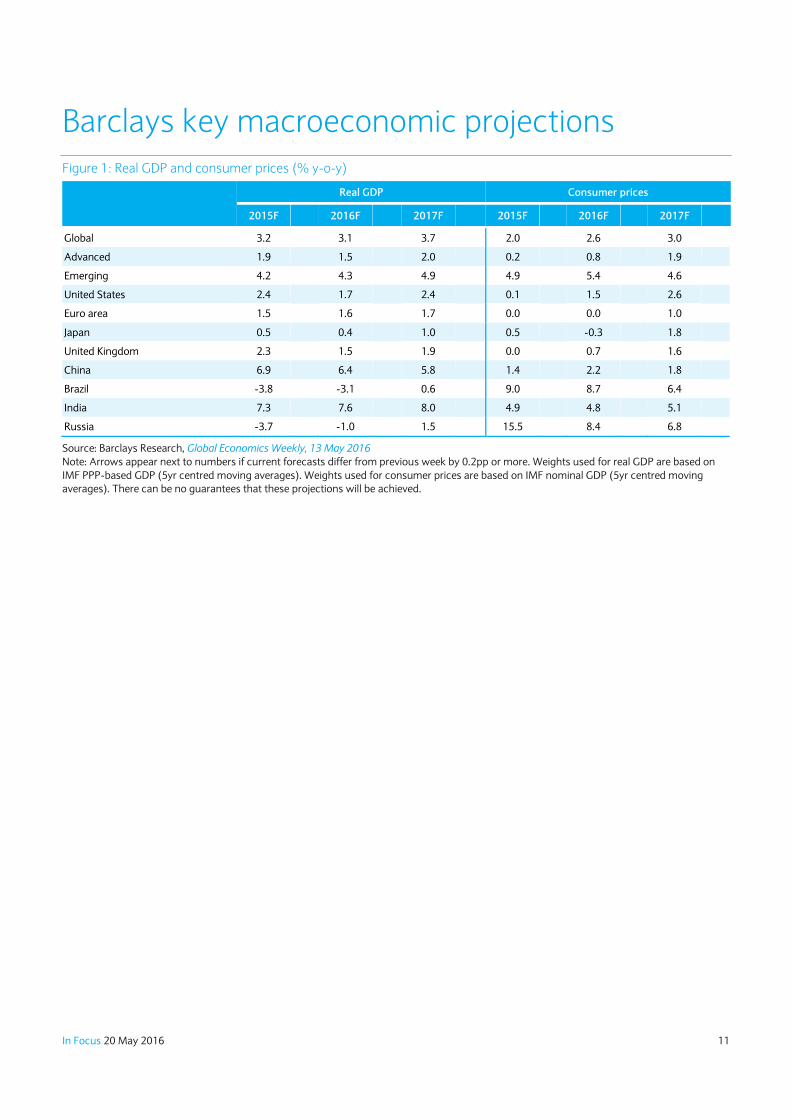
Barclays key macroeconomic projections
Figure 1: Real GDP and consumer prices (% y-o-y)
Real GDP Consumer prices
2015F
2016F
2017F
2015F
2016F
2017F
Global 3.2
3.1
3.7
2.0
2.6
3.0
Advanced 1.9
1.5
2.0
0.2
0.8
1.9
Emerging 4.2
4.3
4.9
4.9
5.4
4.6
United States 2.4
1.7
2.4
0.1
1.5
2.6
Euro area 1.5
1.6
1.7
0.0
0.0
1.0
Japan 0.5
0.4
1.0
0.5
-0.3
1.8
United Kingdom 2.3
1.5
1.9
0.0
0.7
1.6
China 6.9
6.4
5.8
1.4
2.2
1.8
Brazil -3.8
-3.1
0.6
9.0
8.7
6.4
India 7.3
7.6
8.0
4.9
4.8
5.1
Russia -3.7
-1.0
1.5
15.5
8.4
6.8
Source: Barclays Research, Global Economics Weekly, 13 May 2016
Note: Arrows appear next to numbers if current forecasts differ from previous week by 0.2pp or more. Weights used for real GDP are based on
IMF PPP-based GDP (5yr centred moving averages). Weights used for consumer prices are based on IMF nominal GDP (5yr centred moving
averages). There can be no guarantees that these projections will be achieved.
In Focus 20 May 2016 12
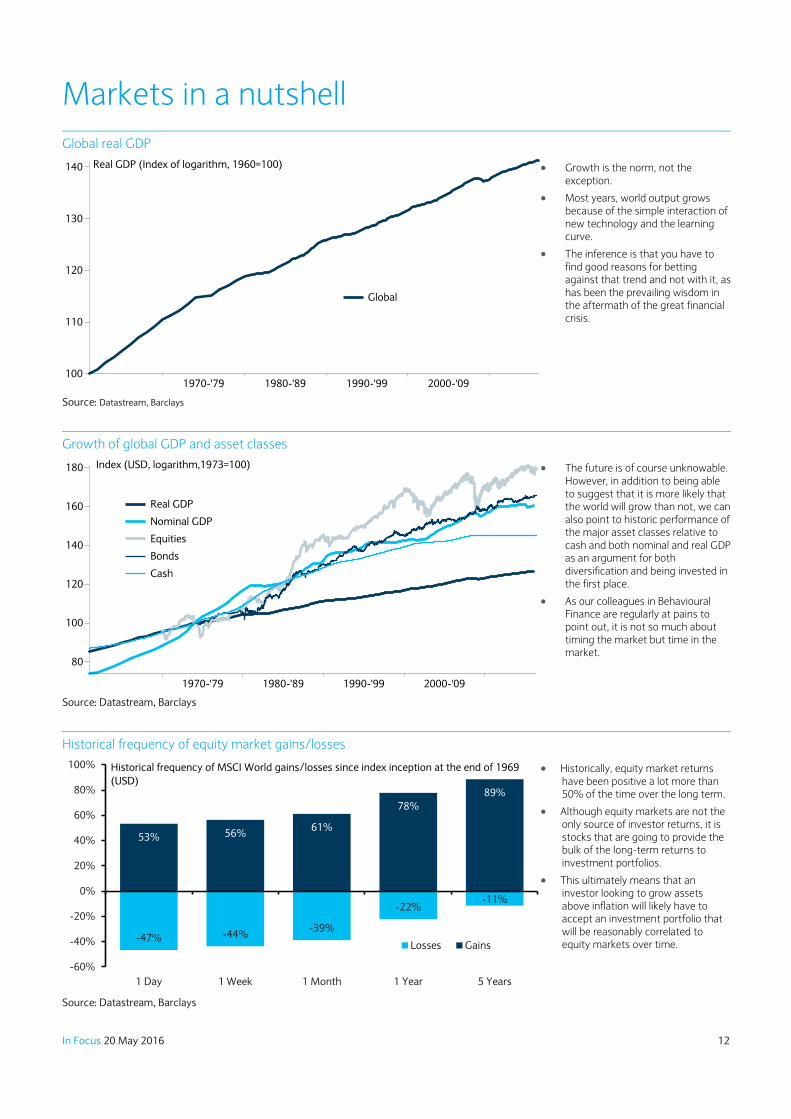
Markets in a nutshell
Global real GDP
Growth is the norm, not the exception.
Most years, world output grows because of the simple interaction of new technology and the learning curve.
The inference is that you have to find good reasons for betting against that trend and not with it, as has been the prevailing wisdom in the aftermath of the great financial crisis.
Source: Datastream, Barclays
Growth of global GDP and asset classes
The future is of course unknowable. However, in addition to being able to suggest that it is more likely that the world will grow than not, we can also point to historic performance of the major asset classes relative to cash and both nominal and real GDP as an argument for both diversification and being invested in the first place.
As our colleagues in Behavioural Finance are regularly at pains to point out, it is not so much about timing the market but time in the market.
Source: Datastream, Barclays
Historical frequency of equity market gains/losses
Historically, equity market returns have been positive a lot more than 50% of the time over the long term.
Although equity markets are not the only source of investor returns, it is stocks that are going to provide the bulk of the long-term returns to investment portfolios.
This ultimately means that an investor looking to grow assets above inflation will likely have to accept an investment portfolio that will be reasonably correlated to equity markets over time.
Source: Datastream, Barclays
100
120
130
110
140
1970-'79 1990-'991980-'89 2000-'09
Global
Real GDP (Index of logarithm, 1960=100)
80
100
120
160
140
180
1970-'79 1990-'991980-'89 2000-'09
Real GDP
Nominal GDP
Equities
Bonds
Cash
Index (USD, logarithm,1973=100)
53% 56%61%
78%
89%
-47% -44%-39%
-22%-11%
-60%
-40%
-20%
0%
20%
40%
60%
80%
100%
1 Day 1 Week 1 Month 1 Year 5 Years
Losses Gains
Historical frequency of MSCI World gains/losses since index inception at the end of 1969
(USD)
In Focus 20 May 2016 13
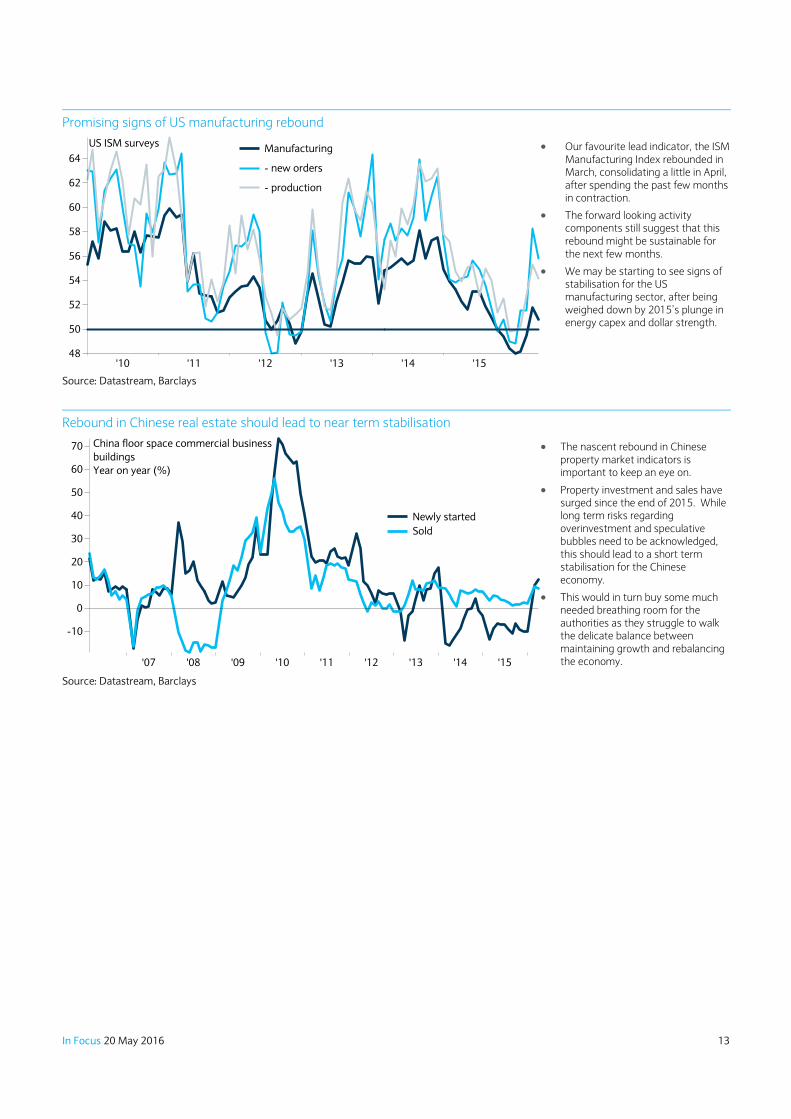
Promising signs of US manufacturing rebound
Our favourite lead indicator, the ISM Manufacturing Index rebounded in March, consolidating a little in April, after spending the past few months in contraction.
The forward looking activity components still suggest that this rebound might be sustainable for the next few months.
We may be starting to see signs of stabilisation for the US manufacturing sector, after being weighed down by 2015’s plunge in energy capex and dollar strength.
Source: Datastream, Barclays
Rebound in Chinese real estate should lead to near term stabilisation
The nascent rebound in Chinese property market indicators is important to keep an eye on.
Property investment and sales have surged since the end of 2015. While long term risks regarding overinvestment and speculative bubbles need to be acknowledged, this should lead to a short term stabilisation for the Chinese economy.
This would in turn buy some much needed breathing room for the authorities as they struggle to walk the delicate balance between maintaining growth and rebalancing the economy.
Source: Datastream, Barclays
48
50
52
54
56
58
60
62
64
'13'12'11'10 '15'14
Manufacturing
- new orders
- production
US ISM surveys
0
10
-10
20
30
40
50
60
70
'13'12'11'10'09 '15'08 '14'07
Newly started
Sold
China floor space commercial business
buildings
Year on year (%)

In Focus 20 May 2016 14
This document has been prepared by the wealth and investment management division of Barclays Bank plc (“Barclays”), for information purposes only. Barclays does
not guarantee the accuracy or completeness of information which is contained in this document and which is stated to have been obtained from or is based upon
trade and statistical services or other third party sources. Any data on past performance, modelling or back-testing contained herein is no indication as to future
performance. No representation is made as to the reasonableness of the assumptions made within or the accuracy or completeness of any modelling or back-testing.
All opinions and estimates are given as of the date hereof and are subject to change. The value of any investment may fluctuate as a result of market changes. The
information in this document is not intended to predict actual results and no assurances are given with respect thereto.
The information contained herein is intended for general circulation. It does not take into account the specific investment objectives, financial situation or particular
needs of any particular person. The investments discussed in this publication may not be suitable for all investors. Advice should be sought from a financial adviser
regarding the suitability of the investment products mentioned herein, taking into account your specific objectives, financial situation and particular needs before you
make any commitment to purchase any such investment products. Barclays and its affiliates do not provide tax advice and nothing herein should be construed as
such. Accordingly, you should seek advice based on your particular circumstances from an independent tax advisor. Neither Barclays, nor any affiliate, nor any of their
respective officers, directors, partners, or employees accepts any liability whatsoever for any direct or consequential loss arising from any use of or reliance upon this
publication or its contents, or for any omission. Past performance does not guarantee or predict future performance. The information herein is not intended to predict
actual results, which may differ substantially from those reflected.
The products mentioned in this document may not be eligible for sale in some states or countries, nor suitable for all types of investors. This document shall not
constitute an underwriting commitment, an offer of financing, an offer to sell, or the solicitation of an offer to buy any securities described herein, which shall be
subject to Barclays’ internal approvals. No transaction or services related thereto is contemplated without Barclays’ subsequent formal agreement. Unless expressly
stated, products mentioned herein are not guaranteed by Barclays Bank plc or its affiliates or any government entity.
This document is not directed to, nor intended for distribution or use by, any person or entity in any jurisdiction or country where the publication or availability of this
document or such distribution or use would be contrary to local law or regulation, including, for the avoidance of doubt, the United States of America. It may not be
reproduced or disclosed (in whole or in part) to any other person without prior written permission. You should not take notice of this document if you know that your
access would contravene applicable local, national or international laws. The contents of this publication have not been reviewed or approved by any regulatory
authority.
Barclays Capital Inc., Member SIPC, Barclays Bank plc and / or their affiliated companies and/or the individuals associated therewith (in various capacities) may
already have or intend to: (i) seek investment banking or other business relationships for which they already receive or will receive compensation from the companies
that are the subject of this publication (“Researched Companies”), such as underwriting, advising, and lending – as such, it is possible that Barclays Capital Inc.,
Barclays Bank plc or their affiliated companies may have managed or co-managed a public offering of securities for any issuer mentioned in this document within the
last three years.; (ii) have an interest in the Researched Companies by acting making a market or dealing as principal in securities issued by Researched Companies or
in options or other derivatives based thereon, or otherwise hold personal interests in the Research Companies; (iii) appoint employees or associates as directors or
officers of the Researched Companies; (iv) act upon the contents of this publication prior to your having received it; (v) effect transactions which are not consistent
with the recommendations given herein.
Barclays offers wealth and investment management products and services to its clients through Barclays Bank PLC and its subsidiary companies. Barclays Bank PLC is
registered in England and authorised by the Prudential Regulation Authority and regulated by the Financial Conduct Authority and the Prudential Regulation Authority.
Registered No. 1026167. Registered Office: 1 Churchill Place, London E14 5HP.
Cyprus – Barclays Bank PLC is regulated by the Central Bank of Cyprus in the conduct of its banking and investment business in Cyprus. France – Barclays Bank PLC,
Succursale en France - Principal établissement : 32 avenue George V - 75008 Paris - RCS Paris B 381 066 281 - C.C.P. 62-07 Paris - Siège social à Londres E14 5HP,
Angleterre, 1, Churchill Place - Reg N° 1026167 - Capital autorisé 3 040 001 000 de Livres Sterling. BARCLAYS BANK PLC est un établissement de crédit, intermédiaire
en assurance (l'immatriculation auprès du FCA peut être contrôlée sur le site internet www.orias.fr.), prestataire de service d’investissement de droit anglais agréé par
the Financial Conduct Authority (FCA), autorité de tutelle britannique qui a son siège social 25 The North Colonnade, Canary Wharf, Londres E14 5HS.
(www.fca.gov.uk), FCA register n° 122702 La Succursale française de Barclays Bank PLC, est autorisée par le FCA à recourir à un Agent lié, Barclays Patrimoine SCS.
Gibraltar – Barclays Bank PLC is authorised by the Gibraltar Financial Services Commission to conduct banking and investment business in Gibraltar. Guernsey –
Barclays Bank PLC, Guernsey Branch is licensed by the Guernsey Financial Services Commission under the Banking Supervision (Bailiwick of Guernsey) Law 1994, as
amended, and the Protection of Investors (Bailiwick of Guernsey) Law 1987, as amended. Barclays Bank PLC, Guernsey Branch has its principal place of business at Le
Marchant House, St Peter Port, Guernsey, GY1 3BE. Ireland – Barclays Bank Ireland PLC is regulated by the Central Bank of Ireland. Registered in Ireland. Registered
Office: Two Park Place, Hatch Street, Dublin 2. Registered Number: 396330. In the provision of certain corporate and investment banking, and wealth products,
Barclays Bank Ireland PLC acts as agent for Barclays Bank PLC. Isle of Man – Barclays Bank PLC, Isle of Man Branch is licensed by the Isle of Man Financial Supervision
Commission. Barclays Bank PLC, Isle of Man Branch has its principal business address in the Isle of Man at Barclays House, Victoria Street, Douglas, Isle of Man, IM99
1AJ. Italy – Barclays Bank PLC – Via della Moscova 18 – 20121 Milano è iscritta all’albo delle banche n. 4862, Registro Imprese Milano n. 80123490155 R.E.A. Milano n.
1040254 – Cod. Fiscale 80123490155 Partita IVA 04826660153 Le informazioni presenti in questo documento non costituiscono una raccomandazione, una
sollecitazione o un invito all’acquisto o alla vendita di alcuno strumento finanziario né costituiscono una consulenza strumentale all’investimento in strumenti
finanziari. I rendimenti conseguiti in passato non sono garanzia di rendimenti futuri. Jersey – Barclays Bank PLC, Jersey Branch is regulated by the Jersey Financial
Services Commission. Barclays Bank PLC, Jersey Branch has its principal business address in Jersey at 13 Library Place, St Helier, Jersey JE4 8NE, Channel Islands.
Monaco – Barclays Bank PLC – Monaco is a branch of Barclays Bank PLC with its offices in the Principality of Monaco at 31 Avenue de la Costa, MC 98000 Monaco –
Tel. +377 93 15 35 35. Registered with the Monaco Chamber of Commerce and Industry under No° 68 S 01191. Registered VAT No° FR 40 00002674 9. Nigeria –
Barclays Group Representative Office (NIG) Ltd. Registered Company No: RC41757 and its mailing address is Barclays Group Representative Office (NIG) Ltd, Courier
Department, 3rd Floor, 1 Churchill Place, London, E14 5HP. Portugal – Barclays Bank PLC activity in Portugal is supervised by Banco de Portugal (BoP) and Comissão
de Mercado de Valores Mobiliários (CMVM). Qatar – Barclays Bank PLC in the Qatar Financial Centre (Registered No. 00018) is authorised by the Qatar Financial
Centre Regulatory Authority. Barclays Bank PLC QFC Branch may only undertake the regulated activities that fall within the scope of its existing QFCRA authorisation.
Principal place of business in Qatar: Qatar Financial Centre, Office 1002, 10th Floor, QFC Tower, Diplomatic Area, West Bay, PO Box 15891, Doha, Qatar. This
information has been distributed by Barclays Bank PLC. Related financial products or services are only available to Business Customers as defined by the QFCRA.
South Africa – Absa Bank Limited t/a ABSA Private Bank. Registration number: 1986/004794/06. Authorised financial services Licence No 523 and registered credit
provider NCRCP7. Spain – Barclays Bank, S.A.U. es un banco español regulado por el Banco de España e inscrito en el registro de bancos y banqueros del Banco de
España con el nº 0065. Domicilio social: Plaza de Colón, 1 28046 Madrid. Inscrito en el R.M. Madrid, T. 3755, F.1, Hoja M62564, I. 1381. NIF: A47001946. Switzerland –
Barclays Bank (Suisse) SA is a Bank registered in Switzerland and regulated and supervised by FINMA. Registered No. CH-660.0.118.986-6. Registered Office: Chemin
de Grange-Canal 18-20, P.O. Box 3941, 1211 Geneva 3, Switzerland. Registered branch: Beethovenstrasse 19, P.O. Box, 8027 Zurich. Registered VAT No. CHE-
106.002.386. Barclays Bank (Suisse) SA is a subsidiary of Barclays Bank PLC. United Arab Emirates (Dubai International Financial Centre) – Barclays Bank PLC in the
Dubai International Financial Centre (Registered No. 0060) is regulated by the Dubai Financial Services Authority. Barclays Bank PLC DIFC Branch may only undertake
the financial services activities that fall within the scope of its existing DFSA licence. Principal place of business: Wealth and investment management, Dubai
International Financial Centre, The Gate Village Building No. 10, Level 6, PO Box 506674, Dubai, UAE. This information has been distributed by Barclays Bank PLC DIFC
Branch. Related financial products or services are only available to Professional Clients as defined by the DFSA.
Barclays Private Clients International Limited, part of Barclays, is registered in the Isle of Man. Registered Number: 005619C. Registered Office: Barclays House, Victoria Street,
Douglas, Isle of Man, IM99 1AJ. Barclays Private Clients International Limited is licensed by the Isle of Man Financial Services Authority, and authorised and regulated by the
Financial Conduct Authority in the UK in relation to UK regulated mortgage activities. Barclays Private Clients International Limited, Jersey Branch is regulated by the Jersey
Financial Services Commission. Barclays Private Clients International Limited, Jersey Branch has its principal business address in Jersey at 13 Library Place, St. Helier, Jersey JE4 8NE,
Channel Islands. Barclays Private Clients International Limited, Jersey Branch is regulated by the Guernsey Financial Services Commission under the Protection of Investors
(Bailiwick of Guernsey) Law 1987 as amended.


![[D0009] 1 Ounce Troy New Coin,Promotions100pcs/lot , …allengelhard.com/wp-content/uploads/2014/04/D0009-1-Ounce-Troy-New...Krugerrand Gold Coins Without Copy,Copper Core Krugerrand](https://img.pdfslide.us/doc/110x75/5aada5b07f8b9a9c2e8e9729/d0009-1-ounce-troy-new-coinpromotions100pcslot-gold-coins-without-copycopper.jpg)