Embed Size (px)
Citation preview

. Mineral Land Assessment
I Open File Report/If88 °
| Mineral Investigation of the Muleshoe study area, | Cochise and Graham Counties, Arizona
I I
! !
!
! !
!
I t ' ~ : ~ ' " '~' ~ ~ ~ , . ~. .~o~' UNITED STATES DEPARTMENT OF THE INTERIOR
I

i
!:i ~i
i - , . , . ~ , " ; ' " '. '~. ' . ..
MINERAL INVESTIGATION OF THE MULESHOE STUDY AREA, COCHISE AND GRAHAM COUNTIES, ARIZONA
by
Russell A. Schreiner
MLA 43-88 1988
~Ov ~, ~ 1988
Intermountain Field Operations Center Denver, Colorado
UNITED STATES DEPARTMENT OF THE INTERIOR Donald P. Hodel, Secretary
BUREAU OF MINES T S Ary, Director

I I I I |
I
This open-file report summarizes the results of a Bureau of Mines mineral
study requested by the Bureau of Land Management. The report is preliminary
and has not been edited or reviewed for conformity with the Bureau of Mines
editorial standards. This study was conducted by personnel from the Resource
Evaluation Branch, Intermountain Field Operations Center, P.O. Box 25086,
Denver Federal Center, Denver, CO 80225.
i!!ili~? •
!!I ¸

: . , - . . . . . . _ - ' : . . . . . . . . - ~ ' : : . , . . : . . . . ~ .. • : . . ,
!!!i ̧ ¸
I I I I I I I I I I I I I I I I I
CONTENTS
Page
Summary . . . . . . . . . . . . . . . . . . . . . . . . . . . . . . . . . . . . . . . . . . . . . . . . . . . . . . . . . . . . . . . . . . l
I n t roduc t i on . . . . . . . . . . . . . . . . . . . . . . . . . . . . . . . . . . . . . . . . . . . . . . . . . . . . . . . . . . . . . 2
Geographic se t t i ng . . . . . . . . . . . . . . . . . . . . . . . . . . . . . . . . . . . . . . . . . . . . . . . . . . 4
Method of i n v e s t i g a t i o n . . . . . . . . . . . . . . . . . . . . . . . . . . . . . . . . . . . . . . . . . . . . . 4
Previous i nves t i ga t i ons . . . . . . . . . . . . . . . . . . . . . . . . . . . . . . . . . . . . . . . . . . . . . 5
Geologic se t t i ng . . . . . . . . . . . . . . . . . . . . . . . . . . . . . . . . . . . . . . . . . . . . . . . . . . . . . . . . . 5
Mining h i s t o r y . . . . . . . . . . . . . . . . . . . . . . . . . . . . . . . . . . . . . . . . . . . . . . . . . . . . . . . . . . . 7
Geothermal . . . . . . . . . . . . . . . . . . . . . . . . . . . . . . . . . . . . . . . . . . . . . . . . . . . . . . . . . . . . . . . B
Oi l and gas . . . . . . . . . . . . . . . . . . . . . . . . . . . . . . . . . . . . . . . . . . . . . . . . . . . . . . . . . . . . . . 8
Appraisal of s i t es examined . . . . . . . . . . . . . . . . . . . . . . . . . . . . . . . . . . . . . . . . . . . . . . 9
Now prospects . . . . . . . . . . . . . . . . . . . . . . . . . . . . . . . . . . . . . . . . . . . . . . . . . . . . . . . 9
Teran Basin area . . . . . . . . . . . . . . . . . . . . . . . . . . . . . . . . . . . . . . . . . . . . . . . . . . . . lO
Jackson Cabin area . . . . . . . . . . . . . . . . . . . . . . . . . . . . . . . . . . . . . . . . . . . . . . . . . . I I
I n d u s t r i a l mater ia ls . . . . . . . . . . . . . . . . . . . . . . . . . . . . . . . . . . . . . . . . . . . . . . . . 12
Stream-sediment data . . . . . . . . . . . . . . . . . . . . . . . . . . . . . . . . . . . . . . . . . . . . . . . . . . . . . 12
Conclusions . . . . . . . . . . . . . . . . . . . . . . . . . . . . . . . . . . . . . . . . . . . . . . . . . . . . . . . . . . . . . . 14
References . . . . . . . . . . . . . . . . . . . . . . . . . . . . . . . . . . . . . . . . . . . . . . . . . . . . . . . . . . . . . . . 15
Plate I .
ILLUSTRATIONS
Mine and prospect map of the Muleshoe study area, Cochise at and Graham Counties, Arizona . . . . . . . . . . . . . . . . . . . . . . . . . . . . . . . . back
Figure l .
.
Index map of the Muleshoe study area, Cochise and Graham Counties, Arizona . . . . . . . . . . . . . . . . . . . . . . . . . . . . . . . . . . . . . . . . . . . 4
Sketch map of workings on the Now claims showing sample l o c a l i t i e s 22-26 . . . . . . . . . . . . . . . . . . . . . . . . . . . . . . . . . . . . . . . . . . . . 16
i i

I I I I I I I I I I I
Table l .
.
TABLES
Pa~e
Analytical results and sample descriptions for chip and grab samples from in and near the Muleshoe study area . . . . . . . l?
Analytical results for stream-sediment samples from in and near the Muleshoe study area, Arizona . . . . . . . . . . . . . . . . . . . . . . . 21
UNIT OF MEASURE ABBREVIATIONS USED IN THIS REPORT
°C degree celsius
f t foot
in. inch
mi mile
ppb part per b i l l ion
ppm part per mill ion
% percent
Ib pound
oz troy ounce
oz/st troy ounce per short ton
FIIII
i! i!~,,;i;
ili¸ ~,
iI i i i

I I I I I I I I I I I I I I I I I I
MINERAL INVESTIGATION OF THE MULESHOE STUDY AREA, COCHISE AND GRAHAM COUNTIES, ARIZONA
by
Russell A. Schreiner, Bureau of Mines
SUMMARY
In February and March 1988, at the request of the Bureau of Land
Management, the Bureau of Mines conducted a mineral investigation of the
Muleshoe study area comprising approximately 60,000 acres in Cochise and
Graham Counties, Arizona. Bureau personnel mapped and sampled mines,
prospects, and mineralized zones to appraise identified mineral resources and
conducted a reconnaissance sediment survey to identify areas favorable for
resources.
The study area lies at the southern end of the northwest-trending Galiuro
Mountains and consists of Cretaceous- to Tertiary-age volcanic and sedimentary
rock units. There has been no mineral production from the area and i t is not
in any organized mining d is t r ic t .
Occurrences of base and precious metals in vein/fault type deposits were
identified at the Now prospects in the study area and within I/4 mi of the
southern and northern boundaries of the study area in Teran Basin and 3ackson
Cabin areas, respectively. Anomalous metal concentrations were present in
stream-sediment samples from Redfield Canyon in the north-central part of the
study area and Teran Basin within l mi of the southern boundary. Two areas,
the Now prospects and part of Redfield Canyon, warrant additional exploration
in the Muleshoe study area.
The Now prospects and v ic in i ty is considered to be favorable for
resources of copper and silver. Although no resources were identified,
additional silver-bearing tetrahedrite mineralization is inferred at depth in

extensions of fault zones. Increases in size and grade of the mineralization
at depth are conjectural, but the possibi l i ty exists. A detailed f ield
examination of the area, including additional sampling and trenching, would be
necessary to determine the extent and nature of the mineralization.
I I I
The geochemical anomaly in Redfield Canyon appears to be associated with
a mineral occurrence or deposit, and the area around the anomaly is considered
favorable for the occurrence of gold, arsenic, copper, and molybdenum. No
occurrences or resources of these metals were identified in outcrop in the
area. A detailed f ield examination, including additional sampling, would be
I I I
necessary to identify possible mineralization in this area.
Sand and gravel occurs in the canyons in the study area but the
inaccessibility of the area and the abundance of sand and gravel throughout
the region would preclude anything but local use.
The U.S. Geological Survey has rated the petroleum potential of the study
area as low.
The Arizona State Bureau of Geology and Mineral Technology has rated the
I I I
area surrounding Warm Springs and Hookers Hot Springs in the southeastern part
of the study area favorable for low temperature geothermal resources.
INTRODUCTION
The Muleshoe study area is one of two tracts of land in the Galiuro
Mountains acquired in 1986 by the U.S. Bureau of Land Management (BLM) in a
I i I
land exchange with the Arizona State Land Department. The Muleshoe study area
comprises 60,000 acres in Cochise and Graham Counties, Arizona, administered
by the BLM Safford d is t r ic t office. In February and March of 1988, the Bureau
of Mines conducted a mineral investigation to provide current data on mines,
prospects, and mineralized areas to appraise identified mineral resources and
areas favorable for resources in the study area to aid in developing a
resource management plan for the Safford d is t r ic t .
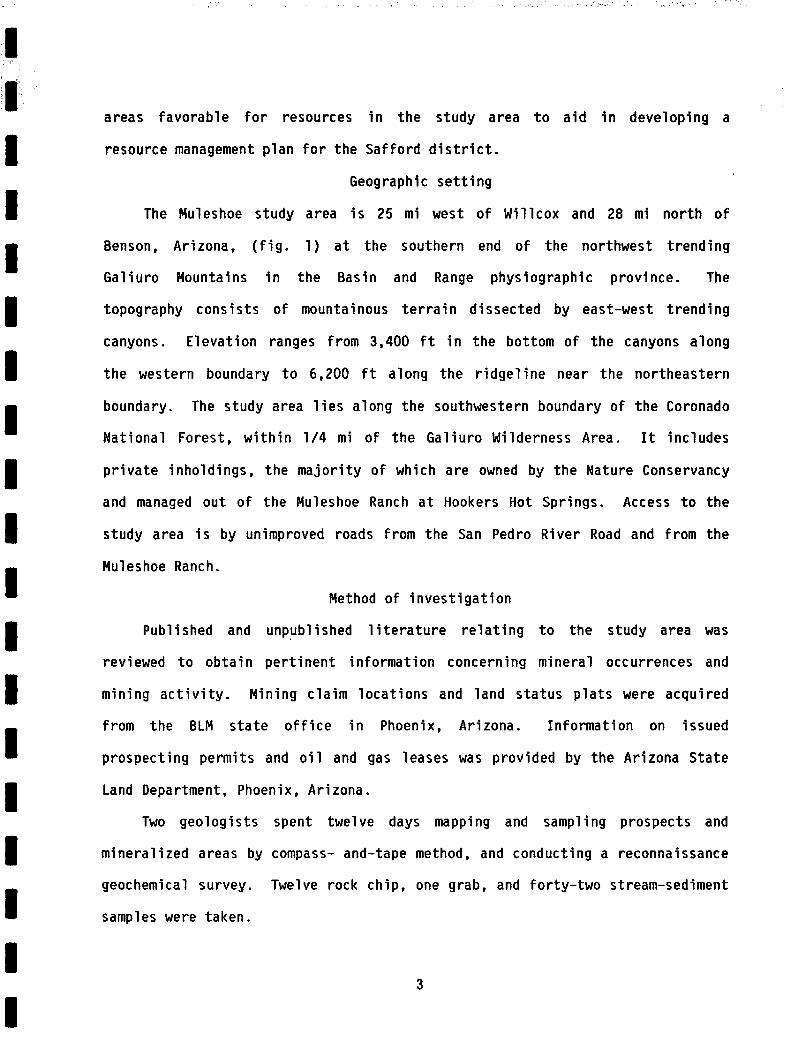
Geographic setting
The Muleshoe study area is 25 mi west of Willcox and 28 mi north of
I I I
Benson, Arizona, (f ig. l ) at the southern end of the northwest trending
Galiuro Mountains in the Basin and Range physiographic province. The
topography consists of mountainous terrain dissected by east-west trending
canyons. Elevation ranges from 3,400 f t in the bottom of the canyons along
the western boundary to 6,200 f t along the ridgeline near the northeastern
I I I
boundary. The study area l ies along the southwestern boundary of the Coronado
National Forest, within I/4 mi of the Galiuro Wilderness Area. I t includes
private inholdings, the majority of which are owned by the Nature Conservancy
and managed out of the Muleshoe Ranch at Hookers Hot Springs. Access to the
study area is by unimproved roads from the San Pedro River Road and from the
Muleshoe Ranch.
Method of invest igat ion
I I I
Published and unpublished l i t e ra tu re re la t ing to the study area was
reviewed to obtain pert inent information concerning mineral occurrences and
mining a c t i v i t y . Mining claim locations and land status plats were acquired
from the BLM state o f f i ce in Phoenix, Arizona. Information on issued
prospecting permits and o i l and gas leases was provided by the Arizona State
I I I
Land Department, Phoenix, Arizona.
Two geologists spent twelve days mapping and sampling prospects and
mineralized areas by compass- and-tape method, and conducting a reconnaissance
geochemical survey. Twelve rock chip, one grab, and for ty- two stream-sediment
samples were taken.

I
I
I
I I I I I I
I I I I I
I
I
I I I
110°30 ' 3 2 ° 3 0 ' ~ . .
32015 '
3Poo0 '
R. 19E. R. 2OE. 110o15' R. 21E. R. 2 2 E .
[~ , G a l i u r o f " ~ ~ CORONaOOi !]'i I W|ldernesi ~ ~ 1 ~ ~ NATIONAL i
i I f . . - % ~ I " : / . %.~-~. ~ I FOREST I
• I s - ' 4 " ~ ~ m . . . . . " ' r ' I ~J~I~_UII~IIUI#j '¢.."~.| GRAHAM COUNTY
_~°~'~--I'- . . . . . . ~ E%~ ~ .~ i couNTy Redington ~1 - - ~ ~ %~ i "% .=0 ' , I~ ~\1 . "1 ~t-udy~ ~ I . CORONaO0
~ r e ~ ~' ~,~ NATIONAL ~- . L-- I ~.~
~ i - ' ~ ' - " ~ ~ L
_.,..,1.( co,oo~,, ,/" '-"~ "~ i
_ ...... e', "~\~=,~ "*i I .~..0~ 0 F L A T
i :3"~ • I r - ' , ~
NATIONAL j
' ~ ~ " i
FOREST i : ~ '~ (
I r -J ~ ; ~f~ ~ ~ _ ~ .y : . . . . ~ I ~
_.J . ~ , . . . . . . . , L . . \ ~ /
~1_= O I
° ° ~ ~ , e'-
~ _ ~ , ~ I Bensoh~ I I I I I
I 110o30 '
MAP LOCATION
\ ',o
110015 '
0 5 I0 15
EXPLANATION
INTERSTATE/U.S. HIGHWAY
IMPROVED ROAD
20mi I
I10O00 t 3 2 o 3 0 '
T. II S.
T. 12 S.
T. 1:3 S.
32 ° 15'
1". 14 S.
1". 15 S.
T. 16 S.
32000 '
1". 17 S.
I10O00 '
r'~.~- " '~-..- ' ' - ' ~ UNIMPROVED ROAD
NATIONAL FOREST BOUNDARY
Figure 1. - - Index map of the Muleshoe study area, Cochise and Graham Counties, Arizona.

Analytical determinations were made by Bondar-Clegg, Inc., Lakewood,
Colorado. All samples were analyzed for gold by f i re assay-atomic absorption
spectroscopy and for an additional thirty-one elements by direct-coupled
plasma emission spectroscopy, using a multiacid total digestion. Samples
I I I
containing metal concentrations over the upper detection l imits were then
re-analyzed for silver by f i re assay, for copper by atomic absorption
spectroscopy, for barium by X-ray fluorescence and for arsenic and antimony by
titrametric method.
In addition to the analytical determinations, a polished section and a
polished thin section of vein material, and thin sections of altered host
rocks at the Now prospects were examined under a petrographic microscope.
I I I
Identif ication of metallic minerals was then verified by microprobe analysis
by Peter Modreski, U.S. Geological Survey, Denver, CO.
Previous investigations
Reconnaissance geologic maps of the study area have been published by
Creasey and others (1961) and Creasey and Krieger (1978). Creasey and others
I I I
(Ig81) evaluated the mineral potential of the Galiuro Wilderness Area, and
their evaluation and geologic mapping at a scale of 1:62,500 included the
northern part of the Muleshoe study area. Detailed mapping at a scale of
1:24,000 of the Cretaceous sedimentary and volcanic rocks in the southern part
of the study area was completed by Goodlin (1985) and Mark (1985). In the
I I I
northern part of the study area, detailed mapping of the Tertiary Galiuro
volcanics is currently in progress by 3ohn Quinby (unpublished Masters Thesis,
California State University at Hayward, California).
GEOLOGIC SETTING
The study area consists of exposed Cretaceous- and Tertiary-age volcanic
and sedimentary rock units of the Willow Canyon Formation, Muleshoe volcanics,
5

ili Cascabel Formation, Galiuro volcanics, and the Quiburis Formation (pl. l ) .
The geology and structure as described below is taken from Goodlin (1985),
Mark (1985), and Creasey and others (Ig81).
Cretaceous rocks crop out in the southwestern part of the study area,
I I I
where the overlying Galiuro volcanics have been eroded away. The Willow
Canyon Formation of the Bisbee Group, is the oldest formation exposed in the
study area, consists of interbedded green-gray to brown-red quartzose
conglomerate, sandstone, and siltstone and red and green mudstone and shale.
The Willow Canyon Formation is overlain unconformably by the Muleshoe
I I I
volcanics, a heterogenous group of purple andesite breccias with less abundant
rhyolite breccia, tu f f , lahar deposits, mudstone, sandstone, and
conglomerate. The Muleshoe volcanics are overlain conformably by the Cascabel
Formation, consisting of red-brown to red-gray indurated conglomerate,
sandstone, siltstone, and mudstone with clasts derived from the Muleshoe
I I I
volcanics and the Bisbee Group.
The middle Tertiary Galiuro volcanics are made up of andesite, dacite,
la t i te , and rhyolite flows, rhyolite and la t i te welded ruffs, and
conglomerate. This series lies unconformably on the older Cretaceous
formations, covering the northern half of the study area and extending in a
narrow strip down to the southern boundary in the eastern part of the study
area.
The upper Tertiary Quiburis Formation is the youngest rock unit and lies
unconformably on al l other units. I t consists primarily of poorly
consolidated conglomerate with clasts derived primarily from the Galiuro
I I I
volcanics. The formation is exposed a l l along the southeastern boundary and
on Soza Mesa in the southwestern part of the study area.

I I I I I I I I I I I I I I I I I
The area is structurally complex and has undergone four major
deformational events; early Cretaceous r i f t ing , late Cretaceous to early
Tertiary Laramide compression, middle Tertiary extension, and late Tertiary
basin and range faulting.
MINING HISTORY
The Muleshoe study area is not within any organized mining d is t r i c t and
there has been no mineral production. Two claims, the Now #1 and #2 in the
NE. I/4 sec. 22, T. 12 S., R. 20 E., (referred to in this report as the Now
prospects) abandoned in lgBS, and an application for a state prospecting
permit in 1968 in the same area (sec. 15 and 22, T. 12 S., R. 20 E.) are the
only records of any act iv i ty in the study area. Most of the act iv i ty in the
Galiuro Mountains has been in the Copper Creek (Bunker Hi l l ) and Rattlesnake
mining distr icts 20 mi and 6 mi north of the study area, respectively. These
mining distr icts have no known relationship to the Muleshoe study area and are
presented here to inform the reader of the general character of mineral
deposits that have been exploited in the past in the Galiuro Mountain Range.
In the Copper Creek d is t r ic t , the f i r s t ore was shipped in 1863 but
quantitative production records are available only from 1905 to 1975. During
this time the d is t r ic t had production of 2?,300,000 Ib copper, 5,770,000 lb
lead, 4,150,000 Ib molybdenum, 190,000 oz silver and l,O00 oz gold (Keith and
others, 1983, p. 20) from breccia pipes and veins associated with the
Laramide-age Copper Creek porphyry copper system, which is 2,000 f t below the
surface.
From 1908 to 1940 the Rattlesnake d is t r ic t had production of 12,203 Ib
copper, 2,310 oz silver and 163 oz gold (Creasey and others, 1981, p. 34).

I I I !
I I I I I I I I I I I I I I
The production came from Miocene-age or younger vein-type deposits p r inc ipa l l y
from the Gold Mountain, Powers, and Long Tom Mines.
The Jackson Mine, 2 mi north of the study area, consists of a sha f t
reported to be 300 to 400 f t deep. No recorded production is known; i f
anything was produced, i t was probably assigned to the Rattlesnake d i s t r i c t .
The Jackson Mine is on a s i l i c i f i e d fau l t zone between andesite flows and ash
flow tu f fs . The fau l t zone str ikes N. 20 ° W., dips 60 ° SW., and contains
copper, gold, s i l ve r , and minor zinc, arsenic and antimony. (See Creasey and
others, 1981.) Several small workings have been cut along this fau l t zone on
shows of mineralized rock from the Jackson Mine toward the study area. A
small p i t containing chrysocolla, azur i te, and malachite within 1/4 mi of the
study area is the southernmost extension of v is ib le mineral ization along th is
fau l t .
GEOTHERMAL
Two thermal springs occur on and near the Muleshoe Ranch in the
southeastern part of the study area (p l . 1). Hookers Hot Springs and Warm
Springs have temperatures of 52°C and 33°C, respectively. Although no
geothermal leases have been issued, the area surrounding these thermal springs
was considered favorable for the development of low temperature (lower than
100°C) geothermal resources (Witcher and others, 1982).
OIL AND GAS
As of June 1988, no leases were present and no holes have been d r i l l ed
for o i l and gas in the study area. In the late 1970's, o i l and gas leases
issued to Anschutz Corporation covered a l l of the study area. The leasing of
large tracts of land was related to Anschutz's overthrust concept, which was
based on the idea that the Cordil leran Overthrust belt extends through Arizona
8

I I I I I I I I I I I I I I I I I
connecting the Idaho-Wyoming-Utah Fold/Thrust Bel t and the Chihuahua Fold/
Thrust Belt both of which have large petroleum reserves (Kei th , 1979). Ryder
(1983) rated the hydrocarbon po ten t ia l as low to zero in th is area due t o
r i f t i n g and volcanism.
APPRAISAL OF SITES EXAMINED
Occurrences of base and precious metals in v e i n / f a u l t type deposits were
i d e n t i f i e d at the Now prospects in the study area, and w i th in 1/4 mi of the
southern and northern boundaries in the Teran Basin and 3ackson Cabin areas,
respect ive ly .
Now prospects
The Now prospects are in the centra l part of the study area, in sec. 22,
T. 12 S., R. 20 E., ( p l . 1). The ma jo r i t y of the workings, two 20-f t -deep
shaf ts , two p i t s and a trench have been cut on or along four narrow s i l i c i f i e d
f a u l t zones exposed over a distance of 250 f t in brown conglomerates and
coarse grained sandstones of the Cascabel Formation ( f i g . 2). The f a u l t zones
are 0.5 to 2 f t wide, s t r i k e N. 50 ° to 80 ° W., dip 50 ° to 85 ° N., and could
not be traced fo r more than 25 f t along s t r i k e due to a l luv ium and vegetat ion
that covers much of the bedrock in the area. The fau l t s contain ve in le ts and
pods of primary t e t rahed r i t e contain ing inc lus ions of cha lcopyr i te and galena,
secondary cha lcoc i te , c o v e l l i t e , malachite, azu r i t e , and antimony oxide
( s t i b i c o n i t e ?) in a gangue of quartz, ba r i t e , brecciated wal l rock fragments,
and minor ca l c i t e . The wal l rock on the footwal l side has been bleached white
to l i g h t gray by q u a r t z - s e r i c i t e a l t e r a t i o n to least 4 f t out from the f a u l t
zones. The wal l rock on the hangingwall side of the f a u l t zones has a br ick
red co lor due to hematite, from ox idat ion of i ron-bear ing minerals.
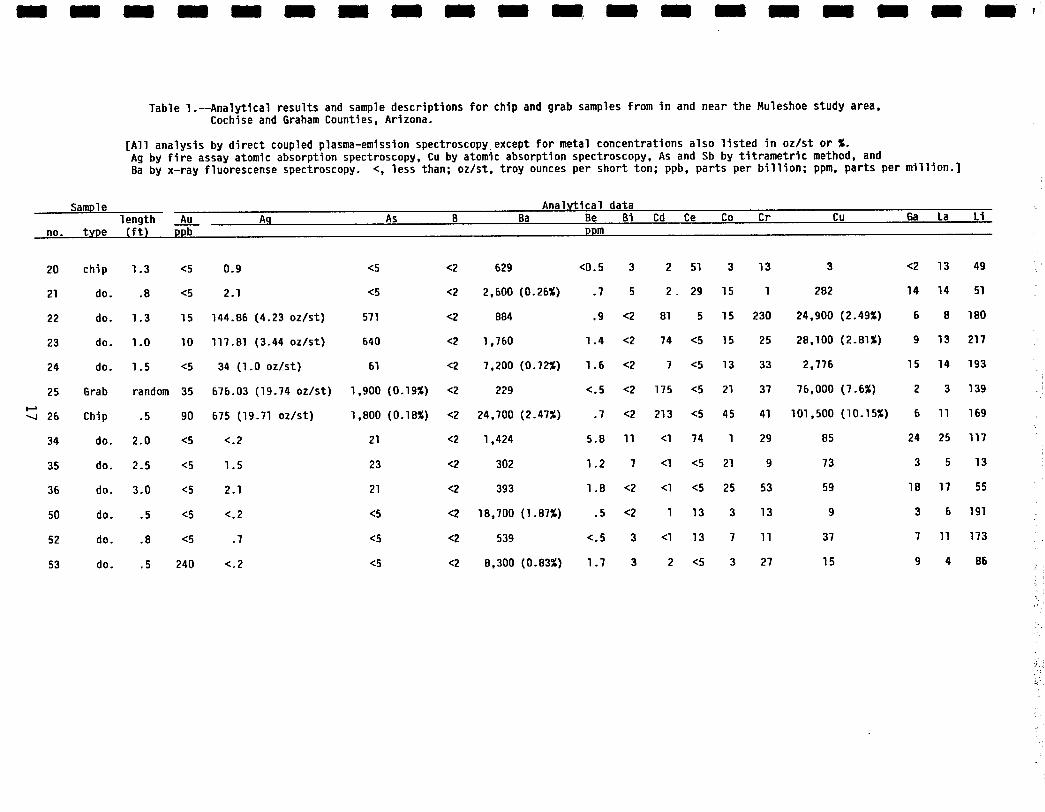
Four samples (22, 23, 24, 26) taken from the f a u l t zones contained 1.0 to
19.71 oz/st s i l v e r (average of 7.1 oz / s t ) , 0.28 to 10.15% copper (average of
9

I i I I I I I I I! I I I I I I I I I I
3.93%), 0.02 to 2.47% barium, and 0.1 to 2.72% antimony (table 1). In
addit ion, concentrations as high as 90 ppb gold, 0.18~ arsenic, 0.37% zinc,
213 ppm cadmium, 141 ppm lead, and 63 ppm molybdenum were present. A select
grab sample (25) from a small stockpile contained 19.74 oz/st s i l ve r , 7.60%
copper, 2.54% antimony, 0.41% zinc, 0.19% arsenic, 214 ppm lead, 175 ppm
cadmium, 55 ppm molybdenum, and 35 ppb gold. Microprobe analysis ver i f ied the
presence of argentian (s i lver-bear ing) tetrahedr i te.
Two addit ional shallow shafts were sunk on vein/ faul ts jus t to the north
and northwest of the main group of workings. Sample 20 from a 1.5-f t -wide
quartz and calc i te vein, s t r i k ing N. 37 ° W. and dipping 59 ° NE., contained low
concentrations of lead (121 ppm) and antimony (21 ppm). Sample 21 from a
lO-in.-wide s i l i c i f i e d fau l t zone, s t r i k ing N. 25 ° W. and dipping 50 ° SW.,
contained low concentrations of barium (0.26%), copper (282 ppm), and antimony
(73 ppm).
No resources were ident i f ied at the Now prospects because of l imited
outcrop exposure due to a l luv ia l cover but addit ional mineralized rock is
inferred in extensions of the fau l t zones. The presence of tet rahedr i te with
high s i l ve r concentrations warrants addi t ional , subsurface exploration to
determine the extent and nature of these occurrences. The mineralogy and
a l terat ion of these occurrences f i t the polymetal l ic vein model as described
by Cox (1986, p. 125) that may be associated with a buried copper-molybdenum
porphyry deposit.
Teran Basin area
At the north end of Teran Basin, in sec. 11, T. 13 S., R. 20 E., a few
narrow quar tz-bar i te-ca lc i te veins occur between 1 and 1/4 mi outside of the
study area. The veins trend toward the study area but appear to pinch
10

. . . . . . . . . . . . . i , .. i . . . . . . . . ! : ' : : ~ . ' . i ~
I I I I I I I I I I I I I I I I I
out 1/4 mi from the boundary. No evidence of extensions of th is
mineral ization was observed in the study area and sediment samples taken in
drainages that would cut the projection of the faul ts contained no anomalous
concentrations. The veins are exposed in a folded and highly faulted section
of conglomerate, sandstone, and mudstone of the Cascabel Formation and
andesite breccia of the Muleshoe volcanics. Most of the bedrock is covered by
alluvium, and the veins are exposed for distances of less than 80 f t along
s t r ike in small drainage cuts through this area. An 8-f t-wide shear zone (at
sample s i te 53), s t r i k ing N. 20 ° N. and dipping ve r t i ca l l y , contained several
1 /4 - in . - to 6-in.-wide quartz-bari te veins and was the largest mineralized
structure in the area. The presence of bar i te and bleaching of wallrocks due
to quar tz-ser ic i te a l terat ion along the veins were the only v is ib le evidence
of hydrothermal ac t i v i t y .
Samples 50, 52, and 53 were taken from three veins, a l l contained
concentrations of antimony (15 to 47 ppm). Sample 53, taken from the shear
zone, contained 240 ppb gold.
Jackson Cabin area
The Jackson Cabin area in secs. 9, 16, and 22, T. 11 S., R. 20 E. (p l .
1), includes the Jackson Nine and numerous small workings along a fau l t zone
between andesite flows and ash flow tuf fs of the Galiuro volcanics.
Occurrences of copper, gold, and s i l ve r and minor zinc, arsenic, and antimony
are found in s i l i c i f i e d zones along the fau l t from the Jackson Mine south to
within 1/4 mi of the Muleshoe study area. This area has been sampled, mapped
and described by Creasey and others (1981). The fau l t zone extends into the
Muleshoe study area, where i t is mostly covered by alluvium, and no surface
evidence of mineral ization was found during the f ie ld examination. Analyses
11

• ; . ; .~ .: ~. ""-c : . ' . . . . . . . - . ,
!I I I
of sediment samples taken from drainages cutting through the fault zone showed
no anomalous concentrations.
Industrial materials
No unique or valuable rock or rock materials that would be economical for
I I I
industrial use were identified in the study area. Sand and gravel occurs in
the canyons but the inaccessibility of the area and the abundance of sand and
gravel throughout the region would preclude al l but local use.
STREAM-SEDIMENT DATA
Forty-two stream-sediment samples, taken from drainages in and near the
I I I
study area as an aid in identifying mineralized areas, were dried and sieved
to -80 mesh fraction. Sample results were considered anomalous i f
concentrations exceeded the mean of the values (background) plus two times the
standard deviation (Hawkes and Webb, 1962). Metals with concentrations mostly
below the lower detection l imits, such as gold, could not be treated
I I I
stat is t ica l ly . Any gold concentrations at or above the lower detection l imit
were considered anomalous because its average abundance is below the l imi t of
detection of the analytical method used. Only anomalous concentrations of
gold, silver, arsenic, barium, copper, lead, molybdenum, and zinc are
discussed in the report. Other metals with concentrations that would be
I I I
considered anomalous using this simple stat ist ical method are not discussed
because their relationship to expected mineral deposit types in the area is
unknown.
Two areas, Redfield Canyon in the north central part of the study area
and Teran Basin within l mi of the south boundary, have a group of two or more
I I I
sample s i tes that contained anomalous metal concentrat ions. In both areas
v i s ib le mineral ized rock fragments were found near the sample s i tes .
12

I i '
I I
In Redfield Canyon, stream-sediment samples contained weakly anomalous
concentrations of gold (sample 2, 5 ppb; sample 6, 5 ppb), arsenic (sample 5,
39 ppm), copper (sample 5, lOl ppm), and molybdenum (sample 4, 3 ppm; sample
5, 5 ppm) (table 2). A rounded fist-sized cobble of quartz and chrysocolla
I I I I I I I I !
I
was found between sample sites 2 and 4. The closest known mineralized area
and possible source for the metal concentrations is the Jackson Mine and
associated workings 3-4 mi to the north. However, th is distance and the lack
of anomalous metal concentrations in samples 7, 8, and 9 far ther up the canyon
and closer to the mine workings, makes i t unl ikely that the Jackson Mine is
the source. Redfield Canyon makes an abrupt turn from south to west in th is
area suggesting a major structural control that might provide a favorable
conduit for hydrothermal f lu ids and mineral deposition.
In Te ran Basin, stream-sediment sample 55 contained anomalous
concentrations of gold (10 ppb), s i l ve r (6. l ppm), barium (2,700 ppm), and
molybdenum (3 ppm). Samples 54 and 55 had anomalous lead, 105 ppm and 73 ppm,
respectively. Several f i s t -s ized fragments of bar i te and quartz vein material
were found near sample s i te 55. The source of the gold and barium can be
traced to the shear zone at sample s i te 53 less than 1/4 mi up the drainage.
Anomalous concentrations of s i l ve r , lead, and molybdenum were not detected in
sample 53 or in the other samples of vein material in this area but these
metals could be present in other unexposed sections of the shear zone.
I I I
In addition to the two areas mentioned above, six other scattered sample
sites (17, 1B, 31, 33, 39, and 43) contained anomalous metal concentrations
the source of which is unknown.
Due to the nature of reconnaissance geochemical surveys, the wide spacing
and small number of sample sites from an area, they can only indicate areas of
13

I I I I I I I I I I !
I I I I I I
i n t e res t . Detai led surveys are required to determine i f the metal
concentrat ions are associated wi th a mineral occurrence or deposi t .
CONCLUSIONS
Two areas, the Now prospects and the geochemical anomaly in Redf ield
Canyon, warrant add i t iona l inves t iga t ion in the Muleshoe study area.
The Now prospects and v i c i n i t y is considered to be favorable fo r
resources of copper and s i l v e r . Although no resources were i d e n t i f i e d ,
add i t iona l s i l ve r -bea r ing te t rahed r i t e minera l i za t ion is in fer red at depth in
extensions of f a u l t zones. Increases in size and grade of the minera l i za t ion
at depth are con jec tu ra l , but the p o s s i b i l i t y ex is ts . A deta i led f i e l d
examination of the area, inc lud ing add i t iona l sampling and t renching, would be
necessary to determine the extent and nature of the m inera l i za t ion .
The geochemical anomaly in Redfield Canyon appears to be associated with
a mineral occurrence or deposit and the area around the anomaly is considered
favorable fo r the occurrence of gold, arsenic, copper, and molybdenum. No
occurrences or resources of these metals were i d e n t i f i e d in the area but the
anomaly suggests they are present. A deta i led f i e l d examination, inc lud ing
add i t iona l sampling, would be necessary, to i d e n t i f y possible m inera l i za t ion
in th is area.
Sand and gravel occurs in the canyons in the study area but the
i n a c c e s s i b i l i t y of the area and the abundance of sand and gravel throughout
the region would preclude a l l but local use.
The U.S. Geological Survey has rated the petroleum po ten t ia l of the study
area as low.
The Arizona State Bureau of Geology and Mineral Technology has rated the
area surrounding Warm Springs and Hookers Hot Springs in the southeastern part
of the study area favorable fo r low temperature geothermal resources.
14

I I I I I I I I I I i I I I I I I
REFERENCES
Cox, D. P., 1986, Descriptive model of polymetallic veins; i_nn Cox, D. P., and Singer, D. A., ed., Mineral deposit models: U.S. Geological Survey Bulletin 1693, p. 125.
Creasey, S. D., Jackson, E. D., and Gulbrandsen, R. A., 1961, Reconnaissance geologic map of parts of the San Pedro and Aravaipa Valleys, south-central Arizona: U.S. Geological Survey Mineral Investigation Field Studies Map MF-238, scale I:125,000.
Creasey, S. C., Jinks, J. E., Williams, F. E., and Meeves, H. C., 1981, Mineral resources of the Galiuro wilderness and contiguious further planning areas, Arizona: U.S. Geological Survey Bulletin 1490, 94 p.
Creasey, S. C., and Krieger, M. H., 197B, Galiuro volcanics, Pinal, Graham, and Cochise Counties, Arizona: U.S. Geological Survey Journal of Research, vol. 6, no. l , p. ll5-131.
Goodlin, T. C., 1985, Stratigraphic and structural relations of the area south of Hot Springs Canyon, Galiuro Mountains, Arizona: University of Arizona unpublished M.S. thesis, lOl p.
Goodlin, T. C., and Mark, R. A., 1985, Geologic map of the Hot Springs Canyon area, Cochise County, Arizona: Arizona Bureau of Geology and Mineral Technology Miscellaneous map MM-85-D, scale 1:24,000.
Hawkes, H. E., and Webb, J. S., 1962, Geochemistry in Mineral Exploration, Harper and Row.
Keith, S. B., 1979, The great southwestern Arizona overthrust oil and gas play: Arizona Bureau of Geology and Mineral Technology Field Notes, v. 9, no. l , p. lO-14.
Keith, S. B., Gest, D. E., DeWitt, Ed, Toll, N. W., and Everson, B. A., 1983, Metallic mineral distr icts and production in Arizona: Arizona Bureau of Geology and Mineral Technology Bulletin 194, 58 p.
Mark, R. A., 1985, Structural and sedimentary geology of the area north of Hot Springs Canyon, southern Galiuro Mountains, Cochise County, Arizona: University of Arizona, unpublished M.S. thesis, 96 p.
Ryder, R. T., lgB3, Petroleum potential of wilderness lands in Arizona, i_nn Miller, B. M., ed., Petroleum potential of wilderness lands in the western United States: U.S. Geological Survey Circular 902-A-P, p. CI-C22.
Witcher, J. C , Stone, Claudia, and Holman W. R., Sr., 1982 Geothermal • 9 B
resources of Arizona: State of Arizona Bureau of Geology and Mineral Technology, scale 1:500,000.
15

I , Bleached 25 ~ .,-...
/ , l , °
.. "~ . . :o'; . .": I . e , ' % ~ I ; • " o . " . : : : 6"'_'.1°~ ~ _ ~ . ~
.1 . ,o . - . . - - . . ;~ IP~,:'r, • :'.A.'. :,-',..'.'.'.'.'.'.'.'.~#.,~ ~ ~ ' , i " I - # ' | 7 ~ 6 " # ~g . * E D - I _ . , p ~ e o ~ , o m ~ , , . , e , o ~ m B,, ,a0hed' '~ " ;~ '~ ~ f , , . ° : 1; ' ." : ;~
• " j o " - y * ' : ' ~ o '~ . e . ~ ~" ,s . . . ~ : , . , : ,.. ' .. . "- . , ,
o * . , , ~ " i •
'; : .*; ". ,o .' . , . l i?:i! •
I ' k / ~. . . . . , . ' , ~?.... •
I / ~ / ",:~,-" :':. ; ' EXPLANATION / /
i ~ o 25
I ~ ~ 8 5
25 ! - - 2 • • • i • •
I I • I I I I l i~
| o
i ~f~ 26 , .~..: "°';;*" :; . . . . . . . . . I i . °o . . ~ o " .
i . . . ,,.-~: ; . ' : . . : . - . . . , . , - . , . -...,•. , . ' . -~...o .'.~: (
'°-"-V- 50 ~. - ." - .,. -. " . ~.'- "'o --. "-'-- "~ ,£ . . . • . . . . ,~ , , . . - . . ~ - . . . . . ; . . . . . . . .-~.~;.,~,~ ~ . . . ~ ..:o..,.. :
• ~ _ . ' . . . ~ . ' ~ . . , ' : " . ; ? ; : " - ~ ' " : ~ . , r ;';::~,'. i i t • ~ . _ . - . : , . . . ~ . : . . ~ - - o . . o . , ,~ ... -.., -: ,-'.
I ............... × F"":;. • ~ . , . . : - . . . - . 2 5 . ~-.~%
-N-
O 4 O f t I I I
SAMPLE LOCALITY--Showing sample number
MINERALIZED FAULT--Showing strike and dip; dashed where approximate
STRIKE AND DIP OF BEDDING
TRENCH
PIT
SHAFT
STOCKPILE
ROAD
INTERMITTENT STREAM
CRETACEOUS CASCABEL FORMATION-- Brown, coarse-groined sandstone and conglomeratic sandstone
Figure 2. - -Sketch map of workings on the Now claims showing sample l o c a l i t i e s 22-26.
16
m i u M u m BBI m BBI BBI m M U m m m m B m
Table 1 . - -Ana ly t i ca l results and sample descript ions fo r chip and grab samples from in and near the Muleshoe study area, Cochise and Graham Counties, Arizona.
[A l l analysis by d i rec t coupled plasma-emission spectroscopyexcept fo r metal concentrat ions also l i s t e d in oz/s t or %. Ag by f i r e assay atomic absorption spectroscopy, Cu by atomic absorption spectroscopy, As and Sb by t i t r a m e t r i c method, and Ba by x-ray fluorescense spectroscopy. <, less than; oz/s t , t roy ounces per short ton; ppb, parts per b i l l i o n ; ppm, parts per m i l l i o n . ]
Sample Analy t ica l data length Au Ag As B Ba Be BI
no. type ( f t ) ppb ppm
2O
21
22
23
24
25 F ~
-~ 25
34
35
36
SO
52
53
Cd Ce Co Cr Cu Ga La
chip 1.3 <5 0.9 <5 <2 629 <0.5 3 2 5l 3 13 3 <2 13
do. .8 <5 2.1 <5 <2 2,600 (0.26%) .7 5 2 29 15 l 282 14 14
do. 1.3 15 144.86 (4.23 oz/st) 571 <2 884 .9 <2 81 5 15 230 24,900 (2.49%) 6 8
do. 1.0 I0 117.81 (3.44 oz/st) 640 <2 1,760 1.4 <2 74 <5 15 25 28,100 (2.81%) 9 13
do. 1.5 <5 34 (1.0 oz/st) 61 <2 7,200 (0.72%) 1.6 <2 7 <5 13 33 2,776 15 14
Grab random 35 676.03 (19.74 oz/st) l ,gO0 (0.19%) <2 229 <.5 <2 175 <S 21 37 76,000 (7.6%) 2 3
Chip .5 90 675 (19.71 oz/st) 1,800 (0.18%) <2 24,700 (2.47%) .7 <2 213 <5 45 41 101,500 (10.15%) 6 11
do. 2.0 <5 <.2 21 <2 1,424 5.8 11 <1 74 1 29 85 24 25
do. 2.5 <5 1.5 23 <2 302 1.2 7 <1 <5 21 9 73 3 S
do. 3.0 <5 2.1 21 <2 393 1 .B <2 <1 <5 25 53 59 18 17
do. .5 <5 <.2 <5 <2 18,700 (1.87%) .5 <2 1 13 3 13 9 3 6
do. .8 <5 .7 <5 <2 539 <.5 3 <1 13 7 11 37 7 11
do. .5 240 <.2 <5 <2 8,300 (0.83%) 1.7 3 2 <5 3 27 15 9 4
Li
4g
51
180
217
193
139
169
117
13
55
191
173
86

m m m m m m m m m m m m m m m m m mini
Table 1 . - -Ana ly t i ca l resu l ts and sample descr ip t ions fo r chip and grab samples from in and near the Muleshoe study area, Cochise and Graham Counties, Arizona--Continued
Analytical data Sample Mo Nb Ni Pb Rb Sb Sc Sn Sr Ta Te T1 V W Y Zn Zr
no. ppm Remarks
20 <l <l I I 121 <20 21 l <20 776 <lO <lO <lO B <lO 34 13 36
21 1 7 43 27 <20 73 5 <20 608 <lO <lO <lO 84 <lO lO lO1 73
p.a
oo
23
22 63 <l 55 141 35 13,200 (1.32%) 2 <20 252 <lO <lO <lO 33 <lO B 1,030 33
29 3 23 97 54 I0,500 (1.05%) 4 <20 268 <lO <lO <lO 56 <lO 9 1,020 43
24 3 5 27 13 57 1,078 I0 <20 83 <lO <lO <lO 74 <lO 9 380 60
25 55 <I
Shaft , 12-f t-deep; qua r t z -ca l c i t e vein s t r i k i ng N. 37 ° W. and dipping 59 ° NE. in conglomerate of Cascabel Formation; specular hematite, conglomerate, hematite s ta in .
Shaft inclined 50 ° to SW., 18 ft deep; sillcified fault zone striking N. 25 ° W. dipping 50 ° SW. in andeslte breccia of Muleshoe volcanlcs; barite, calcite, hematite stain.
S i l i c l f i e d f a u l t zone, s t r i k i n g N. 80 ° E. and dipping B5 ° N. in coarse- grained sandstone of Cascabel Formation; te t rahedr i te , cha lcoc i te , malachite, azur i te , brecciated w a l l - rock, minor ca l c i t e , hematite- llmonlte stain.
S i l f c i f i e d f a u l t zone, p a r t i a l l y exposed, s t r i k i ng N. BO ° E. and dipping B5 ° N. in coarse-grained sandstone of Cascabel Formation; te t rahedr t te , chalcoc i te , malachite, azur i te , brecciated wal l rock, bar i te , minor ca l c i t e , hemat i te- l imoni te s ta in .
S t l i c i f i e d f a u l t zone, s t r i k i n g N. 76 = E. and dipping 72 ° NW. in coarse-grained sandstone of Cascabel Formation; te t rahedr l te , chalcoct te, malachite, azur i te , ba r i t e .
33 214 26 25,400 (2.54%) 1 <20 161 <10 <10 <10 31 <lO 4 4,067 26 Stockpile, pieces of silicified fault material, tetrahedrite, chalcopyrite, chalcocite, malachite, azurite, brecciated wallrock, bar i te , minor ca l c i t e , hematite- limonlte stain, pyrolusite stain.

m m mm mm m m mm m m m m m m m mm m n m m
Table 1 . - -Ana l y t i ca l resu l ts and sample descr ipt ions fo r chip and grab samples from in and near the Muleshoe study area, Cochise and Graham Counties, Arizona--Continued
Analytical data Sample Mo Nb Ni Pb Rb Sb Sc Sn Sr Ta Te TI V W Y Zn Zr
no. ppm Remarks
26 17 7 41 95 34 27,200 (2.72%) 7 <20 296 <lO <lO <lO 90 <lO 13 3,735 54
34 3 I I I I I I 93 <5 1 <20 417 <lO <10 <lO 21 <lO 20 l l 7 I f6
36
35 1 <l 39 7 23 <5 <l <20 195 <lO <lO <lO 25 <lO 2 55 44
l 3 65 I I 153 <5 5 <20 91 <10 <10 <10 29 <10 17 93 48
50 <l <l 17 47 22 47 1 <20 411 <10 <10 <10 10 <10 B 21 20
S t l t c i f t e d f a u l t zone, p a r t i a l l y exposed, s t r i k i ng N. 80 e E. and dipping 50 ° NW.; t e t rahed r i t e , cha lcoc i te , malachite, azur i te , brecclated wal l rock, bar i te , minor c a l c i t e .
Faul t zone, low angle f a u l t s t r i k i n g No 30 ° W. between andesite of Galturo volcantcs and sandstone and mudstone of Wil low Canyon Formation, wal l rock fragments and c lay gouge.
Faul t zone, s t r i k i ng N. 40 = W. and dipping 1B ° SW. between andestte of Gal iuro volcantcs and conglomerate of Wil low Canyon Formation; andesite and conglomerate fragments, c lay gouge, ca l c i t e , hematite s ta in .
52 <1 <1 15 27 57 43 3 <20 13 <10 <10 <10 23 <10 7 43 28
Faul t zone, s t r i k i ng N. 40 ° and dipping 15 ° SW., c lay gouge, andesite and sandstone fragments, ca l c i t e , hematite s ta in ; ground mass of andesite a l t e r i ng to green caladontte.
Quartz-bar i te vein s t r i k i n g N. 40 ° W. and dipping 70 ° N; in andestte breccia of Ruleshoe volcanics.
Quar tz -ca lc i te vein s t r i k i n g N. 20 = E. and dipping v e r t i c a l l y in andesite breccia of Muleshoe volcanics; brecciated andesite and quartz fragments, minor bar i te , andesite bleached white to l i g h t gray next to vein.

M m m m m m U m m m m ; m m m U M W N m
Table 1 . - -Ana ly t i ca l resul ts and sample descript ions f o r chip and grab samples from in and near the Muleshoe study area, Cochise and Graham Counties, Arizona--Continued
Analy t ica l data Sample Mo Nb Nt Pb Rb Sb Sc Sn Sr Ta Te T1 V W Y Zn Zr
no. ppm Remarks
53 <1 <1 13 31 28 15 1 <20 157 <10 <10 <10 9 <10 4 17 23 quar tz -bar i te vein in B- f t -wide shear zone s t r i k i ng N. 20 ° W. and dipping v e r t i c a l l y In interbedded sandstone and mudstone of the Cascabel Formation; several quar tz -bar i te veins up to 0.5 f t wide in shear zone; brecciated wal l rock, minor ca l c i t e ; mudstone bleached white next to veins.
r ~ o

mm mm m mm ibm m m m m m R m m mm I I m m m mm L m
N~
IN)
Table 2 . - - A n a l y t i c a l r e s u l t s f o r stream-sediment samples f rom in and near the Huleshoe study area, Cochtse and Graham Count ies, Ar izona.
[Ana lys is by d i r e c t coupled plasma emission spect roscopy except f o r samples noted w i t h an a s t e r t k * by atomic absorp t ion spectroscopy; <, less than, na, not a p p l i c a b l e . ]
A n a l y t i c a l data Sample Au Ag As B Ba Be Bi Cd Ce Co Cr Cu Ga La Lt Ho Nb
no. ppb ppm
l <5 1 .5 5 <2 675 2.7 5 <1 <5 29 115 59 26 44 51 1 22 2 5 1 .5 7 <2 606 .9 3 <l <5 27 105 61 22 36 39 l 14 3 <5 1.7 15 <2 642 1.6 <2 <1 <5 27 113 61 19 10 19 1 9 4 <5 2.5 9 <2 652 2.3 3 <1 <5 39 230 67 11 26 45 3 9 5 5 2.5 5 <2 566 1.6 7 <l <5 25 79 51 22 22 30 l 5 6 <5 4 .9 39 <2 623 2.2 5 2 <5 53 312 10l 20 43 46 5 27 7 <5 2.1 13 <2 765 2.8 5 <1 21 25 69 63 23 35 43 l 18 8 <5 1.5 <5 <2 109 .9 <2 <1 15 29 167 65 9 33 37 <1 5 9 <5 2.5 21 <2 622 2 7 1 <5 29 87 49 8 12 24 1 7
10 <5 2.5 21 <2 618 1.5 3 <1 <5 37 222 77 14 11 16 1 3 l l <5 1.7 5 <2 591 1.8 <2 <1 <5 33 151 81 7 15 27 l <1 12 <5 3.1 5 <2 650 2.4 5 <1 <5 37 202 71 11 51 61 1 22 13 <5 1 .5 <5 <2 668 2.4 5 <1 <5 35 171 67 21 36 122 1 20 14 <5 2.5 11 <2 612 1.9 7 <1 <5 39 222 69 14 29 73 1 22 15 <5 1.1 11 <2 509 1.8 5 <1 <5 25 113 63 1 6 41 1 <1 16 <5 3.5 23 <2 780 1.1 7 <1 <5 47 284 75 16 19 46 1 4 17 <5 3 .5 35 <2 78B 1.1 1 <1 <5 43 179 67 17 25 53 3 10 18 <5 2.3 25 <2 445 2.4 5 <1 <5 31 79 63 25 39 81 1 25 19 <5 .7 5 <2 340 1.4 5 <1 <5 13 25 45 15 23 73 1 7 27 <5 .7 <5 <2 418 1.6 5 <1 <5 17 19 39 13 26 91 1 9 28 <5 2.3 25 <2 505 1.7 <2 <1 <5 33 43 47 25 30 67 1 34 29 <5 .7 <5 <2 189 <.5 7 <1 <5 9 19 33 8 16 46 1 3 30 <5 .9 <S <2 304 .5 7 <1 <5 17 37 49 9 17 58 <1 11 31 <5 2.5 37 <2 326 1 5 l <5 25 57 47 35 19 60 1 19 32 <5 1 .5 <5 <2 318 1.2 7 <1 <5 17 35 47 11 18 60 <1 12 33 <5 2.1 11 <2 360 1.3 5 <1 <5 17 39 B7 12 22 73 1 10 37 <5 2.1 7 <2 475 2.2 5 <1 <5 25 73 43 19 29 35 1 9 38 <5 2.1 7 <2 567 2.1 3 <1 <5 29 129 47 19 35 28 1 18 39 <5 3.3 17 <2 534 2.2 3 <1 <5 37 171 53 17 41 31 1 29 40 <5 3.5 21 <2 540 2.1 <2 <1 <5 41 208 57 21 53 25 1 34 41 <5 3.5 13 <2 556 2.7 3 <1 <5 35 173 37 17 47 36 1 26 42 <5 3.1 35 <2 790 2.3 5 <1 <5 37 173 53 25 46 65 1 21 43 <5 7 .3 47 <2 523 2.4 <2 1 <5 57 429 63 29 77 34 l 76 44 <5 4.1 23 <2 808 2.4 5 1 21 37 141 61 24 45 36 1 22 45 <5 3.5 11 <2 57B 1.8 5 2 <5 37 191 39 27 52 43 l 24 46 <5 2.9 <5 <2 595 3 5 1 <5 33 109 43 19 62 24 1 27 4? <5 3.3 13 <2 550 2.1 <2 <1 <5 33 41 45 24 34 74 1 36 48 <5 3.1 9 <2 523 2 3 l <5 27 25 43 24 30 81 ] 21
79 67 75
123 63
127 59 95 67
111 95
119 95
107 67
137 101
79 23 19 47 17 25 37 27 35 47 49 69 67 59
103 111
79 85 59 41 33

m m m m m m m m m m m m m m m m m m mm
Table 2 . - - A n a l y t i c a l r e s u l t s f o r stream-sediment samples from in and near the Huleshoe study area, Cochise and Graham Count ies, A r i zona- -Con t inued
A n a l y t i c a l data Sample Au Ag As B Ba Be BI Cd Ce Co Cr Cu Ga La Lt Mo Nb Nt
no. ppb ppm
49 <5 2.3 7 <2 717 1.4 <2 2 <5 27 23 43 28 23 72 <l 30 35 51 <5 .7 <5 <2 559 1.7 <2 <1 <5 21 15 39 25 22 100 <l 13 25 54 <5 1.7 5 <2 642 2.3 <2 <l <5 25 19 39 18 23 61 1 14 27 55 lO 6.1 33 <2 2,700 2.3 <2 l <5 57 115 69 23 38 46 3 64 91
r ~
Haximum va lue 10 Hinimum va lue <5 Average va lue
(background) na Standard
d e v i a t i o n na Threshold
(average value + two t imes the standard d e v i a t i o n ) na
7 .3 47 <2 2,700 3 7 2 ' 21 57 429 lOl 29 77 122 5 76 137 0.7 5 <2 109 <0.5 <2 <1 <5 9 15 33 7 5 16 <l <l 17
2.5 14 na 606 1.8 4 na na 32 124 57 18 32 52 l 19 68
1 .4 11 na 363 0.6 2 na na 11 go 15 6 15 23 1 15 33
5.3 36 na 1,332 3.0 8 na na 54 304 87 30 62 98 8 49 134

m m n m m m m m m m m m m m m m m
Table 2.--Anal~rtical r e s u l t s
Sample Pb Rb
for stream-sediment samples from in and near the Muleshoe study area, Cochlse and Graham Counties, Arizona--Continued
Analytical data Sb Sc Sn Sr Ta Te T1 V W Y Zn Zr
no. ppm
1 13 B9 <5 14 <20 286 <10 <10 <10 135 <10 29 109 202 2 17 B3 <5 12 <20 23B <10 <10 <10] 95 <10} B 95 50 3 17 71 <5 2 <20} 24B <10} < .2* <10} 41 <10} 11 175 28 4 27 G2 <5 12 <20} 340} <10} <10} < .2 " 121 <lO 16 117 123 5 35 68 <5 5 <20} 216 <10} <10} <lO 76 <10} 24 83 61 6 39 52 <5 11 27 3"/4 16 <10} <10 126 <10} 30} 143 144 7 23 72 <5 4 <20 276 <10} <lO <I0 58 " <10} 26 1 57 95 B 27 <20} <5 8 <20} 79 <lO <I0 <10} 120 <10} 19 107 49 9 45 39 <5 2 <20} 155 <I0 <10} <I0 85 <I0 12 97 77
10} 25 43 <5 3 <20} 252 <10} <.2" <lO 58 <10} 5 131 25 I I 17 4B <5 6 <20 254 <lO <lO <10} 61 <10} 8 155 73 12 25 33 <S 27 <20} 314 <10} <I0 <I0 168 <I0 7 93 254 13 9 75 <5 18 <20} 298 <10} <I0 <10} 13B <I0 25 I11 20}2 14 2 79 <5 17 <20} 264 <10 <I0 <I0 146 <10} 27 lOS 172 15 15 24 <5 3 <20} IB3 <10} <.2" <.4* 33 <10} 3 153 19 16 25 45 <5 I0 <20} 374 <10} <.2" <I0 99 <10} 7 121 B4 17 27 44 <5 13 <20 366 <10 <10} <I0 124 <10} 13 123 128 IB 33 92 <5 14 <20} 139 <10} <10} <10} 154 <10} 2B 284 179 19 13 72 <5 8 <20} 143 <10} <10 <10} 62 <10 27 61 I00} 27 13 50} <5 9 <20 83 <I0 <I0 <10} B9 <10} 17 145 I08 28 43 62 <5 9 <20} I I I <10} <10} <I0 265 <10} 21 177 120 29 9 38 <5 B <20 95 <I0 <10} <10 41 <10 15 43 100 30} 17 37 <5 9 <20 99 <10} <I0 <I0 97 <10 16 79 95 31 43 39 <5 10} 20} B3 <10} <10 <10 162 <10} 16 93 135 32 33 40 <5 9 <20 B7 <I 0} <I 0 <I 0 91 <l 0} 16 77 109 33 23 51 7 12 <20} 10}5 <I0 <10} <I0 92 <10} 19 99 129 37 15 63 <5 9 <20 246 <I0 <I0 <I0 92 <I0 22 105 I12 38 9 69 <5 lO <20 264 <10} <lO 410 l l 8 410} 23 127 161 39 29 7B <5 12 20} 202 <10 <I0 <10 169 <10} 22 332 154 40} 33 72 <5 12 22 248 <10} <10} <I0 180 <10} 28 427 137 41 33 73 <5 11 <20 228 <10} <.2* <10} 154 <10} 32 127 140} 42 25 65 <5 19 <20 356 <l 0 <10 <l 0 130} <I 0 33 163 212 43 71 60} <5 18 39 199 <10} <10} <I0 371 <10} 55 230} 194 44 39 64 <5 12 <20} 24B <10} <I0 <10} l i b <10} 32 I13 222 45 35 60 <5 15 <20 342 <10} <10 <lO 143 <10} 33 log 151 46 31 75 <5 I I <20 25B <10 <10 <10 81 410 37 10}5 97 47 29 93 <5 14 <20 147 <10} <10} 410 20}9 <10} 27 121 178 48 35 I I I <5 14 <20} IB3 <10} <I0 410} 147 <10} 23 9? 154

m m m m m m m m m m m : m m m m m m m
Table 2 . - - A n a l y t i c a l r e s u l t s f o r s t ream-sediment samples from in and near the Muleshoe study area, Cochise and Graham Count ies , Ar izona- -Cont inued
A n a l y t i c a l data Sample Pb Rb Sb Sc Sn Sr Ta Te T1 V W Y Zn Zr
no. ppm
49 51 79 <5 17 <20 248 <lO <10 <lO 187 <10 19 99 170 51 13 83 <5 12 <20 171 <10 <10 <10 120 <lO 19 81 139 54 105 123 <S I0 <20 103 <I0 <I0 <lO 131 <I0 16 252 120 55 73 6B <5 16 36 137 <lO <lO <lO 511 <lO 25 IBl 216
Maximum value 105 123 7 27 39 374 16 25 14 5 l l <lO 55 427 254 Minimum value <2 20 <5 2 <20 79 <lO <0.2 <0.2 33 <lO 3 43 19 Average value
(background) 30 63 na l l na 215 na na na 133 na 2l 138 129 Star~dard
d e v i a t i o n l g 22 na 5 na BB na na na 85 na lO 72 56 Threshold
(average value + two t imes the standard deviat ion 6B 107 na 21 na 391 na na na 303 na 41 282 241