Embed Size (px)
Citation preview

Research ArticleUsability in the Product Design Process Based on theIntelligent Microprocessor
Ke Su and Hao Ma
College of Art and Design, Qilu Industry University, Jinan, 250353 Shandong, China
Correspondence should be addressed to Ke Su; [email protected] and Hao Ma; [email protected]
Received 28 September 2021; Revised 23 October 2021; Accepted 28 October 2021; Published 13 November 2021
Academic Editor: Haibin Lv
Copyright © 2021 Ke Su and Hao Ma. This is an open access article distributed under the Creative Commons Attribution License,which permits unrestricted use, distribution, and reproduction in any medium, provided the original work is properly cited.
The sharing and reuse of product design experience knowledge is beneficial to shorten the product development cycle andimprove product quality. The intelligent microprocessor has greatly changed the way of interaction between people andcomputers. This article mainly studies the usability analysis in the product design process based on the intelligentmicroprocessor. The experiment must first perform initial finite element calculations, and the purpose is to complete the datacollection. The collection of evaluation indicators is carried out with the help of perceptual vocabulary classification, and thehierarchical inference method is used to build a tree-like analysis chart. After the indicator collection is completed, the Likertscale method is used to screen the indicators, and the evaluators will rate the selected indicators according to their importance.The Petri net modeling method is used to model the product design process, which mainly includes task element definition,task module division, task planning, and task allocation. Finally, the usability test of the product is carried out. Experimentaldata shows that the probability of completing the design task within 30 days is 27.74%. The results show that the intelligentmicroprocessor shortens the time-consuming process of product design and at the same time enhances product usability.
1. Introduction
The transformation of social economy, the increasinglyintensified market competition, and the diversified develop-ment of science and technology have made consumers’demands and expectations increasingly expand, and thepositioning and role of products have also changed. In ourcountry, the research and application of product usabilityand user experience are rising rapidly, arousing widespreadinterest in the research field, and also major well-knownenterprises and emerging technological innovation enter-prises have also increased their investment in usability engi-neering. Therefore, studying UCD methodology in theproduct development life cycle is of great significance toboth theory and practice.
In this paper, the intelligent microprocessor is applied tothe field of product design evaluation, which expands andcomplements the methods of product design evaluation,provides new ideas for the development direction of productdesign evaluation under the background of science and tech-nology and information, and provides a new platform for
the communication among users, designers, engineers, andevaluators. At the same time, it provides an effective basisfor the simulation verification of new products before theyare put into the market. Through the quantitative processingof subjective design evaluation, it can better grasp the needsof consumers and control the design direction, which is ofgreat significance to improve the success rate and efficiencyof design.
Product design is a very complex process. Xia believesthat product design and manufacturing simulation is apromising research and application field of tactile. Throughnatural human-computer interaction and realistic torquefeedback, tactile can change the traditional design andmanufacturing methods. He has conducted a detailed andcomprehensive survey of the haptics used in product designand manufacturing simulation over the past 10 years,including tactile for product design and shape modeling,for machining simulation, and for virtual assembly andmaintenance simulation. He introduced new tactile devicesand rendering algorithms and discussed the main researchwork and typical systems. His research content is too limited
HindawiWireless Communications and Mobile ComputingVolume 2021, Article ID 6511627, 15 pageshttps://doi.org/10.1155/2021/6511627

[1]. The NURBS surface is the same as the NURBS curve inthe shape project column, which forms the final shape to becreated through the combination of multiple surfaces. Thereare two types of adjustment points on NURBS curves andsurfaces: points edit points and CV control points. Pernotet al. believe that the use of free shapes has become the main-stream for designing complex products that must meet engi-neering requirements and aesthetic standards. Even thoughthe CAD system can easily express free shapes throughNURBS surfaces, its definition and modification still requiredeep knowledge and superb skills in operating the basicmathematical model. The implementation of free-formdesigners is time-consuming and cannot be quickly modi-fied. In order to overcome these limitations, they have car-ried out some research to try to adapt to the characteristicconcepts successfully used for regular shape design in thefield of free concepts. They described and compared variousmethods. Their research lacks innovation [2]. Du et al. pro-vide an overview of the latest technology on LFJO problemsbased on the typical decision chain of engineering optimiza-tion, including successive stages of problem formation, opti-mization modeling, model solution, and optimizationevaluation. They also reviewed the current status of two-level programming (BLP) models for LFJO problems, focus-ing on their engineering implications for PDD. They alsoreviewed popular algorithms used to solve BLP mathemati-cal models, as well as common practices for LFJO modelevaluation in the PDD literature. Finally, they discussedthe key issues of the LFJO problem and the prospects for fur-ther research. The factors considered in his research are notcomprehensive [3]. For example, there is insufficientresearch on the development conditions, development costs,and maintenance costs of the technology. Tiwari et al.believe that design concept evaluation is one of the mostimportant stages in the early stages of the design processbecause it not only affects the later stages of the design pro-cess but also affects the success of the final design solution.Their main purpose is to reduce inaccurate content in thecustomer evaluation process, thereby improving the effec-tiveness and objectivity of product design. They proposed anovel method for performing design concept evaluation.This method does not need to consider the cost and benefitcharacteristics of design standards but instead determinesthe best concept that can meet the constraints imposed bythe designer team on the design standards and meet thepreferences of the largest customer. In this work, they devel-oped an improved VIKOR method for rough numbers bymodifying the extended VIKOR method by using intervalnumbers for design concept evaluation. Their research lacksnecessary experimental data [4]. The VIKOR decision-making method they mentioned is a compromise rankingmethod, which compromises and ranks limited decision-making schemes by maximizing group utility and minimiz-ing individual regret values. The VIKOR method is an effec-tive tool for multicriteria decision-making (MCDM). It isused in the following situations: (1) the decision-maker can-not or does not know how to accurately express his prefer-ences; (2) there are conflicts and incommensurabilitybetween evaluation criteria (different measurement units);
and (3) decision-makers dealing with conflict issues canaccept compromise solutions.
This paper applies the intelligent microprocessor toproduct design evaluation and builds a model frameworkof the product design evaluation system that applies theintelligent microprocessor. At the same time, the sharingtechnology of product design knowledge can effectively inte-grate the existing design resources and design results, sharethe design process through the network, accelerate the prod-uct design speed, and shorten the product developmentdesign cycle. This paper takes users as the center, evaluatesthe usability of the product design process and design qual-ity, tries to apply it to different types of products and differ-ent design processes, and finally forms the usabilityevaluation standard of product design, which is the evalua-tion of design results, and also the user participation in thedesign process solves the problem of too subjective designevaluation.
2. Intelligent Microprocessor in Product Design
2.1. Intelligent Microprocessor. The intelligent microproces-sor in product design has changed the previous two-dimensional or three-dimensional rendering design, whichdigitizes the three-dimensional model, accurately and intui-tively, and can provide a real design object so that con-sumers or designers can experience products, evaluateproducts, and validate products on the same platform. Theycan be in or in front of the evaluation object and evaluate thescale, space, structure, proportion, color, and texturethrough simulation [5, 6].
Since the introduction of microprocessors, microproces-sors have been quickly introduced into various industriesand have completely changed the design ideas of products.For example, common smart products such as computers,scientific calculators, tablets, smart phones, smart watches,and smart switches all use smart microprocessors. Take asmart phone as an example. The processor is the core com-ponent of the mobile phone. It is the control center systemof the entire mobile phone and the control core of the logicpart. The microprocessor achieves the purpose of overallmonitoring of the mobile phone by running the softwarein the memory and calling the database in the memory.With the continuous improvement of the integrated circuitproduction technology and process level, the functions ofthe microprocessor in the mobile phone are becoming moreand more powerful, such as the integration of advanced dig-ital signal processors in the microprocessor. The perfor-mance of the processor determines the performance of theentire phone. Through the digital conversion of analog sig-nals, information can be stored conveniently, measuredvalues can be analyzed in real time, and various synthesesand processing can be performed. And this pushes productdesign to a new era of computerization and intelligence.The intelligent microprocessor makes the product schemefrom two-dimensional drawings and three-dimensionalmodels and imitates the product’s shape, color, material,size, and other attributes, providing a virtual viewing andusing the digital product for evaluation and verification by
2 Wireless Communications and Mobile Computing

evaluators. The intelligent microprocessor can simulate theappearance of the product in all directions and with highprecision. The intelligent microprocessor first accepts pro-cessing instructions, which must be executed in strict accor-dance with the order specified by the program to ensure thecorrectness of the computer system. Secondly, the corre-sponding operation control signals are sent to the corre-sponding components so as to control these componentsto perform corresponding operations according to therequirements of the instructions. During the operation ofthe instruction, strictly follow the time specified in theinstruction. After all program operations are completed, per-form arithmetic and logical operations on the data or per-form other information processing. After all dataprocessing is completed, the entire product can be simu-lated. In addition, the intelligent microprocessor can alsobuild a product use environment to simulate the use processof the product. Through strong technical support, the evalu-ators can observe and use the products in a realistic naturaland reasonable use environment and make the evaluationresults more reasonable [7]. The specific processor chipstructure is shown in Figure 1.
It can be seen from Figure 1 that more and more hetero-geneous multicores have appeared in recent years. Heteroge-neous multicore hardware is different in architecture. TheCPU is mainly responsible for executing serial tasks andlogic control. GPU has great advantages in parallel comput-ing due to its thread-level parallelism. CPU and GPU hetero-geneous multicores can give full play to the performanceadvantages of CPU and GPU in their respective applicationscenarios. The principle is to integrate cores of different sizesinto the same chip according to specific needs—application
computing requirements. At the same time, the multi-threaded microprocessor structure provides multiple hard-ware sites, that is, the program execution contextenvironment, so that the CPU can run in accordance withmultiple control threads at the same time, and each execu-tion site saves the running state of a currently runningthread, including general register files and the programcounter. These hardware sites save the thread state of thesame address space on site and can execute lightweightthreads. The model is shown in Figure 2.
As shown in Figure 2, from an architectural point ofview, simultaneous multithreaded processor technologyimplements multiple relatively independent logical proces-sors on a physical processor core. Each logical processorhas its own architecture description. During operation, eachlogical processor can independently suspend, interrupt, anddirectly execute a specific thread without being affected bythe state of another logical processor. At the same time,due to the use of the largest hardware support, the threadswitching efficiency is relatively high.
The entity and virtual body are inseparable. The dialecti-cal relationship between them constitutes products anddetermines the grade of products. On the one hand, thetwo are interrelated. The virtual body belongs to ideology.It cannot exist in isolation but must rely on the entity. Inother words, in the process of design, we must considerwhether the materials, design tools, and related processingequipment can support the completion of the productmanufacturing. Moreover, the perceptual elements of prod-ucts need to be externalized with the help of product entities[8]. In addition, human beings live in the real environment,which is full of objective entities. The objective entities are
Main CPU One-clickcaching
Auxiliary nucleus Auxiliary nucleus
System bus
Memory controller
x1 x1
x2
u1u1x
⁎ /⁎x1
x2
u1
⁎ /⁎f (x1...xn)S
R
SET
CLR
𝑸
𝑸
Figure 1: Structure of the heterogeneous SMP processor.
3Wireless Communications and Mobile Computing

the necessities of human life, and the real sense of humanexistence also needs to be reflected by product entities [9].On the other hand, the two restrict each other. The perfec-tion of the entity elements directly restricts the embodimentof the virtual elements. Without the support of the entity, nomatter how unique the creativity is, no better idea can berealized, and then the excellent products cannot be used bypeople. At the same time, virtual elements have initiative,and appropriate virtual elements will promote the develop-ment of physical elements and then create high-level prod-ucts [10]. On the contrary, it will produce low-gradeproducts. Therefore, in the process of product design, theconstruction of virtual elements is to give product emotionand then use reasonable methods to pass the emotional stateof the product to consumers, thus affecting the evaluation ofproduct formation by consumers. The construction processof emotional experience is to automatically store the con-sumer’s experience and feelings about a certain product inmemory, and then the short-term memory is strengthenedto form some unconscious tendency or prejudice, which willunconsciously affect consumers’ cognition of a certain prod-uct [11, 12].
The virtual design principle is shown in Figure 3. In thevirtual design environment, the digital model of mechanicalproducts is used to build a computable digital prototype. Onthis basis, it simulates the physical prototype in the realworld for operation and analysis. A virtual prototype is anintegrated design of computer-supported mechanical prod-uct modeling, simulation, and product description, simulat-ing all necessary product data and manufacturing processes.
The interaction between the design world and the virtualworld includes the virtual design environment, which inte-grates mechanical product definition, design engineering,and manufacturing [13, 14].
2.2. Product Design. The product platform is of great signif-icance for the future development of enterprises. Whenplanning the product platform, on the one hand, it is neces-sary to meet the individual needs of market segments andcustomers. On the other hand, it is necessary to develop anappropriate product platform according to the situation ofthe product itself and the operation status of the enterpriseto ensure the low cost and high efficiency of design and pro-duction. Therefore, when enterprises adopt a platform strat-egy for product design, they should first determine the typeof product platform that conforms to their own situationand has stability [15]. The design task module division pro-cess is shown in Figure 4. The product design project obtainsthe final task element through the task decomposition andthe related task element adjustment rule, carries on the cor-relation analysis to the task element, establishes the compre-hensive correlation matrix between the task elements, laysthe foundation for the subsequent module division, thenuses the method of the clustering analysis and genetic opti-mization algorithm to divide the task element module, andrealizes the process solution through MATLAB. Finally, theoptimal module partition scheme under the given conditionsis obtained [16].
On the basis of module partition, for the parallel executionmodule, the Petri net model under parallel relation can be
Branch predictorValue unit Program counter
Instruction
Floating pointtransmit queue Floating-point
register bank Floating point
Orderrearrangement
part
Fixed-point parts
DatabaseFetch parts
Fixed-point registerbank
Fixed-point launchqueue
Value line up Decoding Register rename
System Base
Output
Purchase
Package
$ $ $
Branch predictor
Figure 2: Simultaneous multithreading microprocessor model.
4 Wireless Communications and Mobile Computing

directly selected. It can express the dynamic and sequentialrequirements of the process, support the dynamic simulationof a product system, have a strict formalization mechanism,have precise semantics and a strict mathematical basis to ver-ify the correctness of the process model, support process con-
currency, solve the synchronous competition problem of theadvanced Petri net, and improve the modeling and analysisfunction of the Petri net from different angles [17].
Assuming that the i-th task element belongs to the k-thmodule, set xik = 1; otherwise, set xik = 0. Define the task
Designer and user
Virtual reality interface
Generate productdata
Visualization Interactivity
MechanicalProductconcept Evaluation
AnalysisSimulation
Product virtualprototype
Product model
Behavior model
Functional model
Hardware (physical) prototype Manufacturing productionmanagement
Figure 3: Virtual design principle.
Database
packagePreparation of module
division conditions
Task decomposition
Task metaadjustment
Task elementincidence matrix
Station 1 Station 2
Area
Module division processimplementation
Initial module divisionbased on cluster
analysis
Optimization of moduledivision based ongenetic algorithm
Module division result
Design taskmodule composition
National
Member
Figure 4: Design task module division.
5Wireless Communications and Mobile Computing

meta-aggregation index in the k-th module as follows:
MIk =∑n−1
i=1 ∑nj=i+1 rij ⋅ xik ⋅ xjk
� �/rmax
∑n−1i=1 ∑
nj=i+1rmax ⋅ xik ⋅ xjk
, ð1Þ
where rmax is the maximum value of rij in the incidencematrix, n is the number of task elements, and k is the num-ber of modules. Then, all the aggregation degrees of theentire product are as follows:
M0 =∑k
p=1 ∑n−1i=1 ∑
nj=i+1rij ⋅ xik ⋅ xjk ⋅MIk
h i
∑kk=1 ∑n−1
i=1 ∑nj=i+1rmax ⋅ xik ⋅ xjk
� � : ð2Þ
Define the coupling index between module α and mod-ule β as follows:
MOαβ =∑n
i=1∑nj=1 rij ⋅ xiα ⋅ xjβ� �
/rmax∑n
i=1∑nj=1rmax ⋅ xiα ⋅ xjβ
: ð3Þ
The coupling degree between product modules is as fol-lows:
MS =∑k−1
α=1∑kβ=α+1 ∑n
i=1∑nj=1rij ⋅ xiα ⋅ xjβ ⋅MOαβ
h i
∑k−1α=1∑
kβ=α+1 ∑n
i=1∑nj=1rmax ⋅ xiα ⋅ xjβ
� � : ð4Þ
The calculation process of the data interface complexityis as follows:
Ha = −1k〠k
j=1
∑najq=1ajq∑n
i=1ai
!ln
∑najq=1ajq∑n
i=1ai
!: ð5Þ
In the formula, naj represents the number of task ele-ments constituting the j-th module.
The calculation engineering of cost complexity is as fol-lows:
Hc = −1k〠n
i=1cri ⋅ ln cri + 1 − crið Þ ln 1 − crið Þ½ �: ð6Þ
In the formula, cri represents the relative cost of theentity corresponding to the i-th (i = 1, 2,⋯, n) design task.
The expression for normalization is as follows:
X = X − XminXmax − Xmin
: ð7Þ
The fitness function is constructed as follows:
Fitness =
1c + F
,
1c + F + T
,
8>><>>:
ð8Þ
where F is the objective function and c is the conservativeestimate of the objective function, which is a nonnegativenumber.
Compared with the knowledge process, the productdesign process is much more complicated, and it is necessaryto define and maintain the relevant information of all designactivities. At the same time, the definition of the productdesign process mainly relies on the definition of the productstructure, while taking into account the dynamics of thedesign process, managing and coordinating user execution,and dynamically controlling the human, resource, and timefactors of the design process [18].
According to the rough set theory, assuming that R = fC1, C2,⋯, Cng is the evaluation result set of n persons, then
AprCi= ∪ Ck ≤ Cif g, k = 1, 2,⋯, n, ð9Þ
AprCi= ∪ Ck ≥ Cif g, k = 1, 2,⋯, n: ð10Þ
The fuzzy number of Ci is as follows:
RNCi= CL
i , CUi
� �, ð11Þ
CLi =
∑AprCi
ML, ð12Þ
CUi =
∑AprCi
MU: ð13Þ
Among them, ML represents the number of the lowerlimit of Ci, andMU represents the number of the upper limitof Ci. The evaluation set R is transformed into a fuzzy num-ber:
RNR = RL, RU� �, ð14Þ
RL = 1n〠n
i=1CLi , ð15Þ
RU = 1n〠n
i=1CUi : ð16Þ
Design evaluation refers to the method of comparingand selecting schemes and clarifying the design value andadvantages and disadvantages of each scheme in the productdesign process so as to screen out the best scheme. Accord-ing to the above algorithm model, the scores in the designscheme scoring table can be converted into evaluation coef-ficients. The conversion formula is as follows:
o11 = 〠5
u=1l1 wukð Þou = l1 w11ð Þo1 + l1 w12ð Þo2 + l1 w13ð Þo3:
ð17Þ
Among them, o11 is the evaluation coefficient of the firstrow of the gray evaluation sample matrix W in evaluatingthe gray category “excellent”; according to the above
6 Wireless Communications and Mobile Computing

method, the evaluation coefficient of each evaluation indexand the total evaluation coefficient can be calculated. Theproportion of the evaluation coefficient of a certain evalua-tion index belonging to each gray class in the total evaluationcoefficient is called the gray class weight coefficient.
euk =oukok
+ o1 + 〠n
u=1ouk, ð18Þ
e1 =
0:22 0:49 0:10:4 0:43 0:10:33 0:41 0:160:51 0:16 0:240:4 0:43 0:080:41 0:49 0:01
2666666666664
3777777777775
,
e2 =
0:32 0:53 0:060:03 0:47 0:470:01 0:42 0:120:31 0:54 0:070:23 0:54 0:150:21 0:52 0:18
2666666666664
3777777777775
:
ð19Þ
Setting the indicators “excellent” and “good” as the out-put indicators of the evaluation system and the indicator“poor” as the input indicators of the system, the followingforms of the DEA evaluation model can be established:
min c = vsbnpt:s
msan − vsbn ≥ 0,msan0 = 1,v ≥ 0 ;m ≥ 0:
8>><>>:
n = 0, 1, 2,⋯, o,
ð20Þ
Among them, an0 and bn0 are the input and output vec-tors of the n-th evaluation index of the product being evalu-ated, the following is a model evaluation of the above twoproduct design schemes, and the quality cost evaluation ofdesign scheme 1 is selected as an example, and the evalua-tion equation is expressed as follows:
min c11 = 0:25v1 + 0:51v2, m1 ≥ 0, v1 ≥ o, v2 ≥ 0: ð21Þ
This paragraph extends the usability research to thestage of design evaluation and usability testing, extracts thedifferent needs of users, producers, and designers, and ana-lyzes usability evaluation methods.
2.3. Usability Research. Usability is an inherent attribute ofthe product. When the product is determined, the usabilityof the product will be determined like its other attributes.That is to say, the usability of a product is completely deter-mined by the product design. Under normal circumstances,
two products with the same function do not mean that theyare equally easy to use. This is the difference in the usabilitydesign of different products, so product usability determinesthe competitiveness of products. Usability analysis indica-tors are data sources and related information that we useto measure the level of product usability and discover usabil-ity problems [19]. The topic of knowledge points should usethe concepts in the domain ontology as much as possible toensure that knowledge points can be created and managedaccording to the semantic relationship between domainontology concepts. Domain ontology is a common methodfor enterprises to express the semantic relationship betweencommon professional terms and professional terms. In theknowledge distribution service system, the domain ontologyneeds to be constructed first as the basic data for creatingknowledge points and acquiring knowledge [20].
Usability research is user-centered and has practical sig-nificance in various industries. Some industries and all ser-vice industries are based on customers. In the knowledgeservice system, knowledge points can be used to representall kinds of product-aided design knowledge, such as thedesign method, design principle, design experience, designrules, fact knowledge, product model, process knowledge,and design example, and then stored in the knowledge basein the form of knowledge points. With the global allocationof resources and the developed and convenient sales net-work, the price war is becoming more and more difficult[21]. In order to maintain a huge production machine, thequality is getting lower and lower. In order to attract cus-tomers, businesses are not only constantly reducing pricesbut also belittling the image of products. Consumers cannotget high-quality products. Price competition is important forenterprises, but it is not a long-term strategy. Large enter-prises invest more money to seek breakthrough points tomeet consumer demand through usability research, andsmall- and medium-sized enterprises also make newattempts on individual products [22]. Some basic character-istics of a product system with good usability are shown inFigure 5.
It can be seen from Figure 5 that, to sum up, productswith good usability mainly perform well in the “5 E”dimensions.
3. Model Simulation Experiment of the ProductDesign Process
3.1. Experimental Environment. The authenticity of the VRsystem is closely related to two factors: the correspondingtime delay of the system and the number of polygons usedto construct the graphics. The delay time is less than10ms; its authenticity is stronger; the longer the delay, thelonger the user’s waiting time, the worse the authenticity.It is an important task of the software to generate a realisticview. Constructing polygons into visual graphics is the mostcommonly used method [23].
3.2. Data Collection. The data obtained in the CAD processcan be used to check the calculation results and functionssynchronously, and the knowledge obtained from this can
7Wireless Communications and Mobile Computing

be fed back to the design process. The complete geometricdescription of the product can be used for initial finite ele-ment calculations. The intelligent microprocessor can testand evaluate the product and track and collect the evalua-tion data of the operator through related equipment. Thedata composed of data obtained through testing and eval-uation has changed the complicated and cumbersomemethods of traditional prototype testing and market test-ing and is in line with the testing requirements of devel-oped products [24].
3.3. Establishment of the Evaluation System. After the evalu-ation object is determined, the evaluation indicators are col-lected, and the evaluation indicators are screened andclassified by reasonable methods, and the evaluation indexmodel is constructed [25].
(1) The evaluation indicators are collected andexpanded with the help of the perceptual vocabularyclassification method, and the tree analysis chart isestablished by the hierarchical inference method,
consciousness
Effective Efficient
Easy toLearn
Engaging
ErrorTolerant
Will
knowNeed
Emotion
Motivation
Interest
Tran
Observe thetarget item
Observe thetarget project
feedback
Productavailability
Operate thetarget project
Select thetarget project
Find thetarget project
Behavior Target
HW
Figure 5: The “5 Es” of product availability.
0
20
40
60
80
100
1 2 3 4 5 6 7 8 9 10 11 12 13 14 15
Cos
t
Time
ECOSTNCOSTPCOST
0
20
40
60
80
100
1 2 3 4 5 6 7 8 9 10 11 12 13 14 15
Cos
t
Time
ACOSTBCOSTYCOST
Figure 6: The changing law of process cost.
8 Wireless Communications and Mobile Computing
and the details are obtained gradually. Through theevaluation, personnel experience the product useenvironment, and it carries on the full discussionand obtains the analysis chart
(2) After the completion of index collection, it is neces-sary to simplify and screen the collected indicators,exclude unnecessary indicators, classify and sortout the indicators, and establish the evaluation indexmodel. 40 evaluators scored the importance of thecollected perceptual indicators by using the Likertscale. For each index, the evaluators choose a gradeto express the attitude of the index as the importanceof product evaluation [26]
(3) A quantitative statistical method is adopted to calcu-late the weight of indicators. The importance of Nselected evaluation indicators is investigated anddivided into five grades: unimportant, less impor-tant, important, more important, and very important
3.4. Product Design Process Modeling. The workflow of theproduct design process is modeled by the Petri net modelingmethod. For the large complex product design process,
workflow modeling needs to complete the following work:task element definition, task module division, task planning,and task allocation [27].
(1) Design Preparation Process. After the task arrives, thetask module is formed through the preparation process, andthe process is modeled by the Petri net.
(2) Execution Process between Modules. According to theplanning results, the task modules are independent of eachother, so they are executed in parallel.
(3) Task Element Preparation Process. Before opening thedesign process, the decomposed task element needs somedesign information input.
(4) Block Execution. The module execution process is theprocess of concreting the task elements in each module, andit is the subprocess of module design.
3.5. Usability Testing. Usability testing is a process of evalu-ating the usability level. It can evaluate the efficiency andeffectiveness of users in achieving tasks. It is a standardizedmethod so that every aspect of each application can satisfyuser-friendliness, functionality, and artistry.
(1) One-to-One User Test. In the user experiment opera-tion, we understand the user’s operation and thinking, andprofessional evaluators come to discover the problem datain detail.
(2) Heuristic Evaluation. Users find problems based onusability principles, and users prioritize the problems [28].
3.6. Data Processing. The design parameters of productdesign evaluation in the intelligent microprocessor are takenas the input of the network, and the result of product designevaluation is the output of the network, and the hidden layeris in the middle. The product evaluation data and resultsobtained in the network environment are used as networktraining samples for model training. After training, clickthe evaluation to obtain the relevant evaluation datavalue [29].
4. Usability Analysis of the ProductDesign Process
4.1. Impact of the Intelligent Microprocessor on ProductDesign. Through iteration, the product design schemebecomes more and more specific, but at the same time, italso increases the difficulty of defining the logical relation-ship between activities, which makes the design cycle anddesign cost difficult to estimate, and brings great pressureto the optimization and management of the product designprocess. A reasonable iterative model is the basis of effective
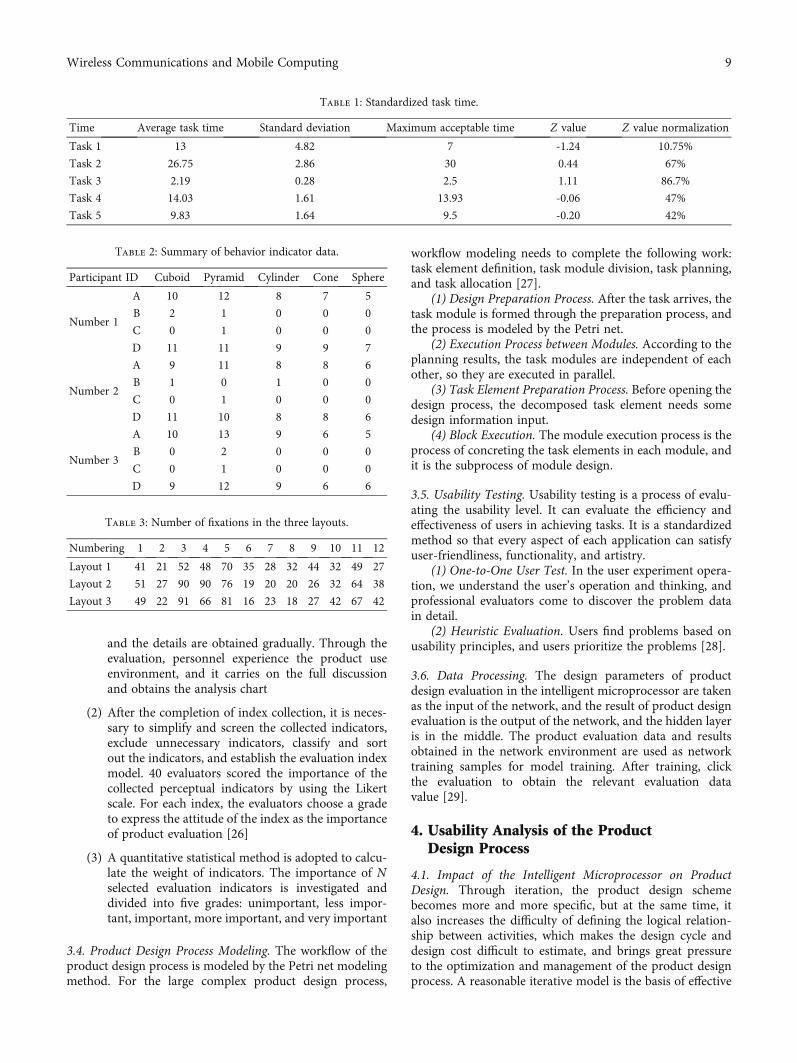
Table 1: Standardized task time.
Time Average task time Standard deviation Maximum acceptable time Z value Z value normalization
Task 1 13 4.82 7 -1.24 10.75%
Task 2 26.75 2.86 30 0.44 67%
Task 3 2.19 0.28 2.5 1.11 86.7%
Task 4 14.03 1.61 13.93 -0.06 47%
Task 5 9.83 1.64 9.5 -0.20 42%
Table 2: Summary of behavior indicator data.
Participant ID Cuboid Pyramid Cylinder Cone Sphere
Number 1
A 10 12 8 7 5
B 2 1 0 0 0
C 0 1 0 0 0
D 11 11 9 9 7
Number 2
A 9 11 8 8 6
B 1 0 1 0 0
C 0 1 0 0 0
D 11 10 8 8 6
Number 3
A 10 13 9 6 5
B 0 2 0 0 0
C 0 1 0 0 0
D 9 12 9 6 6
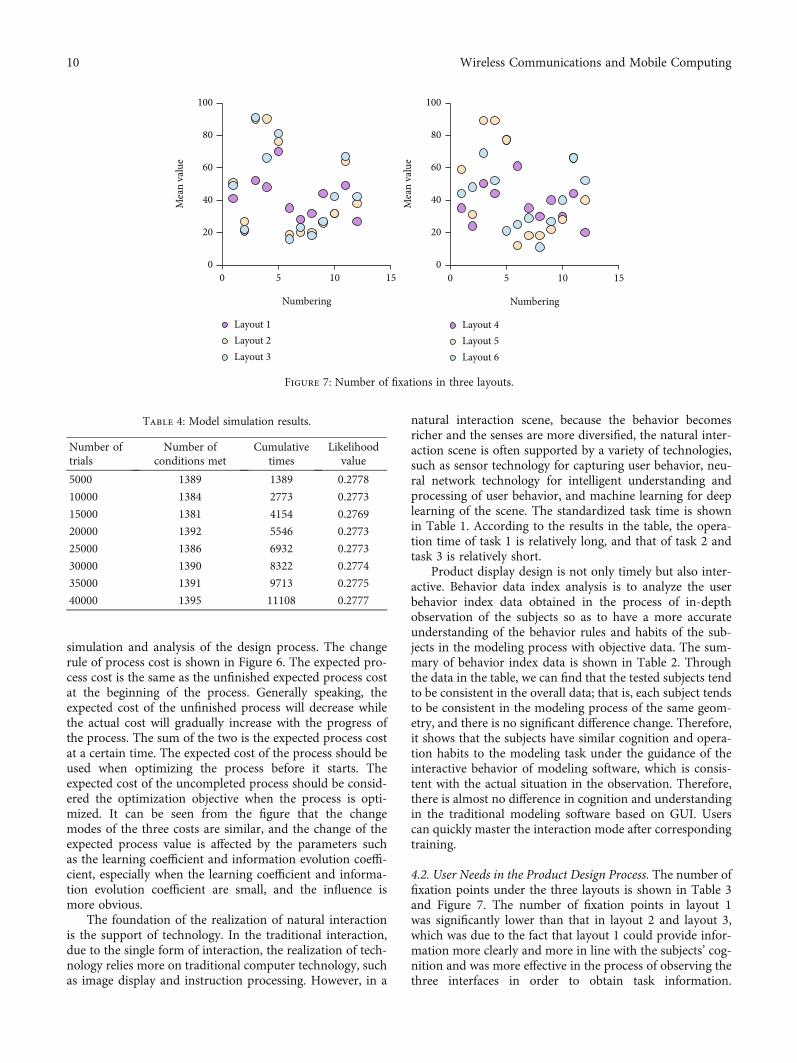
Table 3: Number of fixations in the three layouts.
Numbering 1 2 3 4 5 6 7 8 9 10 11 12
Layout 1 41 21 52 48 70 35 28 32 44 32 49 27
Layout 2 51 27 90 90 76 19 20 20 26 32 64 38
Layout 3 49 22 91 66 81 16 23 18 27 42 67 42
9Wireless Communications and Mobile Computing
simulation and analysis of the design process. The changerule of process cost is shown in Figure 6. The expected pro-cess cost is the same as the unfinished expected process costat the beginning of the process. Generally speaking, theexpected cost of the unfinished process will decrease whilethe actual cost will gradually increase with the progress ofthe process. The sum of the two is the expected process costat a certain time. The expected cost of the process should beused when optimizing the process before it starts. Theexpected cost of the uncompleted process should be consid-ered the optimization objective when the process is opti-mized. It can be seen from the figure that the changemodes of the three costs are similar, and the change of theexpected process value is affected by the parameters suchas the learning coefficient and information evolution coeffi-cient, especially when the learning coefficient and informa-tion evolution coefficient are small, and the influence ismore obvious.
The foundation of the realization of natural interactionis the support of technology. In the traditional interaction,due to the single form of interaction, the realization of tech-nology relies more on traditional computer technology, suchas image display and instruction processing. However, in a
natural interaction scene, because the behavior becomesricher and the senses are more diversified, the natural inter-action scene is often supported by a variety of technologies,such as sensor technology for capturing user behavior, neu-ral network technology for intelligent understanding andprocessing of user behavior, and machine learning for deeplearning of the scene. The standardized task time is shownin Table 1. According to the results in the table, the opera-tion time of task 1 is relatively long, and that of task 2 andtask 3 is relatively short.
Product display design is not only timely but also inter-active. Behavior data index analysis is to analyze the userbehavior index data obtained in the process of in-depthobservation of the subjects so as to have a more accurateunderstanding of the behavior rules and habits of the sub-jects in the modeling process with objective data. The sum-mary of behavior index data is shown in Table 2. Throughthe data in the table, we can find that the tested subjects tendto be consistent in the overall data; that is, each subject tendsto be consistent in the modeling process of the same geom-etry, and there is no significant difference change. Therefore,it shows that the subjects have similar cognition and opera-tion habits to the modeling task under the guidance of theinteractive behavior of modeling software, which is consis-tent with the actual situation in the observation. Therefore,there is almost no difference in cognition and understandingin the traditional modeling software based on GUI. Userscan quickly master the interaction mode after correspondingtraining.
4.2. User Needs in the Product Design Process. The number offixation points under the three layouts is shown in Table 3and Figure 7. The number of fixation points in layout 1was significantly lower than that in layout 2 and layout 3,which was due to the fact that layout 1 could provide infor-mation more clearly and more in line with the subjects’ cog-nition and was more effective in the process of observing thethree interfaces in order to obtain task information.
0
20
40
60
80
100
0 5 10 15
Mea
n va
lue
Numbering
Layout 1Layout 2Layout 3
0
20
40
60
80
100
0 5 10 15
Mea
n va
lue
Numbering
Layout 4Layout 5Layout 6
Figure 7: Number of fixations in three layouts.
Table 4: Model simulation results.
Number oftrials
Number ofconditions met
Cumulativetimes
Likelihoodvalue
5000 1389 1389 0.2778
10000 1384 2773 0.2773
15000 1381 4154 0.2769
20000 1392 5546 0.2773
25000 1386 6932 0.2773
30000 1390 8322 0.2774
35000 1391 9713 0.2775
40000 1395 11108 0.2777
10 Wireless Communications and Mobile Computing

However, layout 2 and layout 3 are not clear enough, and thesubjects’ line of sight needs to turn back repeatedly, whichleads to the increase of fixation points and the decrease ofinformation acquisition efficiency, which affects the usabilityof the interactive interface. According to the fixation paths ofthe three subjects, it can be seen that the fixation sequencepath of layout 1 is clearer and simpler than that of layout 2and layout 3, with fewer detours and lower fixation points.At the same time, according to the experimental task setting,the three subjects were able to search information accordingto the established logic, and they were relatively fuzzy anduncertain in layouts 2 and 3. According to the comprehen-sive evaluation model of intelligent product interactioninterface usability, layout 1 has lower design complexity,higher interaction efficiency, better user cognition, and bet-ter usability.
The simulation results of the model are shown inTable 4. From the result of simulation analysis, the possibil-ity of the design process to complete the task within 30 daysis still relatively low, and the distribution range of task com-pletion time is large. Some measures should be taken toimprove the design process within the specified cost rangeso as to improve the design quality and shorten the productdevelopment time. With the increase of simulation times,
the simulation accuracy is higher and more stable. The prob-ability of completing the design task in 30 days is 27.74%.
Under the condition of given task quantity, the corre-sponding resource demand will also change if the time con-straint is changed. In the same way, the optimal allocation ofresources can be obtained by changing the proportion ofresources to affect the completion time and resource utiliza-tion efficiency of the design process. The statistics of timesand probability of completing design tasks within 30 daysbefore and after optimization are shown in Figure 8. The sin-gle optimization effect of optimization scheme 1 and optimi-zation scheme 2 is better than that of optimization scheme 3,and the optimization effect of three optimization schemescan be superimposed; after optimization scheme 4 is formedby three optimization schemes, the possibility of completingdesign tasks in 30 days for building product equipmentdetailed design process instance is increased to 69.73%, with-out a significant increase in design cost. Within the specifieddesign time, the task completion rate is increased by 42%,and the optimization effect is remarkable.
4.3. Process Planning Results. Although the product principlestructure model is an expression of the actual structure ofthe product in principle, it also corresponds to a certainfunction. It can express its corresponding different workingstates through graph theory. The working state of the prod-uct principle structure model can be expressed by the cate-gory of energy, and the corresponding energy conversionmatrix and other transformations are used to determinethe working state corresponding to the product principlestructure model, and then we use the representation methodin graph theory to perform different working states. Expres-sion provides an object basis for optimizing redundant com-ponents. For the product principle structure model, differentprinciple components may correspond to the process of
0%
20%
40%
60%
80%
100%
1 2 3 4 5 6 7 8 9 10
Valu
e
Numbering
Optimization 4Optimization 2
Optimization 3Optimization 1
Figure 8: Statistics of the number and probability of completing design tasks within 30 days before and after optimization.
Table 5: Comparison results of characteristics.
GroupNumber ofobservations
Sum Mean Variance
Horizontallayout
12 74625 6218.75 24335.48
Vertical layout 12 78960 6580 82093.27
Central layout 11 69854 6574 62478.21
Edge layout 10 66857 6614 52142.32
11Wireless Communications and Mobile Computing

energy generation, consumption, storage, and conversion,and they can be combined to realize the effect on energy.In order to ensure that the system corresponding to theproduct principle structure model has input energy and out-put energy and to prevent the continuous circulation ofenergy, it is stipulated that there is no structural loop inthe product principle structure model, and energy can beoutput through the system.
The comparison results of the advantages and disadvan-tages of the features are shown in Table 5. The purpose ofmetadata is to clearly describe and present the informationof the design object. In the construction of the metadataframework in the field of data science, in order to ensurethe consistency and integrity of various standards, metadatais usually divided into three levels. In the field of design,three-tier data decomposition can clearly express the infor-mation of the design object. At the same time, it is easy toensure that the metadata information does not deviate fromthe information subject of the design object. The probabilitybetween groups is p = 0:000899 < 0:05, and the horizontaland vertical layout has a significant impact on the task com-pletion efficiency. According to the current informatizationlevel of small- and medium-sized enterprises, the data ofdesign quality information is still mainly based on ordinary
document data, so most of the quality information will bestored and managed in an unstructured way in the PDM sys-tem. Some data information that is convenient for structuredmanagement should be managed in a structured waythrough data decomposition as much as possible.
The design quality feature extraction of the vibratingscreen is shown in Figure 9. According to the user require-ments for the design quality of the vibrating screen, thedesign quality characteristic information of the vibratingscreen are accurately extracted based on the technology ofthe house of quality, including the design quality character-istic elements and their relative importance, which are as fol-lows: plastic arts (0.036); system reliability (0.064); efficacyand practicability (0.494); structural manufacturability(0.136); manufacturing economy (0.023); design economy(0.075); environmental harmlessness (0.127); maintenanceconvenience (0.030); and production time (0.020). Modernproduct design methods based on the intelligent micropro-cessor still pay attention to the expression of product formsemantics. At the same time, the performance of the productform in the network environment is different from the per-formance in the real environment. In the network environ-ment, user experience and testing are carried out throughcomputers, so it is necessary to highlight the morphologicalcharacteristics of products and highlight the characteristicsof product design.
4.4. Model Analysis of the Product Design Process. In theserial process, all the design is completed and handed overto the process, the process is fed back, and the problematicpart is redesigned. Although there is process feedback beforethe design is all qualified, there is only design iteration, so itis a serial process. In addition to the parallel and iterativecharacteristics of product parallel design, it also has
0 1 2 3 4 5 6 7 8 91
2
3
4
5
6
7
8
9
Value
Seria
l num
ber
Production timelinessServiceabilityEnvironmentally sound
Design economy
EffectivenessManufacturing economy
Figure 9: Extraction of design quality features of the vibrating screen.
Table 6: Experimental results of semantic similarity calculation.
Threshold θ 0.3 0.4 0.5 0.6 0.7
Sample 1Precision 0.79 0.74 0.88 0.81 0.77
Recall rate 0.92 0.90 0.81 0.69 0.66
Sample 2Precision 0.53 0.55 0.60 0.46 0.41
Recall rate 0.66 0.66 0.58 0.57 0.52
12 Wireless Communications and Mobile Computing

overlapping characteristics. It is manifested in the process ofupstream product design information from vague to clearduring the specific design and process implementation,while the downstream process design progresses to a certainlevel in the upstream product design. The stage beginsinstead of after the design is over.
According to the different distribution of concepts, thesemantic similarity calculation method can be divided intotwo different algorithms: the distribution in the local ontol-ogy and the distribution in the scenario. The distributionalgorithm in the scenario is designed for the existence oftwo ontology concepts in different local ontologies, but itcan also be applied to the same local ontology. In order tomake the experimental results comparable, two algorithmsare used to calculate the case that different ontology con-cepts are in the same local ontology. For training sample 1and training sample 2, mapping relations based on semanticsimilarity were established in domain ontology with decora-tive materials as the theme and domain ontology with elec-troplating technology as the theme, respectively. Theexperimental results of semantic similarity calculation areshown in Table 6 and Figure 10. According to the data inthe table, when the threshold value is 0.5, the precision ofsample 1 and sample 2 reaches the maximum value, whichis 0.88 and 0.6, respectively; when the threshold value is0.3, the recall ratio of sample 1 and sample 2 reaches themaximum value, which is 0.92 and 0.66, respectively. Thethreshold value θ and the sample size have a great influenceon the final calculation results. Taking the appropriate valueof θ, increasing the coverage of samples, and expanding thenumber of samples, we can get better results. At the sametime, the calculation of semantic correlation and similaritybetween ontologies can be completed in advance and storedin the database. Therefore, although the amount of calcula-tion is large, it will not affect the speed of knowledge servicecalculation of designers in product design.
5. Conclusions
The core of modern enterprise competition is the ability ofenterprise products and technology innovation. Theresponse ability of enterprise products to the market is thekey of enterprise management. The product is the mainbody of all enterprise activities. Whether the enterprise canbe invincible in the future competition largely depends onwhether the enterprise adopts advanced modern designmeans to develop market-oriented products faster and bet-ter. Usability testing should be organically combined withthe design and development process of products, and the testresults can guide the improvement of the product designscheme, which can effectively control the design cost,improve the product quality, and make the product havestronger market competitiveness.
This paper takes the product in the design process as theresearch object, through the relevant theoretical tools, andthe concept design as the concept, and the implementationof the human-centered design principle, including the useof the computer intelligent microprocessor, in the productdesign process has not yet produced the product usabilityevaluation. Through the analysis and research of the mainproduct design evaluation theory, a new idea and methodof product design evaluation is realized.
Through effective integration with the product designCAD system, product database system, and remote accesssystem with other department information of the enterprise,the integrated management of all information used and gen-erated in the design process is realized. Evaluators can usethe real-time and accurate intelligent microprocessor toevaluate the product. The entire evaluation process is notlimited by the time and region and highly simulates the realuse situation of the product so as to maximize the control ofthe uncertain factors of consumer demand and make theresults more objective and accurate.
0
0.2
0.4
0.6
0.8
1
0.3 0.4 0.5 0.6 0.7
Resu
lt
Threshold
Sample 2 recall rateSample 1 recall rate
Sample 1 precisionSample 2 precision
Figure 10: Experimental results of semantic similarity calculation.
13Wireless Communications and Mobile Computing
Data Availability
The data that support the findings of this study are availablefrom the corresponding authors upon reasonable request.
Conflicts of Interest
The authors declared no potential conflicts of interest withrespect to the research, authorship, and/or publication ofthis article.
Acknowledgments
This work was supported by the Postdoctoral Science Foun-dation of China (2020M672101), the Postdoctoral Innova-tion Science Foundation of Shandong (202002046), and theInternational Cooperation Project of Qilu University, China(No. QLUTGJHZ2018022).
References
[1] P. Xia, “Haptics for product design andmanufacturing simula-tion,” IEEE Transactions on Haptics, vol. 9, no. 3, pp. 358–375,2016.
[2] J. P. Pernot, B. Falcidieno, F. Giannini, and J. C. Léon, “Incor-porating free-form features in aesthetic and engineering prod-uct design: state-of-the-art report,” Computers in Industry,vol. 59, no. 6, pp. 626–637, 2016.
[3] G. Du, Y. Zhang, X. Liu, R. J. Jiao, Y. Xia, and Y. Li, “A reviewof leader-follower joint optimization problems and mathemat-ical models for product design and development,” The Inter-national Journal of Advanced Manufacturing Technology,vol. 103, no. 9-12, pp. 3405–3424, 2019.
[4] V. Tiwari, P. K. Jain, and P. Tandon, “Product design conceptevaluation using rough sets and VIKOR method,” AdvancedEngineering Informatics, vol. 30, no. 1, pp. 16–25, 2016.
[5] T. Suh, J. Ford, Y. S. Ryu, and J. H. S. Kim, “Enhancing thesimultaneous utilization of measure in product design foracademic-practitioner collaboration,” Journal of Product &Brand Management, vol. 26, no. 3, pp. 312–326, 2017.
[6] D. Tang, R. Zhu, J. Tang, R. Xu, and R. He, “Product designknowledge management based on design structure matrix,”Advanced Engineering Informatics, vol. 24, no. 2, pp. 159–166, 2018.
[7] G. B. Loureiro, J. C. E. Ferreira, and P. H. Z. Messerschmidt,“Design structure network (DSN): a method to make explicitthe product design specification process for mass customiza-tion,” Research in Engineering Design, vol. 31, no. 2, pp. 197–220, 2020.
[8] I. Belboula, C. L. Ackermann, J. P. Mathieu, and C. Cuny,“Consumers' responses to product design: using a semanticpriming task to assess automatic understanding of productpositioning,” International Journal of Market Research,vol. 61, no. 2, pp. 140–156, 2019.
[9] D. Howard, “IoT product design considerations: security,functionality, interoperability,” Appliance Design, vol. 66,no. 5, pp. 12-13, 2018.
[10] T. Maggio, “Senses to cultivate the collective consciousness:physical theatre, an experimental approach to product designeducation,” Technoetic Arts, vol. 14, no. 3, pp. 275–281, 2016.
[11] C. Lu, H. Chai, M. Tian, X. Peng, and S. Jiang, “Product func-tion combination design based on functional redundancyanalysis,” Concurrent Engineering, Research, and Applications,vol. 25, no. 3, pp. 229–244, 2017.
[12] C. Sassanelli, G. Pezzotta, F. Pirola et al., “Using design rules toguide the PSS design in an engineering platform based on theproduct service lifecycle management paradigm,” Interna-tional Journal of Product Lifecycle Management, vol. 11,no. 2, pp. 91–115, 2018.
[13] K. L. LaBat and S. L. Sokolowski, “A three-stage design processapplied to an industry-university textile product design pro-ject,” Clothing & Textiles Research Journal, vol. 17, no. 1,pp. 11–20, 2016.
[14] L. P. Berg and J. M. Vance, “Industry use of virtual reality inproduct design and manufacturing: a survey,” Virtual Reality,vol. 21, no. 1, pp. 1–17, 2017.
[15] F. Tao, L. N. Bi, Y. Zuo, and A. Y. C. Nee, “A hybrid groupleader algorithm for green material selection with energy con-sideration in product design,” CIRP Annals - ManufacturingTechnology, vol. 65, no. 1, pp. 9–12, 2016.
[16] R. G. Askin and J. B. Goldberg, “Economic optimization inproduct design,” Engineering Optimization, vol. 14, no. 2,pp. 139–152, 2016.
[17] S. Stegemann, R. L. Ternik, G. onder, M. A. Khan, and D. A.van Riet-Nales, “Defining patient centric pharmaceutical drugproduct design,” The AAPS Journal, vol. 18, no. 5, pp. 1047–1055, 2016.
[18] K. M. Kim and K. P. Lee, “Collaborative product design pro-cesses of industrial design and engineering design in consumerproduct companies,” Design Studies, vol. 46, no. 9, pp. 226–260, 2016.
[19] K. Y. Lin, C. F. Chien, and R. Kerh, “UNISON framework ofdata-driven innovation for extracting user experience of prod-uct design of wearable devices,” Computers & Industrial Engi-neering, vol. 99, no. 9, pp. 487–502, 2016.
[20] Y. Xia, V. R. Singhal, and G. Peter Zhang, “Product designawards and the market value of the firm,” Production & Oper-ations Management, vol. 25, no. 6, pp. 1038–1055, 2016.
[21] R. B. Malmiry, J. Pailhès, A. J. Qureshi, J. F. Antoine, and J. Y.Dantan, “Management of product design complexity due toepistemic uncertainty via energy flow modelling based onCPM,” CIRP Annals-Manufacturing Technology, vol. 65,no. 1, pp. 169–172, 2016.
[22] A. Wong, M. Sherris, and R. Stevens, “Natural hedging strate-gies for life insurers: impact of product design and risk mea-sure,” Journal of Risk & Insurance, vol. 84, no. 1, pp. 153–175, 2017.
[23] M. F. Hassan, M. Z. M. Saman, S. Sharif, and B. Omar, “Sus-tainability evaluation of alternative part configurations inproduct design: weighted decision matrix and artificial neuralnetwork approach,” Clean Technologies & Environmental Pol-icy, vol. 18, no. 1, pp. 63–79, 2016.
[24] M. Kumar and C. H. Noble, “Beyond form and function: whydo consumers value product design?,” Journal of BusinessResearch, vol. 69, no. 2, pp. 613–620, 2016.
[25] R. P. Jindal, K. R. Sarangee, R. Echambadi, and S. Lee,“Designed to succeed: dimensions of product design and theirimpact on market share,” Journal of Marketing, vol. 80, no. 4,pp. 72–89, 2016.
[26] S. Nazari-Shirkouhi and A. Keramati, “Modeling customersatisfaction with new product design using a flexible fuzzy
14 Wireless Communications and Mobile Computing

regression-data envelopment analysis algorithm,” AppliedMathematical Modelling, vol. 50, no. 10, pp. 755–771, 2017.
[27] H. Zhang, X. Han, R. Li, S. Qin, G. Ding, and K. Yan, “A newconceptual design method to support rapid and effective map-ping from product design specification to concept design,”International Journal of Advanced Manufacturing Technology,vol. 87, no. 5-8, pp. 2375–2389, 2016.
[28] J. de Aguiar, L. de Oliveira, J. O. da Silva, D. Bond, R. K. Scalice,and D. Becker, “A design tool to diagnose product recyclabilityduring product design phase,” Journal of Cleaner Production,vol. 141, no. 1, pp. 219–229, 2017.
[29] J. Liu, Z. Cheng, and Y. Ma, “Product design-optimizationintegration via associative optimization feature modeling,”Advanced Engineering Informatics, vol. 30, no. 4, pp. 713–727, 2016.
15Wireless Communications and Mobile Computing