Embed Size (px)
Citation preview

USA Technologies Investor Presentation
NASDAQ: USAT

Safe Harbor Statement
All statements, other than statements of historical fact included in this presentation, are forward-looking statements. When used in this presentation, words such as
“anticipate”, “believe”, “estimate”, “expect”, “intend”, and similar expressions, as they relate to USA Technologies or its management, identify forward-looking statements.
Such forward-looking statements are based on the beliefs of USA Technologies’ management, as well as assumptions made by and information currently available to USA
Technologies’ management. Actual results could differ materially from those contemplated by the forward-looking statements as a result of certain factors, including but not
limited to, business, financial market and economic conditions; the incurrence of any unanticipated or unusual non-operating expenses which would require diversion of
cash resources; the ability of USA Technologies to predict or estimate its future annual revenues or connections; the ability of USA Technologies to retain key customers
from whom a significant portion of its revenues is derived; the ability of a key customer to reduce or delay purchasing products from USA Technologies; whether suppliers
would increase their prices, reduce output or change their terms of sale; whether, and the promptness with which, customers install new connections; whether, and the
extent to which, new connections will generate revenues for USA Technologies in future quarters; whether USA Technologies’ customers continue to utilize USA
Technologies’ transaction processing and related services, as customer agreements are generally cancelable by the customer on thirty to sixty days’ notice; the ability of
USA Technologies to accurately estimate potential connections controlled by its existing customer base and predict future market conditions and customer behavior;
whether customers will increase their purchases of USA Technologies’ products and services in the future; the ability of our products and services to avoid unauthorized
hacking or credit card fraud; the extent to which USAT’s 2015 Cashless Knowledge Base is predictive of average annual cashless sales; the ability of the Company’s 2015
Cashless Knowledge Base to predict future market conditions, customer and consumer behavior, and average ticket prices and cashless sales across all of USAT’s
customer locations; the accuracy and reliability of third party data relating to potential connections in the market; the ability of Apple Pay to drive demand and adoption; and
the possibility that all of the expected benefits from adoption of cashless payment will not be realized by all vending operators, or will not be realized within the expected
time period. Readers are cautioned not to place undue reliance on these forward-looking statements. Any forward-looking statement made in this presentation speaks only
as of the date of this presentation. Unless required by law, USA Technologies does not undertake to release publicly any revisions to these forward-looking statements to
reflect future events or circumstances or to reflect the occurrence of unanticipated events.
Non-GAAP Information: This presentation includes a discussion of non-GAAP net income (loss) and Adjusted EBITDA which are non-GAAP financial measures that USA
Technologies believes are useful for an understanding of the Company’s ongoing operations. These non-GAAP financial measures are supplemental to, and not a
substitute for, GAAP financial measures such as net income or loss. Details of these items and a reconciliation of these non-GAAP financial measures to GAAP financial
measures can be found in the Appendix to this presentation, and at www.USAT.com under the “Investor Relations” tab.
5/15/2017
2Introduction

Investment Highlights
- Strong growth company
- High proportion of recurring revenue
- Large penetration opportunity in U.S.
- Market and technology leader for cashless
payment in self-serve retail
- Improved cash flow from operations
- Mgt. team with deep relevant experience
- Deferred tax asset of approximately $28 M
that may be available to offset future
taxable income
Quarterly Revenue Highlights
5/15/2017
3Introduction
0
5
10
15
20
25
30
$s
in m
illio
ns
License & Transaction Equipment Sales

Customer Base Increasing at Substantial Rate
174,000 Connections 1Q 2013
504,000 Connections 3Q 2017
3,725 Customers 1Q 2013
12,400 Customers 3Q 2017
Connections Customers
5/15/2017
4Introduction
-
100,000
200,000
300,000
400,000
500,000
600,000
-
2,000
4,000
6,000
8,000
10,000
12,000
14,000

USA Technologies Overview
Market leading, IoT, one-stop cashless payment and telemetry services specifically designed for the self-serve retail market.
5/15/2017
5Introduction

USA Technologies Overview
USA Technologies provides the technology that modern businesses need to thrive in the rapidly evolving unattended retail marketplace.
5/15/2017
6Introduction
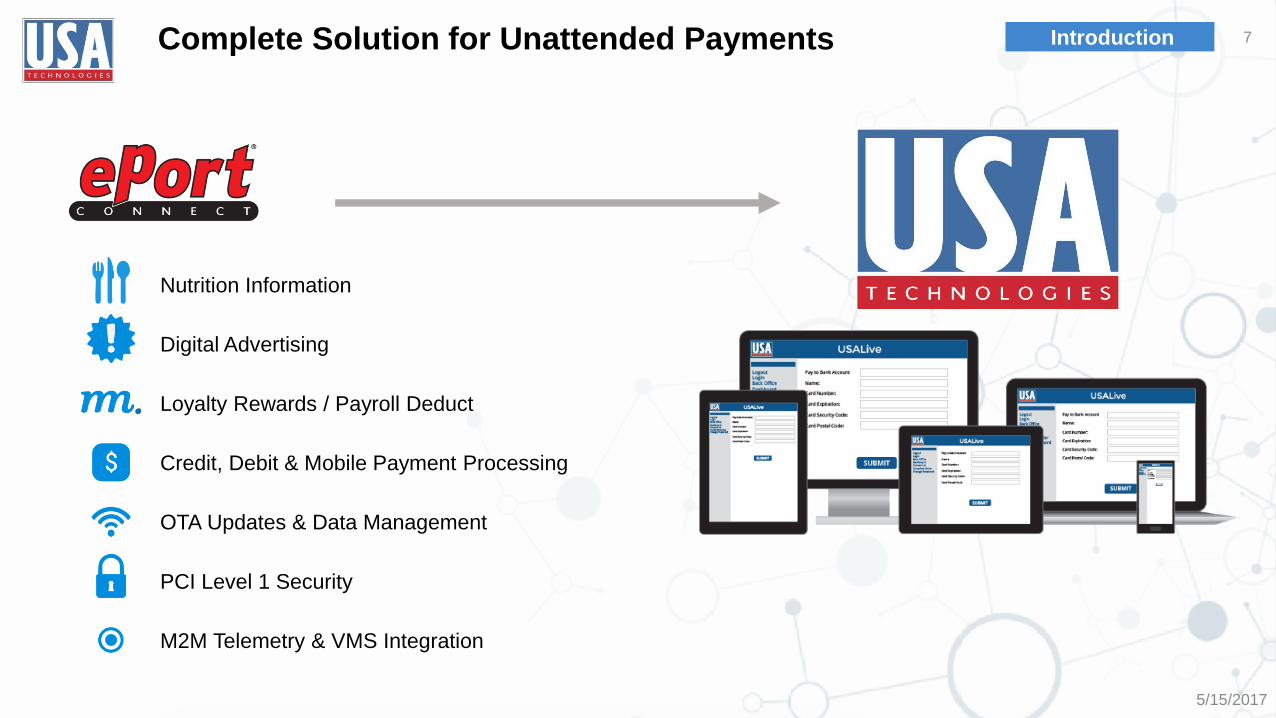
Complete Solution for Unattended Payments
Nutrition Information
Digital Advertising
Loyalty Rewards / Payroll Deduct
Credit, Debit & Mobile Payment Processing
OTA Updates & Data Management
PCI Level 1 Security
M2M Telemetry & VMS Integration
5/15/2017
7Introduction

Large Domestic Opportunity in Self-serve Retail
Established Foothold in Multiple Market Segments
Vending
Office Coffee
Automated Carwash
Amusement & Arcade
Parking
Tolls
Commercial Laundry
Kiosks
504,000
Connections
- Strong growth company
- High proportion of recurring revenue
- Large penetration opportunity in U.S.
- Market and technology leader for
cashless
5/15/2017
8Introduction

Large Domestic Opportunity in Self-serve Retail
Vending
Office Coffee
Automated Carwash
Amusement & Arcade
Parking
Tolls
*Company Estimate
Kiosks
13 – 15 Million potential
connections*
Sources: US Department of Transportation, 2008; IHL Kiosk Study, 2010 (2011 projections) First Research, March 2011, June 2010; Vending Times Census 2012; Smart Card Alliance 2006; Automated Merchandiser State of the Coffee Industry 2009; USA Technologies estimates.
Commercial Laundry
5/15/2017
9Introduction

National Vending Trends
The 2015 USA Technologies’ KnowledgeBase shows vending consumers continue to buy more,
spend more and buy more often with credit and debit cards on ePort-equipped machines.
Average Annual Cash Sales + Cashless Payments + Average Sale +
5/15/2017
10Introduction

Kiosk Opportunity
- IoT driven kiosk opportunity
- Kiosk market in North America expected to grow at 6.2% CAGR1
- Embedded systems, independent of traditional hardware
- Typically larger transaction amounts
- TouchTunes has 65,000 potential locations
- MinuteKey migrating all locations to ePort Connect
5/15/2017
11Introduction

Significant USAT Partners and Adoption Drivers
5/15/2017
12Introduction

Largest NFC-enabled Mobile Footprint
- Approximately 400,000 NFC-enabled merchant locations
- All newly shipped ePort terminals are NFC-enabled
- Google’s launch of Android Pay solidifies broader market acceptance of the mobile payments technology
- Apple Pay introduction marks tectonic shift, expected to drive demand and adoption
- Accepted throughout USAT network
13Introduction

Largest NFC-enabled Mobile Footprint
- ~400,000 NFC-enabled merchant locations
- All newly shipped ePort terminals are NFC-enabled
- Apple Pay introduction marks tectonic shift, expected to drive demand and adoption
- Accepted throughout USAT network
- Google’s launch of Android Pay solidifies broader market acceptance of the mobile payments technology
5/15/2017
14Introduction

Growth Strategy

We Are Experiencing an Inflection Point
Core
Growth
Value-
Added
ServicesMobile &
Other
TODAY
Drive
Adoption
Strategic
Expansion
FY 2014 FY 2015
Early
Adopters
Market
Acceptance
Achieve
Scale
FY 2012 FY 2013
156,000 connections
4/12
Drive Market
Achieved scale in service model;
Crossover to positive Adjusted EBITDA
Leverage Model
Targeting: $100M revenue;
Increasing cash generated by
operations
500,000 connections250,000 connections
4/14
Build Momentum
Free cash flow and non-GAAP net income
504,000connections
5/15/2017
16Growth Strategy

Largest Growth Opportunity: Our Customers
88% of New Connections came from existing customers in 3Q FY17
+2 Million potential connectionsThere are over 2 million* possible connections in our customers’ portfolios
504,000 existing connections
2 Million+
potential
connections*
*Company Estimate
5/15/2017
17Growth Strategy

Building Blocks of Growth
GR
OW
TH IN
CO
NN
ECTI
ON
S
GR
OW
TH IN
TH
E V
ALU
E O
F C
ON
NEC
TIO
NS
5/15/2017
18Growth Strategy

VendScreen Acquisition
One of the industry’s most advanced interactive media, content delivery systems, and
touchscreen platforms designed specifically for the self service retail market
Nutrition Information
Digital Advertising
Loyalty Program
Coupons / Offers
5/15/2017
19Growth Strategy

ePort Interactive Launch
5/15/2017
20Growth Strategy

Financial Progress

Expanding Connection Base Driving Growth
5/15/2017
22Financial Progress
* Company estimate
119,000
164,000
214,000
266,000
333,000
429,000
544,000 -554,000*
0
100,000
200,000
300,000
400,000
500,000
600,000
FY11 FY12 FY13 FY14 FY15 FY16 FY17E*
Connection Base

Increasing Annual Transaction ValueM
illio
ns
Annual Transaction Value
5/15/2017
23Financial Progress
Projected to reach $1 billion annual transaction run rate during FY 2017
$20M
$171M
$219M
$294M
$389M
$584M
$0
$100
$200
$300
$400
$500
$600
$700
FY11 FY12 FY13 FY14 FY15 FY16

Revenue Growth
5/15/2017
24Financial Progress
$22.9M
$29M
$35.9M
$42.3M
$58.1M
$77.4M
$95M - $100M*
$0
$10
$20
$30
$40
$50
$60
$70
$80
$90
$100
FY11 FY12 FY13 FY14 FY15 FY16 FY17E*
Revenue
* Company estimate
Mill
ion
s

Fiscal 2017 Outlook
MetricFY17
Guidance
Increase from
FY16
Connections
Revenue $95,000,000 to $100,000,000
+ 115,000 to 125,000 27% to 29%
23% to 29%
5/15/2017
25Financial Progress

Management Team
Stephen P. HerbertChairman and CEO
• Chairman and CEO since 2011• President and COO from 1999• Operations, Sales and Marketing at
PepsiCo including market strategy for vending and retail channels of Pepsi Cola N.A.
Priyanka SinghCFO
• Appointed CFO in 2017• VP Product Strategy &
Innovation/Division CFO, Global Payments Inc., CFO Heartland Commerce Units/VP Finance, Heartland Payment Systems (acquired by Global Payments) and various leadership roles with General Electric
• Certified Public Accountant and a member of the AICPA
Maeve DuskaSVP Sales & Marketing
• SVP Marketing since 2015• VP Marketing from 2009• Marketing for all products and services
for flagship ePort branded services from 2004
• Marketing Manager, Higher Education, Aramark
George HarrumSVP Operations
• SVP Operations and Customer Service since 2001
• Various Operations Positions, Danyl/Schlumberger from 1982
Michael K. LawlorCSO
• Appointed CSO in 2016• SVP Sales and Business
Development since 2010• Sales and partner development
programs from 1996• National and Regional sales
manager positions, Pepsi Cola Co.
5/15/2017
26Financial Progress

www.usat.com
NASDAQ: USAT