Embed Size (px)
Citation preview

INVESTOR PRESENTATION Q3 2016
AGENDA
FINANCIAL HIGHLIGHTS Q3 2016
FINANCIAL EXPECTATIONS 2016
FINANCIAL REVIEW Q3 2016
APPENDIX
Q3 2016 PANDORA INVESTOR PRESENTATION2
DISCLAIMER
Certain statements in this presentation constitute forward-looking statements. Forward-looking statements are statements (other than statements of historical fact) relating to future events and our anticipated or planned financial and operational performance. The words “targets,” “believes,” “expects,” “aims,” “intends,” “plans,” “seeks,” “will,” “may,” “might,” “anticipates,” “would,” “could,” “should,” “continues,” “estimates” or similar expressions or the negatives thereof, identify certain of these forward-looking statements. Other forward-looking statements can be identified in the context in which the statements are made. Forward-looking statements include, among other things, statements addressing matters such as our future results of operations; our financial condition; our working capital, cash flows and capital expenditures; and our business strategy, plans and objectives for future operations and events, including those relating to our ongoing operational and strategic reviews, expansion into new markets, future product launches, points of sale and production facilities; and
Although we believe that the expectations reflected in these forward-looking statements are reasonable, such forward-looking statements involve known and unknown risks, uncertainties and other important factors that could cause our actual results, performance or achievements or industry results, to differ materially from any future results, performance or achievements expressed or implied by such forward-looking statements. Such risks, uncertainties and other important factors include, among others: global and local economic conditions; changes in market trends and end-consumer preferences; fluctuations in the prices of raw materials, currency exchange rates, and interest rates; our plans or objectives for future operations or products, including our ability to introduce new jewellery and non-jewellery products; our ability to expand in existing and new markets and risks associated with doing business globally and, in particular, in emerging markets; competition from local, national and international companies in the United States, Australia, Germany, the United Kingdom and other markets in which we operate; the protection and strengthening of our intellectual property rights, including patents and trademarks; the future adequacy of our current warehousing, logistics and information technology operations; changes in Danish, E.U., Thai or other laws and regulations or any interpretation thereof, applicable to our business; increases to our effective tax rate or other harm to our business as a result of governmental review of our transfer pricing policies, conflicting taxation claims or changes in tax laws; and other factors referenced to in this presentation.
Should one or more of these risks or uncertainties materialise, or should any underlying assumptions prove to be incorrect, our actual financial condition, cash flows or results of operations could differ materially from that described herein as anticipated, believed, estimated or expected.
We do not intend, and do not assume any obligation, to update any forward-looking statements contained herein, except as may be required by law or the rules of NASDAQ Copenhagen. All subsequent written and oral forward-looking statements attributable to us or to persons acting on our behalf are expressly qualified in their entirety by the cautionary statements referred to above and contained elsewhere in this presentation.
Q3 2016 PANDORA INVESTOR PRESENTATION3
FINANCIAL HIGHLIGHTS Q3 2016
HIGHLIGHTS
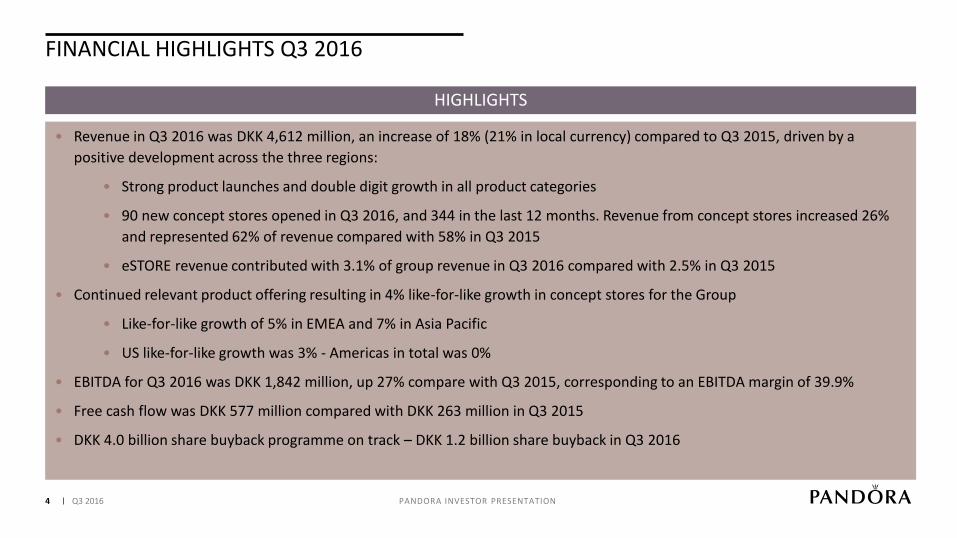
• Revenue in Q3 2016 was DKK 4,612 million, an increase of 18% (21% in local currency) compared to Q3 2015, driven by a
positive development across the three regions:
• Strong product launches and double digit growth in all product categories
• 90 new concept stores opened in Q3 2016, and 344 in the last 12 months. Revenue from concept stores increased 26%
and represented 62% of revenue compared with 58% in Q3 2015
• eSTORE revenue contributed with 3.1% of group revenue in Q3 2016 compared with 2.5% in Q3 2015
• Continued relevant product offering resulting in 4% like-for-like growth in concept stores for the Group
• Like-for-like growth of 5% in EMEA and 7% in Asia Pacific
• US like-for-like growth was 3% - Americas in total was 0%
• EBITDA for Q3 2016 was DKK 1,842 million, up 27% compare with Q3 2015, corresponding to an EBITDA margin of 39.9%
• Free cash flow was DKK 577 million compared with DKK 263 million in Q3 2015
• DKK 4.0 billion share buyback programme on track – DKK 1.2 billion share buyback in Q3 2016
Q3 2016 PANDORA INVESTOR PRESENTATION4

REGIONAL DEVELOPMENT
REVENUE BREAKDOWN BY REGION COMMENTS
• 18% revenue growth evenly split between organic and network growth
• 3pp negative impact from currency
• Americas revenue growth driven by the US
• US growth driven by like-for-like, network expansion and US eSTORE
• Continued strong growth in EMEA
• Italy and France increased revenue with around 70% and 35% respectively and had double digit like-for-like
• Positive Like-for-like in both UK and Germany
• Asia Pacific increase 46%
• Growth driven by China and Pacific
DKK million Q3 2016GrowthQ3/Q3
Growth in local currency
Americas 1,510 6% 6%
EMEA 2,220 18% 25%
Asia Pacific 882 46% 47%
Total 4,612 18% 21%
LIKE-FOR-LIKE SALES DEVELOPMENT (Y/Y GROWTH)Concept stores (excluding eSTOREs) that have been operating for more than 12 months
Q3 2016 Q3 2015 FY 2015
Americas 0% 5% 7%
EMEA 5% 15% 14%
Asia Pacific 7% 24% 22%
Group 4% 13% 13%
Q3 2016 PANDORA INVESTOR PRESENTATION5
Q3 2016 PANDORA INVESTOR PRESENTATION6
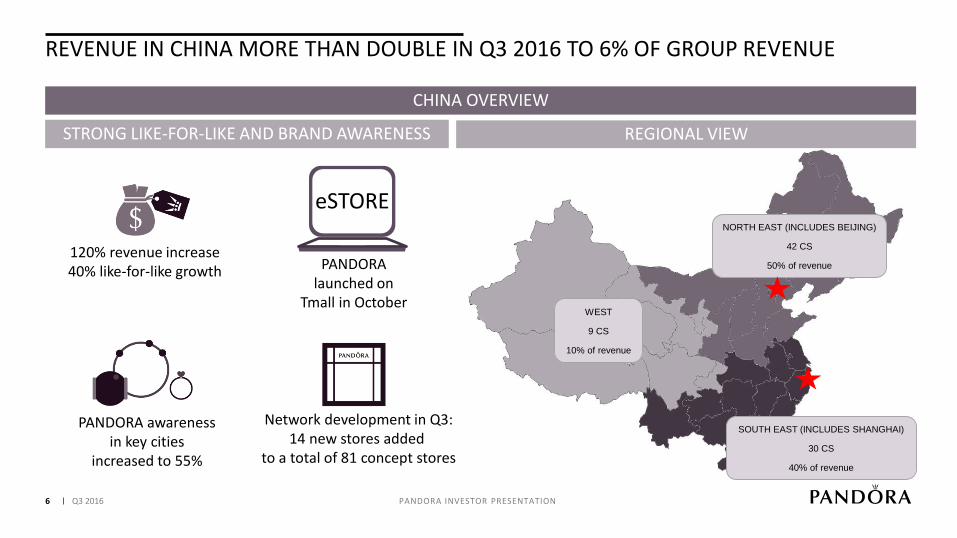
REVENUE IN CHINA MORE THAN DOUBLE IN Q3 2016 TO 6% OF GROUP REVENUE
eSTORE
120% revenue increase40% like-for-like growth PANDORA
launched on Tmall in October
PANDORA awarenessin key cities
increased to 55%
Network development in Q3:14 new stores added
to a total of 81 concept stores
WEST
9 CS
10% of revenue
SOUTH EAST (INCLUDES SHANGHAI)
30 CS
40% of revenue
NORTH EAST (INCLUDES BEIJING)
42 CS
50% of revenue
REGIONAL VIEWSTRONG LIKE-FOR-LIKE AND BRAND AWARENESS
CHINA OVERVIEW

2016 FINANCIAL EXPECTATIONS
• Full year revenue guidance maintained
• Revenue of more than DKK 20 billion
including a -4% impact from currency
• EBITDA margin guidance changed to around
39% (from more than 38%)
• Better ability to cope with production
complexity
• Marginally increased operating
leverage
• CAPEX maintained at DKK 1.2 billion
• Effective tax rate of approximately 21%
• More than 325 concept store openings (from
more than 300 concept store openings)
2016 2016 2015
GUIDANCE(new)
GUIDANCE(previous)
ACTUAL
Revenue, DKK billion >20 >20 16.7
EBITDA margin Approx. 39% >38% 37.1%
CAPEX, DKK billion Approx. 1.2 Approx. 1.2 1.1
Effective tax rate Approx. 21% Approx. 21% 31.3%
Concept store, net openings >325 >300 392
FINANCIAL GUIDANCE 2016 COMMENTS
Q3 2016 PANDORA INVESTOR PRESENTATION7
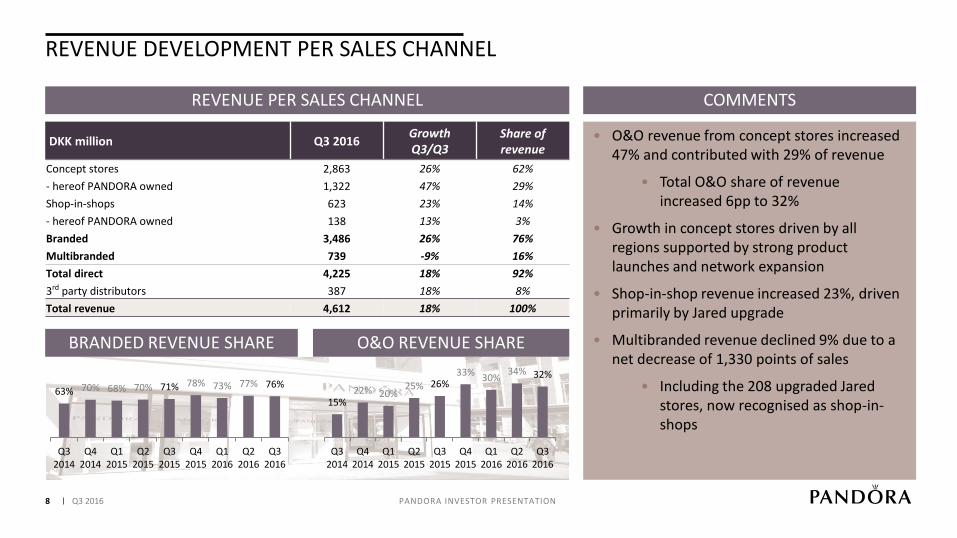
REVENUE DEVELOPMENT PER SALES CHANNEL
DKK million Q3 2016GrowthQ3/Q3
Share of revenue
Concept stores 2,863 26% 62%
- hereof PANDORA owned 1,322 47% 29%
Shop-in-shops 623 23% 14%
- hereof PANDORA owned 138 13% 3%
Branded 3,486 26% 76%
Multibranded 739 -9% 16%
Total direct 4,225 18% 92%
3rd party distributors 387 18% 8%
Total revenue 4,612 18% 100%
REVENUE PER SALES CHANNEL COMMENTS
• O&O revenue from concept stores increased 47% and contributed with 29% of revenue
• Total O&O share of revenueincreased 6pp to 32%
• Growth in concept stores driven by all regions supported by strong product launches and network expansion
• Shop-in-shop revenue increased 23%, driven primarily by Jared upgrade
• Multibranded revenue declined 9% due to a net decrease of 1,330 points of sales
• Including the 208 upgraded Jared stores, now recognised as shop-in-shops
BRANDED REVENUE SHARE O&O REVENUE SHARE
32%34%30%
33%26%25%
20%22%15%
Q32016
Q22016
Q12016
Q42015
Q32015
Q22015
Q12015
Q42014
Q32014
76%77%73%78%71%70%68%70%63%
Q32016
Q22016
Q12016
Q42015
Q32015
Q22015
Q12015
Q42014
Q32014
Q3 2016 PANDORA INVESTOR PRESENTATION8

COMMENTS
STORE NETWORK DEVELOPMENT
Number of stores
Q3 2016
Share of total
Q3 2016
Net openings
Q3 2016vs. Q2 2016
Q3 2016vs. Q3 2015
Concept stores 2,010 23% 90 344
- hereof PANDORA owned 563 6% 38 123
Shop-in-shops 1,987 22% 160 374
- hereof PANDORA owned 112 1% -6 -3
Branded 3,997 45% 250 718
Multibranded 4,924 55% -248 -1,330
Total PoS 8,921 100% 2 -612
STORE NETWORK
• 90 new concept stores opened in Q3 2016,
to a total of 2,010 concept stores
• Including the addition of 38 O&O
concept stores in Q3 2016, to a total
of 563 O&O concept stores
• Net opening of 160 shop-in-shops in Q3
2016, hereof 110 upgraded from
multibranded stores to shop-in-shops in
relation to the collaboration with Jared
• 1,330 multibranded stores closed in the last
12 months, including Jared upgrades
• Multibranded store closings primarily
in the US, Italy, Germany, France and
Spain
TOTAL CONCEPT STORES O&O CONCEPT STORES563525511474440
357292251218
Q32016
Q22016
Q12016
Q42015
Q32015
Q22015
Q12015
Q42014
Q32014
2.0101.9201.8521.8021.6661.5541.4471.4101.307
Q32016
Q22016
Q12016
Q42015
Q32015
Q22015
Q12015
Q42014
Q32014
Q3 2016 PANDORA INVESTOR PRESENTATION9

PRODUCT CATEGORY DEVELOPMENT
REVENUE PER PRODUCT CATEGORY COMMENTS
• Charms increased 10%, driven by Asia Pacific
and EMEA partially offset by Americas
• US charms impacted by lower
revenue from the Disney collection
• Rings were up 11% and contributed with
15% of revenue for the quarter
• Rings in North America impacted by
change in promotions
• Earrings increased around 100%, and
generated around 6% of total revenue
• Necklaces increased close to 40%
• Rings, Earrings and Necklaces contributed
with around 40% of the growth for the
quarter
DKK million Q3 2016GrowthQ3/Q3
Share ofrevenue
Share of growth
Charms 2,661 10% 58% 33%
Bracelets 777 35% 17% 29%
- Hereof Moments and ESSENCE collections 556 32% 12% 19%
Rings 686 11% 15% 10%
Other jewellery 488 67% 11% 28%
Total revenue 4,612 18% 100% 100%
58%17%
15%
11%Charms
Bracelets
Rings
OtherJewellery
CATEGORY SHARE% OF REVENUE
Q3 2016
RINGS SHARE OF REVENUE% OF LAST 12 MONTHS REVENUE
6% 6% 6% 6% 7%8%
9% 10% 11% 11%12% 12% 12% 13% 13%
0%2%4%6%8%
10%12%14%
Q1 Q2 Q3 Q4 Q1 Q2 Q3 Q4 Q1 Q2 Q3 Q4 Q1 Q2 Q3
2013 2014 2015 2016
Q3 2016 PANDORA INVESTOR PRESENTATION10

P&L OVERVIEW
DKK million Q3 2016GrowthQ3/Q3
Share ofrevenueQ3 2016
Q3/Q3(pp)
Share of revenue Q3 2015
Gross profit 3,464 20% 75.1% 1.1 74.0%
Operational expenses (incl. D&A) 1,745 12% 37.8% -1.9 39.7%
- hereof sales & distribution 934 16% 20.3% -0.3 20.6%
- hereof marketing 360 0% 7.8% -1.4 9.2%
- hereof administrative 451 17% 9.8% -0.1 9.9%
Depreciation and amortisation 123 7% 2.7% -0.2 2.9%
EBITDA 1,842 27% 39.9% 2.7 37.2%
Net financials 60
Income tax expenses 374
Net profit 1,405 40% 30.5% 4.8 25.7%
COST AND PROFIT COMMENTS
• Gross margin increased 1.1pp, driven by increased O&O share and favourable raw material prices partially offset by currency moves and increased complexity
• Gross margin impact of +/-1pp if 10% deviation on raw material prices
• Operational expenses were DKK 1.7 billion, corresponding to 37.8% of revenue, down 1.9pp compared to Q3 2015
• S&D ratio improved by 0.3pp driven primarily by leverage in key markets partially offset by more O&O
• Marketing expenses was DKK 360 million on par with Q3 2015
• Administrative ratio improved by 0.1pp to 9.8% of revenue
EBITDA MARGIN DEVELOPMENT (Y/Y)
Marketing
0.1%
Grossmargin
1.4%0.3%
1.1%
Q3 2015
37.2%
S&D Admin.
39.9%
Q3 2016D&A
0.2%
Q3 2016 PANDORA INVESTOR PRESENTATION11
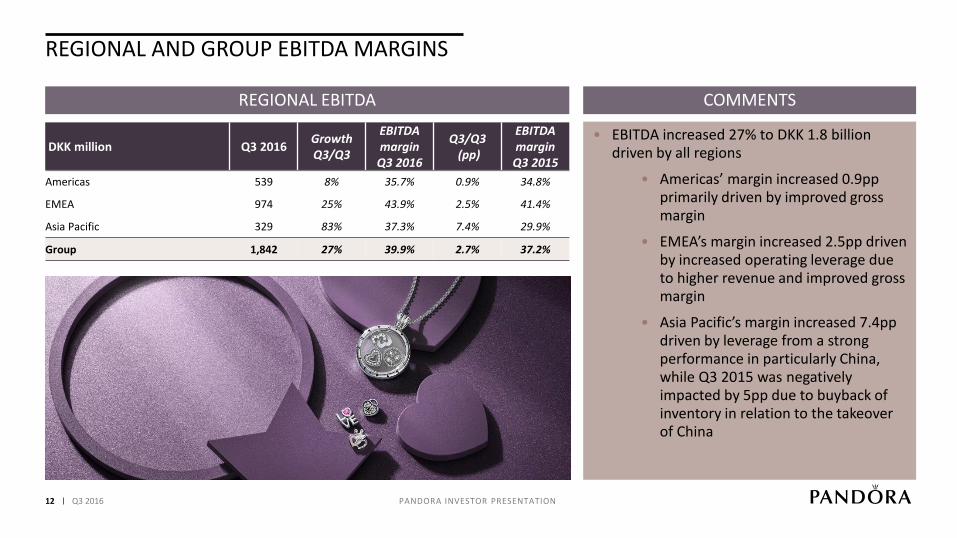
REGIONAL AND GROUP EBITDA MARGINS
REGIONAL EBITDA COMMENTS
• EBITDA increased 27% to DKK 1.8 billion driven by all regions
• Americas’ margin increased 0.9pp primarily driven by improved gross margin
• EMEA’s margin increased 2.5pp driven by increased operating leverage due to higher revenue and improved gross margin
• Asia Pacific’s margin increased 7.4pp driven by leverage from a strong performance in particularly China, while Q3 2015 was negatively impacted by 5pp due to buyback of inventory in relation to the takeover of China
DKK million Q3 2016GrowthQ3/Q3
EBITDA margin
Q3 2016
Q3/Q3(pp)
EBITDA margin
Q3 2015
Americas 539 8% 35.7% 0.9% 34.8%
EMEA 974 25% 43.9% 2.5% 41.4%
Asia Pacific 329 83% 37.3% 7.4% 29.9%
Group 1,842 27% 39.9% 2.7% 37.2%
Q3 2016 PANDORA INVESTOR PRESENTATION12

BALANCE SHEET AND CASH FLOW
DKK million Q3 2016 Q2 2016 Q1 2016 Q4 2015 Q3 2015
Inventory 3,166 2,929 2,474 2,357 2,584
Trade receivables 1,976 1,253 1,361 1,360 1,392
Trade payables 1,309 1,239 1,259 1,329 1,036
Operating working capital 3,833 2,943 2,576 2,388 2,940
- Share of revenue (last 12 months) 19.8% 15.8% 14.4% 14.3% 19.6%
Free cash flow 577 576 1,356 1,464 263
CAPEX 324 352 274 319 384
NIBD to EBITDA (LTM) 0.6x 0.5x 0.4x 0.3x 0.4x
WORKING CAPITAL AND CASH MANAGEMENT COMMENTS
• Operating working capital was 19.8% of revenue on par with Q3 2015 and increased compared to Q2 2016
• Increase in inventory related to inventory build up ahead of the Christmas collection
• Increase in receivables is related to extended credit terms for selected markets
• …and Q3 revenue being skewed towards end of quarter
• Free cash flow was DKK 577 million
• CAPEX amounted to DKK 324 million
• NIBD to EBITDA ratio within capital structure policy
Q3 2016 PANDORA INVESTOR PRESENTATION13
Q3 2016 SUMMARY
SUMMARY
• Revenue increased 18% (21% in local currency)
• Driven by all regions and categories
• Continued roll out of concept stores with the addition of 90 new concept stores during the quarter
• Online presence established in Canada and China
• Gross margin was 75.1%
• EBITDA margin was 39.9%
• Free cash flow was DKK 577 million
• Revenue guidance intact – EBITDA now expected to be around 39%.
Q3 2016 PANDORA INVESTOR PRESENTATION14
APPENDIX
Q3 2016 PANDORA INVESTOR PRESENTATION15
Q3 2016 PANDORA INVESTOR PRESENTATION16
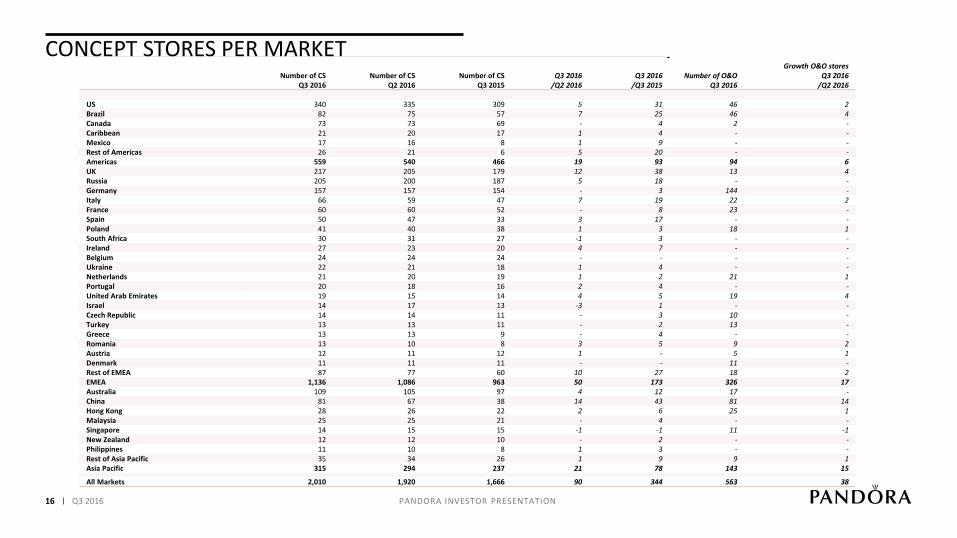
CONCEPT STORES PER MARKETNumber of CS
Q3 2016Number of CS
Q2 2016Number of CS
Q3 2015
GrowthQ3 2016
/Q2 2016
Growth Q3 2016
/Q3 2015Number of O&O
Q3 2016
Growth O&O storesQ3 2016
/Q2 2016
US 340 335 309 5 31 46 2Brazil 82 75 57 7 25 46 4Canada 73 73 69 - 4 2 -Caribbean 21 20 17 1 4 - -Mexico 17 16 8 1 9 - -Rest of Americas 26 21 6 5 20 - -Americas 559 540 466 19 93 94 6UK 217 205 179 12 38 13 4Russia 205 200 187 5 18 - -Germany 157 157 154 - 3 144 -Italy 66 59 47 7 19 22 2France 60 60 52 - 8 23 -Spain 50 47 33 3 17 - -Poland 41 40 38 1 3 18 1South Africa 30 31 27 -1 3 - -Ireland 27 23 20 4 7 - -Belgium 24 24 24 - - - -Ukraine 22 21 18 1 4 - -Netherlands 21 20 19 1 2 21 1Portugal 20 18 16 2 4 - -United Arab Emirates 19 15 14 4 5 19 4Israel 14 17 13 -3 1 - -Czech Republic 14 14 11 - 3 10 -Turkey 13 13 11 - 2 13 -Greece 13 13 9 - 4 - -Romania 13 10 8 3 5 9 2Austria 12 11 12 1 - 5 1Denmark 11 11 11 - - 11 -Rest of EMEA 87 77 60 10 27 18 2EMEA 1,136 1,086 963 50 173 326 17Australia 109 105 97 4 12 17 -China 81 67 38 14 43 81 14Hong Kong 28 26 22 2 6 25 1Malaysia 25 25 21 - 4 - -Singapore 14 15 15 -1 -1 11 -1New Zealand 12 12 10 - 2 - -Philippines 11 10 8 1 3 - -Rest of Asia Pacific 35 34 26 1 9 9 1Asia Pacific 315 294 237 21 78 143 15
All Markets 2,010 1,920 1,666 90 344 563 38
Q3 2016 PANDORA INVESTOR PRESENTATION17
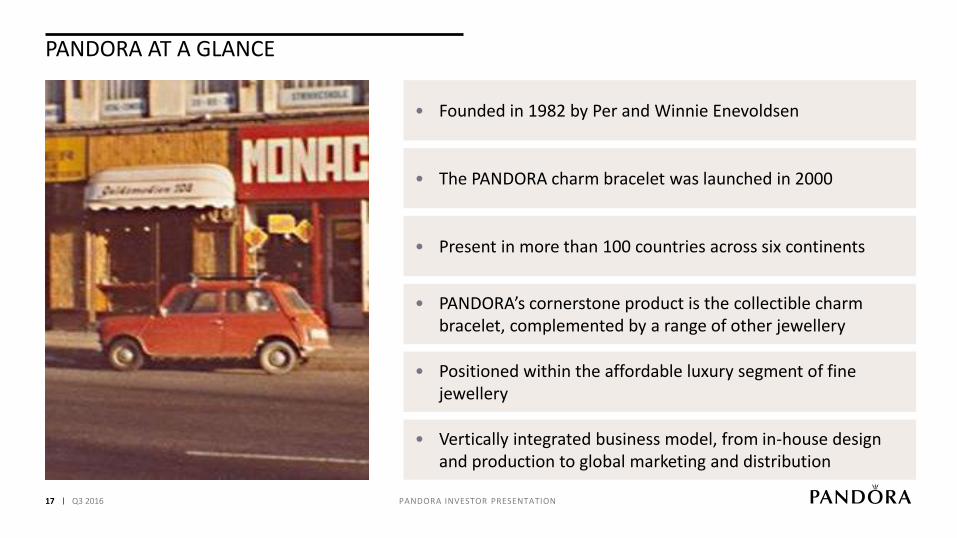
PANDORA AT A GLANCE
• Founded in 1982 by Per and Winnie Enevoldsen
• Present in more than 100 countries across six continents
• PANDORA’s cornerstone product is the collectible charm bracelet, complemented by a range of other jewellery
• Positioned within the affordable luxury segment of fine jewellery
• Vertically integrated business model, from in-house design and production to global marketing and distribution
• The PANDORA charm bracelet was launched in 2000
Q3 2016 PANDORA INVESTOR PRESENTATION18
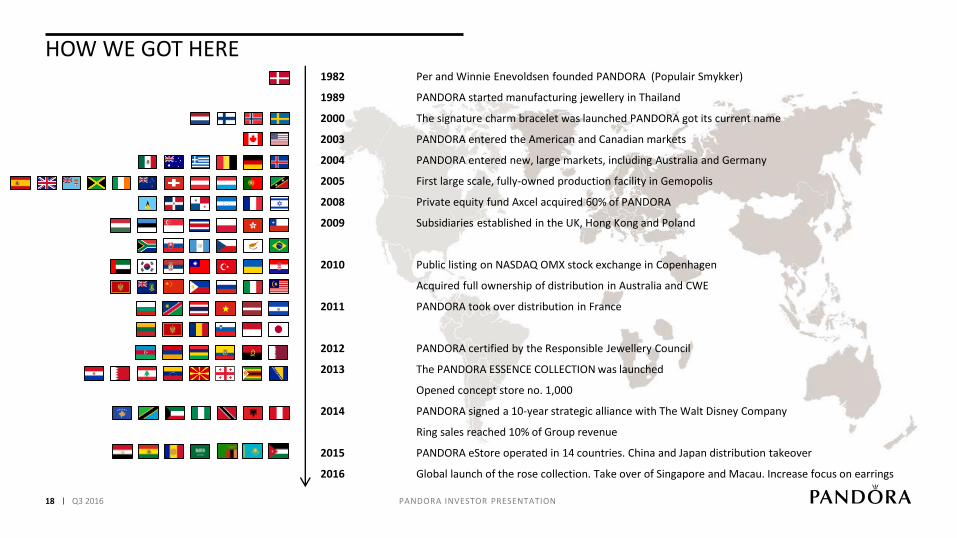
HOW WE GOT HERE1982 Per and Winnie Enevoldsen founded PANDORA (Populair Smykker)
1989 PANDORA started manufacturing jewellery in Thailand
2000 The signature charm bracelet was launched PANDORA got its current name
2003 PANDORA entered the American and Canadian markets
2004 PANDORA entered new, large markets, including Australia and Germany
2005 First large scale, fully-owned production facility in Gemopolis
2008 Private equity fund Axcel acquired 60% of PANDORA
2009 Subsidiaries established in the UK, Hong Kong and Poland
2010 Public listing on NASDAQ OMX stock exchange in Copenhagen
Acquired full ownership of distribution in Australia and CWE
2011 PANDORA took over distribution in France
2012 PANDORA certified by the Responsible Jewellery Council
2013 The PANDORA ESSENCE COLLECTION was launched
Opened concept store no. 1,000
2014 PANDORA signed a 10-year strategic alliance with The Walt Disney Company
Ring sales reached 10% of Group revenue
2015 PANDORA eStore operated in 14 countries. China and Japan distribution takeover
2016 Global launch of the rose collection. Take over of Singapore and Macau. Increase focus on earrings

Q3 2016 PANDORA INVESTOR PRESENTATION19
PRODUCT DEVELOPMENT
SIMPLE DESIGNS IN YEAR 2000
EVOLVED AND SOPHISTICATED PRODUCTS TODAY
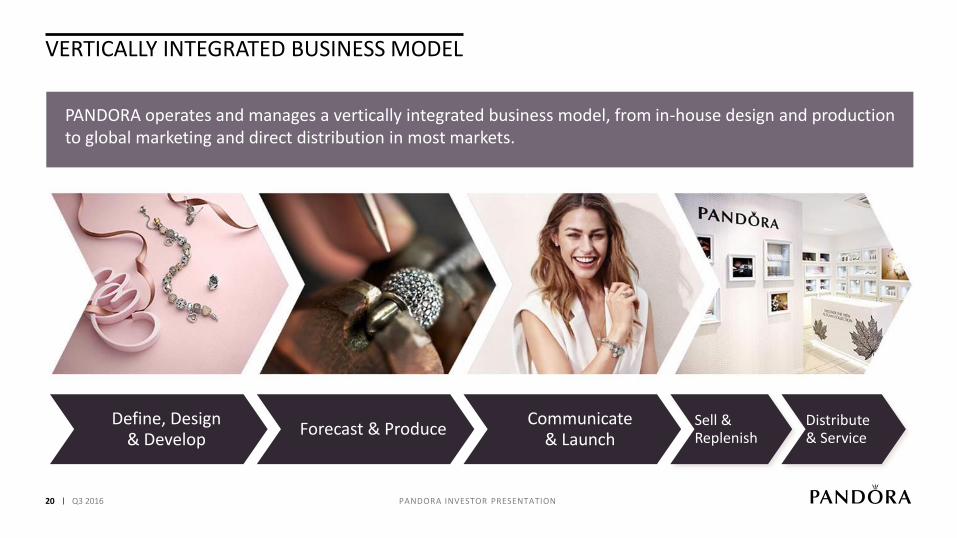
VERTICALLY INTEGRATED BUSINESS MODEL
Q3 2016 PANDORA INVESTOR PRESENTATION20
PANDORA operates and manages a vertically integrated business model, from in-house design and production to global marketing and direct distribution in most markets.
Define, Design & Develop
Forecast & ProduceCommunicate
& LaunchDistribute & Service
Sell & Replenish
Q3 2016 PANDORA INVESTOR PRESENTATION21
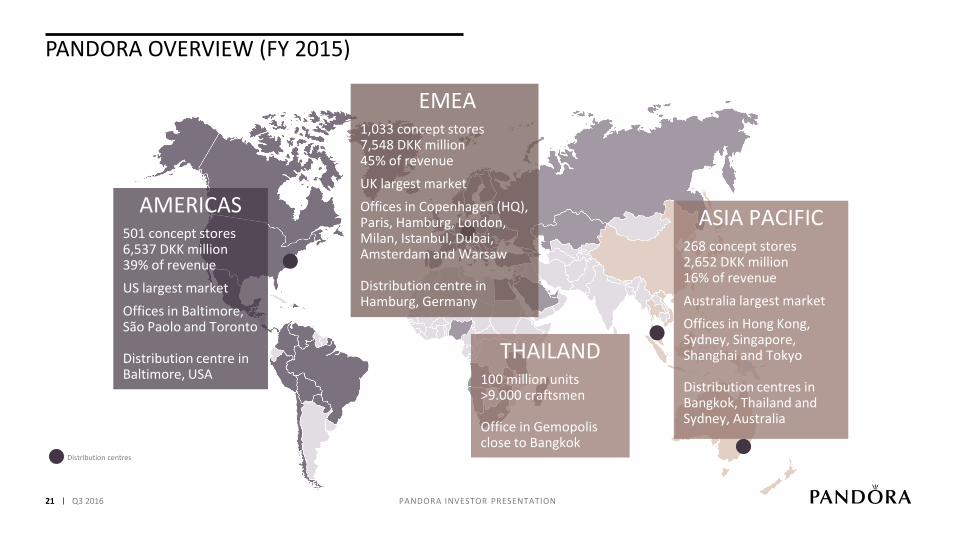
PANDORA OVERVIEW (FY 2015)
AMERICAS501 concept stores6,537 DKK million39% of revenue
US largest market
Offices in Baltimore, São Paolo and Toronto
Distribution centre in Baltimore, USA
THAILAND100 million units>9.000 craftsmen
Office in Gemopolis close to Bangkok
Distribution centres
EMEA1,033 concept stores7,548 DKK million45% of revenue
UK largest market
Offices in Copenhagen (HQ), Paris, Hamburg, London, Milan, Istanbul, Dubai, Amsterdam and Warsaw
Distribution centre in Hamburg, Germany
ASIA PACIFIC268 concept stores2,652 DKK million16% of revenue
Australia largest market
Offices in Hong Kong, Sydney, Singapore, Shanghai and Tokyo
Distribution centres in Bangkok, Thailand and Sydney, Australia

Q3 2016 PANDORA INVESTOR PRESENTATION22
DIVIDEND AND SHARE BUYBACK PROGRAMME
DIVIDEND AND SHARE BUYBACK (DKKbn) DISTRIBUTION OF CASH
• Capital structure ratio of 0–1x NIBD to EBITDA
• End Q3 2016: 0.6x
• Excess cash paid out
• Annually increase the nominal dividend per share
• Dividend of DKK 13 per share for 2015
(2014: DKK 9)
• Share buyback programme of up to DKK 4.0
billion during 2016 (2015: DKK 3.9 billion)
• The programme is being implemented
under the Safe Harbour regulations
0,7 0,8 1,11,5
0,7
2,5
3,9
4,0
2013 2014 2015
1.4
3.3
5.0
2016e
5.5
Share Buyback
Dividend
Nominal dividend
DKK 5.5
DKK 6.5
DKK 9.0
DKK 13

Q3 2016 PANDORA INVESTOR PRESENTATION23
BUILD A GLOBAL BRAND
NOW THE 2nd HIGHEST GLOBALLY
50%43%
2015
36%
20142010
67%73%
2011 2012 2013
63%
AIDED BRAND AWARENESS
Based on brand tracking analysis carried out by Ipsos among women aged 18+ (previously carried out by IUM 2010-2013). Between 1,000 and 2,000 web interviews per country.Markets included: 2010 (16 markets), 2011 (26 markets), 2012 (28 markets), 2013-2015 (25 markets) = Australia, Austria, Belgium, Brazil, Canada, Denmark, France, Germany, Greece, Hong Kong, Ireland, Israel, Italy, New Zealand, Poland, Portugal, Russia, South Africa, South Korea, Spain, Switzerland, the Netherlands, Turkey, United Kingdom and the USA. Sample in 2014 has been weighted with a 50% SSI sample in the US – Aided Awareness was 65% unweighted in 2014.
73% 71%65%
78%
Q3 2016 PANDORA INVESTOR PRESENTATION24
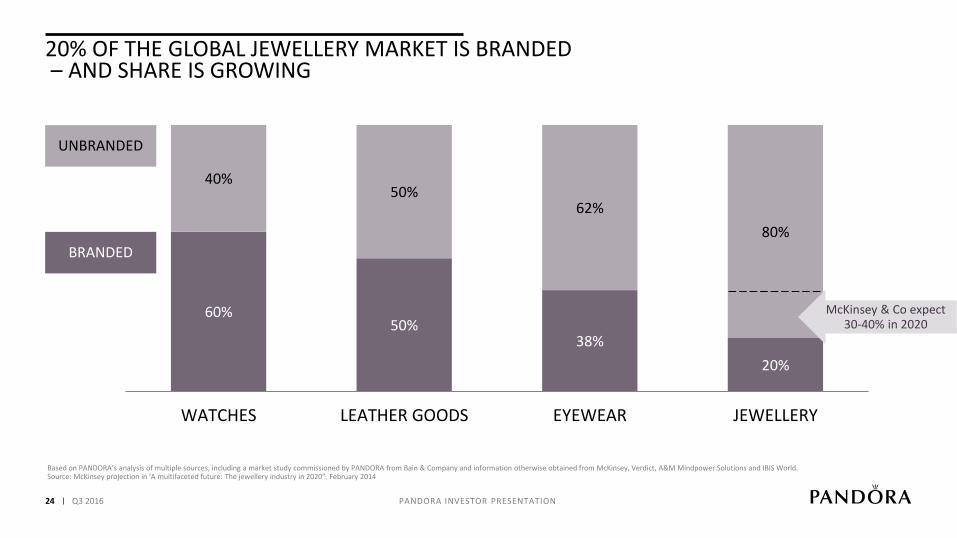
20% OF THE GLOBAL JEWELLERY MARKET IS BRANDED– AND SHARE IS GROWING
60%50%
38%
20%
40%50%
62%
80%
WATCHES LEATHER GOODS EYEWEAR JEWELLERY
BRANDED
UNBRANDED
Based on PANDORA’s analysis of multiple sources, including a market study commissioned by PANDORA from Bain & Company and information otherwise obtained from McKinsey, Verdict, A&M Mindpower Solutions and IBIS World.Source: McKinsey projection in ‘A multifaceted future: The jewellery industry in 2020”. February 2014
McKinsey & Co expect 30-40% in 2020

Q3 2016 PANDORA INVESTOR PRESENTATION25
LIKE-FOR-LIKE SALES DEVELOPMENT BY REGION
LIKE-FOR-LIKE SALES DEVELOPMENT (Y/Y GROWTH)
4%5%
0%
-2%
0%
2%
4%
6%
8%
10%
12%
Q3
201
4
Q4
201
4
Q1
201
5
Q2
201
5
Q3
201
5
Q4
201
5
Q1
201
6
Q2
201
6
Q3
201
6Americas
15% 15%
5%
0%
5%
10%
15%
20%
Q3
201
4
Q4
201
4
Q1
201
5
Q2
201
5
Q3
201
5
Q4
201
5
Q1
201
6
Q2
201
6
Q3
201
6
EMEA29%
24%
7%
0%
5%
10%
15%
20%
25%
30%
35%
Q3
201
4
Q4
201
4
Q1
201
5
Q2
201
5
Q3
201
5
Q4
201
5
Q1
201
6
Q2
201
6
Q3
201
6
Asia Pacific14% 13%
4%
0%
5%
10%
15%
Q3
20
14
Q4
20
14
Q1
20
15
Q2
20
15
Q3
20
15
Q4
20
15
Q1
20
16
Q2
20
16
Q3
20
16
Group
Q3 201626
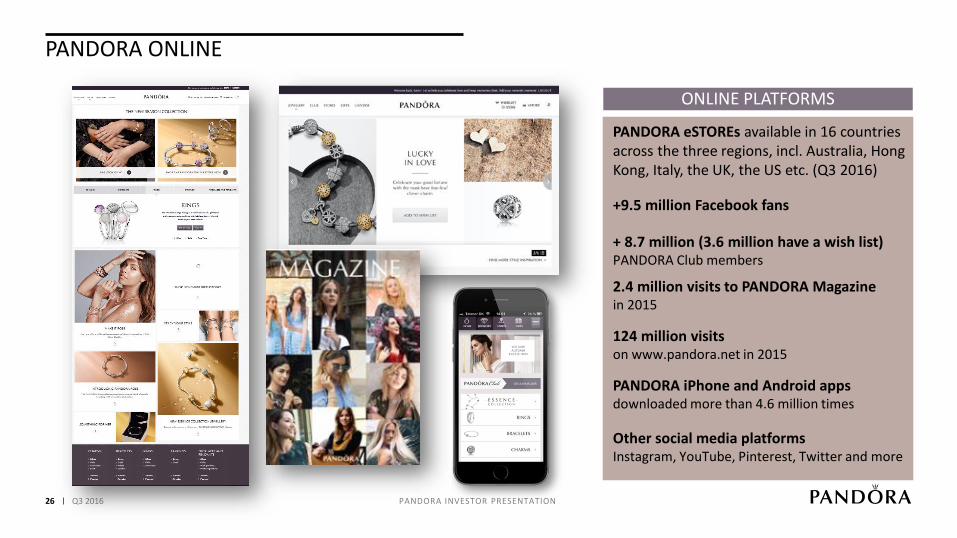
PANDORA ONLINE
ONLINE PLATFORMS
PANDORA eSTOREs available in 16 countries across the three regions, incl. Australia, Hong Kong, Italy, the UK, the US etc. (Q3 2016)
+9.5 million Facebook fans
+ 8.7 million (3.6 million have a wish list)PANDORA Club members
2.4 million visits to PANDORA Magazinein 2015
124 million visitson www.pandora.net in 2015
PANDORA iPhone and Android appsdownloaded more than 4.6 million times
Other social media platformsInstagram, YouTube, Pinterest, Twitter and more
PANDORA INVESTOR PRESENTATION
Q3 2016 PANDORA INVESTOR PRESENTATION27
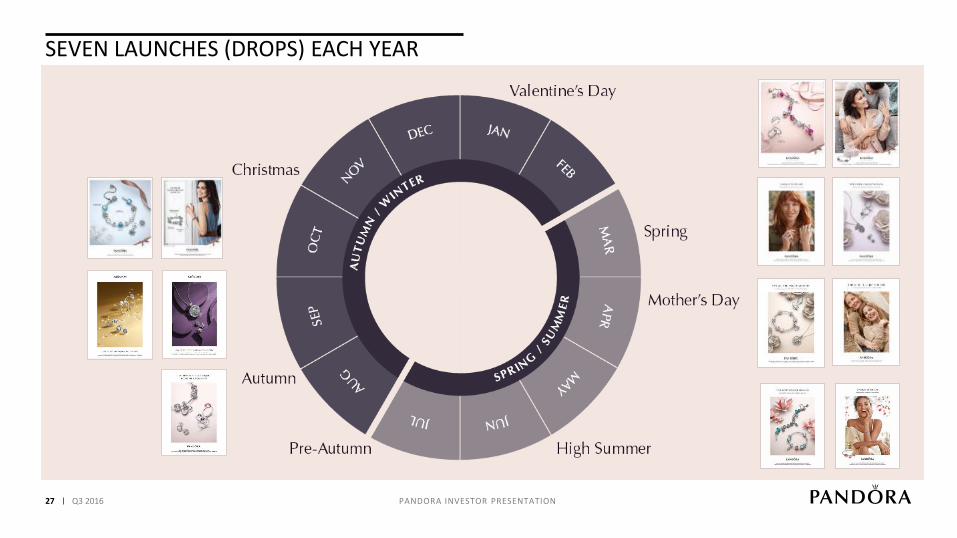
SEVEN LAUNCHES (DROPS) EACH YEAR
Q3 2016 PANDORA INVESTOR PRESENTATION28
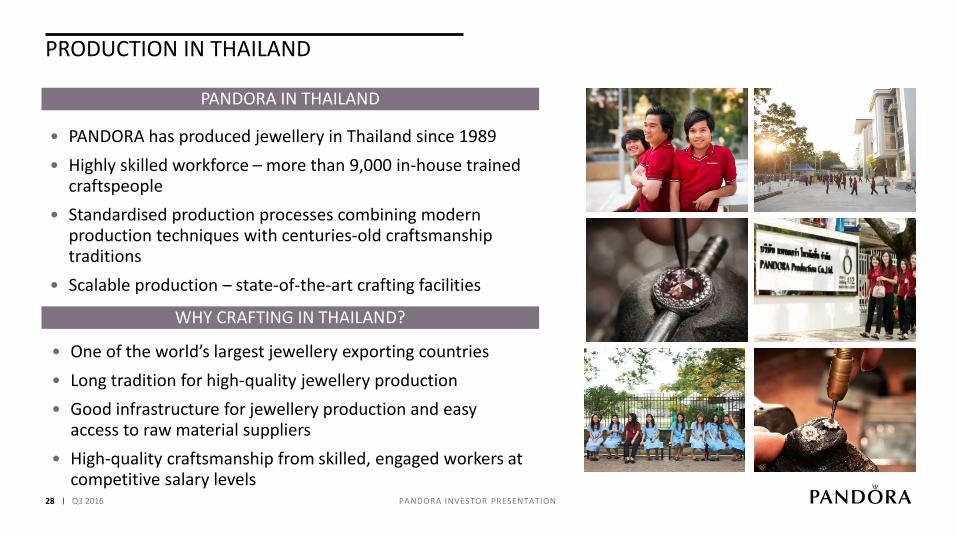
PRODUCTION IN THAILAND
• PANDORA has produced jewellery in Thailand since 1989
• Highly skilled workforce – more than 9,000 in-house trained craftspeople
• Standardised production processes combining modern production techniques with centuries-old craftsmanship traditions
• Scalable production – state-of-the-art crafting facilities
PANDORA IN THAILAND
WHY CRAFTING IN THAILAND?
• One of the world’s largest jewellery exporting countries
• Long tradition for high-quality jewellery production
• Good infrastructure for jewellery production and easy access to raw material suppliers
• High-quality craftsmanship from skilled, engaged workers at competitive salary levels
Q3 2016 PANDORA INVESTOR PRESENTATION29
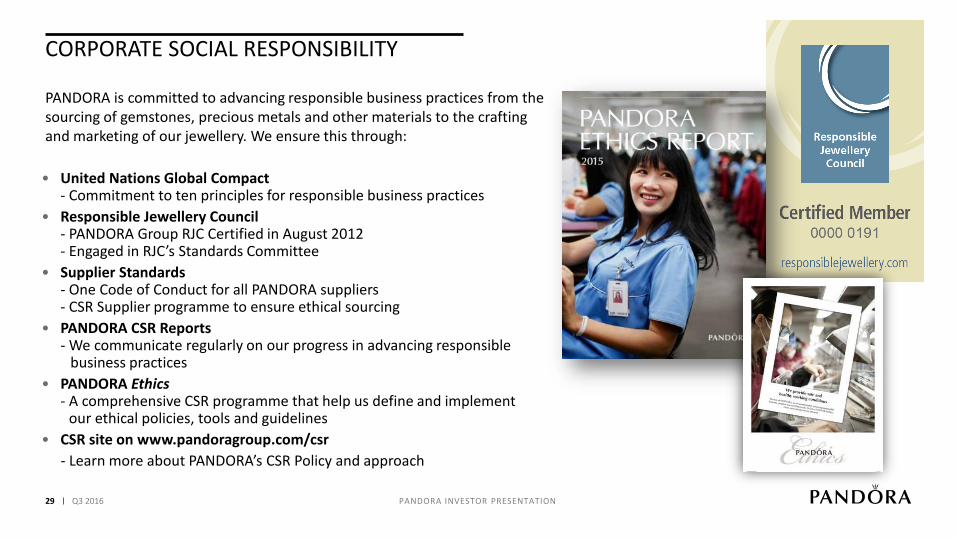
CORPORATE SOCIAL RESPONSIBILITY
• United Nations Global Compact- Commitment to ten principles for responsible business practices
• Responsible Jewellery Council- PANDORA Group RJC Certified in August 2012- Engaged in RJC’s Standards Committee
• Supplier Standards- One Code of Conduct for all PANDORA suppliers- CSR Supplier programme to ensure ethical sourcing
• PANDORA CSR Reports- We communicate regularly on our progress in advancing responsible ---business practices
• PANDORA Ethics- A comprehensive CSR programme that help us define and implement - our ethical policies, tools and guidelines
• CSR site on www.pandoragroup.com/csr
- Learn more about PANDORA’s CSR Policy and approach
PANDORA is committed to advancing responsible business practices from the sourcing of gemstones, precious metals and other materials to the crafting and marketing of our jewellery. We ensure this through:

Q3 2016 PANDORA INVESTOR PRESENTATION30
BUSINESS STRATEGY WITH COMPELLING GROWTH DRIVERS
Q3 2016 PANDORA INVESTOR PRESENTATION31
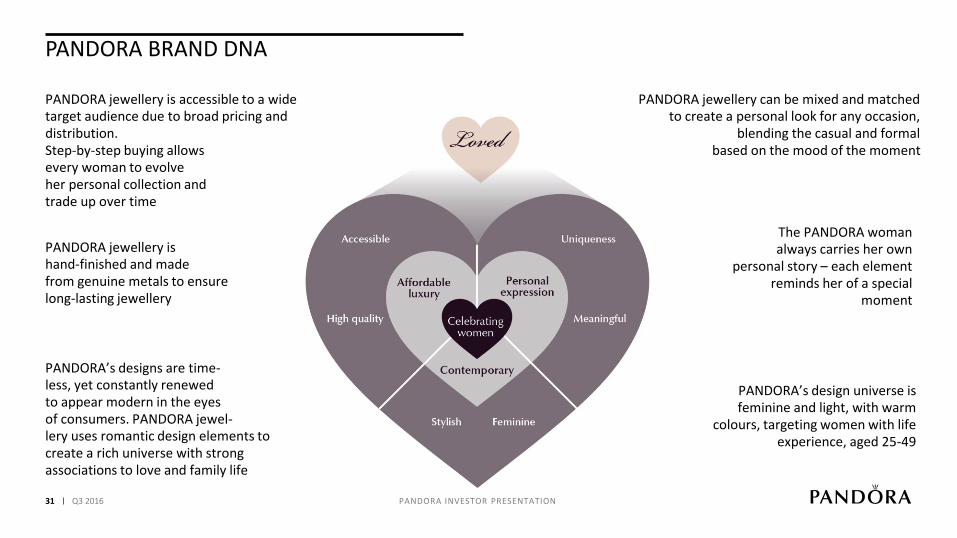
PANDORA BRAND DNA
PANDORA jewellery is accessible to a wide target audience due to broad pricing and distribution. Step-by-step buying allows every woman to evolve her personal collection and trade up over time
PANDORA jewellery is hand-finished and made from genuine metals to ensure long-lasting jewellery
PANDORA’s designs are time-less, yet constantly renewed to appear modern in the eyes of consumers. PANDORA jewel-lery uses romantic design elements to create a rich universe with strong associations to love and family life
PANDORA jewellery can be mixed and matched to create a personal look for any occasion,
blending the casual and formal based on the mood of the moment
The PANDORA woman always carries her own
personal story – each element reminds her of a special
moment
PANDORA’s design universe is feminine and light, with warm
colours, targeting women with life experience, aged 25-49

Q3 2016 PANDORA INVESTOR PRESENTATION32
HEDGING POLICY AND RAW MATERIALS SHARE OF PANDORA'S PRODUCTION COSTS
COMMODITY HEDGING POLICY RAW MATERIAL SHARE OF COST OF GOODS SOLD
100%
90%
80%
70%
60%
50%
40%
30%
20%
10%
Q1 Q2 Q3 Q4 Q1 Q2 Q3 Q4 Q1 Q2 Q3 Q4
Year 1 Year 2 Year 3
HedgedInventory
lead timeExposureRealised
58%46%
36% 30%
20%
15%
14%11%
9%
14%
14%
14%
13%25%
36%45%
2012 2013 2014 2015
Silver Gold Other raw materials Other
• PANDORA hedging policy is to hedge approximately 100%, 80%, 60% and 40%, respectively, of expected gold and silver consumption in the following four quarters.
* Other includes employee costs, electricity, depreciations, etc.
*
• ‘Other’ as share of total cost of goods sold increases as products become increasingly labour intensive and as the price of raw materials decrease from 2012 and onwards

Q3 2016 PANDORA INVESTOR PRESENTATION33
GLOBAL JEWELLERY MARKET
Mexico 1,615
Spain 1,624
Thailand 1,954
Singapore 2,021
Turkey 2,058
Australia 2,741
United Arab Emirates 2,783
Brazil 2,896
South Korea 3,454
France 3,512
Italy 3,659
Germany 3,931
Russia 4,048
Taiwan 4,147
United Kingdom 5,368
Canada 5,409
Hong Kong 5,975
Japan 7,976
India 46,740
USA 56,635
China 94,318
LARGEST JEWELLERY MARKETS (2016e: EURm)
5%
30%
18%
30%
17%
OTHER
NECKWEAR
EARRINGS
RINGS
WRISTWEAR
GLOBAL CATEGORY SHARE
Note: All figures are based on current prices and year-on-year exchange ratesSource: EUROMONITOR RESEARCH
JEWELLERY MARKET EXPECTED TO INCREASE WITH A CAGR OF 9% (EURbn)
+9%
446+9%
+6%
2021E
83%
2018E2017E
17%
2020E2019E2016
289
87%
13%
20152014201320122011
186
86%
14%
20102009200820072006
141
86%
14%
Real Jewellery
Costume Jewellery
CAGR

Q3 2016 PANDORA INVESTOR PRESENTATION34
STORE TYPES – GUIDING PRINCIPLES
CONCEPT STORES
• Size: 40-80m2
• Full product assortment
• Dedicated PANDORA staff
• PANDORA facade, fixtures and furniture
SHOP-IN-SHOPS MULTI-BRANDED STORES
• Size: above 8m2 in defined area
• Full product assortment
• Dedicated PANDORA staff
• PANDORA fixtures and furniture
• Size: up to 8m2
• Part of assortment
• No dedicated staff
• PANDORA display and optionally some fixtures and furniture
LIKE-FOR-LIKE GROWTH DEFINITION ORGANIC GROWTH DEFINITION
• Based on retail revenue in local currency
• Concept stores open for >12 months
• Includes retail value from O&O, franchisees and distributors, but excludes revenue from eSTOREs
• Based on Pandora reported revenue
• All stores across sales channels (incl. eSTOREs) open >12 months
• Includes reported revenue (mix of sell-in and sell-out)
Q3 2016 PANDORA INVESTOR PRESENTATION35
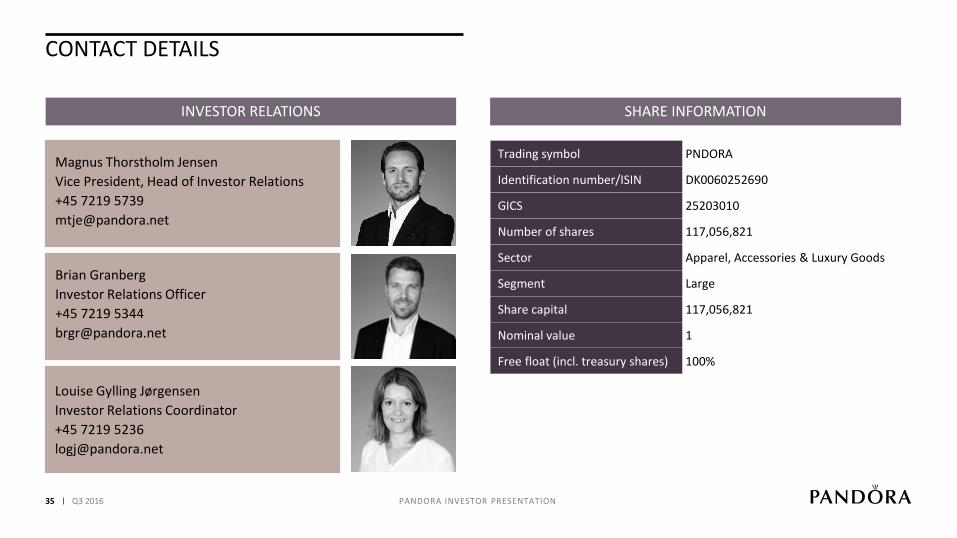
CONTACT DETAILS
SHARE INFORMATIONINVESTOR RELATIONS
Magnus Thorstholm Jensen
Vice President, Head of Investor Relations
+45 7219 5739
Brian Granberg
Investor Relations Officer
+45 7219 5344
Trading symbol PNDORA
Identification number/ISIN DK0060252690
GICS 25203010
Number of shares 117,056,821
Sector Apparel, Accessories & Luxury Goods
Segment Large
Share capital 117,056,821
Nominal value 1
Free float (incl. treasury shares) 100%
Louise Gylling Jørgensen
Investor Relations Coordinator
+45 7219 5236