Embed Size (px)
Citation preview
U.S. Wheat Supply and Utilization09/10 10/11 11/12 12/13 13/14 14/15 15/16 16/17 17/18 18/19 19/20
Area (Million Acres) Planted Area 59.1 53.6 54.9 55.0 54.9 54.5 54.0 53.9 53.6 53.3 53.1 Harvested Area 49.9 45.6 46.7 46.7 46.6 46.3 45.9 45.7 45.5 45.3 45.1
(Bushels per Acre)Yield 44.4 43.2 44.0 44.3 44.7 45.0 45.3 45.7 46.1 46.4 46.7
(Million Bushels)Supply 2,982 3,034 2,989 2,927 2,920 2,911 2,909 2,915 2,920 2,927 2,929 Beginning Stocks 657 963 829 748 729 721 721 715 712 713 711 Production 2,216 1,968 2,053 2,071 2,082 2,081 2,078 2,089 2,097 2,102 2,105 Imports 109 104 106 108 109 109 110 111 111 112 112
Domestic Use 1,194 1,268 1,267 1,272 1,274 1,287 1,293 1,298 1,310 1,316 1,330 Feed, Residual 177 227 217 212 205 209 205 201 203 199 201 Seed 72 74 74 74 74 73 73 73 73 73 73 Food, Other 945 968 976 986 995 1,005 1,014 1,024 1,034 1,044 1,056
Exports 825 937 974 926 925 903 902 904 897 900 883
Total Use 2,019 2,205 2,241 2,198 2,198 2,190 2,195 2,203 2,207 2,216 2,213
Ending Stocks 963 829 748 729 721 721 715 712 713 711 716 CCC Inventory 0 0 0 0 0 0 0 0 0 0 0 Under Loan 39 49 47 46 44 44 42 41 41 40 41 Other Stocks 924 780 701 683 678 677 673 671 672 671 675
Prices, Program Provisions (U.S. Dollars per Bushel) Farm Price 4.92 4.58 4.74 4.81 4.90 4.90 4.99 5.04 5.05 5.11 5.06 Loan Rate 2.75 2.94 2.94 2.94 2.94 2.94 2.94 2.94 2.94 2.94 2.94 Target Price 3.92 4.17 4.17 4.17 4.17 4.17 4.17 4.17 4.17 4.17 4.17 Direct Payment Rate 0.52 0.52 0.52 0.52 0.52 0.52 0.52 0.52 0.52 0.52 0.52
(Million Acres) Base Area 72.8 72.9 72.9 72.9 72.9 72.9 72.9 72.9 72.9 72.9 72.9
(Bushels per Acre) Direct Payment Yield 34.4 34.4 34.4 34.4 34.4 34.4 34.4 34.4 34.4 34.4 34.4 CCP Yield 36.0 36.0 36.0 36.0 36.0 36.0 36.0 36.0 36.0 36.0 36.0
(Percent) ACRE Participation Rate 12.7 19.1 20.3 21.6 21.6 21.6 21.6 21.6 21.6 21.6 21.6
Returns and Payments (U.S. Dollars per Acre) Gross Market Revenue 218.46 197.70 208.36 213.17 218.97 220.29 225.88 230.14 232.83 237.19 236.44 Variable Expenses 108.07 108.60 114.30 118.01 121.04 124.38 129.02 132.23 134.52 136.85 138.92 Market Net Returns 110.39 89.10 94.06 95.15 97.92 95.91 96.86 97.91 98.31 100.34 97.53 Marketing Loan Benefits 0.00 0.00 0.00 0.00 0.00 0.00 0.00 0.00 0.00 0.00 0.00 ACRE Payments 3.18 4.10 1.68 0.00 0.00 0.00 0.00 0.00 0.00 0.00 0.15 CCP Payment/Base 0.00 0.00 0.00 0.00 0.00 0.00 0.00 0.00 0.00 0.00 0.00 Direct Payment/Base 14.52 14.33 14.30 14.55 14.55 14.55 14.55 14.55 14.55 14.55 14.55
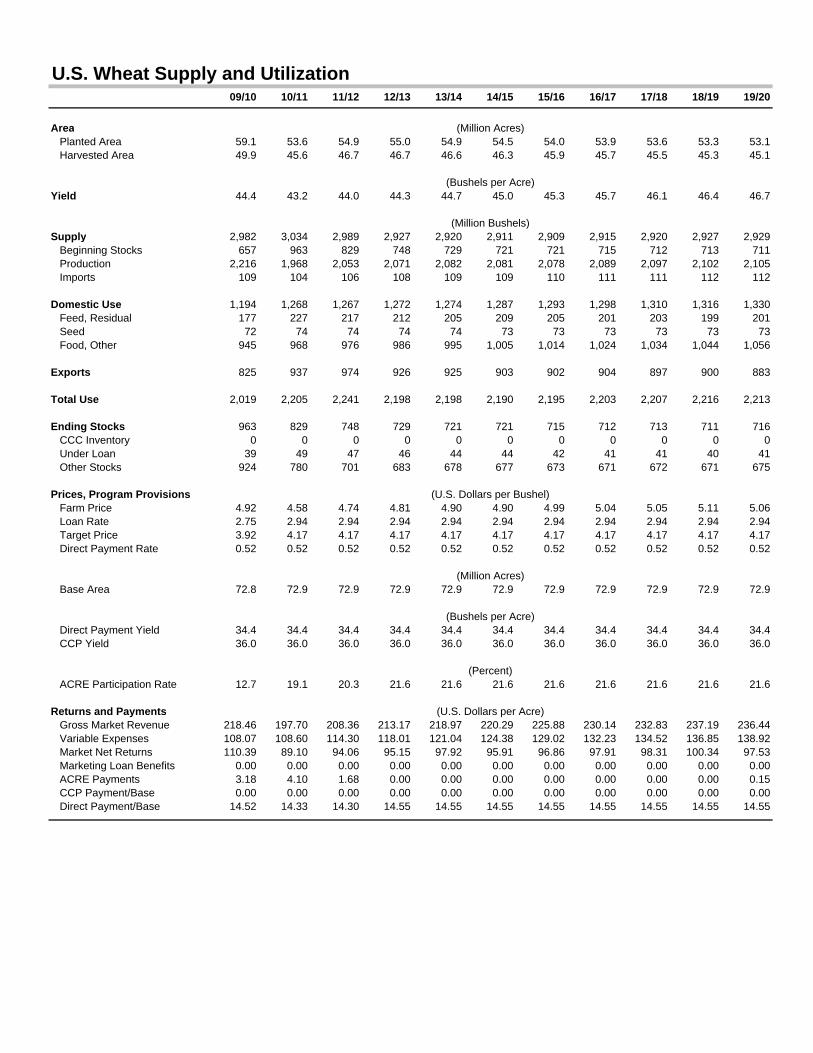
U.S. Rice Supply and Utilization09/10 10/11 11/12 12/13 13/14 14/15 15/16 16/17 17/18 18/19 19/20
Area (Million Acres) Planted Area 3.14 2.96 2.80 2.79 2.80 2.80 2.79 2.78 2.78 2.79 2.82 Harvested Area 3.10 2.94 2.78 2.77 2.78 2.78 2.77 2.76 2.76 2.77 2.79
(Pounds per Acre)Yield 7,085 7,178 7,242 7,309 7,377 7,444 7,511 7,577 7,632 7,687 7,742
(Million Hundredweight)Supply 271.3 274.0 265.8 263.4 264.3 266.2 268.4 270.6 273.2 276.6 281.2 Beginning Stocks 30.4 42.2 42.7 39.2 37.3 37.2 37.6 38.2 39.0 39.7 40.3 Production 219.9 210.9 201.7 202.4 204.9 206.6 207.9 209.1 210.5 212.8 216.4 Imports 21.0 20.9 21.4 21.8 22.1 22.5 22.9 23.3 23.7 24.1 24.4
Domestic Use 130.2 133.3 134.9 136.5 138.2 139.9 141.6 143.4 145.1 146.8 148.4
Exports 98.9 97.9 91.6 89.7 89.0 88.7 88.5 88.1 88.4 89.4 91.7
Total Use 229.1 231.2 226.5 226.2 227.1 228.6 230.1 231.5 233.5 236.2 240.2
Ending Stocks 42.2 42.7 39.2 37.3 37.2 37.6 38.2 39.0 39.7 40.3 41.0 CCC Inventory 0.0 0.0 0.0 0.0 0.0 0.0 0.0 0.0 0.0 0.0 0.0 Other Stocks 42.2 42.7 39.2 37.3 37.2 37.6 38.2 39.0 39.7 40.3 41.0
Prices, Program Provisions (U.S. Dollars per Hundredweight) Farm Price 13.79 9.91 9.81 9.90 9.89 9.88 9.87 9.77 9.83 9.88 10.03 Adjusted World Price 11.41 8.02 7.80 7.87 7.86 7.85 7.83 7.70 7.81 7.90 8.18 Loan Rate 6.50 6.50 6.50 6.50 6.50 6.50 6.50 6.50 6.50 6.50 6.50 Target Price 10.50 10.50 10.50 10.50 10.50 10.50 10.50 10.50 10.50 10.50 10.50 Direct Payment Rate 2.35 2.35 2.35 2.35 2.35 2.35 2.35 2.35 2.35 2.35 2.35
(Million Acres) Base Area 4.35 4.35 4.35 4.35 4.35 4.35 4.35 4.35 4.35 4.35 4.35
(Pounds per Acre) Direct Payment Yield 4,818 4,818 4,818 4,818 4,818 4,818 4,818 4,818 4,818 4,818 4,818 CCP Yield 5,131 5,131 5,131 5,131 5,131 5,131 5,131 5,131 5,131 5,131 5,131
(Percent) ACRE Participation Rate 0.0 0.0 0.0 0.0 0.0 0.0 0.0 0.0 0.0 0.0 0.0
Returns and Payments (U.S. Dollars per Acre) Gross Market Revenue 977.37 711.46 710.58 723.57 729.27 735.29 741.58 740.44 749.87 759.10 776.23 Variable Expenses 430.23 444.12 468.79 485.12 498.16 511.52 528.83 542.08 551.84 561.63 569.27 Market Net Returns 547.14 267.35 241.79 238.45 231.10 223.77 212.75 198.36 198.03 197.47 206.96 Marketing Loan Benefits 0.00 0.00 0.00 0.00 0.00 0.00 0.00 0.00 0.00 0.00 0.00 ACRE Payments 0.00 0.00 0.00 0.00 0.00 0.00 0.00 0.00 0.00 0.00 0.00 CCP Payment/Base 0.00 0.00 0.00 0.00 0.00 0.00 0.00 0.00 0.00 0.00 0.00 Direct Payment/Base 94.32 94.32 94.32 96.25 96.25 96.25 96.25 96.25 96.25 96.25 96.25
Note: Figures in this table are in rough (paddy) basis.
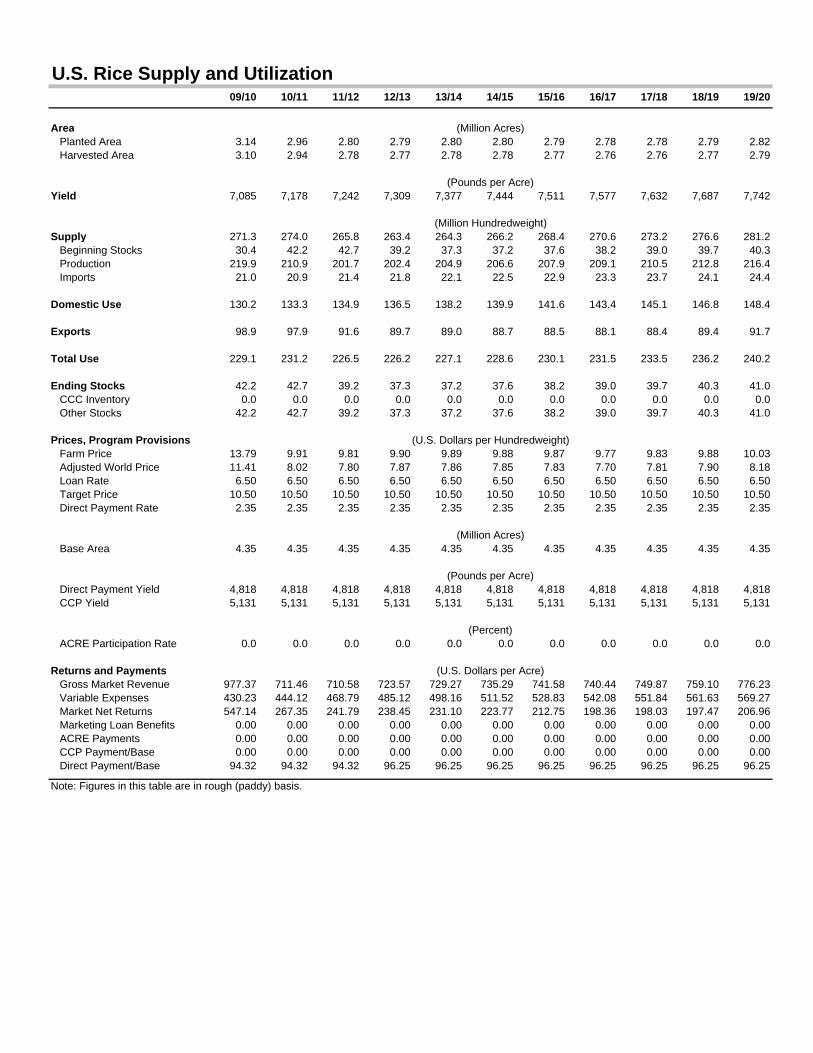
U.S. Long-Grain Rice Supply and Utilization09/10 10/11 11/12 12/13 13/14 14/15 15/16 16/17 17/18 18/19 19/20
Area (Million Acres) Planted Area 2.29 2.25 2.14 2.13 2.14 2.13 2.12 2.10 2.10 2.11 2.13 Arkansas 1.26 1.29 1.24 1.24 1.24 1.24 1.23 1.23 1.22 1.23 1.24 California 0.01 0.01 0.01 0.01 0.01 0.01 0.01 0.01 0.01 0.01 0.01 Louisiana 0.42 0.40 0.39 0.39 0.39 0.39 0.38 0.38 0.38 0.39 0.39 Mississippi 0.25 0.22 0.21 0.20 0.21 0.21 0.21 0.21 0.21 0.21 0.21 Missouri 0.20 0.19 0.17 0.17 0.17 0.16 0.16 0.16 0.16 0.16 0.16 Texas 0.17 0.15 0.13 0.13 0.13 0.13 0.13 0.12 0.12 0.12 0.13
Harvested Area 2.27 2.24 2.13 2.12 2.12 2.11 2.10 2.09 2.08 2.09 2.11
(Pounds per Acre)Yield 6,743 6,900 6,961 7,027 7,093 7,159 7,224 7,290 7,346 7,401 7,457
(Million Hundredweight)Supply 190.80 194.41 189.66 189.60 191.26 192.61 193.80 194.90 196.53 198.90 202.20 Beginning Stocks 20.05 22.05 23.37 22.27 22.16 22.52 22.87 23.24 23.67 23.90 24.26 Production 152.73 154.36 147.99 148.78 150.33 151.09 151.67 152.16 153.10 154.97 157.68 Imports 18.03 18.00 18.30 18.55 18.77 19.01 19.25 19.51 19.76 20.02 20.26
Domestic Use 99.38 100.44 101.34 102.62 103.98 105.12 106.36 107.59 108.49 109.71 110.68
Exports 69.37 70.60 66.06 64.82 64.77 64.62 64.19 63.64 64.14 64.92 66.96
Residual 0.00 0.00 0.00 0.00 0.00 0.00 0.00 0.00 0.00 0.00 0.00
Ending Stocks 22.05 23.37 22.27 22.16 22.52 22.87 23.24 23.67 23.90 24.26 24.56
Prices (U.S. Dollars per Hundredweight) Farm Price 12.76 9.18 9.15 9.18 9.11 9.11 9.09 9.00 9.15 9.22 9.46 Milled Rice, Gulf 24.90 18.74 18.94 19.16 19.16 19.29 19.38 19.32 19.66 19.78 20.18 Milled Rice, Thai 100% B 24.42 18.37 18.19 18.30 18.28 18.37 18.40 18.25 18.63 18.83 19.45
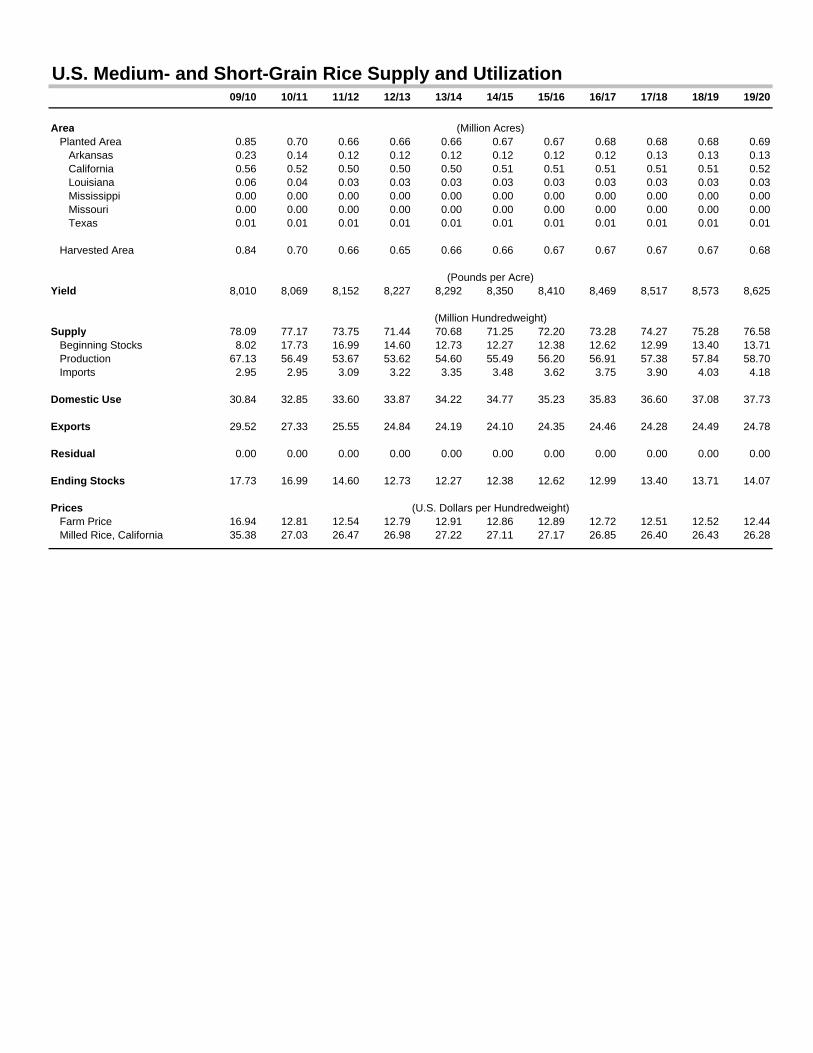
U.S. Medium- and Short-Grain Rice Supply and Utilization09/10 10/11 11/12 12/13 13/14 14/15 15/16 16/17 17/18 18/19 19/20
Area (Million Acres) Planted Area 0.85 0.70 0.66 0.66 0.66 0.67 0.67 0.68 0.68 0.68 0.69 Arkansas 0.23 0.14 0.12 0.12 0.12 0.12 0.12 0.12 0.13 0.13 0.13 California 0.56 0.52 0.50 0.50 0.50 0.51 0.51 0.51 0.51 0.51 0.52 Louisiana 0.06 0.04 0.03 0.03 0.03 0.03 0.03 0.03 0.03 0.03 0.03 Mississippi 0.00 0.00 0.00 0.00 0.00 0.00 0.00 0.00 0.00 0.00 0.00 Missouri 0.00 0.00 0.00 0.00 0.00 0.00 0.00 0.00 0.00 0.00 0.00 Texas 0.01 0.01 0.01 0.01 0.01 0.01 0.01 0.01 0.01 0.01 0.01
Harvested Area 0.84 0.70 0.66 0.65 0.66 0.66 0.67 0.67 0.67 0.67 0.68
(Pounds per Acre)Yield 8,010 8,069 8,152 8,227 8,292 8,350 8,410 8,469 8,517 8,573 8,625
(Million Hundredweight)Supply 78.09 77.17 73.75 71.44 70.68 71.25 72.20 73.28 74.27 75.28 76.58 Beginning Stocks 8.02 17.73 16.99 14.60 12.73 12.27 12.38 12.62 12.99 13.40 13.71 Production 67.13 56.49 53.67 53.62 54.60 55.49 56.20 56.91 57.38 57.84 58.70 Imports 2.95 2.95 3.09 3.22 3.35 3.48 3.62 3.75 3.90 4.03 4.18
Domestic Use 30.84 32.85 33.60 33.87 34.22 34.77 35.23 35.83 36.60 37.08 37.73
Exports 29.52 27.33 25.55 24.84 24.19 24.10 24.35 24.46 24.28 24.49 24.78
Residual 0.00 0.00 0.00 0.00 0.00 0.00 0.00 0.00 0.00 0.00 0.00
Ending Stocks 17.73 16.99 14.60 12.73 12.27 12.38 12.62 12.99 13.40 13.71 14.07
Prices (U.S. Dollars per Hundredweight) Farm Price 16.94 12.81 12.54 12.79 12.91 12.86 12.89 12.72 12.51 12.52 12.44 Milled Rice, California 35.38 27.03 26.47 26.98 27.22 27.11 27.17 26.85 26.40 26.43 26.28
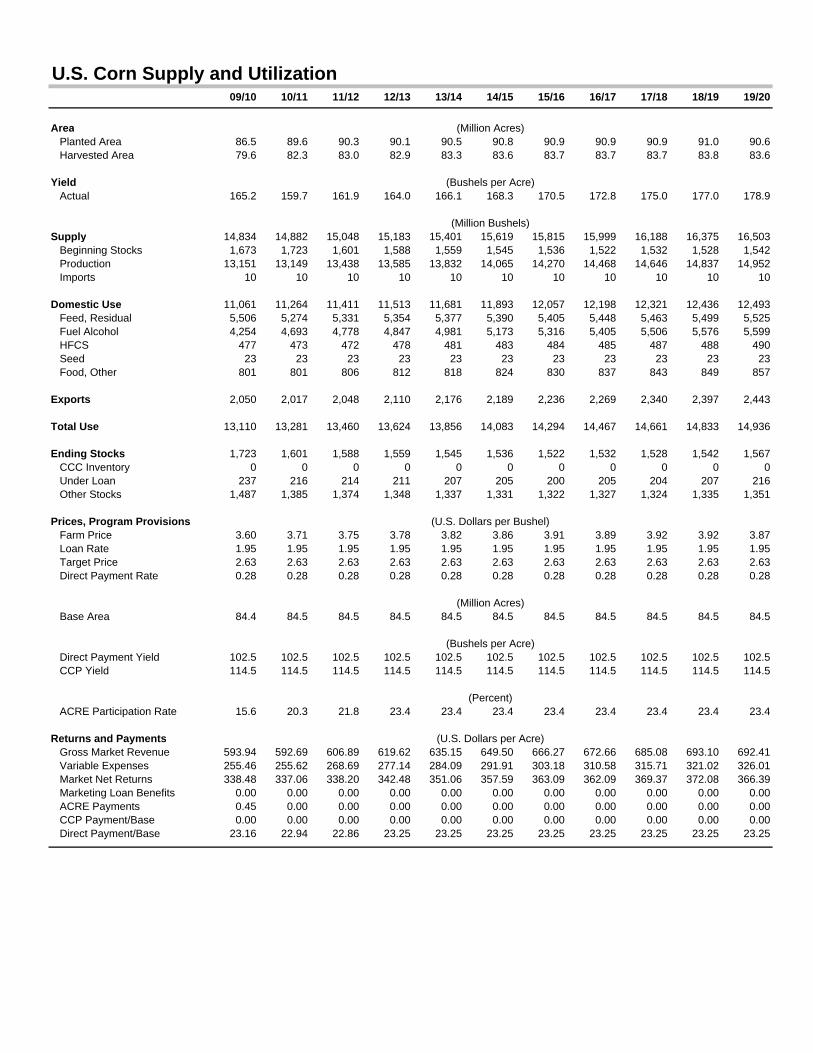
U.S. Corn Supply and Utilization09/10 10/11 11/12 12/13 13/14 14/15 15/16 16/17 17/18 18/19 19/20
Area (Million Acres) Planted Area 86.5 89.6 90.3 90.1 90.5 90.8 90.9 90.9 90.9 91.0 90.6 Harvested Area 79.6 82.3 83.0 82.9 83.3 83.6 83.7 83.7 83.7 83.8 83.6
Yield (Bushels per Acre) Actual 165.2 159.7 161.9 164.0 166.1 168.3 170.5 172.8 175.0 177.0 178.9
(Million Bushels)Supply 14,834 14,882 15,048 15,183 15,401 15,619 15,815 15,999 16,188 16,375 16,503 Beginning Stocks 1,673 1,723 1,601 1,588 1,559 1,545 1,536 1,522 1,532 1,528 1,542 Production 13,151 13,149 13,438 13,585 13,832 14,065 14,270 14,468 14,646 14,837 14,952 Imports 10 10 10 10 10 10 10 10 10 10 10
Domestic Use 11,061 11,264 11,411 11,513 11,681 11,893 12,057 12,198 12,321 12,436 12,493 Feed, Residual 5,506 5,274 5,331 5,354 5,377 5,390 5,405 5,448 5,463 5,499 5,525 Fuel Alcohol 4,254 4,693 4,778 4,847 4,981 5,173 5,316 5,405 5,506 5,576 5,599 HFCS 477 473 472 478 481 483 484 485 487 488 490 Seed 23 23 23 23 23 23 23 23 23 23 23 Food, Other 801 801 806 812 818 824 830 837 843 849 857
Exports 2,050 2,017 2,048 2,110 2,176 2,189 2,236 2,269 2,340 2,397 2,443
Total Use 13,110 13,281 13,460 13,624 13,856 14,083 14,294 14,467 14,661 14,833 14,936
Ending Stocks 1,723 1,601 1,588 1,559 1,545 1,536 1,522 1,532 1,528 1,542 1,567 CCC Inventory 0 0 0 0 0 0 0 0 0 0 0 Under Loan 237 216 214 211 207 205 200 205 204 207 216 Other Stocks 1,487 1,385 1,374 1,348 1,337 1,331 1,322 1,327 1,324 1,335 1,351
Prices, Program Provisions (U.S. Dollars per Bushel) Farm Price 3.60 3.71 3.75 3.78 3.82 3.86 3.91 3.89 3.92 3.92 3.87 Loan Rate 1.95 1.95 1.95 1.95 1.95 1.95 1.95 1.95 1.95 1.95 1.95 Target Price 2.63 2.63 2.63 2.63 2.63 2.63 2.63 2.63 2.63 2.63 2.63 Direct Payment Rate 0.28 0.28 0.28 0.28 0.28 0.28 0.28 0.28 0.28 0.28 0.28
(Million Acres) Base Area 84.4 84.5 84.5 84.5 84.5 84.5 84.5 84.5 84.5 84.5 84.5
(Bushels per Acre) Direct Payment Yield 102.5 102.5 102.5 102.5 102.5 102.5 102.5 102.5 102.5 102.5 102.5 CCP Yield 114.5 114.5 114.5 114.5 114.5 114.5 114.5 114.5 114.5 114.5 114.5
(Percent) ACRE Participation Rate 15.6 20.3 21.8 23.4 23.4 23.4 23.4 23.4 23.4 23.4 23.4
Returns and Payments (U.S. Dollars per Acre) Gross Market Revenue 593.94 592.69 606.89 619.62 635.15 649.50 666.27 672.66 685.08 693.10 692.41 Variable Expenses 255.46 255.62 268.69 277.14 284.09 291.91 303.18 310.58 315.71 321.02 326.01 Market Net Returns 338.48 337.06 338.20 342.48 351.06 357.59 363.09 362.09 369.37 372.08 366.39 Marketing Loan Benefits 0.00 0.00 0.00 0.00 0.00 0.00 0.00 0.00 0.00 0.00 0.00 ACRE Payments 0.45 0.00 0.00 0.00 0.00 0.00 0.00 0.00 0.00 0.00 0.00 CCP Payment/Base 0.00 0.00 0.00 0.00 0.00 0.00 0.00 0.00 0.00 0.00 0.00 Direct Payment/Base 23.16 22.94 22.86 23.25 23.25 23.25 23.25 23.25 23.25 23.25 23.25
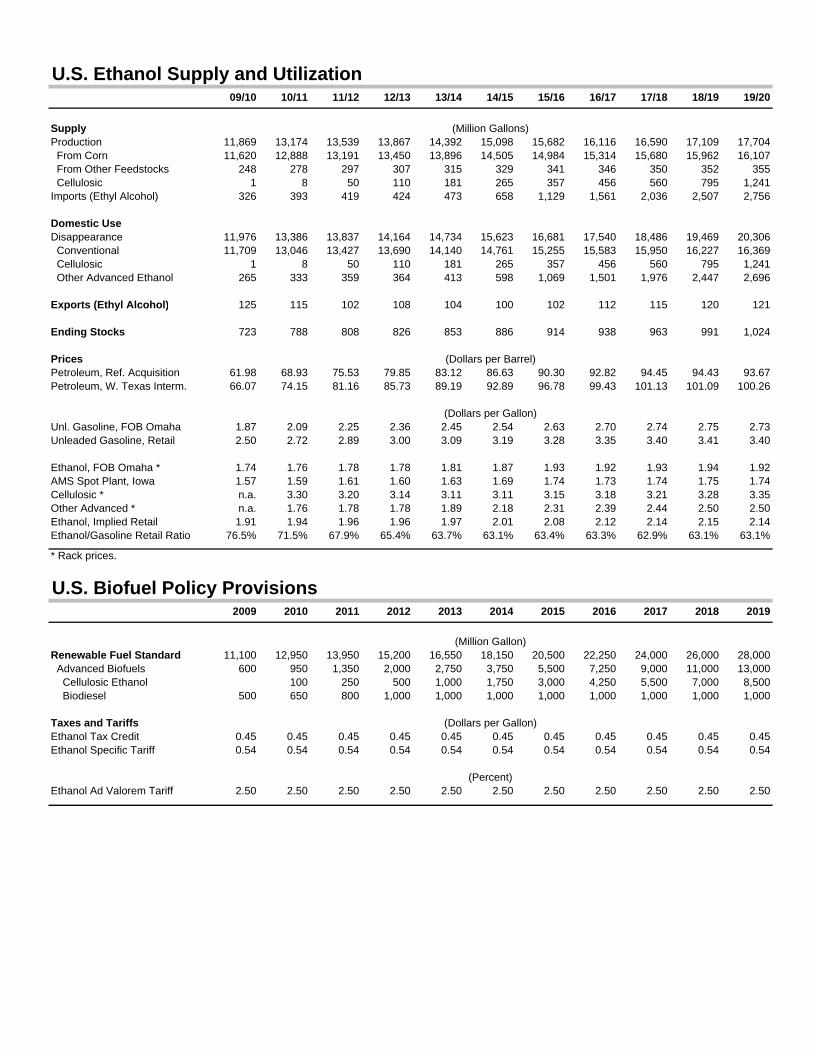
U.S. Ethanol Supply and Utilization09/10 10/11 11/12 12/13 13/14 14/15 15/16 16/17 17/18 18/19 19/20
Supply (Million Gallons)Production 11,869 13,174 13,539 13,867 14,392 15,098 15,682 16,116 16,590 17,109 17,704 From Corn 11,620 12,888 13,191 13,450 13,896 14,505 14,984 15,314 15,680 15,962 16,107 From Other Feedstocks 248 278 297 307 315 329 341 346 350 352 355 Cellulosic 1 8 50 110 181 265 357 456 560 795 1,241Imports (Ethyl Alcohol) 326 393 419 424 473 658 1,129 1,561 2,036 2,507 2,756
Domestic UseDisappearance 11,976 13,386 13,837 14,164 14,734 15,623 16,681 17,540 18,486 19,469 20,306 Conventional 11,709 13,046 13,427 13,690 14,140 14,761 15,255 15,583 15,950 16,227 16,369 Cellulosic 1 8 50 110 181 265 357 456 560 795 1,241 Other Advanced Ethanol 265 333 359 364 413 598 1,069 1,501 1,976 2,447 2,696
Exports (Ethyl Alcohol) 125 115 102 108 104 100 102 112 115 120 121
Ending Stocks 723 788 808 826 853 886 914 938 963 991 1,024
Prices (Dollars per Barrel)Petroleum, Ref. Acquisition 61.98 68.93 75.53 79.85 83.12 86.63 90.30 92.82 94.45 94.43 93.67Petroleum, W. Texas Interm. 66.07 74.15 81.16 85.73 89.19 92.89 96.78 99.43 101.13 101.09 100.26
(Dollars per Gallon)Unl. Gasoline, FOB Omaha 1.87 2.09 2.25 2.36 2.45 2.54 2.63 2.70 2.74 2.75 2.73Unleaded Gasoline, Retail 2.50 2.72 2.89 3.00 3.09 3.19 3.28 3.35 3.40 3.41 3.40
Ethanol, FOB Omaha * 1.74 1.76 1.78 1.78 1.81 1.87 1.93 1.92 1.93 1.94 1.92AMS Spot Plant, Iowa 1.57 1.59 1.61 1.60 1.63 1.69 1.74 1.73 1.74 1.75 1.74Cellulosic * n.a. 3.30 3.20 3.14 3.11 3.11 3.15 3.18 3.21 3.28 3.35Other Advanced * n.a. 1.76 1.78 1.78 1.89 2.18 2.31 2.39 2.44 2.50 2.50Ethanol, Implied Retail 1.91 1.94 1.96 1.96 1.97 2.01 2.08 2.12 2.14 2.15 2.14Ethanol/Gasoline Retail Ratio 76.5% 71.5% 67.9% 65.4% 63.7% 63.1% 63.4% 63.3% 62.9% 63.1% 63.1%
* Rack prices.
U.S. Biofuel Policy Provisions2009 2010 2011 2012 2013 2014 2015 2016 2017 2018 2019
(Million Gallon)Renewable Fuel Standard 11,100 12,950 13,950 15,200 16,550 18,150 20,500 22,250 24,000 26,000 28,000 Advanced Biofuels 600 950 1,350 2,000 2,750 3,750 5,500 7,250 9,000 11,000 13,000 Cellulosic Ethanol 100 250 500 1,000 1,750 3,000 4,250 5,500 7,000 8,500 Biodiesel 500 650 800 1,000 1,000 1,000 1,000 1,000 1,000 1,000 1,000
Taxes and Tariffs (Dollars per Gallon)Ethanol Tax Credit 0.45 0.45 0.45 0.45 0.45 0.45 0.45 0.45 0.45 0.45 0.45Ethanol Specific Tariff 0.54 0.54 0.54 0.54 0.54 0.54 0.54 0.54 0.54 0.54 0.54
(Percent)Ethanol Ad Valorem Tariff 2.50 2.50 2.50 2.50 2.50 2.50 2.50 2.50 2.50 2.50 2.50
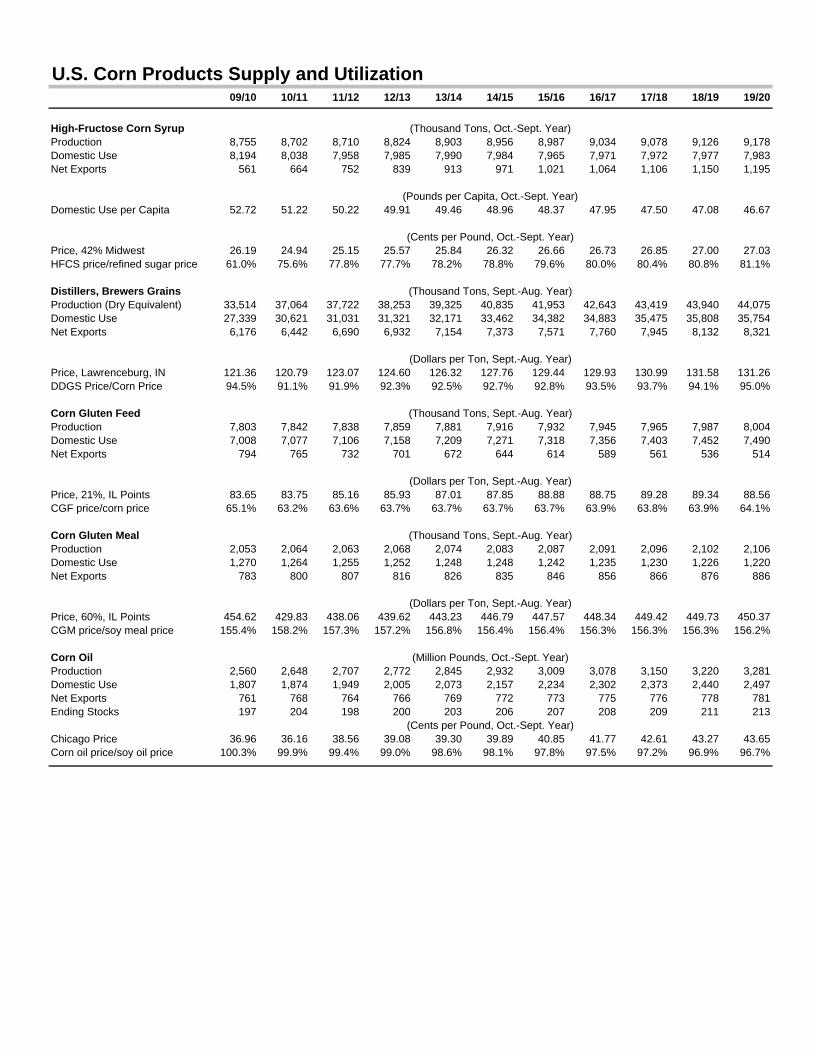
U.S. Corn Products Supply and Utilization09/10 10/11 11/12 12/13 13/14 14/15 15/16 16/17 17/18 18/19 19/20
High-Fructose Corn Syrup (Thousand Tons, Oct.-Sept. Year)Production 8,755 8,702 8,710 8,824 8,903 8,956 8,987 9,034 9,078 9,126 9,178Domestic Use 8,194 8,038 7,958 7,985 7,990 7,984 7,965 7,971 7,972 7,977 7,983Net Exports 561 664 752 839 913 971 1,021 1,064 1,106 1,150 1,195
(Pounds per Capita, Oct.-Sept. Year)Domestic Use per Capita 52.72 51.22 50.22 49.91 49.46 48.96 48.37 47.95 47.50 47.08 46.67
(Cents per Pound, Oct.-Sept. Year)Price, 42% Midwest 26.19 24.94 25.15 25.57 25.84 26.32 26.66 26.73 26.85 27.00 27.03HFCS price/refined sugar price 61.0% 75.6% 77.8% 77.7% 78.2% 78.8% 79.6% 80.0% 80.4% 80.8% 81.1%
Distillers, Brewers Grains (Thousand Tons, Sept.-Aug. Year)Production (Dry Equivalent) 33,514 37,064 37,722 38,253 39,325 40,835 41,953 42,643 43,419 43,940 44,075Domestic Use 27,339 30,621 31,031 31,321 32,171 33,462 34,382 34,883 35,475 35,808 35,754Net Exports 6,176 6,442 6,690 6,932 7,154 7,373 7,571 7,760 7,945 8,132 8,321
(Dollars per Ton, Sept.-Aug. Year)Price, Lawrenceburg, IN 121.36 120.79 123.07 124.60 126.32 127.76 129.44 129.93 130.99 131.58 131.26DDGS Price/Corn Price 94.5% 91.1% 91.9% 92.3% 92.5% 92.7% 92.8% 93.5% 93.7% 94.1% 95.0%
Corn Gluten Feed (Thousand Tons, Sept.-Aug. Year)Production 7,803 7,842 7,838 7,859 7,881 7,916 7,932 7,945 7,965 7,987 8,004Domestic Use 7,008 7,077 7,106 7,158 7,209 7,271 7,318 7,356 7,403 7,452 7,490Net Exports 794 765 732 701 672 644 614 589 561 536 514
(Dollars per Ton, Sept.-Aug. Year)Price, 21%, IL Points 83.65 83.75 85.16 85.93 87.01 87.85 88.88 88.75 89.28 89.34 88.56CGF price/corn price 65.1% 63.2% 63.6% 63.7% 63.7% 63.7% 63.7% 63.9% 63.8% 63.9% 64.1%
Corn Gluten Meal (Thousand Tons, Sept.-Aug. Year)Production 2,053 2,064 2,063 2,068 2,074 2,083 2,087 2,091 2,096 2,102 2,106Domestic Use 1,270 1,264 1,255 1,252 1,248 1,248 1,242 1,235 1,230 1,226 1,220Net Exports 783 800 807 816 826 835 846 856 866 876 886
(Dollars per Ton, Sept.-Aug. Year)Price, 60%, IL Points 454.62 429.83 438.06 439.62 443.23 446.79 447.57 448.34 449.42 449.73 450.37CGM price/soy meal price 155.4% 158.2% 157.3% 157.2% 156.8% 156.4% 156.4% 156.3% 156.3% 156.3% 156.2%
Corn Oil (Million Pounds, Oct.-Sept. Year)Production 2,560 2,648 2,707 2,772 2,845 2,932 3,009 3,078 3,150 3,220 3,281Domestic Use 1,807 1,874 1,949 2,005 2,073 2,157 2,234 2,302 2,373 2,440 2,497Net Exports 761 768 764 766 769 772 773 775 776 778 781Ending Stocks 197 204 198 200 203 206 207 208 209 211 213
(Cents per Pound, Oct.-Sept. Year)Chicago Price 36.96 36.16 38.56 39.08 39.30 39.89 40.85 41.77 42.61 43.27 43.65Corn oil price/soy oil price 100.3% 99.9% 99.4% 99.0% 98.6% 98.1% 97.8% 97.5% 97.2% 96.9% 96.7%
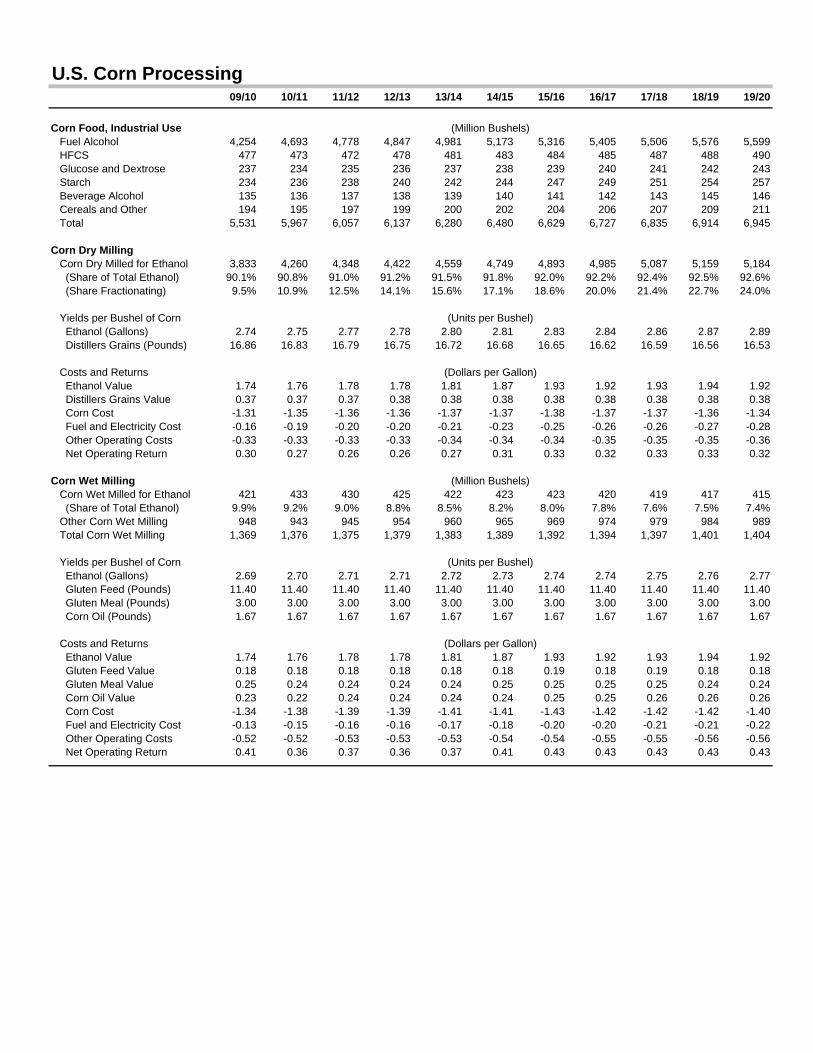
U.S. Corn Processing09/10 10/11 11/12 12/13 13/14 14/15 15/16 16/17 17/18 18/19 19/20
Corn Food, Industrial Use (Million Bushels) Fuel Alcohol 4,254 4,693 4,778 4,847 4,981 5,173 5,316 5,405 5,506 5,576 5,599 HFCS 477 473 472 478 481 483 484 485 487 488 490 Glucose and Dextrose 237 234 235 236 237 238 239 240 241 242 243 Starch 234 236 238 240 242 244 247 249 251 254 257 Beverage Alcohol 135 136 137 138 139 140 141 142 143 145 146 Cereals and Other 194 195 197 199 200 202 204 206 207 209 211 Total 5,531 5,967 6,057 6,137 6,280 6,480 6,629 6,727 6,835 6,914 6,945
Corn Dry Milling Corn Dry Milled for Ethanol 3,833 4,260 4,348 4,422 4,559 4,749 4,893 4,985 5,087 5,159 5,184 (Share of Total Ethanol) 90.1% 90.8% 91.0% 91.2% 91.5% 91.8% 92.0% 92.2% 92.4% 92.5% 92.6% (Share Fractionating) 9.5% 10.9% 12.5% 14.1% 15.6% 17.1% 18.6% 20.0% 21.4% 22.7% 24.0%
Yields per Bushel of Corn (Units per Bushel) Ethanol (Gallons) 2.74 2.75 2.77 2.78 2.80 2.81 2.83 2.84 2.86 2.87 2.89 Distillers Grains (Pounds) 16.86 16.83 16.79 16.75 16.72 16.68 16.65 16.62 16.59 16.56 16.53
Costs and Returns (Dollars per Gallon) Ethanol Value 1.74 1.76 1.78 1.78 1.81 1.87 1.93 1.92 1.93 1.94 1.92 Distillers Grains Value 0.37 0.37 0.37 0.38 0.38 0.38 0.38 0.38 0.38 0.38 0.38 Corn Cost -1.31 -1.35 -1.36 -1.36 -1.37 -1.37 -1.38 -1.37 -1.37 -1.36 -1.34 Fuel and Electricity Cost -0.16 -0.19 -0.20 -0.20 -0.21 -0.23 -0.25 -0.26 -0.26 -0.27 -0.28 Other Operating Costs -0.33 -0.33 -0.33 -0.33 -0.34 -0.34 -0.34 -0.35 -0.35 -0.35 -0.36 Net Operating Return 0.30 0.27 0.26 0.26 0.27 0.31 0.33 0.32 0.33 0.33 0.32
Corn Wet Milling (Million Bushels) Corn Wet Milled for Ethanol 421 433 430 425 422 423 423 420 419 417 415 (Share of Total Ethanol) 9.9% 9.2% 9.0% 8.8% 8.5% 8.2% 8.0% 7.8% 7.6% 7.5% 7.4% Other Corn Wet Milling 948 943 945 954 960 965 969 974 979 984 989 Total Corn Wet Milling 1,369 1,376 1,375 1,379 1,383 1,389 1,392 1,394 1,397 1,401 1,404
Yields per Bushel of Corn (Units per Bushel) Ethanol (Gallons) 2.69 2.70 2.71 2.71 2.72 2.73 2.74 2.74 2.75 2.76 2.77 Gluten Feed (Pounds) 11.40 11.40 11.40 11.40 11.40 11.40 11.40 11.40 11.40 11.40 11.40 Gluten Meal (Pounds) 3.00 3.00 3.00 3.00 3.00 3.00 3.00 3.00 3.00 3.00 3.00 Corn Oil (Pounds) 1.67 1.67 1.67 1.67 1.67 1.67 1.67 1.67 1.67 1.67 1.67
Costs and Returns (Dollars per Gallon) Ethanol Value 1.74 1.76 1.78 1.78 1.81 1.87 1.93 1.92 1.93 1.94 1.92 Gluten Feed Value 0.18 0.18 0.18 0.18 0.18 0.18 0.19 0.18 0.19 0.18 0.18 Gluten Meal Value 0.25 0.24 0.24 0.24 0.24 0.25 0.25 0.25 0.25 0.24 0.24 Corn Oil Value 0.23 0.22 0.24 0.24 0.24 0.24 0.25 0.25 0.26 0.26 0.26 Corn Cost -1.34 -1.38 -1.39 -1.39 -1.41 -1.41 -1.43 -1.42 -1.42 -1.42 -1.40 Fuel and Electricity Cost -0.13 -0.15 -0.16 -0.16 -0.17 -0.18 -0.20 -0.20 -0.21 -0.21 -0.22 Other Operating Costs -0.52 -0.52 -0.53 -0.53 -0.53 -0.54 -0.54 -0.55 -0.55 -0.56 -0.56 Net Operating Return 0.41 0.36 0.37 0.36 0.37 0.41 0.43 0.43 0.43 0.43 0.43
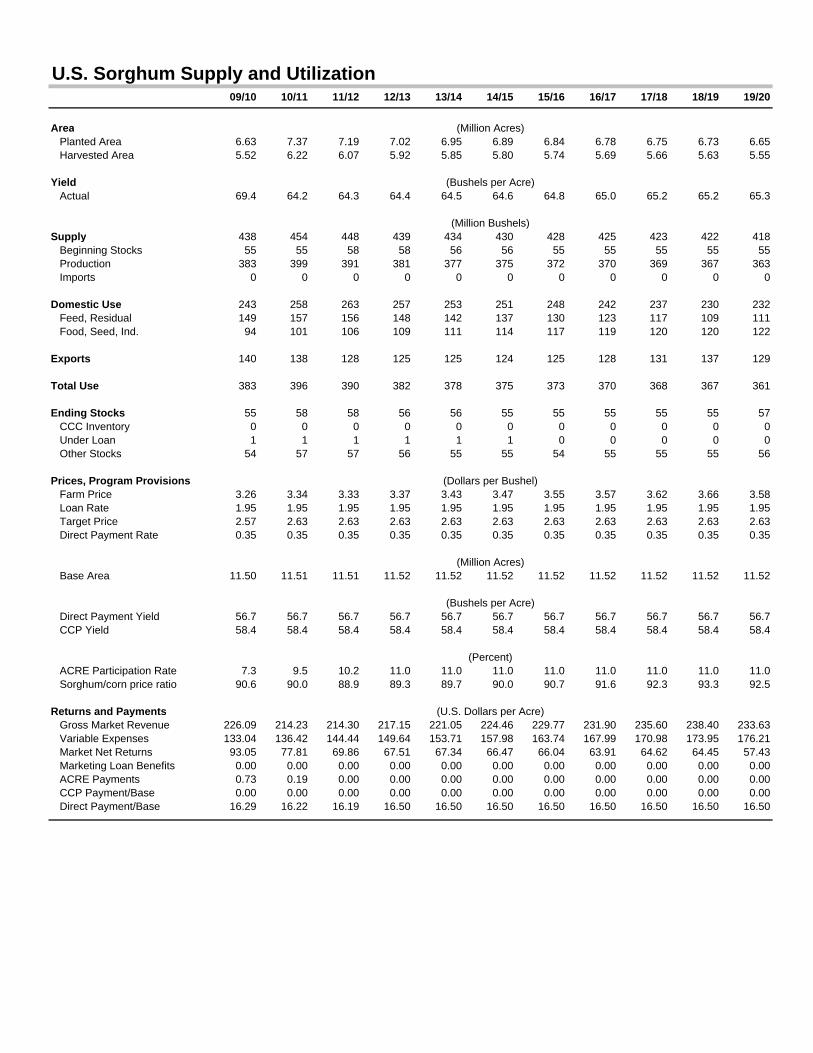
U.S. Sorghum Supply and Utilization09/10 10/11 11/12 12/13 13/14 14/15 15/16 16/17 17/18 18/19 19/20
Area (Million Acres) Planted Area 6.63 7.37 7.19 7.02 6.95 6.89 6.84 6.78 6.75 6.73 6.65 Harvested Area 5.52 6.22 6.07 5.92 5.85 5.80 5.74 5.69 5.66 5.63 5.55
Yield (Bushels per Acre) Actual 69.4 64.2 64.3 64.4 64.5 64.6 64.8 65.0 65.2 65.2 65.3
(Million Bushels)Supply 438 454 448 439 434 430 428 425 423 422 418 Beginning Stocks 55 55 58 58 56 56 55 55 55 55 55 Production 383 399 391 381 377 375 372 370 369 367 363 Imports 0 0 0 0 0 0 0 0 0 0 0
Domestic Use 243 258 263 257 253 251 248 242 237 230 232 Feed, Residual 149 157 156 148 142 137 130 123 117 109 111 Food, Seed, Ind. 94 101 106 109 111 114 117 119 120 120 122
Exports 140 138 128 125 125 124 125 128 131 137 129
Total Use 383 396 390 382 378 375 373 370 368 367 361
Ending Stocks 55 58 58 56 56 55 55 55 55 55 57 CCC Inventory 0 0 0 0 0 0 0 0 0 0 0 Under Loan 1 1 1 1 1 1 0 0 0 0 0 Other Stocks 54 57 57 56 55 55 54 55 55 55 56
Prices, Program Provisions (Dollars per Bushel) Farm Price 3.26 3.34 3.33 3.37 3.43 3.47 3.55 3.57 3.62 3.66 3.58 Loan Rate 1.95 1.95 1.95 1.95 1.95 1.95 1.95 1.95 1.95 1.95 1.95 Target Price 2.57 2.63 2.63 2.63 2.63 2.63 2.63 2.63 2.63 2.63 2.63 Direct Payment Rate 0.35 0.35 0.35 0.35 0.35 0.35 0.35 0.35 0.35 0.35 0.35
(Million Acres) Base Area 11.50 11.51 11.51 11.52 11.52 11.52 11.52 11.52 11.52 11.52 11.52
(Bushels per Acre) Direct Payment Yield 56.7 56.7 56.7 56.7 56.7 56.7 56.7 56.7 56.7 56.7 56.7 CCP Yield 58.4 58.4 58.4 58.4 58.4 58.4 58.4 58.4 58.4 58.4 58.4
(Percent) ACRE Participation Rate 7.3 9.5 10.2 11.0 11.0 11.0 11.0 11.0 11.0 11.0 11.0 Sorghum/corn price ratio 90.6 90.0 88.9 89.3 89.7 90.0 90.7 91.6 92.3 93.3 92.5
Returns and Payments (U.S. Dollars per Acre) Gross Market Revenue 226.09 214.23 214.30 217.15 221.05 224.46 229.77 231.90 235.60 238.40 233.63 Variable Expenses 133.04 136.42 144.44 149.64 153.71 157.98 163.74 167.99 170.98 173.95 176.21 Market Net Returns 93.05 77.81 69.86 67.51 67.34 66.47 66.04 63.91 64.62 64.45 57.43 Marketing Loan Benefits 0.00 0.00 0.00 0.00 0.00 0.00 0.00 0.00 0.00 0.00 0.00 ACRE Payments 0.73 0.19 0.00 0.00 0.00 0.00 0.00 0.00 0.00 0.00 0.00 CCP Payment/Base 0.00 0.00 0.00 0.00 0.00 0.00 0.00 0.00 0.00 0.00 0.00 Direct Payment/Base 16.29 16.22 16.19 16.50 16.50 16.50 16.50 16.50 16.50 16.50 16.50
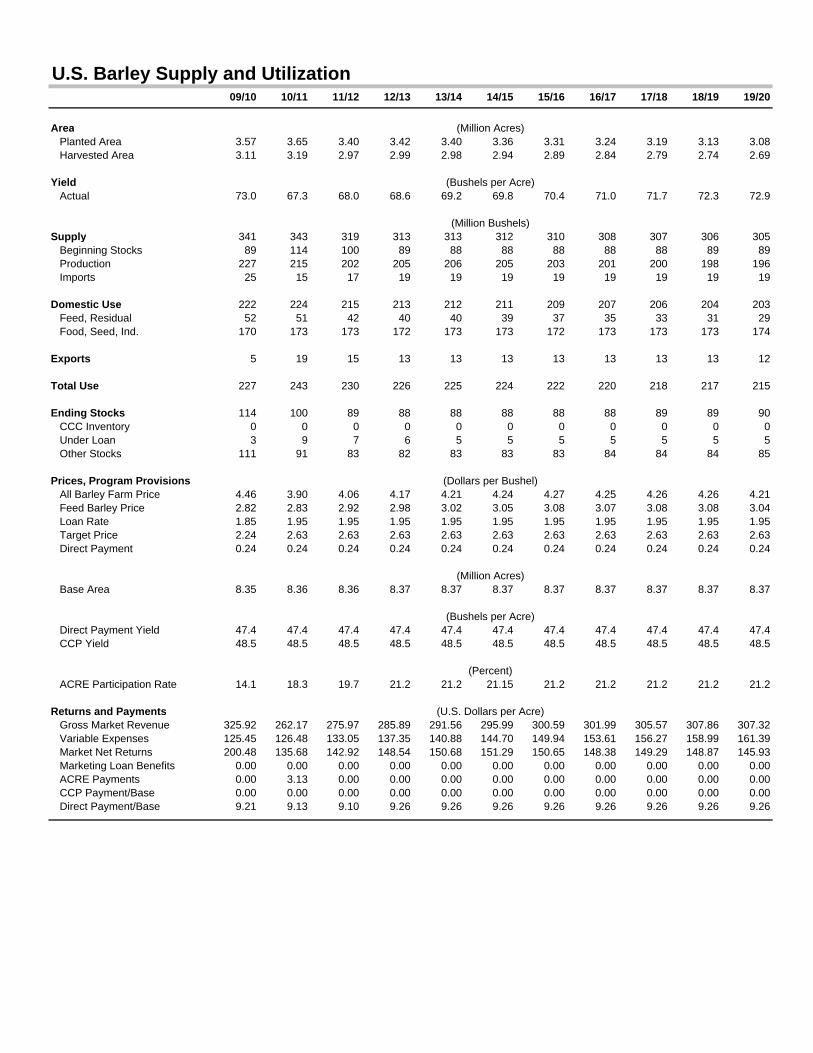
U.S. Barley Supply and Utilization09/10 10/11 11/12 12/13 13/14 14/15 15/16 16/17 17/18 18/19 19/20
Area (Million Acres) Planted Area 3.57 3.65 3.40 3.42 3.40 3.36 3.31 3.24 3.19 3.13 3.08 Harvested Area 3.11 3.19 2.97 2.99 2.98 2.94 2.89 2.84 2.79 2.74 2.69
Yield (Bushels per Acre) Actual 73.0 67.3 68.0 68.6 69.2 69.8 70.4 71.0 71.7 72.3 72.9
(Million Bushels)Supply 341 343 319 313 313 312 310 308 307 306 305 Beginning Stocks 89 114 100 89 88 88 88 88 88 89 89 Production 227 215 202 205 206 205 203 201 200 198 196 Imports 25 15 17 19 19 19 19 19 19 19 19
Domestic Use 222 224 215 213 212 211 209 207 206 204 203 Feed, Residual 52 51 42 40 40 39 37 35 33 31 29 Food, Seed, Ind. 170 173 173 172 173 173 172 173 173 173 174
Exports 5 19 15 13 13 13 13 13 13 13 12
Total Use 227 243 230 226 225 224 222 220 218 217 215
Ending Stocks 114 100 89 88 88 88 88 88 89 89 90 CCC Inventory 0 0 0 0 0 0 0 0 0 0 0 Under Loan 3 9 7 6 5 5 5 5 5 5 5 Other Stocks 111 91 83 82 83 83 83 84 84 84 85
Prices, Program Provisions (Dollars per Bushel) All Barley Farm Price 4.46 3.90 4.06 4.17 4.21 4.24 4.27 4.25 4.26 4.26 4.21 Feed Barley Price 2.82 2.83 2.92 2.98 3.02 3.05 3.08 3.07 3.08 3.08 3.04 Loan Rate 1.85 1.95 1.95 1.95 1.95 1.95 1.95 1.95 1.95 1.95 1.95 Target Price 2.24 2.63 2.63 2.63 2.63 2.63 2.63 2.63 2.63 2.63 2.63 Direct Payment 0.24 0.24 0.24 0.24 0.24 0.24 0.24 0.24 0.24 0.24 0.24
(Million Acres) Base Area 8.35 8.36 8.36 8.37 8.37 8.37 8.37 8.37 8.37 8.37 8.37
(Bushels per Acre) Direct Payment Yield 47.4 47.4 47.4 47.4 47.4 47.4 47.4 47.4 47.4 47.4 47.4 CCP Yield 48.5 48.5 48.5 48.5 48.5 48.5 48.5 48.5 48.5 48.5 48.5
(Percent) ACRE Participation Rate 14.1 18.3 19.7 21.2 21.2 21.15 21.2 21.2 21.2 21.2 21.2
Returns and Payments (U.S. Dollars per Acre) Gross Market Revenue 325.92 262.17 275.97 285.89 291.56 295.99 300.59 301.99 305.57 307.86 307.32 Variable Expenses 125.45 126.48 133.05 137.35 140.88 144.70 149.94 153.61 156.27 158.99 161.39 Market Net Returns 200.48 135.68 142.92 148.54 150.68 151.29 150.65 148.38 149.29 148.87 145.93 Marketing Loan Benefits 0.00 0.00 0.00 0.00 0.00 0.00 0.00 0.00 0.00 0.00 0.00 ACRE Payments 0.00 3.13 0.00 0.00 0.00 0.00 0.00 0.00 0.00 0.00 0.00 CCP Payment/Base 0.00 0.00 0.00 0.00 0.00 0.00 0.00 0.00 0.00 0.00 0.00 Direct Payment/Base 9.21 9.13 9.10 9.26 9.26 9.26 9.26 9.26 9.26 9.26 9.26
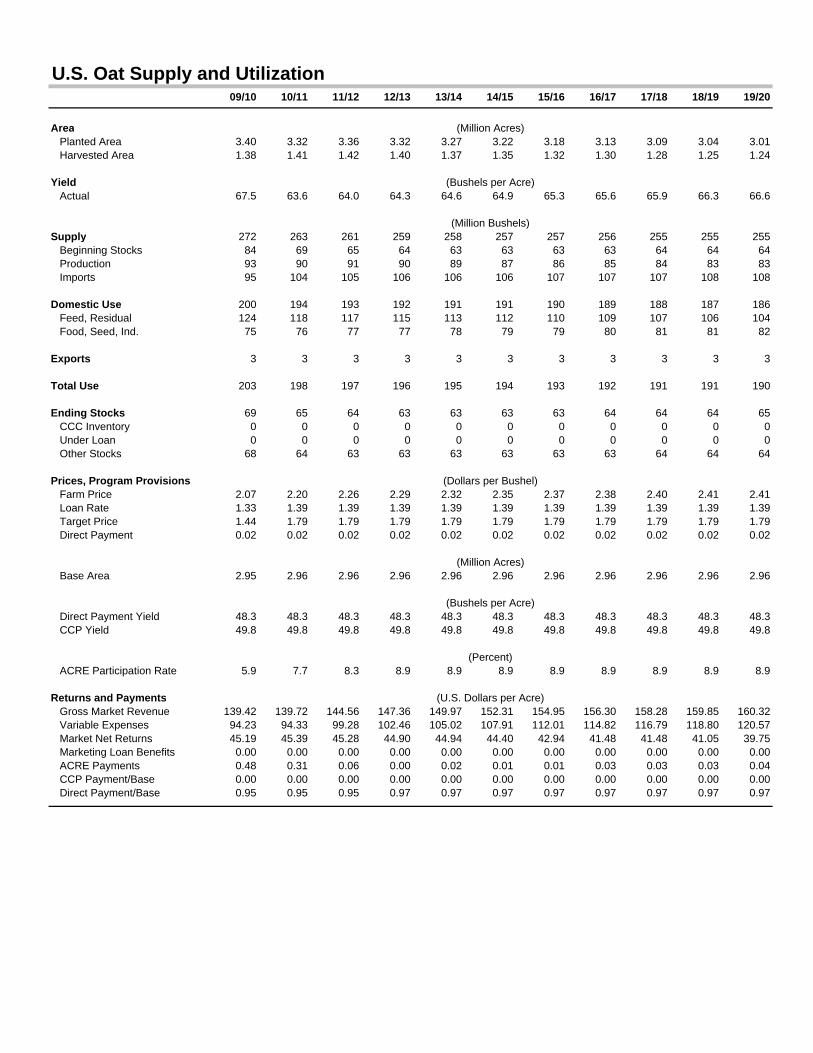
U.S. Oat Supply and Utilization09/10 10/11 11/12 12/13 13/14 14/15 15/16 16/17 17/18 18/19 19/20
Area (Million Acres) Planted Area 3.40 3.32 3.36 3.32 3.27 3.22 3.18 3.13 3.09 3.04 3.01 Harvested Area 1.38 1.41 1.42 1.40 1.37 1.35 1.32 1.30 1.28 1.25 1.24
Yield (Bushels per Acre) Actual 67.5 63.6 64.0 64.3 64.6 64.9 65.3 65.6 65.9 66.3 66.6
(Million Bushels)Supply 272 263 261 259 258 257 257 256 255 255 255 Beginning Stocks 84 69 65 64 63 63 63 63 64 64 64 Production 93 90 91 90 89 87 86 85 84 83 83 Imports 95 104 105 106 106 106 107 107 107 108 108
Domestic Use 200 194 193 192 191 191 190 189 188 187 186 Feed, Residual 124 118 117 115 113 112 110 109 107 106 104 Food, Seed, Ind. 75 76 77 77 78 79 79 80 81 81 82
Exports 3 3 3 3 3 3 3 3 3 3 3
Total Use 203 198 197 196 195 194 193 192 191 191 190
Ending Stocks 69 65 64 63 63 63 63 64 64 64 65 CCC Inventory 0 0 0 0 0 0 0 0 0 0 0 Under Loan 0 0 0 0 0 0 0 0 0 0 0 Other Stocks 68 64 63 63 63 63 63 63 64 64 64
Prices, Program Provisions (Dollars per Bushel) Farm Price 2.07 2.20 2.26 2.29 2.32 2.35 2.37 2.38 2.40 2.41 2.41 Loan Rate 1.33 1.39 1.39 1.39 1.39 1.39 1.39 1.39 1.39 1.39 1.39 Target Price 1.44 1.79 1.79 1.79 1.79 1.79 1.79 1.79 1.79 1.79 1.79 Direct Payment 0.02 0.02 0.02 0.02 0.02 0.02 0.02 0.02 0.02 0.02 0.02
(Million Acres) Base Area 2.95 2.96 2.96 2.96 2.96 2.96 2.96 2.96 2.96 2.96 2.96
(Bushels per Acre) Direct Payment Yield 48.3 48.3 48.3 48.3 48.3 48.3 48.3 48.3 48.3 48.3 48.3 CCP Yield 49.8 49.8 49.8 49.8 49.8 49.8 49.8 49.8 49.8 49.8 49.8
(Percent) ACRE Participation Rate 5.9 7.7 8.3 8.9 8.9 8.9 8.9 8.9 8.9 8.9 8.9
Returns and Payments (U.S. Dollars per Acre) Gross Market Revenue 139.42 139.72 144.56 147.36 149.97 152.31 154.95 156.30 158.28 159.85 160.32 Variable Expenses 94.23 94.33 99.28 102.46 105.02 107.91 112.01 114.82 116.79 118.80 120.57 Market Net Returns 45.19 45.39 45.28 44.90 44.94 44.40 42.94 41.48 41.48 41.05 39.75 Marketing Loan Benefits 0.00 0.00 0.00 0.00 0.00 0.00 0.00 0.00 0.00 0.00 0.00 ACRE Payments 0.48 0.31 0.06 0.00 0.02 0.01 0.01 0.03 0.03 0.03 0.04 CCP Payment/Base 0.00 0.00 0.00 0.00 0.00 0.00 0.00 0.00 0.00 0.00 0.00 Direct Payment/Base 0.95 0.95 0.95 0.97 0.97 0.97 0.97 0.97 0.97 0.97 0.97
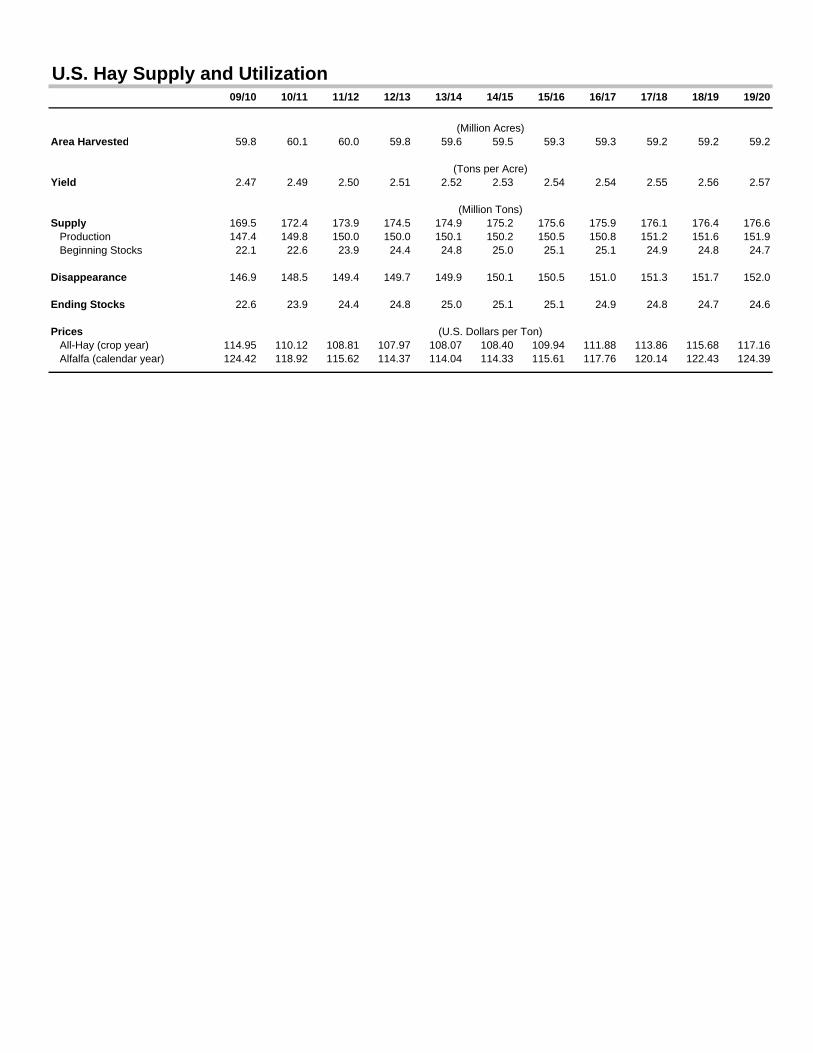
U.S. Hay Supply and Utilization09/10 10/11 11/12 12/13 13/14 14/15 15/16 16/17 17/18 18/19 19/20
(Million Acres)Area Harvested 59.8 60.1 60.0 59.8 59.6 59.5 59.3 59.3 59.2 59.2 59.2
(Tons per Acre)Yield 2.47 2.49 2.50 2.51 2.52 2.53 2.54 2.54 2.55 2.56 2.57
(Million Tons)Supply 169.5 172.4 173.9 174.5 174.9 175.2 175.6 175.9 176.1 176.4 176.6 Production 147.4 149.8 150.0 150.0 150.1 150.2 150.5 150.8 151.2 151.6 151.9 Beginning Stocks 22.1 22.6 23.9 24.4 24.8 25.0 25.1 25.1 24.9 24.8 24.7
Disappearance 146.9 148.5 149.4 149.7 149.9 150.1 150.5 151.0 151.3 151.7 152.0
Ending Stocks 22.6 23.9 24.4 24.8 25.0 25.1 25.1 24.9 24.8 24.7 24.6
Prices (U.S. Dollars per Ton) All-Hay (crop year) 114.95 110.12 108.81 107.97 108.07 108.40 109.94 111.88 113.86 115.68 117.16 Alfalfa (calendar year) 124.42 118.92 115.62 114.37 114.04 114.33 115.61 117.76 120.14 122.43 124.39
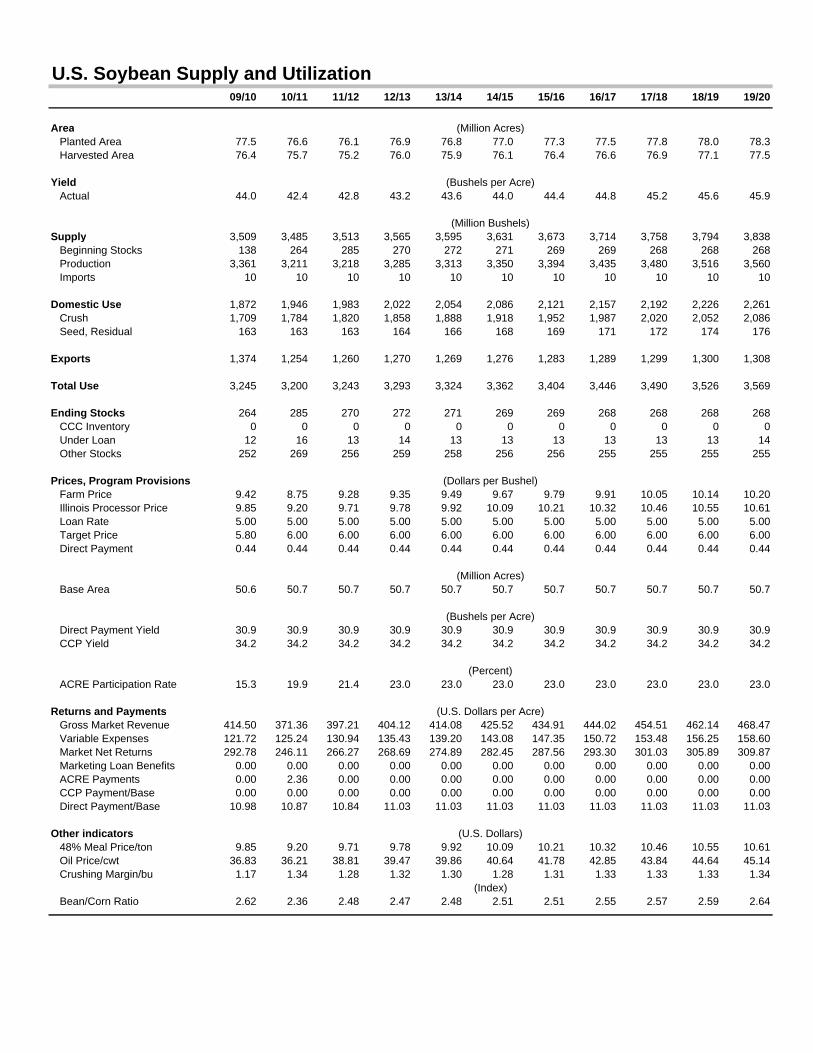
U.S. Soybean Supply and Utilization09/10 10/11 11/12 12/13 13/14 14/15 15/16 16/17 17/18 18/19 19/20
Area (Million Acres) Planted Area 77.5 76.6 76.1 76.9 76.8 77.0 77.3 77.5 77.8 78.0 78.3 Harvested Area 76.4 75.7 75.2 76.0 75.9 76.1 76.4 76.6 76.9 77.1 77.5
Yield (Bushels per Acre) Actual 44.0 42.4 42.8 43.2 43.6 44.0 44.4 44.8 45.2 45.6 45.9
(Million Bushels)Supply 3,509 3,485 3,513 3,565 3,595 3,631 3,673 3,714 3,758 3,794 3,838 Beginning Stocks 138 264 285 270 272 271 269 269 268 268 268 Production 3,361 3,211 3,218 3,285 3,313 3,350 3,394 3,435 3,480 3,516 3,560 Imports 10 10 10 10 10 10 10 10 10 10 10
Domestic Use 1,872 1,946 1,983 2,022 2,054 2,086 2,121 2,157 2,192 2,226 2,261 Crush 1,709 1,784 1,820 1,858 1,888 1,918 1,952 1,987 2,020 2,052 2,086 Seed, Residual 163 163 163 164 166 168 169 171 172 174 176
Exports 1,374 1,254 1,260 1,270 1,269 1,276 1,283 1,289 1,299 1,300 1,308
Total Use 3,245 3,200 3,243 3,293 3,324 3,362 3,404 3,446 3,490 3,526 3,569
Ending Stocks 264 285 270 272 271 269 269 268 268 268 268 CCC Inventory 0 0 0 0 0 0 0 0 0 0 0 Under Loan 12 16 13 14 13 13 13 13 13 13 14 Other Stocks 252 269 256 259 258 256 256 255 255 255 255
Prices, Program Provisions (Dollars per Bushel) Farm Price 9.42 8.75 9.28 9.35 9.49 9.67 9.79 9.91 10.05 10.14 10.20 Illinois Processor Price 9.85 9.20 9.71 9.78 9.92 10.09 10.21 10.32 10.46 10.55 10.61 Loan Rate 5.00 5.00 5.00 5.00 5.00 5.00 5.00 5.00 5.00 5.00 5.00 Target Price 5.80 6.00 6.00 6.00 6.00 6.00 6.00 6.00 6.00 6.00 6.00 Direct Payment 0.44 0.44 0.44 0.44 0.44 0.44 0.44 0.44 0.44 0.44 0.44
(Million Acres) Base Area 50.6 50.7 50.7 50.7 50.7 50.7 50.7 50.7 50.7 50.7 50.7
(Bushels per Acre) Direct Payment Yield 30.9 30.9 30.9 30.9 30.9 30.9 30.9 30.9 30.9 30.9 30.9 CCP Yield 34.2 34.2 34.2 34.2 34.2 34.2 34.2 34.2 34.2 34.2 34.2
(Percent) ACRE Participation Rate 15.3 19.9 21.4 23.0 23.0 23.0 23.0 23.0 23.0 23.0 23.0
Returns and Payments (U.S. Dollars per Acre) Gross Market Revenue 414.50 371.36 397.21 404.12 414.08 425.52 434.91 444.02 454.51 462.14 468.47 Variable Expenses 121.72 125.24 130.94 135.43 139.20 143.08 147.35 150.72 153.48 156.25 158.60 Market Net Returns 292.78 246.11 266.27 268.69 274.89 282.45 287.56 293.30 301.03 305.89 309.87 Marketing Loan Benefits 0.00 0.00 0.00 0.00 0.00 0.00 0.00 0.00 0.00 0.00 0.00 ACRE Payments 0.00 2.36 0.00 0.00 0.00 0.00 0.00 0.00 0.00 0.00 0.00 CCP Payment/Base 0.00 0.00 0.00 0.00 0.00 0.00 0.00 0.00 0.00 0.00 0.00 Direct Payment/Base 10.98 10.87 10.84 11.03 11.03 11.03 11.03 11.03 11.03 11.03 11.03
Other indicators (U.S. Dollars) 48% Meal Price/ton 9.85 9.20 9.71 9.78 9.92 10.09 10.21 10.32 10.46 10.55 10.61 Oil Price/cwt 36.83 36.21 38.81 39.47 39.86 40.64 41.78 42.85 43.84 44.64 45.14 Crushing Margin/bu 1.17 1.34 1.28 1.32 1.30 1.28 1.31 1.33 1.33 1.33 1.34
(Index) Bean/Corn Ratio 2.62 2.36 2.48 2.47 2.48 2.51 2.51 2.55 2.57 2.59 2.64
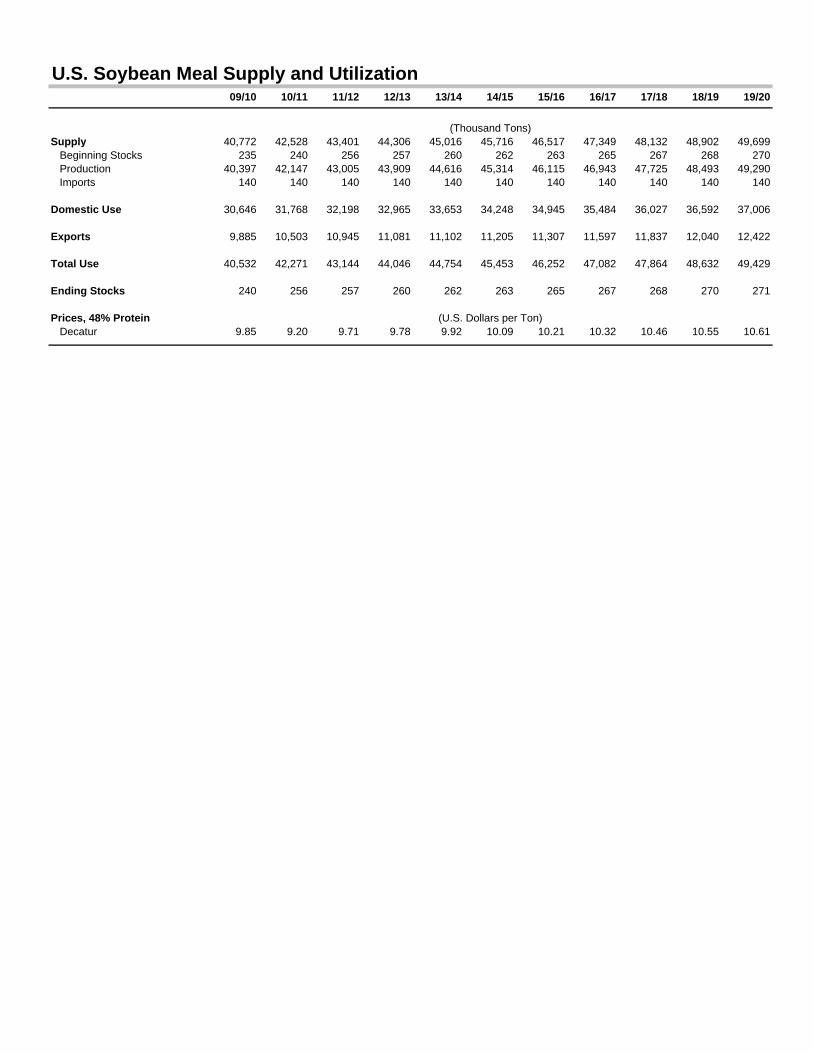
U.S. Soybean Meal Supply and Utilization09/10 10/11 11/12 12/13 13/14 14/15 15/16 16/17 17/18 18/19 19/20
(Thousand Tons)Supply 40,772 42,528 43,401 44,306 45,016 45,716 46,517 47,349 48,132 48,902 49,699 Beginning Stocks 235 240 256 257 260 262 263 265 267 268 270 Production 40,397 42,147 43,005 43,909 44,616 45,314 46,115 46,943 47,725 48,493 49,290 Imports 140 140 140 140 140 140 140 140 140 140 140
Domestic Use 30,646 31,768 32,198 32,965 33,653 34,248 34,945 35,484 36,027 36,592 37,006
Exports 9,885 10,503 10,945 11,081 11,102 11,205 11,307 11,597 11,837 12,040 12,422
Total Use 40,532 42,271 43,144 44,046 44,754 45,453 46,252 47,082 47,864 48,632 49,429
Ending Stocks 240 256 257 260 262 263 265 267 268 270 271
Prices, 48% Protein (U.S. Dollars per Ton) Decatur 9.85 9.20 9.71 9.78 9.92 10.09 10.21 10.32 10.46 10.55 10.61
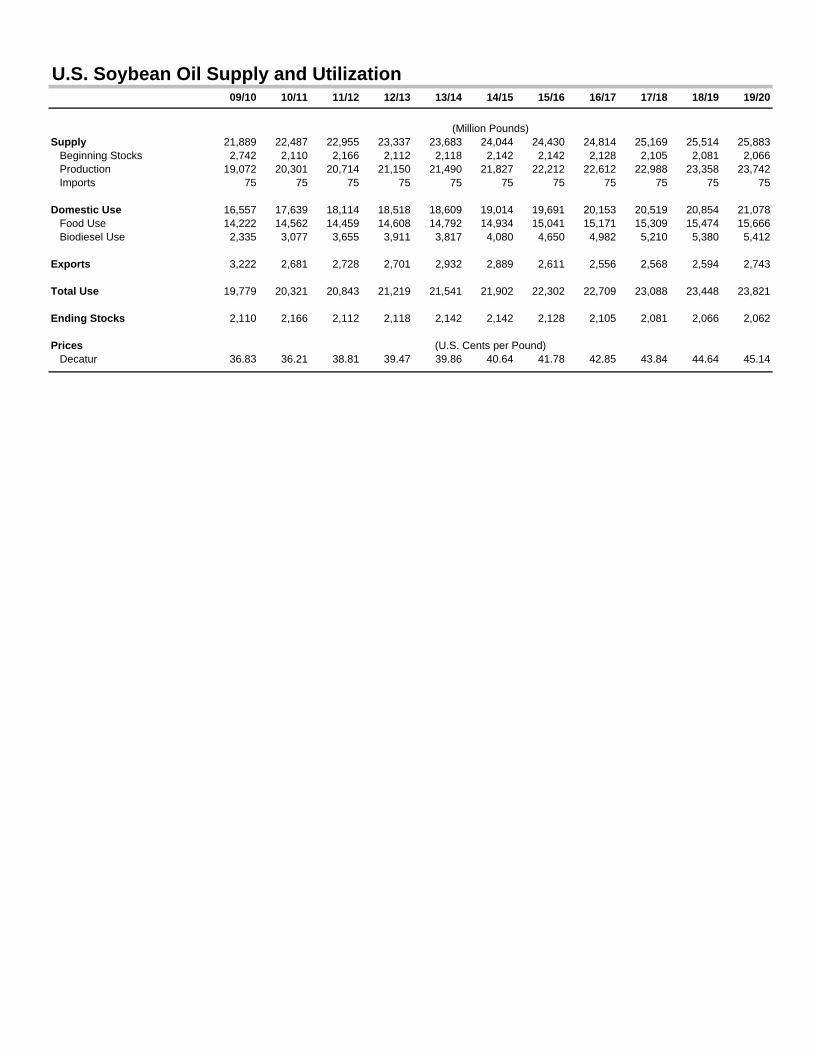
U.S. Soybean Oil Supply and Utilization09/10 10/11 11/12 12/13 13/14 14/15 15/16 16/17 17/18 18/19 19/20
(Million Pounds)Supply 21,889 22,487 22,955 23,337 23,683 24,044 24,430 24,814 25,169 25,514 25,883 Beginning Stocks 2,742 2,110 2,166 2,112 2,118 2,142 2,142 2,128 2,105 2,081 2,066 Production 19,072 20,301 20,714 21,150 21,490 21,827 22,212 22,612 22,988 23,358 23,742 Imports 75 75 75 75 75 75 75 75 75 75 75
Domestic Use 16,557 17,639 18,114 18,518 18,609 19,014 19,691 20,153 20,519 20,854 21,078 Food Use 14,222 14,562 14,459 14,608 14,792 14,934 15,041 15,171 15,309 15,474 15,666 Biodiesel Use 2,335 3,077 3,655 3,911 3,817 4,080 4,650 4,982 5,210 5,380 5,412
Exports 3,222 2,681 2,728 2,701 2,932 2,889 2,611 2,556 2,568 2,594 2,743
Total Use 19,779 20,321 20,843 21,219 21,541 21,902 22,302 22,709 23,088 23,448 23,821
Ending Stocks 2,110 2,166 2,112 2,118 2,142 2,142 2,128 2,105 2,081 2,066 2,062
Prices (U.S. Cents per Pound) Decatur 36.83 36.21 38.81 39.47 39.86 40.64 41.78 42.85 43.84 44.64 45.14
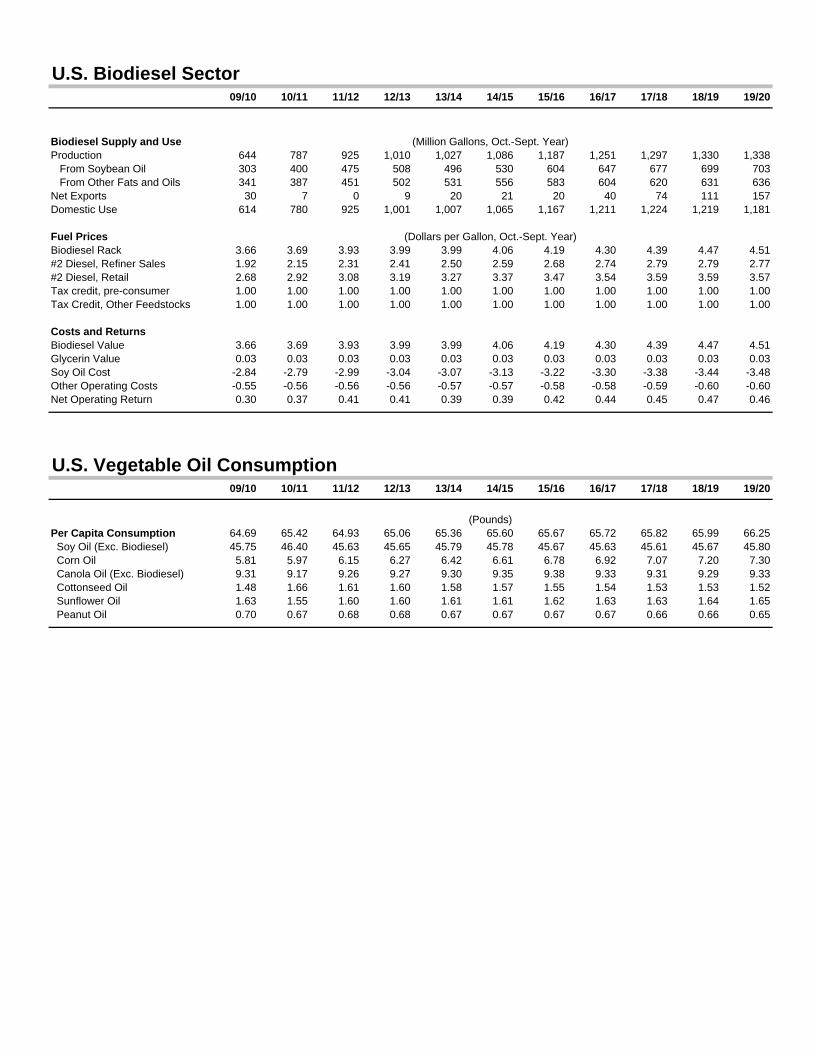
U.S. Biodiesel Sector09/10 10/11 11/12 12/13 13/14 14/15 15/16 16/17 17/18 18/19 19/20
Biodiesel Supply and Use (Million Gallons, Oct.-Sept. Year)Production 644 787 925 1,010 1,027 1,086 1,187 1,251 1,297 1,330 1,338 From Soybean Oil 303 400 475 508 496 530 604 647 677 699 703 From Other Fats and Oils 341 387 451 502 531 556 583 604 620 631 636Net Exports 30 7 0 9 20 21 20 40 74 111 157Domestic Use 614 780 925 1,001 1,007 1,065 1,167 1,211 1,224 1,219 1,181
Fuel Prices (Dollars per Gallon, Oct.-Sept. Year)Biodiesel Rack 3.66 3.69 3.93 3.99 3.99 4.06 4.19 4.30 4.39 4.47 4.51#2 Diesel, Refiner Sales 1.92 2.15 2.31 2.41 2.50 2.59 2.68 2.74 2.79 2.79 2.77#2 Diesel, Retail 2.68 2.92 3.08 3.19 3.27 3.37 3.47 3.54 3.59 3.59 3.57Tax credit, pre-consumer 1.00 1.00 1.00 1.00 1.00 1.00 1.00 1.00 1.00 1.00 1.00Tax Credit, Other Feedstocks 1.00 1.00 1.00 1.00 1.00 1.00 1.00 1.00 1.00 1.00 1.00
Costs and ReturnsBiodiesel Value 3.66 3.69 3.93 3.99 3.99 4.06 4.19 4.30 4.39 4.47 4.51Glycerin Value 0.03 0.03 0.03 0.03 0.03 0.03 0.03 0.03 0.03 0.03 0.03Soy Oil Cost -2.84 -2.79 -2.99 -3.04 -3.07 -3.13 -3.22 -3.30 -3.38 -3.44 -3.48Other Operating Costs -0.55 -0.56 -0.56 -0.56 -0.57 -0.57 -0.58 -0.58 -0.59 -0.60 -0.60Net Operating Return 0.30 0.37 0.41 0.41 0.39 0.39 0.42 0.44 0.45 0.47 0.46
U.S. Vegetable Oil Consumption09/10 10/11 11/12 12/13 13/14 14/15 15/16 16/17 17/18 18/19 19/20
(Pounds)Per Capita Consumption 64.69 65.42 64.93 65.06 65.36 65.60 65.67 65.72 65.82 65.99 66.25 Soy Oil (Exc. Biodiesel) 45.75 46.40 45.63 45.65 45.79 45.78 45.67 45.63 45.61 45.67 45.80 Corn Oil 5.81 5.97 6.15 6.27 6.42 6.61 6.78 6.92 7.07 7.20 7.30 Canola Oil (Exc. Biodiesel) 9.31 9.17 9.26 9.27 9.30 9.35 9.38 9.33 9.31 9.29 9.33 Cottonseed Oil 1.48 1.66 1.61 1.60 1.58 1.57 1.55 1.54 1.53 1.53 1.52 Sunflower Oil 1.63 1.55 1.60 1.60 1.61 1.61 1.62 1.63 1.63 1.64 1.65 Peanut Oil 0.70 0.67 0.68 0.68 0.67 0.67 0.67 0.67 0.66 0.66 0.65
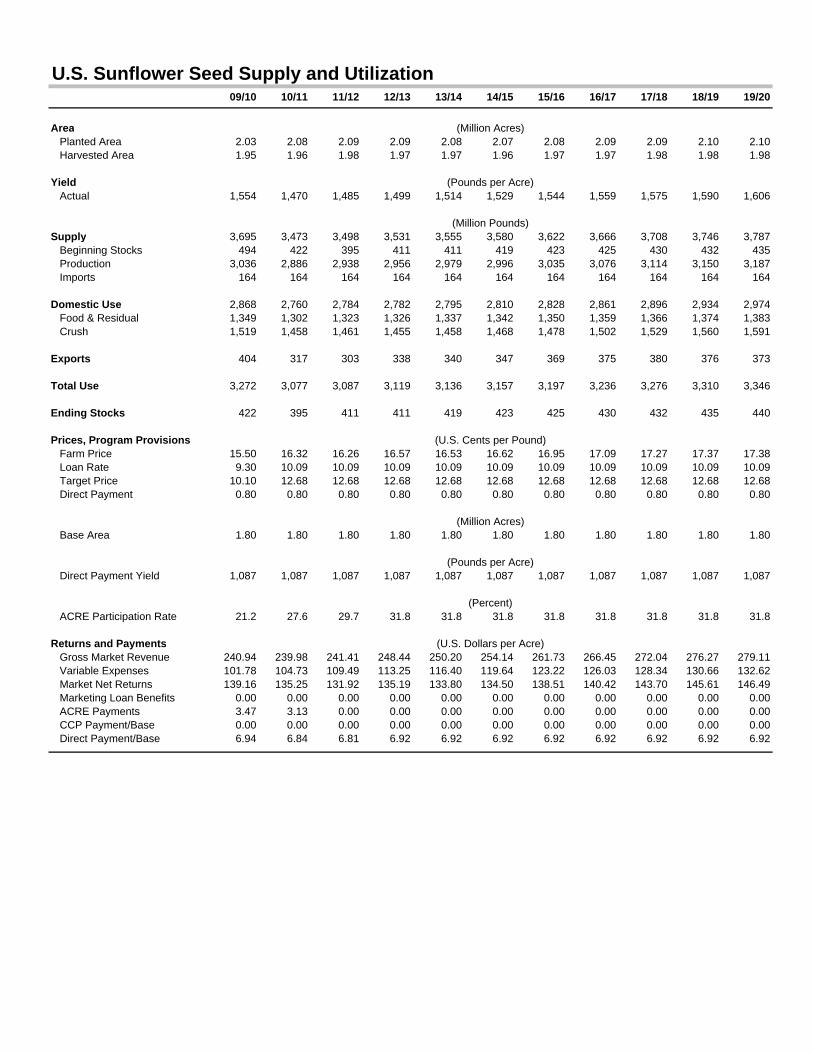
U.S. Sunflower Seed Supply and Utilization09/10 10/11 11/12 12/13 13/14 14/15 15/16 16/17 17/18 18/19 19/20
Area (Million Acres) Planted Area 2.03 2.08 2.09 2.09 2.08 2.07 2.08 2.09 2.09 2.10 2.10 Harvested Area 1.95 1.96 1.98 1.97 1.97 1.96 1.97 1.97 1.98 1.98 1.98
Yield (Pounds per Acre) Actual 1,554 1,470 1,485 1,499 1,514 1,529 1,544 1,559 1,575 1,590 1,606
(Million Pounds)Supply 3,695 3,473 3,498 3,531 3,555 3,580 3,622 3,666 3,708 3,746 3,787 Beginning Stocks 494 422 395 411 411 419 423 425 430 432 435 Production 3,036 2,886 2,938 2,956 2,979 2,996 3,035 3,076 3,114 3,150 3,187 Imports 164 164 164 164 164 164 164 164 164 164 164
Domestic Use 2,868 2,760 2,784 2,782 2,795 2,810 2,828 2,861 2,896 2,934 2,974 Food & Residual 1,349 1,302 1,323 1,326 1,337 1,342 1,350 1,359 1,366 1,374 1,383 Crush 1,519 1,458 1,461 1,455 1,458 1,468 1,478 1,502 1,529 1,560 1,591
Exports 404 317 303 338 340 347 369 375 380 376 373
Total Use 3,272 3,077 3,087 3,119 3,136 3,157 3,197 3,236 3,276 3,310 3,346
Ending Stocks 422 395 411 411 419 423 425 430 432 435 440
Prices, Program Provisions (U.S. Cents per Pound) Farm Price 15.50 16.32 16.26 16.57 16.53 16.62 16.95 17.09 17.27 17.37 17.38 Loan Rate 9.30 10.09 10.09 10.09 10.09 10.09 10.09 10.09 10.09 10.09 10.09 Target Price 10.10 12.68 12.68 12.68 12.68 12.68 12.68 12.68 12.68 12.68 12.68 Direct Payment 0.80 0.80 0.80 0.80 0.80 0.80 0.80 0.80 0.80 0.80 0.80
(Million Acres) Base Area 1.80 1.80 1.80 1.80 1.80 1.80 1.80 1.80 1.80 1.80 1.80
(Pounds per Acre) Direct Payment Yield 1,087 1,087 1,087 1,087 1,087 1,087 1,087 1,087 1,087 1,087 1,087
(Percent) ACRE Participation Rate 21.2 27.6 29.7 31.8 31.8 31.8 31.8 31.8 31.8 31.8 31.8
Returns and Payments (U.S. Dollars per Acre) Gross Market Revenue 240.94 239.98 241.41 248.44 250.20 254.14 261.73 266.45 272.04 276.27 279.11 Variable Expenses 101.78 104.73 109.49 113.25 116.40 119.64 123.22 126.03 128.34 130.66 132.62 Market Net Returns 139.16 135.25 131.92 135.19 133.80 134.50 138.51 140.42 143.70 145.61 146.49 Marketing Loan Benefits 0.00 0.00 0.00 0.00 0.00 0.00 0.00 0.00 0.00 0.00 0.00 ACRE Payments 3.47 3.13 0.00 0.00 0.00 0.00 0.00 0.00 0.00 0.00 0.00 CCP Payment/Base 0.00 0.00 0.00 0.00 0.00 0.00 0.00 0.00 0.00 0.00 0.00 Direct Payment/Base 6.94 6.84 6.81 6.92 6.92 6.92 6.92 6.92 6.92 6.92 6.92
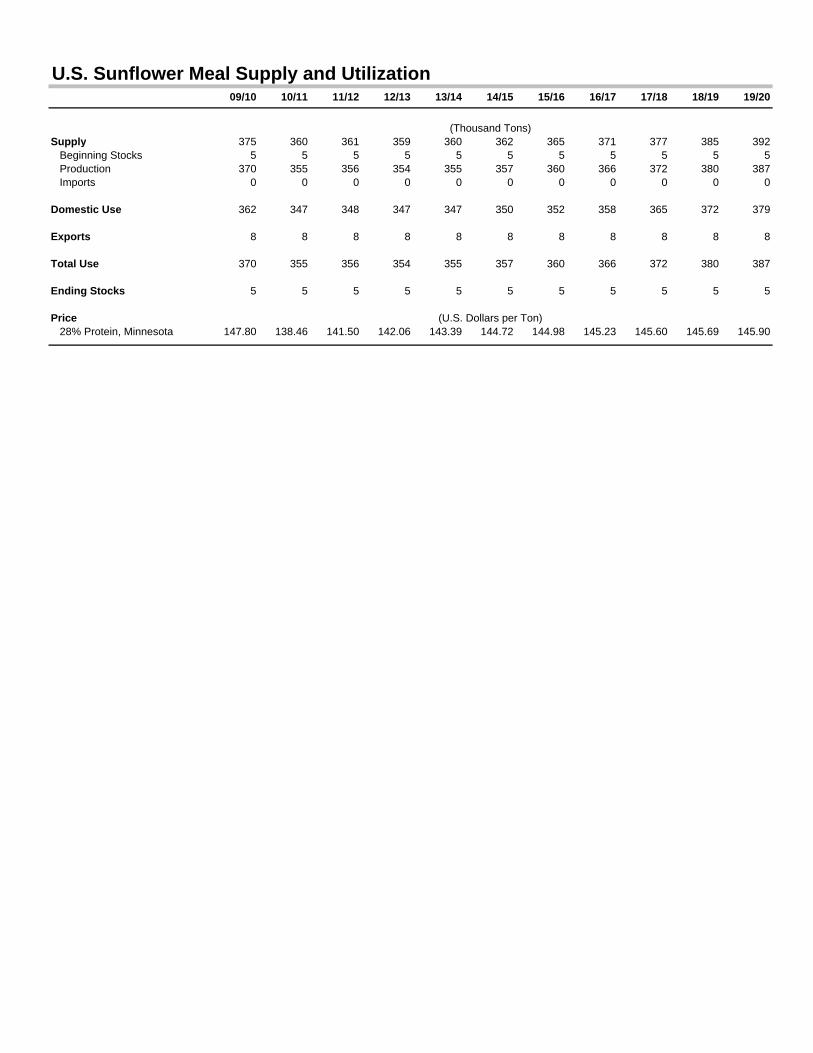
U.S. Sunflower Meal Supply and Utilization09/10 10/11 11/12 12/13 13/14 14/15 15/16 16/17 17/18 18/19 19/20
(Thousand Tons)Supply 375 360 361 359 360 362 365 371 377 385 392 Beginning Stocks 5 5 5 5 5 5 5 5 5 5 5 Production 370 355 356 354 355 357 360 366 372 380 387 Imports 0 0 0 0 0 0 0 0 0 0 0
Domestic Use 362 347 348 347 347 350 352 358 365 372 379
Exports 8 8 8 8 8 8 8 8 8 8 8
Total Use 370 355 356 354 355 357 360 366 372 380 387
Ending Stocks 5 5 5 5 5 5 5 5 5 5 5
Price (U.S. Dollars per Ton) 28% Protein, Minnesota 147.80 138.46 141.50 142.06 143.39 144.72 144.98 145.23 145.60 145.69 145.90
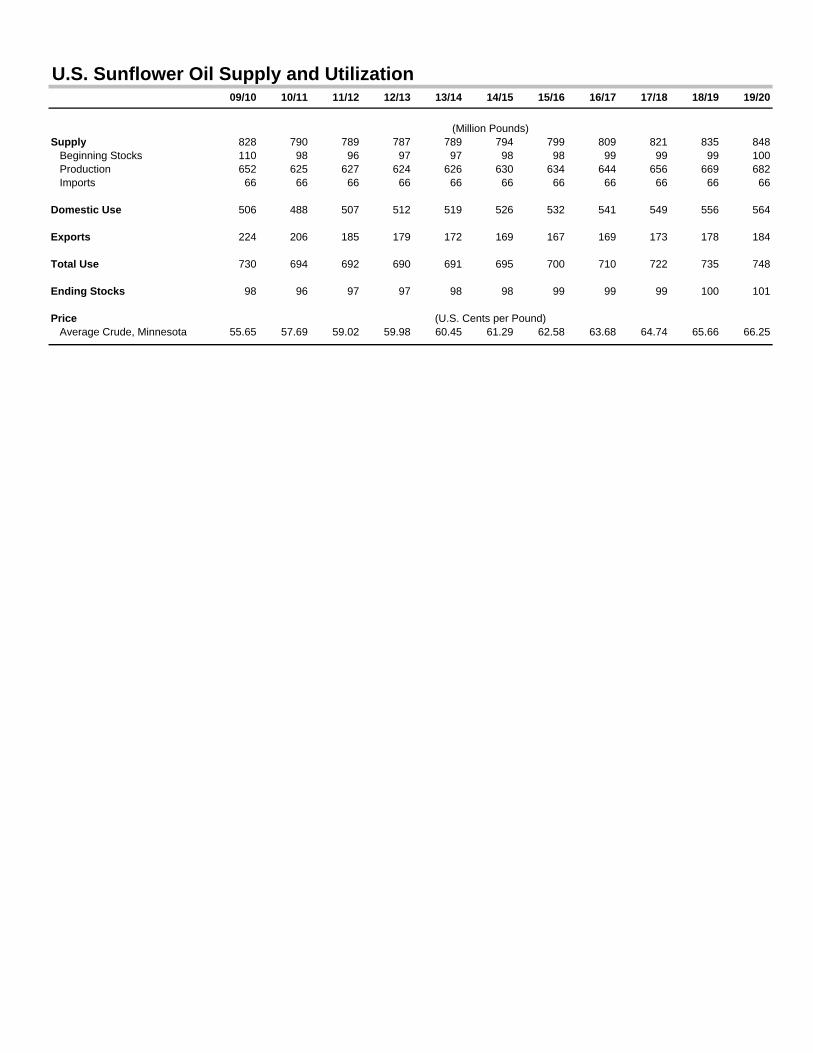
U.S. Sunflower Oil Supply and Utilization09/10 10/11 11/12 12/13 13/14 14/15 15/16 16/17 17/18 18/19 19/20
(Million Pounds)Supply 828 790 789 787 789 794 799 809 821 835 848 Beginning Stocks 110 98 96 97 97 98 98 99 99 99 100 Production 652 625 627 624 626 630 634 644 656 669 682 Imports 66 66 66 66 66 66 66 66 66 66 66
Domestic Use 506 488 507 512 519 526 532 541 549 556 564
Exports 224 206 185 179 172 169 167 169 173 178 184
Total Use 730 694 692 690 691 695 700 710 722 735 748
Ending Stocks 98 96 97 97 98 98 99 99 99 100 101
Price (U.S. Cents per Pound) Average Crude, Minnesota 55.65 57.69 59.02 59.98 60.45 61.29 62.58 63.68 64.74 65.66 66.25
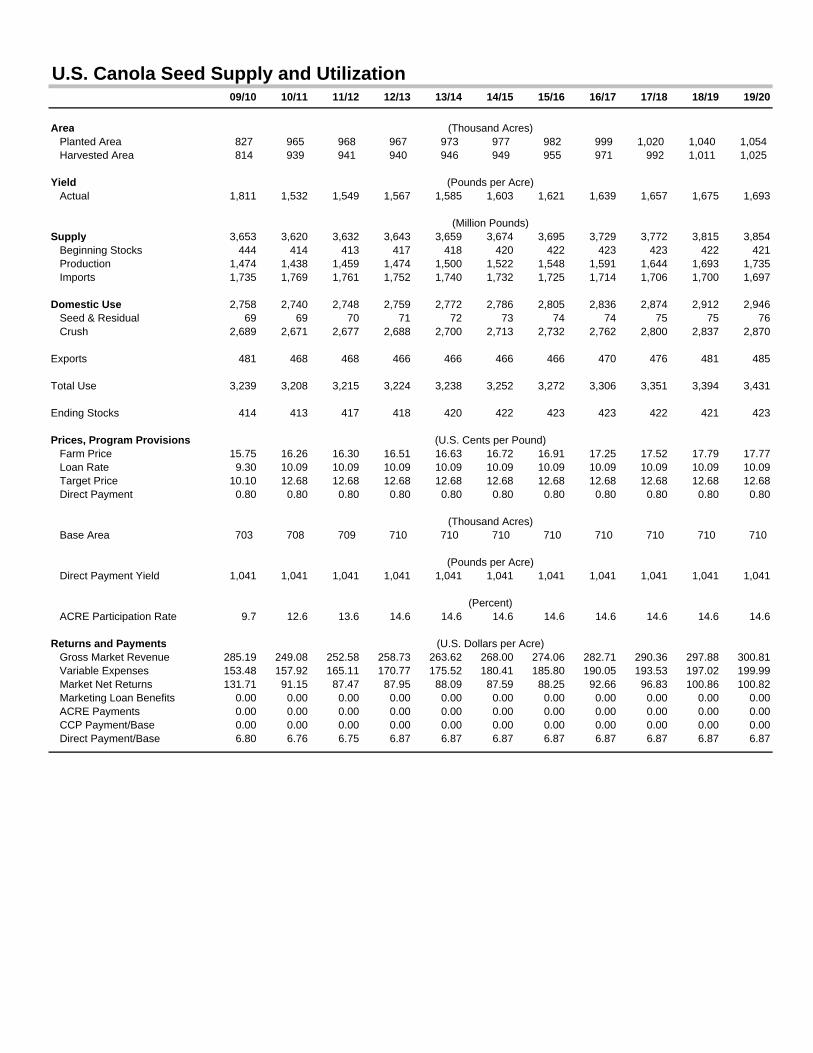
U.S. Canola Seed Supply and Utilization09/10 10/11 11/12 12/13 13/14 14/15 15/16 16/17 17/18 18/19 19/20
Area (Thousand Acres) Planted Area 827 965 968 967 973 977 982 999 1,020 1,040 1,054 Harvested Area 814 939 941 940 946 949 955 971 992 1,011 1,025
Yield (Pounds per Acre) Actual 1,811 1,532 1,549 1,567 1,585 1,603 1,621 1,639 1,657 1,675 1,693
(Million Pounds)Supply 3,653 3,620 3,632 3,643 3,659 3,674 3,695 3,729 3,772 3,815 3,854 Beginning Stocks 444 414 413 417 418 420 422 423 423 422 421 Production 1,474 1,438 1,459 1,474 1,500 1,522 1,548 1,591 1,644 1,693 1,735 Imports 1,735 1,769 1,761 1,752 1,740 1,732 1,725 1,714 1,706 1,700 1,697
Domestic Use 2,758 2,740 2,748 2,759 2,772 2,786 2,805 2,836 2,874 2,912 2,946 Seed & Residual 69 69 70 71 72 73 74 74 75 75 76 Crush 2,689 2,671 2,677 2,688 2,700 2,713 2,732 2,762 2,800 2,837 2,870
Exports 481 468 468 466 466 466 466 470 476 481 485
Total Use 3,239 3,208 3,215 3,224 3,238 3,252 3,272 3,306 3,351 3,394 3,431
Ending Stocks 414 413 417 418 420 422 423 423 422 421 423
Prices, Program Provisions (U.S. Cents per Pound) Farm Price 15.75 16.26 16.30 16.51 16.63 16.72 16.91 17.25 17.52 17.79 17.77 Loan Rate 9.30 10.09 10.09 10.09 10.09 10.09 10.09 10.09 10.09 10.09 10.09 Target Price 10.10 12.68 12.68 12.68 12.68 12.68 12.68 12.68 12.68 12.68 12.68 Direct Payment 0.80 0.80 0.80 0.80 0.80 0.80 0.80 0.80 0.80 0.80 0.80
(Thousand Acres) Base Area 703 708 709 710 710 710 710 710 710 710 710
(Pounds per Acre) Direct Payment Yield 1,041 1,041 1,041 1,041 1,041 1,041 1,041 1,041 1,041 1,041 1,041
(Percent) ACRE Participation Rate 9.7 12.6 13.6 14.6 14.6 14.6 14.6 14.6 14.6 14.6 14.6
Returns and Payments (U.S. Dollars per Acre) Gross Market Revenue 285.19 249.08 252.58 258.73 263.62 268.00 274.06 282.71 290.36 297.88 300.81 Variable Expenses 153.48 157.92 165.11 170.77 175.52 180.41 185.80 190.05 193.53 197.02 199.99 Market Net Returns 131.71 91.15 87.47 87.95 88.09 87.59 88.25 92.66 96.83 100.86 100.82 Marketing Loan Benefits 0.00 0.00 0.00 0.00 0.00 0.00 0.00 0.00 0.00 0.00 0.00 ACRE Payments 0.00 0.00 0.00 0.00 0.00 0.00 0.00 0.00 0.00 0.00 0.00 CCP Payment/Base 0.00 0.00 0.00 0.00 0.00 0.00 0.00 0.00 0.00 0.00 0.00 Direct Payment/Base 6.80 6.76 6.75 6.87 6.87 6.87 6.87 6.87 6.87 6.87 6.87
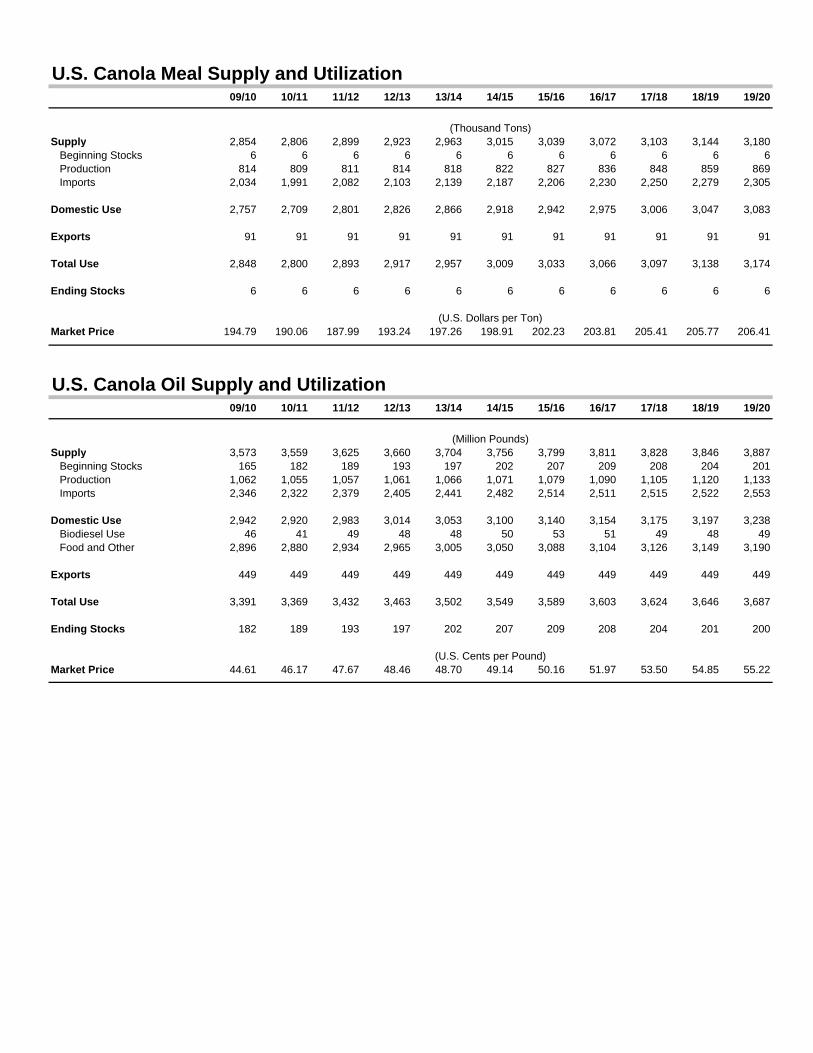
U.S. Canola Meal Supply and Utilization09/10 10/11 11/12 12/13 13/14 14/15 15/16 16/17 17/18 18/19 19/20
(Thousand Tons)Supply 2,854 2,806 2,899 2,923 2,963 3,015 3,039 3,072 3,103 3,144 3,180 Beginning Stocks 6 6 6 6 6 6 6 6 6 6 6 Production 814 809 811 814 818 822 827 836 848 859 869 Imports 2,034 1,991 2,082 2,103 2,139 2,187 2,206 2,230 2,250 2,279 2,305
Domestic Use 2,757 2,709 2,801 2,826 2,866 2,918 2,942 2,975 3,006 3,047 3,083
Exports 91 91 91 91 91 91 91 91 91 91 91
Total Use 2,848 2,800 2,893 2,917 2,957 3,009 3,033 3,066 3,097 3,138 3,174
Ending Stocks 6 6 6 6 6 6 6 6 6 6 6
(U.S. Dollars per Ton)Market Price 194.79 190.06 187.99 193.24 197.26 198.91 202.23 203.81 205.41 205.77 206.41
U.S. Canola Oil Supply and Utilization09/10 10/11 11/12 12/13 13/14 14/15 15/16 16/17 17/18 18/19 19/20
(Million Pounds)Supply 3,573 3,559 3,625 3,660 3,704 3,756 3,799 3,811 3,828 3,846 3,887 Beginning Stocks 165 182 189 193 197 202 207 209 208 204 201 Production 1,062 1,055 1,057 1,061 1,066 1,071 1,079 1,090 1,105 1,120 1,133 Imports 2,346 2,322 2,379 2,405 2,441 2,482 2,514 2,511 2,515 2,522 2,553
Domestic Use 2,942 2,920 2,983 3,014 3,053 3,100 3,140 3,154 3,175 3,197 3,238 Biodiesel Use 46 41 49 48 48 50 53 51 49 48 49 Food and Other 2,896 2,880 2,934 2,965 3,005 3,050 3,088 3,104 3,126 3,149 3,190
Exports 449 449 449 449 449 449 449 449 449 449 449
Total Use 3,391 3,369 3,432 3,463 3,502 3,549 3,589 3,603 3,624 3,646 3,687
Ending Stocks 182 189 193 197 202 207 209 208 204 201 200
(U.S. Cents per Pound)Market Price 44.61 46.17 47.67 48.46 48.70 49.14 50.16 51.97 53.50 54.85 55.22
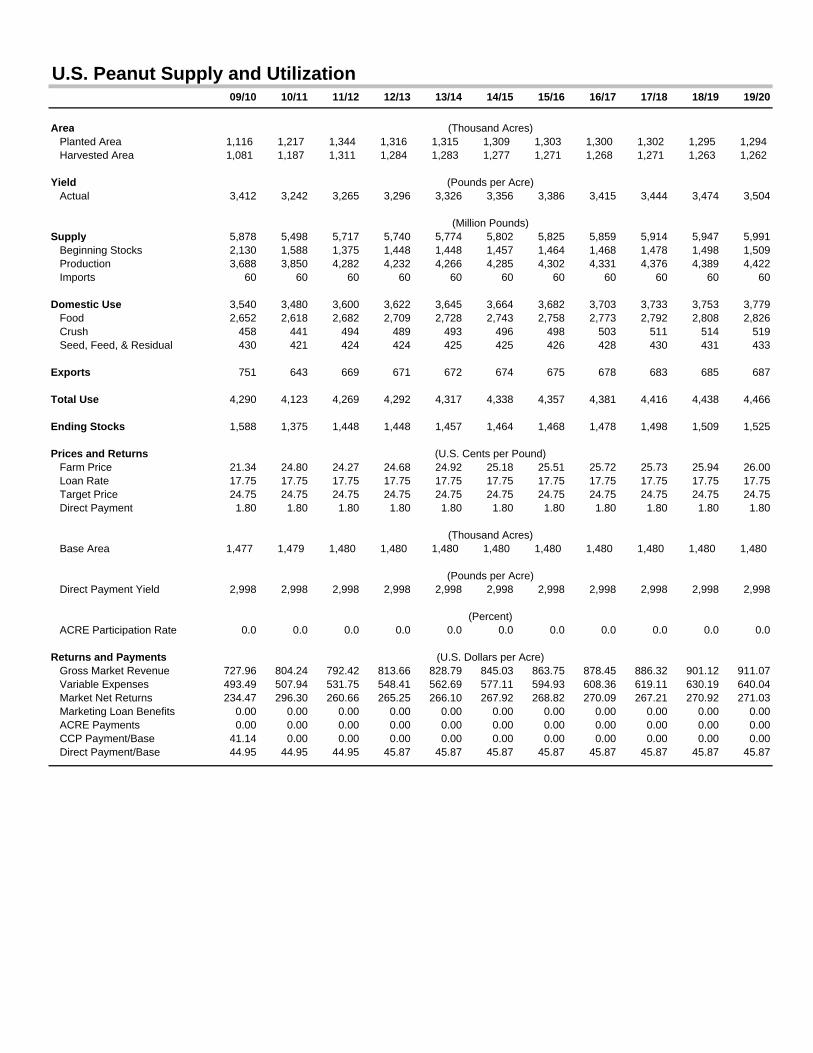
U.S. Peanut Supply and Utilization09/10 10/11 11/12 12/13 13/14 14/15 15/16 16/17 17/18 18/19 19/20
Area (Thousand Acres) Planted Area 1,116 1,217 1,344 1,316 1,315 1,309 1,303 1,300 1,302 1,295 1,294 Harvested Area 1,081 1,187 1,311 1,284 1,283 1,277 1,271 1,268 1,271 1,263 1,262
Yield (Pounds per Acre) Actual 3,412 3,242 3,265 3,296 3,326 3,356 3,386 3,415 3,444 3,474 3,504
(Million Pounds)Supply 5,878 5,498 5,717 5,740 5,774 5,802 5,825 5,859 5,914 5,947 5,991 Beginning Stocks 2,130 1,588 1,375 1,448 1,448 1,457 1,464 1,468 1,478 1,498 1,509 Production 3,688 3,850 4,282 4,232 4,266 4,285 4,302 4,331 4,376 4,389 4,422 Imports 60 60 60 60 60 60 60 60 60 60 60
Domestic Use 3,540 3,480 3,600 3,622 3,645 3,664 3,682 3,703 3,733 3,753 3,779 Food 2,652 2,618 2,682 2,709 2,728 2,743 2,758 2,773 2,792 2,808 2,826 Crush 458 441 494 489 493 496 498 503 511 514 519 Seed, Feed, & Residual 430 421 424 424 425 425 426 428 430 431 433
Exports 751 643 669 671 672 674 675 678 683 685 687
Total Use 4,290 4,123 4,269 4,292 4,317 4,338 4,357 4,381 4,416 4,438 4,466
Ending Stocks 1,588 1,375 1,448 1,448 1,457 1,464 1,468 1,478 1,498 1,509 1,525
Prices and Returns (U.S. Cents per Pound) Farm Price 21.34 24.80 24.27 24.68 24.92 25.18 25.51 25.72 25.73 25.94 26.00 Loan Rate 17.75 17.75 17.75 17.75 17.75 17.75 17.75 17.75 17.75 17.75 17.75 Target Price 24.75 24.75 24.75 24.75 24.75 24.75 24.75 24.75 24.75 24.75 24.75 Direct Payment 1.80 1.80 1.80 1.80 1.80 1.80 1.80 1.80 1.80 1.80 1.80
(Thousand Acres) Base Area 1,477 1,479 1,480 1,480 1,480 1,480 1,480 1,480 1,480 1,480 1,480
(Pounds per Acre) Direct Payment Yield 2,998 2,998 2,998 2,998 2,998 2,998 2,998 2,998 2,998 2,998 2,998
(Percent) ACRE Participation Rate 0.0 0.0 0.0 0.0 0.0 0.0 0.0 0.0 0.0 0.0 0.0
Returns and Payments (U.S. Dollars per Acre) Gross Market Revenue 727.96 804.24 792.42 813.66 828.79 845.03 863.75 878.45 886.32 901.12 911.07 Variable Expenses 493.49 507.94 531.75 548.41 562.69 577.11 594.93 608.36 619.11 630.19 640.04 Market Net Returns 234.47 296.30 260.66 265.25 266.10 267.92 268.82 270.09 267.21 270.92 271.03 Marketing Loan Benefits 0.00 0.00 0.00 0.00 0.00 0.00 0.00 0.00 0.00 0.00 0.00 ACRE Payments 0.00 0.00 0.00 0.00 0.00 0.00 0.00 0.00 0.00 0.00 0.00 CCP Payment/Base 41.14 0.00 0.00 0.00 0.00 0.00 0.00 0.00 0.00 0.00 0.00 Direct Payment/Base 44.95 44.95 44.95 45.87 45.87 45.87 45.87 45.87 45.87 45.87 45.87
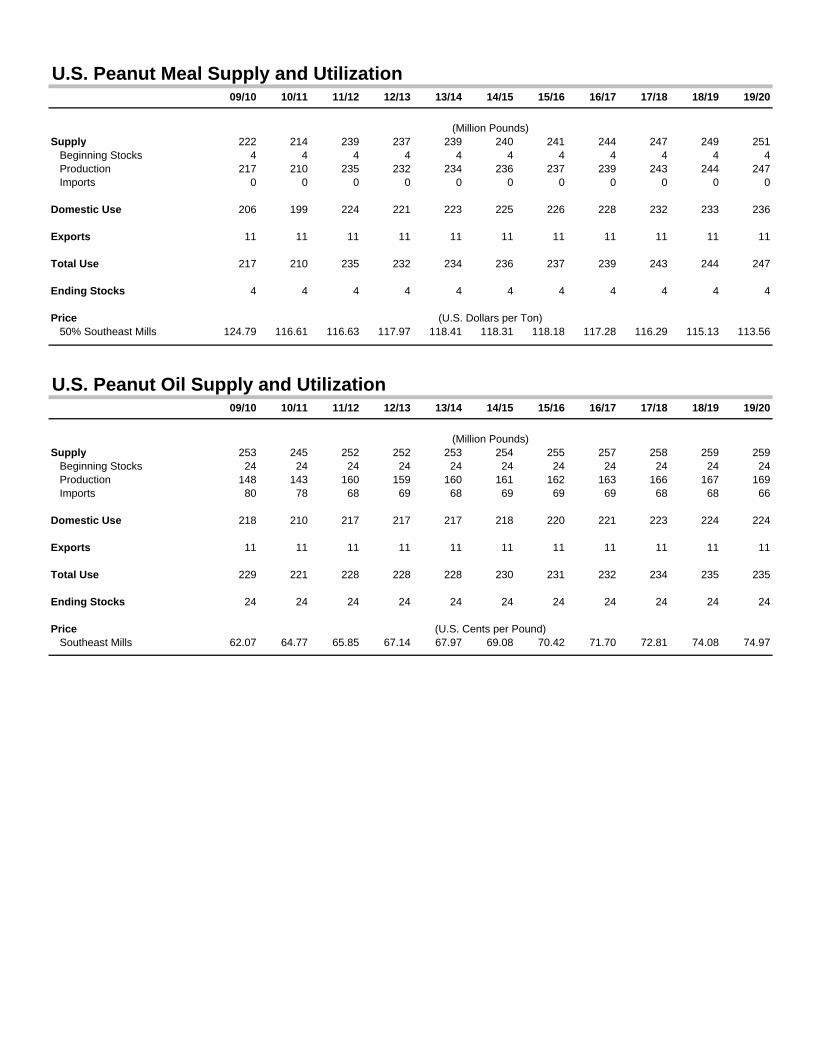
U.S. Peanut Meal Supply and Utilization09/10 10/11 11/12 12/13 13/14 14/15 15/16 16/17 17/18 18/19 19/20
(Million Pounds)Supply 222 214 239 237 239 240 241 244 247 249 251 Beginning Stocks 4 4 4 4 4 4 4 4 4 4 4 Production 217 210 235 232 234 236 237 239 243 244 247 Imports 0 0 0 0 0 0 0 0 0 0 0
Domestic Use 206 199 224 221 223 225 226 228 232 233 236
Exports 11 11 11 11 11 11 11 11 11 11 11
Total Use 217 210 235 232 234 236 237 239 243 244 247
Ending Stocks 4 4 4 4 4 4 4 4 4 4 4
Price (U.S. Dollars per Ton) 50% Southeast Mills 124.79 116.61 116.63 117.97 118.41 118.31 118.18 117.28 116.29 115.13 113.56
U.S. Peanut Oil Supply and Utilization09/10 10/11 11/12 12/13 13/14 14/15 15/16 16/17 17/18 18/19 19/20
(Million Pounds)Supply 253 245 252 252 253 254 255 257 258 259 259 Beginning Stocks 24 24 24 24 24 24 24 24 24 24 24 Production 148 143 160 159 160 161 162 163 166 167 169 Imports 80 78 68 69 68 69 69 69 68 68 66
Domestic Use 218 210 217 217 217 218 220 221 223 224 224
Exports 11 11 11 11 11 11 11 11 11 11 11
Total Use 229 221 228 228 228 230 231 232 234 235 235
Ending Stocks 24 24 24 24 24 24 24 24 24 24 24
Price (U.S. Cents per Pound) Southeast Mills 62.07 64.77 65.85 67.14 67.97 69.08 70.42 71.70 72.81 74.08 74.97
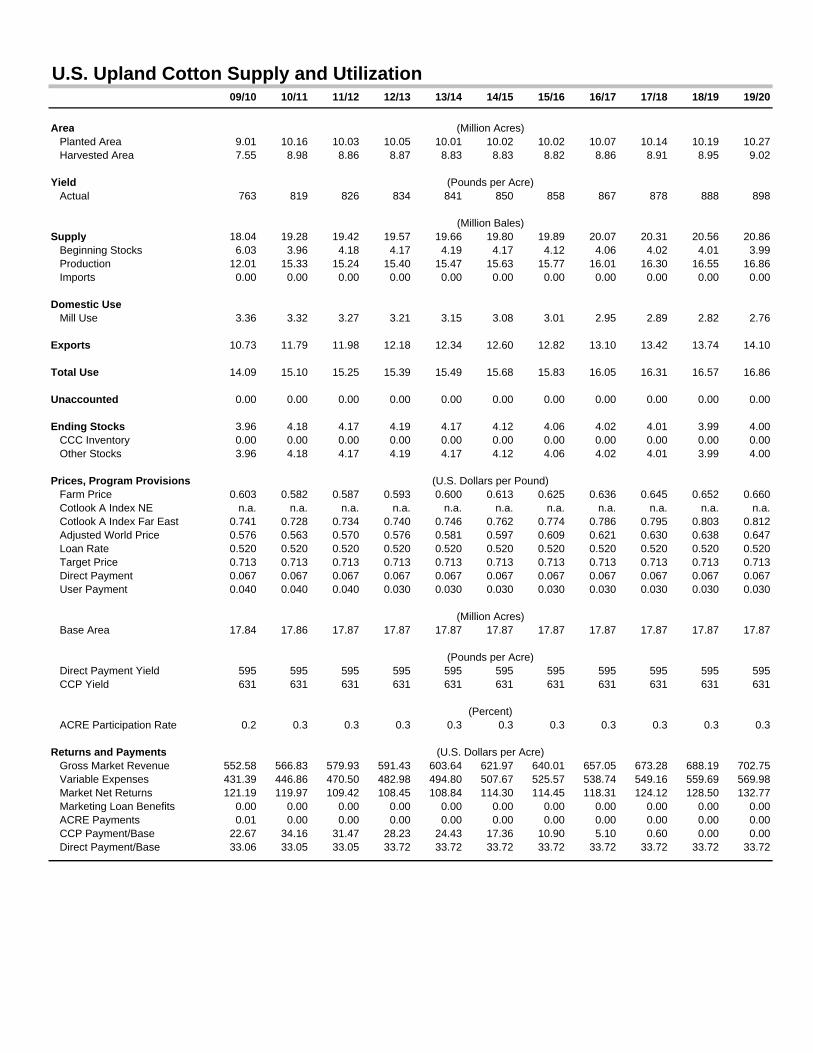
U.S. Upland Cotton Supply and Utilization09/10 10/11 11/12 12/13 13/14 14/15 15/16 16/17 17/18 18/19 19/20
Area (Million Acres) Planted Area 9.01 10.16 10.03 10.05 10.01 10.02 10.02 10.07 10.14 10.19 10.27 Harvested Area 7.55 8.98 8.86 8.87 8.83 8.83 8.82 8.86 8.91 8.95 9.02
Yield (Pounds per Acre) Actual 763 819 826 834 841 850 858 867 878 888 898
(Million Bales)Supply 18.04 19.28 19.42 19.57 19.66 19.80 19.89 20.07 20.31 20.56 20.86 Beginning Stocks 6.03 3.96 4.18 4.17 4.19 4.17 4.12 4.06 4.02 4.01 3.99 Production 12.01 15.33 15.24 15.40 15.47 15.63 15.77 16.01 16.30 16.55 16.86 Imports 0.00 0.00 0.00 0.00 0.00 0.00 0.00 0.00 0.00 0.00 0.00
Domestic Use Mill Use 3.36 3.32 3.27 3.21 3.15 3.08 3.01 2.95 2.89 2.82 2.76
Exports 10.73 11.79 11.98 12.18 12.34 12.60 12.82 13.10 13.42 13.74 14.10
Total Use 14.09 15.10 15.25 15.39 15.49 15.68 15.83 16.05 16.31 16.57 16.86
Unaccounted 0.00 0.00 0.00 0.00 0.00 0.00 0.00 0.00 0.00 0.00 0.00
Ending Stocks 3.96 4.18 4.17 4.19 4.17 4.12 4.06 4.02 4.01 3.99 4.00 CCC Inventory 0.00 0.00 0.00 0.00 0.00 0.00 0.00 0.00 0.00 0.00 0.00 Other Stocks 3.96 4.18 4.17 4.19 4.17 4.12 4.06 4.02 4.01 3.99 4.00
Prices, Program Provisions (U.S. Dollars per Pound) Farm Price 0.603 0.582 0.587 0.593 0.600 0.613 0.625 0.636 0.645 0.652 0.660 Cotlook A Index NE n.a. n.a. n.a. n.a. n.a. n.a. n.a. n.a. n.a. n.a. n.a. Cotlook A Index Far East 0.741 0.728 0.734 0.740 0.746 0.762 0.774 0.786 0.795 0.803 0.812 Adjusted World Price 0.576 0.563 0.570 0.576 0.581 0.597 0.609 0.621 0.630 0.638 0.647 Loan Rate 0.520 0.520 0.520 0.520 0.520 0.520 0.520 0.520 0.520 0.520 0.520 Target Price 0.713 0.713 0.713 0.713 0.713 0.713 0.713 0.713 0.713 0.713 0.713 Direct Payment 0.067 0.067 0.067 0.067 0.067 0.067 0.067 0.067 0.067 0.067 0.067 User Payment 0.040 0.040 0.040 0.030 0.030 0.030 0.030 0.030 0.030 0.030 0.030
(Million Acres) Base Area 17.84 17.86 17.87 17.87 17.87 17.87 17.87 17.87 17.87 17.87 17.87
(Pounds per Acre) Direct Payment Yield 595 595 595 595 595 595 595 595 595 595 595 CCP Yield 631 631 631 631 631 631 631 631 631 631 631
(Percent) ACRE Participation Rate 0.2 0.3 0.3 0.3 0.3 0.3 0.3 0.3 0.3 0.3 0.3
Returns and Payments (U.S. Dollars per Acre) Gross Market Revenue 552.58 566.83 579.93 591.43 603.64 621.97 640.01 657.05 673.28 688.19 702.75 Variable Expenses 431.39 446.86 470.50 482.98 494.80 507.67 525.57 538.74 549.16 559.69 569.98 Market Net Returns 121.19 119.97 109.42 108.45 108.84 114.30 114.45 118.31 124.12 128.50 132.77 Marketing Loan Benefits 0.00 0.00 0.00 0.00 0.00 0.00 0.00 0.00 0.00 0.00 0.00 ACRE Payments 0.01 0.00 0.00 0.00 0.00 0.00 0.00 0.00 0.00 0.00 0.00 CCP Payment/Base 22.67 34.16 31.47 28.23 24.43 17.36 10.90 5.10 0.60 0.00 0.00 Direct Payment/Base 33.06 33.05 33.05 33.72 33.72 33.72 33.72 33.72 33.72 33.72 33.72
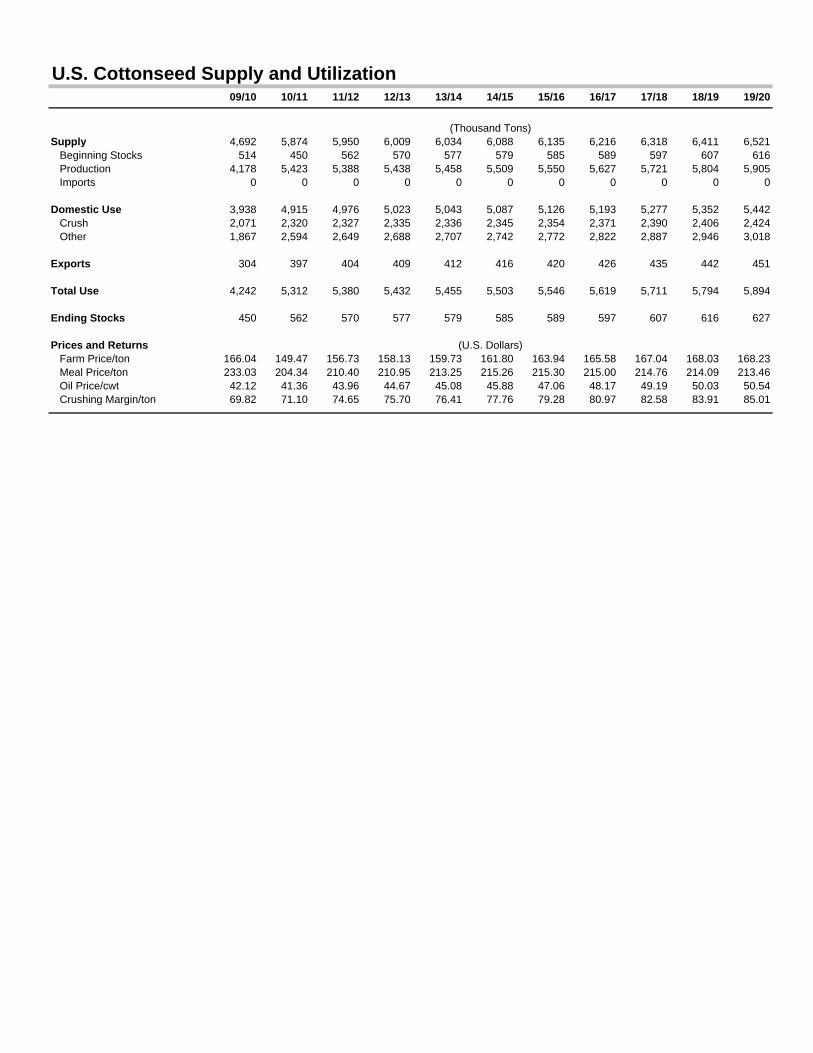
U.S. Cottonseed Supply and Utilization09/10 10/11 11/12 12/13 13/14 14/15 15/16 16/17 17/18 18/19 19/20
(Thousand Tons)Supply 4,692 5,874 5,950 6,009 6,034 6,088 6,135 6,216 6,318 6,411 6,521 Beginning Stocks 514 450 562 570 577 579 585 589 597 607 616 Production 4,178 5,423 5,388 5,438 5,458 5,509 5,550 5,627 5,721 5,804 5,905 Imports 0 0 0 0 0 0 0 0 0 0 0
Domestic Use 3,938 4,915 4,976 5,023 5,043 5,087 5,126 5,193 5,277 5,352 5,442 Crush 2,071 2,320 2,327 2,335 2,336 2,345 2,354 2,371 2,390 2,406 2,424 Other 1,867 2,594 2,649 2,688 2,707 2,742 2,772 2,822 2,887 2,946 3,018
Exports 304 397 404 409 412 416 420 426 435 442 451
Total Use 4,242 5,312 5,380 5,432 5,455 5,503 5,546 5,619 5,711 5,794 5,894
Ending Stocks 450 562 570 577 579 585 589 597 607 616 627
Prices and Returns (U.S. Dollars) Farm Price/ton 166.04 149.47 156.73 158.13 159.73 161.80 163.94 165.58 167.04 168.03 168.23 Meal Price/ton 233.03 204.34 210.40 210.95 213.25 215.26 215.30 215.00 214.76 214.09 213.46 Oil Price/cwt 42.12 41.36 43.96 44.67 45.08 45.88 47.06 48.17 49.19 50.03 50.54 Crushing Margin/ton 69.82 71.10 74.65 75.70 76.41 77.76 79.28 80.97 82.58 83.91 85.01
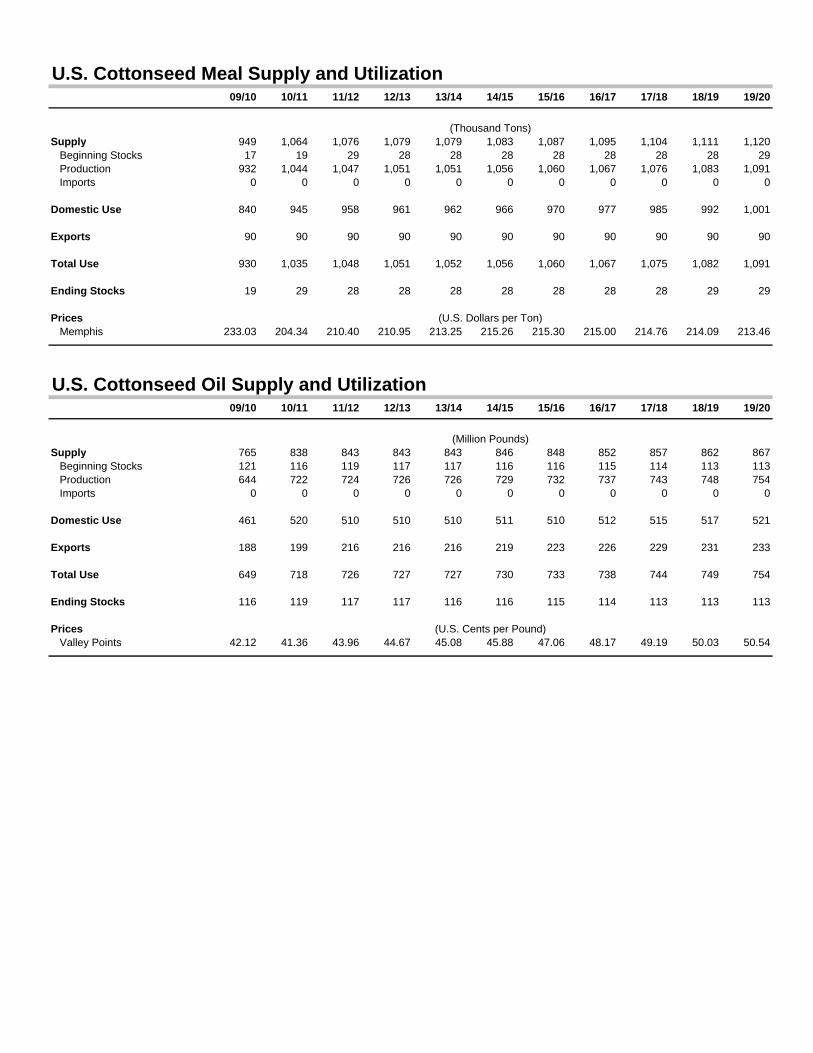
U.S. Cottonseed Meal Supply and Utilization09/10 10/11 11/12 12/13 13/14 14/15 15/16 16/17 17/18 18/19 19/20
(Thousand Tons)Supply 949 1,064 1,076 1,079 1,079 1,083 1,087 1,095 1,104 1,111 1,120 Beginning Stocks 17 19 29 28 28 28 28 28 28 28 29 Production 932 1,044 1,047 1,051 1,051 1,056 1,060 1,067 1,076 1,083 1,091 Imports 0 0 0 0 0 0 0 0 0 0 0
Domestic Use 840 945 958 961 962 966 970 977 985 992 1,001
Exports 90 90 90 90 90 90 90 90 90 90 90
Total Use 930 1,035 1,048 1,051 1,052 1,056 1,060 1,067 1,075 1,082 1,091
Ending Stocks 19 29 28 28 28 28 28 28 28 29 29
Prices (U.S. Dollars per Ton) Memphis 233.03 204.34 210.40 210.95 213.25 215.26 215.30 215.00 214.76 214.09 213.46
U.S. Cottonseed Oil Supply and Utilization09/10 10/11 11/12 12/13 13/14 14/15 15/16 16/17 17/18 18/19 19/20
(Million Pounds)Supply 765 838 843 843 843 846 848 852 857 862 867 Beginning Stocks 121 116 119 117 117 116 116 115 114 113 113 Production 644 722 724 726 726 729 732 737 743 748 754 Imports 0 0 0 0 0 0 0 0 0 0 0
Domestic Use 461 520 510 510 510 511 510 512 515 517 521
Exports 188 199 216 216 216 219 223 226 229 231 233
Total Use 649 718 726 727 727 730 733 738 744 749 754
Ending Stocks 116 119 117 117 116 116 115 114 113 113 113
Prices (U.S. Cents per Pound) Valley Points 42.12 41.36 43.96 44.67 45.08 45.88 47.06 48.17 49.19 50.03 50.54
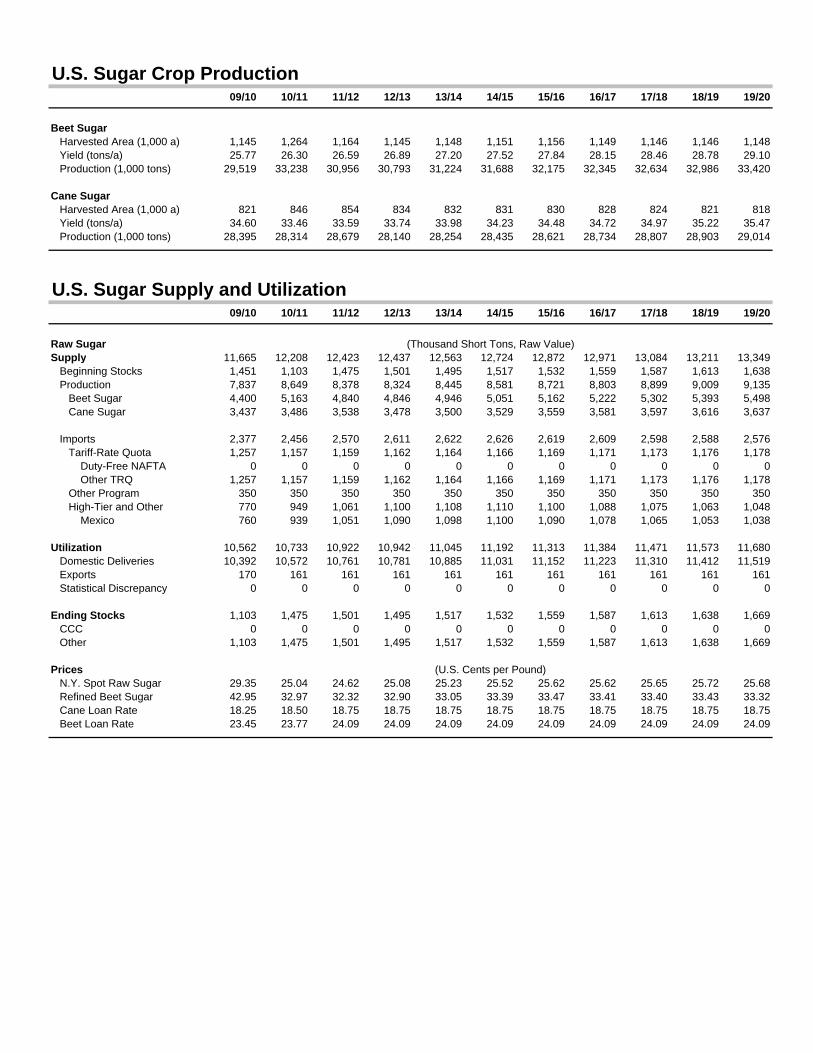
U.S. Sugar Crop Production09/10 10/11 11/12 12/13 13/14 14/15 15/16 16/17 17/18 18/19 19/20
Beet Sugar Harvested Area (1,000 a) 1,145 1,264 1,164 1,145 1,148 1,151 1,156 1,149 1,146 1,146 1,148 Yield (tons/a) 25.77 26.30 26.59 26.89 27.20 27.52 27.84 28.15 28.46 28.78 29.10 Production (1,000 tons) 29,519 33,238 30,956 30,793 31,224 31,688 32,175 32,345 32,634 32,986 33,420
Cane Sugar Harvested Area (1,000 a) 821 846 854 834 832 831 830 828 824 821 818 Yield (tons/a) 34.60 33.46 33.59 33.74 33.98 34.23 34.48 34.72 34.97 35.22 35.47 Production (1,000 tons) 28,395 28,314 28,679 28,140 28,254 28,435 28,621 28,734 28,807 28,903 29,014
U.S. Sugar Supply and Utilization09/10 10/11 11/12 12/13 13/14 14/15 15/16 16/17 17/18 18/19 19/20
Raw Sugar (Thousand Short Tons, Raw Value)Supply 11,665 12,208 12,423 12,437 12,563 12,724 12,872 12,971 13,084 13,211 13,349 Beginning Stocks 1,451 1,103 1,475 1,501 1,495 1,517 1,532 1,559 1,587 1,613 1,638 Production 7,837 8,649 8,378 8,324 8,445 8,581 8,721 8,803 8,899 9,009 9,135 Beet Sugar 4,400 5,163 4,840 4,846 4,946 5,051 5,162 5,222 5,302 5,393 5,498 Cane Sugar 3,437 3,486 3,538 3,478 3,500 3,529 3,559 3,581 3,597 3,616 3,637
Imports 2,377 2,456 2,570 2,611 2,622 2,626 2,619 2,609 2,598 2,588 2,576 Tariff-Rate Quota 1,257 1,157 1,159 1,162 1,164 1,166 1,169 1,171 1,173 1,176 1,178 Duty-Free NAFTA 0 0 0 0 0 0 0 0 0 0 0 Other TRQ 1,257 1,157 1,159 1,162 1,164 1,166 1,169 1,171 1,173 1,176 1,178 Other Program 350 350 350 350 350 350 350 350 350 350 350 High-Tier and Other 770 949 1,061 1,100 1,108 1,110 1,100 1,088 1,075 1,063 1,048 Mexico 760 939 1,051 1,090 1,098 1,100 1,090 1,078 1,065 1,053 1,038 Utilization 10,562 10,733 10,922 10,942 11,045 11,192 11,313 11,384 11,471 11,573 11,680 Domestic Deliveries 10,392 10,572 10,761 10,781 10,885 11,031 11,152 11,223 11,310 11,412 11,519 Exports 170 161 161 161 161 161 161 161 161 161 161 Statistical Discrepancy 0 0 0 0 0 0 0 0 0 0 0
Ending Stocks 1,103 1,475 1,501 1,495 1,517 1,532 1,559 1,587 1,613 1,638 1,669 CCC 0 0 0 0 0 0 0 0 0 0 0 Other 1,103 1,475 1,501 1,495 1,517 1,532 1,559 1,587 1,613 1,638 1,669
Prices (U.S. Cents per Pound) N.Y. Spot Raw Sugar 29.35 25.04 24.62 25.08 25.23 25.52 25.62 25.62 25.65 25.72 25.68 Refined Beet Sugar 42.95 32.97 32.32 32.90 33.05 33.39 33.47 33.41 33.40 33.43 33.32 Cane Loan Rate 18.25 18.50 18.75 18.75 18.75 18.75 18.75 18.75 18.75 18.75 18.75 Beet Loan Rate 23.45 23.77 24.09 24.09 24.09 24.09 24.09 24.09 24.09 24.09 24.09
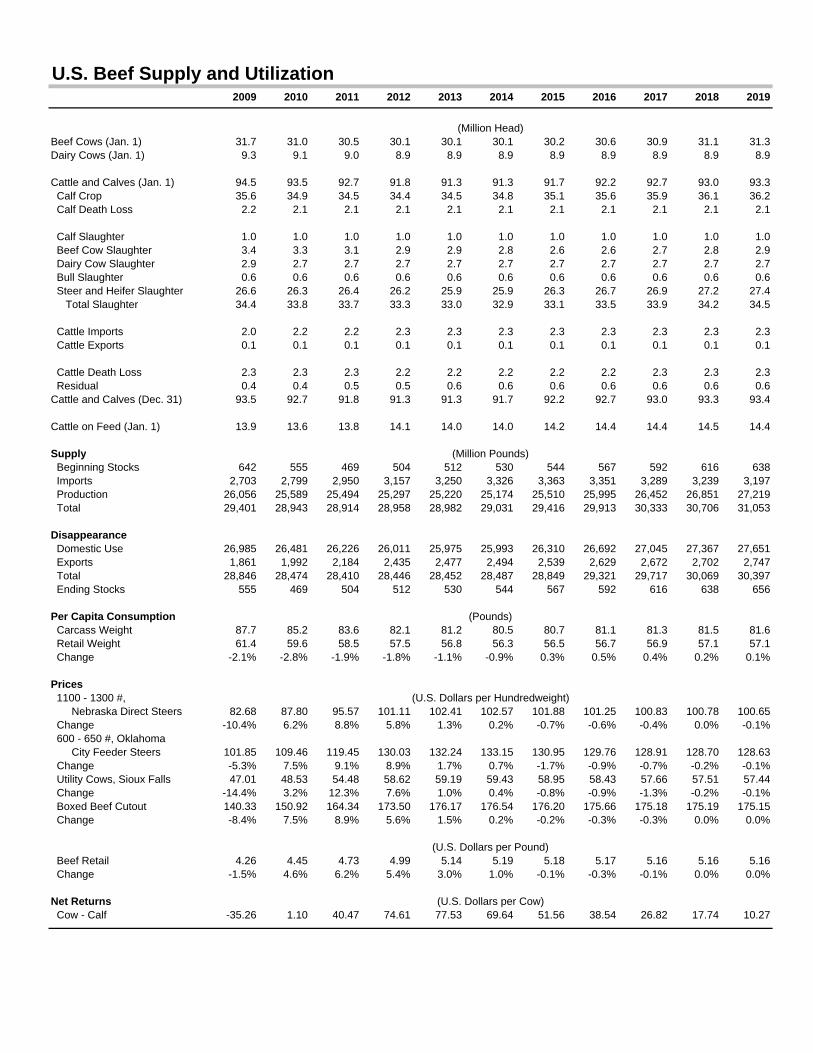
U.S. Beef Supply and Utilization2009 2010 2011 2012 2013 2014 2015 2016 2017 2018 2019
(Million Head)Beef Cows (Jan. 1) 31.7 31.0 30.5 30.1 30.1 30.1 30.2 30.6 30.9 31.1 31.3Dairy Cows (Jan. 1) 9.3 9.1 9.0 8.9 8.9 8.9 8.9 8.9 8.9 8.9 8.9
Cattle and Calves (Jan. 1) 94.5 93.5 92.7 91.8 91.3 91.3 91.7 92.2 92.7 93.0 93.3 Calf Crop 35.6 34.9 34.5 34.4 34.5 34.8 35.1 35.6 35.9 36.1 36.2 Calf Death Loss 2.2 2.1 2.1 2.1 2.1 2.1 2.1 2.1 2.1 2.1 2.1
Calf Slaughter 1.0 1.0 1.0 1.0 1.0 1.0 1.0 1.0 1.0 1.0 1.0 Beef Cow Slaughter 3.4 3.3 3.1 2.9 2.9 2.8 2.6 2.6 2.7 2.8 2.9 Dairy Cow Slaughter 2.9 2.7 2.7 2.7 2.7 2.7 2.7 2.7 2.7 2.7 2.7 Bull Slaughter 0.6 0.6 0.6 0.6 0.6 0.6 0.6 0.6 0.6 0.6 0.6 Steer and Heifer Slaughter 26.6 26.3 26.4 26.2 25.9 25.9 26.3 26.7 26.9 27.2 27.4 Total Slaughter 34.4 33.8 33.7 33.3 33.0 32.9 33.1 33.5 33.9 34.2 34.5
Cattle Imports 2.0 2.2 2.2 2.3 2.3 2.3 2.3 2.3 2.3 2.3 2.3 Cattle Exports 0.1 0.1 0.1 0.1 0.1 0.1 0.1 0.1 0.1 0.1 0.1
Cattle Death Loss 2.3 2.3 2.3 2.2 2.2 2.2 2.2 2.2 2.3 2.3 2.3 Residual 0.4 0.4 0.5 0.5 0.6 0.6 0.6 0.6 0.6 0.6 0.6Cattle and Calves (Dec. 31) 93.5 92.7 91.8 91.3 91.3 91.7 92.2 92.7 93.0 93.3 93.4
Cattle on Feed (Jan. 1) 13.9 13.6 13.8 14.1 14.0 14.0 14.2 14.4 14.4 14.5 14.4
Supply (Million Pounds) Beginning Stocks 642 555 469 504 512 530 544 567 592 616 638 Imports 2,703 2,799 2,950 3,157 3,250 3,326 3,363 3,351 3,289 3,239 3,197 Production 26,056 25,589 25,494 25,297 25,220 25,174 25,510 25,995 26,452 26,851 27,219 Total 29,401 28,943 28,914 28,958 28,982 29,031 29,416 29,913 30,333 30,706 31,053
Disappearance Domestic Use 26,985 26,481 26,226 26,011 25,975 25,993 26,310 26,692 27,045 27,367 27,651 Exports 1,861 1,992 2,184 2,435 2,477 2,494 2,539 2,629 2,672 2,702 2,747 Total 28,846 28,474 28,410 28,446 28,452 28,487 28,849 29,321 29,717 30,069 30,397 Ending Stocks 555 469 504 512 530 544 567 592 616 638 656
Per Capita Consumption (Pounds) Carcass Weight 87.7 85.2 83.6 82.1 81.2 80.5 80.7 81.1 81.3 81.5 81.6 Retail Weight 61.4 59.6 58.5 57.5 56.8 56.3 56.5 56.7 56.9 57.1 57.1 Change -2.1% -2.8% -1.9% -1.8% -1.1% -0.9% 0.3% 0.5% 0.4% 0.2% 0.1%
Prices 1100 - 1300 #, (U.S. Dollars per Hundredweight) Nebraska Direct Steers 82.68 87.80 95.57 101.11 102.41 102.57 101.88 101.25 100.83 100.78 100.65 Change -10.4% 6.2% 8.8% 5.8% 1.3% 0.2% -0.7% -0.6% -0.4% 0.0% -0.1% 600 - 650 #, Oklahoma City Feeder Steers 101.85 109.46 119.45 130.03 132.24 133.15 130.95 129.76 128.91 128.70 128.63 Change -5.3% 7.5% 9.1% 8.9% 1.7% 0.7% -1.7% -0.9% -0.7% -0.2% -0.1% Utility Cows, Sioux Falls 47.01 48.53 54.48 58.62 59.19 59.43 58.95 58.43 57.66 57.51 57.44 Change -14.4% 3.2% 12.3% 7.6% 1.0% 0.4% -0.8% -0.9% -1.3% -0.2% -0.1% Boxed Beef Cutout 140.33 150.92 164.34 173.50 176.17 176.54 176.20 175.66 175.18 175.19 175.15 Change -8.4% 7.5% 8.9% 5.6% 1.5% 0.2% -0.2% -0.3% -0.3% 0.0% 0.0%
(U.S. Dollars per Pound) Beef Retail 4.26 4.45 4.73 4.99 5.14 5.19 5.18 5.17 5.16 5.16 5.16 Change -1.5% 4.6% 6.2% 5.4% 3.0% 1.0% -0.1% -0.3% -0.1% 0.0% 0.0%
Net Returns (U.S. Dollars per Cow) Cow - Calf -35.26 1.10 40.47 74.61 77.53 69.64 51.56 38.54 26.82 17.74 10.27
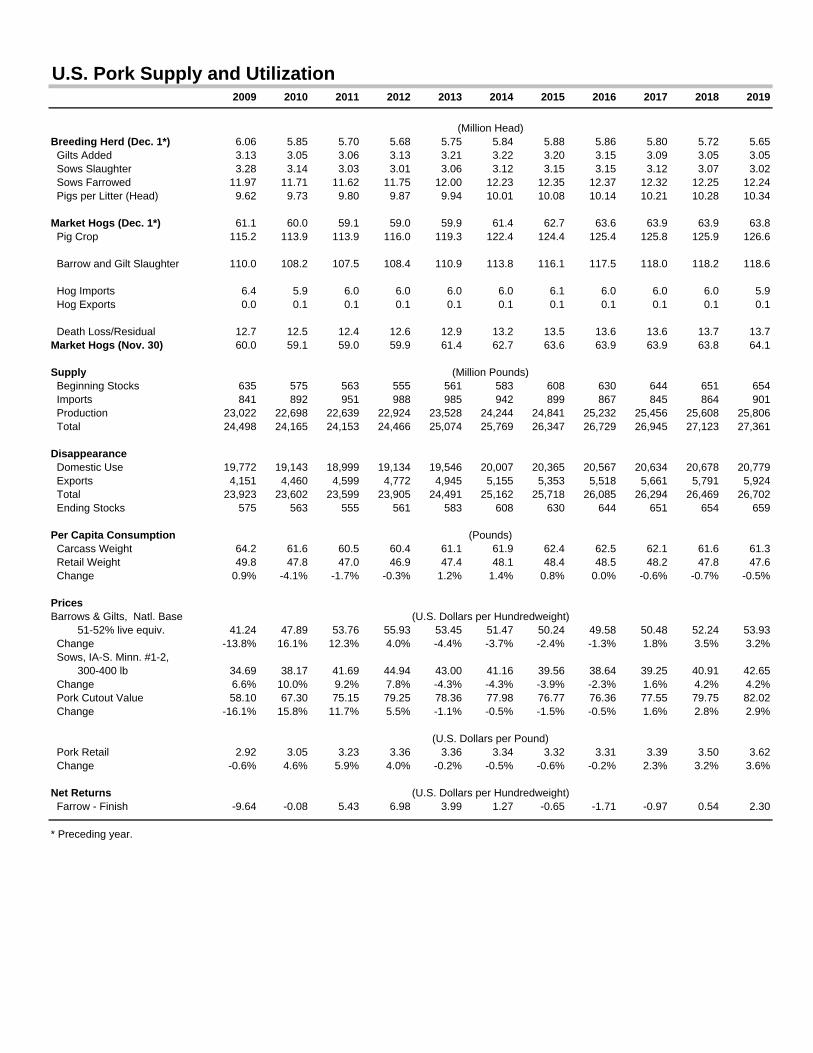
U.S. Pork Supply and Utilization2009 2010 2011 2012 2013 2014 2015 2016 2017 2018 2019
(Million Head)Breeding Herd (Dec. 1*) 6.06 5.85 5.70 5.68 5.75 5.84 5.88 5.86 5.80 5.72 5.65 Gilts Added 3.13 3.05 3.06 3.13 3.21 3.22 3.20 3.15 3.09 3.05 3.05 Sows Slaughter 3.28 3.14 3.03 3.01 3.06 3.12 3.15 3.15 3.12 3.07 3.02 Sows Farrowed 11.97 11.71 11.62 11.75 12.00 12.23 12.35 12.37 12.32 12.25 12.24 Pigs per Litter (Head) 9.62 9.73 9.80 9.87 9.94 10.01 10.08 10.14 10.21 10.28 10.34
Market Hogs (Dec. 1*) 61.1 60.0 59.1 59.0 59.9 61.4 62.7 63.6 63.9 63.9 63.8 Pig Crop 115.2 113.9 113.9 116.0 119.3 122.4 124.4 125.4 125.8 125.9 126.6
Barrow and Gilt Slaughter 110.0 108.2 107.5 108.4 110.9 113.8 116.1 117.5 118.0 118.2 118.6
Hog Imports 6.4 5.9 6.0 6.0 6.0 6.0 6.1 6.0 6.0 6.0 5.9 Hog Exports 0.0 0.1 0.1 0.1 0.1 0.1 0.1 0.1 0.1 0.1 0.1
Death Loss/Residual 12.7 12.5 12.4 12.6 12.9 13.2 13.5 13.6 13.6 13.7 13.7Market Hogs (Nov. 30) 60.0 59.1 59.0 59.9 61.4 62.7 63.6 63.9 63.9 63.8 64.1
Supply (Million Pounds) Beginning Stocks 635 575 563 555 561 583 608 630 644 651 654 Imports 841 892 951 988 985 942 899 867 845 864 901 Production 23,022 22,698 22,639 22,924 23,528 24,244 24,841 25,232 25,456 25,608 25,806 Total 24,498 24,165 24,153 24,466 25,074 25,769 26,347 26,729 26,945 27,123 27,361
Disappearance Domestic Use 19,772 19,143 18,999 19,134 19,546 20,007 20,365 20,567 20,634 20,678 20,779 Exports 4,151 4,460 4,599 4,772 4,945 5,155 5,353 5,518 5,661 5,791 5,924 Total 23,923 23,602 23,599 23,905 24,491 25,162 25,718 26,085 26,294 26,469 26,702 Ending Stocks 575 563 555 561 583 608 630 644 651 654 659
Per Capita Consumption (Pounds) Carcass Weight 64.2 61.6 60.5 60.4 61.1 61.9 62.4 62.5 62.1 61.6 61.3 Retail Weight 49.8 47.8 47.0 46.9 47.4 48.1 48.4 48.5 48.2 47.8 47.6 Change 0.9% -4.1% -1.7% -0.3% 1.2% 1.4% 0.8% 0.0% -0.6% -0.7% -0.5%
PricesBarrows & Gilts, Natl. Base (U.S. Dollars per Hundredweight) 51-52% live equiv. 41.24 47.89 53.76 55.93 53.45 51.47 50.24 49.58 50.48 52.24 53.93 Change -13.8% 16.1% 12.3% 4.0% -4.4% -3.7% -2.4% -1.3% 1.8% 3.5% 3.2% Sows, IA-S. Minn. #1-2, 300-400 lb 34.69 38.17 41.69 44.94 43.00 41.16 39.56 38.64 39.25 40.91 42.65 Change 6.6% 10.0% 9.2% 7.8% -4.3% -4.3% -3.9% -2.3% 1.6% 4.2% 4.2% Pork Cutout Value 58.10 67.30 75.15 79.25 78.36 77.98 76.77 76.36 77.55 79.75 82.02 Change -16.1% 15.8% 11.7% 5.5% -1.1% -0.5% -1.5% -0.5% 1.6% 2.8% 2.9%
(U.S. Dollars per Pound) Pork Retail 2.92 3.05 3.23 3.36 3.36 3.34 3.32 3.31 3.39 3.50 3.62 Change -0.6% 4.6% 5.9% 4.0% -0.2% -0.5% -0.6% -0.2% 2.3% 3.2% 3.6%
Net Returns (U.S. Dollars per Hundredweight) Farrow - Finish -9.64 -0.08 5.43 6.98 3.99 1.27 -0.65 -1.71 -0.97 0.54 2.30
* Preceding year.
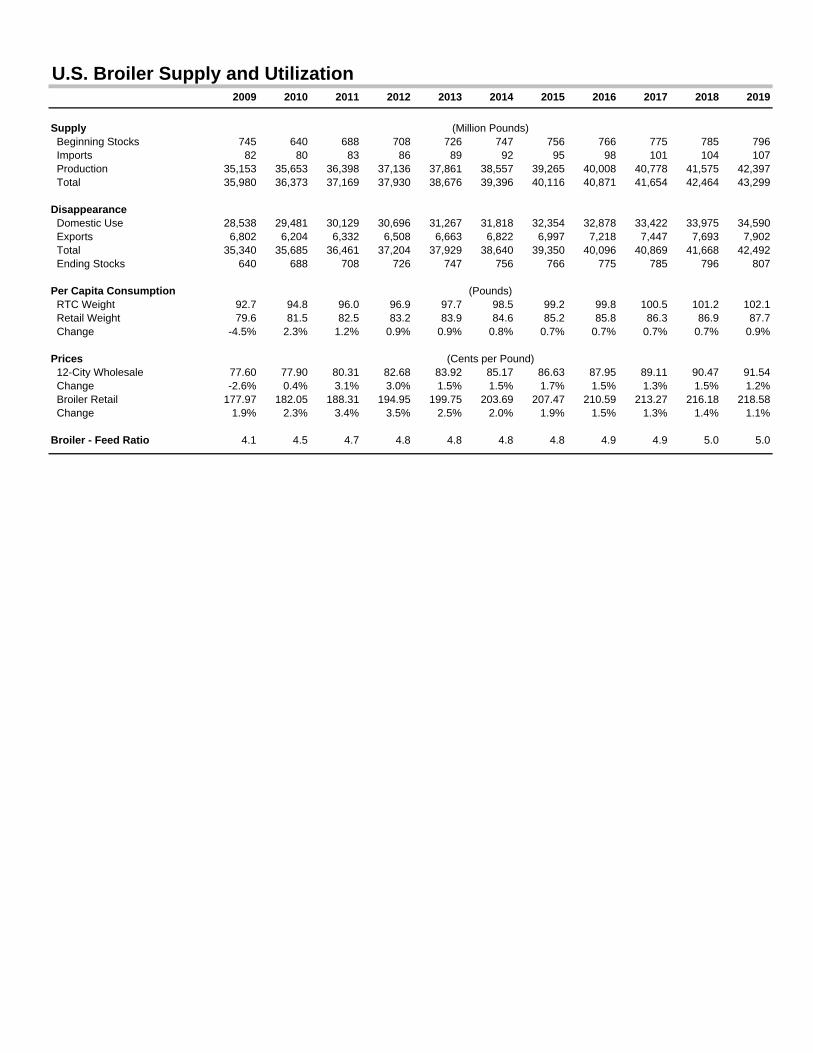
U.S. Broiler Supply and Utilization2009 2010 2011 2012 2013 2014 2015 2016 2017 2018 2019
Supply (Million Pounds) Beginning Stocks 745 640 688 708 726 747 756 766 775 785 796 Imports 82 80 83 86 89 92 95 98 101 104 107 Production 35,153 35,653 36,398 37,136 37,861 38,557 39,265 40,008 40,778 41,575 42,397 Total 35,980 36,373 37,169 37,930 38,676 39,396 40,116 40,871 41,654 42,464 43,299
Disappearance Domestic Use 28,538 29,481 30,129 30,696 31,267 31,818 32,354 32,878 33,422 33,975 34,590 Exports 6,802 6,204 6,332 6,508 6,663 6,822 6,997 7,218 7,447 7,693 7,902 Total 35,340 35,685 36,461 37,204 37,929 38,640 39,350 40,096 40,869 41,668 42,492 Ending Stocks 640 688 708 726 747 756 766 775 785 796 807
Per Capita Consumption (Pounds) RTC Weight 92.7 94.8 96.0 96.9 97.7 98.5 99.2 99.8 100.5 101.2 102.1 Retail Weight 79.6 81.5 82.5 83.2 83.9 84.6 85.2 85.8 86.3 86.9 87.7 Change -4.5% 2.3% 1.2% 0.9% 0.9% 0.8% 0.7% 0.7% 0.7% 0.7% 0.9%
Prices (Cents per Pound) 12-City Wholesale 77.60 77.90 80.31 82.68 83.92 85.17 86.63 87.95 89.11 90.47 91.54 Change -2.6% 0.4% 3.1% 3.0% 1.5% 1.5% 1.7% 1.5% 1.3% 1.5% 1.2% Broiler Retail 177.97 182.05 188.31 194.95 199.75 203.69 207.47 210.59 213.27 216.18 218.58 Change 1.9% 2.3% 3.4% 3.5% 2.5% 2.0% 1.9% 1.5% 1.3% 1.4% 1.1%
Broiler - Feed Ratio 4.1 4.5 4.7 4.8 4.8 4.8 4.8 4.9 4.9 5.0 5.0
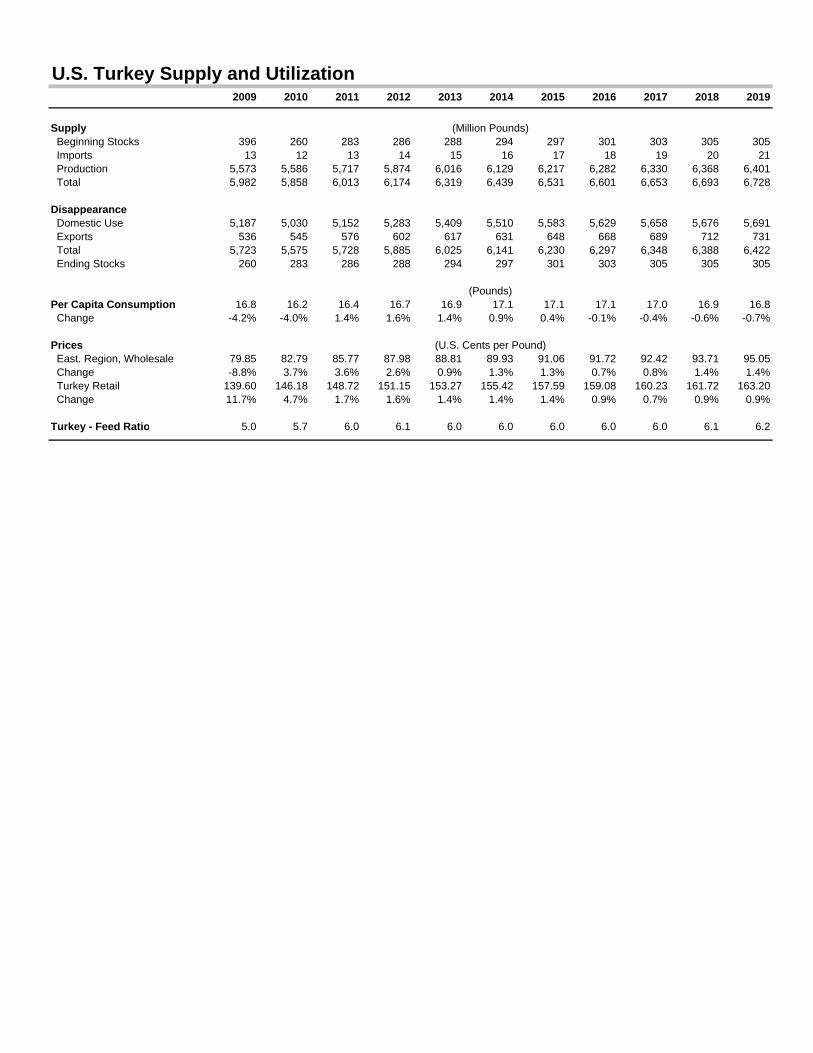
U.S. Turkey Supply and Utilization2009 2010 2011 2012 2013 2014 2015 2016 2017 2018 2019
Supply (Million Pounds) Beginning Stocks 396 260 283 286 288 294 297 301 303 305 305 Imports 13 12 13 14 15 16 17 18 19 20 21 Production 5,573 5,586 5,717 5,874 6,016 6,129 6,217 6,282 6,330 6,368 6,401 Total 5,982 5,858 6,013 6,174 6,319 6,439 6,531 6,601 6,653 6,693 6,728
Disappearance Domestic Use 5,187 5,030 5,152 5,283 5,409 5,510 5,583 5,629 5,658 5,676 5,691 Exports 536 545 576 602 617 631 648 668 689 712 731 Total 5,723 5,575 5,728 5,885 6,025 6,141 6,230 6,297 6,348 6,388 6,422 Ending Stocks 260 283 286 288 294 297 301 303 305 305 305
(Pounds)Per Capita Consumption 16.8 16.2 16.4 16.7 16.9 17.1 17.1 17.1 17.0 16.9 16.8 Change -4.2% -4.0% 1.4% 1.6% 1.4% 0.9% 0.4% -0.1% -0.4% -0.6% -0.7%
Prices (U.S. Cents per Pound) East. Region, Wholesale 79.85 82.79 85.77 87.98 88.81 89.93 91.06 91.72 92.42 93.71 95.05 Change -8.8% 3.7% 3.6% 2.6% 0.9% 1.3% 1.3% 0.7% 0.8% 1.4% 1.4% Turkey Retail 139.60 146.18 148.72 151.15 153.27 155.42 157.59 159.08 160.23 161.72 163.20 Change 11.7% 4.7% 1.7% 1.6% 1.4% 1.4% 1.4% 0.9% 0.7% 0.9% 0.9%
Turkey - Feed Ratio 5.0 5.7 6.0 6.1 6.0 6.0 6.0 6.0 6.0 6.1 6.2
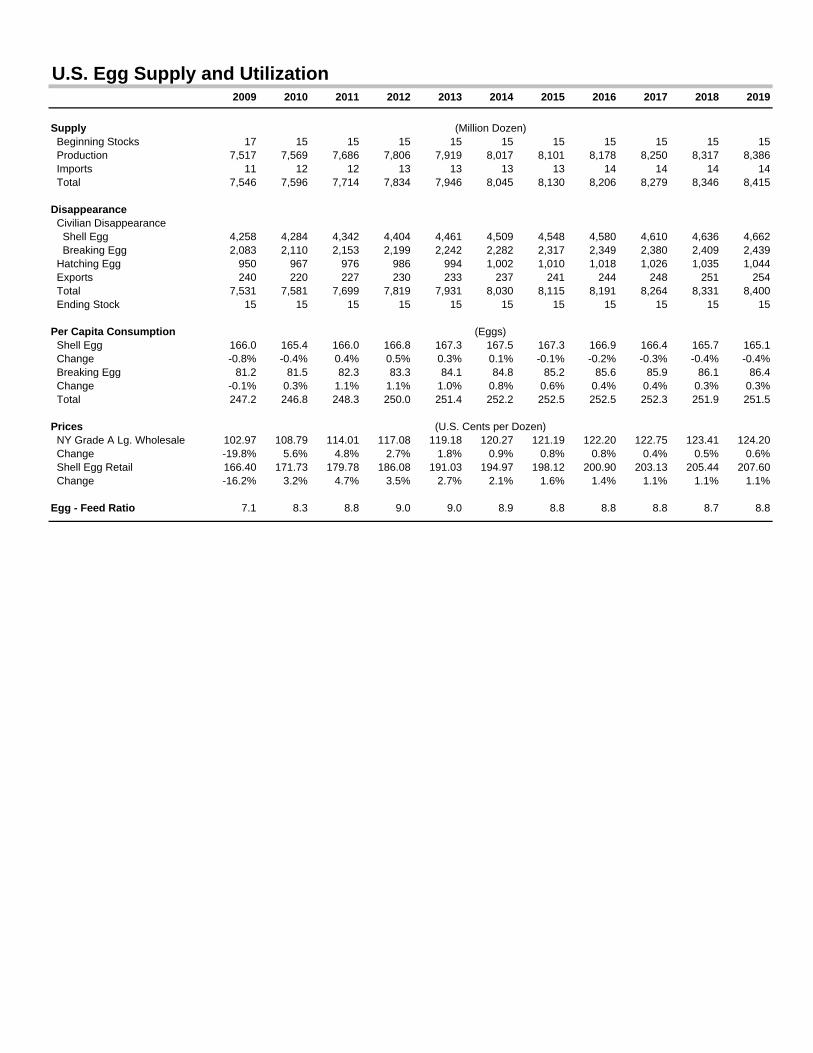
U.S. Egg Supply and Utilization2009 2010 2011 2012 2013 2014 2015 2016 2017 2018 2019
Supply (Million Dozen) Beginning Stocks 17 15 15 15 15 15 15 15 15 15 15 Production 7,517 7,569 7,686 7,806 7,919 8,017 8,101 8,178 8,250 8,317 8,386 Imports 11 12 12 13 13 13 13 14 14 14 14 Total 7,546 7,596 7,714 7,834 7,946 8,045 8,130 8,206 8,279 8,346 8,415
Disappearance Civilian Disappearance Shell Egg 4,258 4,284 4,342 4,404 4,461 4,509 4,548 4,580 4,610 4,636 4,662 Breaking Egg 2,083 2,110 2,153 2,199 2,242 2,282 2,317 2,349 2,380 2,409 2,439 Hatching Egg 950 967 976 986 994 1,002 1,010 1,018 1,026 1,035 1,044 Exports 240 220 227 230 233 237 241 244 248 251 254 Total 7,531 7,581 7,699 7,819 7,931 8,030 8,115 8,191 8,264 8,331 8,400 Ending Stock 15 15 15 15 15 15 15 15 15 15 15
Per Capita Consumption (Eggs) Shell Egg 166.0 165.4 166.0 166.8 167.3 167.5 167.3 166.9 166.4 165.7 165.1 Change -0.8% -0.4% 0.4% 0.5% 0.3% 0.1% -0.1% -0.2% -0.3% -0.4% -0.4% Breaking Egg 81.2 81.5 82.3 83.3 84.1 84.8 85.2 85.6 85.9 86.1 86.4 Change -0.1% 0.3% 1.1% 1.1% 1.0% 0.8% 0.6% 0.4% 0.4% 0.3% 0.3% Total 247.2 246.8 248.3 250.0 251.4 252.2 252.5 252.5 252.3 251.9 251.5
Prices (U.S. Cents per Dozen) NY Grade A Lg. Wholesale 102.97 108.79 114.01 117.08 119.18 120.27 121.19 122.20 122.75 123.41 124.20 Change -19.8% 5.6% 4.8% 2.7% 1.8% 0.9% 0.8% 0.8% 0.4% 0.5% 0.6% Shell Egg Retail 166.40 171.73 179.78 186.08 191.03 194.97 198.12 200.90 203.13 205.44 207.60 Change -16.2% 3.2% 4.7% 3.5% 2.7% 2.1% 1.6% 1.4% 1.1% 1.1% 1.1%
Egg - Feed Ratio 7.1 8.3 8.8 9.0 9.0 8.9 8.8 8.8 8.8 8.7 8.8
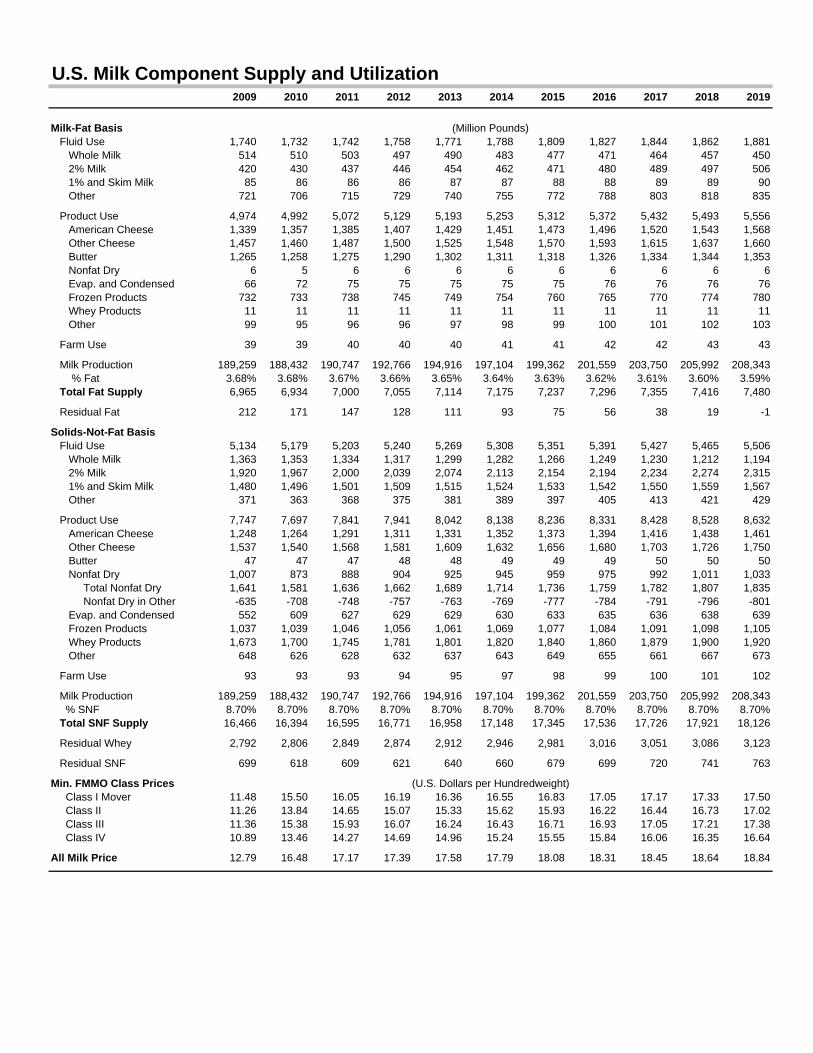
U.S. Milk Component Supply and Utilization2009 2010 2011 2012 2013 2014 2015 2016 2017 2018 2019
Milk-Fat Basis (Million Pounds) Fluid Use 1,740 1,732 1,742 1,758 1,771 1,788 1,809 1,827 1,844 1,862 1,881 Whole Milk 514 510 503 497 490 483 477 471 464 457 450 2% Milk 420 430 437 446 454 462 471 480 489 497 506 1% and Skim Milk 85 86 86 86 87 87 88 88 89 89 90 Other 721 706 715 729 740 755 772 788 803 818 835
Product Use 4,974 4,992 5,072 5,129 5,193 5,253 5,312 5,372 5,432 5,493 5,556 American Cheese 1,339 1,357 1,385 1,407 1,429 1,451 1,473 1,496 1,520 1,543 1,568 Other Cheese 1,457 1,460 1,487 1,500 1,525 1,548 1,570 1,593 1,615 1,637 1,660 Butter 1,265 1,258 1,275 1,290 1,302 1,311 1,318 1,326 1,334 1,344 1,353 Nonfat Dry 6 5 6 6 6 6 6 6 6 6 6 Evap. and Condensed 66 72 75 75 75 75 75 76 76 76 76 Frozen Products 732 733 738 745 749 754 760 765 770 774 780 Whey Products 11 11 11 11 11 11 11 11 11 11 11 Other 99 95 96 96 97 98 99 100 101 102 103
Farm Use 39 39 40 40 40 41 41 42 42 43 43
Milk Production 189,259 188,432 190,747 192,766 194,916 197,104 199,362 201,559 203,750 205,992 208,343 % Fat 3.68% 3.68% 3.67% 3.66% 3.65% 3.64% 3.63% 3.62% 3.61% 3.60% 3.59% Total Fat Supply 6,965 6,934 7,000 7,055 7,114 7,175 7,237 7,296 7,355 7,416 7,480
Residual Fat 212 171 147 128 111 93 75 56 38 19 -1
Solids-Not-Fat Basis Fluid Use 5,134 5,179 5,203 5,240 5,269 5,308 5,351 5,391 5,427 5,465 5,506 Whole Milk 1,363 1,353 1,334 1,317 1,299 1,282 1,266 1,249 1,230 1,212 1,194 2% Milk 1,920 1,967 2,000 2,039 2,074 2,113 2,154 2,194 2,234 2,274 2,315 1% and Skim Milk 1,480 1,496 1,501 1,509 1,515 1,524 1,533 1,542 1,550 1,559 1,567 Other 371 363 368 375 381 389 397 405 413 421 429
Product Use 7,747 7,697 7,841 7,941 8,042 8,138 8,236 8,331 8,428 8,528 8,632 American Cheese 1,248 1,264 1,291 1,311 1,331 1,352 1,373 1,394 1,416 1,438 1,461 Other Cheese 1,537 1,540 1,568 1,581 1,609 1,632 1,656 1,680 1,703 1,726 1,750 Butter 47 47 47 48 48 49 49 49 50 50 50 Nonfat Dry 1,007 873 888 904 925 945 959 975 992 1,011 1,033 Total Nonfat Dry 1,641 1,581 1,636 1,662 1,689 1,714 1,736 1,759 1,782 1,807 1,835 Nonfat Dry in Other -635 -708 -748 -757 -763 -769 -777 -784 -791 -796 -801 Evap. and Condensed 552 609 627 629 629 630 633 635 636 638 639 Frozen Products 1,037 1,039 1,046 1,056 1,061 1,069 1,077 1,084 1,091 1,098 1,105 Whey Products 1,673 1,700 1,745 1,781 1,801 1,820 1,840 1,860 1,879 1,900 1,920 Other 648 626 628 632 637 643 649 655 661 667 673
Farm Use 93 93 93 94 95 97 98 99 100 101 102
Milk Production 189,259 188,432 190,747 192,766 194,916 197,104 199,362 201,559 203,750 205,992 208,343 % SNF 8.70% 8.70% 8.70% 8.70% 8.70% 8.70% 8.70% 8.70% 8.70% 8.70% 8.70% Total SNF Supply 16,466 16,394 16,595 16,771 16,958 17,148 17,345 17,536 17,726 17,921 18,126
Residual Whey 2,792 2,806 2,849 2,874 2,912 2,946 2,981 3,016 3,051 3,086 3,123
Residual SNF 699 618 609 621 640 660 679 699 720 741 763
Min. FMMO Class Prices (U.S. Dollars per Hundredweight) Class I Mover 11.48 15.50 16.05 16.19 16.36 16.55 16.83 17.05 17.17 17.33 17.50 Class II 11.26 13.84 14.65 15.07 15.33 15.62 15.93 16.22 16.44 16.73 17.02 Class III 11.36 15.38 15.93 16.07 16.24 16.43 16.71 16.93 17.05 17.21 17.38 Class IV 10.89 13.46 14.27 14.69 14.96 15.24 15.55 15.84 16.06 16.35 16.64
All Milk Price 12.79 16.48 17.17 17.39 17.58 17.79 18.08 18.31 18.45 18.64 18.84
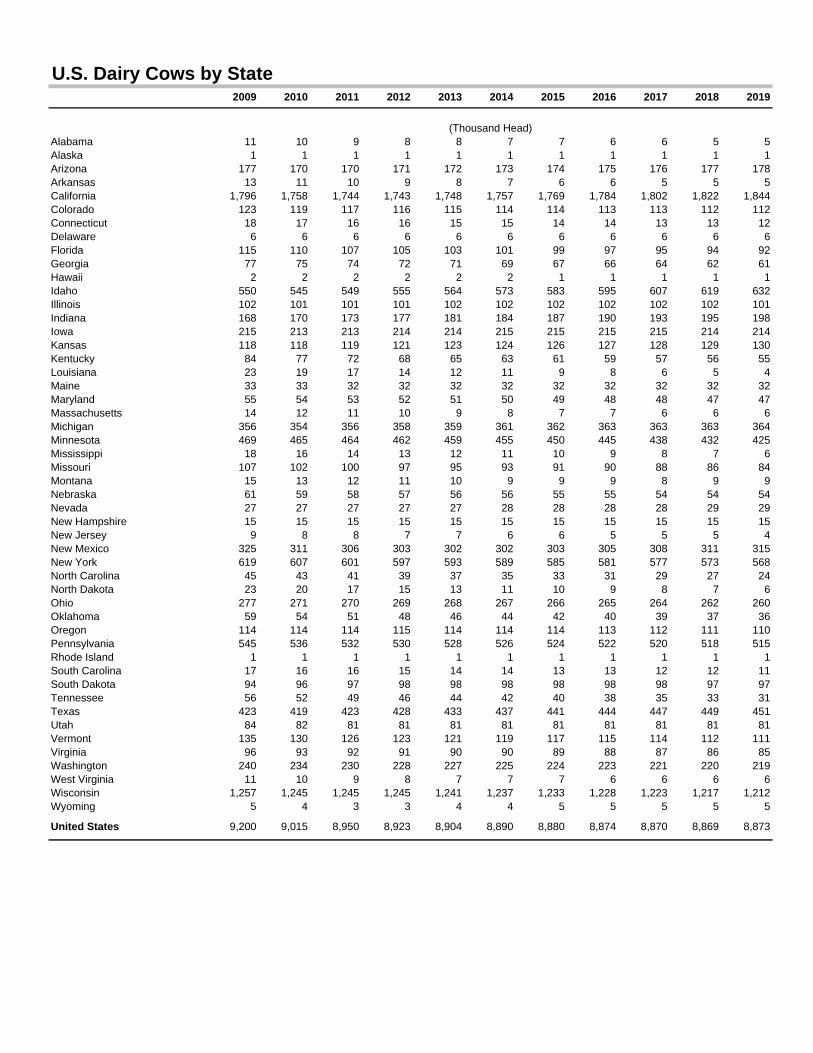
U.S. Dairy Cows by State2009 2010 2011 2012 2013 2014 2015 2016 2017 2018 2019
(Thousand Head)Alabama 11 10 9 8 8 7 7 6 6 5 5Alaska 1 1 1 1 1 1 1 1 1 1 1Arizona 177 170 170 171 172 173 174 175 176 177 178Arkansas 13 11 10 9 8 7 6 6 5 5 5California 1,796 1,758 1,744 1,743 1,748 1,757 1,769 1,784 1,802 1,822 1,844Colorado 123 119 117 116 115 114 114 113 113 112 112Connecticut 18 17 16 16 15 15 14 14 13 13 12Delaware 6 6 6 6 6 6 6 6 6 6 6Florida 115 110 107 105 103 101 99 97 95 94 92Georgia 77 75 74 72 71 69 67 66 64 62 61Hawaii 2 2 2 2 2 2 1 1 1 1 1Idaho 550 545 549 555 564 573 583 595 607 619 632Illinois 102 101 101 101 102 102 102 102 102 102 101Indiana 168 170 173 177 181 184 187 190 193 195 198Iowa 215 213 213 214 214 215 215 215 215 214 214Kansas 118 118 119 121 123 124 126 127 128 129 130Kentucky 84 77 72 68 65 63 61 59 57 56 55Louisiana 23 19 17 14 12 11 9 8 6 5 4Maine 33 33 32 32 32 32 32 32 32 32 32Maryland 55 54 53 52 51 50 49 48 48 47 47Massachusetts 14 12 11 10 9 8 7 7 6 6 6Michigan 356 354 356 358 359 361 362 363 363 363 364Minnesota 469 465 464 462 459 455 450 445 438 432 425Mississippi 18 16 14 13 12 11 10 9 8 7 6Missouri 107 102 100 97 95 93 91 90 88 86 84Montana 15 13 12 11 10 9 9 9 8 9 9Nebraska 61 59 58 57 56 56 55 55 54 54 54Nevada 27 27 27 27 27 28 28 28 28 29 29New Hampshire 15 15 15 15 15 15 15 15 15 15 15New Jersey 9 8 8 7 7 6 6 5 5 5 4New Mexico 325 311 306 303 302 302 303 305 308 311 315New York 619 607 601 597 593 589 585 581 577 573 568North Carolina 45 43 41 39 37 35 33 31 29 27 24North Dakota 23 20 17 15 13 11 10 9 8 7 6Ohio 277 271 270 269 268 267 266 265 264 262 260Oklahoma 59 54 51 48 46 44 42 40 39 37 36Oregon 114 114 114 115 114 114 114 113 112 111 110Pennsylvania 545 536 532 530 528 526 524 522 520 518 515Rhode Island 1 1 1 1 1 1 1 1 1 1 1South Carolina 17 16 16 15 14 14 13 13 12 12 11South Dakota 94 96 97 98 98 98 98 98 98 97 97Tennessee 56 52 49 46 44 42 40 38 35 33 31Texas 423 419 423 428 433 437 441 444 447 449 451Utah 84 82 81 81 81 81 81 81 81 81 81Vermont 135 130 126 123 121 119 117 115 114 112 111Virginia 96 93 92 91 90 90 89 88 87 86 85Washington 240 234 230 228 227 225 224 223 221 220 219West Virginia 11 10 9 8 7 7 7 6 6 6 6Wisconsin 1,257 1,245 1,245 1,245 1,241 1,237 1,233 1,228 1,223 1,217 1,212Wyoming 5 4 3 3 4 4 5 5 5 5 5
United States 9,200 9,015 8,950 8,923 8,904 8,890 8,880 8,874 8,870 8,869 8,873
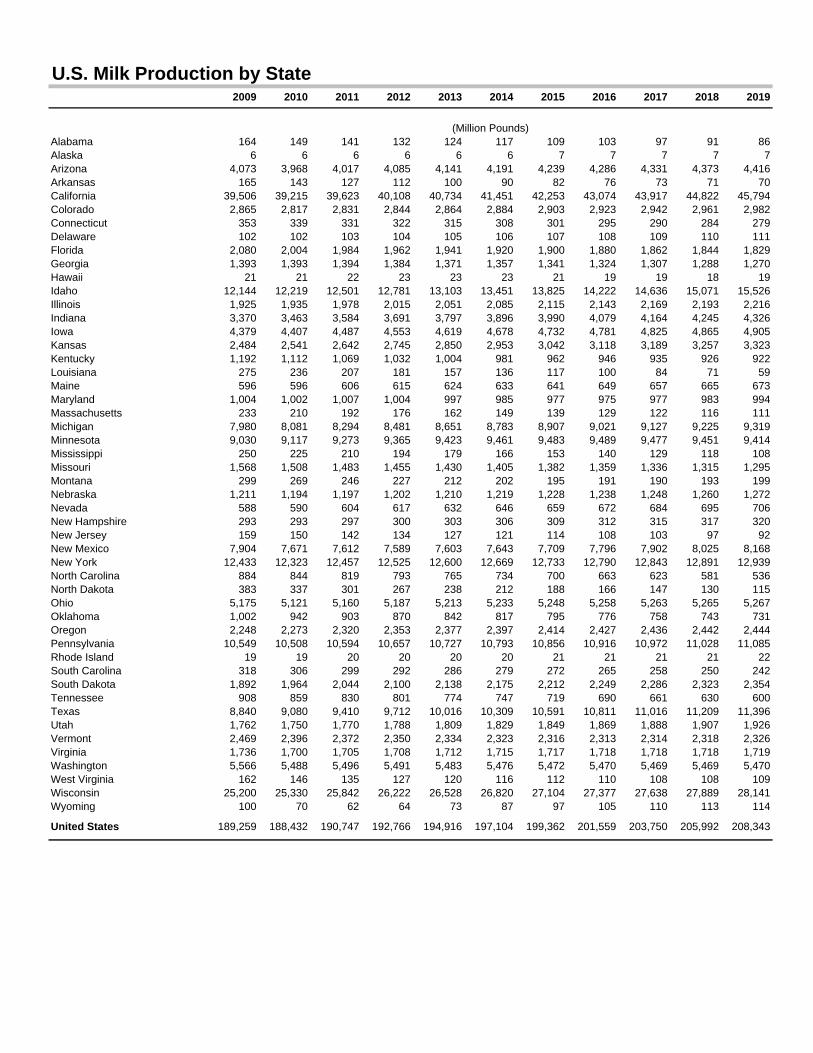
U.S. Milk Production by State 2009 2010 2011 2012 2013 2014 2015 2016 2017 2018 2019
(Million Pounds)Alabama 164 149 141 132 124 117 109 103 97 91 86Alaska 6 6 6 6 6 6 7 7 7 7 7Arizona 4,073 3,968 4,017 4,085 4,141 4,191 4,239 4,286 4,331 4,373 4,416Arkansas 165 143 127 112 100 90 82 76 73 71 70California 39,506 39,215 39,623 40,108 40,734 41,451 42,253 43,074 43,917 44,822 45,794Colorado 2,865 2,817 2,831 2,844 2,864 2,884 2,903 2,923 2,942 2,961 2,982Connecticut 353 339 331 322 315 308 301 295 290 284 279Delaware 102 102 103 104 105 106 107 108 109 110 111Florida 2,080 2,004 1,984 1,962 1,941 1,920 1,900 1,880 1,862 1,844 1,829Georgia 1,393 1,393 1,394 1,384 1,371 1,357 1,341 1,324 1,307 1,288 1,270Hawaii 21 21 22 23 23 23 21 19 19 18 19Idaho 12,144 12,219 12,501 12,781 13,103 13,451 13,825 14,222 14,636 15,071 15,526Illinois 1,925 1,935 1,978 2,015 2,051 2,085 2,115 2,143 2,169 2,193 2,216Indiana 3,370 3,463 3,584 3,691 3,797 3,896 3,990 4,079 4,164 4,245 4,326Iowa 4,379 4,407 4,487 4,553 4,619 4,678 4,732 4,781 4,825 4,865 4,905Kansas 2,484 2,541 2,642 2,745 2,850 2,953 3,042 3,118 3,189 3,257 3,323Kentucky 1,192 1,112 1,069 1,032 1,004 981 962 946 935 926 922Louisiana 275 236 207 181 157 136 117 100 84 71 59Maine 596 596 606 615 624 633 641 649 657 665 673Maryland 1,004 1,002 1,007 1,004 997 985 977 975 977 983 994Massachusetts 233 210 192 176 162 149 139 129 122 116 111Michigan 7,980 8,081 8,294 8,481 8,651 8,783 8,907 9,021 9,127 9,225 9,319Minnesota 9,030 9,117 9,273 9,365 9,423 9,461 9,483 9,489 9,477 9,451 9,414Mississippi 250 225 210 194 179 166 153 140 129 118 108Missouri 1,568 1,508 1,483 1,455 1,430 1,405 1,382 1,359 1,336 1,315 1,295Montana 299 269 246 227 212 202 195 191 190 193 199Nebraska 1,211 1,194 1,197 1,202 1,210 1,219 1,228 1,238 1,248 1,260 1,272Nevada 588 590 604 617 632 646 659 672 684 695 706New Hampshire 293 293 297 300 303 306 309 312 315 317 320New Jersey 159 150 142 134 127 121 114 108 103 97 92New Mexico 7,904 7,671 7,612 7,589 7,603 7,643 7,709 7,796 7,902 8,025 8,168New York 12,433 12,323 12,457 12,525 12,600 12,669 12,733 12,790 12,843 12,891 12,939North Carolina 884 844 819 793 765 734 700 663 623 581 536North Dakota 383 337 301 267 238 212 188 166 147 130 115Ohio 5,175 5,121 5,160 5,187 5,213 5,233 5,248 5,258 5,263 5,265 5,267Oklahoma 1,002 942 903 870 842 817 795 776 758 743 731Oregon 2,248 2,273 2,320 2,353 2,377 2,397 2,414 2,427 2,436 2,442 2,444Pennsylvania 10,549 10,508 10,594 10,657 10,727 10,793 10,856 10,916 10,972 11,028 11,085Rhode Island 19 19 20 20 20 20 21 21 21 21 22South Carolina 318 306 299 292 286 279 272 265 258 250 242South Dakota 1,892 1,964 2,044 2,100 2,138 2,175 2,212 2,249 2,286 2,323 2,354Tennessee 908 859 830 801 774 747 719 690 661 630 600Texas 8,840 9,080 9,410 9,712 10,016 10,309 10,591 10,811 11,016 11,209 11,396Utah 1,762 1,750 1,770 1,788 1,809 1,829 1,849 1,869 1,888 1,907 1,926Vermont 2,469 2,396 2,372 2,350 2,334 2,323 2,316 2,313 2,314 2,318 2,326Virginia 1,736 1,700 1,705 1,708 1,712 1,715 1,717 1,718 1,718 1,718 1,719Washington 5,566 5,488 5,496 5,491 5,483 5,476 5,472 5,470 5,469 5,469 5,470West Virginia 162 146 135 127 120 116 112 110 108 108 109Wisconsin 25,200 25,330 25,842 26,222 26,528 26,820 27,104 27,377 27,638 27,889 28,141Wyoming 100 70 62 64 73 87 97 105 110 113 114
United States 189,259 188,432 190,747 192,766 194,916 197,104 199,362 201,559 203,750 205,992 208,343
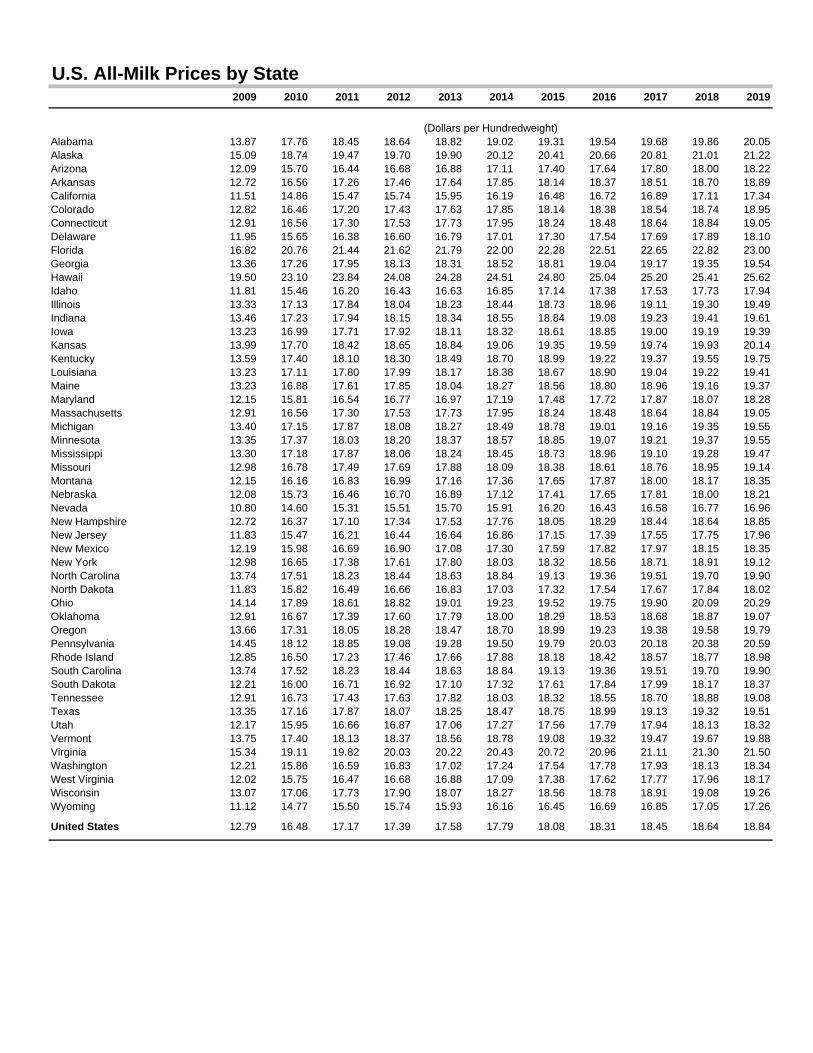
U.S. All-Milk Prices by State2009 2010 2011 2012 2013 2014 2015 2016 2017 2018 2019
(Dollars per Hundredweight)Alabama 13.87 17.76 18.45 18.64 18.82 19.02 19.31 19.54 19.68 19.86 20.05Alaska 15.09 18.74 19.47 19.70 19.90 20.12 20.41 20.66 20.81 21.01 21.22Arizona 12.09 15.70 16.44 16.68 16.88 17.11 17.40 17.64 17.80 18.00 18.22Arkansas 12.72 16.56 17.26 17.46 17.64 17.85 18.14 18.37 18.51 18.70 18.89California 11.51 14.86 15.47 15.74 15.95 16.19 16.48 16.72 16.89 17.11 17.34Colorado 12.82 16.46 17.20 17.43 17.63 17.85 18.14 18.38 18.54 18.74 18.95Connecticut 12.91 16.56 17.30 17.53 17.73 17.95 18.24 18.48 18.64 18.84 19.05Delaware 11.95 15.65 16.38 16.60 16.79 17.01 17.30 17.54 17.69 17.89 18.10Florida 16.82 20.76 21.44 21.62 21.79 22.00 22.28 22.51 22.65 22.82 23.00Georgia 13.36 17.26 17.95 18.13 18.31 18.52 18.81 19.04 19.17 19.35 19.54Hawaii 19.50 23.10 23.84 24.08 24.28 24.51 24.80 25.04 25.20 25.41 25.62Idaho 11.81 15.46 16.20 16.43 16.63 16.85 17.14 17.38 17.53 17.73 17.94Illinois 13.33 17.13 17.84 18.04 18.23 18.44 18.73 18.96 19.11 19.30 19.49Indiana 13.46 17.23 17.94 18.15 18.34 18.55 18.84 19.08 19.23 19.41 19.61Iowa 13.23 16.99 17.71 17.92 18.11 18.32 18.61 18.85 19.00 19.19 19.39Kansas 13.99 17.70 18.42 18.65 18.84 19.06 19.35 19.59 19.74 19.93 20.14Kentucky 13.59 17.40 18.10 18.30 18.49 18.70 18.99 19.22 19.37 19.55 19.75Louisiana 13.23 17.11 17.80 17.99 18.17 18.38 18.67 18.90 19.04 19.22 19.41Maine 13.23 16.88 17.61 17.85 18.04 18.27 18.56 18.80 18.96 19.16 19.37Maryland 12.15 15.81 16.54 16.77 16.97 17.19 17.48 17.72 17.87 18.07 18.28Massachusetts 12.91 16.56 17.30 17.53 17.73 17.95 18.24 18.48 18.64 18.84 19.05Michigan 13.40 17.15 17.87 18.08 18.27 18.49 18.78 19.01 19.16 19.35 19.55Minnesota 13.35 17.37 18.03 18.20 18.37 18.57 18.85 19.07 19.21 19.37 19.55Mississippi 13.30 17.18 17.87 18.06 18.24 18.45 18.73 18.96 19.10 19.28 19.47Missouri 12.98 16.78 17.49 17.69 17.88 18.09 18.38 18.61 18.76 18.95 19.14Montana 12.15 16.16 16.83 16.99 17.16 17.36 17.65 17.87 18.00 18.17 18.35Nebraska 12.08 15.73 16.46 16.70 16.89 17.12 17.41 17.65 17.81 18.00 18.21Nevada 10.80 14.60 15.31 15.51 15.70 15.91 16.20 16.43 16.58 16.77 16.96New Hampshire 12.72 16.37 17.10 17.34 17.53 17.76 18.05 18.29 18.44 18.64 18.85New Jersey 11.83 15.47 16.21 16.44 16.64 16.86 17.15 17.39 17.55 17.75 17.96New Mexico 12.19 15.98 16.69 16.90 17.08 17.30 17.59 17.82 17.97 18.15 18.35New York 12.98 16.65 17.38 17.61 17.80 18.03 18.32 18.56 18.71 18.91 19.12North Carolina 13.74 17.51 18.23 18.44 18.63 18.84 19.13 19.36 19.51 19.70 19.90North Dakota 11.83 15.82 16.49 16.66 16.83 17.03 17.32 17.54 17.67 17.84 18.02Ohio 14.14 17.89 18.61 18.82 19.01 19.23 19.52 19.75 19.90 20.09 20.29Oklahoma 12.91 16.67 17.39 17.60 17.79 18.00 18.29 18.53 18.68 18.87 19.07Oregon 13.66 17.31 18.05 18.28 18.47 18.70 18.99 19.23 19.38 19.58 19.79Pennsylvania 14.45 18.12 18.85 19.08 19.28 19.50 19.79 20.03 20.18 20.38 20.59Rhode Island 12.85 16.50 17.23 17.46 17.66 17.88 18.18 18.42 18.57 18.77 18.98South Carolina 13.74 17.52 18.23 18.44 18.63 18.84 19.13 19.36 19.51 19.70 19.90South Dakota 12.21 16.00 16.71 16.92 17.10 17.32 17.61 17.84 17.99 18.17 18.37Tennessee 12.91 16.73 17.43 17.63 17.82 18.03 18.32 18.55 18.70 18.88 19.08Texas 13.35 17.16 17.87 18.07 18.25 18.47 18.75 18.99 19.13 19.32 19.51Utah 12.17 15.95 16.66 16.87 17.06 17.27 17.56 17.79 17.94 18.13 18.32Vermont 13.75 17.40 18.13 18.37 18.56 18.78 19.08 19.32 19.47 19.67 19.88Virginia 15.34 19.11 19.82 20.03 20.22 20.43 20.72 20.96 21.11 21.30 21.50Washington 12.21 15.86 16.59 16.83 17.02 17.24 17.54 17.78 17.93 18.13 18.34West Virginia 12.02 15.75 16.47 16.68 16.88 17.09 17.38 17.62 17.77 17.96 18.17Wisconsin 13.07 17.06 17.73 17.90 18.07 18.27 18.56 18.78 18.91 19.08 19.26Wyoming 11.12 14.77 15.50 15.74 15.93 16.16 16.45 16.69 16.85 17.05 17.26
United States 12.79 16.48 17.17 17.39 17.58 17.79 18.08 18.31 18.45 18.64 18.84
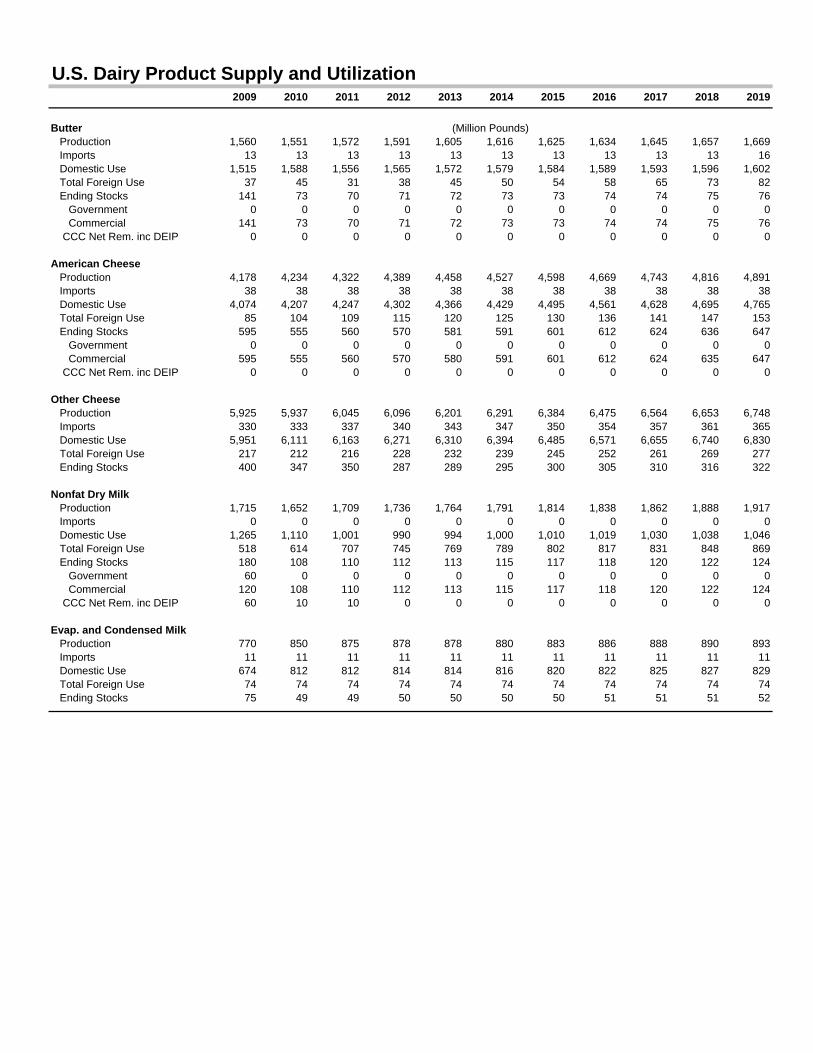
U.S. Dairy Product Supply and Utilization2009 2010 2011 2012 2013 2014 2015 2016 2017 2018 2019
Butter (Million Pounds) Production 1,560 1,551 1,572 1,591 1,605 1,616 1,625 1,634 1,645 1,657 1,669 Imports 13 13 13 13 13 13 13 13 13 13 16 Domestic Use 1,515 1,588 1,556 1,565 1,572 1,579 1,584 1,589 1,593 1,596 1,602 Total Foreign Use 37 45 31 38 45 50 54 58 65 73 82 Ending Stocks 141 73 70 71 72 73 73 74 74 75 76 Government 0 0 0 0 0 0 0 0 0 0 0 Commercial 141 73 70 71 72 73 73 74 74 75 76 CCC Net Rem. inc DEIP 0 0 0 0 0 0 0 0 0 0 0
American Cheese Production 4,178 4,234 4,322 4,389 4,458 4,527 4,598 4,669 4,743 4,816 4,891 Imports 38 38 38 38 38 38 38 38 38 38 38 Domestic Use 4,074 4,207 4,247 4,302 4,366 4,429 4,495 4,561 4,628 4,695 4,765 Total Foreign Use 85 104 109 115 120 125 130 136 141 147 153 Ending Stocks 595 555 560 570 581 591 601 612 624 636 647 Government 0 0 0 0 0 0 0 0 0 0 0 Commercial 595 555 560 570 580 591 601 612 624 635 647 CCC Net Rem. inc DEIP 0 0 0 0 0 0 0 0 0 0 0
Other Cheese Production 5,925 5,937 6,045 6,096 6,201 6,291 6,384 6,475 6,564 6,653 6,748 Imports 330 333 337 340 343 347 350 354 357 361 365 Domestic Use 5,951 6,111 6,163 6,271 6,310 6,394 6,485 6,571 6,655 6,740 6,830 Total Foreign Use 217 212 216 228 232 239 245 252 261 269 277 Ending Stocks 400 347 350 287 289 295 300 305 310 316 322
Nonfat Dry Milk Production 1,715 1,652 1,709 1,736 1,764 1,791 1,814 1,838 1,862 1,888 1,917 Imports 0 0 0 0 0 0 0 0 0 0 0 Domestic Use 1,265 1,110 1,001 990 994 1,000 1,010 1,019 1,030 1,038 1,046 Total Foreign Use 518 614 707 745 769 789 802 817 831 848 869 Ending Stocks 180 108 110 112 113 115 117 118 120 122 124 Government 60 0 0 0 0 0 0 0 0 0 0 Commercial 120 108 110 112 113 115 117 118 120 122 124 CCC Net Rem. inc DEIP 60 10 10 0 0 0 0 0 0 0 0
Evap. and Condensed Milk Production 770 850 875 878 878 880 883 886 888 890 893 Imports 11 11 11 11 11 11 11 11 11 11 11 Domestic Use 674 812 812 814 814 816 820 822 825 827 829 Total Foreign Use 74 74 74 74 74 74 74 74 74 74 74 Ending Stocks 75 49 49 50 50 50 50 51 51 51 52
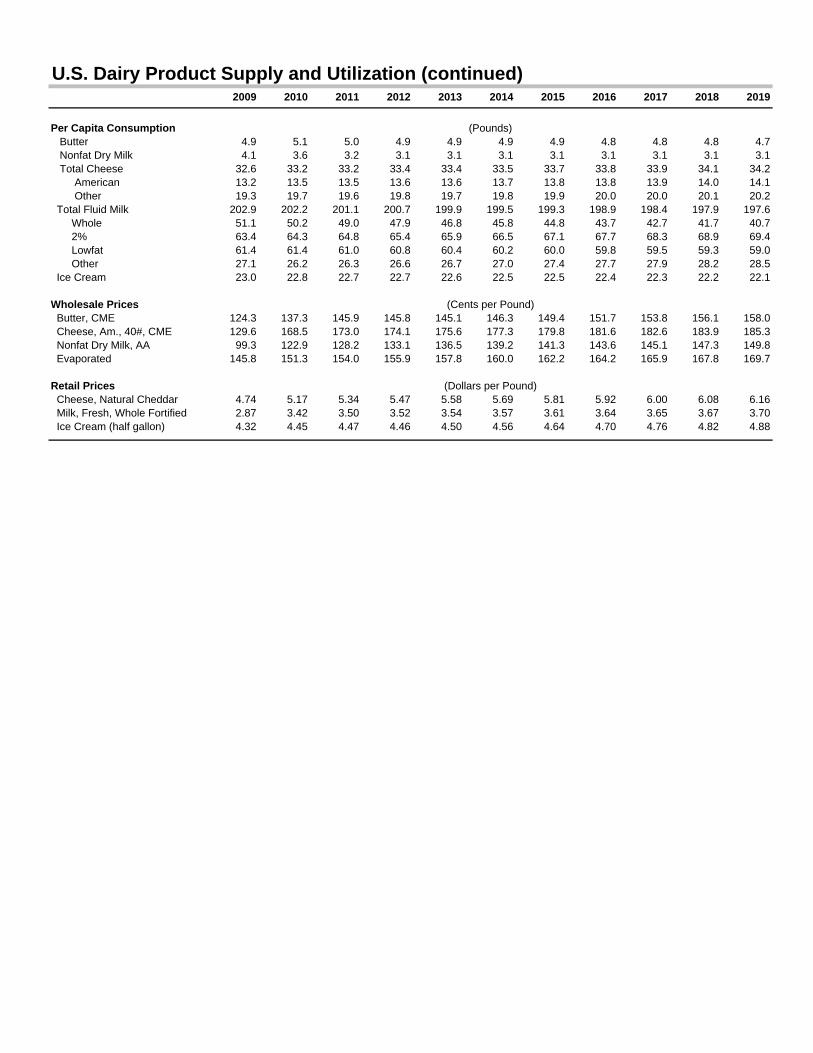
U.S. Dairy Product Supply and Utilization (continued)2009 2010 2011 2012 2013 2014 2015 2016 2017 2018 2019
Per Capita Consumption (Pounds) Butter 4.9 5.1 5.0 4.9 4.9 4.9 4.9 4.8 4.8 4.8 4.7 Nonfat Dry Milk 4.1 3.6 3.2 3.1 3.1 3.1 3.1 3.1 3.1 3.1 3.1 Total Cheese 32.6 33.2 33.2 33.4 33.4 33.5 33.7 33.8 33.9 34.1 34.2 American 13.2 13.5 13.5 13.6 13.6 13.7 13.8 13.8 13.9 14.0 14.1 Other 19.3 19.7 19.6 19.8 19.7 19.8 19.9 20.0 20.0 20.1 20.2 Total Fluid Milk 202.9 202.2 201.1 200.7 199.9 199.5 199.3 198.9 198.4 197.9 197.6 Whole 51.1 50.2 49.0 47.9 46.8 45.8 44.8 43.7 42.7 41.7 40.7 2% 63.4 64.3 64.8 65.4 65.9 66.5 67.1 67.7 68.3 68.9 69.4 Lowfat 61.4 61.4 61.0 60.8 60.4 60.2 60.0 59.8 59.5 59.3 59.0 Other 27.1 26.2 26.3 26.6 26.7 27.0 27.4 27.7 27.9 28.2 28.5 Ice Cream 23.0 22.8 22.7 22.7 22.6 22.5 22.5 22.4 22.3 22.2 22.1
Wholesale Prices (Cents per Pound) Butter, CME 124.3 137.3 145.9 145.8 145.1 146.3 149.4 151.7 153.8 156.1 158.0 Cheese, Am., 40#, CME 129.6 168.5 173.0 174.1 175.6 177.3 179.8 181.6 182.6 183.9 185.3 Nonfat Dry Milk, AA 99.3 122.9 128.2 133.1 136.5 139.2 141.3 143.6 145.1 147.3 149.8 Evaporated 145.8 151.3 154.0 155.9 157.8 160.0 162.2 164.2 165.9 167.8 169.7
Retail Prices (Dollars per Pound) Cheese, Natural Cheddar 4.74 5.17 5.34 5.47 5.58 5.69 5.81 5.92 6.00 6.08 6.16 Milk, Fresh, Whole Fortified 2.87 3.42 3.50 3.52 3.54 3.57 3.61 3.64 3.65 3.67 3.70 Ice Cream (half gallon) 4.32 4.45 4.47 4.46 4.50 4.56 4.64 4.70 4.76 4.82 4.88
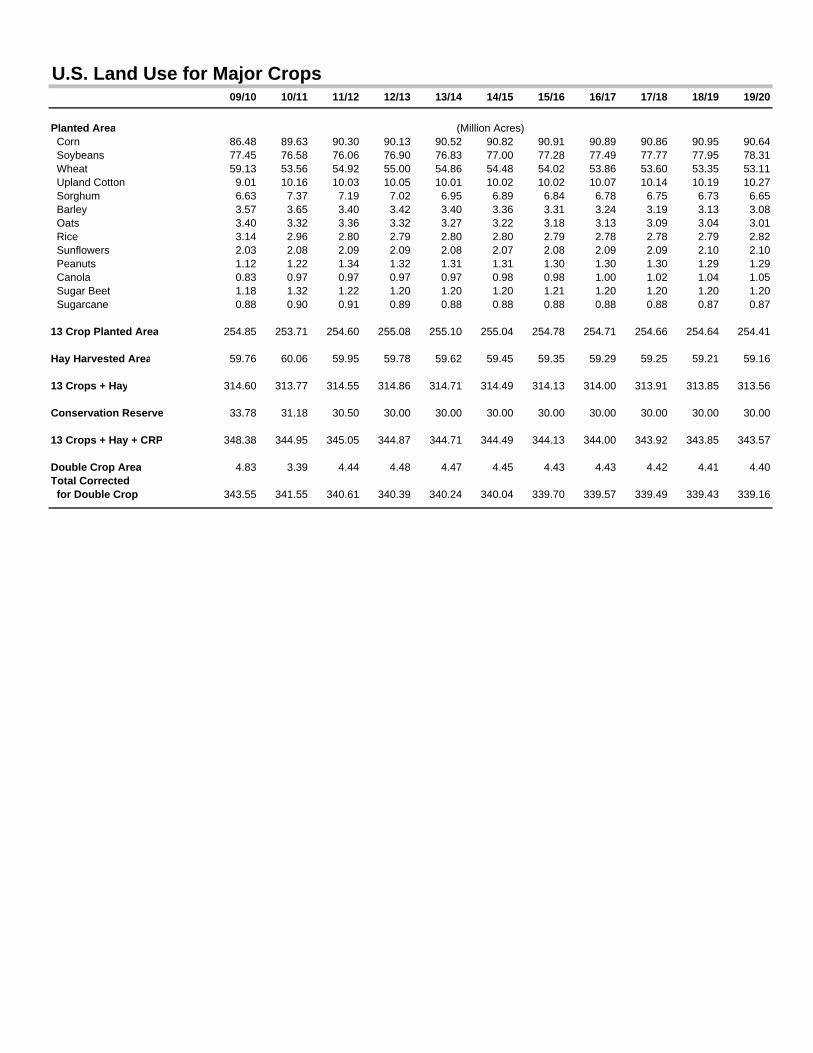
U.S. Land Use for Major Crops09/10 10/11 11/12 12/13 13/14 14/15 15/16 16/17 17/18 18/19 19/20
Planted Area (Million Acres) Corn 86.48 89.63 90.30 90.13 90.52 90.82 90.91 90.89 90.86 90.95 90.64 Soybeans 77.45 76.58 76.06 76.90 76.83 77.00 77.28 77.49 77.77 77.95 78.31 Wheat 59.13 53.56 54.92 55.00 54.86 54.48 54.02 53.86 53.60 53.35 53.11 Upland Cotton 9.01 10.16 10.03 10.05 10.01 10.02 10.02 10.07 10.14 10.19 10.27 Sorghum 6.63 7.37 7.19 7.02 6.95 6.89 6.84 6.78 6.75 6.73 6.65 Barley 3.57 3.65 3.40 3.42 3.40 3.36 3.31 3.24 3.19 3.13 3.08 Oats 3.40 3.32 3.36 3.32 3.27 3.22 3.18 3.13 3.09 3.04 3.01 Rice 3.14 2.96 2.80 2.79 2.80 2.80 2.79 2.78 2.78 2.79 2.82 Sunflowers 2.03 2.08 2.09 2.09 2.08 2.07 2.08 2.09 2.09 2.10 2.10 Peanuts 1.12 1.22 1.34 1.32 1.31 1.31 1.30 1.30 1.30 1.29 1.29 Canola 0.83 0.97 0.97 0.97 0.97 0.98 0.98 1.00 1.02 1.04 1.05 Sugar Beet 1.18 1.32 1.22 1.20 1.20 1.20 1.21 1.20 1.20 1.20 1.20 Sugarcane 0.88 0.90 0.91 0.89 0.88 0.88 0.88 0.88 0.88 0.87 0.87
13 Crop Planted Area 254.85 253.71 254.60 255.08 255.10 255.04 254.78 254.71 254.66 254.64 254.41
Hay Harvested Area 59.76 60.06 59.95 59.78 59.62 59.45 59.35 59.29 59.25 59.21 59.16
13 Crops + Hay 314.60 313.77 314.55 314.86 314.71 314.49 314.13 314.00 313.91 313.85 313.56
Conservation Reserve 33.78 31.18 30.50 30.00 30.00 30.00 30.00 30.00 30.00 30.00 30.00
13 Crops + Hay + CRP 348.38 344.95 345.05 344.87 344.71 344.49 344.13 344.00 343.92 343.85 343.57
Double Crop Area 4.83 3.39 4.44 4.48 4.47 4.45 4.43 4.43 4.42 4.41 4.40Total Corrected for Double Crop 343.55 341.55 340.61 340.39 340.24 340.04 339.70 339.57 339.49 339.43 339.16
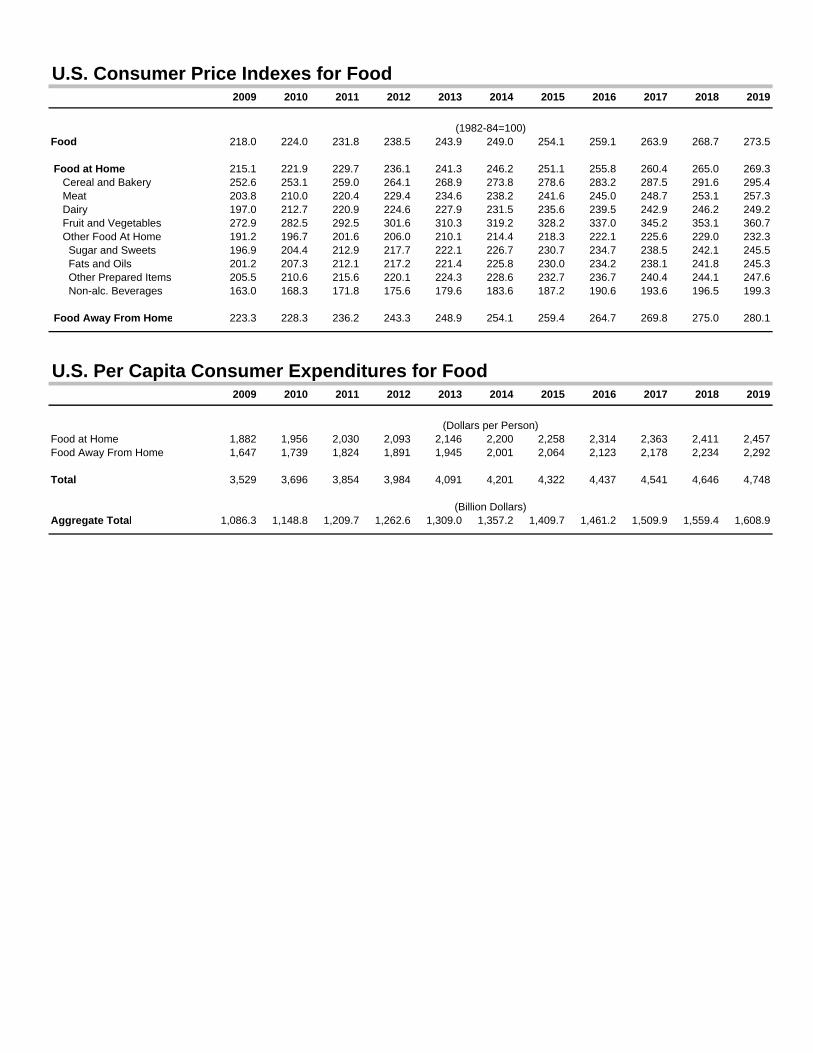
U.S. Consumer Price Indexes for Food2009 2010 2011 2012 2013 2014 2015 2016 2017 2018 2019
(1982-84=100)Food 218.0 224.0 231.8 238.5 243.9 249.0 254.1 259.1 263.9 268.7 273.5
Food at Home 215.1 221.9 229.7 236.1 241.3 246.2 251.1 255.8 260.4 265.0 269.3 Cereal and Bakery 252.6 253.1 259.0 264.1 268.9 273.8 278.6 283.2 287.5 291.6 295.4 Meat 203.8 210.0 220.4 229.4 234.6 238.2 241.6 245.0 248.7 253.1 257.3 Dairy 197.0 212.7 220.9 224.6 227.9 231.5 235.6 239.5 242.9 246.2 249.2 Fruit and Vegetables 272.9 282.5 292.5 301.6 310.3 319.2 328.2 337.0 345.2 353.1 360.7 Other Food At Home 191.2 196.7 201.6 206.0 210.1 214.4 218.3 222.1 225.6 229.0 232.3 Sugar and Sweets 196.9 204.4 212.9 217.7 222.1 226.7 230.7 234.7 238.5 242.1 245.5 Fats and Oils 201.2 207.3 212.1 217.2 221.4 225.8 230.0 234.2 238.1 241.8 245.3 Other Prepared Items 205.5 210.6 215.6 220.1 224.3 228.6 232.7 236.7 240.4 244.1 247.6 Non-alc. Beverages 163.0 168.3 171.8 175.6 179.6 183.6 187.2 190.6 193.6 196.5 199.3
Food Away From Home 223.3 228.3 236.2 243.3 248.9 254.1 259.4 264.7 269.8 275.0 280.1
U.S. Per Capita Consumer Expenditures for Food2009 2010 2011 2012 2013 2014 2015 2016 2017 2018 2019
(Dollars per Person)Food at Home 1,882 1,956 2,030 2,093 2,146 2,200 2,258 2,314 2,363 2,411 2,457Food Away From Home 1,647 1,739 1,824 1,891 1,945 2,001 2,064 2,123 2,178 2,234 2,292
Total 3,529 3,696 3,854 3,984 4,091 4,201 4,322 4,437 4,541 4,646 4,748
(Billion Dollars)Aggregate Total 1,086.3 1,148.8 1,209.7 1,262.6 1,309.0 1,357.2 1,409.7 1,461.2 1,509.9 1,559.4 1,608.9
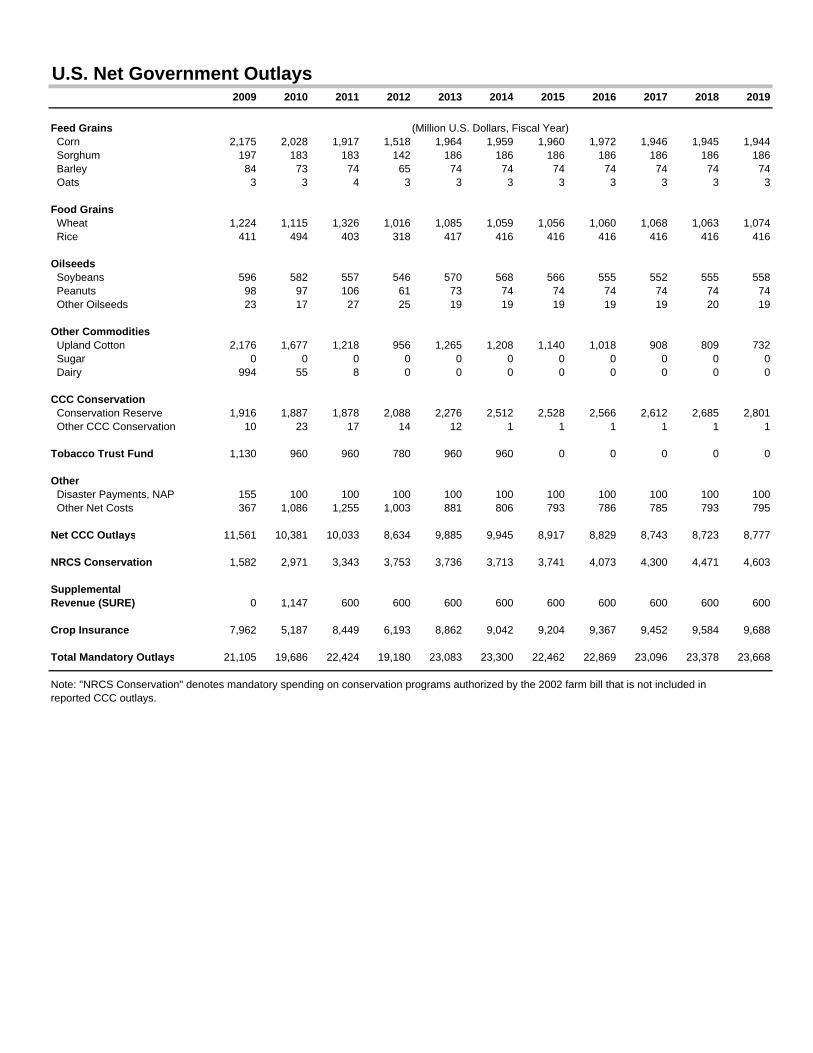
U.S. Net Government Outlays2009 2010 2011 2012 2013 2014 2015 2016 2017 2018 2019
Feed Grains (Million U.S. Dollars, Fiscal Year) Corn 2,175 2,028 1,917 1,518 1,964 1,959 1,960 1,972 1,946 1,945 1,944 Sorghum 197 183 183 142 186 186 186 186 186 186 186 Barley 84 73 74 65 74 74 74 74 74 74 74 Oats 3 3 4 3 3 3 3 3 3 3 3
Food Grains Wheat 1,224 1,115 1,326 1,016 1,085 1,059 1,056 1,060 1,068 1,063 1,074 Rice 411 494 403 318 417 416 416 416 416 416 416
Oilseeds Soybeans 596 582 557 546 570 568 566 555 552 555 558 Peanuts 98 97 106 61 73 74 74 74 74 74 74 Other Oilseeds 23 17 27 25 19 19 19 19 19 20 19
Other Commodities Upland Cotton 2,176 1,677 1,218 956 1,265 1,208 1,140 1,018 908 809 732 Sugar 0 0 0 0 0 0 0 0 0 0 0 Dairy 994 55 8 0 0 0 0 0 0 0 0
CCC Conservation Conservation Reserve 1,916 1,887 1,878 2,088 2,276 2,512 2,528 2,566 2,612 2,685 2,801 Other CCC Conservation 10 23 17 14 12 1 1 1 1 1 1
Tobacco Trust Fund 1,130 960 960 780 960 960 0 0 0 0 0
Other Disaster Payments, NAP 155 100 100 100 100 100 100 100 100 100 100 Other Net Costs 367 1,086 1,255 1,003 881 806 793 786 785 793 795
Net CCC Outlays 11,561 10,381 10,033 8,634 9,885 9,945 8,917 8,829 8,743 8,723 8,777
NRCS Conservation 1,582 2,971 3,343 3,753 3,736 3,713 3,741 4,073 4,300 4,471 4,603
SupplementalRevenue (SURE) 0 1,147 600 600 600 600 600 600 600 600 600
Crop Insurance 7,962 5,187 8,449 6,193 8,862 9,042 9,204 9,367 9,452 9,584 9,688
Total Mandatory Outlays 21,105 19,686 22,424 19,180 23,083 23,300 22,462 22,869 23,096 23,378 23,668
Note: "NRCS Conservation" denotes mandatory spending on conservation programs authorized by the 2002 farm bill that is not included in reported CCC outlays.
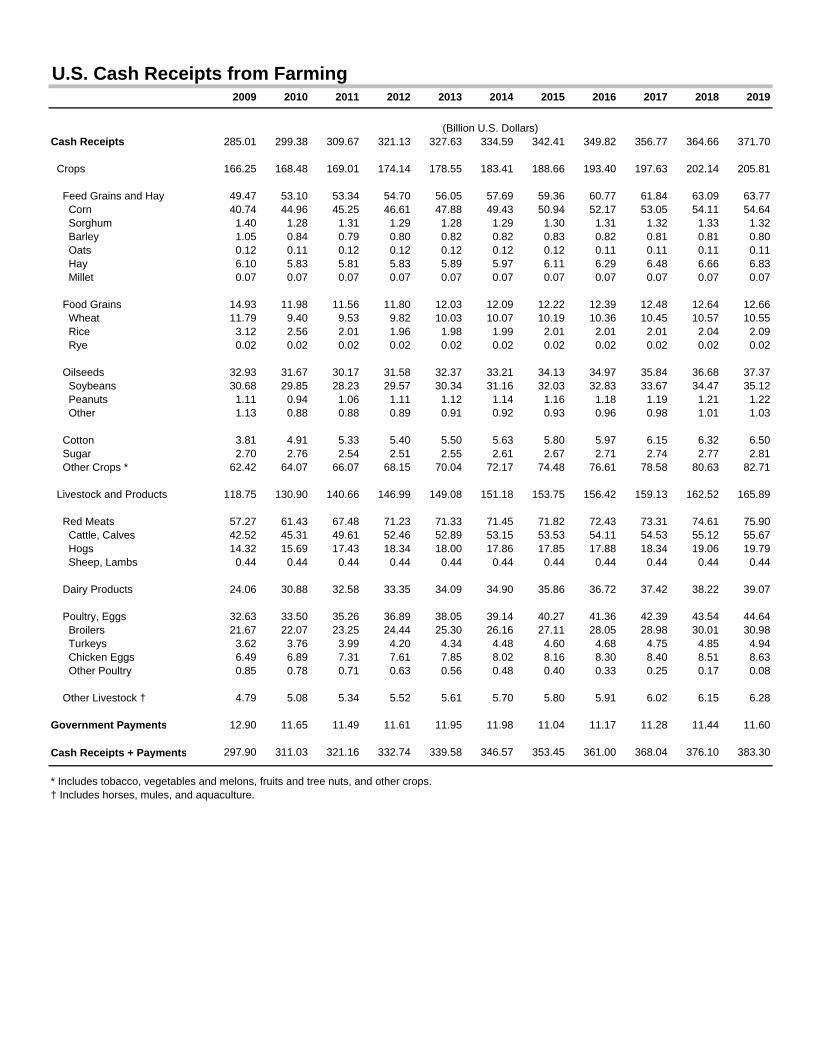
U.S. Cash Receipts from Farming2009 2010 2011 2012 2013 2014 2015 2016 2017 2018 2019
(Billion U.S. Dollars)Cash Receipts 285.01 299.38 309.67 321.13 327.63 334.59 342.41 349.82 356.77 364.66 371.70
Crops 166.25 168.48 169.01 174.14 178.55 183.41 188.66 193.40 197.63 202.14 205.81
Feed Grains and Hay 49.47 53.10 53.34 54.70 56.05 57.69 59.36 60.77 61.84 63.09 63.77 Corn 40.74 44.96 45.25 46.61 47.88 49.43 50.94 52.17 53.05 54.11 54.64 Sorghum 1.40 1.28 1.31 1.29 1.28 1.29 1.30 1.31 1.32 1.33 1.32 Barley 1.05 0.84 0.79 0.80 0.82 0.82 0.83 0.82 0.81 0.81 0.80 Oats 0.12 0.11 0.12 0.12 0.12 0.12 0.12 0.11 0.11 0.11 0.11 Hay 6.10 5.83 5.81 5.83 5.89 5.97 6.11 6.29 6.48 6.66 6.83 Millet 0.07 0.07 0.07 0.07 0.07 0.07 0.07 0.07 0.07 0.07 0.07
Food Grains 14.93 11.98 11.56 11.80 12.03 12.09 12.22 12.39 12.48 12.64 12.66 Wheat 11.79 9.40 9.53 9.82 10.03 10.07 10.19 10.36 10.45 10.57 10.55 Rice 3.12 2.56 2.01 1.96 1.98 1.99 2.01 2.01 2.01 2.04 2.09 Rye 0.02 0.02 0.02 0.02 0.02 0.02 0.02 0.02 0.02 0.02 0.02
Oilseeds 32.93 31.67 30.17 31.58 32.37 33.21 34.13 34.97 35.84 36.68 37.37 Soybeans 30.68 29.85 28.23 29.57 30.34 31.16 32.03 32.83 33.67 34.47 35.12 Peanuts 1.11 0.94 1.06 1.11 1.12 1.14 1.16 1.18 1.19 1.21 1.22 Other 1.13 0.88 0.88 0.89 0.91 0.92 0.93 0.96 0.98 1.01 1.03
Cotton 3.81 4.91 5.33 5.40 5.50 5.63 5.80 5.97 6.15 6.32 6.50 Sugar 2.70 2.76 2.54 2.51 2.55 2.61 2.67 2.71 2.74 2.77 2.81 Other Crops * 62.42 64.07 66.07 68.15 70.04 72.17 74.48 76.61 78.58 80.63 82.71
Livestock and Products 118.75 130.90 140.66 146.99 149.08 151.18 153.75 156.42 159.13 162.52 165.89
Red Meats 57.27 61.43 67.48 71.23 71.33 71.45 71.82 72.43 73.31 74.61 75.90 Cattle, Calves 42.52 45.31 49.61 52.46 52.89 53.15 53.53 54.11 54.53 55.12 55.67 Hogs 14.32 15.69 17.43 18.34 18.00 17.86 17.85 17.88 18.34 19.06 19.79 Sheep, Lambs 0.44 0.44 0.44 0.44 0.44 0.44 0.44 0.44 0.44 0.44 0.44
Dairy Products 24.06 30.88 32.58 33.35 34.09 34.90 35.86 36.72 37.42 38.22 39.07
Poultry, Eggs 32.63 33.50 35.26 36.89 38.05 39.14 40.27 41.36 42.39 43.54 44.64 Broilers 21.67 22.07 23.25 24.44 25.30 26.16 27.11 28.05 28.98 30.01 30.98 Turkeys 3.62 3.76 3.99 4.20 4.34 4.48 4.60 4.68 4.75 4.85 4.94 Chicken Eggs 6.49 6.89 7.31 7.61 7.85 8.02 8.16 8.30 8.40 8.51 8.63 Other Poultry 0.85 0.78 0.71 0.63 0.56 0.48 0.40 0.33 0.25 0.17 0.08
Other Livestock † 4.79 5.08 5.34 5.52 5.61 5.70 5.80 5.91 6.02 6.15 6.28
Government Payments 12.90 11.65 11.49 11.61 11.95 11.98 11.04 11.17 11.28 11.44 11.60
Cash Receipts + Payments 297.90 311.03 321.16 332.74 339.58 346.57 353.45 361.00 368.04 376.10 383.30
* Includes tobacco, vegetables and melons, fruits and tree nuts, and other crops.† Includes horses, mules, and aquaculture.
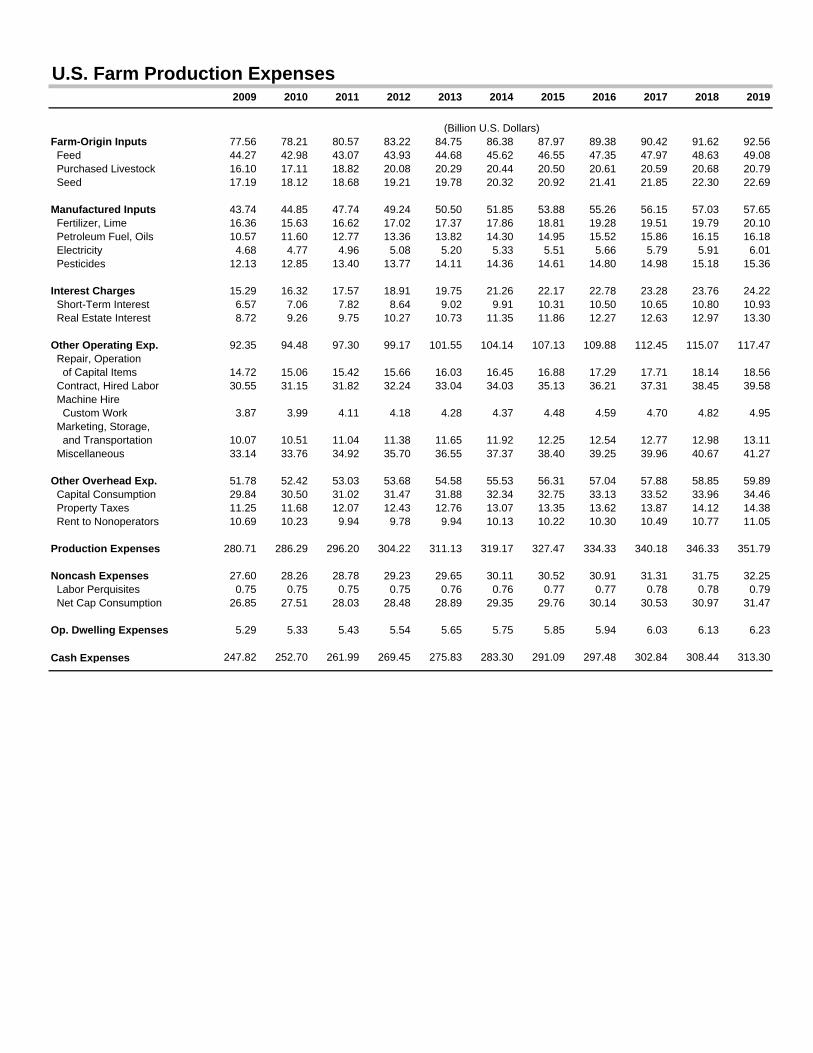
U.S. Farm Production Expenses2009 2010 2011 2012 2013 2014 2015 2016 2017 2018 2019
(Billion U.S. Dollars)Farm-Origin Inputs 77.56 78.21 80.57 83.22 84.75 86.38 87.97 89.38 90.42 91.62 92.56 Feed 44.27 42.98 43.07 43.93 44.68 45.62 46.55 47.35 47.97 48.63 49.08 Purchased Livestock 16.10 17.11 18.82 20.08 20.29 20.44 20.50 20.61 20.59 20.68 20.79 Seed 17.19 18.12 18.68 19.21 19.78 20.32 20.92 21.41 21.85 22.30 22.69
Manufactured Inputs 43.74 44.85 47.74 49.24 50.50 51.85 53.88 55.26 56.15 57.03 57.65 Fertilizer, Lime 16.36 15.63 16.62 17.02 17.37 17.86 18.81 19.28 19.51 19.79 20.10 Petroleum Fuel, Oils 10.57 11.60 12.77 13.36 13.82 14.30 14.95 15.52 15.86 16.15 16.18 Electricity 4.68 4.77 4.96 5.08 5.20 5.33 5.51 5.66 5.79 5.91 6.01 Pesticides 12.13 12.85 13.40 13.77 14.11 14.36 14.61 14.80 14.98 15.18 15.36
Interest Charges 15.29 16.32 17.57 18.91 19.75 21.26 22.17 22.78 23.28 23.76 24.22 Short-Term Interest 6.57 7.06 7.82 8.64 9.02 9.91 10.31 10.50 10.65 10.80 10.93 Real Estate Interest 8.72 9.26 9.75 10.27 10.73 11.35 11.86 12.27 12.63 12.97 13.30
Other Operating Exp. 92.35 94.48 97.30 99.17 101.55 104.14 107.13 109.88 112.45 115.07 117.47 Repair, Operation of Capital Items 14.72 15.06 15.42 15.66 16.03 16.45 16.88 17.29 17.71 18.14 18.56 Contract, Hired Labor 30.55 31.15 31.82 32.24 33.04 34.03 35.13 36.21 37.31 38.45 39.58 Machine Hire Custom Work 3.87 3.99 4.11 4.18 4.28 4.37 4.48 4.59 4.70 4.82 4.95 Marketing, Storage, and Transportation 10.07 10.51 11.04 11.38 11.65 11.92 12.25 12.54 12.77 12.98 13.11 Miscellaneous 33.14 33.76 34.92 35.70 36.55 37.37 38.40 39.25 39.96 40.67 41.27
Other Overhead Exp. 51.78 52.42 53.03 53.68 54.58 55.53 56.31 57.04 57.88 58.85 59.89 Capital Consumption 29.84 30.50 31.02 31.47 31.88 32.34 32.75 33.13 33.52 33.96 34.46 Property Taxes 11.25 11.68 12.07 12.43 12.76 13.07 13.35 13.62 13.87 14.12 14.38 Rent to Nonoperators 10.69 10.23 9.94 9.78 9.94 10.13 10.22 10.30 10.49 10.77 11.05
Production Expenses 280.71 286.29 296.20 304.22 311.13 319.17 327.47 334.33 340.18 346.33 351.79
Noncash Expenses 27.60 28.26 28.78 29.23 29.65 30.11 30.52 30.91 31.31 31.75 32.25 Labor Perquisites 0.75 0.75 0.75 0.75 0.76 0.76 0.77 0.77 0.78 0.78 0.79 Net Cap Consumption 26.85 27.51 28.03 28.48 28.89 29.35 29.76 30.14 30.53 30.97 31.47
Op. Dwelling Expenses 5.29 5.33 5.43 5.54 5.65 5.75 5.85 5.94 6.03 6.13 6.23
Cash Expenses 247.82 252.70 261.99 269.45 275.83 283.30 291.09 297.48 302.84 308.44 313.30
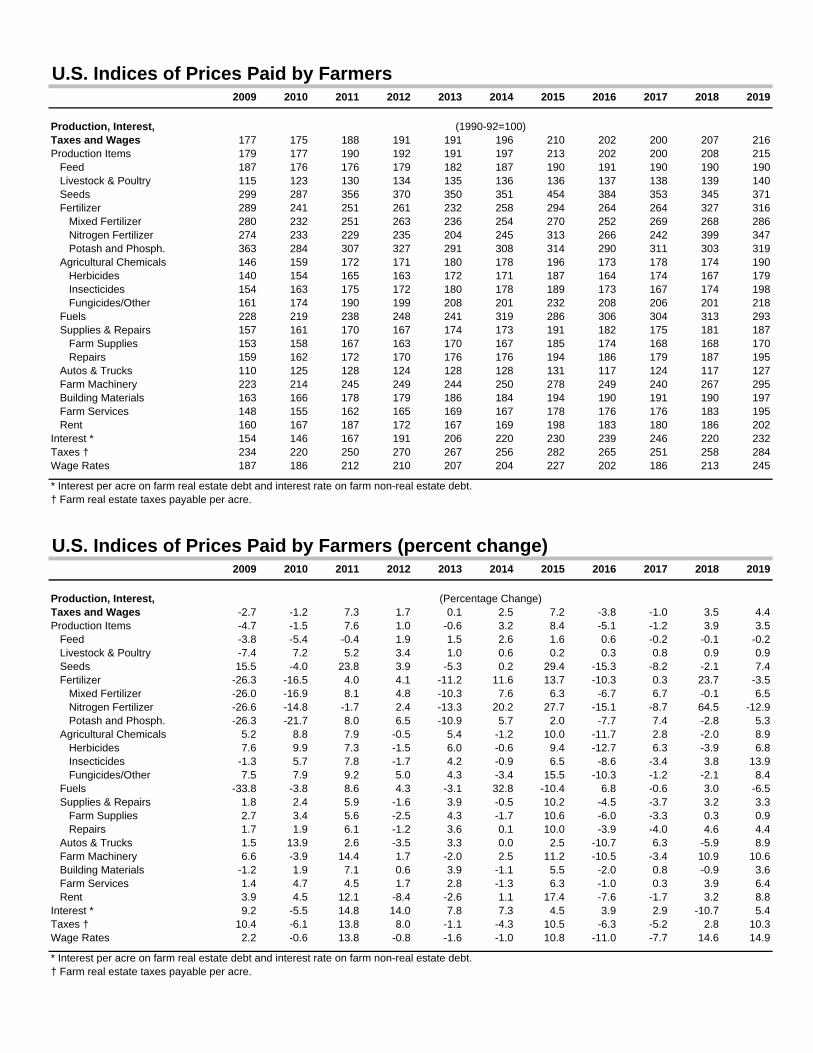
U.S. Indices of Prices Paid by Farmers2009 2010 2011 2012 2013 2014 2015 2016 2017 2018 2019
Production, Interest, (1990-92=100)Taxes and Wages 177 175 188 191 191 196 210 202 200 207 216Production Items 179 177 190 192 191 197 213 202 200 208 215
Feed 187 176 176 179 182 187 190 191 190 190 190Livestock & Poultry 115 123 130 134 135 136 136 137 138 139 140Seeds 299 287 356 370 350 351 454 384 353 345 371Fertilizer 289 241 251 261 232 258 294 264 264 327 316
Mixed Fertilizer 280 232 251 263 236 254 270 252 269 268 286Nitrogen Fertilizer 274 233 229 235 204 245 313 266 242 399 347Potash and Phosph. 363 284 307 327 291 308 314 290 311 303 319
Agricultural Chemicals 146 159 172 171 180 178 196 173 178 174 190Herbicides 140 154 165 163 172 171 187 164 174 167 179Insecticides 154 163 175 172 180 178 189 173 167 174 198Fungicides/Other 161 174 190 199 208 201 232 208 206 201 218
Fuels 228 219 238 248 241 319 286 306 304 313 293Supplies & Repairs 157 161 170 167 174 173 191 182 175 181 187
Farm Supplies 153 158 167 163 170 167 185 174 168 168 170Repairs 159 162 172 170 176 176 194 186 179 187 195
Autos & Trucks 110 125 128 124 128 128 131 117 124 117 127Farm Machinery 223 214 245 249 244 250 278 249 240 267 295Building Materials 163 166 178 179 186 184 194 190 191 190 197Farm Services 148 155 162 165 169 167 178 176 176 183 195Rent 160 167 187 172 167 169 198 183 180 186 202
Interest * 154 146 167 191 206 220 230 239 246 220 232Taxes † 234 220 250 270 267 256 282 265 251 258 284Wage Rates 187 186 212 210 207 204 227 202 186 213 245
* Interest per acre on farm real estate debt and interest rate on farm non-real estate debt.† Farm real estate taxes payable per acre.
U.S. Indices of Prices Paid by Farmers (percent change)2009 2010 2011 2012 2013 2014 2015 2016 2017 2018 2019
Production, Interest, (Percentage Change)Taxes and Wages -2.7 -1.2 7.3 1.7 0.1 2.5 7.2 -3.8 -1.0 3.5 4.4Production Items -4.7 -1.5 7.6 1.0 -0.6 3.2 8.4 -5.1 -1.2 3.9 3.5
Feed -3.8 -5.4 -0.4 1.9 1.5 2.6 1.6 0.6 -0.2 -0.1 -0.2Livestock & Poultry -7.4 7.2 5.2 3.4 1.0 0.6 0.2 0.3 0.8 0.9 0.9Seeds 15.5 -4.0 23.8 3.9 -5.3 0.2 29.4 -15.3 -8.2 -2.1 7.4Fertilizer -26.3 -16.5 4.0 4.1 -11.2 11.6 13.7 -10.3 0.3 23.7 -3.5
Mixed Fertilizer -26.0 -16.9 8.1 4.8 -10.3 7.6 6.3 -6.7 6.7 -0.1 6.5Nitrogen Fertilizer -26.6 -14.8 -1.7 2.4 -13.3 20.2 27.7 -15.1 -8.7 64.5 -12.9Potash and Phosph. -26.3 -21.7 8.0 6.5 -10.9 5.7 2.0 -7.7 7.4 -2.8 5.3
Agricultural Chemicals 5.2 8.8 7.9 -0.5 5.4 -1.2 10.0 -11.7 2.8 -2.0 8.9Herbicides 7.6 9.9 7.3 -1.5 6.0 -0.6 9.4 -12.7 6.3 -3.9 6.8Insecticides -1.3 5.7 7.8 -1.7 4.2 -0.9 6.5 -8.6 -3.4 3.8 13.9Fungicides/Other 7.5 7.9 9.2 5.0 4.3 -3.4 15.5 -10.3 -1.2 -2.1 8.4
Fuels -33.8 -3.8 8.6 4.3 -3.1 32.8 -10.4 6.8 -0.6 3.0 -6.5Supplies & Repairs 1.8 2.4 5.9 -1.6 3.9 -0.5 10.2 -4.5 -3.7 3.2 3.3
Farm Supplies 2.7 3.4 5.6 -2.5 4.3 -1.7 10.6 -6.0 -3.3 0.3 0.9Repairs 1.7 1.9 6.1 -1.2 3.6 0.1 10.0 -3.9 -4.0 4.6 4.4
Autos & Trucks 1.5 13.9 2.6 -3.5 3.3 0.0 2.5 -10.7 6.3 -5.9 8.9Farm Machinery 6.6 -3.9 14.4 1.7 -2.0 2.5 11.2 -10.5 -3.4 10.9 10.6Building Materials -1.2 1.9 7.1 0.6 3.9 -1.1 5.5 -2.0 0.8 -0.9 3.6Farm Services 1.4 4.7 4.5 1.7 2.8 -1.3 6.3 -1.0 0.3 3.9 6.4Rent 3.9 4.5 12.1 -8.4 -2.6 1.1 17.4 -7.6 -1.7 3.2 8.8
Interest * 9.2 -5.5 14.8 14.0 7.8 7.3 4.5 3.9 2.9 -10.7 5.4Taxes † 10.4 -6.1 13.8 8.0 -1.1 -4.3 10.5 -6.3 -5.2 2.8 10.3Wage Rates 2.2 -0.6 13.8 -0.8 -1.6 -1.0 10.8 -11.0 -7.7 14.6 14.9
* Interest per acre on farm real estate debt and interest rate on farm non-real estate debt.† Farm real estate taxes payable per acre.
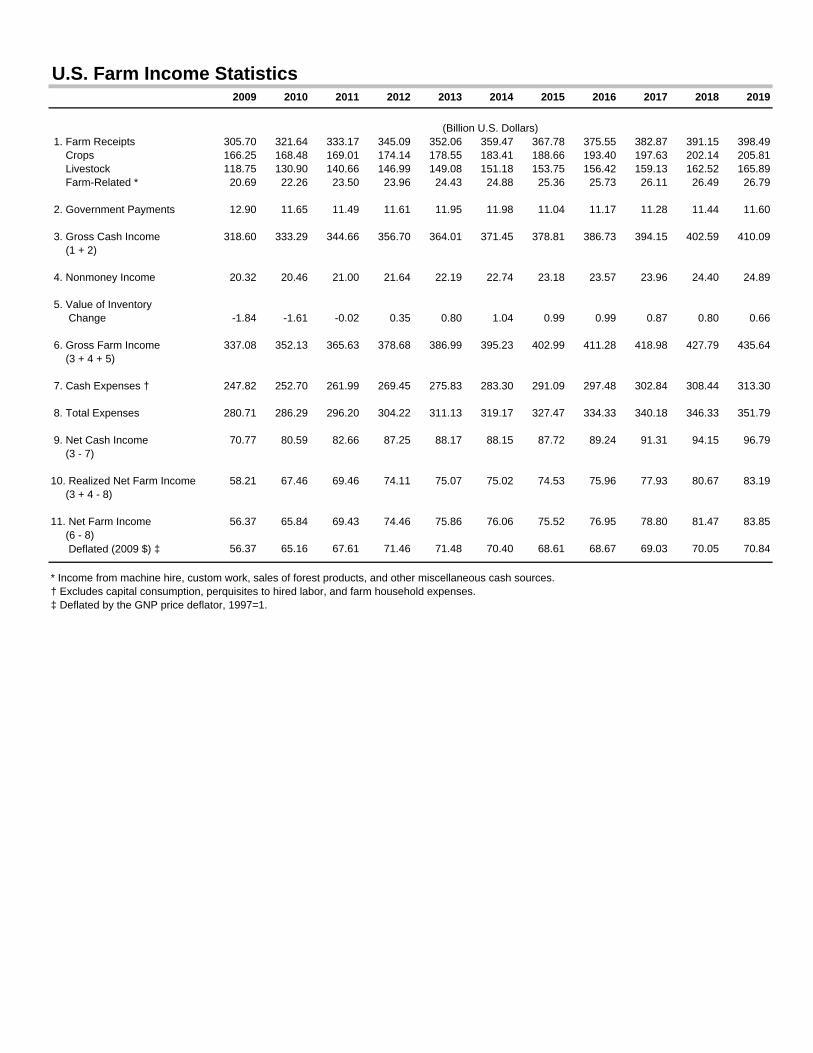
U.S. Farm Income Statistics2009 2010 2011 2012 2013 2014 2015 2016 2017 2018 2019
(Billion U.S. Dollars) 1. Farm Receipts 305.70 321.64 333.17 345.09 352.06 359.47 367.78 375.55 382.87 391.15 398.49 Crops 166.25 168.48 169.01 174.14 178.55 183.41 188.66 193.40 197.63 202.14 205.81 Livestock 118.75 130.90 140.66 146.99 149.08 151.18 153.75 156.42 159.13 162.52 165.89 Farm-Related * 20.69 22.26 23.50 23.96 24.43 24.88 25.36 25.73 26.11 26.49 26.79
2. Government Payments 12.90 11.65 11.49 11.61 11.95 11.98 11.04 11.17 11.28 11.44 11.60
3. Gross Cash Income 318.60 333.29 344.66 356.70 364.01 371.45 378.81 386.73 394.15 402.59 410.09 (1 + 2)
4. Nonmoney Income 20.32 20.46 21.00 21.64 22.19 22.74 23.18 23.57 23.96 24.40 24.89
5. Value of Inventory Change -1.84 -1.61 -0.02 0.35 0.80 1.04 0.99 0.99 0.87 0.80 0.66
6. Gross Farm Income 337.08 352.13 365.63 378.68 386.99 395.23 402.99 411.28 418.98 427.79 435.64 (3 + 4 + 5)
7. Cash Expenses † 247.82 252.70 261.99 269.45 275.83 283.30 291.09 297.48 302.84 308.44 313.30
8. Total Expenses 280.71 286.29 296.20 304.22 311.13 319.17 327.47 334.33 340.18 346.33 351.79
9. Net Cash Income 70.77 80.59 82.66 87.25 88.17 88.15 87.72 89.24 91.31 94.15 96.79 (3 - 7)
10. Realized Net Farm Income 58.21 67.46 69.46 74.11 75.07 75.02 74.53 75.96 77.93 80.67 83.19 (3 + 4 - 8)
11. Net Farm Income 56.37 65.84 69.43 74.46 75.86 76.06 75.52 76.95 78.80 81.47 83.85 (6 - 8) Deflated (2009 $) ‡ 56.37 65.16 67.61 71.46 71.48 70.40 68.61 68.67 69.03 70.05 70.84
* Income from machine hire, custom work, sales of forest products, and other miscellaneous cash sources.† Excludes capital consumption, perquisites to hired labor, and farm household expenses.‡ Deflated by the GNP price deflator, 1997=1.
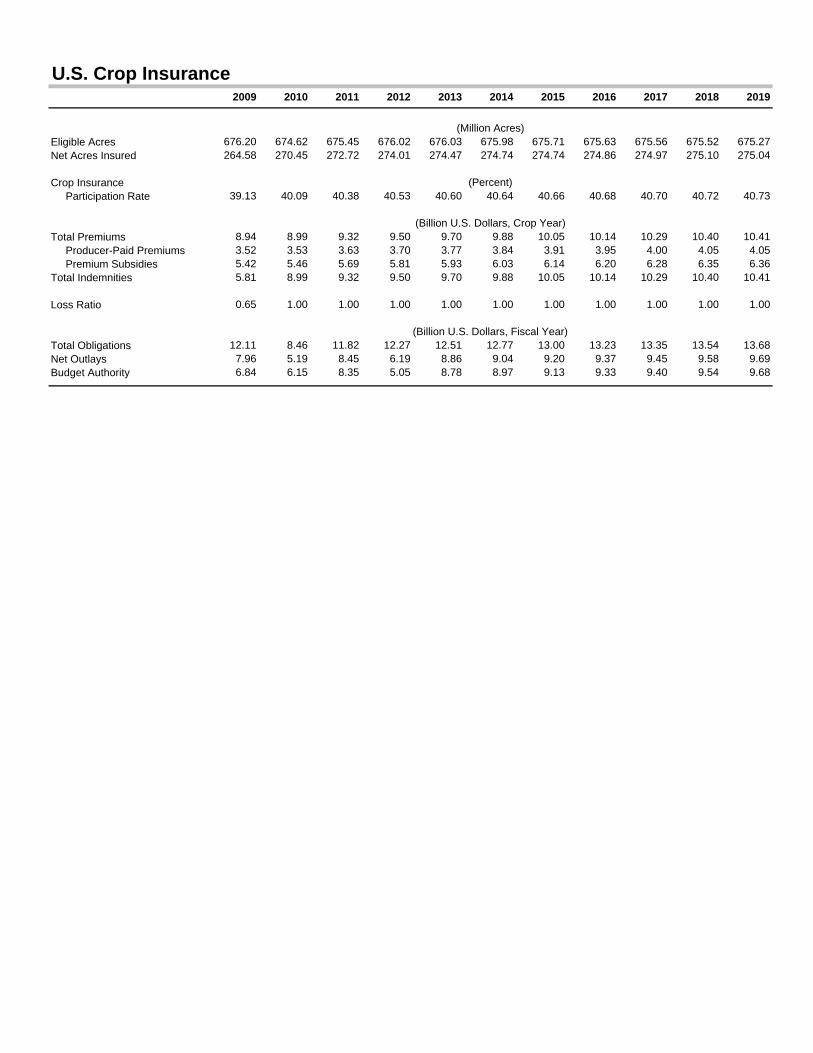
U.S. Crop Insurance2009 2010 2011 2012 2013 2014 2015 2016 2017 2018 2019
(Million Acres)Eligible Acres 676.20 674.62 675.45 676.02 676.03 675.98 675.71 675.63 675.56 675.52 675.27Net Acres Insured 264.58 270.45 272.72 274.01 274.47 274.74 274.74 274.86 274.97 275.10 275.04
Crop Insurance (Percent) Participation Rate 39.13 40.09 40.38 40.53 40.60 40.64 40.66 40.68 40.70 40.72 40.73
(Billion U.S. Dollars, Crop Year)Total Premiums 8.94 8.99 9.32 9.50 9.70 9.88 10.05 10.14 10.29 10.40 10.41 Producer-Paid Premiums 3.52 3.53 3.63 3.70 3.77 3.84 3.91 3.95 4.00 4.05 4.05 Premium Subsidies 5.42 5.46 5.69 5.81 5.93 6.03 6.14 6.20 6.28 6.35 6.36Total Indemnities 5.81 8.99 9.32 9.50 9.70 9.88 10.05 10.14 10.29 10.40 10.41
Loss Ratio 0.65 1.00 1.00 1.00 1.00 1.00 1.00 1.00 1.00 1.00 1.00
(Billion U.S. Dollars, Fiscal Year)Total Obligations 12.11 8.46 11.82 12.27 12.51 12.77 13.00 13.23 13.35 13.54 13.68Net Outlays 7.96 5.19 8.45 6.19 8.86 9.04 9.20 9.37 9.45 9.58 9.69Budget Authority 6.84 6.15 8.35 5.05 8.78 8.97 9.13 9.33 9.40 9.54 9.68