Embed Size (px)
Citation preview

IP Portfolio Optimization
Taylor HawesCFO & GM, IP & LicensingMicrosoft Corporation
March 3, 2010

IP Overview and technology patent landscape
Dynamic macro environment
IP optimization framework
Financial objectives for portfolio optimization
Portfolio optimization benefits
Conceptual value matrix
Case study: investment valuation
Case study: competitive landscape
Discussion Summary

IP Overview and Technology Patent Landscape
U.S. Technology Patent Landscape
Patents Leveraged for Multiple Purposes
Total: 1,800,00
0
Top 100 Tech:
~300,000
Tech Patents: ~700,000
Secondary Market: ~20,000
Microsoft:
Protect R&D Innovation
Influence Standards
Cross-License Collaboration
Patent Monetization
Risk Mitigation
Four IP Categories
Patent
Trade Secret
Copyright
Trademark

Dynamic Macro Environment
IP & Licensing Goals Competition
•Capital market uncertainty
•Global legislative and political landscape
• Earnings commitments and margin management
Economy Secondary Market
•Relentless global competition
•Open source environments
•Rapid innovation of product life cycles
• Emerging technologies
• Top 5 patent filer for quantity and quality
• Tighter IP and business strategy alignment
•Maximize return on investment
•Monetize where appropriate
•Maturing secondary market
•Ramp in number of assertions
• Investment options to strengthen portfolio
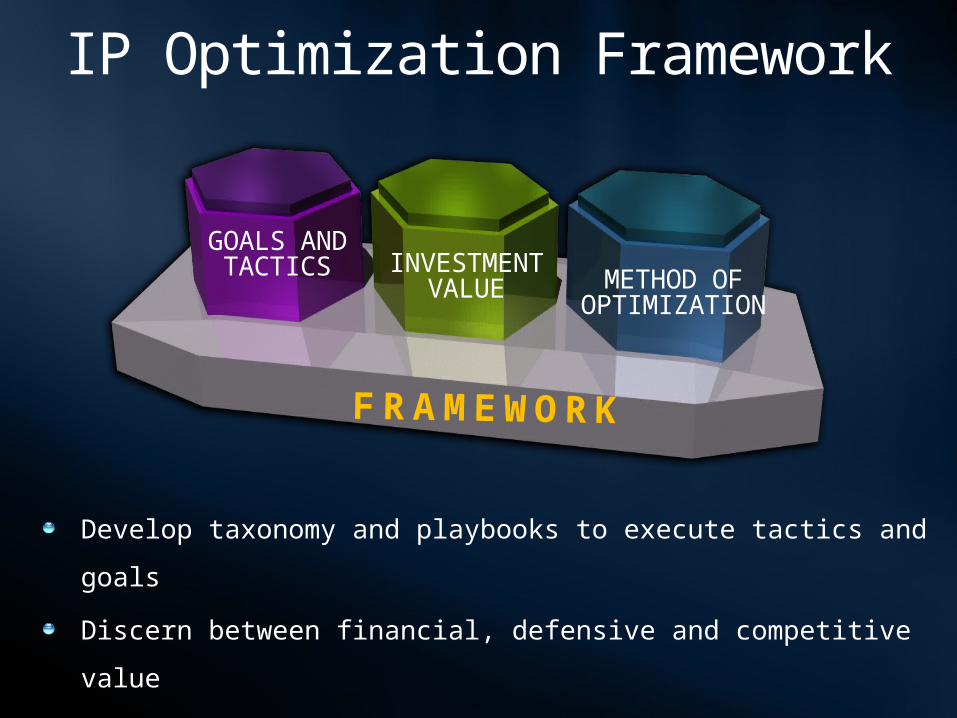
IP Optimization Framework
Develop taxonomy and playbooks to execute tactics and goals
Discern between financial, defensive and competitive value
Design portfolio optimization techniques given constraints and
objectives
METHOD OF OPTIMIZATION
INVESTMENT VALUE
GOALS AND TACTICS
F R A M E W O R K
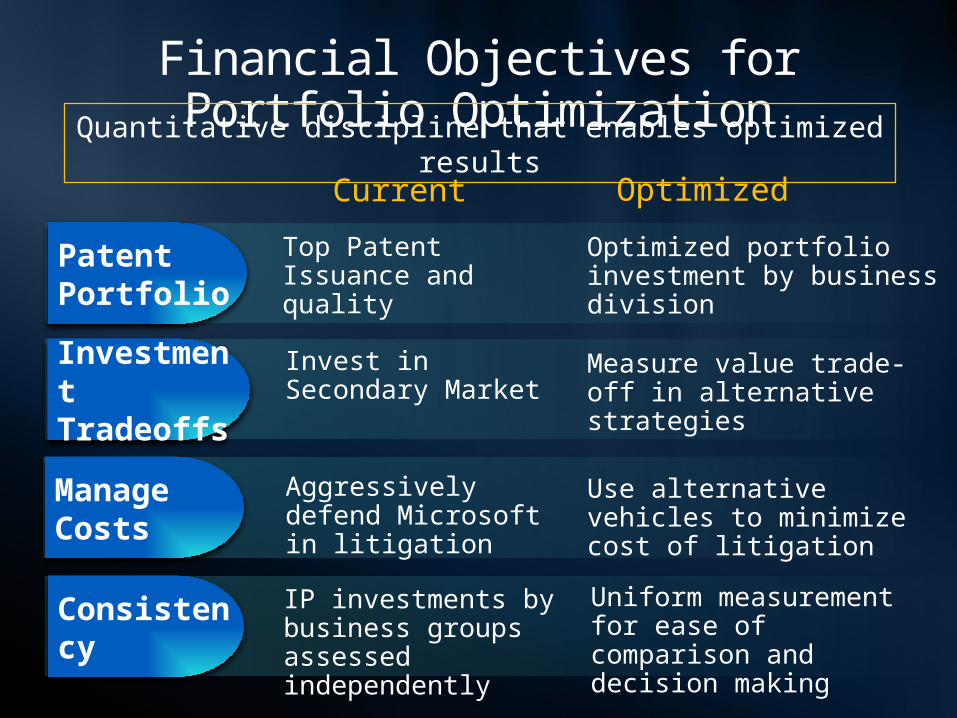
Financial Objectives for Portfolio Optimization
Current
Top Patent Issuance and quality
Invest in Secondary Market
Aggressively defend Microsoft in litigation
IP investments by business groups assessed independently
Optimized portfolio investment by business division
Measure value trade-off in alternative strategies
Use alternative vehicles to minimize cost of litigation
Uniform measurement for ease of comparison and decision making
Quantitative discipline that enables optimized results
Manage Costs
Consistency
Investment Tradeoffs
Patent Portfolio
Optimized

Portfolio Optimization Benefits
Financial ClarityFunding weighted by highest ROI tactics and goalsInvestment return segmented by type of value with associated riskCompare similar IP investments for tradeoff potential
Efficient ExecutionTactics are targeted and aligned to highest priority goals by relevancyPlaybooks ensure consistent and comprehensive completionBest practices are leveraged across business groups

Conceptual Value Matrix
Organizes investments into categories for clearer
communication
Provides a clear correlation between tactics and type of value
created
Measures investments by assets and liabilities resulting in
closer relationship to the income statement and balance sheet.
Defensive Risk
Conflicts
Internal Investment
External Investment
s
Assets / Liabilities
Financial
Enterprise Value Creation
$
$
$
$
$
$
$
$
$
Investment
Cost
Tactics Map to Matrix
$
$
$
Competitive
$
Total
$
$

Cost & Financial Value
Competitive ValueDefensive & Risk ValueDetermine potential
internal cost and damages if patents owned and asserted by a 3rd party:
- Number of assertions- Probability of assertion- Potential settlement cost- Legal fees- R&D feature work-
arounds
Moderate risk on return
Connect the technology acquired to business success:
- Market share- Time to market- Average selling price- Cost efficiencies
High risk on return
Cost represents the initial payment and subsequent cash outflows (e.g. maintenance fees)
Transactional cash inflows comprise financial value:
- Patent purchase price- Outbound licensing
revenue
Low risk on return Conclusion
$66M is a positive return, but will turn to breakeven without the high risk competitive value. There is significant risk to this investment.
Defensive Risk
External Investmen
t
Financial
Enterprise Value Creation
$10 $30M $16M($50M)
Investment
Cost Total NPV
$66M
Competitive
$65M
Case Study: Valuing a Patent Purchase

Portfolio Gap Analysis
Patent Filing RateRisk Assessment
Evaluate the size of the revenue pool associated with patent counts from each technology area.
Determine whether products with material revenue are exposed or protected relative to the competitor(s) using a weighted ratio.
Combinations of technology areas comprise products.
To determine the correct volume of patents to file, the portfolio life cycle is charted (below).
Depending on desired issuance levels, the number of patents to be filed in future years are calculated.
Analyze how well our portfolio aligns to one or more competitors for existing and emerging technology areas.
Product Category
Exposure Ratio
Product A 3.0 : 1
Product B 0.5 : 1
Product C 1 .0: 1 Quality of patents is an important variable and is an overlay to the quantity analysis above.
Case Study: Competitive Landscape

© 2010 Microsoft Corporation. All rights reserved. Microsoft, Windows, Windows Vista and other product names are or may be registered trademarks and/or trademarks in the U.S. and/or other countries.
The information herein is for informational purposes only and represents the current view of Microsoft Corporation as of the date of this presentation. Because Microsoft must respond to changing market conditions, it should not be interpreted to be a commitment on the part of Microsoft, and Microsoft cannot guarantee the accuracy of any information provided after
the date of this presentation. MICROSOFT MAKES NO WARRANTIES, EXPRESS, IMPLIED OR STATUTORY, AS TO THE INFORMATION IN THIS PRESENTATION.