Embed Size (px)
Citation preview
1
U.S. SUSTAINABLE GROWTH FUND REVIEW AND OUTLOOKThird Quarter 2021
Please see disclosure statements at the end of this presentation for additional information and for a complete list of terms and definitions.
For Marketing Purposes
The strategy recorded strong gains during the quarter and beat its benchmark, the Russell 1000® Growth Index. The strategy also finished ahead of its benchmark for the first nine months of 2021.
While we ended the quarter with a modest gain, investor sentiment soured toward the end of the period, for several reasons. Supply chain bottlenecks brought on by Covid have not eased and factors such as labor shortages and China’s power-sector interruptions have exacerbated the issue. We have also seen higher-than-expected inflation, a real estate debt scenario in China that may be simultaneously too big to fail and too big to save, and political stalemates in the U.S.
But economic momentum has been strong, and the worst impacts of the Delta variant seem to have passed. Quality growth stocks led the market in Q3, supporting our results. We were pleased with the underlying performance of our companies and made relatively few changes to the portfolio.
In prior communications, we have discussed the positive impact of the COVID response on many of our health care companies. Given the ephemeral nature of the pandemic, we recognize that many of these companies could be “over-earning” in the short-term. Growth rates for Thermo Fisher, Danaher, Bio-Rad and West Pharmaceuticals may come down as COVID testing wanes and vaccination rates fall. Rather than selling names that we still favor fundamentally, we have taken other steps to manage risk: trimming to manage risk and position size, and importantly keeping a multiyear investment perspective, to help us separate short-term macro-related headwinds/tailwinds from an underlying long-term fundamental thesis. We always come back to the thesis, and in the case of these health care names, we believe our thesis is not only intact but has strengthened throughout the pandemic. For example, during the quarter, Thermo Fisher and Danaher both raised long-term growth forecasts thanks to improved positions in biologics and cell and gene therapies.
Strong performance within health care and information technology contributed to Q3 gains. Within technology, many of our software and semiconductor names performed well, including Monolithic Power Systems, Dynatrace and Intuit. Monolithic’s share gains in analog power management are in large part due to new, energy-efficient product introductions. During the period, Dynatrace acquired SpectXto bolster its position in security for hybrid, multicloud environments. Intuit followed its Credit Karma acquisition with another large deal, acquiring MailChimp to become a full solution, one-stop-shop for small businesses.
We took advantage of market weakness to add to several positions including Autodesk, Analog Devices, and American Tower. In our view, all three are undervalued based on our cash flow projections. At the same time, we trimmed some larger positions to manage risk, including Danaher, Bio-Rad and ServiceNow. Trimming position and sector exposure diligently is a key step for risk management in our view. We have a maximum size threshold of 5% for individual positions. Similarly, we will periodically trim outsized positions to manage sector risk. The trims of Danaher and Bio-Rad are good examples of adhering to this discipline, given our overweight within health care.
We added one new position in Q3, Enphase Energy, and partially trimmed our Accenture position to make room in the portfolio. Accenture has performed well for us, but we believe Enphase has better growth potential and some compelling new avenues to increase its total addressable market. Enphase is a leading supplier of micro-inverter technology products for use in distributed photovoltaic systems. The company primarily sells home energy solutions that connect energy generation, energy storage and control management software on one platform. Enphase’s fundamental strengths include a first mover advantage in micro-inverter technology, an asset-light business model and a reliable, trusted brand among installer partners. Enphase’s Sustainable Business Advantage (SBA) is its critical role in providing renewable energy for domestic residential customers. Going forward, we believe Enphase will help residential customers become increasingly grid-independent by providing more advanced systems that include battery storage and advanced home energy management solutions.
We remain fully invested and disciplined in our process of finding investment opportunities at the intersection of strong fundamentals, sustainable business advantages and attractive valuations. This philosophy has served us well for nearly 12 years, and we believe it will continue to do so in the years ahead.
SECTOR DIVERSIFICATION
GICS SECTOR
U.S.
SUSTAINAB
LE GROWTH
UCITS FUND
(%)
RUSSELL
1000®
GROWTH
INDEX
(%)
DIFFERENC
E
(%)
U.S. SUSTAINABLE
GROWTH
UCITS FUND
(%)
Q3 2021 Q3 2021 Q3 2021 Q2’2021 Q3’2020
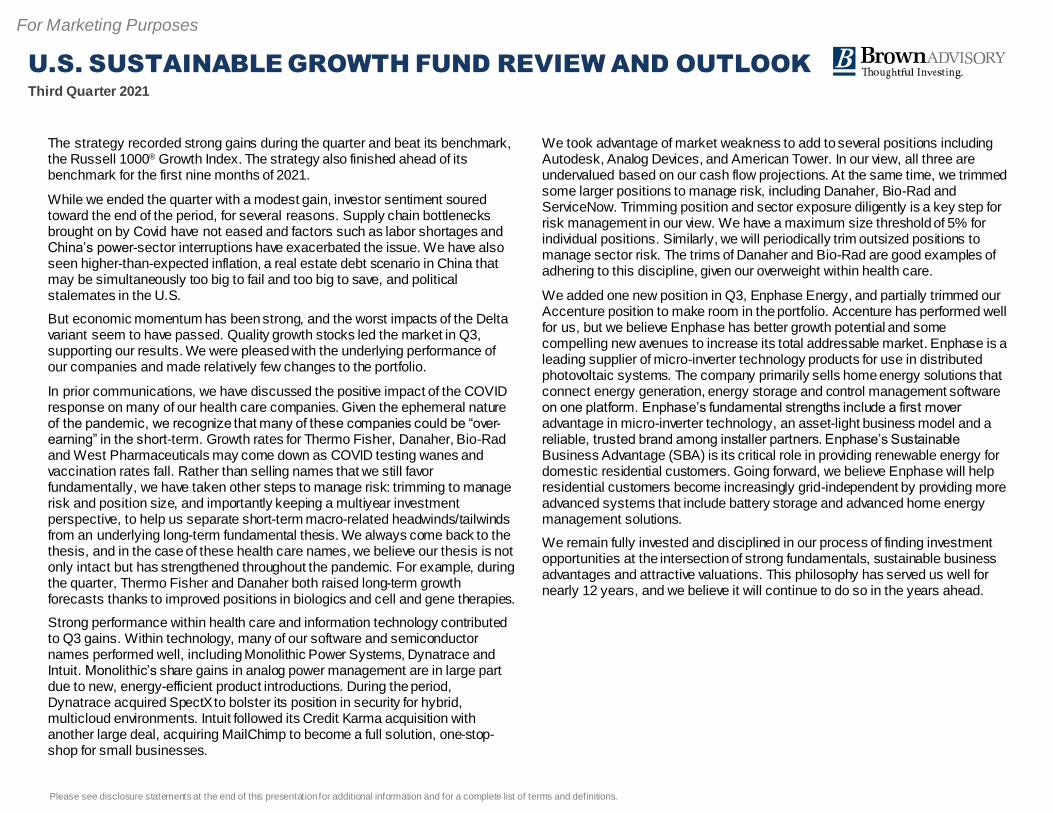
Communication Services 4.45 12.73 -8.28 4.25 3.68
Consumer Discretionary 13.98 18.44 -4.46 14.88 15.59
Consumer Staples -- 3.83 -3.83 -- --
Energy -- 0.29 -0.29 -- --
Financials 2.89 2.46 0.43 2.65 --
Health Care 23.58 9.05 14.53 23.01 24.30
Industrials 6.71 5.58 1.13 5.20 8.31
Information Technology 41.85 44.86 -3.01 43.04 38.52
Materials 1.68 1.08 0.60 1.73 4.53
Real Estate 3.79 1.66 2.13 3.84 4.07
Utilities -- 0.03 -0.03 -- --
Source: FactSet®. The information provided in this material is not intended to be and should not be considered to be a recommendation or suggestion to engage in or refrain from a particular course of action or to make or hold a particular inv estment or pursue a particular investment strategy, including whether or not to buy, sell, or hold any of the securities mentioned. It should not be assumed that investments in such securities have been or will be
prof itable. The portfolio information provided is based on the Brown Advisory U.S. Sustainable Growth UCITS Fund. Sector diversification includes cash and cash equivalents. Sectors are based on the Global Industry Classification Standard (GICS®) classification system. Please see disclosure statements at the end of this presentation for additional information and for a complete list of terms and definitions.
Third Quarter 2021
Sector allocation in both absolute and relative terms did not change meaningfully during the quarter.
The portfolio is overweight health care and underweight consumer staples and communication services. We do not use sector rotation as a driver of return. Our sector weightings are primarily determined by where we find opportunities in our bottom-up stock selection process.
QUARTER-TO-DATE ATTRIBUTION DETAIL BY SECTOR
Source: FactSet. The inf ormation provided in this material is not intended to be and should not be considered to be a recommendation or suggestion to engage in or ref rain from a particular course of action or to make or hold a particular inv estment or pursue a particular investment strategy, including whether or not to buy, sell, or hold any of the securities mentioned. It should not be assumed that investments in such securities have been or will be
prof itable. Total portfolio return figures provided above reflect the sum of the returns of the equity holdings in the representative account portfolio due to price movements and dividend payments or other sources of income, and exclude cash. The portfolio information provided is based on the Brown Advisory U.S. Sustainable Growth UCITS Fund. Sectors are based on the Global Industry Classification Standard (GICS) classification system. Sector
attribution includes cash and cash equivalents. Please see disclosure statements at the end of this presentation for additional information and for a complete list of terms and definitions.
U.S. SUSTAINABLE GROWTH
UCITS FUND
RUSSELL 1000® GROWTH TOTAL
RETURN INDEXATTRIBUTION ANALYSIS
GICS SECTOR AVERAGE
WEIGHT (%) RETURN (%)
AVERAGE
WEIGHT (%) RETURN (%)
ALLOCATION
EFFECT (%)
SELECTION &
INTERACTION
EFFECT (%)
TOTAL EFFECT
(%)
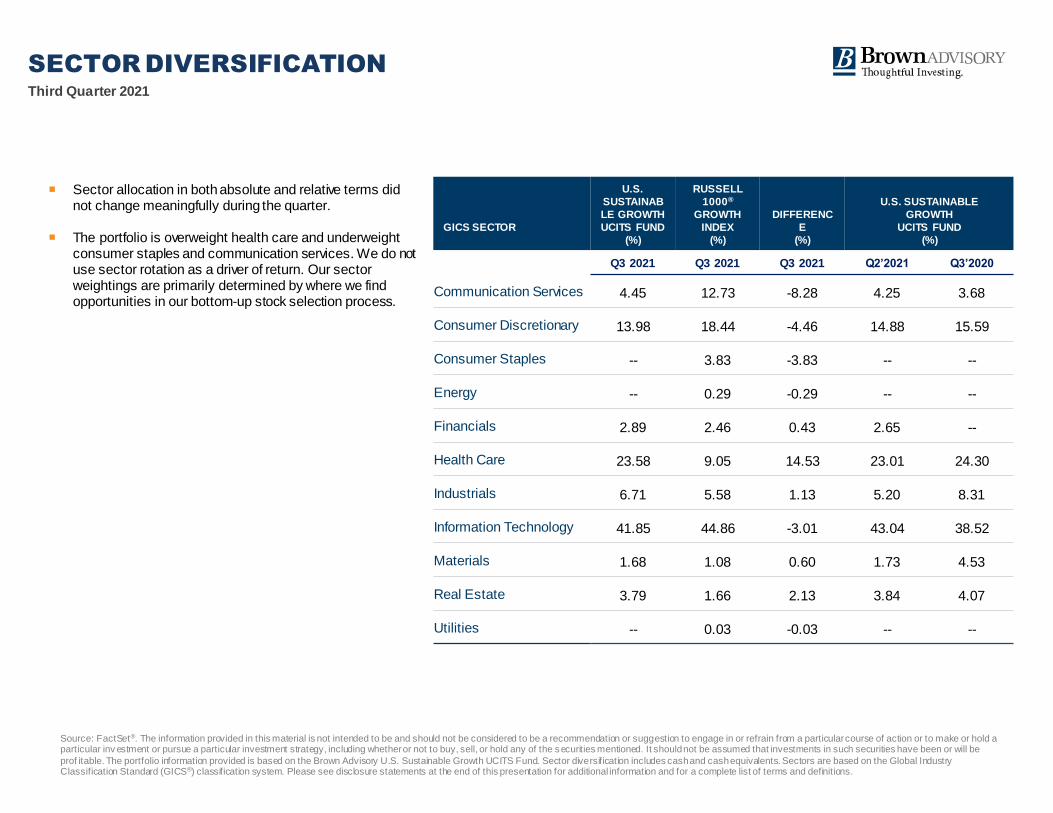
Communication Services 4.42 9.49 12.63 3.29 -0.16 0.26 0.10
Consumer Discretionary 14.29 -3.73 18.25 -0.34 0.06 -0.43 -0.37
Consumer Staples -- -- 3.84 0.39 0.04 -- 0.04
Energy -- -- 0.25 5.67 -- -- --
Financials 2.83 14.31 2.42 6.12 0.03 0.21 0.24
Health Care 23.61 8.75 9.11 3.54 0.37 1.11 1.49
Industrials 5.92 5.21 5.76 -5.71 0.01 0.62 0.62
Information Technology 42.10 6.21 44.88 1.62 -- 1.84 1.84
Materials 1.72 1.50 1.11 -1.36 -0.01 0.06 0.05
Real Estate 3.91 -1.28 1.72 -2.32 -0.07 0.05 -0.01
Utilities -- -- 0.03 0.03 0.01 -- 0.01
Total 100.00 5.17 100.00 1.16 0.29 3.72 4.02
Third Quarter 2021
Stock-specif ic performance w as strongest w ithin our information technology and health care holdings, w hile consumer discretionar y w as w eaker during the period.
Our overw eight in health care helped our results as the sector outperformed the benchmark during the quarter. Conversely, our underw eight in communication services detracted
from performance.
Within information technology, returns w ere led by many of our companies in softw are and semiconductors. Softw are vendors Dynatrace and Intuit had attractive results and
Monolithic Pow er Systems led the w ay in semiconductors.
Verisk Analytics contributed to positive results in industrials. Despite a slow dow n in the company’s f inancial services and energy businesses, Verisk’s insurance analytics
business continues to post very solid, consistent grow th given its dominant position w ithin the property and casualty industr y.
MSCI, our only holding in f inancials, outpaced the benchmark during the period. Strong performance from the company’s index and ESG/climate businesses led to better-than-
expected results.
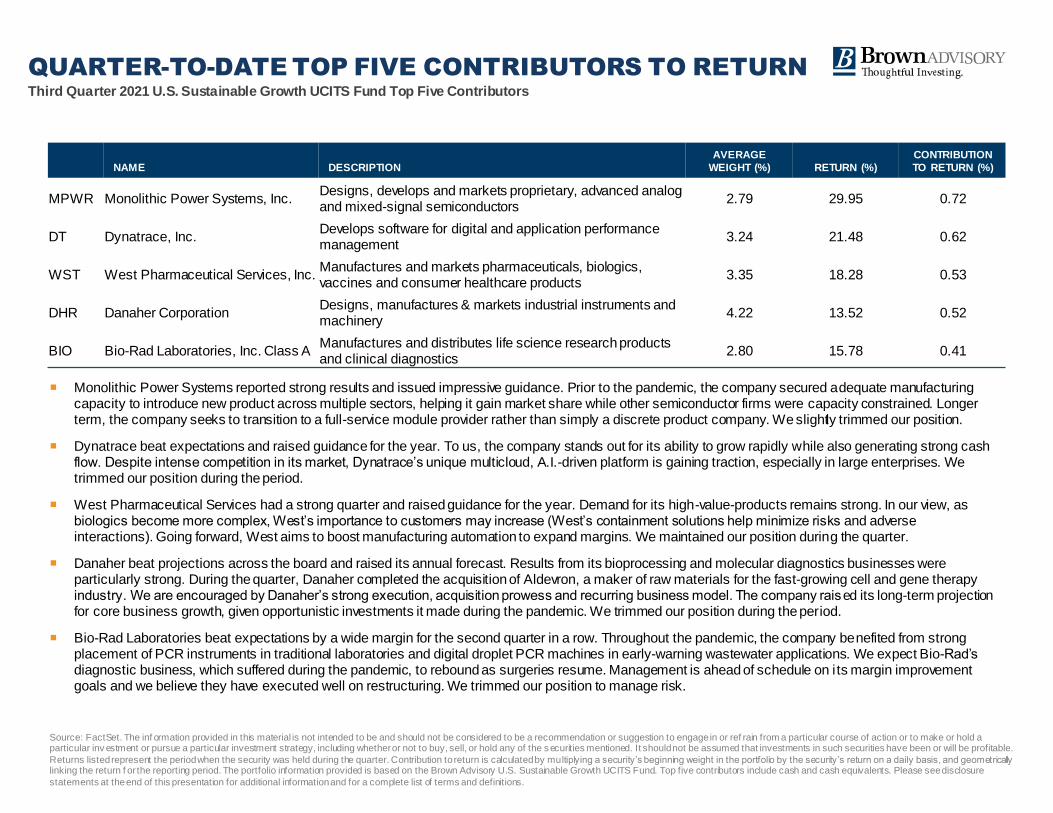
Third Quarter 2021 U.S. Sustainable Growth UCITS Fund Top Five Contributors
QUARTER-TO-DATE TOP FIVE CONTRIBUTORS TO RETURN
NAME DESCRIPTION
AVERAGE
WEIGHT (%) RETURN (%)
CONTRIBUTION
TO RETURN (%)
MPWR Monolithic Power Systems, Inc.Designs, develops and markets proprietary, advanced analog and mixed-signal semiconductors
2.79 29.95 0.72
DT Dynatrace, Inc.Develops software for digital and application performance management
3.24 21.48 0.62
WST West Pharmaceutical Services, Inc.Manufactures and markets pharmaceuticals, biologics, vaccines and consumer healthcare products
3.35 18.28 0.53
DHR Danaher CorporationDesigns, manufactures & markets industrial instruments and machinery
4.22 13.52 0.52
BIO Bio-Rad Laboratories, Inc. Class AManufactures and distributes life science research products and clinical diagnostics
2.80 15.78 0.41
Source: FactSet. The inf ormation provided in this material is not intended to be and should not be considered to be a recommendation or suggestion to engage in or ref rain from a particular course of action or to make or hold a particular inv estment or pursue a particular investment strategy, including whether or not to buy, sell, or hold any of the securities mentioned. It should not be assumed that investments in such securities have been or will be profitable.
Returns listed represent the period when the security was held during the quarter. Contribution to return is calculated by multiplying a security’s beginning weight in the portfolio by the security’s return on a daily basis, and geometrically linking the return f or the reporting period. The portfolio information provided is based on the Brown Advisory U.S. Sustainable Growth UCITS Fund. Top five contributors include cash and cash equivalents. Please see disclosure
statements at the end of this presentation for additional information and for a complete list of terms and definitions.
Monolithic Power Systems reported strong results and issued impressive guidance. Prior to the pandemic, the company secured adequate manufacturing capacity to introduce new product across multiple sectors, helping it gain market share while other semiconductor firms were capacity constrained. Longer term, the company seeks to transition to a full-service module provider rather than simply a discrete product company. We slightly trimmed our position.
Dynatrace beat expectations and raised guidance for the year. To us, the company stands out for its ability to grow rapidly while also generating strong cash flow. Despite intense competition in its market, Dynatrace’s unique multicloud, A.I.-driven platform is gaining traction, especially in large enterprises. We trimmed our position during the period.
West Pharmaceutical Services had a strong quarter and raised guidance for the year. Demand for its high-value-products remains strong. In our view, as biologics become more complex, West’s importance to customers may increase (West’s containment solutions help minimize risks and adverse interactions). Going forward, West aims to boost manufacturing automation to expand margins. We maintained our position during the quarter.
Danaher beat projections across the board and raised its annual forecast. Results from its bioprocessing and molecular diagnostics businesses were particularly strong. During the quarter, Danaher completed the acquisition of Aldevron, a maker of raw materials for the fast-growing cell and gene therapy industry. We are encouraged by Danaher’s strong execution, acquisition prowess and recurring business model. The company raised its long-term projection for core business growth, given opportunistic investments it made during the pandemic. We trimmed our position during the period.
Bio-Rad Laboratories beat expectations by a wide margin for the second quarter in a row. Throughout the pandemic, the company benefited from strong placement of PCR instruments in traditional laboratories and digital droplet PCR machines in early-warning wastewater applications. We expect Bio-Rad’s diagnostic business, which suffered during the pandemic, to rebound as surgeries resume. Management is ahead of schedule on i ts margin improvement goals and we believe they have executed well on restructuring. We trimmed our position to manage risk.
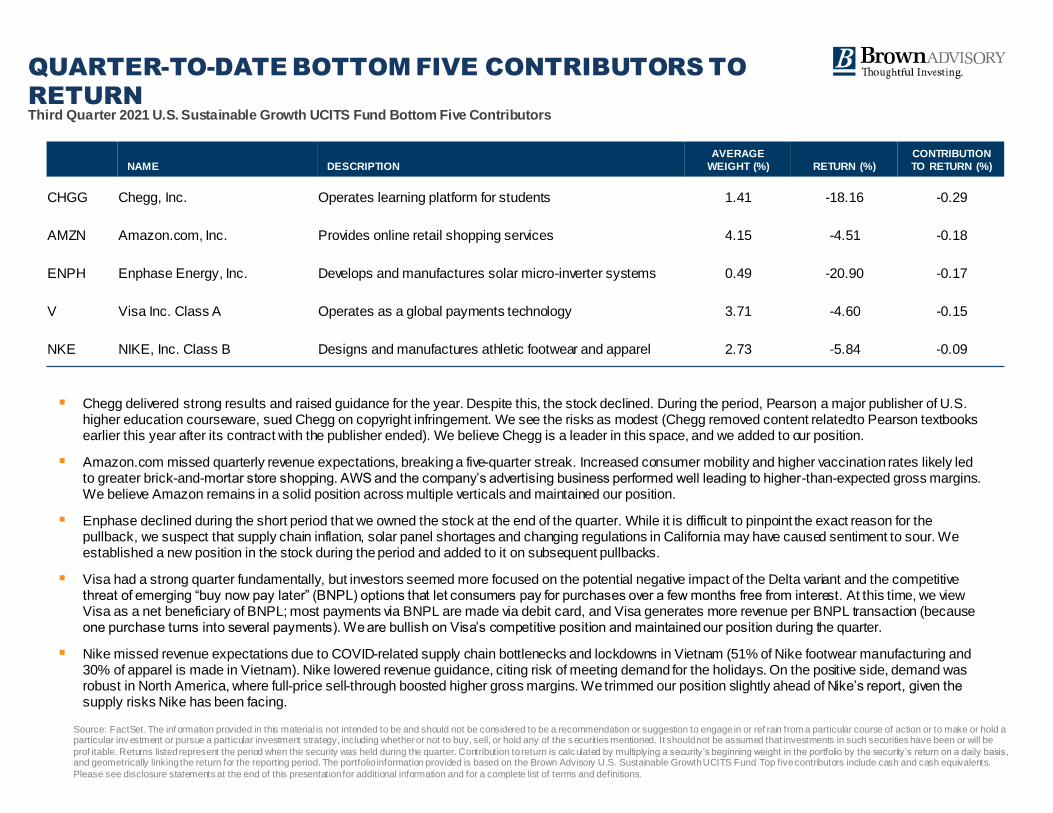
Third Quarter 2021 U.S. Sustainable Growth UCITS Fund Bottom Five Contributors
QUARTER-TO-DATE BOTTOM FIVE CONTRIBUTORS TO
RETURN
Source: FactSet. The inf ormation provided in this material is not intended to be and should not be considered to be a recommendation or suggestion to engage in or ref rain from a particular course of action or to make or hold a particular inv estment or pursue a particular investment strategy, including whether or not to buy, sell, or hold any of the s ecurities mentioned. It should not be assumed that investments in such securities have been or will be
prof itable. Returns listed represent the period when the security was held during the quarter. Contribution to return is calculated by multiplying a security’s beginning weight in the portfolio by the security’s return on a daily basis, and geometrically linking the return for the reporting period. The portfolio information provided is based on the Brown Advisory U.S. Sustainable Growth UCITS Fund. Top five contributors include cash and cash equivalents.
Please see disclosure statements at the end of this presentation for additional information and for a complete list of terms and definitions.
NAME DESCRIPTION
AVERAGE
WEIGHT (%) RETURN (%)
CONTRIBUTION
TO RETURN (%)
CHGG Chegg, Inc. Operates learning platform for students 1.41 -18.16 -0.29
AMZN Amazon.com, Inc. Provides online retail shopping services 4.15 -4.51 -0.18
ENPH Enphase Energy, Inc. Develops and manufactures solar micro-inverter systems 0.49 -20.90 -0.17
V Visa Inc. Class A Operates as a global payments technology 3.71 -4.60 -0.15
NKE NIKE, Inc. Class B Designs and manufactures athletic footwear and apparel 2.73 -5.84 -0.09
▪ Chegg delivered strong results and raised guidance for the year. Despite this, the stock declined. During the period, Pearson, a major publisher of U.S. higher education courseware, sued Chegg on copyright infringement. We see the risks as modest (Chegg removed content related to Pearson textbooks earlier this year after its contract with the publisher ended). We believe Chegg is a leader in this space, and we added to our position.
▪ Amazon.com missed quarterly revenue expectations, breaking a five-quarter streak. Increased consumer mobility and higher vaccination rates likely led to greater brick-and-mortar store shopping. AWS and the company’s advertising business performed well leading to higher-than-expected gross margins. We believe Amazon remains in a solid position across multiple verticals and maintained our position.
▪ Enphase declined during the short period that we owned the stock at the end of the quarter. While it is difficult to pinpoint the exact reason for the pullback, we suspect that supply chain inflation, solar panel shortages and changing regulations in California may have caused sentiment to sour. We established a new position in the stock during the period and added to it on subsequent pullbacks.
▪ Visa had a strong quarter fundamentally, but investors seemed more focused on the potential negative impact of the Delta variant and the competitive threat of emerging “buy now pay later” (BNPL) options that let consumers pay for purchases over a few months free from interest. At this time, we view Visa as a net beneficiary of BNPL; most payments via BNPL are made via debit card, and Visa generates more revenue per BNPL transaction (because one purchase turns into several payments). We are bullish on Visa’s competitive position and maintained our position during the quarter.
▪ Nike missed revenue expectations due to COVID-related supply chain bottlenecks and lockdowns in Vietnam (51% of Nike footwear manufacturing and 30% of apparel is made in Vietnam). Nike lowered revenue guidance, citing risk of meeting demand for the holidays. On the positive side, demand was robust in North America, where full-price sell-through boosted higher gross margins. We trimmed our position slightly ahead of Nike’s report, given the supply risks Nike has been facing.
6
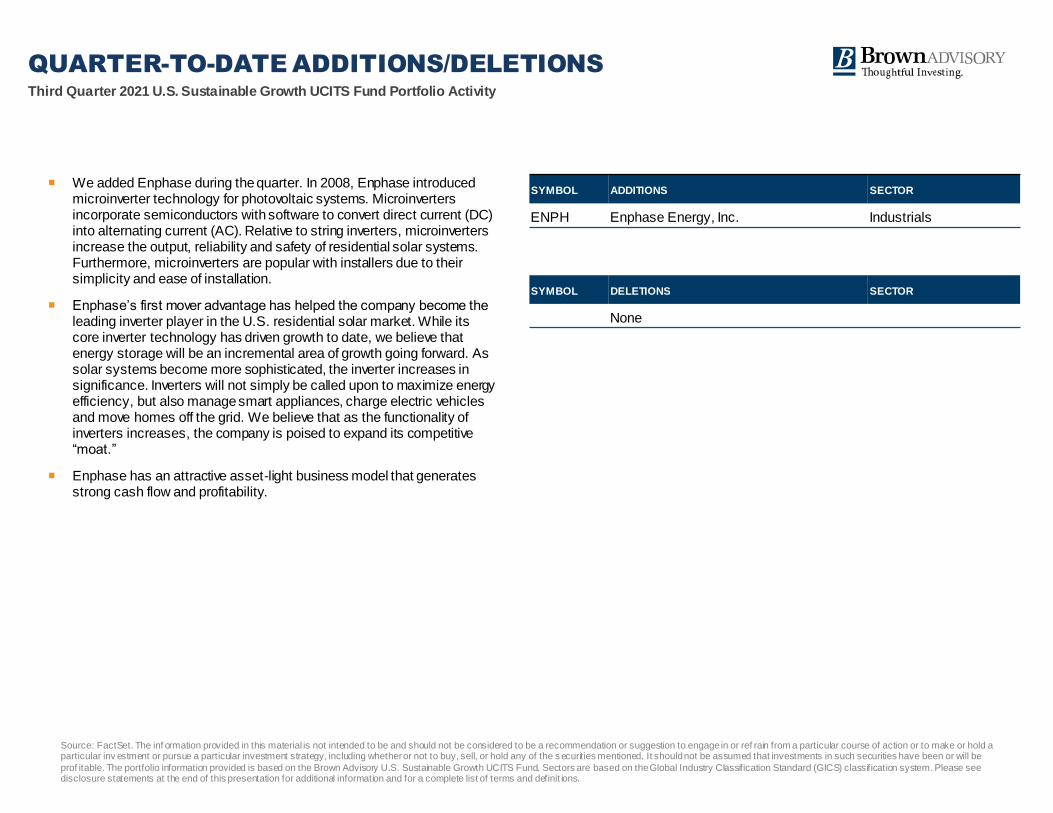
QUARTER-TO-DATE ADDITIONS/DELETIONSThird Quarter 2021 U.S. Sustainable Growth UCITS Fund Portfolio Activity
SYMBOL ADDITIONS SECTOR
ENPH Enphase Energy, Inc. Industrials
SYMBOL DELETIONS SECTOR
None
Source: FactSet. The inf ormation provided in this material is not intended to be and should not be considered to be a recommendation or suggestion to engage in or ref rain from a particular course of action or to make or hold a particular inv estment or pursue a particular investment strategy, including whether or not to buy, sell, or hold any of the securities mentioned. It should not be assumed that investments in such securities have been or will be
prof itable. The portfolio information provided is based on the Brown Advisory U.S. Sustainable Growth UCITS Fund. Sectors are based on the Global Industry Classification Standard (GICS) classification system. Please see disclosure statements at the end of this presentation for additional information and for a complete list of terms and definit ions.
We added Enphase during the quarter. In 2008, Enphase introduced microinverter technology for photovoltaic systems. Microinverters incorporate semiconductors with software to convert direct current (DC) into alternating current (AC). Relative to string inverters, microinverters increase the output, reliability and safety of residential solar systems. Furthermore, microinverters are popular with installers due to their simplicity and ease of installation.
Enphase’s first mover advantage has helped the company become the leading inverter player in the U.S. residential solar market. While its core inverter technology has driven growth to date, we believe that energy storage will be an incremental area of growth going forward. As solar systems become more sophisticated, the inverter increases in significance. Inverters will not simply be called upon to maximize energy efficiency, but also manage smart appliances, charge electric vehicles and move homes off the grid. We believe that as the functionality of inverters increases, the company is poised to expand its competitive “moat.”
Enphase has an attractive asset-light business model that generates strong cash flow and profitability.
7
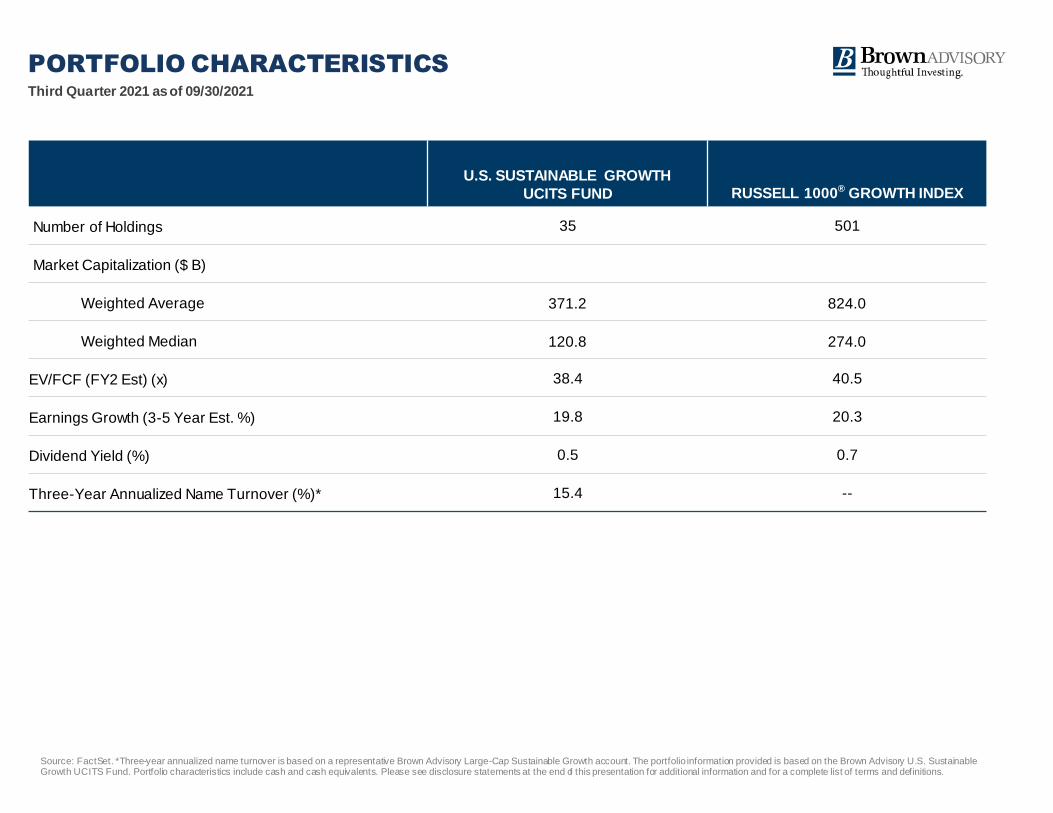
PORTFOLIO CHARACTERISTICS
U.S. SUSTAINABLE GROWTH
UCITS FUND RUSSELL 1000® GROWTH INDEX
Number of Holdings 35 501
Market Capitalization ($ B)
Weighted Average 371.2 824.0
Weighted Median 120.8 274.0
EV/FCF (FY2 Est) (x) 38.4 40.5
Earnings Growth (3-5 Year Est. %) 19.8 20.3
Dividend Yield (%) 0.5 0.7
Three-Year Annualized Name Turnover (%)* 15.4 --
Source: FactSet. *Three-year annualized name turnover is based on a representative Brown Advisory Large-Cap Sustainable Growth account. The portfolio information provided is based on the Brown Advisory U.S. Sustainable Growth UCITS Fund. Portfolio characteristics include cash and cash equivalents. Please see disclosure statements at the end of this presentation for additional information and for a complete list of terms and definitions.
Third Quarter 2021 as of 09/30/2021
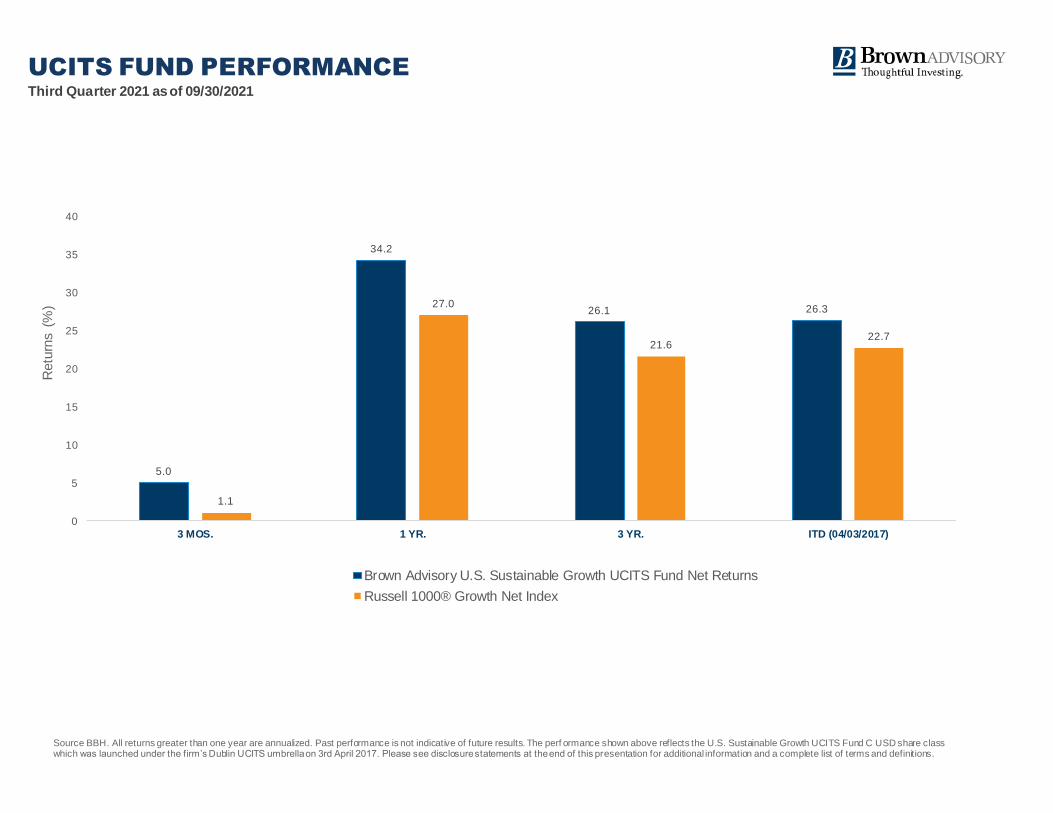
UCITS FUND PERFORMANCE
5.0
34.2
26.1 26.3
1.1
27.0
21.622.7
0
5
10
15
20
25
30
35
40
3 MOS. 1 YR. 3 YR. ITD (04/03/2017)
Brown Advisory U.S. Sustainable Growth UCITS Fund Net Returns
Russell 1000® Growth Net Index
Source BBH. All returns greater than one year are annualized. Past performance is not indicative of future results. The perf ormance shown above reflects the U.S. Sustainable Growth UCITS Fund C USD share class which was launched under the firm’s Dublin UCITS umbrella on 3rd April 2017. Please see disclosure statements at the end of this presentation for additional information and a complete list of terms and definitions.
Retu
rns (
%)
Third Quarter 2021 as of 09/30/2021
Third Quarter 2021 as of 09/30/2021
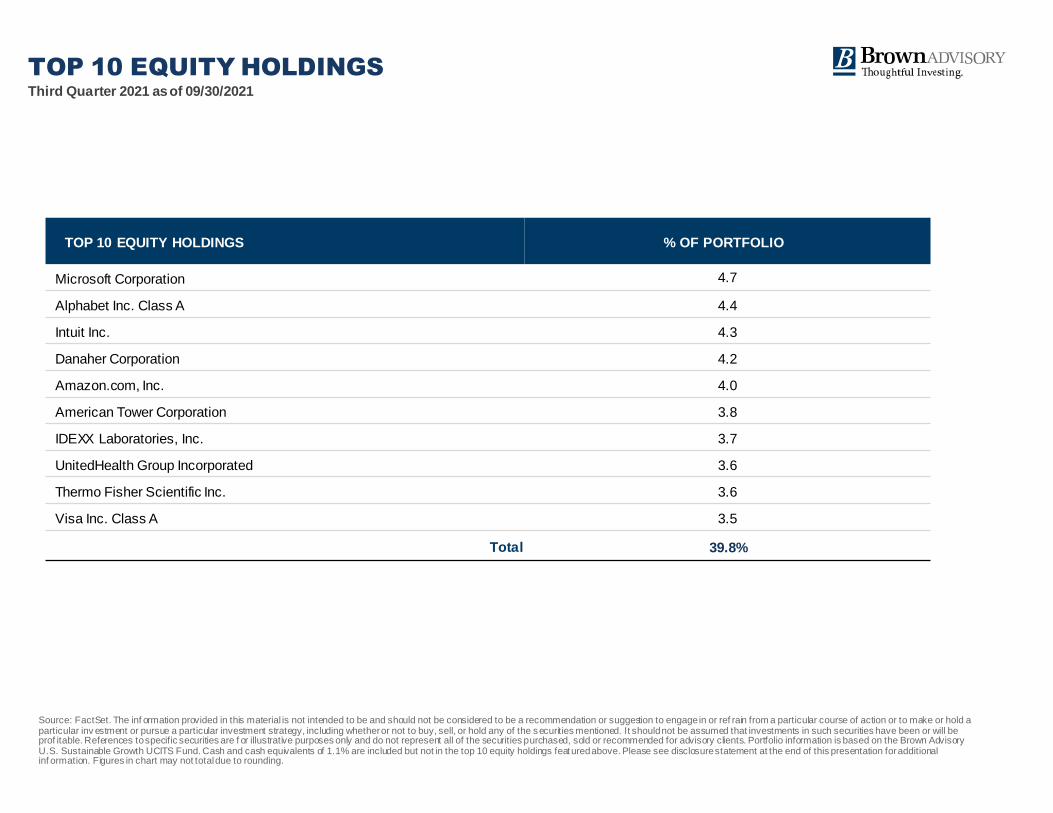
TOP 10 EQUITY HOLDINGS
TOP 10 EQUITY HOLDINGS % OF PORTFOLIO
Microsoft Corporation 4.7
Alphabet Inc. Class A 4.4
Intuit Inc. 4.3
Danaher Corporation 4.2
Amazon.com, Inc. 4.0
American Tower Corporation 3.8
IDEXX Laboratories, Inc. 3.7
UnitedHealth Group Incorporated 3.6
Thermo Fisher Scientific Inc. 3.6
Visa Inc. Class A 3.5
Total 39.8%
Source: FactSet. The inf ormation provided in this material is not intended to be and should not be considered to be a recommendation or suggestion to engage in or ref rain from a particular course of action or to make or hold a particular inv estment or pursue a particular investment strategy, including whether or not to buy, sell, or hold any of the securities mentioned. It should not be assumed that investments in such securities have been or will be prof itable. References to specific securities are f or illustrative purposes only and do not represent all of the securities purchased, sold or recommended for advisory clients. Portfolio information is based on the Brown Advisory U.S. Sustainable Growth UCITS Fund. Cash and cash equivalents of 1.1% are included but not in the top 10 equity holdings featured above. Please see disclosure statement at the end of this presentation for additional inf ormation. Figures in chart may not total due to rounding.
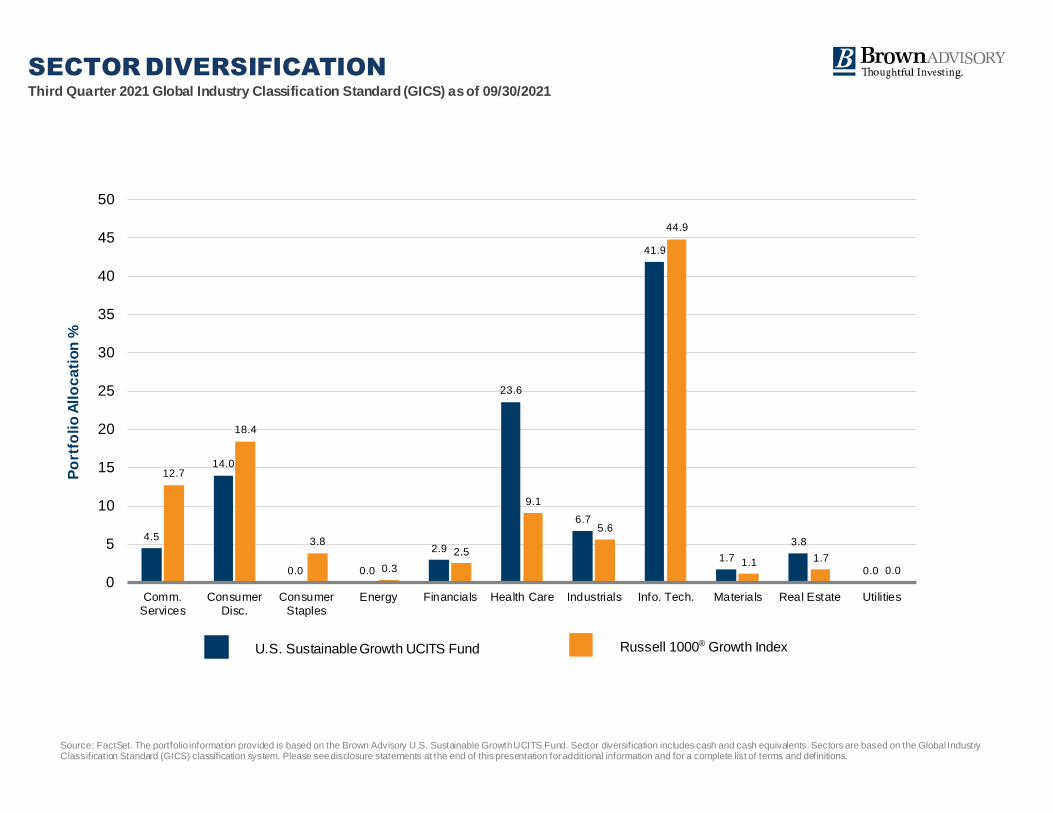
Third Quarter 2021 Global Industry Classification Standard (GICS) as of 09/30/2021
SECTOR DIVERSIFICATION
U.S. Sustainable Growth UCITS Fund Russell 1000® Growth Index
Po
rtfo
lio
All
oc
ati
on
%
4.5
14.0
0.0 0.0
2.9
23.6
6.7
41.9
1.7
3.8
0.0
12.7
18.4
3.8
0.3
2.5
9.1
5.6
44.9
1.1 1.70.0
0
5
10
15
20
25
30
35
40
45
50
Comm.
ServicesConsumer
Disc.Consumer
StaplesEnergy Financials Health Care Industrials Info. Tech. Materials Real Estate Utilities
Source: FactSet. The portfolio information provided is based on the Brown Advisory U.S. Sustainable Growth UCITS Fund. Sector diversification includes cash and cash equivalents. Sectors are based on the Global Industry Classification Standard (GICS) classification system. Please see disclosure statements at the end of this presentation for additional information and for a complete list of terms and definitions.
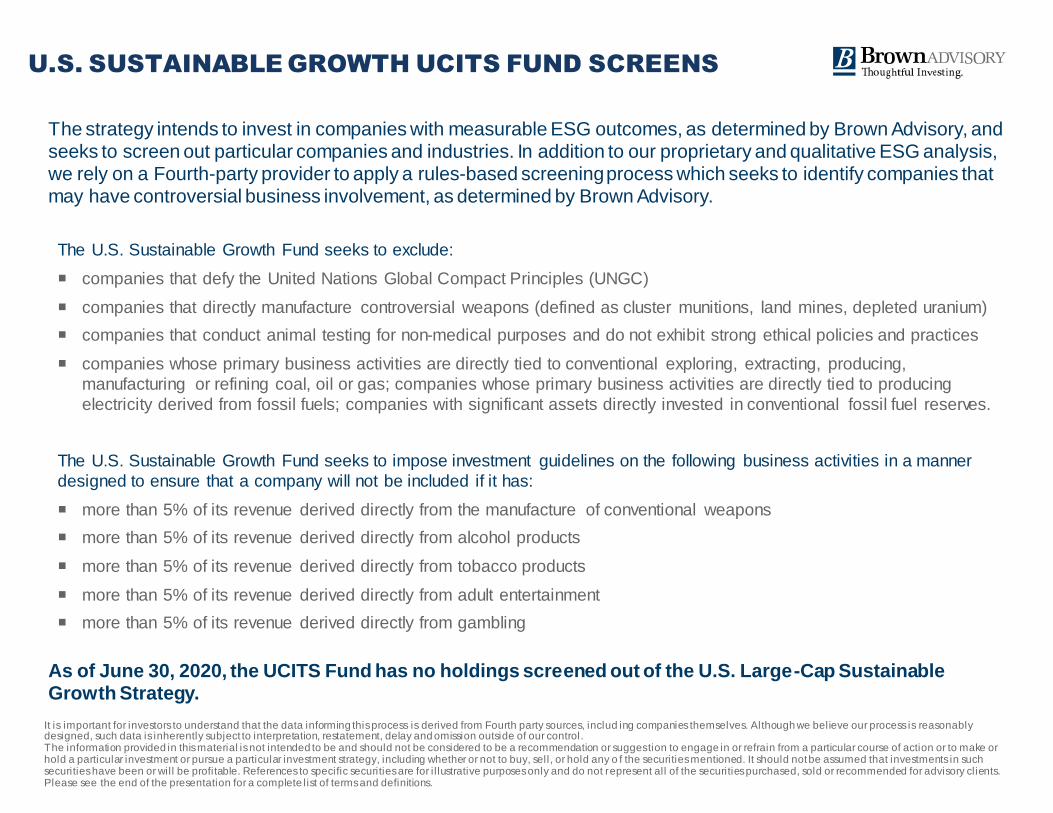
U.S. SUSTAINABLE GROWTH UCITS FUND SCREENS
The U.S. Sustainable Growth Fund seeks to exclude:
companies that defy the United Nations Global Compact Principles (UNGC)
companies that directly manufacture controversial weapons (defined as cluster munitions, land mines, depleted uranium)
companies that conduct animal testing for non-medical purposes and do not exhibit strong ethical policies and practices
companies whose primary business activities are directly tied to conventional exploring, extracting, producing,
manufacturing or refining coal, oil or gas; companies whose primary business activities are directly tied to producing
electricity derived from fossil fuels; companies with significant assets directly invested in conventional fossil fuel reserves.
The U.S. Sustainable Growth Fund seeks to impose investment guidelines on the following business activities in a manner
designed to ensure that a company will not be included if it has:
more than 5% of its revenue derived directly from the manufacture of conventional weapons
more than 5% of its revenue derived directly from alcohol products
more than 5% of its revenue derived directly from tobacco products
more than 5% of its revenue derived directly from adult entertainment
more than 5% of its revenue derived directly from gambling
The strategy intends to invest in companies with measurable ESG outcomes, as determined by Brown Advisory, and seeks to screen out particular companies and industries. In addition to our proprietary and qualitative ESG analysis, we rely on a Fourth-party provider to apply a rules-based screening process which seeks to identify companies that may have controversial business involvement, as determined by Brown Advisory.
As of June 30, 2020, the UCITS Fund has no holdings screened out of the U.S. Large-Cap Sustainable Growth Strategy.
It is important for investors to understand that the data informing this process is derived from Fourth party sources, includ ing companies themselves. Although we believe our process is reasonably designed, such data is inherently subject to interpretation, restatement, delay and omission outside of our control. The information provided in this material is not intended to be and should not be considered to be a recommendation or suggestion to engage in or refrain from a particular course of action or to make or hold a particular investment or pursue a particular investment strategy, including whether or not to buy, sell, or hold any o f the securities mentioned. It should not be assumed that investments in such securities have been or will be profitable. References to specific securities are for i l lustrative purposes only and do not represent all of the securities purchased, sold or recommended for advisory clients. Please see the end of the presentation for a complete list of terms and definitions.
12
DISCLOSURES, TERMS & DEFINITIONS
For institutional investors and professional clients only.
Past performance may not be a reliable guide to future performance and investors may not get back the amount invested. All investments involve
risk. The value of the investment and the income from it will vary. There is no guarantee that the initial investment will bereturned.
The views expressed are those of the author and Brown Advisory as of the date referenced and are subject to change at any time based on market or other conditions. These views are not intended to
be and should not be relied upon as investment advice and are not intended to be a forecast of future events or a guarantee of future results. The information provided in this material is not intended to
be and should not be considered to be a recommendation or suggestion to engage in or refrain from a particular course of action or to make or hold a particular investment or pursue a particular
investment strategy, including whether or not to buy, sell, or hold any of the securities mentioned. It should not be assumedthat investments in such securities have been or will be profitable. To the
extent specific securities are mentioned, they have been selected by the author on an objective basis to i l lustrate views expressed in the commentary and do not represent all of the securities purchased,
sold or recommended for advisory clients. The information contained herein has been prepared from sources believed reliable but is not guaranteed by us as to its timeliness or accuracy, and is not a
complete summary or statement of all available data. This piece is intended solely for our clients and prospective clients, is for informational purposes only, and is not individually tailored for or directed to
any particular client or prospective client.
ESG considerations that are material wil l vary by investment style, sector/industry, market trends and client objectives. Thestrategy seeks to identify companies that it believes may have desirable ESG
outcomes, but investors may differ in their views of what constitutes positive or negative ESG outcomes. As a result, the strategy may invest in companies that do not reflect the beliefs and values of any
particular investor. The strategy may also invest in companies that would otherwise be screened out of other ESG oriented funds. Security selection will be impacted by the combined focus on ESG
assessments and forecasts of return and risk. The strategy intends to invest in companies with measurable ESG outcomes, as determined by Brown Advisory, and seeks to screen out particular
companies and industries. Brown Advisory relies on Fourth parties to provide data and screening tools. There is no assurance that this information will be accurate or complete or that it will properly
exclude all applicable securities. Investments selected using these tools may perform differently than as forecasted due to the factors incorporated into the screening process, changes from historical
trends, and issues in the construction and implementation of the screens (including, but not l imited to, software issues and other technological issues). There is no guarantee that Brown Advisory’s use of
these tools wil l result in effective investment decisions. This piece is intended solely for our clients and prospective clients, is for informational purposes only, and is not individually tailored for or directed
to any particular client or prospective client.
FactSet ® is a registered trademark of FactSet Research Systems, Inc.
Global Industry Classification Standard (GICS®) and “GICS” are service makers/trademarks of MSCI and Standard & Poor’s.
Figures shown on sector diversification and quarterly attribution by detail sl ides may not total due to rounding.
All financial statistics and ratios are calculated using information from FactSet as of the report date unless otherwise noted.
The Av erage Weight of a position or sector refers to the daily average for the period covered in this report of a stock’s value as a percentage of the portfolio.
The Total Return of an equity security is the sum of the return from price movement and the return due to dividend payments or other sources o f income. Standard benchmark-, sector- and portfolio-
level returns are the sums of the weights of each security multiplied by its return, summed and calculated daily and summed over the period covered by the report or by an otherwise-noted period.
Allocation Effect measures the impact of the decision to allocate assets differently than those in the benchmark.
Selection and Interaction Effect reflects the combination of selection effect and interaction effect. Selection effect measures the effect of choosing securitiesthat may or may not outperform those of
the benchmark. Interaction effect measures the effect of allocation and selection decisions (i.e., did we overweight the sectors in which we underperformed).
Total Effect reflects the combination of allocation, selection and interaction effects. Totals may not equal due to rounding.
Contribution To Return is calculated by multiplying a security’s beginning weight in the portfolio by the security’s return on a daily basis, and ge ometrically l inking the return to the reporting period.
Market Capitalization refers to the aggregate value of a company’s publicly traded stock. Statistics are calculated as follows: Weighted Average: the average of each holding’s market cap, weighted by
i ts relative position size in the portfolio (in such a weighting scheme, larger positions have a greater influence on the calculation); Weighted Median: the value at which half the portfolio's market
capitalization weight falls above and half falls below; Maximum and Minimum: the market caps of the largest and smallest companies, respectively, in the portfolio.
Enterprise Value/Free Cash Flow (EV/FCF) is the enterprise value of a company (defined as market value plus debt minus cash and minority interests) divided by its fre e cash flow (defined as
operating cash flow minus net capital expenditure). EV/FCF calculations presented use FY2 earnings estimates; FY1 estimates refer to the next unreported fiscal year, and FY2 estimates refer to the
fiscal year following FY1.
Div idend Yield is the ratio of a stock’s projected annual dividend payment per share for the fiscal year currently in progress, divided by t he stock’s price.
Three-Year Annualized Name Turnov er is the ratio of the lesser of the portfolio’s aggregate purchases or sales during a given period, divided by the average value of the portfolio during that period,
calculated on a monthly basis. Portfolio turnover is provided for a three-year trailing period.
All of the above ratios for a portfolio are expressed as a weighted average of the relevant ratios of each portfolio holding,EXCEPT for P/E ratios, which are expressed as a weighted harmonic average.
BROWN ADVISORY FUNDS PLC
Past performance may not be a reliable guide to future performance and you may not get back the amount invested.
For institutional investors and professional clients only.
Performance data relates to the Brow n Advisory U.S. Sustainable Grow th Fund (the “Fund”). The performance is net of managemen t fees and operating expenses. This communication is intended only for investment professionals and those w ith professional experience of investing in collective investment schemes. Those w ithout such professional experience should not rely on it. This presentation should not be show n or given to retail investors. Any entity responsible for forw arding this material to otherparties takes responsibility for ensuring compliance w ith applicable f inancial promotion rules. Changes in exchange rates may have an adverse effect on the value price or income of the product. The difference at any one time betw een the sale and repurchase price of units in the Fund means that the investment should be view ed as medium to long term. This presentation is issued in the European Union by Brow n Advisory (Ireland) Limited, authorised and regulated by the Central Bank of Ireland. In the UK and other non-EU permissible jurisdictions, this presentation is issued by Brow n Advisory Limited, authorised and regulated by the Financial Conduct Authority. This is not an
offer or an invitation to subscribe in the Fund and is by w ay of information only. Cancellation rights do not apply and UK regulatory complaints and compensation arrangements may not apply. This is not intended as investment or f inancial advice.
Investment decisions should not be made on the basis of this presentation. A Prospectus is available for Brow n Advisory Funds plc (the “Company”) as w ell as a Supplement for the Fund and a Key Investor Information Document (“KIID”) for each share class of the Fund. The Fund’s Prospec tus can be obtained by calling +44020 3301 8130 or visiting https://w ww.brownadvisory.com/intl/ucits-legal-document-library and is available in English. The KIIDs can be obtained from https://w ww.brownadvisory.com/intl/kiid-library and are available in one of the off icial languages of each of the EU Member States into w hich the Fund has been notif ied for
marketing under the Directive 2009/65/EC (the UCITS Directive). In addition, a summary of investor rights is available from https://w w w.brownadvisory.com/intl/ucits-legal-document-library. The summary is available in English. The Fund is currently notif ied for marketing into a number of EU Member States under the UCITS Directive. The Company can terminate such notif ications for any share class and/or the Fund at any time using the process contained in Artic le 93a of the UCITS Directive. Certain share classes of the Fund w ill also be available for subscription in jurisdictions w here the Fund may be law fully privately placed. Please contact Brow n Advisory for more information. Investors should carefully consider the investment objectives, risks, charges, and expenses of the Fund. This and other impor tant information is contained in Prospectus, the Supplement and the applicable KIIDs. Read these documents carefully before you invest.
The Fund is a sub-fund of the Company, an umbrella fund w ith segregated liability betw een sub-funds. The Fund is authorised by the Central Bank of Ireland as a UCITS
pursuant to the European Communities (Undertakings for Collective Investment in Transferable Securities) Regulations, 2011 as may be amended, supplemented or consolidated from time to time (the “Regulations”). The Company has appointed Brow n Advisory (Ireland) Limited as its UCITS management company w hich is authorisedby the Central Bank of Ireland pursuant to the Regulations and the Central Bank (Supervision and Enforcement) Act 2013 (Section 48(1)) (Undertakings for Collective Investment in Transferable Securities) Regulations 2019, as amended. The investment manager of the Fund is Brow n Advisory LLC. The distributor of the Fund is Brow n Advisory LLC, The Fund is a recognised collective investment scheme for the purposes of section 264 of the UK’s Financial Services and Markets Act 2000.
The Fund uses the Russell 1000® Grow th Net Index as a comparator benchmark to compare performance. The Fund is actively managed and is not constrained by any benchmark. The Russell 1000® Grow th Index measures the performance of the large-cap grow th segment of the U.S. equity universe. It includes those Russell 1000®
Index companies w ith higher price-to-book ratios and higher forecasted grow th values. It is constructed to provide a comprehensive and unbiased barometer for the large-cap grow th segment. The Index is completely reconstituted annually to ensure new and grow ing equities are included and that the represented companies continue to reflect grow th characteristics. The Russell 1000® Grow th index and Russell® are trademarks/service marks of the London Stock Exchange Group companies. An investor cannot invest directly into an index. Benchmark returns are not covered by the report of the independent verif iers.
Brow n Advisory is the marketing name for Brow n Advisory, LLC, Brow n Investment Advisory & Trust Company, Brow n Advisory Securities, LLC, Brow n Advisory Ltd., Brow n Advisory Trust Company of Delaw are LLC, Brow n Advisory Investment Solutions Group LLC, Meritage Capital LLC, NextGen Venture Partners, LLC and Signature Financial Management, Inc.