Embed Size (px)
Citation preview
Putnam Sustainable Leaders Fund
FUND SYMBOL CLASS A
PNOPX
Annual report 6 | 30 | 21
Growth funds look for stocks of companies that have the potential to grow over time.
Putnam Sustainable Leaders FundAnnual report 6 | 30 | 21
Message from the Trustees 1
About the fund 2
Interview with your fund’s portfolio manager 6
Your fund’s performance 10
Your fund’s expenses 12
Consider these risks before investing 14
Terms and definitions 15
Other information for shareholders 17
Important notice regarding Putnam’s privacy policy 18
Trustee approval of management contract 19
Audited financial statements 23
Report of Independent Registered Public Accounting Firm 24
Federal tax information 48
About the Trustees 49
Officers 51
August 11, 2021
Dear Fellow Shareholder:
The U.S. economy is much improved from a year ago, or even six months ago. Gross domestic product is growing at a pre-pandemic pace. Stock prices are high and interest rates are low. More and more workers are finding jobs, with millions still open. At the same time, vaccinations in many areas have not yet reached enough people to stop the spread of Covid-19. U.S. and global infection rates have recently risen.
While it is too soon to declare the pandemic over, it is worth taking stock of the economy’s transition. Some changes accelerated by the pandemic could be lasting. Dynamic, well-managed companies have adapted to seize new, more sustainable growth opportunities.
An active investment philosophy is well suited to this time. Putnam’s research teams are analyzing the fundamentals of what has stayed the same and what has changed to uncover valuable investment insights or potential risks.
Thank you for investing with Putnam.
Respectfully yours,
Robert L. ReynoldsPresident and Chief Executive OfficerPutnam Investments
Kenneth R. LeiblerChair, Board of Trustees
Message from the Trustees
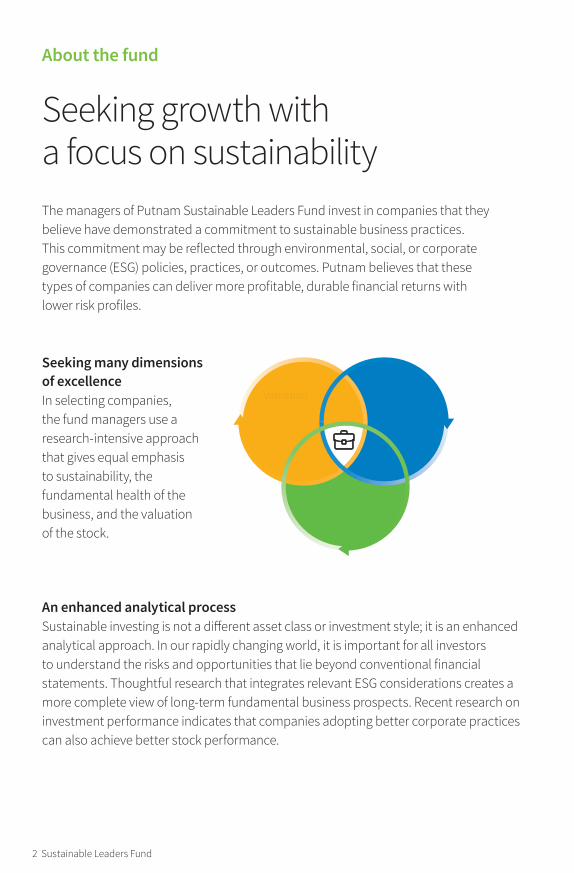
About the fund
Seeking growth with a focus on sustainabilityThe managers of Putnam Sustainable Leaders Fund invest in companies that they believe have demonstrated a commitment to sustainable business practices. This commitment may be reflected through environmental, social, or corporate governance (ESG) policies, practices, or outcomes. Putnam believes that these types of companies can deliver more profitable, durable financial returns with lower risk profiles.
Seeking many dimensions of excellence In selecting companies, the fund managers use a research-intensive approach that gives equal emphasis to sustainability, the fundamental health of the business, and the valuation of the stock.
Valuation
Sustainability
Fundamentals
An enhanced analytical processSustainable investing is not a different asset class or investment style; it is an enhanced analytical approach. In our rapidly changing world, it is important for all investors to understand the risks and opportunities that lie beyond conventional financial statements. Thoughtful research that integrates relevant ESG considerations creates a more complete view of long-term fundamental business prospects. Recent research on investment performance indicates that companies adopting better corporate practices can also achieve better stock performance.
About the fund
2 Sustainable Leaders Fund
Targeting companies with sustainable business practicesIn analyzing companies for the portfolio, the fund’s managers look for excellence in areas such as clean and efficient materials use, plans to reduce carbon or water intensity, focus on employee well-being, improvements in workplace equality and diversity, and alignment of management incentives with the company’s sustainability objectives.
Rigorous analysis of company financial strengthWith the goal of delivering capital appreciation for investors over time, the fund’s managers focus on companies with the potential to produce strong financial performance. They consider factors such as the stock’s valuation and the company’s financial strength, growth potential, competitive position, future earnings, and cash flows.
Katherine Collins, CFA, MTSHead of Sustainable Investing and Portfolio ManagerIndustry since 1990At Putnam since 2017
Stephanie DobsonPortfolio ManagerIndustry since 2011At Putnam since 2017
Deep fundamental research plus intense sustainability analysis are at the heart of our investment process.
Sustainable Leaders Fund 3
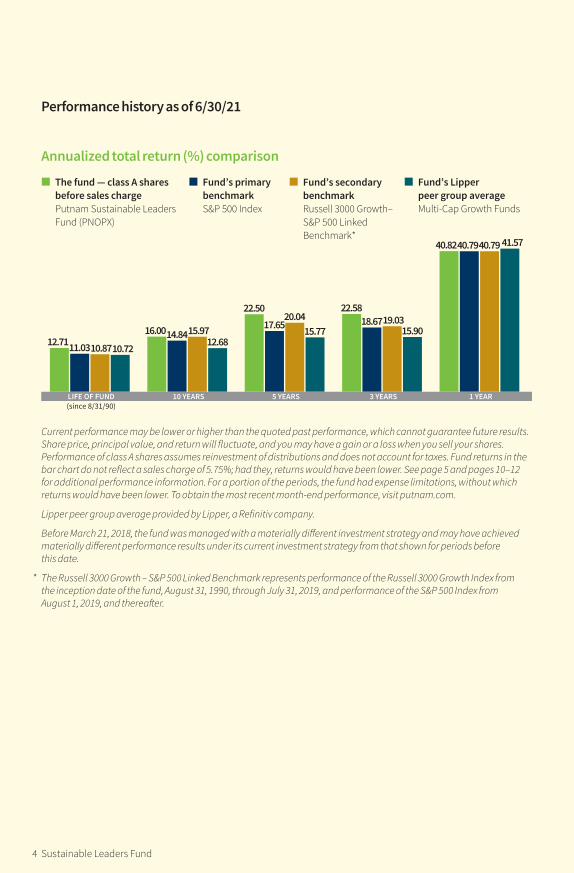
Performance history as of 6/30/21
Annualized total return (%) comparison
LIFE OF FUND(since 8/31/90)
10 YEARS 5 YEARS 3 YEARS 1 YEAR
12.7111.0310.8710.72
16.0014.8415.9712.68
22.5017.65
20.0415.77
22.5818.6719.03
15.90
40.8240.7940.79 41.57
The fund — class A sharesbefore sales chargePutnam Sustainable LeadersFund (PNOPX)
Fund’s primarybenchmarkS&P 500 Index
Fund’s secondarybenchmarkRussell 3000 Growth–S&P 500 LinkedBenchmark*
Fund’s Lipperpeer group averageMulti-Cap Growth Funds
Current performance may be lower or higher than the quoted past performance, which cannot guarantee future results. Share price, principal value, and return will fluctuate, and you may have a gain or a loss when you sell your shares. Performance of class A shares assumes reinvestment of distributions and does not account for taxes. Fund returns in the bar chart do not reflect a sales charge of 5.75%; had they, returns would have been lower. See page 5 and pages 10–12 for additional performance information. For a portion of the periods, the fund had expense limitations, without which returns would have been lower. To obtain the most recent month-end performance, visit putnam.com.
Lipper peer group average provided by Lipper, a Refinitiv company.
Before March 21, 2018, the fund was managed with a materially different investment strategy and may have achieved materially different performance results under its current investment strategy from that shown for periods before this date.
* The Russell 3000 Growth – S&P 500 Linked Benchmark represents performance of the Russell 3000 Growth Index from the inception date of the fund, August 31, 1990, through July 31, 2019, and performance of the S&P 500 Index from August 1, 2019, and thereafter.
4 Sustainable Leaders Fund
Performance history as of 6/30/21
Annualized total return (%) comparison
LIFE OF FUND(since 8/31/90)
10 YEARS 5 YEARS 3 YEARS 1 YEAR
12.7111.0310.8710.72
16.0014.8415.9712.68
22.5017.65
20.0415.77
22.5818.6719.03
15.90
40.8240.7940.79 41.57
The fund — class A sharesbefore sales chargePutnam Sustainable LeadersFund (PNOPX)
Fund’s primarybenchmarkS&P 500 Index
Fund’s secondarybenchmarkRussell 3000 Growth–S&P 500 LinkedBenchmark*
Fund’s Lipperpeer group averageMulti-Cap Growth Funds
Current performance may be lower or higher than the quoted past performance, which cannot guarantee future results. Share price, principal value, and return will fluctuate, and you may have a gain or a loss when you sell your shares. Performance of class A shares assumes reinvestment of distributions and does not account for taxes. Fund returns in the bar chart do not reflect a sales charge of 5.75%; had they, returns would have been lower. See page 5 and pages 10–12 for additional performance information. For a portion of the periods, the fund had expense limitations, without which returns would have been lower. To obtain the most recent month-end performance, visit putnam.com.
Lipper peer group average provided by Lipper, a Refinitiv company.
Before March 21, 2018, the fund was managed with a materially different investment strategy and may have achieved materially different performance results under its current investment strategy from that shown for periods before this date.
* The Russell 3000 Growth – S&P 500 Linked Benchmark represents performance of the Russell 3000 Growth Index from the inception date of the fund, August 31, 1990, through July 31, 2019, and performance of the S&P 500 Index from August 1, 2019, and thereafter.
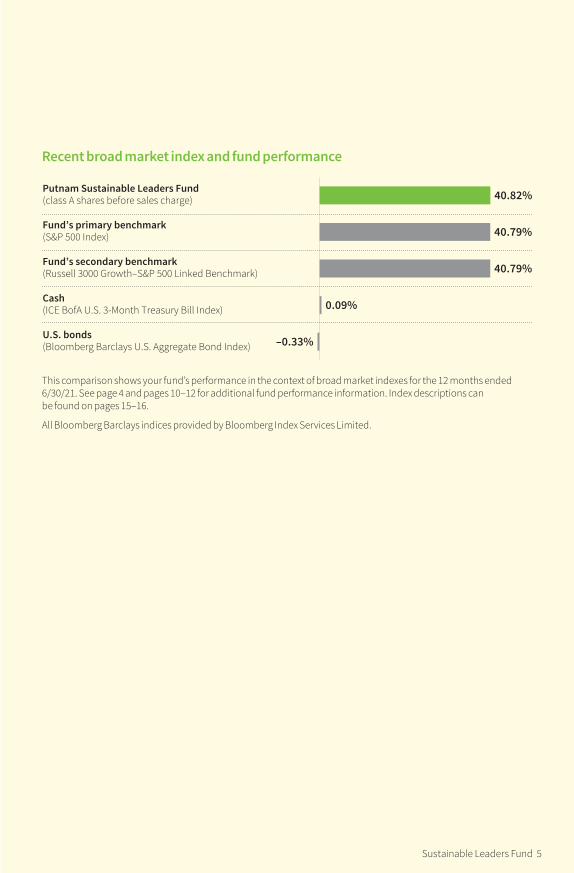
Recent broad market index and fund performance
40.82%
40.79%
40.79%
0.09%
–0.33%
Putnam Sustainable Leaders Fund (class A shares before sales charge)
Fund’s primary benchmark (S&P 500 Index)
Fund’s secondary benchmark (Russell 3000 Growth–S&P 500 Linked Benchmark)
Cash (ICE BofA U.S. 3-Month Treasury Bill Index)
U.S. bonds (Bloomberg Barclays U.S. Aggregate Bond Index)
This comparison shows your fund’s performance in the context of broad market indexes for the 12 months ended 6/30/21. See page 4 and pages 10–12 for additional fund performance information. Index descriptions can be found on pages 15–16.
All Bloomberg Barclays indices provided by Bloomberg Index Services Limited.
Sustainable Leaders Fund 5
Interview with your fund’s portfolio manager
Katherine Collins, CFA, MTSPortfolio Manager
Katherine is Head of Sustainable Investing. She has a Master of Theological Studies from Harvard Divinity School and a B.A. from Wellesley College. Katherine joined Putnam in 2017 and has been in the invest-ment industry since 1990.
Stephanie DobsonPortfolio Manager
Stephanie has a B.A. from Middlebury College. She joined Putnam in 2017 and has been in the investment industry since 2011.
How was the investing environment for U.S. stocks during the 12‑month reporting period?Stocks made an impressive advance during the period, which began in July 2020. At the start, stocks were enjoying a remarkable rebound after steep declines earlier in the year. The market advanced solidly for two months but faced some challenges in September. Volatility picked up as Covid-19 cases began to surge globally and uncertainty surrounded the U.S. presidential election. Stocks posted losses in September and October as investors grappled with slow economic growth and rising unemployment. The market rebounded again in November, buoyed by optimism about Covid-19 vaccines. The S&P 500 Index posted its best November performance ever, and the Dow Jones Industrial Average recorded its largest monthly gain in 33 years. Market advances continued in December, and both the Dow Jones Industrial Average and the S&P 500 Index closed 2020 at record highs.
Stocks advanced during the first few months of 2021, but the performance of growth-style stocks weakened somewhat. As optimism grew about a rebounding economy, investors began
Katherine Collins discusses the investing environment and fund performance for the 12 months ended June 30, 2021, as well as her outlook for the fund.
Interview with your fund’s portfolio manager
6 Sustainable Leaders Fund
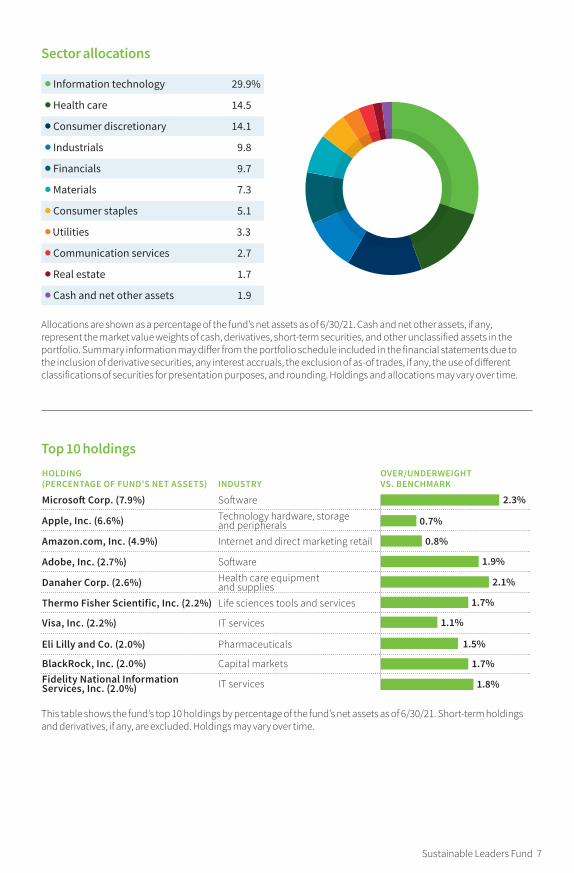
Top 10 holdingsHOLDING (PERCENTAGE OF FUND’S NET ASSETS)
INDUSTRY
OVER/UNDERWEIGHT VS. BENCHMARK
Microsoft Corp. (7.9%) Software
Apple, Inc. (6.6%) Technology hardware, storage and peripherals
Amazon.com, Inc. (4.9%) Internet and direct marketing retail
Adobe, Inc. (2.7%) Software
Danaher Corp. (2.6%) Health care equipment and supplies
Thermo Fisher Scientific, Inc. (2.2%) Life sciences tools and services
Visa, Inc. (2.2%) IT services
Eli Lilly and Co. (2.0%) Pharmaceuticals
BlackRock, Inc. (2.0%) Capital marketsFidelity National Information Services, Inc. (2.0%) IT services 1.8%
2.3%
0.7%
0.8%
1.9%
1.7%
1.1%
1.5%
1.7%
2.1%
This table shows the fund’s top 10 holdings by percentage of the fund’s net assets as of 6/30/21. Short-term holdings and derivatives, if any, are excluded. Holdings may vary over time.
Sector allocations
Information technology 29.9%
Health care 14.5
Consumer discretionary 14.1
Industrials 9.8
Financials 9.7
Materials 7.3
Consumer staples 5.1
Utilities 3.3
Communication services 2.7
Real estate 1.7
Cash and net other assets 1.9
Allocations are shown as a percentage of the fund’s net assets as of 6/30/21. Cash and net other assets, if any, represent the market value weights of cash, derivatives, short-term securities, and other unclassified assets in the portfolio. Summary information may differ from the portfolio schedule included in the financial statements due to the inclusion of derivative securities, any interest accruals, the exclusion of as-of trades, if any, the use of different classifications of securities for presentation purposes, and rounding. Holdings and allocations may vary over time.
Sustainable Leaders Fund 7
to favor stocks in cyclical sectors that tend to perform well in periods of economic recovery. Value-style stocks, for example, outperformed as investors responded to the rollout of three effective Covid-19 vaccines, optimism about the reopening of economies, and significant government stimulus. Growth stocks made a comeback late in the period, although markets experienced some volatility due to concerns about rising inflation and an increasing number of Covid-19 variants. As the period came to a close, one notable trend was a similarity in stock performance across styles and regions.
How did the fund perform for the 12‑month reporting period?The fund delivered a gain of 40.82%, in line with its S&P 500 Index benchmark, which returned 40.79%.
What were some holdings that contributed to performance during the period?The top performer for the period was AES, a company that generates and distributes elec-trical power in 15 countries. AES reported strong earnings and cash flow during the period. The company is one of the biggest drivers of the shift to renewable power generation and is part of an important joint venture in energy storage tech-nology. Investors have responded favorably to AES’s partnerships and projects that contribute to the global transition to cleaner energy.
Another portfolio highlight was our investment in Applied Materials, a leading provider of semiconductor capital equipment. The stock performed well in the period as a number of the company’s customers confirmed future capacity expansions and related capital spending plans. Applied Materials’ products enable advances in many different sustainability-related solutions, with a focus on improved power, performance, and cost.
Could you discuss some holdings that detracted from the fund’s performance during the period?One detractor was Vertex Pharmaceuticals, a leading biotechnology company. During the period, Vertex announced disappointing data for one of its pipeline drugs, which drove under-performance for the stock. Despite this setback, Vertex still has a very strong cystic fibrosis offering that produces meaningful benefits for patients, plus long-term pipeline optionality. We continued to hold Vertex in the portfolio at the end of the period.
Another detractor was Baxter International, a medical device company that serves several areas of healthcare, including renal care and medication delivery. In addition to the negative impact of fewer elective procedures due to the pandemic, Baxter faced delays in approval for a key product, and insurance coverage chal-lenges for another. These issues lowered the expected growth potential for the company.
As the fund begins a new fiscal year, where are you seeing opportunities?The complexities of 2020 brought tremendous challenges for individuals and society and presented an opportunity to test our processes and performance in an extreme set of condi-tions. One important observation about those challenges is that investors have come to under-stand how so many of our social, economic, climate, and health-related issues are inter-twined. As a result, many companies are taking a more systemic and holistic view of how their businesses fit into all these bigger systems.
Investors have come to understand how so many of our social, economic, climate, and health‑related issues are intertwined. Katherine Collins
8 Sustainable Leaders Fund
In all market environments, we look for companies that have demonstrated leadership in the sustainability issues that are financially material to their businesses. Our investment thesis is that companies that exhibit this type of commitment also often demonstrate potential for strong long-term financial performance. The stocks of these companies are typically, but not always, considered to be growth stocks, and often are large cap in size. Some examples of areas where a company might demonstrate leadership include clean and efficient materials use, reductions in environmental intensity, or improvements in workplace equality and diversity.
Thank you, Katherine, for your time and insights today.
The views expressed in this report are exclusively those of Putnam Management and are subject to change. They are not meant as investment advice.
Please note that the holdings discussed in this report may not have been held by the fund for the entire period. Portfolio composition is subject to review in accordance with the fund’s investment strategy and may vary in the future. Current and future portfolio holdings are subject to risk.
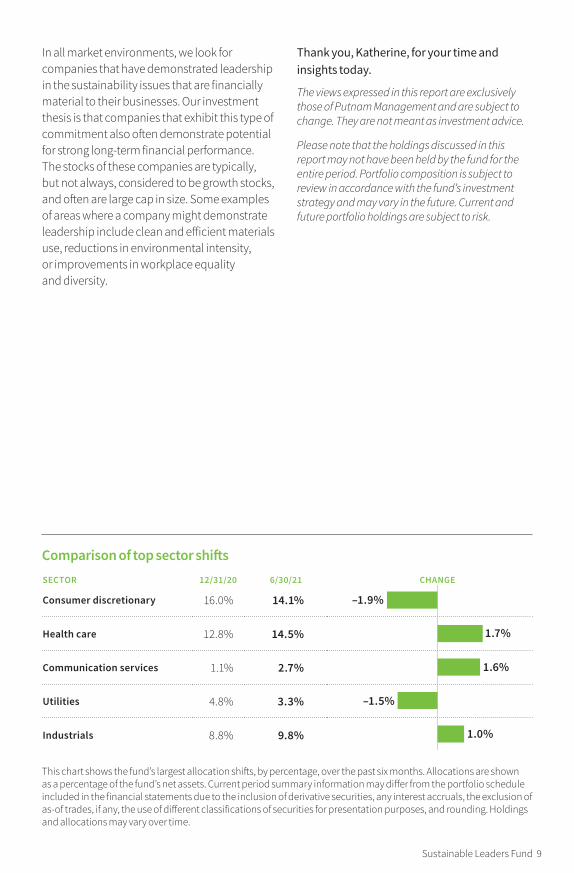
Comparison of top sector shiftsSECTOR 12/31/20 6/30/21 CHANGE
Consumer discretionary 16.0% 14.1%
Health care 12.8% 14.5%
Communication services 1.1% 2.7%
Utilities 4.8% 3.3%
Industrials 8.8% 9.8%
-2 -1 0 1 2
bar height 1p1.5
space between bars 0p11.5
max. width of chart: 11p
–1.5%
1.0%
1.6%
1.7%
–1.9%
Rule: 30% black. 4 pts above top bar / 4 pts below bottom bar.
This chart shows the fund’s largest allocation shifts, by percentage, over the past six months. Allocations are shown as a percentage of the fund’s net assets. Current period summary information may differ from the portfolio schedule included in the financial statements due to the inclusion of derivative securities, any interest accruals, the exclusion of as-of trades, if any, the use of different classifications of securities for presentation purposes, and rounding. Holdings and allocations may vary over time.
Sustainable Leaders Fund 9
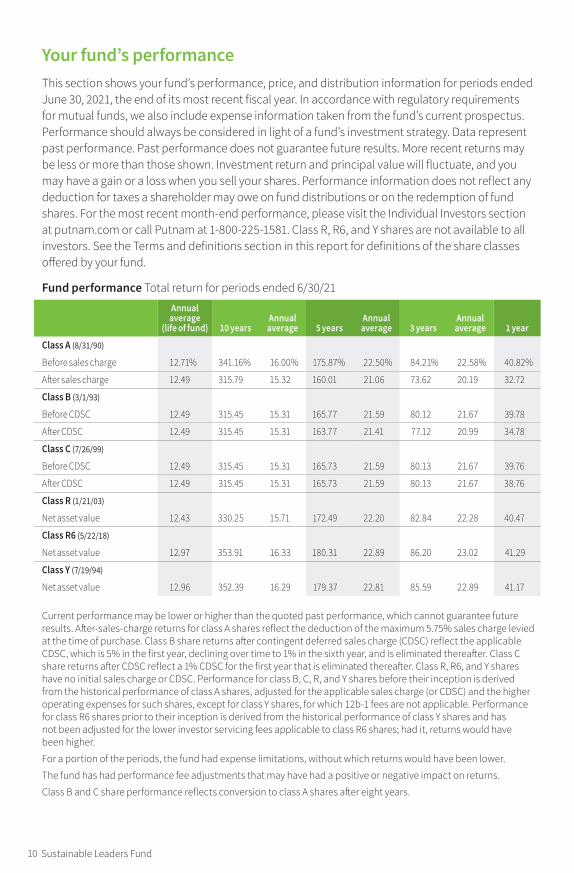
Your fund’s performanceThis section shows your fund’s performance, price, and distribution information for periods ended June 30, 2021, the end of its most recent fiscal year. In accordance with regulatory requirements for mutual funds, we also include expense information taken from the fund’s current prospectus. Performance should always be considered in light of a fund’s investment strategy. Data represent past performance. Past performance does not guarantee future results. More recent returns may be less or more than those shown. Investment return and principal value will fluctuate, and you may have a gain or a loss when you sell your shares. Performance information does not reflect any deduction for taxes a shareholder may owe on fund distributions or on the redemption of fund shares. For the most recent month-end performance, please visit the Individual Investors section at putnam.com or call Putnam at 1-800-225-1581. Class R, R6, and Y shares are not available to all investors. See the Terms and definitions section in this report for definitions of the share classes offered by your fund.
Fund performance Total return for periods ended 6/30/21
Annual average
(life of fund) 10 yearsAnnual average 5 years
Annual average 3 years
Annual average 1 year
Class A (8/31/90)
Before sales charge 12.71% 341.16% 16.00% 175.87% 22.50% 84.21% 22.58% 40.82%
After sales charge 12.49 315.79 15.32 160.01 21.06 73.62 20.19 32.72
Class B (3/1/93)
Before CDSC 12.49 315.45 15.31 165.77 21.59 80.12 21.67 39.78
After CDSC 12.49 315.45 15.31 163.77 21.41 77.12 20.99 34.78
Class C (7/26/99)
Before CDSC 12.49 315.45 15.31 165.73 21.59 80.13 21.67 39.76
After CDSC 12.49 315.45 15.31 165.73 21.59 80.13 21.67 38.76
Class R (1/21/03)
Net asset value 12.43 330.25 15.71 172.49 22.20 82.84 22.28 40.47
Class R6 (5/22/18)
Net asset value 12.97 353.91 16.33 180.31 22.89 86.20 23.02 41.29
Class Y (7/19/94)
Net asset value 12.96 352.39 16.29 179.37 22.81 85.59 22.89 41.17
Current performance may be lower or higher than the quoted past performance, which cannot guarantee future results. After-sales-charge returns for class A shares reflect the deduction of the maximum 5.75% sales charge levied at the time of purchase. Class B share returns after contingent deferred sales charge (CDSC) reflect the applicable CDSC, which is 5% in the first year, declining over time to 1% in the sixth year, and is eliminated thereafter. Class C share returns after CDSC reflect a 1% CDSC for the first year that is eliminated thereafter. Class R, R6, and Y shares have no initial sales charge or CDSC. Performance for class B, C, R, and Y shares before their inception is derived from the historical performance of class A shares, adjusted for the applicable sales charge (or CDSC) and the higher operating expenses for such shares, except for class Y shares, for which 12b-1 fees are not applicable. Performance for class R6 shares prior to their inception is derived from the historical performance of class Y shares and has not been adjusted for the lower investor servicing fees applicable to class R6 shares; had it, returns would have been higher.
For a portion of the periods, the fund had expense limitations, without which returns would have been lower.
The fund has had performance fee adjustments that may have had a positive or negative impact on returns.
Class B and C share performance reflects conversion to class A shares after eight years.
10 Sustainable Leaders Fund
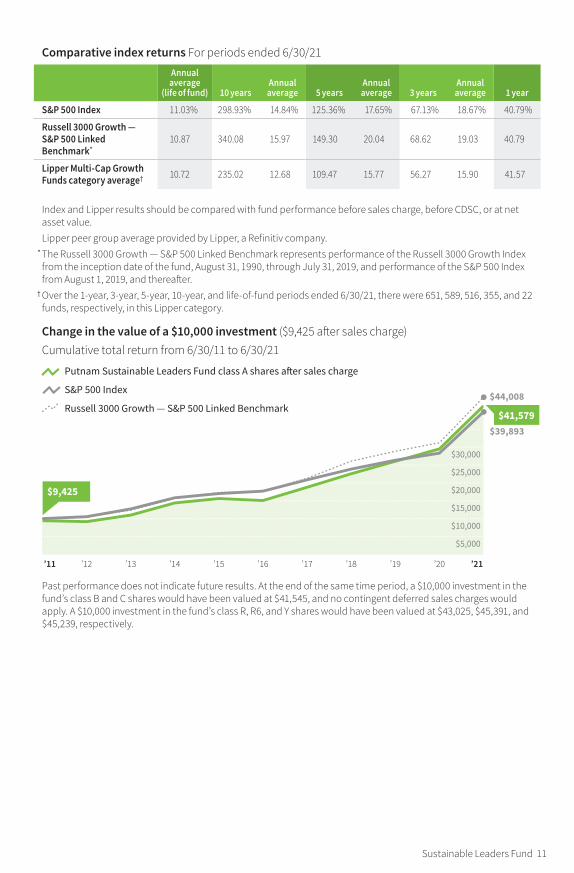
Comparative index returns For periods ended 6/30/21
Annual average
(life of fund) 10 yearsAnnual average 5 years
Annual average 3 years
Annual average 1 year
S&P 500 Index 11.03% 298.93% 14.84% 125.36% 17.65% 67.13% 18.67% 40.79%
Russell 3000 Growth — S&P 500 Linked Benchmark*
10.87 340.08 15.97 149.30 20.04 68.62 19.03 40.79
Lipper Multi-Cap Growth Funds category average† 10.72 235.02 12.68 109.47 15.77 56.27 15.90 41.57
Index and Lipper results should be compared with fund performance before sales charge, before CDSC, or at net asset value.
Lipper peer group average provided by Lipper, a Refinitiv company. * The Russell 3000 Growth — S&P 500 Linked Benchmark represents performance of the Russell 3000 Growth Index
from the inception date of the fund, August 31, 1990, through July 31, 2019, and performance of the S&P 500 Index from August 1, 2019, and thereafter.
† Over the 1-year, 3-year, 5-year, 10-year, and life-of-fund periods ended 6/30/21, there were 651, 589, 516, 355, and 22 funds, respectively, in this Lipper category.
Change in the value of a $10,000 investment ($9,425 after sales charge)Cumulative total return from 6/30/11 to 6/30/21
Past performance does not indicate future results. At the end of the same time period, a $10,000 investment in the fund’s class B and C shares would have been valued at $41,545, and no contingent deferred sales charges would apply. A $10,000 investment in the fund’s class R, R6, and Y shares would have been valued at $43,025, $45,391, and $45,239, respectively.
$5,000
$10,000
$15,000
$20,000
$25,000
$30,000
’11 ’12 ’13 ’14 ’15 ’16 ’17 ’18 ’19 ’20 ’21
$39,893
$44,008
Putnam Sustainable Leaders Fund class A shares a�er sales charge
S&P 500 Index
Russell 3000 Growth — S&P 500 Linked Benchmark
$9,425
$41,579
Sustainable Leaders Fund 11
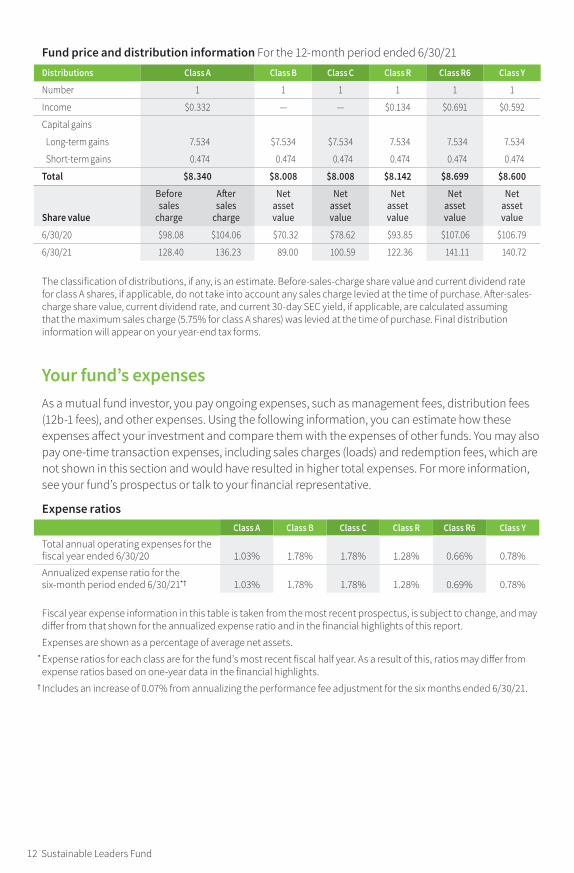
Fund price and distribution information For the 12-month period ended 6/30/21
Distributions Class A Class B Class C Class R Class R 6 Class Y
Number 1 1 1 1 1 1
Income $0.332 — — $0.134 $0.691 $0.592
Capital gains
Long-term gains 7.534 $7.534 $7.534 7.534 7.534 7.534
Short-term gains 0.474 0.474 0.474 0.474 0.474 0.474
Total $8.340 $8.008 $8.008 $8.142 $8.699 $8.600
Share value
Before sales
charge
After sales
charge
Net asset value
Net asset value
Net asset value
Net asset value
Net asset value
6/30/20 $98.08 $104.06 $70.32 $78.62 $93.85 $107.06 $106.79
6/30/21 128.40 136.23 89.00 100.59 122.36 141.11 140.72
The classification of distributions, if any, is an estimate. Before-sales-charge share value and current dividend rate for class A shares, if applicable, do not take into account any sales charge levied at the time of purchase. After-sales-charge share value, current dividend rate, and current 30-day SEC yield, if applicable, are calculated assuming that the maximum sales charge (5.75% for class A shares) was levied at the time of purchase. Final distribution information will appear on your year-end tax forms.
Your fund’s expensesAs a mutual fund investor, you pay ongoing expenses, such as management fees, distribution fees (12b-1 fees), and other expenses. Using the following information, you can estimate how these expenses affect your investment and compare them with the expenses of other funds. You may also pay one-time transaction expenses, including sales charges (loads) and redemption fees, which are not shown in this section and would have resulted in higher total expenses. For more information, see your fund’s prospectus or talk to your financial representative.
Expense ratiosClass A Class B Class C Class R Class R6 Class Y
Total annual operating expenses for the fiscal year ended 6/30/20 1.03% 1.78% 1.78% 1.28% 0.66% 0.78%
Annualized expense ratio for the six-month period ended 6/30/21*† 1.03% 1.78% 1.78% 1.28% 0.69% 0.78%
Fiscal year expense information in this table is taken from the most recent prospectus, is subject to change, and may differ from that shown for the annualized expense ratio and in the financial highlights of this report.
Expenses are shown as a percentage of average net assets. * Expense ratios for each class are for the fund’s most recent fiscal half year. As a result of this, ratios may differ from
expense ratios based on one-year data in the financial highlights. † Includes an increase of 0.07% from annualizing the performance fee adjustment for the six months ended 6/30/21.
12 Sustainable Leaders Fund
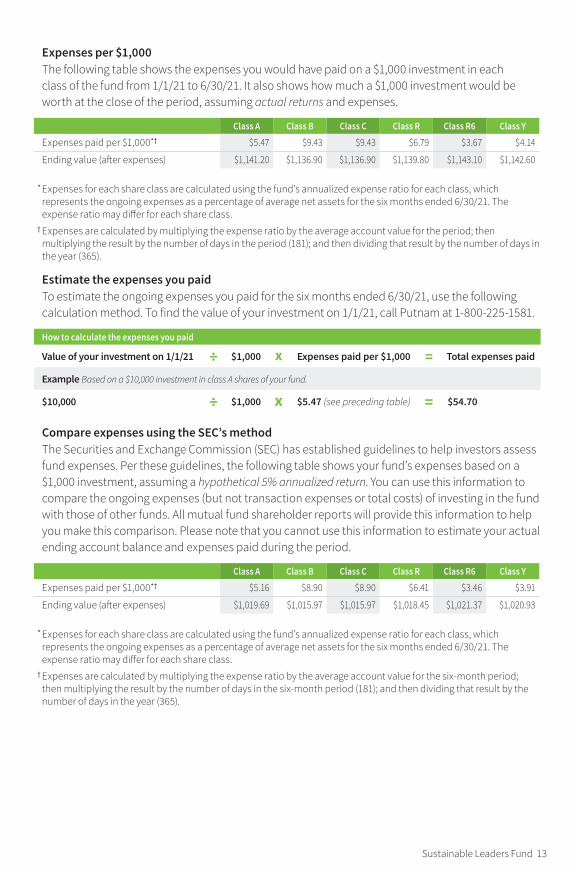
Expenses per $1,000The following table shows the expenses you would have paid on a $1,000 investment in each class of the fund from 1/1/21 to 6/30/21. It also shows how much a $1,000 investment would be worth at the close of the period, assuming actual returns and expenses.
Class A Class B Class C Class R Class R6 Class Y
Expenses paid per $1,000*† $5.47 $9.43 $9.43 $6.79 $3.67 $4.14
Ending value (after expenses) $1,141.20 $1,136.90 $1,136.90 $1,139.80 $1,143.10 $1,142.60
* Expenses for each share class are calculated using the fund’s annualized expense ratio for each class, which represents the ongoing expenses as a percentage of average net assets for the six months ended 6/30/21. The expense ratio may differ for each share class.
† Expenses are calculated by multiplying the expense ratio by the average account value for the period; then multiplying the result by the number of days in the period (181); and then dividing that result by the number of days in the year (365).
Estimate the expenses you paidTo estimate the ongoing expenses you paid for the six months ended 6/30/21, use the following calculation method. To find the value of your investment on 1/1/21, call Putnam at 1-800-225-1581.
How to calculate the expenses you paid
Value of your investment on 1/1/21 ÷ $1,000 x Expenses paid per $1,000 = Total expenses paid
Example Based on a $10,000 investment in class A shares of your fund.
$10,000 ÷ $1,000 x $5.47 (see preceding table) = $54.70
Compare expenses using the SEC’s methodThe Securities and Exchange Commission (SEC) has established guidelines to help investors assess fund expenses. Per these guidelines, the following table shows your fund’s expenses based on a $1,000 investment, assuming a hypothetical 5% annualized return. You can use this information to compare the ongoing expenses (but not transaction expenses or total costs) of investing in the fund with those of other funds. All mutual fund shareholder reports will provide this information to help you make this comparison. Please note that you cannot use this information to estimate your actual ending account balance and expenses paid during the period.
Class A Class B Class C Class R Class R6 Class Y
Expenses paid per $1,000*† $5.16 $8.90 $8.90 $6.41 $3.46 $3.91
Ending value (after expenses) $1,019.69 $1,015.97 $1,015.97 $1,018.45 $1,021.37 $1,020.93
* Expenses for each share class are calculated using the fund’s annualized expense ratio for each class, which represents the ongoing expenses as a percentage of average net assets for the six months ended 6/30/21. The expense ratio may differ for each share class.
† Expenses are calculated by multiplying the expense ratio by the average account value for the six-month period; then multiplying the result by the number of days in the six-month period (181); and then dividing that result by the number of days in the year (365).
Sustainable Leaders Fund 13
Consider these risks before investingThe value of investments in the fund’s portfolio may fall or fail to rise over extended periods of time for a variety of reasons, including general economic, political, or financial market conditions; investor sentiment and market perceptions; government actions; geopolitical events or changes; and factors related to a specific issuer, geography, industry, or sector. These and other factors may lead to increased volatility and reduced liquidity in the fund’s portfolio holdings. Growth stocks may be more susceptible to earnings disappointments, and the market may not favor growth-style investing. Investments in small and midsize companies increase the risk of greater price fluctuations. International investing involves currency, economic, and political risks. Emerging-market securities have illiquidity and volatility risks. Investing with a focus on companies that exhibit a commitment to sustainable business practices may result in the fund investing in certain types of companies, industries, or sectors that underperform the market as a whole. From time to time, the fund may invest a significant portion of its assets in companies in one or more related industries or sectors, which would make the fund more vulnerable to adverse developments affecting those industries or sectors. The technology industries may be affected by technological obsolescence, short product cycles, falling prices and profits, competitive pressures, and general market conditions. In evaluating an investment opportunity, we may make investment decisions based on information and data that is incomplete or inaccurate. In addition, a company’s business practices, products, or services may change over time. As a result of these possibilities, among others, the fund may temporarily hold securities that are inconsistent with the fund’s sustainable investment criteria. Our investment techniques, analyses, and judgments may not produce the outcome we intend. The investments we select for the fund may not perform as well as other securities that we do not select for the fund. We, or the fund’s other service providers, may experience disruptions or operating errors that could have a negative effect on the fund. You can lose money by investing in the fund.
14 Sustainable Leaders Fund
Terms and definitions
Important termsTotal return shows how the value of the fund’s shares changed over time, assuming you held the shares through the entire period and reinvested all distributions in the fund.
Before sales charge, or net asset value, is the price, or value, of one share of a mutual fund, without a sales charge. Before-sales-charge figures fluctuate with market conditions, and are calculated by dividing the net assets of each class of shares by the number of outstanding shares in the class.
After sales charge is the price of a mutual fund share plus the maximum sales charge levied at the time of purchase. After-sales-charge perfor-mance figures shown here assume the 5.75% maximum sales charge for class A shares.
Contingent deferred sales charge (CDSC) is generally a charge applied at the time of the redemption of class B or C shares and assumes redemption at the end of the period. Your fund’s class B CDSC declines over time from a 5% maximum during the first year to 1% during the sixth year. After the sixth year, the CDSC no longer applies. The CDSC for class C shares is 1% for one year after purchase.
Share classesClass A shares are generally subject to an initial sales charge and no CDSC (except on certain redemptions of shares bought without an initial sales charge).
Class B shares are closed to new investments and are only available by exchange from another Putnam fund or through dividend and/or capital gains reinvestment. They are not subject to an initial sales charge and may be subject to a CDSC.
Class C shares are not subject to an initial sales charge and are subject to a CDSC only if the shares are redeemed during the first year.
Class R shares are not subject to an initial sales charge or CDSC and are only available to employer-sponsored retirement plans.
Class R6 shares are not subject to an initial sales charge or CDSC and carry no 12b-1 fee. They are generally only available to employer-sponsored retirement plans, corporate and institutional clients, and clients in other approved programs.
Class Y shares are not subject to an initial sales charge or CDSC and carry no 12b-1 fee. They are generally only available to corporate and institutional clients and clients in other approved programs.
Comparative indexesBloomberg Barclays U.S. Aggregate Bond Index is an unmanaged index of U.S. investment-grade fixed-income securities.
ICE BofA (Intercontinental Exchange Bank of America) U.S. 3-Month Treasury Bill Index is an unmanaged index that seeks to measure the performance of U.S. Treasury bills available in the marketplace.
Russell 3000 Growth Index is an unmanaged index of those companies in the broad-market Russell 3000 Index chosen for their growth orientation.
Russell 3000 Growth — S&P 500 Linked Benchmark represents performance of the Russell 3000 Growth Index from the inception date of the fund, August 31, 1990, through July 31, 2019, and performance of the S&P 500 Index from August 1, 2019, and thereafter.
S&P 500 Index is an unmanaged index of common stock performance.BLOOMBERG® is a trademark and service mark of Bloomberg Finance L.P. and its affiliates (collectively “Bloomberg”). BARCLAYS® is a trademark and service mark of Barclays Bank Plc (collectively with its affili-ates, “Barclays”), used under license. Bloomberg or Bloomberg’s licensors, including Barclays, own all proprietary rights in the Bloomberg Barclays Indices. Neither Bloomberg nor Barclays approves or endorses
Sustainable Leaders Fund 15
this material, or guarantees the accuracy of complete-ness of any information herein, or makes any warranty, express or limited, as to the results to be obtained therefrom and, to the maximum extent allowed by law, neither shall have any liability or responsibility for injury or damages arising in connection therewith.
Indexes assume reinvestment of all distributions and do not account for fees. Securities and performance of a fund and an index will differ. You cannot invest directly in an index.
ICE Data Indices, LLC (“ICE BofA”), used with permis-sion. ICE BofA permits use of the ICE BofA indices and related data on an “as is” basis; makes no warranties regarding same; does not guarantee the suitability, quality, accuracy, timeliness, and/or completeness of the ICE BofA indices or any data included in, related to, or derived therefrom; assumes no liability in connection with the use of the foregoing; and does not sponsor,
endorse, or recommend Putnam Investments, or any of its products or services.
Frank Russell Company is the source and owner of the trademarks, service marks, and copyrights related to the Russell Indexes. Russell® is a trademark of Frank Russell Company.
Lipper, a Refinitiv company, is a third-party industry-ranking entity that ranks mutual funds. Its rankings do not reflect sales charges. Lipper rankings are based on total return at net asset value relative to other funds that have similar current investment styles or objectives as determined by Lipper. Lipper may change a fund’s category assignment at its discretion. Lipper category averages reflect performance trends for funds within a category.
16 Sustainable Leaders Fund
Other information for shareholders
Proxy votingPutnam is committed to managing our mutual funds in the best interests of our shareholders. The Putnam funds’ proxy voting guidelines and procedures, as well as information regarding how your fund voted proxies relating to portfolio securities during the 12-month period ended June 30, 2021, are available in the Individual Investors section of putnam.com and on the Securities and Exchange Commis-sion (SEC) website, www.sec.gov. If you have questions about finding forms on the SEC’s website, you may call the SEC at 1-800-SEC-0330. You may also obtain the Putnam funds’ proxy voting guidelines and procedures at no charge by calling Putnam’s Shareholder Services at 1-800-225-1581.
Fund portfolio holdingsThe fund will file a complete schedule of its portfolio holdings with the SEC for the first and third quarters of each fiscal year on Form N-PORT within 60 days of the end of such fiscal quarter. Shareholders may obtain the fund’s Form N-PORT on the SEC’s website at www.sec.gov.
Prior to its use of Form N-PORT, the fund filed its complete schedule of its portfolio holdings with the SEC on Form N-Q, which is available online at www.sec.gov.
Trustee and employee fund ownershipPutnam employees and members of the Board of Trustees place their faith, confidence, and, most importantly, investment dollars in Putnam mutual funds. As of June 30, 2021,
Putnam employees had approximately $582,000,000 and the Trustees had approxi-mately $83,000,000 invested in Putnam mutual funds. These amounts include investments by the Trustees’ and employees’ immediate family members as well as investments through retirement and deferred compensation plans.
Liquidity risk management programPutnam, as the administrator of the fund’s liquidity risk management program (appointed by the Board of Trustees), presented the most recent annual report on the program to the Trustees in April 2021. The report covered the structure of the program, including the program documents and related policies and procedures adopted to comply with Rule 22e-4 under the Investment Company Act of 1940, and reviewed the operation of the program from January 2020 through December 2020. The report included a description of the annual liquidity assessment of the fund that Putnam performed in November 2020. The report noted that there were no material compliance exceptions identified under Rule 22e-4 during the period. The report included a review of the governance of the program and the methodology for classification of the fund’s investments. The report also included a discussion of liquidity monitoring during the period, including during the market liquidity challenges caused by the Covid-19 pandemic, and the impact those challenges had on the liquidity of the fund’s investments. Putnam concluded that the program has been operating effectively and adequately to ensure compliance with Rule 22e-4.
Sustainable Leaders Fund 17
Important notice regarding Putnam’s privacy policy
In order to conduct business with our shareholders, we must obtain certain personal information such as account holders’ names, addresses, Social Security numbers, and dates of birth. Using this information, we are able to maintain accurate records of accounts and transactions.
It is our policy to protect the confidentiality of our shareholder information, whether or not a shareholder currently owns shares of our funds. In particular, it is our policy not to sell information about you or your accounts to outside marketing firms. We have safeguards in place designed to prevent unauthorized access
to our computer systems and procedures to protect personal information from unauthorized use.
Under certain circumstances, we must share account information with outside vendors who provide services to us, such as mailings and proxy solicitations. In these cases, the service providers enter into confidentiality agreements with us, and we provide only the information necessary to process transactions and perform other services related to your account. Finally, it is our policy to share account information with your financial representative, if you’ve listed one on your Putnam account.
18 Sustainable Leaders Fund
Trustee approval of management contract
Trustee approval of management contractGeneral conclusionsThe Board of Trustees of The Putnam Funds oversees the management of each fund and, as required by law, determines annually whether to approve the continuance of your fund’s management contract with Putnam Investment Management, LLC (“Putnam Management”) and the sub-management contract with respect to your fund between Putnam Management and its affiliate, Putnam Investments Limited (“PIL”). The Board, with the assistance of its Contract Commit-tee, requests and evaluates all information it deems reasonably necessary under the circum-stances in connection with its annual contract review. The Contract Committee consists solely of Trustees who are not “interested persons” (as this term is defined in the Investment Company Act of 1940, as amended (the “1940 Act”)) of The Putnam Funds (“Independent Trustees”).
At the outset of the review process, members of the Board’s independent staff and independent legal counsel considered any possible changes to the annual contract review materials furnished to the Contract Committee during the course of the previous year’s review and, as applicable, identified those changes to Putnam Management. Following these discussions and in consultation with the Contract Committee, the Independent Trustees’ independent legal counsel requested that Putnam Management and its affiliates furnish specified information, together with any additional information that Putnam Management considered relevant, to the Contract Commit-tee. Over the course of several months ending in June 2021, the Contract Committee met on a number of occasions with representatives of Putnam Management, and separately in executive session, to consider the information that Putnam Management provided. Throughout this process, the Contract Committee was assisted by the members of the Board’s independent staff and by independent legal counsel for The Putnam Funds and the Independent Trustees.
In May 2021, the Contract Committee met in executive session to discuss and consider its recommendations with respect to the contin-uance of the contracts. At the Trustees’ June 2021 meeting, the Contract Committee met in executive session with the other Independent Trustees to review a summary of the key financial, performance and other data that the Contract Committee considered in the course of its review.
The Contract Committee then presented its written report, which summarized the key factors that the Committee had considered and set forth its recommendations. The Contract Committee recommended, and the Independent Trustees approved, the continuance of your fund’s manage-ment and sub-management contracts, effective July 1, 2021. (Because PIL is an affiliate of Putnam Management and Putnam Management remains fully responsible for all services provided by PIL, the Trustees have not attempted to evaluate PIL as a separate entity, and all subsequent refer-ences to Putnam Management below should be deemed to include reference to PIL as necessary or appropriate in the context.)
The Independent Trustees’ approval was based on the following conclusions:
• That the fee schedule in effect for your fund repre-sented reasonable compensation in light of the nature and quality of the services being provided to the fund, the fees paid by competitive funds, the costs incurred by Putnam Management in providing services to the fund, and the appli-cation of certain reductions and waivers noted below; and
• That the fee schedule in effect for your fund represented an appropriate sharing between fund shareholders and Putnam Management of any economies of scale as may exist in the management of the fund at current asset levels.
These conclusions were based on a comprehen-sive consideration of all information provided to the Trustees and were not the result of any single factor. Some of the factors that figured particularly in the Trustees’ deliberations and how the Trust-ees considered these factors are described below, although individual Trustees may have evaluated the information presented differently, giving differ-ent weights to various factors. It is also important to recognize that the management arrangements for your fund and the other Putnam funds are the result of many years of review and discussion between the Independent Trustees and Putnam Management, that some aspects of the arrange-ments may receive greater scrutiny in some years than others, and that the Trustees’ conclusions may be based, in part, on their consideration of fee arrangements in previous years. For example, with certain exceptions primarily involving newly launched or repositioned funds, the current fee arrangements under the vast majority of the funds’ management contracts were first
Sustainable Leaders Fund 19
implemented at the beginning of 2010 following extensive review by the Contract Committee and discussions with representatives of Putnam Management, as well as approval by shareholders.
Management fee schedules and total expensesThe Trustees reviewed the management fee sched-ules in effect for all Putnam funds, including fee levels and breakpoints. Under its management contract, your fund has the benefit of breakpoints in its management fee schedule that provide shareholders with reduced fee levels as assets under management in the Putnam family of funds increase. The Trustees also reviewed the total expenses of each Putnam fund, recognizing that in most cases management fees represented the major, but not the sole, determinant of total costs to fund shareholders. (Two funds have implemented so-called “all-in” management fees covering substantially all routine fund operating costs.)
In reviewing fees and expenses, the Trustees generally focus their attention on material changes in circumstances — for example, changes in assets under management, changes in a fund’s investment strategy, changes in Putnam Management’s operating costs or profitability, or changes in competitive practices in the mutual fund industry — that suggest that consideration of fee changes might be warranted. The Trustees concluded that the circumstances did not indicate that changes to the management fee schedule for your fund would be appropriate at this time.
In addition, your fund’s management contract provides that its management fees will be adjusted up or down depending upon whether your fund’s performance is better or worse than the performance of an appropriate index of securi-ties prices specified in the management contract. In the course of reviewing investment perfor-mance, the Trustees examined the operation of your fund’s performance fees and concluded that these fees were operating effectively to align further Putnam Management’s economic interests with those of the fund’s shareholders.
As in the past, the Trustees also focused on the competitiveness of each fund’s total expense ratio. In order to support the effort to have fund expenses meet competitive standards, the Trustees and Putnam Management and the funds’ investor servicing agent, Putnam Inves-tor Services, Inc. (“PSERV”), have implemented expense limitations that were in effect during your fund’s fiscal year ending in 2020. These expense limitations were: (i) a contractual expense
limitation applicable to specified open-end funds, including your fund, of 25 basis points on investor servicing fees and expenses and (ii) a contractual expense limitation applicable to specified open-end funds, including your fund, of 20 basis points on so-called “other expenses” (i.e., all expenses exclusive of management fees, distribution fees, investor servicing fees, investment-related expenses, interest, taxes, brokerage commissions, acquired fund fees and expenses and extraordinary expenses). These expense limitations attempt to maintain compet-itive expense levels for the funds. Most funds, including your fund, had sufficiently low expenses that these expense limitations were not operative during their fiscal years ending in 2020. Putnam Management and PSERV have agreed to maintain these expense limitations until at least October 30, 2022. The support of Putnam Management and PSERV for these expense limitation arrangements was an important factor in the Trustees’ decision to approve the continuance of your fund’s management and sub-management contracts.
The Trustees reviewed comparative fee and expense information for a custom group of competitive funds selected by Broadridge Financial Solutions, Inc. (“Broadridge”). This comparative information included your fund’s percentile ranking for effective management fees and total expenses (excluding any applicable 12b-1 fees), which provides a general indication of your fund’s relative standing. In the custom peer group, your fund ranked in the second quintile in effective management fees (determined for your fund and the other funds in the custom peer group based on fund asset size and the applicable contractual management fee schedule) and in the third quintile in total expenses (excluding any applicable 12b-1 fees) as of December 31, 2020. The first quintile represents the least expensive funds and the fifth quintile the most expensive funds. The fee and expense data reported by Broadridge as of December 31, 2020 reflected the most recent fiscal year-end data available in Broadridge’s database at that time.
In connection with their review of fund manage-ment fees and total expenses, the Trustees also reviewed the costs of the services provided and the profits realized by Putnam Management and its affiliates from their contractual relationships with the funds. This information included trends in revenues, expenses and profitability of Putnam Management and its affiliates relating to the investment management, investor servicing and distribution services provided to the funds. In
20 Sustainable Leaders Fund
this regard, the Trustees also reviewed an analy-sis of the revenues, expenses and profitability of Putnam Management and its affiliates, allocated on a fund-by-fund basis, with respect to the funds’ management, distribution, and investor servicing contracts. For each fund, the analysis presented information about revenues, expenses and profit-ability for each of the agreements separately and for the agreements taken together on a combined basis. The Trustees concluded that, at current asset levels, the fee schedules in place for the Putnam funds, including the fee schedule for your fund, represented reasonable compensation for the services being provided and represented an appropriate sharing between fund sharehold-ers and Putnam Management of any economies of scale as may exist in the management of the Putnam funds at that time.
The information examined by the Trustees in connection with their annual contract review for the Putnam funds included information regarding services provided and fees charged by Putnam Management and its affiliates to other clients, including defined benefit pension and profit- sharing plans, sub-advised mutual funds, private funds sponsored by affiliates of Putnam Manage-ment, model-only separately managed accounts and Putnam Management’s newly launched exchange-traded funds. This information included, in cases where a product’s investment strategy corresponds with a fund’s strategy, comparisons of those fees with fees charged to the Putnam funds, as well as an assessment of the differences in the services provided to these clients as compared to the services provided to the Putnam funds. The Trustees observed that the differences in fee rates between these clients and the Putnam funds are by no means uniform when examined by individual asset sectors, suggesting that differences in the pricing of investment management services to these types of clients may reflect, among other things, historical competitive forces operating in separate marketplaces. The Trustees considered the fact that in many cases fee rates across different asset classes are higher on average for mutual funds than for other clients, and the Trustees also considered the differences between the services that Putnam Management provides to the Putnam funds and those that it provides to its other clients. The Trustees did not rely on these comparisons to any significant extent in conclud-ing that the management fees paid by your fund are reasonable.
Investment performanceThe quality of the investment process provided by Putnam Management represented a major factor in the Trustees’ evaluation of the quality of services provided by Putnam Management under your fund’s management contract. The Trustees were assisted in their review of Putnam Manage-ment’s investment process and performance by the work of the investment oversight committees of the Trustees and the full Board of Trustees, which meet on a regular basis with individual portfolio managers and with senior management of Putnam Management’s Investment Division throughout the year. The Trustees concluded that Putnam Management generally provides a high-quality investment process — based on the experience and skills of the individuals assigned to the management of fund portfolios, the resources made available to them, and in general Putnam Management’s ability to attract and retain high-quality personnel — but also recognized that this does not guarantee favorable investment results for every fund in every time period.
The Trustees considered that, in the aggregate, The Putnam Funds generally performed well in 2020, which Putnam Management characterized as a challenging year with significant volatility and varied market dynamics. On an asset-weighted basis, the Putnam funds ranked in the second quartile of their peers as determined by Lipper Inc. (“Lipper”) for the year ended December 31, 2020 and, on an asset-weighted-basis, delivered a gross return that was 2.3% ahead of their benchmarks in 2020. In addition to the performance of the individual Putnam funds, the Trustees considered, as they had in prior years, the performance of The Putnam Fund complex versus competitor fund complexes. In this regard, the Trustees observed that The Putnam Funds’ relative performance, as reported in the Barron’s/Lipper Fund Families survey, continued to be exceptionally strong over the long term, with The Putnam Funds ranking as the 3rd best performing mutual fund complex out of 44 complexes for the ten-year period, with 2020 marking the fourth consecutive year that The Putnam Funds have ranked in the top ten fund complexes for the ten-year period. The Trustees noted that The Putnam Funds’ performance was solid over the one- and five-year periods, with The Putnam Funds ranking 22nd out of 53 complexes and 14th out of 50 complexes, respectively. In addition to the Barron’s/Lipper Fund Families Survey, the Trustees also considered the funds’ ratings assigned by Morningstar Inc., noting that 26 of the funds were four- or five-star rated at the
Sustainable Leaders Fund 21
end of 2020 (representing an increase of four funds year-over-year) and that this included seven funds that had achieved a five-star rating (representing an increase of two funds year-over-year). They also noted, however, the disappointing investment performance of some funds for periods ended December 31, 2020 and considered information provided by Putnam Management regarding the factors contributing to the underperformance and actions being taken to improve the performance of these particular funds. The Trustees indicated their intention to continue to monitor closely the performance of those funds and evaluate whether additional actions to address areas of underperformance may be warranted.
For purposes of the Trustees’ evaluation of the Putnam funds’ investment performance, the Trustees generally focus on a competitive indus-try ranking of each fund’s total net return over a one-year, three-year and five-year period. For a number of Putnam funds with relatively unique investment mandates for which Putnam Manage-ment informed the Trustees that meaningful competitive performance rankings are not consid-ered to be available, the Trustees evaluated performance based on their total gross and net returns and comparisons of those returns to the returns of selected investment benchmarks. In the case of your fund, the Trustees considered that its class A share cumulative total return performance at net asset value was in the following quartiles of its Lipper peer group (Lipper Multi-Cap Core Funds) for the one-year, three-year and five-year periods ended December 31, 2020 (the first quartile repre-senting the best-performing funds and the fourth quartile the worst-performing funds):One-year period 1stThree-year period 1stFive-year period 1st
For the one-year, three-year and five-year periods ended December 31, 2020, your fund’s performance was in the top decile of its Lipper peer group. Over the one-year, three-year and five-year periods ended December 31, 2020, there were 660, 593 and 514 funds, respectively, in your fund’s Lipper peer group. (When considering performance infor-mation, shareholders should be mindful that past performance is not a guarantee of future results.)
The Trustees considered Putnam Management’s continued efforts to support fund performance through certain initiatives, including structuring compensation for portfolio managers to enhance accountability for fund performance, emphasiz-ing accountability in the portfolio management process, and affirming its commitment to a
fundamental-driven approach to investing. The Trustees noted further that Putnam Management had made selective hires and internal promotions in 2020 to strengthen its investment team.
Brokerage and soft-dollar allocations; investor servicingThe Trustees considered various potential benefits that Putnam Management may receive in connection with the services it provides under the management contract with your fund. These include benefits related to brokerage allocation and the use of soft dollars, whereby a portion of the commissions paid by a fund for brokerage may be used to acquire research services that are expected to be useful to Putnam Management in managing the assets of the fund and of other clients. Subject to policies established by the Trustees, soft dollars generated by these means are used predomi-nantly to acquire brokerage and research services (including third-party research and market data) that enhance Putnam Management’s investment capabilities and supplement Putnam Manage-ment’s internal research efforts. The Trustees indicated their continued intent to monitor regula-tory and industry developments in this area with the assistance of their Brokerage Committee. In addition, with the assistance of their Brokerage Committee, the Trustees indicated their contin-ued intent to monitor the allocation of the Putnam funds’ brokerage in order to ensure that the princi-ple of seeking best price and execution remains paramount in the portfolio trading process.
Putnam Management may also receive benefits from payments that the funds make to Putnam Management’s affiliates for investor or distribution services. In conjunction with the annual review of your fund’s management and sub-management contracts, the Trustees reviewed your fund’s investor servicing agreement with PSERV and its distributor’s contract and distribution plans with Putnam Retail Management Limited Partnership (“PRM”), both of which are affiliates of Putnam Management. The Trustees concluded that the fees payable by the funds to PSERV and PRM, as applicable, for such services are fair and reason-able in relation to the nature and quality of such services, the fees paid by competitive funds, and the costs incurred by PSERV and PRM, as appli-cable, in providing such services. Furthermore, the Trustees were of the view that the investor services provided by PSERV were required for the operation of the funds, and that they were of a quality at least equal to those provided by other providers.
22 Sustainable Leaders Fund
Audited financial statements
Sustainable Leaders Fund 23
Audited financial statements
These sections of the report, as well as the accompanying Notes, preceded by the Report of Independent Registered Public Accounting Firm, constitute the fund’s audited financial statements.
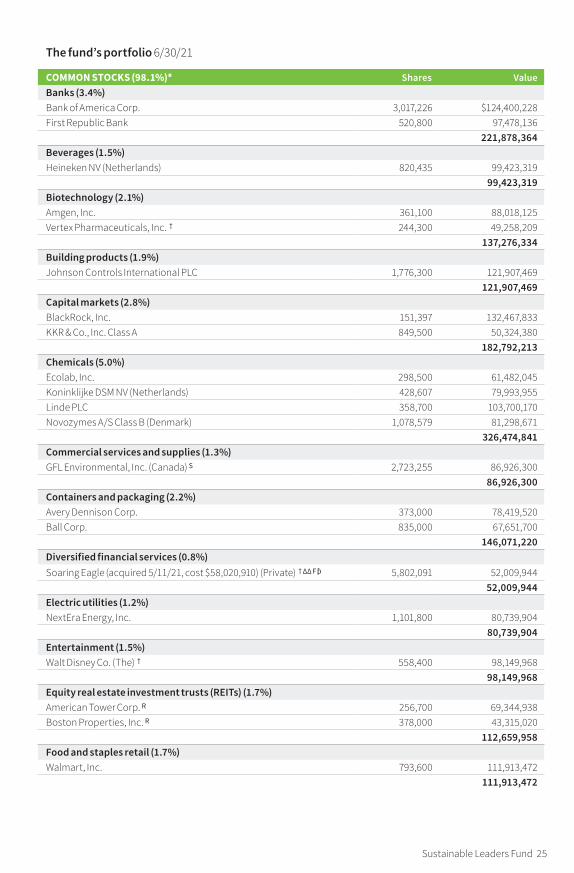
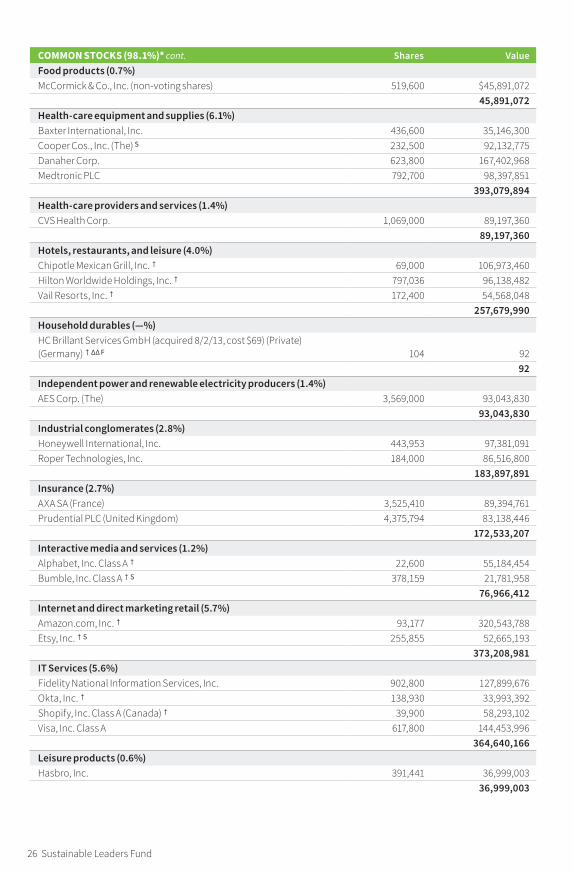
The fund’s portfolio lists all the fund’s invest-ments and their values as of the last day of the reporting period. Holdings are organized by asset type and industry sector, country, or state to show areas of concentration and diversification.
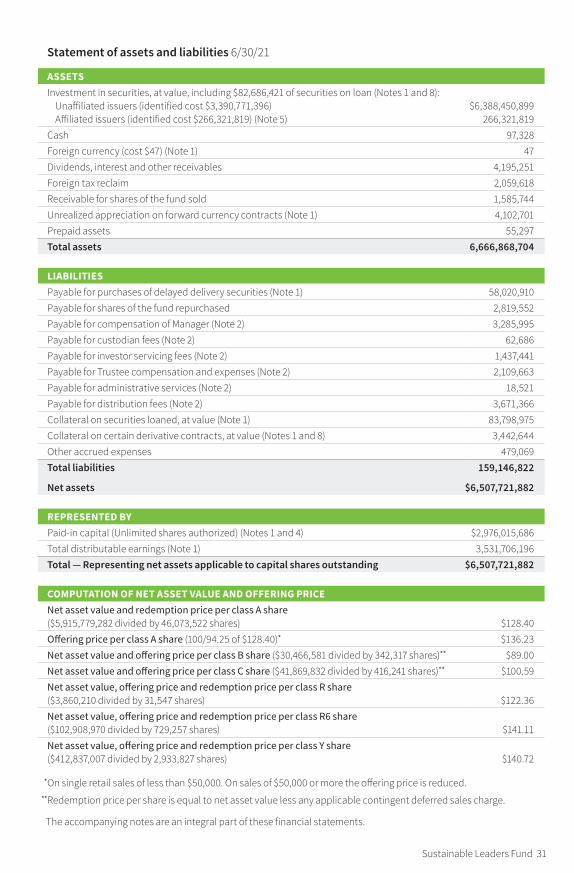
Statement of assets and liabilities shows how the fund’s net assets and share price are determined. All investment and non-investment assets are added together. Any unpaid expenses and other liabilities are subtracted from this total. The result is divided by the number of shares to determine the net asset value per share, which is calculated separately for each class of shares. (For funds with preferred shares, the amount subtracted from total assets includes the liquidation preference of preferred shares.)
Statement of operations shows the fund’s net investment gain or loss. This is done by first adding up all the fund’s earnings — from dividends and interest income — and subtracting its operating
expenses to determine net investment income (or loss). Then, any net gain or loss the fund realized on the sales of its holdings — as well as any unreal-ized gains or losses over the period — is added to or subtracted from the net investment result to determine the fund’s net gain or loss for the fiscal period.
Statement of changes in net assets shows how the fund’s net assets were affected by the fund’s net investment gain or loss, by distributions to shareholders, and by changes in the number of the fund’s shares. It lists distributions and their sources (net investment income or realized capital gains) over the current reporting period and the most recent fiscal year-end. The distributions listed here may not match the sources listed in the Statement of operations because the distributions are deter-mined on a tax basis and may be paid in a different period from the one in which they were earned.
Financial highlights provide an overview of the fund’s investment results, per-share distributions, expense ratios, net investment income ratios, and portfolio turnover in one summary table, reflecting the five most recent reporting periods. In a semiannual report, the highlights table also includes the current reporting period.
Report of Independent Registered Public Accounting Firm
To the Board of Trustees and Shareholders of Putnam Sustainable Leaders Fund:
Opinion on the Financial Statements
We have audited the accompanying statement of assets and liabilities, including the fund’s portfolio, of Putnam Sustainable Leaders Fund (the “Fund”) as of June 30, 2021, the related statement of operations for the year ended June 30, 2021, the statement of changes in net assets for each of the two years in the period ended June 30, 2021, including the related notes, and the financial highlights for each of the periods indicated therein (collectively referred to as the “financial statements”). In our opinion, the financial statements present fairly, in all material respects, the financial position of the Fund as of June 30, 2021, the results of its operations for the year then ended, the changes in its net assets for each of the two years in the period ended June 30, 2021, and the financial highlights for each of the periods indicated therein in conformity with accounting principles generally accepted in the United States of America.
Basis for Opinion
These financial statements are the responsibility of the Fund’s management. Our responsibility is to express an opinion on the Fund’s financial statements based on our audits. We are a public accounting firm registered with the Public Company Accounting Oversight Board (United States) (“PCAOB”) and are required to be independent with respect to the Fund in accordance with the U.S. federal securities laws and the applicable rules and regulations of the Securities and Exchange Commission and the PCAOB.
We conducted our audits of these financial statements in accordance with the standards of the PCAOB. Those standards require that we plan and perform the audit to obtain reasonable assurance about whether the financial statements are free of material misstatement, whether due to error or fraud.
Our audits included performing procedures to assess the risks of material misstatement of the financial statements, whether due to error or fraud, and performing procedures that respond to those risks. Such procedures included examining, on a test basis, evidence regarding the amounts and disclosures in the financial statements. Our audits also included evaluating the accounting principles used and significant estimates made by management, as well as evaluating the overall presentation of the financial statements. Our procedures included confirmation of securities owned as of June 30, 2021, by correspondence with the custodian, transfer agent, portfolio company investee and brokers; when replies were not received from brokers, we performed other auditing procedures. We believe that our audits provide a reasonable basis for our opinion.
PricewaterhouseCoopers LLP Boston, Massachusetts August 11, 2021
We have served as the auditor of one or more investment companies in the Putnam Investments family of mutual funds since at least 1957. We have not been able to determine the specific year we began serving as auditor.
24 Sustainable Leaders Fund
Sustainable Leaders Fund 25
COMMON STOCKS (98.1%)* Shares ValueBanks (3.4%)Bank of America Corp. 3,017,226 $124,400,228First Republic Bank 520,800 97,478,136
221,878,364Beverages (1.5%)Heineken NV (Netherlands) 820,435 99,423,319
99,423,319Biotechnology (2.1%)Amgen, Inc. 361,100 88,018,125Vertex Pharmaceuticals, Inc. † 244,300 49,258,209
137,276,334Building products (1.9%)Johnson Controls International PLC 1,776,300 121,907,469
121,907,469Capital markets (2.8%)BlackRock, Inc. 151,397 132,467,833KKR & Co., Inc. Class A 849,500 50,324,380
182,792,213Chemicals (5.0%)Ecolab, Inc. 298,500 61,482,045Koninklijke DSM NV (Netherlands) 428,607 79,993,955Linde PLC 358,700 103,700,170Novozymes A/S Class B (Denmark) 1,078,579 81,298,671
326,474,841Commercial services and supplies (1.3%)GFL Environmental, Inc. (Canada) S 2,723,255 86,926,300
86,926,300Containers and packaging (2.2%)Avery Dennison Corp. 373,000 78,419,520Ball Corp. 835,000 67,651,700
146,071,220Diversified financial services (0.8%)Soaring Eagle (acquired 5/11/21, cost $58,020,910) (Private) † ∆∆ F ƥ 5,802,091 52,009,944
52,009,944Electric utilities (1.2%)NextEra Energy, Inc. 1,101,800 80,739,904
80,739,904Entertainment (1.5%)Walt Disney Co. (The) † 558,400 98,149,968
98,149,968Equity real estate investment trusts (REITs) (1.7%)American Tower Corp. R 256,700 69,344,938Boston Properties, Inc. R 378,000 43,315,020
112,659,958Food and staples retail (1.7%)Walmart, Inc. 793,600 111,913,472
111,913,472
The fund’s portfolio 6/30/21
26 Sustainable Leaders Fund
COMMON STOCKS (98.1%)* cont. Shares ValueFood products (0.7%)McCormick & Co., Inc. (non-voting shares) 519,600 $45,891,072
45,891,072Health-care equipment and supplies (6.1%)Baxter International, Inc. 436,600 35,146,300Cooper Cos., Inc. (The) S 232,500 92,132,775Danaher Corp. 623,800 167,402,968Medtronic PLC 792,700 98,397,851
393,079,894Health-care providers and services (1.4%)CVS Health Corp. 1,069,000 89,197,360
89,197,360Hotels, restaurants, and leisure (4.0%)Chipotle Mexican Grill, Inc. † 69,000 106,973,460Hilton Worldwide Holdings, Inc. † 797,036 96,138,482Vail Resorts, Inc. † 172,400 54,568,048
257,679,990Household durables (—%)HC Brillant Services GmbH (acquired 8/2/13, cost $69) (Private) (Germany) † ∆∆ F 104 92
92Independent power and renewable electricity producers (1.4%)AES Corp. (The) 3,569,000 93,043,830
93,043,830Industrial conglomerates (2.8%)Honeywell International, Inc. 443,953 97,381,091Roper Technologies, Inc. 184,000 86,516,800
183,897,891Insurance (2.7%)AXA SA (France) 3,525,410 89,394,761Prudential PLC (United Kingdom) 4,375,794 83,138,446
172,533,207Interactive media and services (1.2%)Alphabet, Inc. Class A † 22,600 55,184,454Bumble, Inc. Class A † S 378,159 21,781,958
76,966,412Internet and direct marketing retail (5.7%)Amazon.com, Inc. † 93,177 320,543,788Etsy, Inc. † S 255,855 52,665,193
373,208,981IT Services (5.6%)Fidelity National Information Services, Inc. 902,800 127,899,676Okta, Inc. † 138,930 33,993,392Shopify, Inc. Class A (Canada) † 39,900 58,293,102Visa, Inc. Class A 617,800 144,453,996
364,640,166Leisure products (0.6%)Hasbro, Inc. 391,441 36,999,003
36,999,003
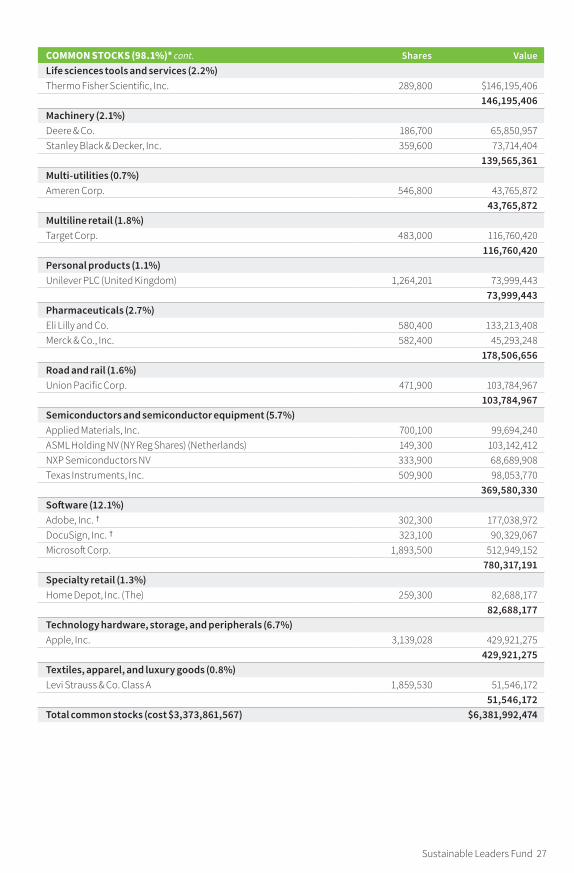
Sustainable Leaders Fund 27
COMMON STOCKS (98.1%)* cont. Shares ValueLife sciences tools and services (2.2%)Thermo Fisher Scientific, Inc. 289,800 $146,195,406
146,195,406Machinery (2.1%)Deere & Co. 186,700 65,850,957Stanley Black & Decker, Inc. 359,600 73,714,404
139,565,361Multi-utilities (0.7%)Ameren Corp. 546,800 43,765,872
43,765,872Multiline retail (1.8%)Target Corp. 483,000 116,760,420
116,760,420Personal products (1.1%)Unilever PLC (United Kingdom) 1,264,201 73,999,443
73,999,443Pharmaceuticals (2.7%)Eli Lilly and Co. 580,400 133,213,408Merck & Co., Inc. 582,400 45,293,248
178,506,656Road and rail (1.6%)Union Pacific Corp. 471,900 103,784,967
103,784,967Semiconductors and semiconductor equipment (5.7%)Applied Materials, Inc. 700,100 99,694,240ASML Holding NV (NY Reg Shares) (Netherlands) 149,300 103,142,412NXP Semiconductors NV 333,900 68,689,908Texas Instruments, Inc. 509,900 98,053,770
369,580,330Software (12.1%)Adobe, Inc. † 302,300 177,038,972DocuSign, Inc. † 323,100 90,329,067Microsoft Corp. 1,893,500 512,949,152
780,317,191Specialty retail (1.3%)Home Depot, Inc. (The) 259,300 82,688,177
82,688,177Technology hardware, storage, and peripherals (6.7%)Apple, Inc. 3,139,028 429,921,275
429,921,275Textiles, apparel, and luxury goods (0.8%)Levi Strauss & Co. Class A 1,859,530 51,546,172
51,546,172Total common stocks (cost $3,373,861,567) $6,381,992,474
28 Sustainable Leaders Fund
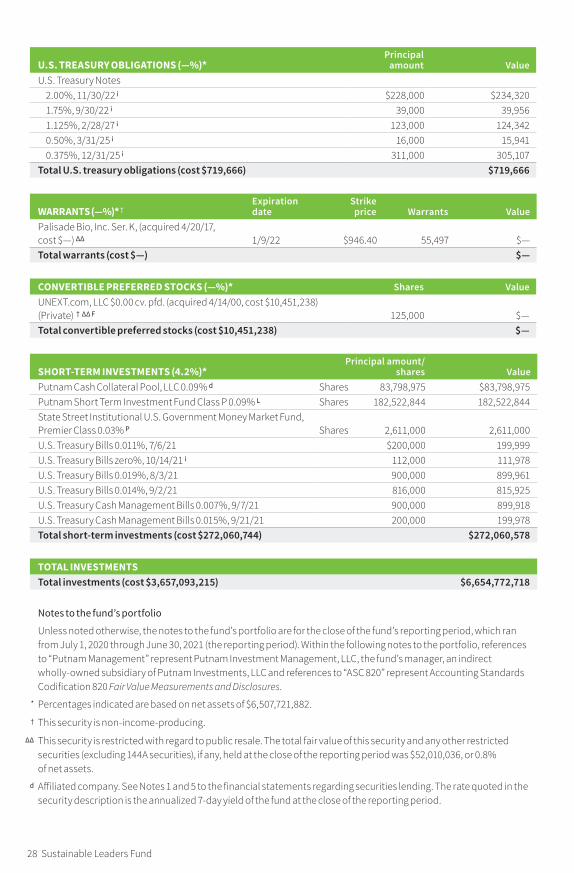
U.S. TREASURY OBLIGATIONS (—%)*Principal
amount ValueU.S. Treasury Notes
2.00%, 11/30/22 i $228,000 $234,3201.75%, 9/30/22 i 39,000 39,9561.125%, 2/28/27 i 123,000 124,3420.50%, 3/31/25 i 16,000 15,9410.375%, 12/31/25 i 311,000 305,107
Total U.S. treasury obligations (cost $719,666) $719,666
WARRANTS (—%)* † Expiration date
Strike price Warrants Value
Palisade Bio, Inc. Ser. K, (acquired 4/20/17, cost $—) ∆∆ 1/9/22 $946.40 55,497 $—Total warrants (cost $—) $—
CONVERTIBLE PREFERRED STOCKS (—%)* Shares ValueUNEXT.com, LLC $0.00 cv. pfd. (acquired 4/14/00, cost $10,451,238) (Private) † ∆∆ F 125,000 $—Total convertible preferred stocks (cost $10,451,238) $—
SHORT‑TERM INVESTMENTS (4.2%)*Principal amount/
shares ValuePutnam Cash Collateral Pool, LLC 0.09% d Shares 83,798,975 $83,798,975Putnam Short Term Investment Fund Class P 0.09% L Shares 182,522,844 182,522,844State Street Institutional U.S. Government Money Market Fund, Premier Class 0.03% P Shares 2,611,000 2,611,000U.S. Treasury Bills 0.011%, 7/6/21 $200,000 199,999U.S. Treasury Bills zero%, 10/14/21 i 112,000 111,978U.S. Treasury Bills 0.019%, 8/3/21 900,000 899,961U.S. Treasury Bills 0.014%, 9/2/21 816,000 815,925U.S. Treasury Cash Management Bills 0.007%, 9/7/21 900,000 899,918U.S. Treasury Cash Management Bills 0.015%, 9/21/21 200,000 199,978Total short-term investments (cost $272,060,744) $272,060,578
TOTAL INVESTMENTSTotal investments (cost $3,657,093,215) $6,654,772,718
Notes to the fund’s portfolio
Unless noted otherwise, the notes to the fund’s portfolio are for the close of the fund’s reporting period, which ran from July 1, 2020 through June 30, 2021 (the reporting period). Within the following notes to the portfolio, references to “Putnam Management” represent Putnam Investment Management, LLC, the fund’s manager, an indirect wholly-owned subsidiary of Putnam Investments, LLC and references to “ASC 820” represent Accounting Standards Codification 820 Fair Value Measurements and Disclosures.
* Percentages indicated are based on net assets of $6,507,721,882.
† This security is non-income-producing.
∆∆ This security is restricted with regard to public resale. The total fair value of this security and any other restricted securities (excluding 144A securities), if any, held at the close of the reporting period was $52,010,036, or 0.8% of net assets.
d Affiliated company. See Notes 1 and 5 to the financial statements regarding securities lending. The rate quoted in the security description is the annualized 7-day yield of the fund at the close of the reporting period.
Sustainable Leaders Fund 29
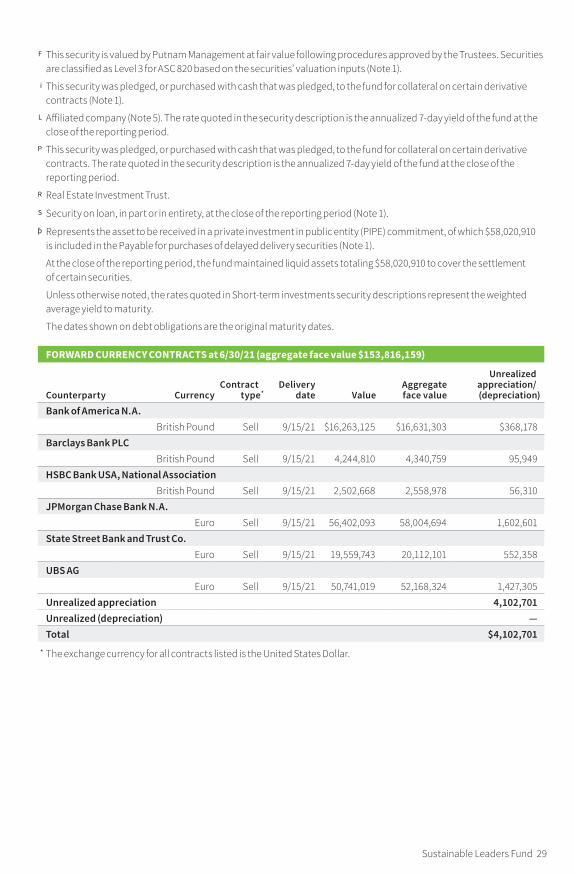
F This security is valued by Putnam Management at fair value following procedures approved by the Trustees. Securities are classified as Level 3 for ASC 820 based on the securities’ valuation inputs (Note 1).
i This security was pledged, or purchased with cash that was pledged, to the fund for collateral on certain derivative contracts (Note 1).
L Affiliated company (Note 5). The rate quoted in the security description is the annualized 7-day yield of the fund at the close of the reporting period.
P This security was pledged, or purchased with cash that was pledged, to the fund for collateral on certain derivative contracts. The rate quoted in the security description is the annualized 7-day yield of the fund at the close of the reporting period.
R Real Estate Investment Trust.
S Security on loan, in part or in entirety, at the close of the reporting period (Note 1).
ƥ Represents the asset to be received in a private investment in public entity (PIPE) commitment, of which $58,020,910 is included in the Payable for purchases of delayed delivery securities (Note 1).
At the close of the reporting period, the fund maintained liquid assets totaling $58,020,910 to cover the settlement of certain securities.
Unless otherwise noted, the rates quoted in Short-term investments security descriptions represent the weighted average yield to maturity.
The dates shown on debt obligations are the original maturity dates.
FORWARD CURRENCY CONTRACTS at 6/30/21 (aggregate face value $153,816,159 )
Counterparty CurrencyContract
type*Delivery
date ValueAggregate face value
Unrealized appreciation/ (depreciation)
Bank of America N.A.British Pound Sell 9/15/21 $16,263,125 $16,631,303 $368,178
Barclays Bank PLCBritish Pound Sell 9/15/21 4,244,810 4,340,759 95,949
HSBC Bank USA, National AssociationBritish Pound Sell 9/15/21 2,502,668 2,558,978 56,310
JPMorgan Chase Bank N.A.Euro Sell 9/15/21 56,402,093 58,004,694 1,602,601
State Street Bank and Trust Co.Euro Sell 9/15/21 19,559,743 20,112,101 552,358
UBS AGEuro Sell 9/15/21 50,741,019 52,168,324 1,427,305
Unrealized appreciation 4,102,701Unrealized (depreciation) —Total $4,102,701
* The exchange currency for all contracts listed is the United States Dollar.
30 Sustainable Leaders Fund
The accompanying notes are an integral part of these financial statements.
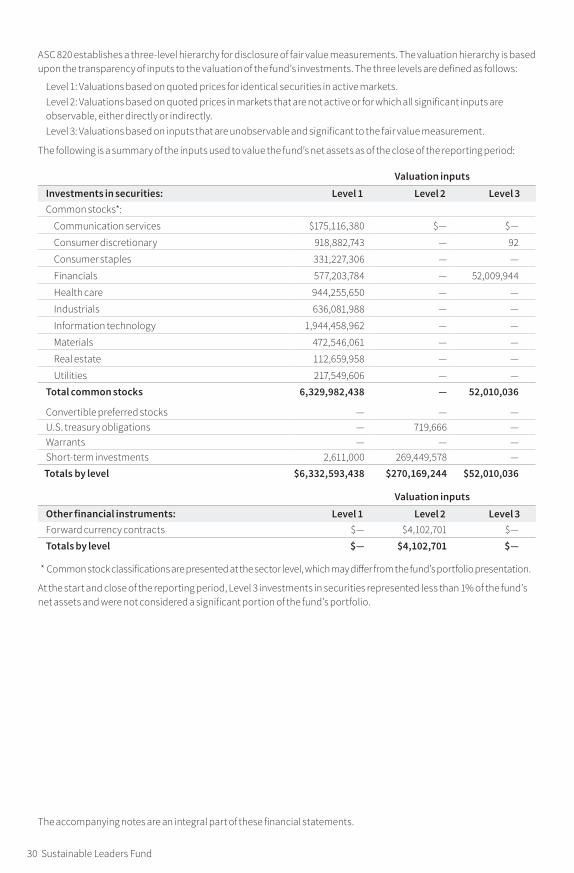
ASC 820 establishes a three-level hierarchy for disclosure of fair value measurements. The valuation hierarchy is based upon the transparency of inputs to the valuation of the fund’s investments. The three levels are defined as follows:
Level 1: Valuations based on quoted prices for identical securities in active markets.Level 2: Valuations based on quoted prices in markets that are not active or for which all significant inputs are observable, either directly or indirectly.Level 3: Valuations based on inputs that are unobservable and significant to the fair value measurement.
The following is a summary of the inputs used to value the fund’s net assets as of the close of the reporting period:
Valuation inputsInvestments in securities: Level 1 Level 2 Level 3Common stocks*:
Communication services $175,116,380 $— $—
Consumer discretionary 918,882,743 — 92
Consumer staples 331,227,306 — —
Financials 577,203,784 — 52,009,944
Health care 944,255,650 — —
Industrials 636,081,988 — —
Information technology 1,944,458,962 — —
Materials 472,546,061 — —
Real estate 112,659,958 — —
Utilities 217,549,606 — — Total common stocks 6,329,982,438 — 52,010,036
Convertible preferred stocks — — — U.S. treasury obligations — 719,666 — Warrants — — — Short-term investments 2,611,000 269,449,578 —
Totals by level $6,332,593,438 $270,169,244 $52,010,036
Valuation inputsOther financial instruments: Level 1 Level 2 Level 3Forward currency contracts $— $4,102,701 $— Totals by level $— $4,102,701 $—
* Common stock classifications are presented at the sector level, which may differ from the fund’s portfolio presentation.
At the start and close of the reporting period, Level 3 investments in securities represented less than 1% of the fund’s net assets and were not considered a significant portion of the fund’s portfolio.
The accompanying notes are an integral part of these financial statements.
Statement of assets and liabilities 6/30/21
ASSETSInvestment in securities, at value, including $82,686,421 of securities on loan (Notes 1 and 8):
Unaffiliated issuers (identified cost $3,390,771,396) $6,388,450,899 Affiliated issuers (identified cost $266,321,819) (Note 5) 266,321,819
Cash 97,328 Foreign currency (cost $47) (Note 1) 47 Dividends, interest and other receivables 4,195,251 Foreign tax reclaim 2,059,618 Receivable for shares of the fund sold 1,585,744 Unrealized appreciation on forward currency contracts (Note 1) 4,102,701 Prepaid assets 55,297 Total assets 6,666,868,704
LIABILITIESPayable for purchases of delayed delivery securities (Note 1) 58,020,910 Payable for shares of the fund repurchased 2,819,552 Payable for compensation of Manager (Note 2) 3,285,995 Payable for custodian fees (Note 2) 62,686 Payable for investor servicing fees (Note 2) 1,437,441 Payable for Trustee compensation and expenses (Note 2) 2,109,663 Payable for administrative services (Note 2) 18,521 Payable for distribution fees (Note 2) 3,671,366 Collateral on securities loaned, at value (Note 1) 83,798,975 Collateral on certain derivative contracts, at value (Notes 1 and 8) 3,442,644 Other accrued expenses 479,069 Total liabilities 159,146,822
Net assets $6,507,721,882
REPRESENTED BYPaid-in capital (Unlimited shares authorized) (Notes 1 and 4) $2,976,015,686 Total distributable earnings (Note 1) 3,531,706,196 Total — Representing net assets applicable to capital shares outstanding $6,507,721,882
COMPUTATION OF NET ASSET VALUE AND OFFERING PRICENet asset value and redemption price per class A share ($5,915,779,282 divided by 46,073,522 shares) $128.40 Offering price per class A share (100/94.25 of $128.40)* $136.23 Net asset value and offering price per class B share ($30,466,581 divided by 342,317 shares)** $89.00 Net asset value and offering price per class C share ($41,869,832 divided by 416,241 shares)** $100.59 Net asset value, offering price and redemption price per class R share ($3,860,210 divided by 31,547 shares) $122.36 Net asset value, offering price and redemption price per class R6 share ($102,908,970 divided by 729,257 shares) $141.11 Net asset value, offering price and redemption price per class Y share ($412,837,007 divided by 2,933,827 shares) $140.72
*On single retail sales of less than $50,000. On sales of $50,000 or more the offering price is reduced.**Redemption price per share is equal to net asset value less any applicable contingent deferred sales charge.
Sustainable Leaders Fund 31
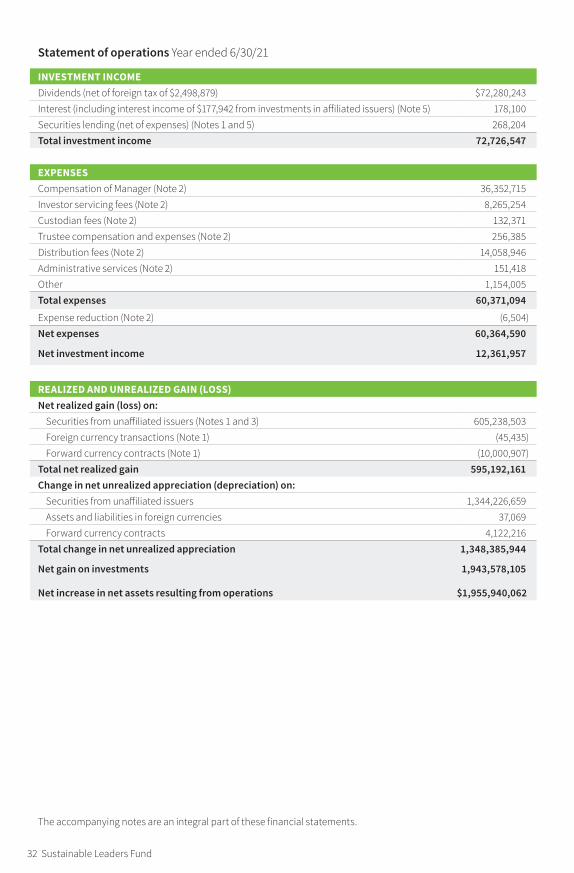
The accompanying notes are an integral part of these financial statements.
Statement of operations Year ended 6/30/21
INVESTMENT INCOMEDividends (net of foreign tax of $2,498,879) $72,280,243 Interest (including interest income of $177,942 from investments in affiliated issuers) (Note 5) 178,100Securities lending (net of expenses) (Notes 1 and 5) 268,204Total investment income 72,726,547
EXPENSESCompensation of Manager (Note 2) 36,352,715 Investor servicing fees (Note 2) 8,265,254 Custodian fees (Note 2) 132,371 Trustee compensation and expenses (Note 2) 256,385 Distribution fees (Note 2) 14,058,946 Administrative services (Note 2) 151,418 Other 1,154,005 Total expenses 60,371,094
Expense reduction (Note 2) (6,504)Net expenses 60,364,590
Net investment income 12,361,957
REALIZED AND UNREALIZED GAIN (LOSS)Net realized gain (loss) on:
Securities from unaffiliated issuers (Notes 1 and 3) 605,238,503 Foreign currency transactions (Note 1) (45,435)Forward currency contracts (Note 1) (10,000,907)
Total net realized gain 595,192,161 Change in net unrealized appreciation (depreciation) on:
Securities from unaffiliated issuers 1,344,226,659 Assets and liabilities in foreign currencies 37,069 Forward currency contracts 4,122,216
Total change in net unrealized appreciation 1,348,385,944
Net gain on investments 1,943,578,105
Net increase in net assets resulting from operations $1,955,940,062
32 Sustainable Leaders Fund
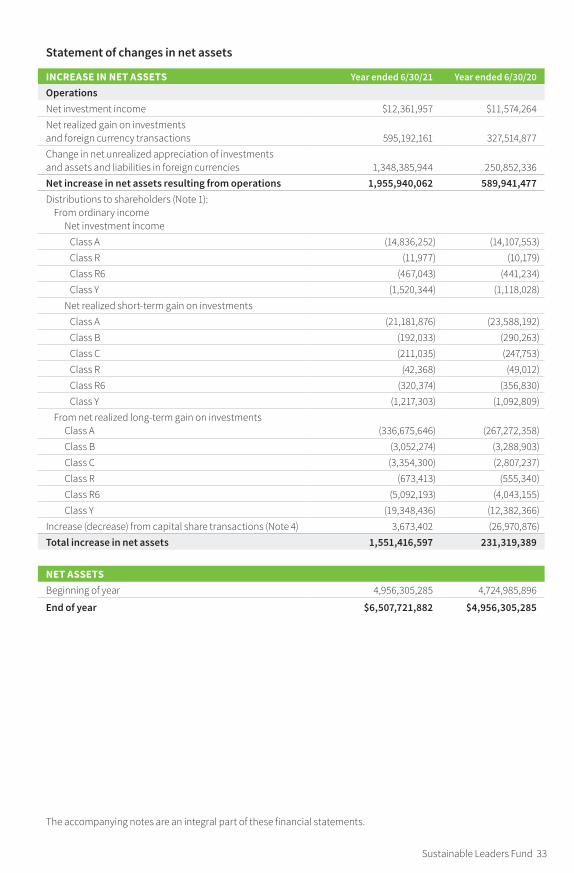
The accompanying notes are an integral part of these financial statements.
Statement of changes in net assets
INCREASE IN NET ASSETS Year ended 6/30/21 Year ended 6/30/20OperationsNet investment income $12,361,957 $11,574,264 Net realized gain on investments and foreign currency transactions 595,192,161 327,514,877 Change in net unrealized appreciation of investments and assets and liabilities in foreign currencies 1,348,385,944 250,852,336 Net increase in net assets resulting from operations 1,955,940,062 589,941,477 Distributions to shareholders (Note 1):
From ordinary incomeNet investment income
Class A (14,836,252) (14,107,553)Class R (11,977) (10,179)Class R6 (467,043) (441,234)Class Y (1,520,344) (1,118,028)
Net realized short-term gain on investmentsClass A (21,181,876) (23,588,192)Class B (192,033) (290,263)Class C (211,035) (247,753)Class R (42,368) (49,012)Class R6 (320,374) (356,830)Class Y (1,217,303) (1,092,809)
From net realized long-term gain on investmentsClass A (336,675,646) (267,272,358)Class B (3,052,274) (3,288,903)Class C (3,354,300) (2,807,237)Class R (673,413) (555,340)Class R6 (5,092,193) (4,043,155)Class Y (19,348,436) (12,382,366)
Increase (decrease) from capital share transactions (Note 4) 3,673,402 (26,970,876)Total increase in net assets 1,551,416,597 231,319,389
NET ASSETSBeginning of year 4,956,305,285 4,724,985,896
End of year $6,507,721,882 $4,956,305,285
Sustainable Leaders Fund 33
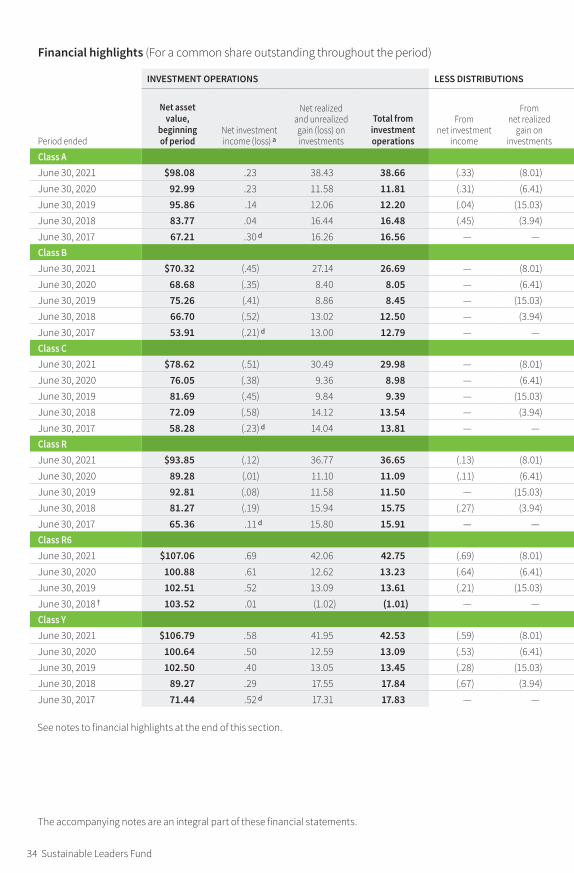
Fund _FundCode, — NumbCols Columns — This section modified: 7/23/21 4:31:10 PM Fund _FundCode, — NumbCols Columns — This section modified: 7/23/21 4:31:10 PM
34 Sustainable Leaders Fund
See notes to financial highlights at the end of this section.
The accompanying notes are an integral part of these financial statements.
Financial highlights (For a common share outstanding throughout the period)
INVESTMENT OPERATIONS LESS DISTRIBUTIONS RATIOS AND SUPPLEMENTAL DATA
Period ended
Net asset value,
beginning of period
Net investment income (loss ) a
Net realized and unrealized gain (loss) on investments
Total from investment operations
From net investment
income
From net realized
gain on investments
Total dis tri bu tions
Non-recurring re im burse-
ments
Net asset value, end of period
Total return at net asset value (% ) b
Net assets, end of period
(in thousands )
Ratio of expenses
to average net assets
(% ) c
Ratio of net investment
income (loss) to average
net assets (% )
Portfolio turnover
(% )
Class AJune 30, 2021 $98.08 .23 38.43 38.66 (.33 ) (8.01 ) (8.34 ) — $128.40 40.82 $5,915,779 1.05 .20 24 June 30, 2020 92.99 .23 11.58 11.81 (.31 ) (6.41 ) (6.72 ) — 98.08 13.30 4,535,812 1.03 .25 44 June 30, 2019 95.86 .14 12.06 12.20 (.04 ) (15.03 ) (15.07 ) — f 92.99 15.46 4,298,012 1.04 .16 30 June 30, 2018 83.77 .04 16.44 16.48 (.45 ) (3.94 ) (4.39 ) — 95.86 20.16 4,085,165 .99 .04 87 June 30, 2017 67.21 .30 d 16.26 16.56 — — — — 83.77 24.64 3,648,574 1.01 .40 d 76 Class BJune 30, 2021 $70.32 (.45 ) 27.14 26.69 — (8.01 ) (8.01 ) — $89.00 39.78 $30,467 1.80 (.56 ) 24 June 30, 2020 68.68 (.35 ) 8.40 8.05 — (6.41 ) (6.41 ) — 70.32 12.45 33,752 1.78 (.52 ) 44 June 30, 2019 75.26 (.41 ) 8.86 8.45 — (15.03 ) (15.03 ) — f 68.68 14.60 43,671 1.79 (.60 ) 30 June 30, 2018 66.70 (.52 ) 13.02 12.50 — (3.94 ) (3.94 ) — 75.26 19.26 51,481 1.74 (.72 ) 87 June 30, 2017 53.91 (.21 ) d 13.00 12.79 — — — — 66.70 23.72 57,979 1.76 (.35 ) d 76 Class CJune 30, 2021 $78.62 (.51 ) 30.49 29.98 — (8.01 ) (8.01 ) — $100.59 39.76 $41,870 1.80 (.56 ) 24 June 30, 2020 76.05 (.38 ) 9.36 8.98 — (6.41 ) (6.41 ) — 78.62 12.47 38,033 1.78 (.51 ) 44 June 30, 2019 81.69 (.45 ) 9.84 9.39 — (15.03 ) (15.03 ) — f 76.05 14.60 38,196 1.79 (.59 ) 30 June 30, 2018 72.09 (.58 ) 14.12 13.54 — (3.94 ) (3.94 ) — 81.69 19.26 34,733 1.74 (.74 ) 87 June 30, 2017 58.28 (.23 ) d 14.04 13.81 — — — — 72.09 23.70 66,307 1.76 (.35 ) d 76 Class RJune 30, 2021 $93.85 (.12 ) 36.77 36.65 (.13 ) (8.01 ) (8.14 ) — $122.36 40.47 $3,860 1.30 (.10 ) 24 June 30, 2020 89.28 (.01 ) 11.10 11.09 (.11 ) (6.41 ) (6.52 ) — 93.85 13.01 8,167 1.28 (.02 ) 44 June 30, 2019 92.81 (.08 ) 11.58 11.50 — (15.03 ) (15.03 ) — f 89.28 15.18 8,443 1.29 (.10 ) 30 June 30, 2018 81.27 (.19 ) 15.94 15.75 (.27 ) (3.94 ) (4.21 ) — 92.81 19.85 8,210 1.24 (.22 ) 87 June 30, 2017 65.36 .11 d 15.80 15.91 — — — — 81.27 24.34 7,930 1.26 .15 d 76 Class R6June 30, 2021 $107.06 .69 42.06 42.75 (.69 ) (8.01 ) (8.70 ) — $141.11 41.29 $102,909 .70 .55 24 June 30, 2020 100.88 .61 12.62 13.23 (.64 ) (6.41 ) (7.05 ) — 107.06 13.71 74,725 .66 .61 44 June 30, 2019 102.51 .52 13.09 13.61 (.21 ) (15.03 ) (15.24 ) — f 100.88 15.89 68,654 .67 .53 30 June 30, 2018 † 103.52 .01 (1.02 ) (1.01 ) — — — — 102.51 (.98 )* 58,846 .07 * - e* 87 Class YJune 30, 2021 $106.79 .58 41.95 42.53 (.59 ) (8.01 ) (8.60 ) — $140.72 41.17 $412,837 .80 .46 24 June 30, 2020 100.64 .50 12.59 13.09 (.53 ) (6.41 ) (6.94 ) — 106.79 13.59 265,816 .78 .51 44 June 30, 2019 102.50 .40 13.05 13.45 (.28 ) (15.03 ) (15.31 ) — f 100.64 15.74 208,467 .79 .41 30 June 30, 2018 89.27 .29 17.55 17.84 (.67 ) (3.94 ) (4.61 ) — 102.50 20.46 178,886 .74 .30 87 June 30, 2017 71.44 .52 d 17.31 17.83 — — — — 89.27 24.96 199,737 .76 .64 d 76
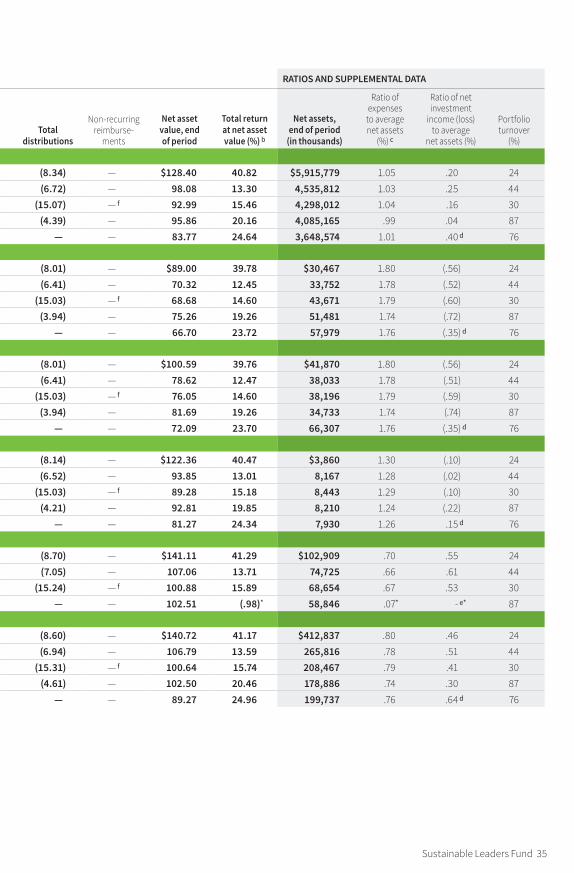
Fund _FundCode, — NumbCols Columns — This section modified: 7/23/21 4:31:10 PM Fund _FundCode, — NumbCols Columns — This section modified: 7/23/21 4:31:10 PM
Sustainable Leaders Fund 35
Financial highlights (For a common share outstanding throughout the period)
INVESTMENT OPERATIONS LESS DISTRIBUTIONS RATIOS AND SUPPLEMENTAL DATA
Period ended
Net asset value,
beginning of period
Net investment income (loss ) a
Net realized and unrealized gain (loss) on investments
Total from investment operations
From net investment
income
From net realized
gain on investments
Total dis tri bu tions
Non-recurring re im burse-
ments
Net asset value, end of period
Total return at net asset value (% ) b
Net assets, end of period
(in thousands )
Ratio of expenses
to average net assets
(% ) c
Ratio of net investment
income (loss) to average
net assets (% )
Portfolio turnover
(% )
Class AJune 30, 2021 $98.08 .23 38.43 38.66 (.33 ) (8.01 ) (8.34 ) — $128.40 40.82 $5,915,779 1.05 .20 24 June 30, 2020 92.99 .23 11.58 11.81 (.31 ) (6.41 ) (6.72 ) — 98.08 13.30 4,535,812 1.03 .25 44 June 30, 2019 95.86 .14 12.06 12.20 (.04 ) (15.03 ) (15.07 ) — f 92.99 15.46 4,298,012 1.04 .16 30 June 30, 2018 83.77 .04 16.44 16.48 (.45 ) (3.94 ) (4.39 ) — 95.86 20.16 4,085,165 .99 .04 87 June 30, 2017 67.21 .30 d 16.26 16.56 — — — — 83.77 24.64 3,648,574 1.01 .40 d 76 Class BJune 30, 2021 $70.32 (.45 ) 27.14 26.69 — (8.01 ) (8.01 ) — $89.00 39.78 $30,467 1.80 (.56 ) 24 June 30, 2020 68.68 (.35 ) 8.40 8.05 — (6.41 ) (6.41 ) — 70.32 12.45 33,752 1.78 (.52 ) 44 June 30, 2019 75.26 (.41 ) 8.86 8.45 — (15.03 ) (15.03 ) — f 68.68 14.60 43,671 1.79 (.60 ) 30 June 30, 2018 66.70 (.52 ) 13.02 12.50 — (3.94 ) (3.94 ) — 75.26 19.26 51,481 1.74 (.72 ) 87 June 30, 2017 53.91 (.21 ) d 13.00 12.79 — — — — 66.70 23.72 57,979 1.76 (.35 ) d 76 Class CJune 30, 2021 $78.62 (.51 ) 30.49 29.98 — (8.01 ) (8.01 ) — $100.59 39.76 $41,870 1.80 (.56 ) 24 June 30, 2020 76.05 (.38 ) 9.36 8.98 — (6.41 ) (6.41 ) — 78.62 12.47 38,033 1.78 (.51 ) 44 June 30, 2019 81.69 (.45 ) 9.84 9.39 — (15.03 ) (15.03 ) — f 76.05 14.60 38,196 1.79 (.59 ) 30 June 30, 2018 72.09 (.58 ) 14.12 13.54 — (3.94 ) (3.94 ) — 81.69 19.26 34,733 1.74 (.74 ) 87 June 30, 2017 58.28 (.23 ) d 14.04 13.81 — — — — 72.09 23.70 66,307 1.76 (.35 ) d 76 Class RJune 30, 2021 $93.85 (.12 ) 36.77 36.65 (.13 ) (8.01 ) (8.14 ) — $122.36 40.47 $3,860 1.30 (.10 ) 24 June 30, 2020 89.28 (.01 ) 11.10 11.09 (.11 ) (6.41 ) (6.52 ) — 93.85 13.01 8,167 1.28 (.02 ) 44 June 30, 2019 92.81 (.08 ) 11.58 11.50 — (15.03 ) (15.03 ) — f 89.28 15.18 8,443 1.29 (.10 ) 30 June 30, 2018 81.27 (.19 ) 15.94 15.75 (.27 ) (3.94 ) (4.21 ) — 92.81 19.85 8,210 1.24 (.22 ) 87 June 30, 2017 65.36 .11 d 15.80 15.91 — — — — 81.27 24.34 7,930 1.26 .15 d 76 Class R6June 30, 2021 $107.06 .69 42.06 42.75 (.69 ) (8.01 ) (8.70 ) — $141.11 41.29 $102,909 .70 .55 24 June 30, 2020 100.88 .61 12.62 13.23 (.64 ) (6.41 ) (7.05 ) — 107.06 13.71 74,725 .66 .61 44 June 30, 2019 102.51 .52 13.09 13.61 (.21 ) (15.03 ) (15.24 ) — f 100.88 15.89 68,654 .67 .53 30 June 30, 2018 † 103.52 .01 (1.02 ) (1.01 ) — — — — 102.51 (.98 )* 58,846 .07 * - e* 87 Class YJune 30, 2021 $106.79 .58 41.95 42.53 (.59 ) (8.01 ) (8.60 ) — $140.72 41.17 $412,837 .80 .46 24 June 30, 2020 100.64 .50 12.59 13.09 (.53 ) (6.41 ) (6.94 ) — 106.79 13.59 265,816 .78 .51 44 June 30, 2019 102.50 .40 13.05 13.45 (.28 ) (15.03 ) (15.31 ) — f 100.64 15.74 208,467 .79 .41 30 June 30, 2018 89.27 .29 17.55 17.84 (.67 ) (3.94 ) (4.61 ) — 102.50 20.46 178,886 .74 .30 87 June 30, 2017 71.44 .52 d 17.31 17.83 — — — — 89.27 24.96 199,737 .76 .64 d 76
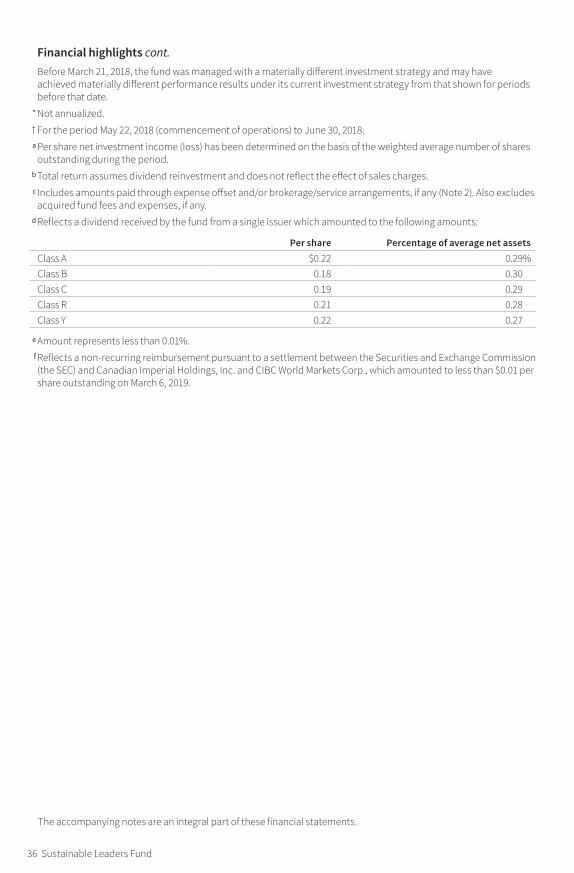
Fund _FundCode, — NumbCols Columns — This section modified: 7/23/21 4:31:10 PM Fund _FundCode, — NumbCols Columns — This section modified: 7/23/21 4:31:10 PM
36 Sustainable Leaders Fund
Financial highlights cont. Before March 21, 2018, the fund was managed with a materially different investment strategy and may have
achieved materially different performance results under its current investment strategy from that shown for periods before that date.
* Not annualized.
† For the period May 22, 2018 (commencement of operations) to June 30, 2018. a Per share net investment income (loss) has been determined on the basis of the weighted average number of shares
outstanding during the period. b Total return assumes dividend reinvestment and does not reflect the effect of sales charges. c Includes amounts paid through expense offset and/or brokerage/service arrangements, if any (Note 2). Also excludes
acquired fund fees and expenses, if any. d Reflects a dividend received by the fund from a single issuer which amounted to the following amounts:
Per share Percentage of average net assetsClass A $0.22 0.29%Class B 0.18 0.30Class C 0.19 0.29Class R 0.21 0.28Class Y 0.22 0.27
e Amount represents less than 0.01%. f Reflects a non-recurring reimbursement pursuant to a settlement between the Securities and Exchange Commission
(the SEC) and Canadian Imperial Holdings, Inc. and CIBC World Markets Corp., which amounted to less than $0.01 per share outstanding on March 6, 2019.
The accompanying notes are an integral part of these financial statements.
Sustainable Leaders Fund 37
Notes to financial statements 6/30/21
Within the following Notes to financial statements, references to “State Street” represent State Street Bank and Trust Company, references to “the SEC” represent the Securities and Exchange Commission, references to “Putnam Management” represent Putnam Investment Management, LLC, the fund’s manager, an indirect wholly-owned subsidiary of Putnam Investments, LLC and references to “OTC”, if any, represent over-the-counter. Unless otherwise noted, the “reporting period” represents the period from July 1, 2020 through June 30, 2021.
Putnam Sustainable Leaders Fund (the fund) is a Massachusetts business trust, which is registered under the Investment Company Act of 1940, as amended, as a diversified, open-end management investment company. The goal of the fund is to seek long-term capital appreciation. The fund invests mainly in common stocks of U.S. companies of any size, with a focus on companies that Putnam Management believes exhibit a commitment to sustainable business practices. Stocks of companies that exhibit a commitment to sustainable business practices are typically, but not always, considered to be growth stocks. Growth stocks are stocks of companies whose earnings are expected to grow faster than those of similar firms, and whose business growth and other characteristics may lead to an increase in stock price. Putnam Management may consider, among other factors, a company’s sustainable business practices (as described below), valuation, financial strength, growth potential, competitive position in its industry, projected future earnings, cash flows and dividends when deciding whether to buy or sell investments. The fund may also invest in non-U.S. companies.
Sustainable investing. Putnam Management believes that companies that exhibit leadership in sustainable business practices also often exhibit more profitable, durable financial returns with lower risk profiles. Accord-ingly, in selecting investments, Putnam Management focuses on companies that it believes have a demonstrated commitment to sustainable business practices in areas that are relevant and material to their long-term financial returns and risk profiles. This commitment may be reflected through environmental, social and/or corporate governance (ESG) policies, practices or outcomes. The fund’s approach to sustainable investing incorporates fundamental research together with consideration of ESG factors. Environmental factors include, for example, a company’s carbon intensity and use of resources like water or minerals. Sustainability measures in the area might include plans to reduce waste, increase recycling, or improve product design to be less resource intensive. Social factors include, for example, labor practices and supply chain management. Sustainability measures in this area might include programs to improve employee well-being, commitment to workplace equality and diversity, or improved stewardship of supplier relationships and working conditions. Corporate governance factors include, for example, board composition and executive compensation. Sustainability measures in this area might include improvements in board independence or diversity, or alignment of management incentives with the company’s strategic sustainability objectives. It is likely that sustainable business practices, as well as the metrics and measurements that Putnam Management uses to evaluate them, will continue to evolve over time.
The fund offers class A, class B, class C, class R, class R6 and class Y shares. Purchases of class B shares are closed to new and existing investors except by exchange from class B shares of another Putnam fund or through dividend and/or capital gains reinvestment. Class A shares are sold with a maximum front-end sales charge of 5.75%. Class A shares generally are not subject to a contingent deferred sales charge, and class R, class R6 and class Y shares are not subject to a contingent deferred sales charge. Class B shares, which convert to class A shares after approximately eight years, are not subject to a front-end sales charge and are subject to a contingent deferred sales charge if those shares are redeemed within six years of purchase. Class C shares are subject to a one-year 1.00% contingent deferred sales charge and generally convert to class A shares after approximately eight years. Prior to March 1, 2021, class C shares generally converted to class A shares after approximately ten years. Class R shares, which are not available to all investors, are sold at net asset value. The expenses for class A, class B, class C and class R shares may differ based on the distribution fee of each class, which is identified in Note 2. Class R6 and class Y shares, which are sold at net asset value, are generally subject to the same expenses as class A, class B, class C and class R shares, but do not bear a distribution fee, and in the case of class R6 shares, bear a lower investor servicing fee, which is identified in Note 2. Class R6 and class Y shares are not available to all investors.
In the normal course of business, the fund enters into contracts that may include agreements to indemnify another party under given circumstances. The fund’s maximum exposure under these arrangements is unknown as this would involve future claims that may be, but have not yet been, made against the fund. However, the fund’s management team expects the risk of material loss to be remote.
The fund has entered into contractual arrangements with an investment adviser, administrator, distributor, share-holder servicing agent and custodian, who each provide services to the fund. Unless expressly stated otherwise, shareholders are not parties to, or intended beneficiaries of these contractual arrangements, and these
38 Sustainable Leaders Fund
contractual arrangements are not intended to create any shareholder right to enforce them against the service providers or to seek any remedy under them against the service providers, either directly or on behalf of the fund.
Under the fund’s Amended and Restated Agreement and Declaration of Trust, any claims asserted against or on behalf of the Putnam Funds, including claims against Trustees and Officers, must be brought in state and federal courts located within the Commonwealth of Massachusetts.
Note 1: Significant accounting policiesThe following is a summary of significant accounting policies consistently followed by the fund in the preparation of its financial statements. The preparation of financial statements is in conformity with accounting principles generally accepted in the United States of America and requires management to make estimates and assump-tions that affect the reported amounts of assets and liabilities in the financial statements and the reported amounts of increases and decreases in net assets from operations. Actual results could differ from those esti-mates. Subsequent events after the Statement of assets and liabilities date through the date that the financial statements were issued have been evaluated in the preparation of the financial statements.
Investment income, realized and unrealized gains and losses and expenses of the fund are borne pro-rata based on the relative net assets of each class to the total net assets of the fund, except that each class bears expenses unique to that class (including the distribution fees applicable to such classes). Each class votes as a class only with respect to its own distribution plan or other matters on which a class vote is required by law or determined by the Trustees. If the fund were liquidated, shares of each class would receive their pro-rata share of the net assets of the fund. In addition, the Trustees declare separate dividends on each class of shares.
Security valuation Portfolio securities and other investments are valued using policies and procedures adopted by the Board of Trustees. The Trustees have formed a Pricing Committee to oversee the implementation of these procedures and have delegated responsibility for valuing the fund’s assets in accordance with these procedures to Putnam Management. Putnam Management has established an internal Valuation Committee that is respon-sible for making fair value determinations, evaluating the effectiveness of the pricing policies of the fund and reporting to the Pricing Committee.
Investments for which market quotations are readily available are valued at the last reported sales price on their principal exchange, or official closing price for certain markets, and are classified as Level 1 securities under Accounting Standards Codification 820 Fair Value Measurements and Disclosures (ASC 820). If no sales are reported, as in the case of some securities that are traded OTC, a security is valued at its last reported bid price and is generally categorized as a Level 2 security.
Investments in open-end investment companies (excluding exchange-traded funds), if any, which can be classi-fied as Level 1 or Level 2 securities, are valued based on their net asset value. The net asset value of such invest-ment companies equals the total value of their assets less their liabilities and divided by the number of their outstanding shares.
Market quotations are not considered to be readily available for certain debt obligations (including short-term investments with remaining maturities of 60 days or less) and other investments; such investments are valued on the basis of valuations furnished by an independent pricing service approved by the Trustees or dealers selected by Putnam Management. Such services or dealers determine valuations for normal institutional-size trading units of such securities using methods based on market transactions for comparable securities and various relation-ships, generally recognized by institutional traders, between securities (which consider such factors as security prices, yields, maturities and ratings). These securities will generally be categorized as Level 2.
Many securities markets and exchanges outside the U.S. close prior to the scheduled close of the New York Stock Exchange and therefore the closing prices for securities in such markets or on such exchanges may not fully reflect events that occur after such close but before the scheduled close of the New York Stock Exchange. Accord-ingly, on certain days, the fund will fair value certain foreign equity securities taking into account multiple factors including movements in the U.S. securities markets, currency valuations and comparisons to the valuation of American Depository Receipts, exchange-traded funds and futures contracts. The foreign equity securities, which would generally be classified as Level 1 securities, will be transferred to Level 2 of the fair value hierarchy when they are valued at fair value. The number of days on which fair value prices will be used will depend on market activity and it is possible that fair value prices will be used by the fund to a significant extent. Securities quoted in foreign currencies, if any, are translated into U.S. dollars at the current exchange rate.
Sustainable Leaders Fund 39
To the extent a pricing service or dealer is unable to value a security or provides a valuation that Putnam Management does not believe accurately reflects the security’s fair value, the security will be valued at fair value by Putnam Management in accordance with policies and procedures approved by the Trustees. Certain invest-ments, including certain restricted and illiquid securities and derivatives, are also valued at fair value following procedures approved by the Trustees. These valuations consider such factors as significant market or specific security events such as interest rate or credit quality changes, various relationships with other securities, discount rates, U.S. Treasury, U.S. swap and credit yields, index levels, convexity exposures, recovery rates, sales and other multiples and resale restrictions. These securities are classified as Level 2 or as Level 3 depending on the priority of the significant inputs.
To assess the continuing appropriateness of fair valuations, the Valuation Committee reviews and affirms the reasonableness of such valuations on a regular basis after considering all relevant information that is reasonably available. Such valuations and procedures are reviewed periodically by the Trustees. The fair value of securities is generally determined as the amount that the fund could reasonably expect to realize from an orderly disposi-tion of such securities over a reasonable period of time. By its nature, a fair value price is a good faith estimate of the value of a security in a current sale and does not reflect an actual market price, which may be different by a material amount.
Security transactions and related investment income Security transactions are recorded on the trade date (the date the order to buy or sell is executed). Gains or losses on securities sold are determined on the identified cost basis.
Interest income, net of any applicable withholding taxes, if any, and including amortization and accretion of premiums and discounts on debt securities, is recorded on the accrual basis. Dividend income, net of any appli-cable withholding taxes, is recognized on the ex-dividend date except that certain dividends from foreign securi-ties, if any, are recognized as soon as the fund is informed of the ex-dividend date. Non-cash dividends, if any, are recorded at the fair value of the securities received. Dividends representing a return of capital or capital gains, if any, are reflected as a reduction of cost and/or as a realized gain.
Securities purchased or sold on a delayed delivery basis may be settled at a future date beyond customary settle-ment time; interest income is accrued based on the terms of the securities. Losses may arise due to changes in the fair value of the underlying securities or if the counterparty does not perform under the contract.
Foreign currency translation The accounting records of the fund are maintained in U.S. dollars. The fair value of foreign securities, currency holdings, and other assets and liabilities is recorded in the books and records of the fund after translation to U.S. dollars based on the exchange rates on that day. The cost of each security is deter-mined using historical exchange rates. Income and withholding taxes are translated at prevailing exchange rates when earned or incurred. The fund does not isolate that portion of realized or unrealized gains or losses resulting from changes in the foreign exchange rate on investments from fluctuations arising from changes in the market prices of the securities. Such gains and losses are included with the net realized and unrealized gain or loss on investments. Net realized gains and losses on foreign currency transactions represent net realized exchange gains or losses on disposition of foreign currencies, currency gains and losses realized between the trade and settlement dates on securities transactions and the difference between the amount of investment income and foreign withholding taxes recorded on the fund’s books and the U.S. dollar equivalent amounts actually received or paid. Net unrealized appreciation and depreciation of assets and liabilities in foreign currencies arise from changes in the value of assets and liabilities other than investments at the period end, resulting from changes in the exchange rate.
Forward currency contracts The fund buys and sells forward currency contracts, which are agreements between two parties to buy and sell currencies at a set price on a future date. These contracts are used to hedge foreign exchange risk.
The U.S. dollar value of forward currency contracts is determined using current forward currency exchange rates supplied by a quotation service. The fair value of the contract will fluctuate with changes in currency exchange rates. The contract is marked to market daily and the change in fair value is recorded as an unrealized gain or loss. The fund records a realized gain or loss equal to the difference between the value of the contract at the time it was opened and the value at the time it was closed when the contract matures or by delivery of the currency. The fund could be exposed to risk if the value of the currency changes unfavorably, if the counterparties to the contracts are unable to meet the terms of their contracts or if the fund is unable to enter into a closing position. Risks may exceed amounts recognized on the Statement of assets and liabilities.
40 Sustainable Leaders Fund
Forward currency contracts outstanding at period end, if any, are listed after the fund’s portfolio.
Master agreements The fund is a party to ISDA (International Swaps and Derivatives Association, Inc.) Master Agreements (Master Agreements) with certain counterparties that govern OTC derivative and foreign exchange contracts entered into from time to time. The Master Agreements may contain provisions regarding, among other things, the parties’ general obligations, representations, agreements, collateral requirements, events of default and early termination. With respect to certain counterparties, in accordance with the terms of the Master Agree-ments, collateral pledged to the fund is held in a segregated account by the fund’s custodian and, with respect to those amounts which can be sold or repledged, is presented in the fund’s portfolio.
Collateral pledged by the fund is segregated by the fund’s custodian and identified in the fund’s portfolio. Collat-eral can be in the form of cash or debt securities issued by the U.S. Government or related agencies or other secu-rities as agreed to by the fund and the applicable counterparty. Collateral requirements are determined based on the fund’s net position with each counterparty.
Termination events applicable to the fund may occur upon a decline in the fund’s net assets below a speci-fied threshold over a certain period of time. Termination events applicable to counterparties may occur upon a decline in the counterparty’s long-term and short-term credit ratings below a specified level. In each case, upon occurrence, the other party may elect to terminate early and cause settlement of all derivative and foreign exchange contracts outstanding, including the payment of any losses and costs resulting from such early termination, as reasonably determined by the terminating party. Any decision by one or more of the fund’s counterparties to elect early termination could impact the fund’s future derivative activity.
At the close of the reporting period, the fund did not have a net liability position on open derivative contracts subject to the Master Agreements.
Securities lending The fund may lend securities, through its agent, to qualified borrowers in order to earn addi-tional income. The loans are collateralized by cash in an amount at least equal to the fair value of the securities loaned. The fair value of securities loaned is determined daily and any additional required collateral is allocated to the fund on the next business day. The remaining maturities of the securities lending transactions are consid-ered overnight and continuous. The risk of borrower default will be borne by the fund’s agent; the fund will bear the risk of loss with respect to the investment of the cash collateral. Income from securities lending, net of expenses, is included in investment income on the Statement of operations. Cash collateral is invested in Putnam Cash Collateral Pool, LLC, a limited liability company managed by an affiliate of Putnam Management. Invest-ments in Putnam Cash Collateral Pool, LLC are valued at its closing net asset value each business day. There are no management fees charged to Putnam Cash Collateral Pool, LLC. At the close of the reporting period, the fund received cash collateral of $83,798,975 and the value of securities loaned amounted to $82,686,421.
Interfund lending The fund, along with other Putnam funds, may participate in an interfund lending program pursuant to an exemptive order issued by the SEC. This program allows the fund to borrow from or lend to other Putnam funds that permit such transactions. Interfund lending transactions are subject to each fund’s investment policies and borrowing and lending limits. Interest earned or paid on the interfund lending transac-tion will be based on the average of certain current market rates. During the reporting period, the fund did not utilize the program.
Lines of credit The fund participates, along with other Putnam funds, in a $317.5 million unsecured committed line of credit and a $235.5 million unsecured uncommitted line of credit, both provided by State Street. Borrow-ings may be made for temporary or emergency purposes, including the funding of shareholder redemption requests and trade settlements. Interest is charged to the fund based on the fund’s borrowing at a rate equal to 1.25% plus the higher of (1) the Federal Funds rate and (2) the Overnight Bank Funding Rate for the committed line of credit and 1.30% plus the higher of (1) the Federal Funds rate and (2) the Overnight Bank Funding Rate for the uncommitted line of credit. A closing fee equal to 0.04% of the committed line of credit and 0.04% of the uncommitted line of credit has been paid by the participating funds. In addition, a commitment fee of 0.21% per annum on any unutilized portion of the committed line of credit is allocated to the participating funds based on their relative net assets and paid quarterly. During the reporting period, the fund had no borrowings against these arrangements.
Federal taxes It is the policy of the fund to distribute all of its taxable income within the prescribed time period and otherwise comply with the provisions of the Internal Revenue Code of 1986, as amended (the Code), appli-cable to regulated investment companies. It is also the intention of the fund to distribute an amount sufficient to avoid imposition of any excise tax under Section 4982 of the Code.
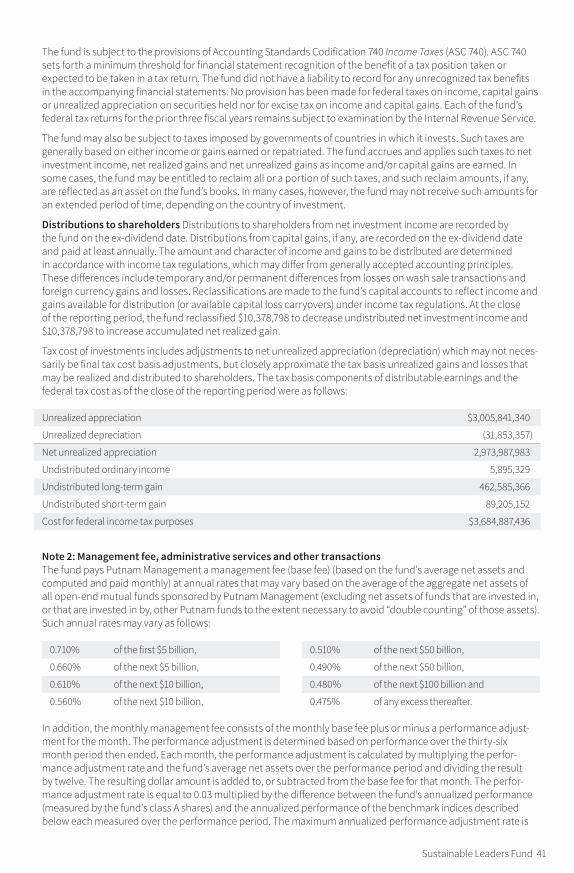
Sustainable Leaders Fund 41
The fund is subject to the provisions of Accounting Standards Codification 740 Income Taxes (ASC 740). ASC 740 sets forth a minimum threshold for financial statement recognition of the benefit of a tax position taken or expected to be taken in a tax return. The fund did not have a liability to record for any unrecognized tax benefits in the accompanying financial statements. No provision has been made for federal taxes on income, capital gains or unrealized appreciation on securities held nor for excise tax on income and capital gains. Each of the fund’s federal tax returns for the prior three fiscal years remains subject to examination by the Internal Revenue Service.
The fund may also be subject to taxes imposed by governments of countries in which it invests. Such taxes are generally based on either income or gains earned or repatriated. The fund accrues and applies such taxes to net investment income, net realized gains and net unrealized gains as income and/or capital gains are earned. In some cases, the fund may be entitled to reclaim all or a portion of such taxes, and such reclaim amounts, if any, are reflected as an asset on the fund’s books. In many cases, however, the fund may not receive such amounts for an extended period of time, depending on the country of investment.
Distributions to shareholders Distributions to shareholders from net investment income are recorded by the fund on the ex-dividend date. Distributions from capital gains, if any, are recorded on the ex-dividend date and paid at least annually. The amount and character of income and gains to be distributed are determined in accordance with income tax regulations, which may differ from generally accepted accounting principles. These differences include temporary and/or permanent differences from losses on wash sale transactions and foreign currency gains and losses. Reclassifications are made to the fund’s capital accounts to reflect income and gains available for distribution (or available capital loss carryovers) under income tax regulations. At the close of the reporting period, the fund reclassified $10,378,798 to decrease undistributed net investment income and $10,378,798 to increase accumulated net realized gain.
Tax cost of investments includes adjustments to net unrealized appreciation (depreciation) which may not neces-sarily be final tax cost basis adjustments, but closely approximate the tax basis unrealized gains and losses that may be realized and distributed to shareholders. The tax basis components of distributable earnings and the federal tax cost as of the close of the reporting period were as follows:
Unrealized appreciation $3,005,841,340
Unrealized depreciation (31,853,357 )
Net unrealized appreciation 2,973,987,983
Undistributed ordinary income 5,895,329
Undistributed long-term gain 462,585,366
Undistributed short-term gain 89,205,152
Cost for federal income tax purposes $3,684,887,436
Note 2: Management fee, administrative services and other transactionsThe fund pays Putnam Management a management fee (base fee) (based on the fund’s average net assets and computed and paid monthly) at annual rates that may vary based on the average of the aggregate net assets of all open-end mutual funds sponsored by Putnam Management (excluding net assets of funds that are invested in, or that are invested in by, other Putnam funds to the extent necessary to avoid “double counting” of those assets). Such annual rates may vary as follows:
0.710 % of the first $5 billion,
0.660 % of the next $5 billion,
0.610 % of the next $10 billion,
0.560 % of the next $10 billion,
0.510 % of the next $50 billion,
0.490 % of the next $50 billion,
0.480 % of the next $100 billion and
0.475 % of any excess thereafter.
In addition, the monthly management fee consists of the monthly base fee plus or minus a performance adjust-ment for the month. The performance adjustment is determined based on performance over the thirty-six month period then ended. Each month, the performance adjustment is calculated by multiplying the perfor-mance adjustment rate and the fund’s average net assets over the performance period and dividing the result by twelve. The resulting dollar amount is added to, or subtracted from the base fee for that month. The perfor-mance adjustment rate is equal to 0.03 multiplied by the difference between the fund’s annualized performance (measured by the fund’s class A shares) and the annualized performance of the benchmark indices described below each measured over the performance period. The maximum annualized performance adjustment rate is
42 Sustainable Leaders Fund
+/–0.12%. The monthly base fee is determined based on the fund’s average net assets for the month, while the performance adjustment is determined based on the fund’s average net assets over the thirty-six month perfor-mance period. This means it is possible that, if the fund underperforms significantly over the performance period, and the fund’s assets have declined significantly over that period, the negative performance adjustment may exceed the base fee. In this event, Putnam Management would make a payment to the fund.
Effective August 1, 2019, the fund’s benchmark index is the S&P 500 Index. Before August 1, 2019, the fund’s benchmark index was the Russell 3000 Growth Index. Because the performance adjustment is based on a rolling thirty-six-month performance period, there is a transition period during which the fund’s performance is compared to a composite index that reflects the performance of the Russell 3000 Growth Index for the portion of the performance period before August 1, 2019, and the performance of the S&P 500 Index for the remainder of the period.
Because the performance adjustment is based on the fund’s performance relative to its applicable benchmark index, and not its absolute performance, the performance adjustment could increase Putnam Management’s fee even if the fund’s shares lose value during the performance period provided that the fund outperformed its benchmark index, and could decrease Putnam Management’s fee even if the fund’s shares increase in value during the performance period provided that the fund underperformed its benchmark index.
For the reporting period, the management fee represented an effective rate (excluding the impact of any expense waiver in effect) of 0.624% of the fund’s average net assets, which included an effective base fee of 0.544% and an increase of 0.080% ($4,647,360) based on performance.
Putnam Management has contractually agreed, through October 30, 2022, to waive fees and/or reimburse the fund’s expenses to the extent necessary to limit the cumulative expenses of the fund, exclusive of brokerage, interest, taxes, investment-related expenses, extraordinary expenses, acquired fund fees and expenses and payments under the fund’s investor servicing contract, investment management contract and distribution plans, on a fiscal year-to-date basis to an annual rate of 0.20% of the fund’s average net assets over such fiscal year-to-date period. During the reporting period, the fund’s expenses were not reduced as a result of this limit.
Putnam Investments Limited (PIL), an affiliate of Putnam Management, is authorized by the Trustees to manage a separate portion of the assets of the fund as determined by Putnam Management from time to time. PIL did not manage any portion of the assets of the fund during the reporting period. If Putnam Management were to engage the services of PIL, Putnam Management would pay a quarterly sub-management fee to PIL for its services at an annual rate of 0.35% of the average net assets of the portion of the fund managed by PIL.
The fund reimburses Putnam Management an allocated amount for the compensation and related expenses of certain officers of the fund and their staff who provide administrative services to the fund. The aggregate amount of all such reimbursements is determined annually by the Trustees.
Custodial functions for the fund’s assets are provided by State Street. Custody fees are based on the fund’s asset level, the number of its security holdings and transaction volumes.
Putnam Investor Services, Inc., an affiliate of Putnam Management, provides investor servicing agent functions to the fund. Putnam Investor Services, Inc. received fees for investor servicing for class A, class B, class C, class R and class Y shares that included (1) a per account fee for each direct and underlying non-defined contribution account (retail account) of the fund; (2) a specified rate of the fund’s assets attributable to defined contribu-tion plan accounts; and (3) a specified rate based on the average net assets in retail accounts. Putnam Investor Services, Inc. has agreed that the aggregate investor servicing fees for each fund’s retail and defined contribution accounts for these share classes will not exceed an annual rate of 0.25% of the fund’s average assets attributable to such accounts.
Class R6 shares paid a monthly fee based on the average net assets of class R6 shares at an annual rate of 0.05%.
During the reporting period, the expenses for each class of shares related to investor servicing fees were as follows:
Class A $7,616,627
Class B 47,249
Class C 58,644
Class R 10,728
Class R6 44,213
Class Y 487,793
Total $8,265,254
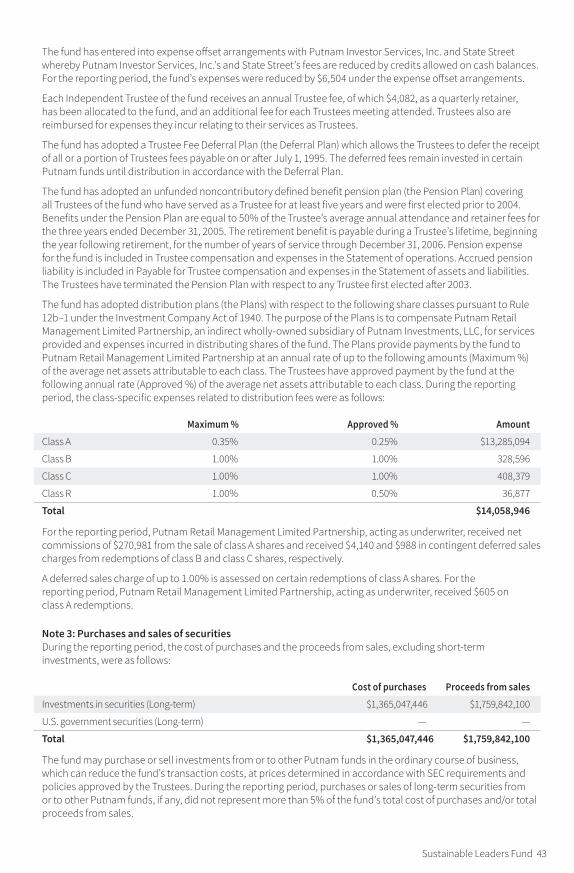
Sustainable Leaders Fund 43
The fund has entered into expense offset arrangements with Putnam Investor Services, Inc. and State Street whereby Putnam Investor Services, Inc.’s and State Street’s fees are reduced by credits allowed on cash balances. For the reporting period, the fund’s expenses were reduced by $6,504 under the expense offset arrangements.
Each Independent Trustee of the fund receives an annual Trustee fee, of which $4,082, as a quarterly retainer, has been allocated to the fund, and an additional fee for each Trustees meeting attended. Trustees also are reimbursed for expenses they incur relating to their services as Trustees.
The fund has adopted a Trustee Fee Deferral Plan (the Deferral Plan) which allows the Trustees to defer the receipt of all or a portion of Trustees fees payable on or after July 1, 1995. The deferred fees remain invested in certain Putnam funds until distribution in accordance with the Deferral Plan.
The fund has adopted an unfunded noncontributory defined benefit pension plan (the Pension Plan) covering all Trustees of the fund who have served as a Trustee for at least five years and were first elected prior to 2004. Benefits under the Pension Plan are equal to 50% of the Trustee’s average annual attendance and retainer fees for the three years ended December 31, 2005. The retirement benefit is payable during a Trustee’s lifetime, beginning the year following retirement, for the number of years of service through December 31, 2006. Pension expense for the fund is included in Trustee compensation and expenses in the Statement of operations. Accrued pension liability is included in Payable for Trustee compensation and expenses in the Statement of assets and liabilities. The Trustees have terminated the Pension Plan with respect to any Trustee first elected after 2003.
The fund has adopted distribution plans (the Plans) with respect to the following share classes pursuant to Rule 12b–1 under the Investment Company Act of 1940. The purpose of the Plans is to compensate Putnam Retail Management Limited Partnership, an indirect wholly-owned subsidiary of Putnam Investments, LLC, for services provided and expenses incurred in distributing shares of the fund. The Plans provide payments by the fund to Putnam Retail Management Limited Partnership at an annual rate of up to the following amounts (Maximum %) of the average net assets attributable to each class. The Trustees have approved payment by the fund at the following annual rate (Approved %) of the average net assets attributable to each class. During the reporting period, the class-specific expenses related to distribution fees were as follows:
Maximum % Approved % Amount
Class A 0.35 % 0.25 % $13,285,094
Class B 1.00 % 1.00 % 328,596
Class C 1.00 % 1.00 % 408,379
Class R 1.00 % 0.50 % 36,877
Total $14,058,946
For the reporting period, Putnam Retail Management Limited Partnership, acting as underwriter, received net commissions of $270,981 from the sale of class A shares and received $4,140 and $988 in contingent deferred sales charges from redemptions of class B and class C shares, respectively.
A deferred sales charge of up to 1.00% is assessed on certain redemptions of class A shares. For the reporting period, Putnam Retail Management Limited Partnership, acting as underwriter, received $605 on class A redemptions.
Note 3: Purchases and sales of securitiesDuring the reporting period, the cost of purchases and the proceeds from sales, excluding short-term investments, were as follows:
Cost of purchases Proceeds from sales
Investments in securities (Long-term ) $1,365,047,446 $1,759,842,100
U.S. government securities (Long-term ) — —
Total $1,365,047,446 $1,759,842,100
The fund may purchase or sell investments from or to other Putnam funds in the ordinary course of business, which can reduce the fund’s transaction costs, at prices determined in accordance with SEC requirements and policies approved by the Trustees. During the reporting period, purchases or sales of long-term securities from or to other Putnam funds, if any, did not represent more than 5% of the fund’s total cost of purchases and/or total proceeds from sales.
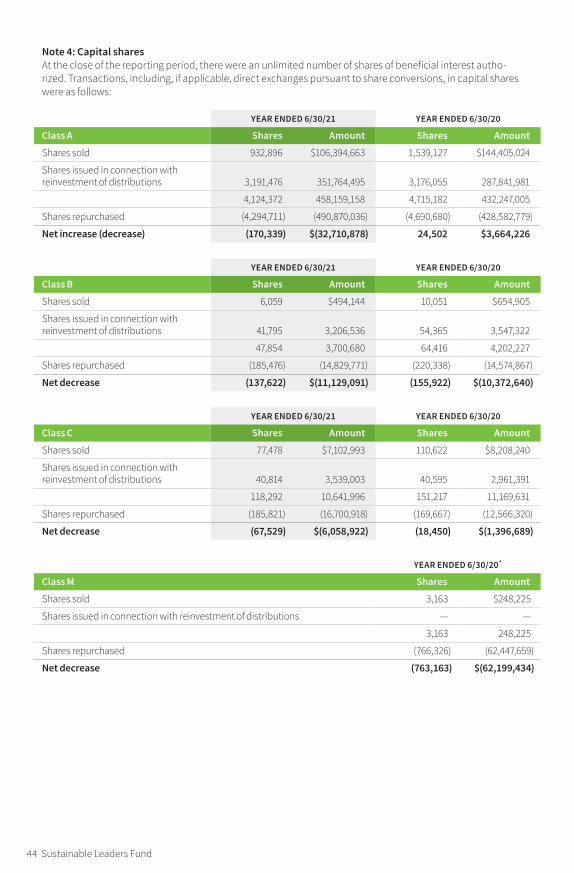
44 Sustainable Leaders Fund
Note 4: Capital sharesAt the close of the reporting period, there were an unlimited number of shares of beneficial interest autho-rized. Transactions, including, if applicable, direct exchanges pursuant to share conversions, in capital shares were as follows:
YEAR ENDED 6/30/21 YEAR ENDED 6/30/20
Class A Shares Amount Shares Amount
Shares sold 932,896 $106,394,663 1,539,127 $144,405,024
Shares issued in connection with reinvestment of distributions 3,191,476 351,764,495 3,176,055 287,841,981
4,124,372 458,159,158 4,715,182 432,247,005
Shares repurchased (4,294,711 ) (490,870,036 ) (4,690,680 ) (428,582,779 )
Net increase (decrease ) (170,339 ) $(32,710,878 ) 24,502 $3,664,226
YEAR ENDED 6/30/21 YEAR ENDED 6/30/20
Class B Shares Amount Shares Amount
Shares sold 6,059 $494,144 10,051 $654,905
Shares issued in connection with reinvestment of distributions 41,795 3,206,536 54,365 3,547,322
47,854 3,700,680 64,416 4,202,227
Shares repurchased (185,476 ) (14,829,771 ) (220,338 ) (14,574,867 )
Net decrease (137,622 ) $(11,129,091 ) (155,922 ) $(10,372,640 )
YEAR ENDED 6/30/21 YEAR ENDED 6/30/20
Class C Shares Amount Shares Amount
Shares sold 77,478 $7,102,993 110,622 $8,208,240
Shares issued in connection with reinvestment of distributions 40,814 3,539,003 40,595 2,961,391
118,292 10,641,996 151,217 11,169,631
Shares repurchased (185,821 ) (16,700,918 ) (169,667 ) (12,566,320 )
Net decrease (67,529 ) $(6,058,922 ) (18,450 ) $(1,396,689 )
YEAR ENDED 6/30/20 *
Class M Shares Amount
Shares sold 3,163 $248,225
Shares issued in connection with reinvestment of distributions — —
3,163 248,225
Shares repurchased (766,326 ) (62,447,659 )
Net decrease (763,163 ) $(62,199,434 )
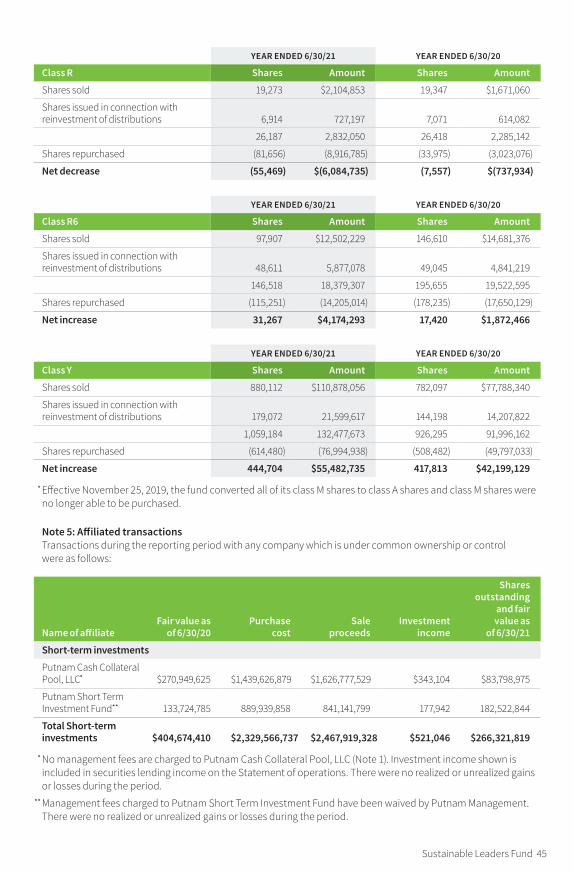
Sustainable Leaders Fund 45
YEAR ENDED 6/30/21 YEAR ENDED 6/30/20
Class R Shares Amount Shares Amount
Shares sold 19,273 $2,104,853 19,347 $1,671,060
Shares issued in connection with reinvestment of distributions 6,914 727,197 7,071 614,082
26,187 2,832,050 26,418 2,285,142
Shares repurchased (81,656 ) (8,916,785 ) (33,975 ) (3,023,076 )
Net decrease (55,469 ) $(6,084,735 ) (7,557 ) $(737,934 )
YEAR ENDED 6/30/21 YEAR ENDED 6/30/20
Class R6 Shares Amount Shares Amount
Shares sold 97,907 $12,502,229 146,610 $14,681,376
Shares issued in connection with reinvestment of distributions 48,611 5,877,078 49,045 4,841,219
146,518 18,379,307 195,655 19,522,595
Shares repurchased (115,251 ) (14,205,014 ) (178,235 ) (17,650,129 )
Net increase 31,267 $4,174,293 17,420 $1,872,466
YEAR ENDED 6/30/21 YEAR ENDED 6/30/20
Class Y Shares Amount Shares Amount
Shares sold 880,112 $110,878,056 782,097 $77,788,340
Shares issued in connection with reinvestment of distributions 179,072 21,599,617 144,198 14,207,822
1,059,184 132,477,673 926,295 91,996,162
Shares repurchased (614,480 ) (76,994,938 ) (508,482 ) (49,797,033 )
Net increase 444,704 $55,482,735 417,813 $42,199,129
* Effective November 25, 2019, the fund converted all of its class M shares to class A shares and class M shares were no longer able to be purchased.
Note 5: Affiliated transactionsTransactions during the reporting period with any company which is under common ownership or control were as follows:
Name of affiliateFair value as
of 6/30/20Purchase
costSale
proceedsInvestment
income
Shares outstanding
and fair value as
of 6/30/21
Short-term investments
Putnam Cash Collateral Pool, LLC * $270,949,625 $1,439,626,879 $1,626,777,529 $343,104 $83,798,975
Putnam Short Term Investment Fund * * 133,724,785 889,939,858 841,141,799 177,942 182,522,844
Total Short-term investments $404,674,410 $2,329,566,737 $2,467,919,328 $521,046 $266,321,819
* No management fees are charged to Putnam Cash Collateral Pool, LLC (Note 1). Investment income shown is included in securities lending income on the Statement of operations. There were no realized or unrealized gains or losses during the period.
** Management fees charged to Putnam Short Term Investment Fund have been waived by Putnam Management. There were no realized or unrealized gains or losses during the period.
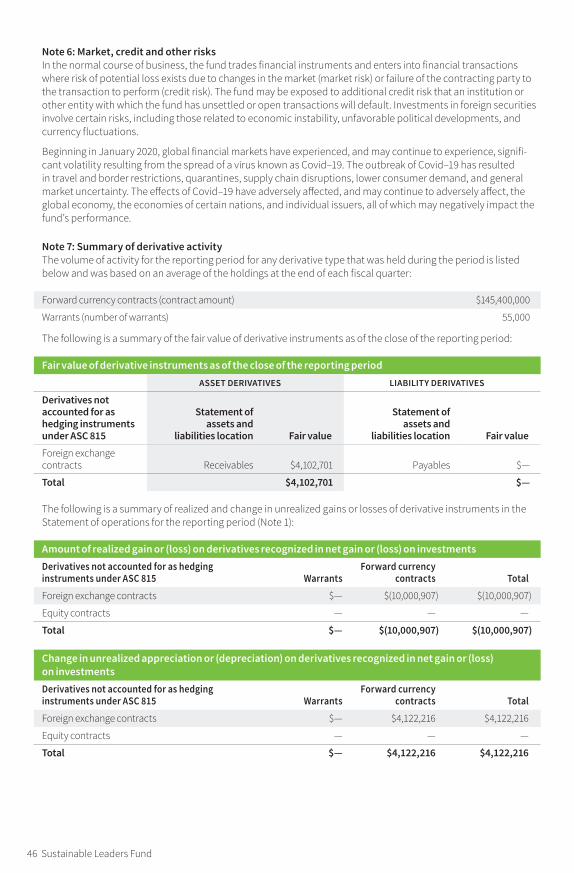
46 Sustainable Leaders Fund
Note 6: Market, credit and other risksIn the normal course of business, the fund trades financial instruments and enters into financial transactions where risk of potential loss exists due to changes in the market (market risk) or failure of the contracting party to the transaction to perform (credit risk). The fund may be exposed to additional credit risk that an institution or other entity with which the fund has unsettled or open transactions will default. Investments in foreign securities involve certain risks, including those related to economic instability, unfavorable political developments, and currency fluctuations.
Beginning in January 2020, global financial markets have experienced, and may continue to experience, signifi-cant volatility resulting from the spread of a virus known as Covid–19. The outbreak of Covid–19 has resulted in travel and border restrictions, quarantines, supply chain disruptions, lower consumer demand, and general market uncertainty. The effects of Covid–19 have adversely affected, and may continue to adversely affect, the global economy, the economies of certain nations, and individual issuers, all of which may negatively impact the fund’s performance.
Note 7: Summary of derivative activityThe volume of activity for the reporting period for any derivative type that was held during the period is listed below and was based on an average of the holdings at the end of each fiscal quarter:
Forward currency contracts (contract amount ) $145,400,000
Warrants (number of warrants ) 55,000
The following is a summary of the fair value of derivative instruments as of the close of the reporting period:
Fair value of derivative instruments as of the close of the reporting periodASSET DERIVATIVES LIABILITY DERIVATIVES
Derivatives not accounted for as hedging instruments under ASC 815
Statement of assets and
liabilities location Fair value
Statement of assets and
liabilities location Fair value
Foreign exchange contracts Receivables $4,102,701 Payables $—
Total $4,102,701 $—
The following is a summary of realized and change in unrealized gains or losses of derivative instruments in the Statement of operations for the reporting period (Note 1):
Amount of realized gain or (loss ) on derivatives recognized in net gain or (loss ) on investmentsDerivatives not accounted for as hedging instruments under ASC 815 Warrants
Forward currency contracts Total
Foreign exchange contracts $— $(10,000,907 ) $(10,000,907 )
Equity contracts — — —
Total $— $(10,000,907 ) $(10,000,907 )
Change in unrealized appreciation or (depreciation ) on derivatives recognized in net gain or (loss ) on investmentsDerivatives not accounted for as hedging instruments under ASC 815 Warrants
Forward currency contracts Total
Foreign exchange contracts $— $4,122,216 $4,122,216
Equity contracts — — —
Total $— $4,122,216 $4,122,216
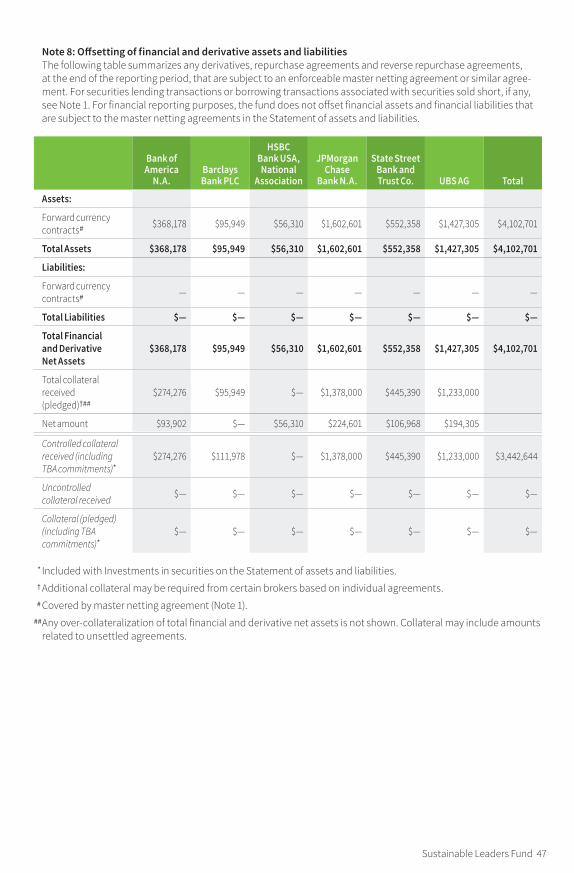
Sustainable Leaders Fund 47
Note 8: Offsetting of financial and derivative assets and liabilitiesThe following table summarizes any derivatives, repurchase agreements and reverse repurchase agreements, at the end of the reporting period, that are subject to an enforceable master netting agreement or similar agree-ment. For securities lending transactions or borrowing transactions associated with securities sold short, if any, see Note 1. For financial reporting purposes, the fund does not offset financial assets and financial liabilities that are subject to the master netting agreements in the Statement of assets and liabilities.
Bank of America
N.A.Barclays Bank PLC
HSBC Bank USA, National
Association
JPMorgan Chase
Bank N.A.
State Street Bank and Trust Co. UBS AG Total
Assets:
Forward currency contracts# $368,178 $95,949 $56,310 $1,602,601 $552,358 $1,427,305 $4,102,701
Total Assets $368,178 $95,949 $56,310 $1,602,601 $552,358 $1,427,305 $4,102,701
Liabilities:
Forward currency contracts# — — — — — — —
Total Liabilities $— $— $— $— $— $— $—
Total Financial and Derivative Net Assets
$368,178 $95,949 $56,310 $1,602,601 $552,358 $1,427,305 $4,102,701
Total collateral received (pledged)†##
$274,276 $95,949 $— $1,378,000 $445,390 $1,233,000
Net amount $93,902 $— $56,310 $224,601 $106,968 $194,305
Controlled collateral received (including TBA commitments)*
$274,276 $111,978 $— $1,378,000 $445,390 $1,233,000 $3,442,644
Uncontrolled collateral received $— $— $— $— $— $— $—
Collateral (pledged) (including TBA commitments)*
$— $— $— $— $— $— $—
* Included with Investments in securities on the Statement of assets and liabilities. † Additional collateral may be required from certain brokers based on individual agreements. # Covered by master netting agreement (Note 1). ## Any over-collateralization of total financial and derivative net assets is not shown. Collateral may include amounts
related to unsettled agreements.
48 Sustainable Leaders Fund
Federal tax information (Unaudited)
Pursuant to §852 of the Internal Revenue Code, as amended, the fund hereby designates $540,432,652 as a capital gain dividend with respect to the taxable year ended June 30, 2021, or, if subsequently determined to be different, the net capital gain of such year.
The fund designated 40.67% of ordinary income distributions as qualifying for the dividends received deduction for corporations.
For the reporting period, the fund hereby designates 59.86%, or the maximum amount allow-able, of its taxable ordinary income distributions as qualified dividends taxed at the individual net capital gain rates.
For the reporting period, pursuant to §871(k) of the Internal Revenue Code, the fund hereby desig-nates $819,895 of distributions paid as qualifying to be taxed as interest-related dividends, and $23,164,989 to be taxed as short-term capital gain dividends for nonresident alien shareholders.
The Form 1099 that will be mailed to you in January 2022 will show the tax status of all distributions paid to your account in calendar 2021.
Federal tax information

About the TrusteesINDEPENDENT TRUSTEES
Liaquat Ahamed Born 1952, Trustee since 2012Principal occupations during past five years: Author; won Pulitzer Prize for Lords of Finance: The Bankers Who Broke
the World.
Other directorships: Chairman of the Sun Valley Writers Conference, a literary not-for-profit organization, and a Trustee of the Journal of Philosophy.
Ravi AkhouryBorn 1947, Trustee since 2009Principal occupations during past five years: Private investor
Other directorships: Director of English Helper, Inc., a private software company; Trustee of the Rubin Museum, serving on the Investment Committee; and previously a Director of RAGE Frameworks, Inc.
Barbara M. Baumann Born 1955, Trustee since 2010Principal occupations during past five years: President of Cross Creek Energy Corporation, a strategic
consultant to domestic energy firms and direct investor in energy projects.
Other directorships: Director of Devon Energy Corporation, a publicly traded independent natural gas and oil exploration and production company; Director of National Fuel Gas Company, a publicly traded energy company that engages in the production, gathering, transportation, distribution, and marketing of natural gas; Senior Advisor to the energy private equity firm First Reserve; Director of Ascent Resources, LLC, a private independent exploration and production company; Director of Texas American Resources Company II, a private, independent oil and gas exploration and production company; member of the Finance Committee of the Children’s Hospital of Colorado; member of the Investment Committee of the Board of The Denver Foundation; and previously a Director of publicly traded companies Buckeye Partners LP, UNS Energy Corporation, CVR Energy Company, and SM Energy Corporation.
Katinka DomotorffyBorn 1975, Trustee since 2012Principal occupations during past five years: Voting member of the Investment Committees of the Anne Ray Foundation
and Margaret A. Cargill Foundation, part of the Margaret A. Cargill Philanthropies.
Other directorships: Director of the Great Lakes Science Center and of College Now Greater Cleveland.
Catharine Bond HillBorn 1954, Trustee since 2017Principal occupations during past five years: Managing Director of Ithaka S+R, a not-for-profit service that
helps the academic community navigate economic and technological change. From 2006 to 2016, the 10th president of Vassar College.
Other directorships: Director of Yale-NUS College and Trustee of Yale University.
Paul L. JoskowBorn 1947, Trustee since 1997Principal occupations during past five years: The Elizabeth and James Killian Professor of Economics, Emeritus at the
Massachusetts Institute of Technology (MIT). From 2008 to 2017, the President of the Alfred P. Sloan Foundation, a philanthropic institution focused primarily on research and education on issues related to science, technology, and economic performance.
Other directorships: Vice Chair of the Board of Directors of the Whitehead Institute for Biomedical Research, a non-profit biomedical research institute; a Director of Exelon Corporation, an energy company focused on power services; and a member Emeritus of the Board of Advisors of the Boston Symphony Orchestra.
Kenneth R. LeiblerBorn 1949, Trustee since 2006 Vice Chair from 2016 to 2018, and Chair since 2018Principal occupations during past
five years: Vice Chairman Emeritus of the Board of Trustees of Beth Israel Deaconess Hospital in Boston. Member of the Investment Committee of the Boston Arts Academy Foundation.
Other directorships: Director of Eversource Corporation, which operates New England’s largest energy delivery system; previously the Chairman of the Boston Options Exchange, an electronic market place for the trading of listed derivatives securities; previously the Chairman and Chief Executive Officer of the Boston Stock Exchange; and previously the President and Chief Operating Officer of the American Stock Exchange.
Sustainable Leaders Fund 49

George Putnam, IIIBorn 1951, Trustee since 1984Principal occupations during past five years: Chairman of New Generation Research, Inc., a publisher of financial
advisory and other research services, and President of New Generation Advisors, LLC, a registered investment adviser to private funds.
Other directorships: Director of The Boston Family Office, LLC, a registered investment advisor; a Trustee of the Gloucester Marine Genomics Institute; previously a Trustee of the Marine Biological Laboratory; and previously a Trustee of Epiphany School.
Manoj P. SinghBorn 1952, Trustee since 2017Principal occupations during past five years: Until 2015, Chief Operating Officer and Global Managing Director at
Deloitte Touche Tohmatsu, Ltd., a global professional services organization, serving on the Deloitte U.S. Board of Directors and the boards of Deloitte member firms in China, Mexico, and Southeast Asia.
Other directorships: Director of Abt Associates, a global research firm working in the fields of health, social and environmental policy, and international development; Trustee of Carnegie Mellon University; Director of Pratham USA, an organization dedicated to children’s education in India; member of the advisory board of Altimetrik, a business transformation and technology solutions firm; and Director of DXC Technology, a global IT services and consulting company.
Mona K. SutphenBorn 1967, Trustee since 2020Principal occupations during past five years: Senior Advisor at The Vistria Group, a private investment firm focused
on middle-market companies in the healthcare, education, and financial services industries. From 2014 to 2018, Partner at Macro Advisory Partners, a global consulting firm.
Other directorships: Director of Unitek Learning, a private nursing and medical services education provider in the United States; Director of Pattern Energy Group LP, a private renewable energy company; previous Director of Pattern Energy, a publicly traded renewable energy company; Board Member, International Rescue Committee; Co-Chair of the Board of Human Rights First; Trustee of Mount Holyoke College; and member of the Advisory Board for the Center on Global Energy Policy at Columbia University’s School of International and Public Affairs.
INTERESTED TRUSTEE
Robert L. Reynolds*
Trustee since 2008 and President and Chief Executive Officer of Putnam Investments since 2008
Principal occupations during past five years: President and Chief Executive Officer of Putnam Investments; President and Chief Executive Officer of Great-West Financial, a financial services company that provides retirement savings plans, life insurance, and annuity and executive benefits products; President and Chief Executive Officer of Great-West Lifeco U.S. Inc., a holding company that owns Putnam Investments and Great-West Financial; and member of Putnam Investments’ and Great-West Financial’s Board of Directors.
Other directorships: Director of West Virginia University Foundation; director of the Concord Museum; director of Dana-Farber Cancer Institute; Chairman of Massachusetts Competitive Partnership; director of Boston Chamber of Commerce; member of the Chief Executives Club of Boston; member of the National Innovation Initiative; member of the Massachusetts General Hospital President’s Council; member of the Council on Competitiveness; and previously the President of the Commercial Club of Boston.
* Mr. Reynolds is an “interested person” (as defined in the Investment Company Act of 1940) of the fund and Putnam Investments. He is President and Chief Executive Officer of Putnam Investments, as well as the President of your fund and each of the other Putnam funds.
The address of each Trustee is 100 Federal Street, Boston, MA 02110.
As of June 30, 2021, there were 100 Putnam funds. All Trustees serve as Trustees of all Putnam funds.
Each Trustee serves for an indefinite term, until his or her resignation, retirement at age 75, removal, or death.
50 Sustainable Leaders Fund
The principal occupations of the officers for the past five years have been with the employers as shown above, although in some cases they have held different positions with such employers. The address of each officer is 100 Federal Street, Boston, MA 02110.
OfficersIn addition to Robert L. Reynolds, the other officers of the fund are shown below:
James F. Clark (Born 1974)Vice President and Chief Compliance OfficerSince 2016Chief Compliance Officer and Chief Risk Officer, Putnam Investments and Chief Compliance Officer, Putnam Management
Nancy E. Florek (Born 1957)Vice President, Director of Proxy Voting and Corporate Governance, Assistant Clerk, and Assistant TreasurerSince 2000
Michael J. Higgins (Born 1976)Vice President, Treasurer, and ClerkSince 2010
Jonathan S. Horwitz (Born 1955)Executive Vice President, Principal Executive Officer, and Compliance LiaisonSince 2004
Richard T. Kircher (Born 1962)Vice President and BSA Compliance OfficerSince 2019Assistant Director, Operational Compliance, Putnam Investments and Putnam Retail Management
Susan G. Malloy (Born 1957)Vice President and Assistant TreasurerSince 2007Head of Accounting and Middle Office Services, Putnam Investments and Putnam Management
Denere P. Poulack (Born 1968)Assistant Vice President, Assistant Clerk, and Assistant TreasurerSince 2004
Janet C. Smith (Born 1965)Vice President, Principal Financial Officer, Principal Accounting Officer, and Assistant TreasurerSince 2007Head of Fund Administration Services, Putnam Investments and Putnam Management
Stephen J. Tate (Born 1974)Vice President and Chief Legal OfficerSince 2021General Counsel, Putnam Investments, Putnam Management, and Putnam Retail Management
Mark C. Trenchard (Born 1962)Vice PresidentSince 2002Director of Operational Compliance, Putnam Investments and Putnam Retail Management
Sustainable Leaders Fund 51
52 Sustainable Leaders Fund
Services for shareholders
Investor services
Systematic investment plan Tell us how much you wish to invest regularly — weekly, semimonthly, or monthly — and the amount you choose will be transferred automatically from your checking or savings account. There’s no additional fee for this service, and you can suspend it at any time. This plan may be a great way to save for college expenses or to plan for your retirement.
Please note that regular investing does not guarantee a profit or protect against loss in a declining market. Before arranging a system-atic investment plan, consider your financial ability to continue making purchases in periods when prices are low.
Systematic exchange You can make regular transfers from one Putnam fund to another Putnam fund. There are no additional fees for this service, and you can cancel or change your options at any time.
Dividends PLUS You can choose to have the dividend distributions from one of your Putnam funds automatically reinvested in another Putnam fund at no additional charge.
Free exchange privilege You can exchange money between Putnam funds free of charge, as long as they are the same class of shares. A signature guarantee is required if you are exchanging more than $500,000. The fund reserves the right to revise or terminate the exchange privilege.
Reinstatement privilege If you’ve sold Putnam shares or received a check for a divi-dend or capital gain, you may reinvest the proceeds with Putnam within 90 days of the
transaction and they will be reinvested at the fund’s current net asset value — with no sales charge. However, reinstatement of class B shares may have special tax consequences. Ask your financial or tax representative for details.
Check-writing service You have ready access to many Putnam accounts. It’s as simple as writing a check, and there are no special fees or service charges. For more information about the check-writing service, call Putnam or visit our website.
Dollar cost averaging When you’re investing for long-term goals, it’s time, not timing, that counts. Investing on a systematic basis is a better strategy than trying to figure out when the markets will go up or down. This means investing the same amount of money regularly over a long period. This method of investing is called dollar cost averaging. When a fund’s share price declines, your investment dollars buy more shares at lower prices. When it increases, they buy fewer shares. Over time, you will pay a lower average price per share.
For more information
Visit the Individual Investors section at putnam.com A secure section of our website contains complete information on your account, including balances and transac-tions, updated daily. You may also conduct transactions, such as exchanges, additional investments, and address changes. Log on today to get your password.
Call us toll free at 1-800-225-1581 Ask a helpful Putnam representative or your financial advisor for details about any of these or other services, or see your prospectus.
Fund informationFounded over 80 years ago, Putnam Investments was built around the concept that a balance between risk and reward is the hallmark of a well-rounded financial program. We manage funds across income, value, blend, growth, sustainable, asset allocation, absolute return, and global sector categories.
Investment ManagerPutnam Investment Management, LLC 100 Federal Street Boston, MA 02110
Investment Sub-AdvisorPutnam Investments Limited 16 St James’s Street London, England SW1A 1ER
Marketing ServicesPutnam Retail Management 100 Federal Street Boston, MA 02110
CustodianState Street Bank and Trust Company
Legal CounselRopes & Gray LLP
Independent Registered Public Accounting FirmPricewaterhouseCoopers LLP
TrusteesKenneth R. Leibler, Chair Liaquat Ahamed Ravi Akhoury Barbara M. Baumann Katinka Domotorffy Catharine Bond Hill Paul L. Joskow George Putnam, III Robert L. Reynolds Manoj P. Singh Mona K. Sutphen
OfficersRobert L. Reynolds President
James F. Clark Vice President, Chief Compliance Officer, and Chief Risk Officer
Nancy E. Florek Vice President, Director of Proxy Voting and Corporate Governance, Assistant Clerk, and Assistant Treasurer
Michael J. Higgins Vice President, Treasurer, and Clerk
Jonathan S. Horwitz Executive Vice President, Principal Executive Officer, and Compliance Liaison
Richard T. Kircher Vice President and BSA Compliance Officer
Susan G. Malloy Vice President and Assistant Treasurer
Denere P. Poulack Assistant Vice President, Assistant Clerk, and Assistant Treasurer
Janet C. Smith Vice President, Principal Financial Officer, Principal Accounting Officer, and Assistant Treasurer
Stephen J. Tate Vice President and Chief Legal Officer
Mark C. Trenchard Vice President
This report is for the information of shareholders of Putnam Sustainable Leaders Fund. It may also be used as sales literature when preceded or accompanied by the current prospectus, the most recent copy of Putnam’s Quarterly Performance Summary, and Putnam’s Quarterly Ranking Summary. For more recent performance, please visit putnam.com. Investors should carefully consider the investment objectives, risks, charges, and expenses of a fund, which are described in its prospectus. For this and other information or to request a prospectus or summary prospectus, call 1-800-225-1581 toll free. Please read the prospectus carefully before investing. The fund’s Statement of Additional Information contains additional information about the fund’s Trustees and is available without charge upon request by calling 1-800-225-1581.

AN01
3 32
6406
8/
21