Embed Size (px)
Citation preview
U.S. Seniors Housing & Care Investor Survey
H1 2021
U.S. SENIORS HOUSING & CARE INVESTOR SURVEY UPDATE
Project: Ventana CCRC by BucknerDallas, Texas
Architect: HKS Interior Design: IDA
Landscape: Talley Associates Photography: Sargent Photography
CBRE Valuation & Advisory Services © 2021 CBRE, Inc. | 2
H1 2021U.S. SENIORS HOUSING & CARE INVESTOR SURVEY UPDATE
As the 10th consecutive survey, this H1 2021
CBRE Seniors Housing & Care Investor Survey is
a product of consistent reporting methodology
and pertinent and actionable market intelligence.
In the most recent surveys, respondents have
provided a much-needed window into ongoing
changes in market conditions as a result of the
COVID-19 pandemic. The H1 2020 survey closed
at the end of February 2020, providing insights
into the last pre-pandemic market sentiment.
U.S. Seniors Housing & Care Investor Survey
When juxtaposed with H1 2020 results, the H2
2020 survey provided real-time market insight into
the impact of COVID-19 within seniors housing.
This H1 2021 survey’s objective is to identify post-
pandemic recovery trends in the seniors housing &
care industry. The data is based on market sentiment
collected from seniors housing investors, developers,
lenders and brokers throughout the United States.
We thank all the respondents for providing their
vital insights on the state of the market.
Project: CC Young Dallas, Texas
Architect: HKS Interior Design: Faulkner Design Group
Landscape: Talley Associates Photography: HKS
CBRE Valuation & Advisory Services © 2021 CBRE, Inc. | 3
H1 2021U.S. SENIORS HOUSING & CARE INVESTOR SURVEY UPDATE
• Capitalization Rates: While not fully recovered, the average cap rate during this survey (H1 2021) indicated a period-over-period (P-o-P) compression of -13 basis points (bps), an improvement from the +31 bps, P-o-P expansion during the prior survey.
• The vast majority of the respondents opined that they expect positive census trends, or a recovery from the negative census trends that resulted from the COVID-19 pandemic.
• The Active Adult product type re-emerged at the top of the investor opportunity list, which was also coincided with the largest compression in cap rates, an average of -32 bps, among all property types.
Figure 1: Survey Respondent Categories (%)
Highlights of Seniors Housing Trends
Overall Cap Rate
Average (bps) P-o-P -32
Active Adult (AA)
-12
Independent Living (IL)
-7
Assisted Living (AL)
-6
Memory Care (MC)
-18
Skilled Nursing Facility (SNF)
-4
Continuing Care Retirement Community/Life Plan Community (CCRC/LPC)
Senior Housing Investor Survey, H2 2020 (Inner Ring) and H1 2021 (Outer Ring).
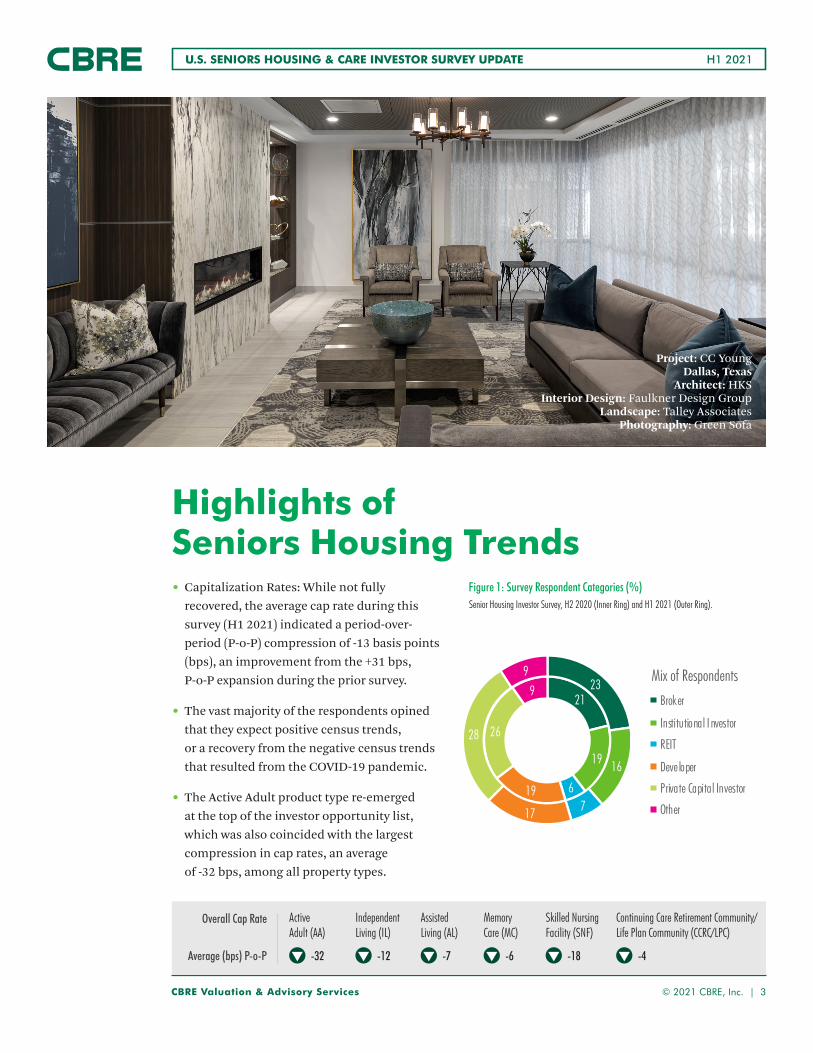
Project: CC YoungDallas, Texas
Architect: HKS Interior Design: Faulkner Design Group
Landscape: Talley Associates Photography: Green Sofa
21
19
619
26
9 23
16
717
28
9 Mix of Respondents
Broker
Institutional I nvestor
REIT
Deve loper
Private Capital Investor
Other
21
19
619
26
9 23
16
717
28
9 Mix of Respondents
Broker
Institutional I nvestor
REIT
Deve loper
Private Capital Investor
Other
CBRE Valuation & Advisory Services © 2021 CBRE, Inc. | 4
H1 2021U.S. SENIORS HOUSING & CARE INVESTOR SURVEY UPDATE
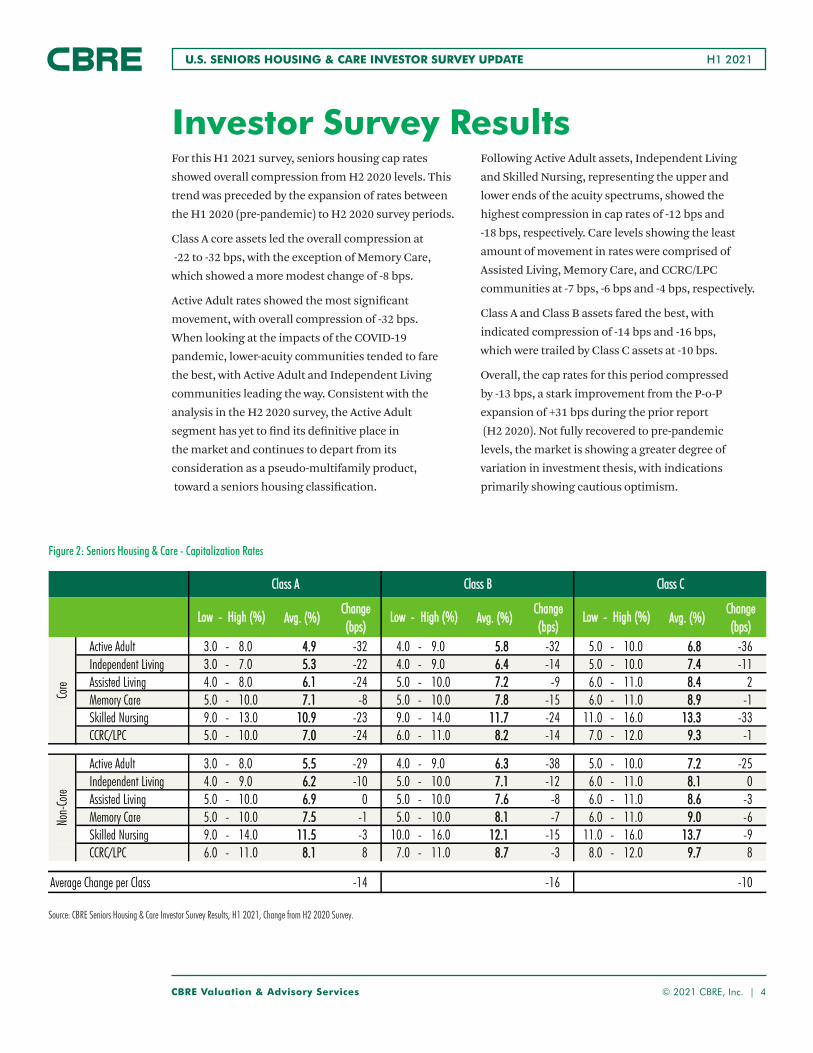
For this H1 2021 survey, seniors housing cap rates
showed overall compression from H2 2020 levels. This
trend was preceded by the expansion of rates between
the H1 2020 (pre-pandemic) to H2 2020 survey periods.
Class A core assets led the overall compression at
-22 to -32 bps, with the exception of Memory Care,
which showed a more modest change of -8 bps.
Active Adult rates showed the most significant
movement, with overall compression of -32 bps.
When looking at the impacts of the COVID-19
pandemic, lower-acuity communities tended to fare
the best, with Active Adult and Independent Living
communities leading the way. Consistent with the
analysis in the H2 2020 survey, the Active Adult
segment has yet to find its definitive place in
the market and continues to depart from its
consideration as a pseudo-multifamily product,
toward a seniors housing classification.
Following Active Adult assets, Independent Living
and Skilled Nursing, representing the upper and
lower ends of the acuity spectrums, showed the
highest compression in cap rates of -12 bps and
-18 bps, respectively. Care levels showing the least
amount of movement in rates were comprised of
Assisted Living, Memory Care, and CCRC/LPC
communities at -7 bps, -6 bps and -4 bps, respectively.
Class A and Class B assets fared the best, with
indicated compression of -14 bps and -16 bps,
which were trailed by Class C assets at -10 bps.
Overall, the cap rates for this period compressed
by -13 bps, a stark improvement from the P-o-P
expansion of +31 bps during the prior report
(H2 2020). Not fully recovered to pre-pandemic
levels, the market is showing a greater degree of
variation in investment thesis, with indications
primarily showing cautious optimism.
Investor Survey Results
Figure 2: Seniors Housing & Care - Capitalization Rates
Source: CBRE Seniors Housing & Care Investor Survey Results, H1 2021, Change from H2 2020 Survey.
Figure 2: Seniors Housing & Care - Capitalization Rates
AAvvgg.. ((%%))CChhaannggee ((bbppss))
AAvvgg.. ((%%))CChhaannggee ((bbppss))
AAvvgg.. ((%%))CChhaannggee ((bbppss))
Active Adult 3.0 - 8.0 44..99 -32 4.0 - 9.0 55..88 -32 5.0 - 10.0 66..88 -36Independent Living 3.0 - 7.0 55..33 -22 4.0 - 9.0 66..44 -14 5.0 - 10.0 77..44 -11Assisted Living 4.0 - 8.0 66..11 -24 5.0 - 10.0 77..22 -9 6.0 - 11.0 88..44 2Memory Care 5.0 - 10.0 77..11 -8 5.0 - 10.0 77..88 -15 6.0 - 11.0 88..99 -1Skilled Nursing 9.0 - 13.0 1100..99 -23 9.0 - 14.0 1111..77 -24 11.0 - 16.0 1133..33 -33CCRC/LPC 5.0 - 10.0 77..00 -24 6.0 - 11.0 88..22 -14 7.0 - 12.0 99..33 -1
Active Adult 3.0 - 8.0 55..55 -29 4.0 - 9.0 66..33 -38 5.0 - 10.0 77..22 -25Independent Living 4.0 - 9.0 66..22 -10 5.0 - 10.0 77..11 -12 6.0 - 11.0 88..11 0Assisted Living 5.0 - 10.0 66..99 0 5.0 - 10.0 77..66 -8 6.0 - 11.0 88..66 -3Memory Care 5.0 - 10.0 77..55 -1 5.0 - 10.0 88..11 -7 6.0 - 11.0 99..00 -6Skilled Nursing 9.0 - 14.0 1111..55 -3 10.0 - 16.0 1122..11 -15 11.0 - 16.0 1133..77 -9CCRC/LPC 6.0 - 11.0 88..11 8 7.0 - 11.0 88..77 -3 8.0 - 12.0 99..77 8
Average Change per Class -14 -16 -10
CBRE Seniors Housing Investor Survey results, H1 2021; change from H2 2020, Survey.
CCllaassss BB CCllaassss CCCCllaassss AA
Non-
Core
Core
LLooww -- HHiigghh ((%%)) LLooww -- HHiigghh ((%%)) LLooww -- HHiigghh ((%%))
CBRE Valuation & Advisory Services © 2021 CBRE, Inc. | 5
H1 2021U.S. SENIORS HOUSING & CARE INVESTOR SURVEY UPDATE
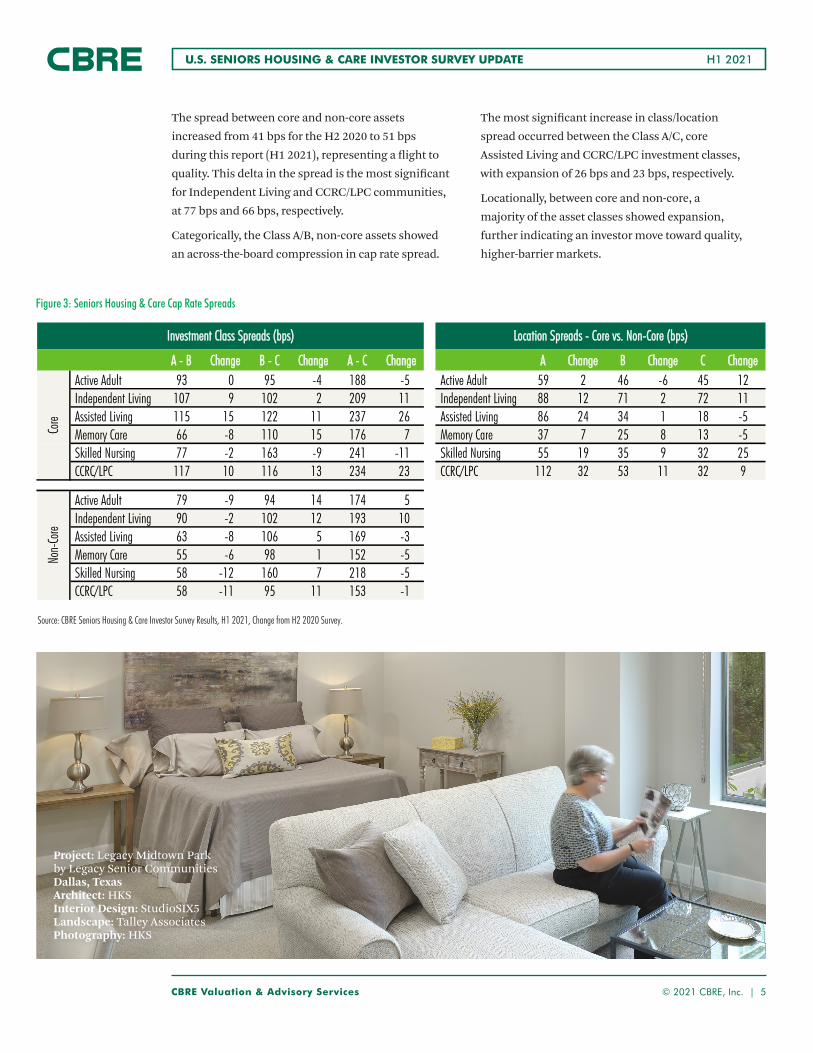
Figure 3: Seniors Housing & Care Cap Rate Spreads
Source: CBRE Seniors Housing & Care Investor Survey Results, H1 2021, Change from H2 2020 Survey.
Project: Legacy Midtown Park by Legacy Senior Communities Dallas, TexasArchitect: HKS Interior Design: StudioSIX5 Landscape: Talley Associates Photography: HKS
The spread between core and non-core assets
increased from 41 bps for the H2 2020 to 51 bps
during this report (H1 2021), representing a flight to
quality. This delta in the spread is the most significant
for Independent Living and CCRC/LPC communities,
at 77 bps and 66 bps, respectively.
Categorically, the Class A/B, non-core assets showed
an across-the-board compression in cap rate spread.
The most significant increase in class/location
spread occurred between the Class A/C, core
Assisted Living and CCRC/LPC investment classes,
with expansion of 26 bps and 23 bps, respectively.
Locationally, between core and non-core, a
majority of the asset classes showed expansion,
further indicating an investor move toward quality,
higher-barrier markets.
Figure 3: Seniors Housing & Care - Capitalization Rate Spreads & Internal Rate of Return
AA -- BB CChhaannggee BB -- CC CChhaannggee AA -- CC CChhaannggee AA CChhaannggee BB CChhaannggee CC CChhaannggee Active Adult 93 0 95 -4 188 -5 Active Adult 59 2 46 -6 45 12 Independent Living 107 9 102 2 209 11 Independent Living 88 12 71 2 72 11 Assisted Living 115 15 122 11 237 26 Assisted Living 86 24 34 1 18 -5 Memory Care 66 -8 110 15 176 7 Memory Care 37 7 25 8 13 -5 Skilled Nursing 77 -2 163 -9 241 -11 Skilled Nursing 55 19 35 9 32 25 CCRC/LPC 117 10 116 13 234 23 CCRC/LPC 112 32 53 11 32 9
Active Adult 79 -9 94 14 174 5 Independent Living 90 -2 102 12 193 10 Assisted Living 63 -8 106 5 169 -3 Memory Care 55 -6 98 1 152 -5 Skilled Nursing 58 -12 160 7 218 -5 CCRC/LPC 58 -11 95 11 153 -1
CBRE Seniors Housing Investor Survey results, H1 2021; change from H2 2020, Survey.
Core
Non-
Core
LLooccaattiioonn SSpprreeaaddss -- CCoorree vvss.. NNoonn--CCoorree ((bbppss))IInnvveessttmmeenntt CCllaassss SSpprreeaaddss ((bbppss))
CBRE Valuation & Advisory Services © 2021 CBRE, Inc. | 6
H1 2021U.S. SENIORS HOUSING & CARE INVESTOR SURVEY UPDATE
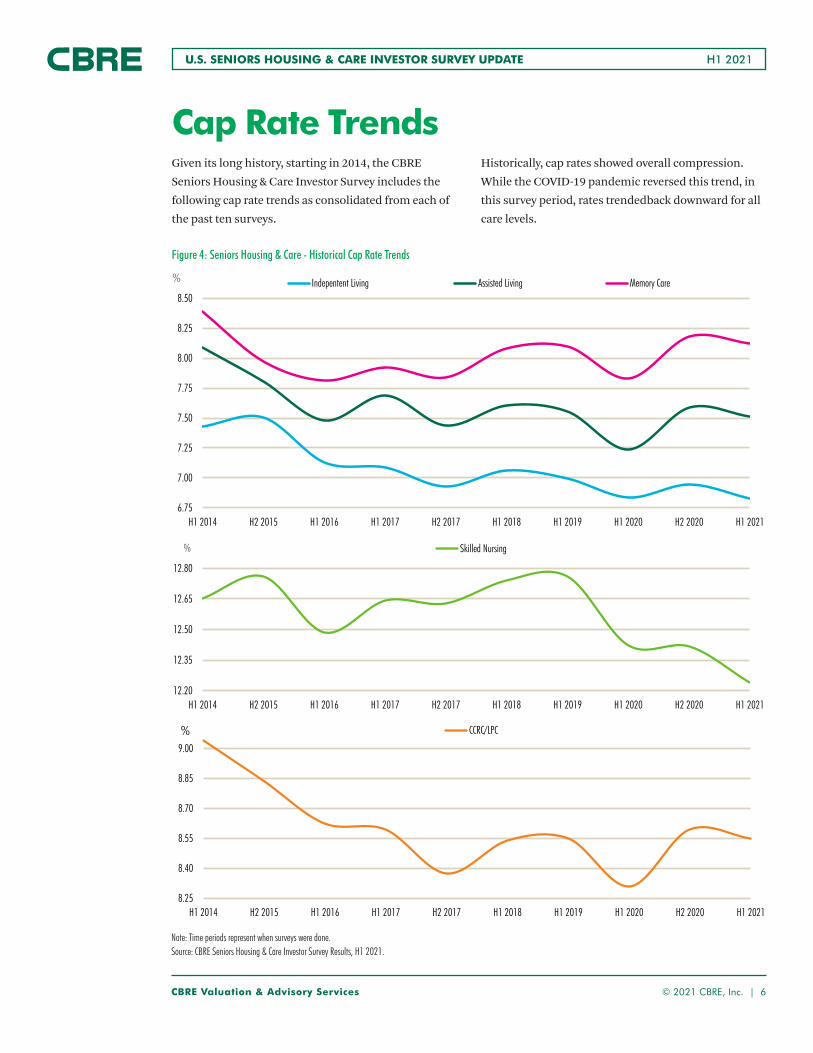
Figure 4: Seniors Housing & Care - Historical Capitalization Rate Trends
Note: Time periods represent when surveys were done.CBRE Seniors Housing Investor Survey results, H1 2021.
6.75
7.00
7.25
7.50
7.75
8.00
8.25
8.50
H1 2014 H2 2015 H1 2016 H1 2017 H2 2017 H1 2018 H1 2019 H1 2020 H2 2020 H1 2021
% Indepentent Living Assisted Living Memory Care
12.20
12.35
12.50
12.65
12.80
H1 2014 H2 2015 H1 2016 H1 2017 H2 2017 H1 2018 H1 2019 H1 2020 H2 2020 H1 2021
% Skilled Nursing
8.25
8.40
8.55
8.70
8.85
9.00
H1 2014 H2 2015 H1 2016 H1 2017 H2 2017 H1 2018 H1 2019 H1 2020 H2 2020 H1 2021
CCRC/LPC%
Given its long history, starting in 2014, the CBRE
Seniors Housing & Care Investor Survey includes the
following cap rate trends as consolidated from each of
the past ten surveys.
Historically, cap rates showed overall compression.
While the COVID-19 pandemic reversed this trend, in
this survey period, rates trendedback downward for all
care levels.
Cap Rate Trends
Figure 4: Seniors Housing & Care - Historical Cap Rate Trends
Note: Time periods represent when surveys were done.Source: CBRE Seniors Housing & Care Investor Survey Results, H1 2021.
CBRE Valuation & Advisory Services © 2021 CBRE, Inc. | 7
H1 2021U.S. SENIORS HOUSING & CARE INVESTOR SURVEY UPDATE
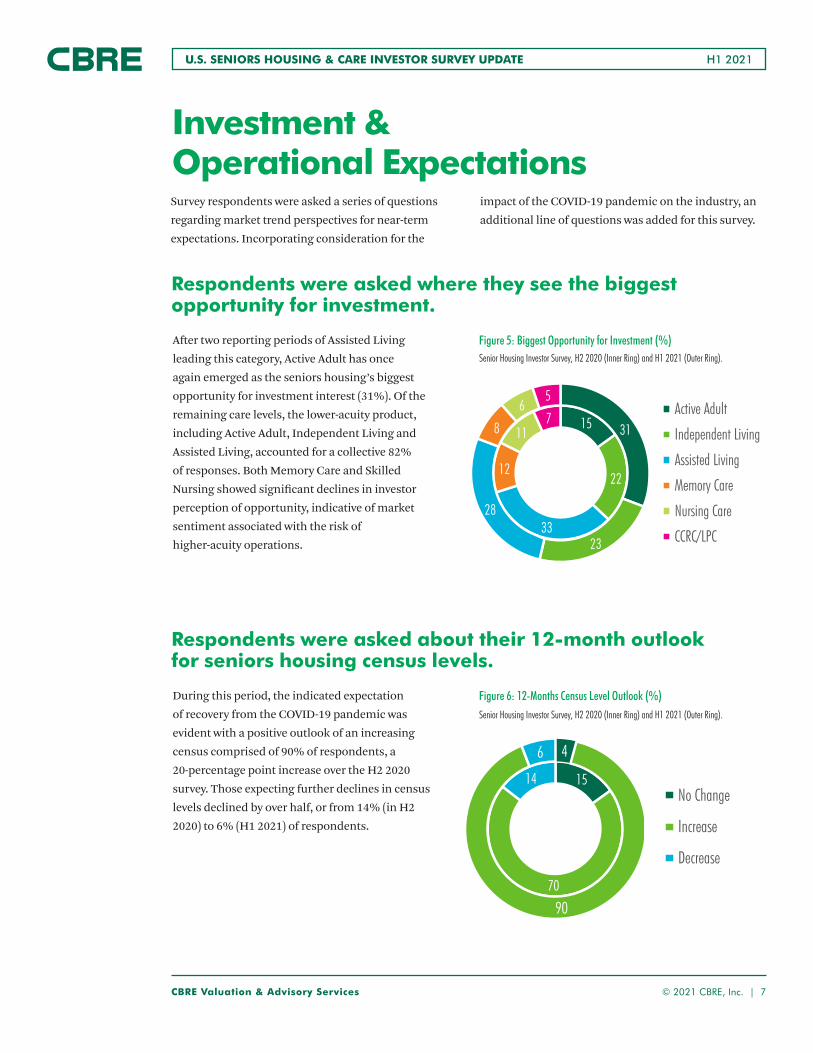
Investment & Operational Expectations
Figure 5: Biggest Opportunity for Investment (%)
Figure 6: 12-Months Census Level Outlook (%)
Senior Housing Investor Survey, H2 2020 (Inner Ring) and H1 2021 (Outer Ring).
Senior Housing Investor Survey, H2 2020 (Inner Ring) and H1 2021 (Outer Ring).
Survey respondents were asked a series of questions
regarding market trend perspectives for near-term
expectations. Incorporating consideration for the
After two reporting periods of Assisted Living
leading this category, Active Adult has once
again emerged as the seniors housing’s biggest
opportunity for investment interest (31%). Of the
remaining care levels, the lower-acuity product,
including Active Adult, Independent Living and
Assisted Living, accounted for a collective 82%
of responses. Both Memory Care and Skilled
Nursing showed significant declines in investor
perception of opportunity, indicative of market
sentiment associated with the risk of
higher-acuity operations.
During this period, the indicated expectation
of recovery from the COVID-19 pandemic was
evident with a positive outlook of an increasing
census comprised of 90% of respondents, a
20-percentage point increase over the H2 2020
survey. Those expecting further declines in census
levels declined by over half, or from 14% (in H2
2020) to 6% (H1 2021) of respondents.
impact of the COVID-19 pandemic on the industry, an
additional line of questions was added for this survey.
Respondents were asked where they see the biggest opportunity for investment.
Respondents were asked about their 12-month outlook for seniors housing census levels.
FFiigguurree 55:: BBiiggggeesstt OOppppoorrttuunniittyy ffoorr IInnvveessttmmeenntt ((%%))
CBRE Seniors Housing Investor Survey, H2 2020 (Inner Ring) and H1 2021 (Outer Ring).
22
33
12117
100
31
23
28
8
65
Active Adult
Independent Living
Assisted Living
Memory Care
Nursing Care
CCRC/LPC
FFiigguurree 66:: 1122--MMoonntthh CCeennssuuss LLeevveell OOuuttllooookk ((%%))
CBRE Seniors Housing Investor Survey, H2 2020 (Inner Ring) and H1 2021 (Outer Ring).
15
70
14
4
90
6No Change
Increase
Decrease
FFiigguurree 66:: 1122--MMoonntthh CCeennssuuss LLeevveell OOuuttllooookk ((%%))
CBRE Seniors Housing Investor Survey, H2 2020 (Inner Ring) and H1 2021 (Outer Ring).
15
70
14
4
90
6No Change
Increase
Decrease
15
22
33
12
117
31
23
28
8
65
Active Adult
Independent Living
Assisted Living
Memory Care
Nursing Care
CCRC/LPC
CBRE Valuation & Advisory Services © 2021 CBRE, Inc. | 8
H1 2021U.S. SENIORS HOUSING & CARE INVESTOR SURVEY UPDATE
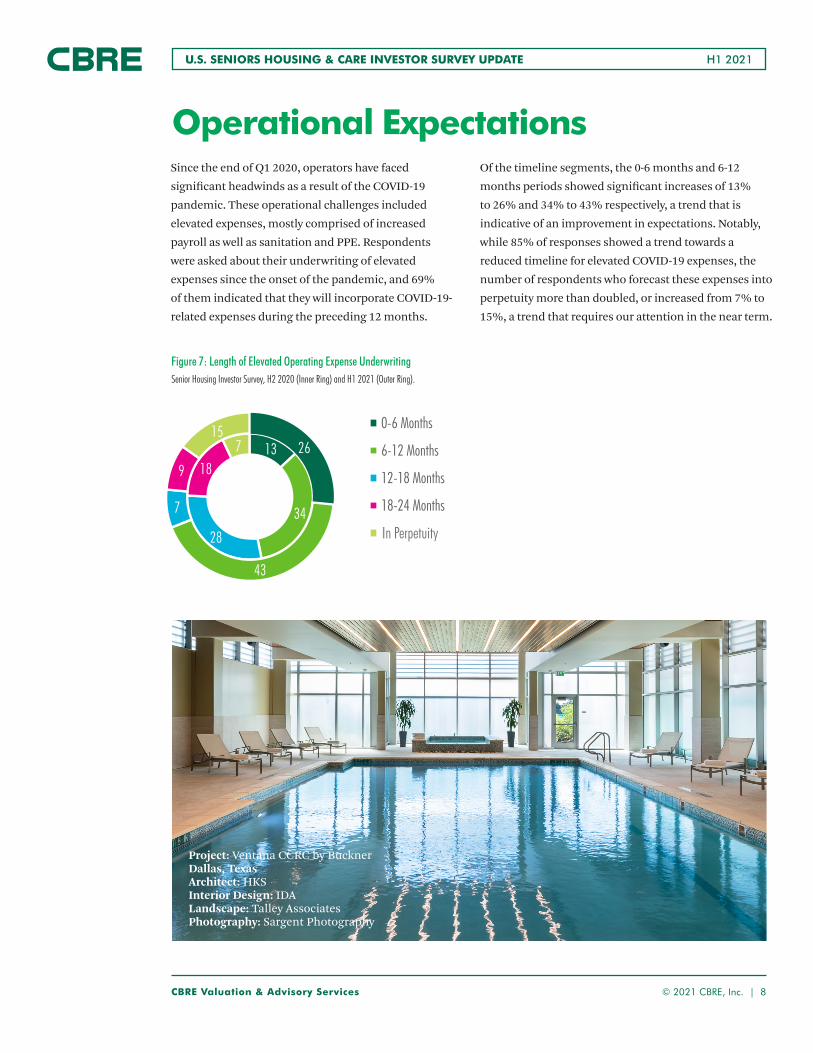
Operational Expectations
Figure 7: Length of Elevated Operating Expense Underwriting
Project: Ventana CCRC by BucknerDallas, TexasArchitect: HKS Interior Design: IDA Landscape: Talley Associates Photography: Sargent Photography
FFiigguurree 77:: LLeennggtthh ooff EElleevvaatteedd OOppeerraattiinngg EExxppeennssee UUnnddeerrwwrriittiinngg
CBRE Seniors Housing Investor Survey, H2 2020 (Inner Ring) and H1 2021 (Outer Ring).
13
34
28
187 26
43
7
9
15 0-6 Months
6-12 Months
12-18 Months
18-24 Months
Into Perpetuity
Senior Housing Investor Survey, H2 2020 (Inner Ring) and H1 2021 (Outer Ring).
Since the end of Q1 2020, operators have faced
significant headwinds as a result of the COVID-19
pandemic. These operational challenges included
elevated expenses, mostly comprised of increased
payroll as well as sanitation and PPE. Respondents
were asked about their underwriting of elevated
expenses since the onset of the pandemic, and 69%
of them indicated that they will incorporate COVID-19-
related expenses during the preceding 12 months.
Of the timeline segments, the 0-6 months and 6-12
months periods showed significant increases of 13%
to 26% and 34% to 43% respectively, a trend that is
indicative of an improvement in expectations. Notably,
while 85% of responses showed a trend towards a
reduced timeline for elevated COVID-19 expenses, the
number of respondents who forecast these expenses into
perpetuity more than doubled, or increased from 7% to
15%, a trend that requires our attention in the near term.
In Perpetuity
CBRE Valuation & Advisory Services © 2021 CBRE, Inc. | 9
H1 2021U.S. SENIORS HOUSING & CARE INVESTOR SURVEY UPDATE
Source: CBRE Seniors Housing & Care Investor Survey Results, H1 2021.
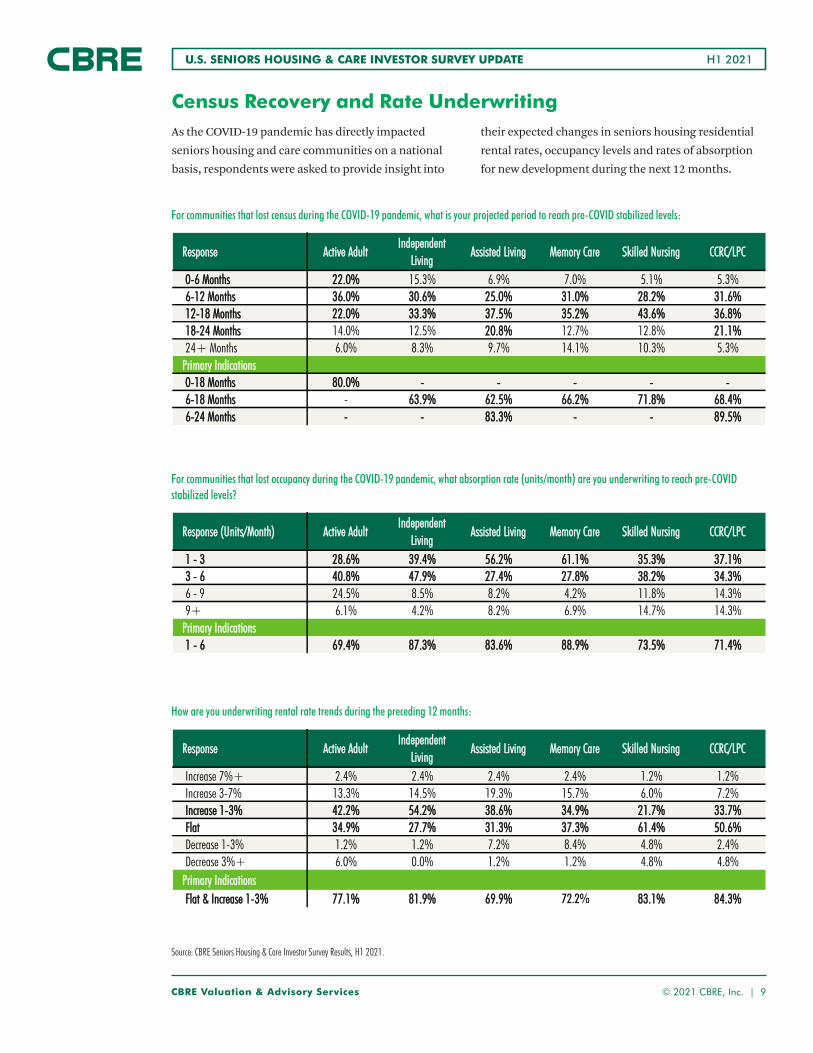
As the COVID-19 pandemic has directly impacted
seniors housing and care communities on a national
basis, respondents were asked to provide insight into
their expected changes in seniors housing residential
rental rates, occupancy levels and rates of absorption
for new development during the next 12 months.
Census Recovery and Rate Underwriting
For communities that lost census during the COVID-19 pandemic, what is your projected period to reach pre-COVID stabilized levels:
RReessppoonnssee AAccttiivvee AAdduullttIInnddeeppeennddeenntt
LLiivviinnggAAssssiisstteedd LLiivviinngg MMeemmoorryy CCaarree SSkkiilllleedd NNuurrssiinngg CCCCRRCC//LLPPCC
00--66 MMoonntthhss 2222..00%% 15.3% 6.9% 7.0% 5.1% 5.3%66--1122 MMoonntthhss 3366..00%% 3300..66%% 2255..00%% 3311..00%% 2288..22%% 3311..66%%1122--1188 MMoonntthhss 2222..00%% 3333..33%% 3377..55%% 3355..22%% 4433..66%% 3366..88%%1188--2244 MMoonntthhss 14.0% 12.5% 2200..88%% 12.7% 12.8% 2211..11%%24+ Months 6.0% 8.3% 9.7% 14.1% 10.3% 5.3%
PPrriimmaarryy IInnddiiccaattiioonnss00--1188 MMoonntthhss 8800..00%% -- -- -- -- --66--1188 MMoonntthhss - 6633..99%% 6622..55%% 6666..22%% 7711..88%% 6688..44%%66--2244 MMoonntthhss -- -- 8833..33%% -- -- 8899..55%%CBRE Seniors Housing Investor Survey results, H1 2021.
For communities that lost occupancy during the COVID-19 pandemic, what absorption rate (units/month) are you underwriting to reach pre-COVID stabilized levels?
RReessppoonnssee ((UUnniittss//MMoonntthh)) AAccttiivvee AAdduullttIInnddeeppeennddeenntt
LLiivviinnggAAssssiisstteedd LLiivviinngg MMeemmoorryy CCaarree SSkkiilllleedd NNuurrssiinngg CCCCRRCC//LLPPCC
11 -- 33 2288..66%% 3399..44%% 5566..22%% 6611..11%% 3355..33%% 3377..11%%33 -- 66 4400..88%% 4477..99%% 2277..44%% 2277..88%% 3388..22%% 3344..33%%6 - 9 24.5% 8.5% 8.2% 4.2% 11.8% 14.3%9+ 6.1% 4.2% 8.2% 6.9% 14.7% 14.3%
PPrriimmaarryy IInnddiiccaattiioonnss11 -- 66 6699..44%% 8877..33%% 8833..66%% 8888..99%% 7733..55%% 7711..44%%
CBRE Seniors Housing Investor Survey results, H1 2021.
How are you underwriting rental rate trends during the preceding 12 months:
RReessppoonnssee AAccttiivvee AAdduullttIInnddeeppeennddeenntt
LLiivviinnggAAssssiisstteedd LLiivviinngg MMeemmoorryy CCaarree SSkkiilllleedd NNuurrssiinngg CCCCRRCC//LLPPCC
Increase 7%+ 2.4% 2.4% 2.4% 2.4% 1.2% 1.2%Increase 3-7% 13.3% 14.5% 19.3% 15.7% 6.0% 7.2%IInnccrreeaassee 11--33%% 4422..22%% 5544..22%% 3388..66%% 3344..99%% 2211..77%% 3333..77%%FFllaatt 3344..99%% 2277..77%% 3311..33%% 3377..33%% 6611..44%% 5500..66%%Decrease 1-3% 1.2% 1.2% 7.2% 8.4% 4.8% 2.4%Decrease 3%+ 6.0% 0.0% 1.2% 1.2% 4.8% 4.8%
PPrriimmaarryy IInnddiiccaattiioonnssFFllaatt && IInnccrreeaassee 11--33%% 7777..11%% 8811..99%% 6699..99%% 7722..33%% 8833..11%% 8844..33%%CBRE Seniors Housing Investor Survey results, H1 2021.
72.2%
CBRE Valuation & Advisory Services © 2021 CBRE, Inc. | 10
H1 2021U.S. SENIORS HOUSING & CARE INVESTOR SURVEY UPDATE
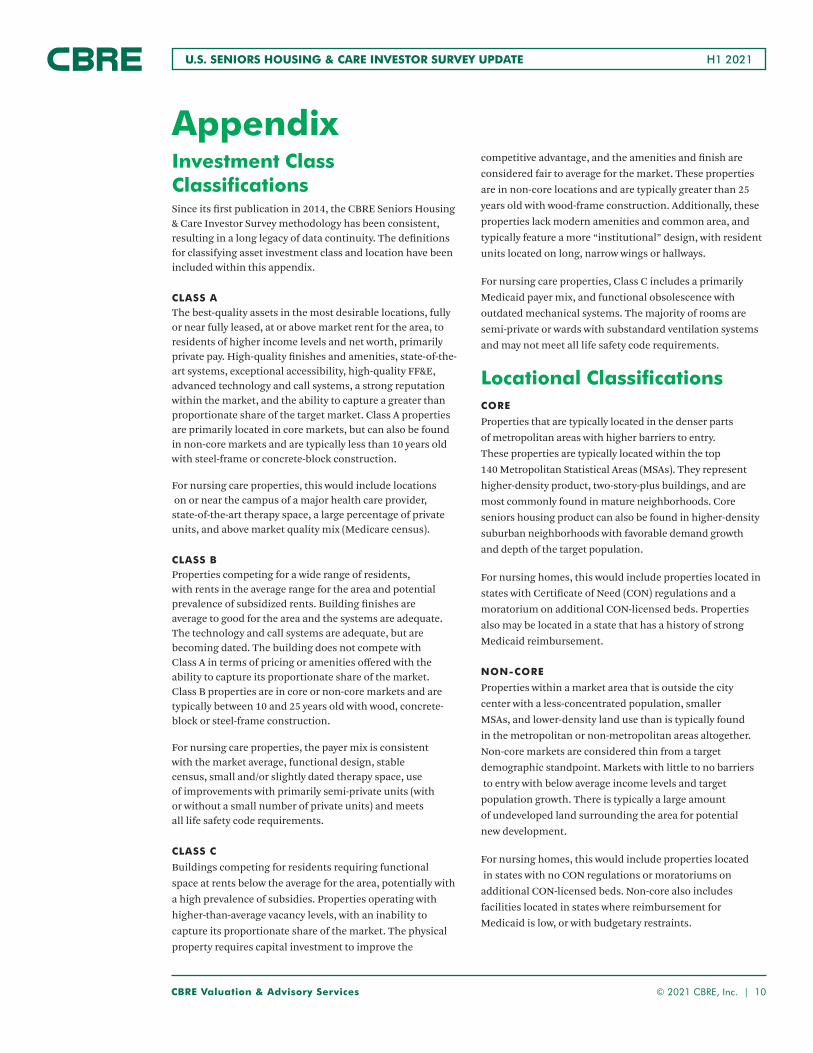
Investment Class Classifications Since its first publication in 2014, the CBRE Seniors Housing & Care Investor Survey methodology has been consistent, resulting in a long legacy of data continuity. The definitions for classifying asset investment class and location have been included within this appendix.
CLASS AThe best-quality assets in the most desirable locations, fully or near fully leased, at or above market rent for the area, to residents of higher income levels and net worth, primarily private pay. High-quality finishes and amenities, state-of-the-art systems, exceptional accessibility, high-quality FF&E, advanced technology and call systems, a strong reputation within the market, and the ability to capture a greater than proportionate share of the target market. Class A properties are primarily located in core markets, but can also be found in non-core markets and are typically less than 10 years old with steel-frame or concrete-block construction.
For nursing care properties, this would include locations on or near the campus of a major health care provider, state-of-the-art therapy space, a large percentage of private units, and above market quality mix (Medicare census).
CLASS B Properties competing for a wide range of residents, with rents in the average range for the area and potential prevalence of subsidized rents. Building finishes are average to good for the area and the systems are adequate. The technology and call systems are adequate, but are becoming dated. The building does not compete with Class A in terms of pricing or amenities offered with the ability to capture its proportionate share of the market. Class B properties are in core or non-core markets and are typically between 10 and 25 years old with wood, concrete-block or steel-frame construction.
For nursing care properties, the payer mix is consistent with the market average, functional design, stable census, small and/or slightly dated therapy space, use of improvements with primarily semi-private units (with or without a small number of private units) and meets all life safety code requirements.
CLASS C
Buildings competing for residents requiring functional space at rents below the average for the area, potentially with a high prevalence of subsidies. Properties operating with higher-than-average vacancy levels, with an inability to capture its proportionate share of the market. The physical property requires capital investment to improve the
competitive advantage, and the amenities and finish are considered fair to average for the market. These properties are in non-core locations and are typically greater than 25 years old with wood-frame construction. Additionally, these properties lack modern amenities and common area, and typically feature a more “institutional” design, with resident units located on long, narrow wings or hallways.
For nursing care properties, Class C includes a primarily Medicaid payer mix, and functional obsolescence with outdated mechanical systems. The majority of rooms are semi-private or wards with substandard ventilation systems and may not meet all life safety code requirements.
Locational Classifications CORE
Properties that are typically located in the denser parts of metropolitan areas with higher barriers to entry. These properties are typically located within the top 140 Metropolitan Statistical Areas (MSAs). They represent higher-density product, two-story-plus buildings, and are most commonly found in mature neighborhoods. Core seniors housing product can also be found in higher-density suburban neighborhoods with favorable demand growth and depth of the target population.
For nursing homes, this would include properties located in states with Certificate of Need (CON) regulations and a moratorium on additional CON-licensed beds. Properties also may be located in a state that has a history of strong Medicaid reimbursement.
NON-CORE
Properties within a market area that is outside the city center with a less-concentrated population, smaller MSAs, and lower-density land use than is typically found in the metropolitan or non-metropolitan areas altogether. Non-core markets are considered thin from a target demographic standpoint. Markets with little to no barriers to entry with below average income levels and target population growth. There is typically a large amount of undeveloped land surrounding the area for potential new development.
For nursing homes, this would include properties located in states with no CON regulations or moratoriums on additional CON-licensed beds. Non-core also includes facilities located in states where reimbursement for Medicaid is low, or with budgetary restraints.
Appendix
H1 2021U.S. SENIORS HOUSING & CARE INVESTOR SURVEY UPDATE
Disclaimer: Information contained herein, including projections, has been obtained from sources believed to be reliable. While we do not doubt its accuracy, we have not verified it and make no guarantee, warranty or representation about it. It is your responsibility to confirm independently its accuracy and completeness. This information is presented exclusively for use by CBRE clients and professionals and all rights to the material are reserved and cannot be reproduced without prior written permission of CBRE.
All COVID-19 related materials have been developed with information from the World Health Organization, Center for Disease Control & Prevention, and strategic suppliers pro-viding services in affected regions. They may not be suitable for application to all facilities or situations. Ultimately, occupiers and landlords must make their own strategic deci-sions for their individual stakeholders and workplaces. CBRE’s guidance is intended to initiate those discussions and expedite the process. We make no representations or warran-ties regarding the accuracy or completeness of this material. CBRE disclaims all liability arising from use of these materials by others.
James A. Graber, MAI Managing Director | National Practice Leader Seniors Housing & Healthcare+1 347 722 0225 [email protected]
Jordan R. Lee, MAI Vice President Seniors Housing & Healthcare
RJ DeBee IIIVice President Seniors Housing & Healthcare
Daniel Lincoln, MAI Director Seniors Housing & Healthcare+1 205 515 5985 [email protected]
Andy Kepchar, MAIVice President Seniors Housing & Healthcare
Anne Gompel, MAI Vice President Seniors Housing & Healthcare
CBRE Valuation & Advisory Services would like to express our sincere gratitude to all our clients and colleagues who participated in this survey.
To learn more about CBRE Seniors Housing Valuation & Advisory, please visit site at cbre.com/shvas
Project: Ventana CCRC by BucknerDallas, Texas
Architect: HKS Interior Design: IDA
Landscape: Talley Associates Photography: Sargent Photography
Valuation & Advisory Services