Embed Size (px)
Citation preview
Do Business Definition Decisions Distort
Small Business Research Results?
A Working Paper
by
Brian Headd and Radwan Saade Office of Advocacy
U.S. Small Business Administration
for
Release Date: August 2008
The statements, findings, conclusions, and recommendations found in this study are those of the authors and do not necessarily reflect the views of the Office of Advocacy, the United States Small
Business Administration, or the United States government.

ABSTRACT
The choice of business definition at the outset of research can drive results. Pooling different kinds
of businesses allows nonemployer businesses (which are numerous and small) to overwhelm
employer businesses (whose numbers are far fewer, but whose business activity is many times more
significant). A scan of special tabulations from the U.S. Census Bureau’s 2002 Survey of Business
Owners shows that nonemployer and employer businesses differ qualitatively, as do employer firms
and businesses of differing sizes.
We investigate how nonemployers and employers differ in number, receipts, industry, business
turnover, survival, and ownership characteristics. Cross-tabulations are presented for such business
characteristics as number of employees, receipt size, business age, veteran ownership, home-based,
franchise status, family-owned status, legal form of organization, geography, industry, and
financing.
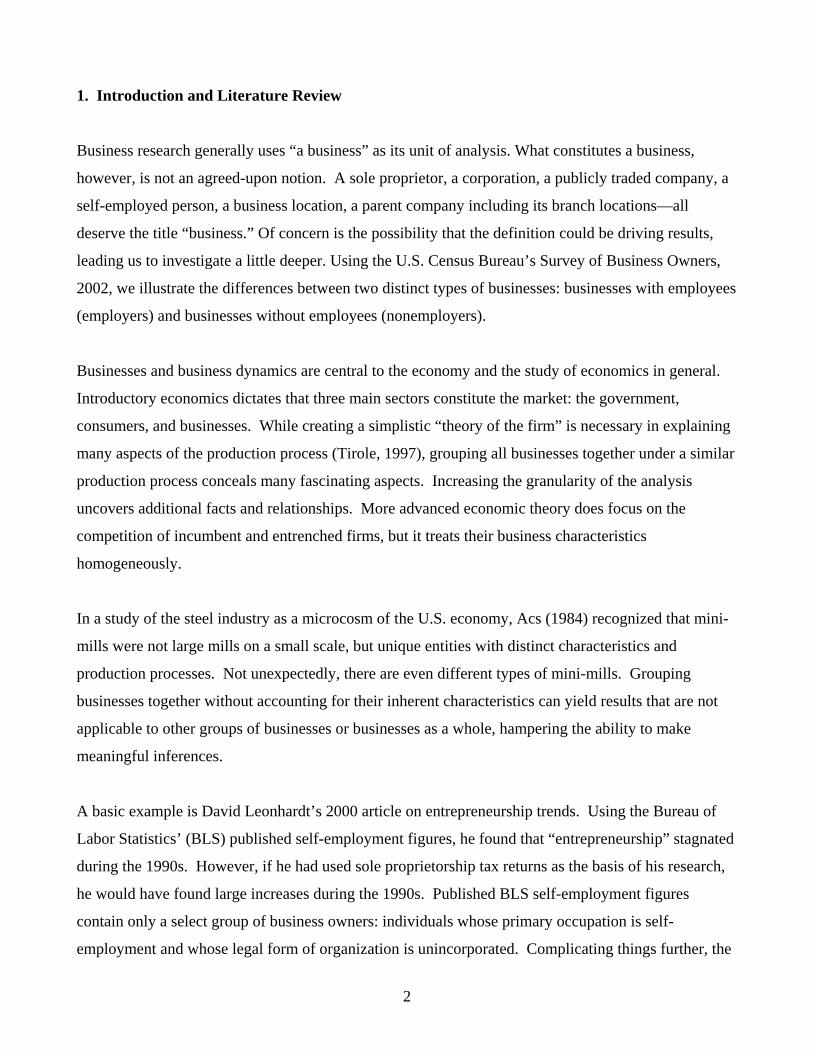
1. Introduction and Literature Review
Business research generally uses “a business” as its unit of analysis. What constitutes a business,
however, is not an agreed-upon notion. A sole proprietor, a corporation, a publicly traded company, a
self-employed person, a business location, a parent company including its branch locations—all
deserve the title “business.” Of concern is the possibility that the definition could be driving results,
leading us to investigate a little deeper. Using the U.S. Census Bureau’s Survey of Business Owners,
2002, we illustrate the differences between two distinct types of businesses: businesses with employees
(employers) and businesses without employees (nonemployers).
Businesses and business dynamics are central to the economy and the study of economics in general.
Introductory economics dictates that three main sectors constitute the market: the government,
consumers, and businesses. While creating a simplistic “theory of the firm” is necessary in explaining
many aspects of the production process (Tirole, 1997), grouping all businesses together under a similar
production process conceals many fascinating aspects. Increasing the granularity of the analysis
uncovers additional facts and relationships. More advanced economic theory does focus on the
competition of incumbent and entrenched firms, but it treats their business characteristics
homogeneously.
In a study of the steel industry as a microcosm of the U.S. economy, Acs (1984) recognized that mini-
mills were not large mills on a small scale, but unique entities with distinct characteristics and
production processes. Not unexpectedly, there are even different types of mini-mills. Grouping
businesses together without accounting for their inherent characteristics can yield results that are not
applicable to other groups of businesses or businesses as a whole, hampering the ability to make
meaningful inferences.
A basic example is David Leonhardt’s 2000 article on entrepreneurship trends. Using the Bureau of
Labor Statistics’ (BLS) published self-employment figures, he found that “entrepreneurship” stagnated
during the 1990s. However, if he had used sole proprietorship tax returns as the basis of his research,
he would have found large increases during the 1990s. Published BLS self-employment figures
contain only a select group of business owners: individuals whose primary occupation is self-
employment and whose legal form of organization is unincorporated. Complicating things further, the
2

BLS figures track the number of owners, not the number of business ventures or their economic
impact. U.S. Census figures on the number of business ventures, employers, and nonemployers also
reported a much higher increase during the 1990s than BLS’s self-employment numbers. Defining
entrepreneurship as self-employment created an incomplete picture.
The problem of defining a business is not unlike that of defining the subset of business owners referred
to as “entrepreneurs.” Although the definition of “entrepreneur” has not been established, it is not for
lack of trying (see Shane and Venkataraman, 2000 and, Brockhaus, 1980). But in the absence of an
agreed-upon definition, an accepted definition of “business” or “entrepreneur” remains elusive. The
availability of data has typically been the driver in coming up with standards, and the U.S. Census
Bureau’s relatively new annual employer and nonemployer business data are likely to become the de
facto definitions.1
The contrast between employers and nonemployers demonstrates the problems of business definition.
Employers and nonemployers inherently differ by business size. Nonemployers outnumber employers
by about 3 to 1. Most nonemployers are part-time operations, and they are a much simpler form of
organization. For a business to go from zero employees to one employee is often a significant leap in
organizational development, requiring a steady revenue stream, payroll accounting and more complex
tax requirements. In terms of economic impact, employer firms dominate; their total receipts are over
20 times the size of nonemployers’ receipts. In 2002, U.S. Census Bureau data counted 5.7 million
employers with $22 trillion in annual receipts and 17.6 million nonemployers with $770 billion in
receipts.
Generally held perceptions of nonemployers and employers differ as well. Thinking of a nonemployer
conjures up visions of spouses working from home, retirees enjoying a hobby, free agent consultants,
and nascent entrepreneurs tinkering in the garage. Thinking of a small employer conjures up visions of
mom-and-pop stores, restaurants, small construction companies, and small manufacturers. While these
stereotypes have kernels of truths, generalizing across millions of nonemployers and employers is
wrought with peril. What is clear however is that the trade associations representing nonemployers
and the trade associations representing employers differ in their focus. For instance, employer
1 With a few exceptions, “nonemployers” include all business tax returns that have $1,000 or more of receipts and no payroll; “employers” include all businesses that had payroll during the year. (For details see www.census.gov/epcd/nonemployer/view/covmeth.htm, and www.census.gov/epcd/susb/introusb.htm.)
3

associations tend to focus on workplace regulations and minimum wage issues while nonemployer
associations tend to focus on tax simplification.
To investigate the differences among employer and nonemployer firms, we use special tabulations
provided courtesy of the U.S. Census Bureau, with partial funding by the Office of Advocacy, U.S.
Small Business Administration.2 Thirteen tables are presented in the Appendix in three groupings: size
categories, business characteristics, and owner characteristics.
The remainder of the paper is organized as follows: Section 2 provides a brief history of the
availability of business data; Section 3 attempts to further delineate “business status”; Section 4
provides summaries of the tables based on the three groupings (size, business characteristics, and
owner characteristics); and Section 5 concludes. The Appendix contains the detailed tables.
2. History of Number of Businesses and Business Characteristics
There is no consensus on what constitutes a business, and by extension, on the number of businesses in
the United States. Surveying the general public, businesspersons, and policymakers on the number of
firms in the U.S. economy would produce interesting results. The differing answers would most likely
result from their differing opinions of what constitutes a business (e.g., a minimum amount of hours
worked by the owner, having employees, etc.) and a patchwork of data sources over the years.
Researchers have used differing definitions of businesses and entrepreneurs over the years. Recently,
Fairlie (2007) defined an entrepreneur as a newly self-employed person, for whom self-employment
was the primary occupation, incorporated or unincorporated, with 15 or more hours worked during the
week. Bates (1990) defined an entrepreneur as a non-minority male filing a business tax return
(excluding C-corporations), with $5,000 or more in annual sales, with capital invested in the business,
and a business age of less than six years. The seemingly idiosyncratic selection of criteria results from
the limits imposed by reliance on available data. For instance, even though entrepreneurs are of every
race, gender, and ethnic makeup, useful data series on all of these groups do not necessarily exist, so
research constructs may appear artificial or constrained. Fairlie and Bates produced solid research
2 The U.S. Census Bureau previously published a few publicly available reports from the Survey of Business Owners (U.S. Census Bureau, 2006a, 2006b) detailing owner and business characteristics.
4
results, but readers need to be cognizant of their definitions of business and/or entrepreneur when
comparing their results to those of similar studies.
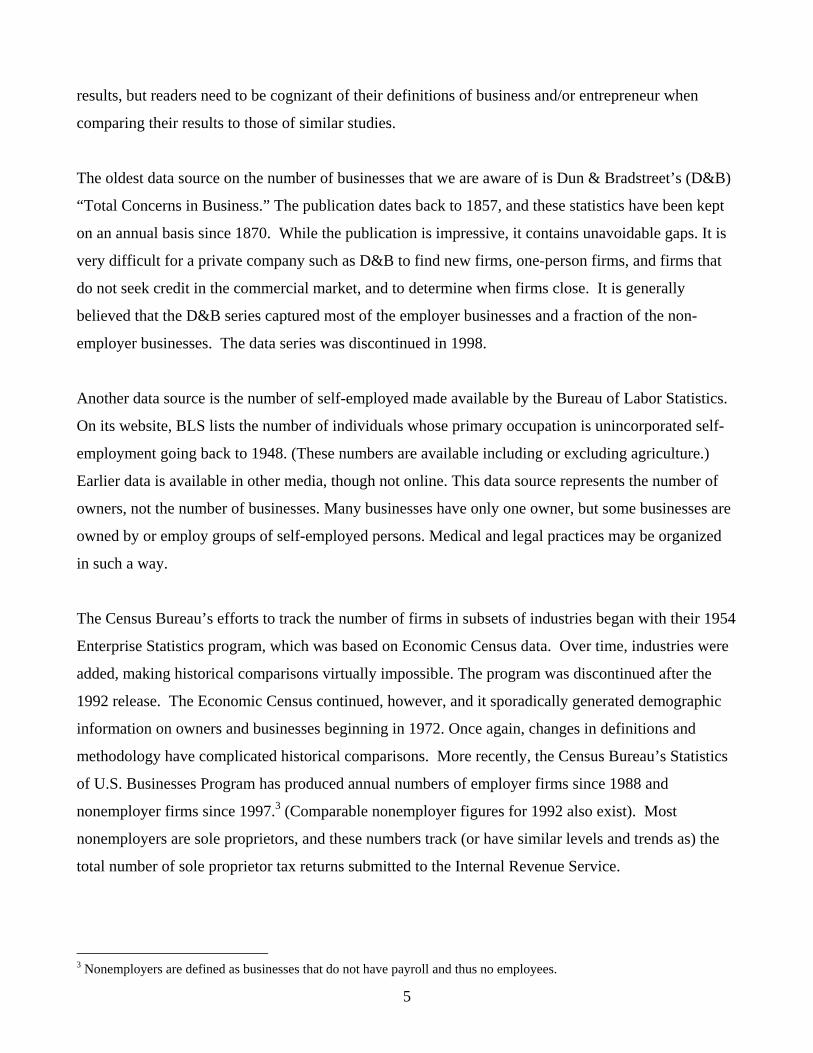
The oldest data source on the number of businesses that we are aware of is Dun & Bradstreet’s (D&B)
“Total Concerns in Business.” The publication dates back to 1857, and these statistics have been kept
on an annual basis since 1870. While the publication is impressive, it contains unavoidable gaps. It is
very difficult for a private company such as D&B to find new firms, one-person firms, and firms that
do not seek credit in the commercial market, and to determine when firms close. It is generally
believed that the D&B series captured most of the employer businesses and a fraction of the non-
employer businesses. The data series was discontinued in 1998.
Another data source is the number of self-employed made available by the Bureau of Labor Statistics.
On its website, BLS lists the number of individuals whose primary occupation is unincorporated self-
employment going back to 1948. (These numbers are available including or excluding agriculture.)
Earlier data is available in other media, though not online. This data source represents the number of
owners, not the number of businesses. Many businesses have only one owner, but some businesses are
owned by or employ groups of self-employed persons. Medical and legal practices may be organized
in such a way.
The Census Bureau’s efforts to track the number of firms in subsets of industries began with their 1954
Enterprise Statistics program, which was based on Economic Census data. Over time, industries were
added, making historical comparisons virtually impossible. The program was discontinued after the
1992 release. The Economic Census continued, however, and it sporadically generated demographic
information on owners and businesses beginning in 1972. Once again, changes in definitions and
methodology have complicated historical comparisons. More recently, the Census Bureau’s Statistics
of U.S. Businesses Program has produced annual numbers of employer firms since 1988 and
nonemployer firms since 1997.3 (Comparable nonemployer figures for 1992 also exist). Most
nonemployers are sole proprietors, and these numbers track (or have similar levels and trends as) the
total number of sole proprietor tax returns submitted to the Internal Revenue Service.
3 Nonemployers are defined as businesses that do not have payroll and thus no employees.
5

For several decades, the Economic Census focused on owner and business demographics in two
publications: the Survey of Women and Minority-Owned Businesses and the Characteristics of
Business Owners. These publications evolved over the years, and they are now published as the
Survey of Business Owners (SBO). The SBO contains information on owner demographics, home-
based businesses, franchises, exporting status, and veteran-ownership. No other data set tracks these
characteristics.
The data used to compare employers and nonemployers in this paper is from special tabulations of
SBO records.4 The SBO’s counts and definitions of employers and nonemployers are similar to the
Census Bureau’s more dedicated annual programs of business counts: the Statistics of U.S. Businesses
(SUSB) for employers and Nonemployer statistics.5 In these series, employers are defined as having
some annual payroll; nonemployers have no annual payroll. Both have $1,000 or more of annual sales.
The basic unit is the firm (i.e., the entire business), not the establishment (or business location).
However, the timing of their data production differs, resulting in differing figures. SBO found 5.52
million employers and 17.45 million nonemployers in 2002, while SUSB found 5.7 million and 17.65
million, respectively.6
The continuing data sources on businesses, such as the number of nonemployers, employer firms and
self-employed, differ in their definition of a business operation and thus differ in trend.7 Table 1
shows that nonemployers experienced high growth rates over the period analyzed, 1992 to 2005, while
employers and the self-employed grew at much lower rates. The trend differences below make clear
that aggregating businesses regardless of size introduces a bias and has the potential to skew the results
of analyses based on such data. For example, when employers and nonemployers are taken as a group
(Table 1) their growth trend corresponds to that of nonemployers, as they overwhelm employers in
number (by a 3-to-1 margin).
Using average sales per venture also corroborates the point that combining nonemployers and
employers can lead to misleading results. Table 2 shows the stark difference in the average sales of
nonemployers and employers. In 2002, nonemployers averaged $47,400 in annual sales, while 4 Figures were adjusted for nonresponse. 5 SUSB and Nonemployer data can be found at www.sba.gov/advo/research/data.html. 6 The authors would like to recognize the efforts of Valerie C. Strang of the U.S. Census Bureau for producing the special tabulations. 7 See U.S. Small Business Administration (2005), Chapter 1, for a comparison of nonemployers and the self-employed.
6

employers averaged $4.2 million. However, their trends were similar with both having larger increases
from 1992 to 1997 than 1997 to 2002. Viewing the combined or total percent change of average
receipts indicates an opposite trend, a decline from 1997 to 2002. This is because the number of
nonemployers grew faster than the number employers from 1997 to 2002.
Table 1: Number of Firms, 1992 to 2005 (millions; percent)
Year 1992 1997 2002 2003 2004 2005 Percent Change
1992-2002 2002-2005 Employers plus Nonemployers 19.43 20.98 23.35 24.42 25.41 26.38 20.2 13.0 Employer Firms 5.10 5.54 5.70 5.77 5.89 5.98 11.8 4.9Nonemployers 14.33 15.44 17.65 18.65 19.52 20.39 23.2 15.5 Self-Employed Persons 8.58 9.06 8.92 9.34 9.47 9.51 4.0 6.6Business Tax Returns 20.85 23.65 26.43 27.49 28.7 29.51 26.8 11.7 Non-farm figures. Sources: U.S. Department of Commerce, Bureau of the Census (SUSB and Nonemployers), U.S. Department of Labor, Bureau of Labor Statistics, and U.S. Department of the Treasury, Internal Revenue Service.
Table 2: Average Receipts of Nonemployers, Employers, and Combined Groups, 1992 – 2005 ($000, 2005 dollars; percent)
Year 1992 1997 2002 2005 Percent Change
1992-1997 1997-2002 2002-2005 Total 999.9 1,092.0 1,061.8 NA 9.2 –2.8 NA
Nonemployers 43.4 46.2 47.4 46.6 6.4 2.5 –1.5
Employers 3,720.6 4,005.5 4,203.6 NA 7.7 4.9 NASource: U.S. Department of Commerce, Bureau of the Census, Statistics of U.S. Businesses, Nonemployer Statistics, Survey of Minority-Owned Business Enterprises Summary, 1992 C-Corporation figures.
3. Business Size Caveat
Business size is not static. Some nonemployers grow to become employers, and some employers
shrink into nonemployers. Firm evolution is a tricky issue for researchers trying to pinpoint a
business’s start year and for census takers trying to get an accurate count of new businesses.
Determining firms’ start years has been problematic in data sources. There is significant potential for
mislabeling an entity as a new firm when in fact it is not. A so-called “new employer firm” may be the
reincarnation of an existing firm, a firm that has been on hiatus for a time, or a nonemployer that has
expanded. This issue is borne out in the comparison of differing data sources.
7

Table 3: Firm Counts for Select Types of Businesses, 2002 Employer firms Amount Percent
Nonemployer firms Amount Percent
Total 5,524,784 100.0 17,449,871 100.0 Home-based 1,259,088 22.8 10,645,910 61.0 Franchises 208,975 3.8 252,197 1.4 Exporters 104,680 1.9 249,010 1.4 New (started in 2002) 275,583 5.0 2,689,812 15.4 Sole proprietors 1,093,907 19.8 15,094,138 86.5 Note: Percentages may total more than 100 because businesses may belong to more than one category. Source: U.S. Department of Commerce, Bureau of the Census, Survey of Business Owners, special tabulations.
The U.S. Census Bureau’s SUSB shows that 11 percent of employer firms were new in 2002, but in
the SBO the figure is 5 percent. (For the SBO, owners of employer firms are asked what year the firm
started.) A similar discrepancy exists among nonemployers. The Census Bureau’s nonemployer
statistics report that 34.8 percent of businesses were new in 2002 (special tabulations from the U.S.
Census Bureau), while the SBO data in Table 6e shows 15.4 percent of business were new (2.69
million divided by 17.45 million).
The employer result is not surprising. Davis et. al. (2007), in undertaking a huge effort to link internal
U.S. Census microdatabases, show the prevalence of new employer firms starting as nonemployer
firms. But the nonemployer discrepancy above gives one the impression that nonemployers tend to go
on hiatus and are classified as new firms after waking from hibernation.
4. Firm Differences
To indicate that employers and nonemployers represent different types of businesses, Tables 3 and 4
show business and owner characteristics for the two groups.8 (These tables summarize the detailed
tables in the Appendix.)
8 While the tables were based on a survey of 1.86 million responding firms and the survey had a response rate of 81 percent, caution should be used when considering some of the smaller figures and the precision of the figures in the tables. See www.census.gov/econ/census02/text/sbo/sbomethodology.htm for details of the data methodology and limitations.
8
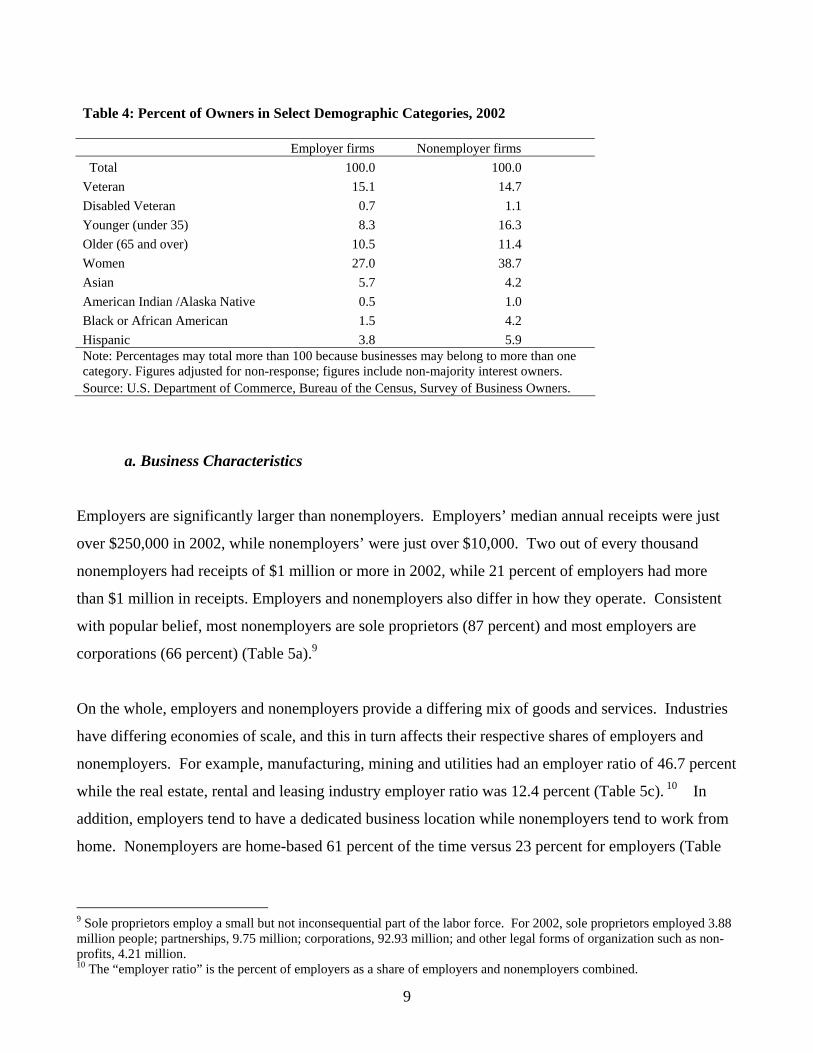
Table 4: Percent of Owners in Select Demographic Categories, 2002 Employer firms Nonemployer firms Total Veteran Disabled Veteran Younger (under 35) Older (65 and over) Women Asian American Indian /Alaska Native Black or African American Hispanic
100.0 15.1
0.7 8.3
10.5 27.0
5.7 0.5 1.5
3.8
100.0 14.7
1.1 16.3 11.4 38.7
4.21.0 4.2 5.9
Note: Percentages may total more than 100 because businesses may belong to more than one category. Figures adjusted for non-response; figures include non-majority interest owners. Source: U.S. Department of Commerce, Bureau of the Census, Survey of Business Owners.
a. Business Characteristics
Employers are significantly larger than nonemployers. Employers’ median annual receipts were just
over $250,000 in 2002, while nonemployers’ were just over $10,000. Two out of every thousand
nonemployers had receipts of $1 million or more in 2002, while 21 percent of employers had more
than $1 million in receipts. Employers and nonemployers also differ in how they operate. Consistent
with popular belief, most nonemployers are sole proprietors (87 percent) and most employers are
corporations (66 percent) (Table 5a).9
On the whole, employers and nonemployers provide a differing mix of goods and services. Industries
have differing economies of scale, and this in turn affects their respective shares of employers and
nonemployers. For example, manufacturing, mining and utilities had an employer ratio of 46.7 percent
while the real estate, rental and leasing industry employer ratio was 12.4 percent (Table 5c). 10 In
addition, employers tend to have a dedicated business location while nonemployers tend to work from
home. Nonemployers are home-based 61 percent of the time versus 23 percent for employers (Table
9 Sole proprietors employ a small but not inconsequential part of the labor force. For 2002, sole proprietors employed 3.88 million people; partnerships, 9.75 million; corporations, 92.93 million; and other legal forms of organization such as non-profits, 4.21 million. 10 The “employer ratio” is the percent of employers as a share of employers and nonemployers combined.
9

6a). Being home-based seems very much a function of industry as some industries need a storefront
while others do not.
Employers and nonemployers do have a few things in common. Both groups have a low percentage of
exporters (firms that make 10 percent or more of sales abroad). Only 1.9 percent of employers and 1.4
percent of nonemployers were exporters. Franchises also tended to be a small percentage of both
employers (4 percent) and nonemployers (1 percent).
Interestingly, with regard to the year that employer and non-employer franchises combined were
acquired, they were 2 percent of all firms in each of the “year acquired” categories (Table 6a).
Franchises having the same age distribution as firms on the whole gives the impression that franchises
have survival rates similar to non-franchises. This has been a contentious issue for the past few
decades. There is a temptation to analyze employer and nonemployer categories separately for age
distributions, but the “business size” caveat mentioned above could cause issues. That is, some firms
might start as nonemployers and expand to become employers while some firms might start as
employers and shrink to become nonemployers. This is a good example of where definitions could
drive results.
Focusing on geography, the ratio of employer and nonemployer firms was similar across states.
Delaware had the highest employer ratio at 30.8 percent and Texas had the lowest, at 20.9 percent.
The most populous states tended to have lower employer ratios (i.e., a relatively large proportion of
nonemployers); the less populous states tended to have higher employer ratios (Table 5b).11
b. Owner Characteristics
The single characteristic that most differentiates nonemployers and employers is the solo versus team
aspect of the venture. Employers were single owners 38.5 percent of the time, while nonemployers
were single owners 59.5 percent of the time. For firms with multiple owners, the bulk of both
employer and nonemployer owners considered their firms to be family businesses (64.4 percent and
78.6 percent, respectively). A surprising relationship emerged with regard to multiple owners, owner
11 This is most likely the result of multi-state employer firms being a larger share of employers in smaller states. The “employer ratio” is the percent of employers as a share of employers and nonemployers combined.
10

age and employer/nonemployer status. For employers, younger owners (under age 35) represented a
below average share of single owners (34 percent versus 38.5 percent), while older owners (65 or over)
were much higher (59.6 percent). For nonemployers, the opposite was true. Younger nonemployers
were single owners 68.8 percent of the time, older nonemployers 52.2 percent, and nonemployers in
general were 59.5 percent. Most younger owners, 54 percent, started their employer firm in the last
four years, while only 7 percent of older owners did. This held up for nonemployers also (Table 7a).
Veteran owners’ firm size distribution was similar to that of the United States as a whole. They
virtually matched the universe in size, state, and industry distributions. Disabled veterans tended to
have similar industry and state distributions as the universe, but they tended to own smaller ventures.
Women, Hispanics, black/African American, and American Indian/Alaska Native business owners had
higher shares of nonemployer firms than the U.S. as a whole. Asians had a larger share of employer
firm owners than the overall distribution. (These observations are based on previously published
Census Bureau data: www.census.gov/csd/sbo/charcbotable_a.xls).
c. Financing
Given their different business characteristics (size and industry mix) and owner characteristics (age
distributions), it is not surprising that employers and nonemployers have differing financing needs.
But similarities certainly exist also.
Table 6d covers the spectrum of possibilities. While the bulk of new firms used start-up financing, for
most, little of it was from outside sources. For nonemployers, 54 percent used personal and/or family
savings, while 34 percent did not use start-up capital. For employers, the figures were 67 percent and
12 percent, respectively. The share of employers who relied on start-up capital in 2002 is similar for
all firms and new firms, creating the impression that using start-up capital is not a significant factor in
distinguishing between the categories. There was a similar finding for nonemployers.
After start-up, some firms used expansion financing, but the bulk of employers and nonemployers did
not seek expansion capital (54 and 63 percent respectively).
11

The source of funds differed for employers and nonemployers. Employers were much more likely than
nonemployers to rely on bank business loans for both start-up capital and expansion capital. Contrary
to conventional wisdom, outside investors were used more for start-up than expansion, and credit cards
were used more for expansion. This held up for both employers and nonemployers.
Franchises and home-based businesses’ financing needs are somewhat different from other businesses.
Franchises can rely upon their franchisor for financing. Home-based firms may not need as much
financing as other firms.
For expansion financing, franchises had a similar financing pattern as the universe of firms. However
at start-up, franchises were more likely to use a bank loan (38 percent for franchises versus 23 percent
for all businesses). Franchise employers and nonemployers had similar financing patterns except for
nonemployers’ lower rates of using any financing and using bank loans.
Home-based and non-home-based nonemployers had similar financing patterns, except non-home-
based employers were more likely to use bank loans. Other than being more likely to use financing,
exporting and non-exporting nonemployers showed reasonably similar financing patterns as the
universe of businesses. This finding also held for employers.
Veteran-owned businesses had similar financing patterns as non-veteran-owned businesses. Businesses
owned by service-disabled veterans tended to favor credit cards for start-up and expansion financing.
Credit card usage differed by age of owner. For employer and nonemployer firms’ start-up and
expansion financing, younger owners had higher credit card usage than the total, while older owners
had lower credit card usage.
5. Conclusion
From a data perspective, the cross-tabulations presented in the Appendix and discussed in the paper
add considerable value to the existing body of data on small business. The information they provide
on home-based businesses is particularly important since the latest installment of such data prior to the
2002 Survey of Business Owners was the 1992 Characteristics of Business Owners. In addition, the
12

new questions that were added to the 2002 Survey of Business Owners have allowed us to document
businesses owned by veterans and service-disabled veterans.
While it is difficult to aggregate businesses across all industries, the special tabulations from the U.S.
Census Bureau of the Survey of Business Owners show that a typical nonemployer differs from a
typical employer business. As one would imagine, many of the differences seemed to be from the
tendency for employers to be bigger entities than nonemployers. Employers had higher average sales,
shares of corporations, higher incidences of multiple owners and more reliance on financing than
nonemployers.
The number of businesses based on different definitions (e.g. total businesses, employers,
nonemployers, or self-employed) has had different levels and trends over the past decade. In addition,
the types of businesses that make up the bulk of employers and nonemployers differ not only in size,
but also in who they are, and how they operate.
Researchers need to make clear which group of business they are studying when conducting small
business research, as the results may not be applicable to other subgroups of small businesses or to the
whole. The discussion in this paper establishes this notion and further validates the conclusion that
whether it be for the characterization of small businesses in general or for the evaluation of regulatory
impact on small business, a clear choice has to be made as to the realm of small businesses under
consideration.
13

References
Acs, Zoltan, 1984. The Changing Structure of the U.S. Economy: Lessons from the Steel Industry, Praeger Publishers, New York. Bates, Timothy, 1990. “Entrepreneur Human Capital Inputs and Small Business Longevity,” The Review of Economics and Statistics, vol. 72, no. 4, pp. 551-559. Brockhaus, Robert H. Sr., 1980. “Risk Taking Propensity of Entrepreneurs,” The Academy of Management Journal, vol. 23, no. 3, pp. 509-520. Davis, Stephen, John Haltiwanger, Ron S. Jarmin, C.J. Krizan, Javier Miranda, Alfred Nucci and Kristin Sandusky, 2007. Measuring the Dynamics of Young and Small Businesses: Integrating the Employer and Nonemployer Universes, NBER working paper 13226, July 2007. Fairlie, Robert, 2007. Entrepreneurship in Silicon Valley During the Boom and Bust, Office of Advocacy, U.S. Small Business Administration (www.sba.gov/advo/research/rs296.pdf). Leonhardt, David, 2000. “Entrepreneurs’ ‘Golden Age’ Is Fading in Economic Boom,” New York Times, December 1. Shane, Scott and S. Venkataraman, 2000. “The Promise of Enterpreneurship as a Field of Research,” The Academy of Management Review, vol. 25, no. 1, pp. 217-226. Tirole, Jean, 1997. The Theory of Industrial Organization, The MIT Press, Cambridge, Massachusetts. U.S. Department of Commerce, Bureau of the Census, 2006a. Characteristics of Businesses: 2002, (www.census.gov/prod/ec02/sb0200cscb.pdf). U.S. Department of Commerce, Bureau of the Census, 2006b. Characteristics of Business Owners: 2002, (www.census.gov/prod/ec02/sb0200cscbo.pdf). U.S. Small Business Administration, Office of Advocacy, 2005. The Small Business Economy, 2005: A Report to the President, (www.sba.gov/advo/research/sbe.html).
14

Appendix Tables
Employers and Nonemployers:
Table 5a: Employers and Nonemployers by Firm Size, 2002 .............................................................. 17
Table 5b: Employers and Nonemployers by State, 2002 ..................................................................... 18
Table 5c: Employers and Nonemployers by Major Industry, 2002...................................................... 19
Table 5d: Cross-Tabulation of Employment Size of Firm and Receipt Size of Firm, 2002 ................ 20
Number of Businesses:
Table 6a: Number of Businesses by Business Characteristics and Firm-Size
Related Variables, 2002 ....................................................................................................... 21
Table 6b: Number of Businesses by Business Characteristics and Geographic Area, 2002................ 22
Table 6c: Number of Businesses by Business Characteristics, Major Industry and Customer, 2002.. 24
Table 6d: Number of Businesses by Business Characteristics and Finance Type, 2002 ..................... 25
Table 6e: Cross-Tabulation of Number of Businesses by Firm-Size Related Variables, 2002............ 26
Owner Characteristics:
Table 7a: Owner Characteristics by Firm-Size Related Variables, 2002 ............................................. 27
Table 7b: Owner Characteristics by Geographic Area, 2002 ............................................................... 28
Table 7c: Owner Characteristics by Major Industry, 2002................................................................... 30
Table 7d: Owner Characteristics by Finance Type, 2002..................................................................... 31
15

Table 5a: Employers and Nonemployers by Firm Size, 2002
Employer firms Nonemployer firms Employer Ratio
Total
Employment size of firmNonemployers0 *1-45-910-1920-99100-249250+
Receipt size of firm< $10,000 $10,000 to $49,999 $50,000 to $99,999 $100,000 to $249,999 $250,000 to $999,999 $1 million to $4.9 million $5 million +
Legal form of organizationCorporations (including tax-exempt corp.)PartnershipsSole proprietorsOther
5,524,784
0810,950
2,600,314948,715581,596484,857
60,77337,579
121,053534,004627,518
1,283,7401,798,618
872,916286,935
3,646,357453,032
1,093,907331,487
17,449,871
17,449,8710000000
7,574,3106,373,6061,759,9311,199,885
515,48026,659
0 **
1,064,4421,081,892
15,094,138191,949
24.0
0.0100.0100.0100.0100.0100.0100.0100.0
1.67.7
26.351.777.797.0
100.0
77.429.5
6.863.3
* Firms with annual payroll but no employees on March 12, 2002.** Nonemployers with receipts in this size class were believed to be misclassified and therefore were notclassified as nonemployers.Note: The employer ratio is the percentage of employers as a share of employers and nonemployers combined.
Source: Office of Advocacy, U.S. Small Business Administration, from special tabulations of U.S. Census Bureau, Survey of Business Owner data.
17

Table 5b: Employers and Nonemployers by State, 2002
Employer firms Nonemployer firms Employer Ratio
Total 5,524,784 17,449,871 24.0
Alabama 74,827 234,717 24.2Alaska 15,548 46,597 25.0Arizona 94,613 286,567 24.8Arkansas 49,988 159,022 23.9California 673,401 2,235,357 23.2Colorado 117,062 347,920 25.2Connecticut 75,328 226,243 25.0Delaware 19,589 43,981 30.8District of Columbia 13,515 33,657 28.7Florida 360,179 1,179,028 23.4Georgia 158,665 515,856 23.5Hawaii 23,517 75,707 23.7Idaho 33,106 88,454 27.2Illinois 244,352 713,768 25.5Indiana 109,771 324,136 25.3Iowa 62,314 174,201 26.3Kansas 58,804 160,574 26.8Kentucky 68,736 231,949 22.9Louisiana 78,420 250,336 23.9Maine 33,676 101,734 24.9Maryland 104,106 339,434 23.5Massachusetts 142,507 421,032 25.3Michigan 185,739 549,792 25.3Minnesota 113,797 330,030 25.6Mississippi 45,630 141,972 24.3Missouri 115,163 324,322 26.2Montana 28,248 72,154 28.1Nebraska 40,224 105,156 27.7Nevada 42,176 127,329 24.9New Hampshire 31,760 93,628 25.3New Jersey 199,426 509,411 28.1New Mexico 34,500 102,211 25.2New York 414,480 1,292,688 24.3North Carolina 157,986 484,611 24.6North Dakota 16,645 40,136 29.3Ohio 201,515 616,178 24.6Oklahoma 67,427 224,183 23.1Oregon 83,217 216,288 27.8Pennsylvania 226,585 647,670 25.9Rhode Island 24,780 62,666 28.3South Carolina 75,352 217,632 25.7South Dakota 20,158 49,378 29.0Tennessee 96,113 358,253 21.2Texas 363,331 1,371,178 20.9Utah 49,192 143,811 25.5Vermont 18,485 53,836 25.6Virginia 136,042 393,478 25.7Washington 135,590 331,700 29.0West Virginia 30,787 82,300 27.2Wisconsin 112,589 280,652 28.6Wyoming 16,145 36,958 30.4
Note: The employer ratio is the percentage of employers as a share of employers and nonemployers combined.
Source: Office of Advocacy, U.S. Small Business Administration, from special tabulations of U.S. Census Bureau, Survey of Business Owner data.
18

Table 5c: Employers and Nonemployers by Major Industry, 2002
Employer firms Nonemployer firms Employer Ratio
Total 5,524,784
Forestry, fish. and hunt. & ag. support srvs. 29,250Mining 19,324Utilities 6,223Construction 729,842Manufacturing 310,821Wholesale trade 347,319Retail trade 745,872Transportation and warehousing 167,865Information 76,443Finance and insurance 241,120Real estate and rental and leasing 266,161Professional, scientific, and technical srvcs. 727,893Management of companies and enterprises 28,351Admin. & support & waste mngt. & rem. srvs. 305,462Educational services 65,251Health care and social assistance 564,299Arts, entertainment, and recreation 103,824Accommodation and food services 434,441Other services (except public administration) 392,656Industries not classified 29,593
Note: The employer ratio is the percentage of employers as a share
Source: Office of Advocacy, U.S. Small Business Administration, froBureau, Survey of Business Owner data.
19
17,449,871
220,04082,70512,673
2,050,481290,360363,764
1,838,817808,961232,674660,248
1,879,9932,552,734
01,262,583
344,4731,456,816
865,917241,675
2,284,9570
of employers and nonemployers combined.
m special tabulations of
24.0
11.718.932.926.351.748.828.917.224.726.812.422.2
100.019.515.927.910.764.314.7
100.0
U.S. Census
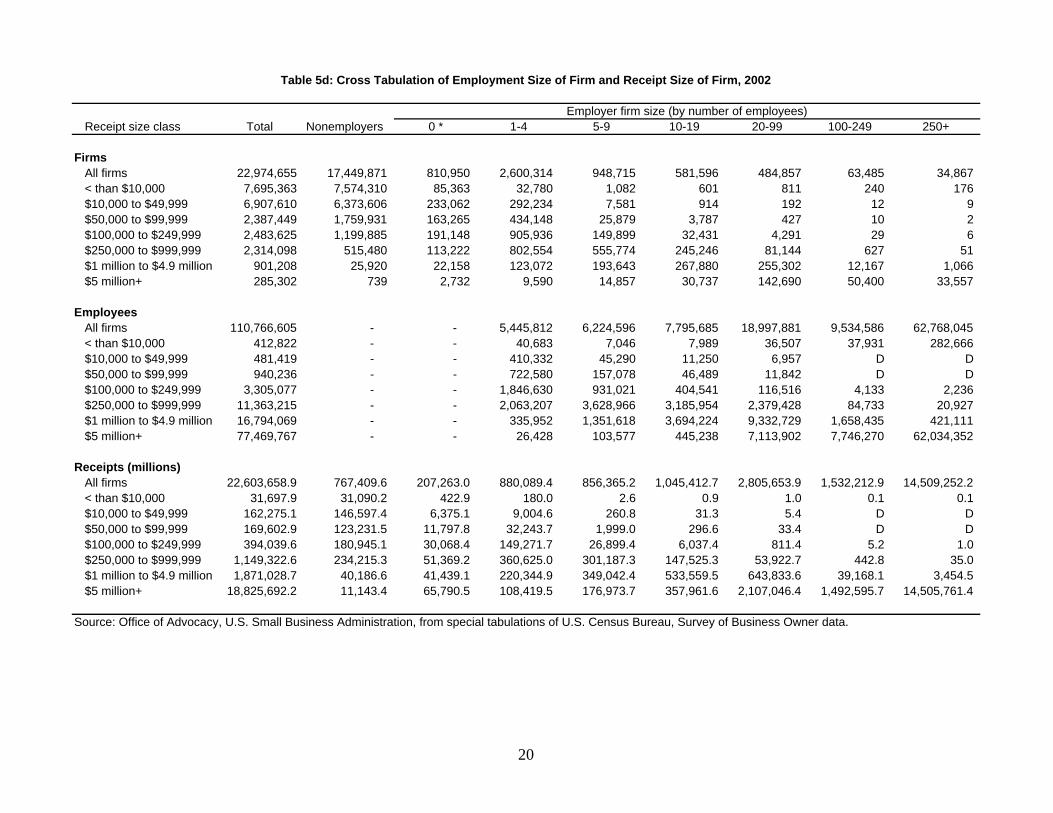
Table 5d: Cross Tabulation of Employment Size of Firm and Receipt Size of Firm, 2002
Receipt size class Total NonemployersEmployer firm size (by number of employees)
0 * 1-4 5-9 10-19 20-99 100-249 250+
FirmsAll firms< than $10,000$10,000 to $49,999$50,000 to $99,999$100,000 to $249,999$250,000 to $999,999$1 million to $4.9 million$5 million+
EmployeesAll firms< than $10,000$10,000 to $49,999$50,000 to $99,999$100,000 to $249,999$250,000 to $999,999$1 million to $4.9 million$5 million+
Receipts (millions)All firms< than $10,000$10,000 to $49,999$50,000 to $99,999$100,000 to $249,999$250,000 to $999,999$1 million to $4.9 million$5 million+
22,974,655 7,695,363 6,907,610 2,387,449 2,483,625 2,314,098 901,208 285,302
110,766,605 412,822 481,419 940,236 3,305,077 11,363,215 16,794,069 77,469,767
22,603,658.9 31,697.9 162,275.1 169,602.9 394,039.6 1,149,322.6 1,871,028.7 18,825,692.2
17,449,871 7,574,310 6,373,606 1,759,931 1,199,885
515,480 25,920
739
- - - - - - - -
767,409.6 31,090.2
146,597.4 123,231.5 180,945.1 234,215.3
40,186.6 11,143.4
810,950 85,363
233,062 163,265 191,148 113,222
22,158 2,732
- - - - - - - -
207,263.0 422.9
6,375.1 11,797.8 30,068.4 51,369.2 41,439.1 65,790.5
2,600,314 32,780
292,234 434,148 905,936 802,554 123,072
9,590
5,445,812 40,683
410,332 722,580
1,846,630 2,063,207
335,952 26,428
880,089.4 180.0
9,004.6 32,243.7
149,271.7 360,625.0 220,344.9 108,419.5
948,715 1,082 7,581
25,879 149,899 555,774 193,643
14,857
6,224,596 7,046
45,290 157,078 931,021
3,628,966 1,351,618
103,577
856,365.2 2.6
260.8 1,999.0
26,899.4 301,187.3 349,042.4 176,973.7
581,596 601 914 3,787 32,431 245,246 267,880 30,737
7,795,685 7,989 11,250 46,489 404,541 3,185,954 3,694,224 445,238
1,045,412.7 0.9 31.3 296.6 6,037.4 147,525.3 533,559.5 357,961.6
484,857 811 192 427 4,291 81,144 255,302 142,690
18,997,881 36,507 6,957 11,842 116,516 2,379,428 9,332,729 7,113,902
2,805,653.9 1.0 5.4 33.4 811.4 53,922.7 643,833.6 2,107,046.4
63,485 240 12 10 29 627 12,167 50,400
9,534,586 37,931
DD
4,133 84,733 1,658,435 7,746,270
1,532,212.9 0.1
DD
5.2 442.8 39,168.1 1,492,595.7
34,867 176 9 2 6 51 1,066 33,557
62,768,045 282,666
DD
2,236 20,927 421,111 62,034,352
14,509,252.2 0.1
DD
1.0 35.0 3,454.5 14,505,761.4
Source: Office of Advocacy, U.S. Small Business Administration, from special tabulations of U.S. Census Bureau, Survey of Business Owner data.
20
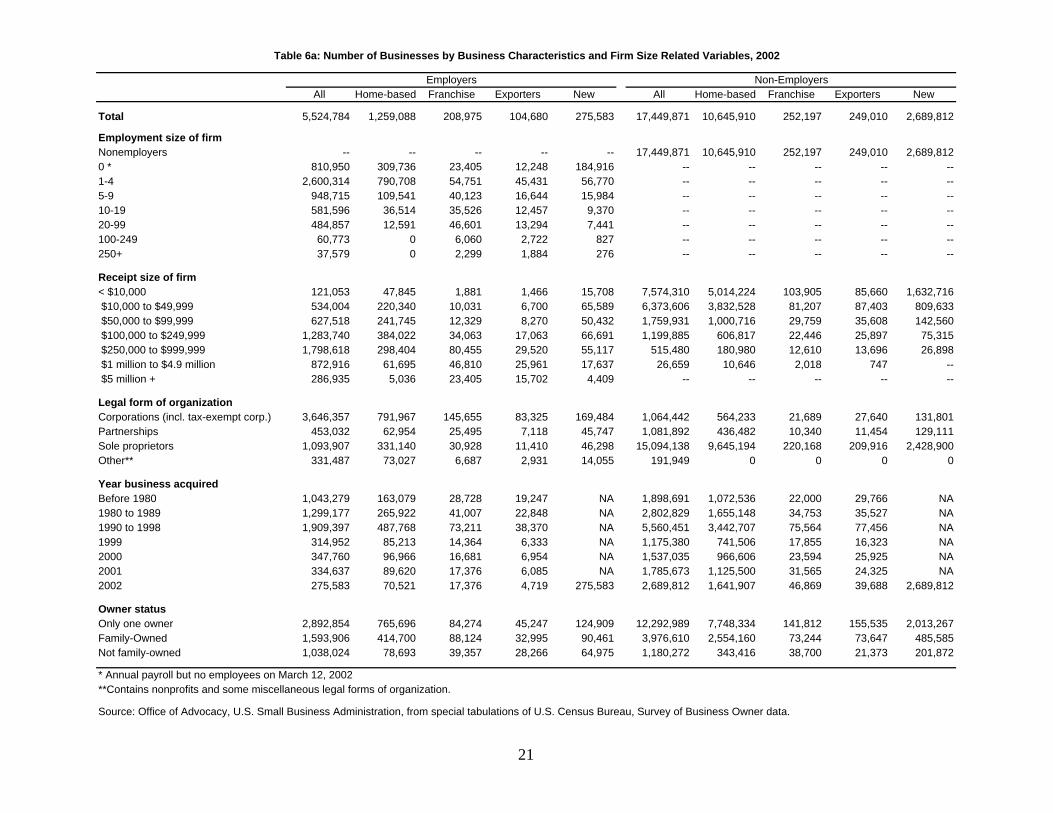
Table 6a: Number of Businesses by Business Characteristics and Firm Size Related Variables, 2002
AllEmployers Non-Employers
Home-based Franchise Exporters New All Home-based Franchise Exporters New
Total
Employment size of firmNonemployers0 *1-45-910-1920-99100-249250+
Receipt size of firm< $10,000 $10,000 to $49,999 $50,000 to $99,999 $100,000 to $249,999 $250,000 to $999,999 $1 million to $4.9 million $5 million +
Legal form of organizationCorporations (incl. tax-exempt corp.)PartnershipsSole proprietorsOther**
Year business acquiredBefore 19801980 to 19891990 to 19981999200020012002
Owner statusOnly one ownerFamily-OwnedNot family-owned
5,524,784
--810,950
2,600,314948,715581,596484,85760,77337,579
121,053534,004627,518
1,283,7401,798,618
872,916286,935
3,646,357453,032
1,093,907331,487
1,043,2791,299,1771,909,397
314,952347,760334,637275,583
2,892,8541,593,9061,038,024
1,259,088
--309,736790,708109,54136,51412,591
00
47,845220,340241,745384,022298,40461,6955,036
791,96762,954
331,14073,027
163,079265,922487,76885,21396,96689,62070,521
765,696414,70078,693
208,975
--23,40554,75140,12335,52646,6016,0602,299
1,88110,03112,32934,06380,45546,81023,405
145,65525,49530,9286,687
28,72841,00773,21114,36416,68117,37617,376
84,27488,12439,357
104,680
--12,24845,43116,64412,45713,2942,7221,884
1,4666,7008,270
17,06329,52025,96115,702
83,3257,118
11,4102,931
19,24722,84838,3706,3336,9546,0854,719
45,24732,99528,266
275,583
--184,91656,77015,9849,3707,441
827276
15,70865,58950,43266,69155,11717,6374,409
169,48445,74746,29814,055
NANANANANANA
275,583
124,90990,46164,975
17,449,871
17,449,871--------------
7,574,3106,373,6061,759,9311,199,885
515,48026,659
--
1,064,4421,081,892
15,094,138191,949
1,898,6912,802,8295,560,4511,175,3801,537,0351,785,6732,689,812
12,292,9893,976,6101,180,272
10,645,910
10,645,910--------------
5,014,2243,832,5281,000,716
606,817180,98010,646
--
564,233436,482
9,645,1940
1,072,5361,655,1483,442,707
741,506966,606
1,125,5001,641,907
7,748,3342,554,160
343,416
252,197
252,197--------------
103,90581,20729,75922,44612,6102,018
--
21,68910,340
220,1680
22,00034,75375,56417,85523,59431,56546,869
141,81273,24438,700
249,010
249,010--------------
85,66087,40335,60825,89713,696
747--
27,64011,454
209,9160
29,76635,52777,45616,32325,92524,32539,688
155,53573,64721,373
2,689,812
2,689,812--------------
1,632,716809,633142,56075,31526,898
----
131,801129,111
2,428,9000
NANANANANANA
2,689,812
2,013,267485,585201,872
* Annual payroll but no employees on March 12, 2002**Contains nonprofits and some miscellaneous legal forms of organization.
Source: Office of Advocacy, U.S. Small Business Administration, from special tabulations of U.S. Census Bureau, Survey of Business Owner data.
21

Table 6b: Number of Businesses by Business Characteristics, Metropolitan Location and State, 2002
AllEmployers Non-Employers
Home-based Franchise Exporters New All Home-based Franchise Exporters New
Total
Geographic concentrationNot within a metro/micro areaWithin a metro/micro area
StateAlabamaAlaskaArizonaArkansasCaliforniaColoradoConnecticutDelawareDistrict of ColumbiaFloridaGeorgiaHawaiiIdahoIllinoisIndianaIowaKansasKentuckyLouisianaMaineMarylandMassachusettsMichiganMinnesotaMississippiMissouriMontanaNebraskaNevadaNew HampshireNew JerseyNew MexicoNew YorkNorth CarolinaNorth Dakota
5,524,784
394,7695,149,141
74,82715,54894,61349,988
673,401117,06275,32819,58913,515
360,179158,66523,51733,106
244,352109,77162,31458,80468,73678,42033,676
104,106142,507185,739113,79745,630
115,16328,24840,22442,17631,760
199,42634,500
414,480157,98616,645
1,259,088
96,9501,162,139
11,3323,777
25,1828,814
127,16837,77315,1093,7771,259
81,84136,5143,777
10,07357,91827,70015,10913,85013,85012,59110,07328,95927,70044,06836,5146,295
27,7007,555
10,0737,5558,814
42,8097,555
69,25039,0323,777
208,975
17,554193,092
3,135209
3,5533,135
21,7334,5972,508
627209
9,6136,060
8361,2549,6135,2243,1352,7173,3442,7171,0453,3443,7627,3145,4332,0905,0151,2541,6721,463
8365,6421,4639,6136,2691,045
104,680
6,07199,341
942419
1,780628
19,5751,9891,780
419314
11,9342,826
628628
4,3971,6751,047
942837
1,256523
1,7803,4543,0361,989
4191,780
419733733733
4,397628
8,2702,303
209
22
275,583
19,015256,843
3,583551
5,5123,031
30,5907,4412,756
827276
19,2918,819
8271,929
11,0235,7873,0312,7563,0313,5831,6534,6855,7878,8196,6142,4806,3381,6531,9292,4802,2057,9921,653
15,7087,992
827
17,449,871
1,233,54416,216,327
234,71746,597
286,567159,022
2,235,357347,920226,24343,98133,657
1,179,028515,85675,70788,454
713,768324,136174,201160,574231,949250,336101,734339,434421,032549,792330,030141,972324,32272,154
105,156127,32993,628
509,411102,211
1,292,688484,61140,136
10,645,910
809,0899,836,821
127,75131,938
191,62695,813
1,288,155255,502149,04331,93821,292
617,463298,08553,23063,875
425,836223,564127,751117,105138,397127,75174,521
223,564266,148383,253255,50274,521
223,56453,23074,52163,87574,521
276,79463,875
628,109308,73131,938
252,197
13,871238,326
3,279252
4,5402,522
29,7594,5402,774
757252
16,6457,0621,0091,513
12,1055,5482,5222,0182,7743,5311,0095,0445,0448,3235,0442,0184,5401,2611,5132,0181,5138,3231,261
15,1327,818
504
249,010
20,419228,591
2,7391,7433,7351,992
42,5813,7352,490
747498
23,4075,9762,2411,2459,2133,4863,2371,9922,4903,9841,7433,9845,4786,2254,4821,4943,735
7471,4941,992
9967,7191,245
15,6884,980
747
2,689,812
180,2172,509,594
37,6575,380
48,41724,208
320,08861,86629,5885,3805,380
182,90791,45410,75916,139
110,28253,79626,89826,89837,65737,65713,44956,48661,86691,45459,17618,82956,48610,75916,13921,51813,44972,62516,139
164,07983,3845,380

Table 6b: Number of Businesses by Business Characteristics, Metropolitan Location and State, 2002
AllEmployers Non-Employers
Home-based Franchise Exporters New All Home-based Franchise Exporters New
OhioOklahomaOregonPennsylvaniaRhode IslandSouth CarolinaSouth DakotaTennesseeTexasUtahVermontVirginiaWashingtonWest VirginiaWisconsinWyoming
201,51567,42783,217
226,58524,78075,35220,15896,113
363,33149,19218,485
136,042135,59030,787
112,58916,145
45,32713,85023,92347,8455,036
15,1095,036
16,36859,17715,1095,036
37,77341,5506,295
30,2183,777
8,7774,3883,3448,150
6273,1351,0454,806
18,5991,881
4185,2244,1791,4635,015
627
3,0361,0471,9894,083
5231,151
3141,3618,6881,151
3142,3034,187
3141,884
209
8,8193,5834,6859,370
8273,8581,1024,960
19,0153,307
8277,1657,4411,1025,5121,102
616,178224,183216,288647,67062,666
217,63249,378
358,2531,371,178
143,81153,836
393,478331,70082,300
280,65236,958
415,190138,397159,689436,48231,938
127,75131,938
202,272723,922106,45942,584
266,148244,85653,230
223,56421,292
10,3404,0353,279
10,592757
2,774757
4,54021,6891,765
5046,5574,7921,2614,287
757
6,9722,9882,9887,221
9961,992
7474,482
19,4232,988
4983,9847,719
7473,735
747
99,52334,96832,27899,5238,069
32,2788,069
53,796207,11626,8988,069
67,24551,10610,75945,7275,380
Notes: Employer firms can be in more than one geographic area. A metro area contains an urban core of 50,000 or more people while a micro area contains an urban core of 10,000 to 49,999 people.
Source: Office of Advocacy, U.S. Small Business Administration, from special tabulations of U.S. Census Bureau, Survey of Business Owner data.
23

Table 6c: Number of Businesses by Business Characteristics, Major Industry and Customer, 2002
AllEmployers Non-Employers
Home-based Franchise Exporters New All Home-based Franchise Exporters New
Total
IndustryForestry, fishing and hunting, and ag. support srv.MiningUtilitiesConstructionManufacturingWholesale tradeRetail tradeTransportation and warehousingInformationFinance and insuranceReal estate and rental and leasingProfessional, scientific, and technical servicesManagement of companies and enterprisesAdmin. & support & waste mngt. & remediation srv.Educational servicesHealth care and social assistanceArts, entertainment, and recreationAccommodation and food servicesOther services (except public administration)Industries not classified
Customer (10 percent or more of total sales) **Export salesFederal governmentState and local governmentHousehold consumers/individualsOther businesses/organizationsAll others
5,524,784
29,25019,3246,223
729,842310,821347,319745,872167,86576,443
241,120266,161727,89328,351
305,46265,251
564,299103,824434,441392,65629,593
104,680168,651447,798
3,128,7722,244,807
953,752
1,259,088
13,8505,0361,259
415,49925,18269,25046,58665,47317,62731,47755,400
229,1541,259
135,98212,59150,36420,14515,10942,8095,036
22,15831,28284,721
596,959630,848181,173
208,975
209418209
6,8966,0606,478
53,0802,926
6277,732
13,1658,9862,926
14,4192,2994,1794,388
64,15514,419
209
1,9194,478
12,368162,27551,60436,251
104,680
1,570523
03,873
21,66928,7877,8518,6882,7221,7801,466
13,2941,2563,350
6283,245
8373,4543,873
105
104,6808,479
10,67719,68056,6329,526
275,583
1,102551276
30,86511,02312,12640,5117,7163,858
11,29911,57436,928
55115,1572,480
26,4565,512
35,82619,8422,756
4,5466,819
16,762156,258102,56250,003
17,449,871
220,04082,70512,673
2,050,481290,360363,764
1,838,817808,961232,674660,248
1,879,9932,552,734
01,262,583
344,4731,456,816
865,917241,675
2,284,9570
249,010325,629861,959
9,155,9155,727,2353,735,154
10,645,910
127,75142,58410,646
1,479,781191,626234,210
1,224,280361,961170,335330,023766,506
2,033,3690
777,151234,210819,735617,46385,167
1,117,8210
135,905169,882520,970
5,628,7423,794,0211,947,975
252,197
1,2611,261
25213,6192,0188,827
52,96113,8712,270
14,37549,68318,663
017,4023,2799,5837,0627,818
27,9940
5,4124,3309,742
170,74750,60250,602
249,010
10,2091,743
24912,7007,968
21,91328,63628,8855,4785,478
12,20243,826
012,4513,7359,960
12,9491,992
28,6360
249,01016,93321,91355,52992,13423,905
2,689,812
21,5185,3802,690
312,01837,65753,796
314,708126,42145,72786,074
193,666473,407
220,56575,315
250,152110,28237,657
320,088
37,35848,853
117,8231,324,790
916,720442,312
* Employer firms can be in more than one industry.** Firms can be in more than one sales category.
Source: Office of Advocacy, U.S. Small Business Administration, from special tabulations of U.S. Census Bureau, Survey of Business Owner data.
24
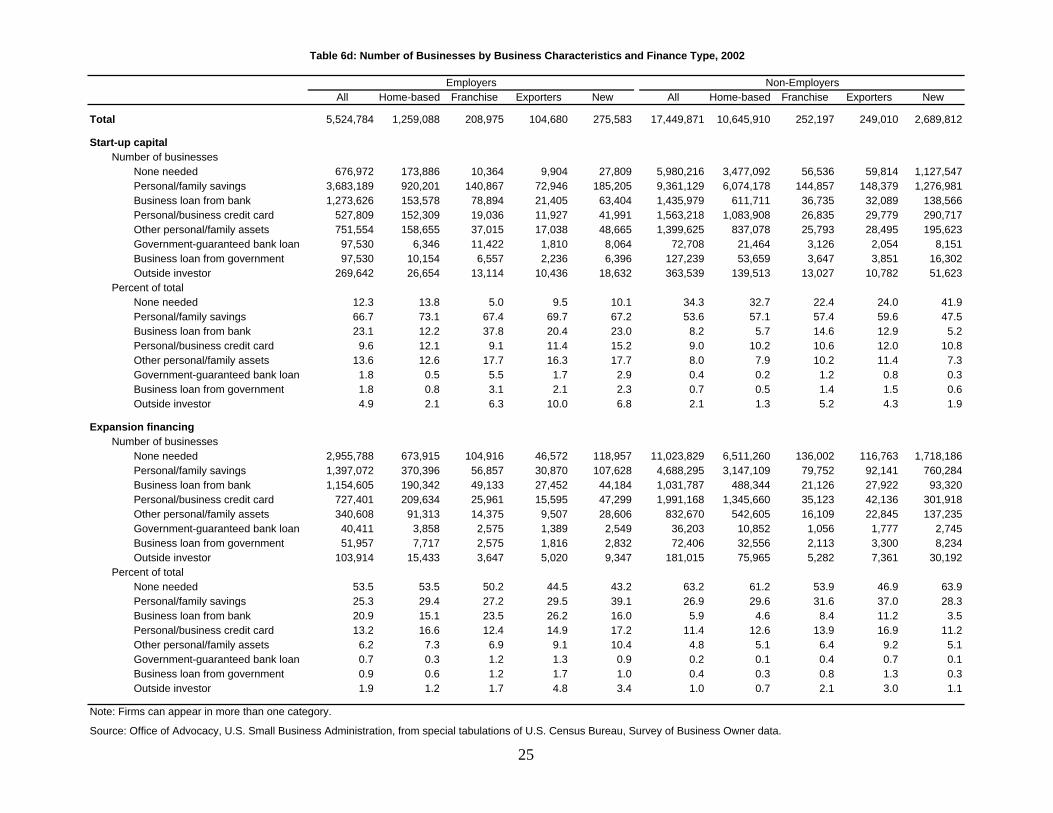
Table 6d: Number of Businesses by Business Characteristics and Finance Type, 2002
AllEmployers Non-Employers
Home-based Franchise Exporters New All Home-based Franchise Exporters New
Total
Start-up capitalNumber of businesses
None neededPersonal/family savingsBusiness loan from bankPersonal/business credit cardOther personal/family assetsGovernment-guaranteed bank loanBusiness loan from governmentOutside investor
Percent of totalNone neededPersonal/family savingsBusiness loan from bankPersonal/business credit cardOther personal/family assetsGovernment-guaranteed bank loanBusiness loan from governmentOutside investor
Expansion financingNumber of businesses
None neededPersonal/family savingsBusiness loan from bankPersonal/business credit cardOther personal/family assetsGovernment-guaranteed bank loanBusiness loan from governmentOutside investor
Percent of totalNone neededPersonal/family savingsBusiness loan from bankPersonal/business credit cardOther personal/family assetsGovernment-guaranteed bank loanBusiness loan from governmentOutside investor
5,524,784
676,9723,683,1891,273,626
527,809751,55497,53097,530
269,642
12.366.723.19.6
13.61.81.84.9
2,955,7881,397,0721,154,605
727,401340,60840,41151,957
103,914
53.525.320.913.26.20.70.91.9
1,259,088
173,886920,201153,578152,309158,655
6,34610,15426,654
13.873.112.212.112.60.50.82.1
673,915370,396190,342209,63491,3133,8587,717
15,433
53.529.415.116.67.30.30.61.2
208,975
10,364140,86778,89419,03637,01511,4226,557
13,114
5.067.437.89.1
17.75.53.16.3
104,91656,85749,13325,96114,3752,5752,5753,647
50.227.223.512.46.91.21.21.7
104,680
9,90472,94621,40511,92717,0381,8102,236
10,436
9.569.720.411.416.31.72.1
10.0
46,57230,87027,45215,5959,5071,3891,8165,020
44.529.526.214.99.11.31.74.8
275,583
27,809185,20563,40441,99148,6658,0646,396
18,632
10.167.223.015.217.72.92.36.8
118,957107,62844,18447,29928,6062,5492,8329,347
43.239.116.017.210.40.91.03.4
17,449,871
5,980,2169,361,1291,435,9791,563,2181,399,625
72,708127,239363,539
34.353.68.29.08.00.40.72.1
11,023,8294,688,2951,031,7871,991,168
832,67036,20372,406
181,015
63.226.95.9
11.44.80.20.41.0
10,645,910
3,477,0926,074,178
611,7111,083,908
837,07821,46453,659
139,513
32.757.15.7
10.27.90.20.51.3
6,511,2603,147,109
488,3441,345,660
542,60510,85232,55675,965
61.229.64.6
12.65.10.10.30.7
252,197
56,536144,85736,73526,83525,7933,1263,647
13,027
22.457.414.610.610.21.21.45.2
136,00279,75221,12635,12316,1091,0562,1135,282
53.931.68.4
13.96.40.40.82.1
249,010
59,814148,37932,08929,77928,4952,0543,851
10,782
24.059.612.912.011.40.81.54.3
116,76392,14127,92242,13622,8451,7773,3007,361
46.937.011.216.99.20.71.33.0
2,689,812
1,127,5471,276,981
138,566290,717195,623
8,15116,30251,623
41.947.55.2
10.87.30.30.61.9
1,718,186760,28493,320
301,918137,235
2,7458,234
30,192
63.928.33.5
11.25.10.10.31.1
Note: Firms can appear in more than one category.
Source: Office of Advocacy, U.S. Small Business Administration, from special tabulations of U.S. Census Bureau, Survey of Business Owner data.
25

Table 6e: Cross-Tabulation of the Number of Employers and Non-Employers by Start Year and Firm-Size Related Variables
AllEmployer Start Years Non-Employer Start Years
2002 2001 2000 Before 2000 All 2002 2001 2000 Before 2000
Total
Employment size of firmNonemployers0 *1-45-910-1920-99100-249250+
Receipt size of firm< $10,000 $10,000 to $49,999 $50,000 to $99,999 $100,000 to $249,999 $250,000 to $999,999 $1 million to $4.9 million $5 million +
Legal form of organizationCorporations (including tax-exempt corp.)PartnershipsSole proprietorsOther**
Owner statusOnly one ownerFamily-OwnedNot family-owned
5,524,784
--810,950
2,600,314948,715581,596484,85760,77337,579
121,053534,004627,518
1,283,7401,798,618
872,916286,935
3,646,357453,032
1,093,907331,487
2,892,8541,593,9061,038,024
275,583
--184,91656,77015,9849,3707,441
827276
15,70865,58950,43266,69155,11717,6374,409
169,48445,74746,29814,055
124,90990,46164,975
334,637
--80,982
157,94849,52625,09818,7401,673
669
9,03542,16448,52291,356
100,05635,8067,697
213,83352,53856,55411,712
165,95298,34276,488
347,760
--55,642
181,18356,68530,25521,2131,739
696
7,65136,51545,90492,156
112,67443,8189,042
227,43548,33961,55310,781
179,92598,85275,028
4,566,805
--397,312
2,224,034863,126548,017452,11454,80222,834
59,368319,676452,114
1,036,6651,602,948
826,592269,441
3,100,860310,543922,495232,907
2,502,4231,407,321
736,281
17,449,871
17,449,871--------------
7,574,3106,373,6061,759,9311,199,885
515,48026,659
--
1,064,4421,081,892
15,094,138191,949
12,292,9893,976,6101,180,272
2,689,812
2,689,812--------------
1,632,716809,633142,56075,31526,898
0--
131,801129,111
2,428,9000
2,013,267485,585201,872
1,785,673
1,785,673--------------
839,266642,842162,49698,21239,2851,786
--
103,569116,069
1,566,0360
1,289,653364,350135,278
1,537,035
1,537,035--------------
679,370559,481147,555106,05541,5001,537
--
89,148116,815
1,331,0730
1,079,658345,366115,122
11,437,351
11,437,351--------------
4,186,0704,311,8811,429,6691,040,799
446,05722,875
--
846,364857,801
9,744,6230
7,655,7393,053,044
751,696
* Annual payroll but no employees on March 12, 2002**Contains nonprofits and some miscellaneous legal forms of organization.Source: Office of Advocacy, U.S. Small Business Administration, from special tabulations of U.S. Census Bureau, Survey of Business Owner data.
26

Table 7a: Owner Characteristics by Firm-Size Related Variables, 2002(percent)
All
Employers Non-Employers
VeteranDisabledVeteran
Younger(under 35)
Older(65 and over) All Veteran
DisabledVeteran
Younger(under 35)
Older(65 and over)
Employment size of firmNonemployers0 *1-45-910-1920-99100-249250+
Receipt size of firm< $10,000 $10,000 to $49,999 $50,000 to $99,999 $100,000 to $249,999 $250,000 to $999,999 $1 million to $4.9 million $5 million +
Legal form of organizationCorporations (including tax-exempt corp.)PartnershipsSole proprietorsOther**
Year business acquiredBefore 19801980 to 19891990 to 19981999200020012002
Owner statusOnly one ownerFamily-ownedNot family-owned
--12.244.418.312.310.91.30.5
1.57.69.8
21.634.019.16.4
69.010.616.53.9
19.023.234.65.86.46.05.0
38.540.322.3
--10.447.018.211.910.71.30.5
1.67.9
10.321.833.418.76.3
68.19.1
18.04.9
33.224.627.13.94.13.93.1
44.036.521.0
--15.652.417.77.46.10.70.2
1.810.713.825.733.411.92.7
64.07.7
22.55.8
26.024.528.15.55.95.64.5
46.640.614.4
--23.543.216.39.36.80.60.2
2.411.112.624.932.613.23.1
66.015.016.62.4
4.85.5
35.511.514.315.013.4
34.044.822.3
--7.6
47.217.512.212.72.00.8
1.79.7
10.219.830.419.68.5
70.29.4
14.36.1
52.222.218.12.11.91.81.6
59.634.95.8
100.0--------------
41.835.910.87.83.40.20.0
7.19.1
83.80.0
11.116.232.26.88.7
10.014.8
59.532.18.7
100.0--------------
40.336.111.68.43.50.20.0
7.99.7
82.40.0
21.919.529.85.36.67.09.8
57.534.38.5
100.0--------------
42.937.710.66.42.30.10.0
6.55.6
88.00.0
17.318.131.46.07.67.6
12.0
59.634.95.8
100.0--------------
52.134.57.44.31.60.10.0
4.15.0
90.90.0
0.81.6
23.29.0
13.919.132.5
68.823.58.1
100.0--------------
44.535.59.27.03.70.10.0
9.212.978.00.0
36.622.025.63.63.83.64.7
52.239.88.2
* Annual payroll but no employees on March 12, 2002**Contains nonprofits and some miscellaneous legal forms of organization.
Source: Office of Advocacy, U.S. Small Business Administration, from special tabulations of U.S. Census Bureau, Survey of Business Owner data.
27
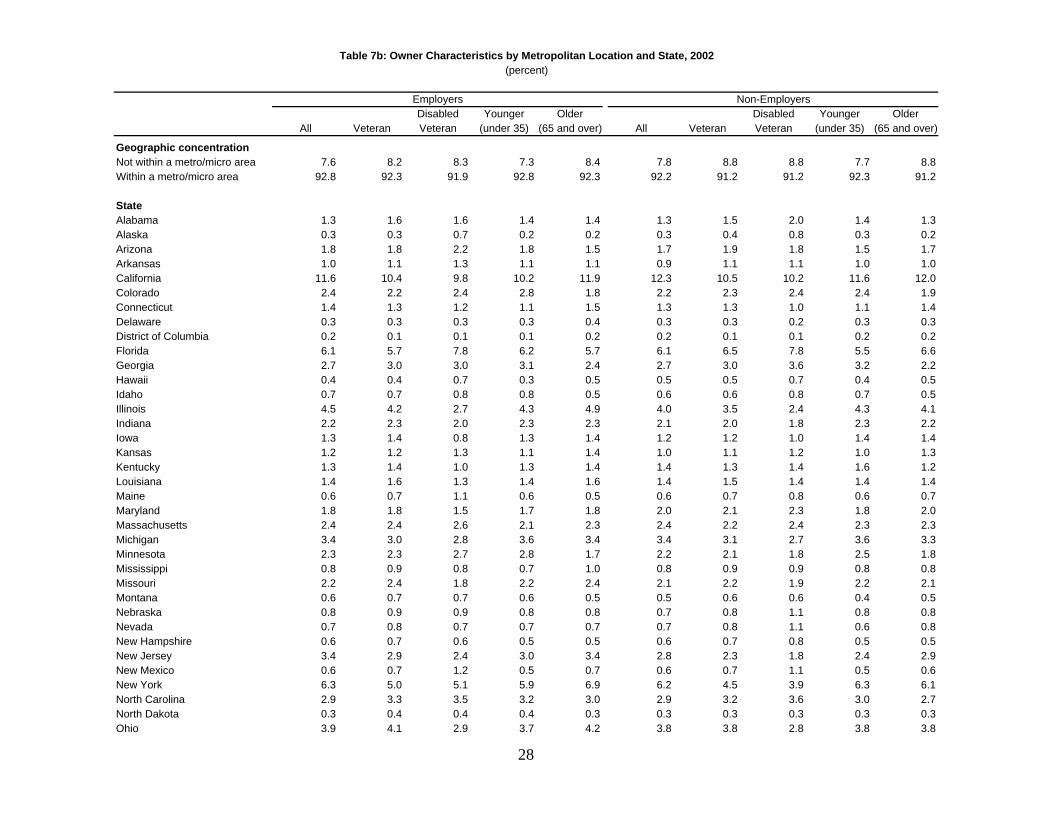
Table 7b: Owner Characteristics by Metropolitan Location and State, 2002(percent)
All
Employers Non-Employers
VeteranDisabledVeteran
Younger(under 35)
Older(65 and over) All Veteran
DisabledVeteran
Younger(under 35)
Older(65 and over)
Geographic concentrationNot within a metro/micro areaWithin a metro/micro area
StateAlabamaAlaskaArizonaArkansasCaliforniaColoradoConnecticutDelawareDistrict of ColumbiaFloridaGeorgiaHawaiiIdahoIllinoisIndianaIowaKansasKentuckyLouisianaMaineMarylandMassachusettsMichiganMinnesotaMississippiMissouriMontanaNebraskaNevadaNew HampshireNew JerseyNew MexicoNew YorkNorth CarolinaNorth DakotaOhio
7.692.8
1.30.31.81.0
11.62.41.40.30.26.12.70.40.74.52.21.31.21.31.40.61.82.43.42.30.82.20.60.80.70.63.40.66.32.90.33.9
8.292.3
1.60.31.81.1
10.42.21.30.30.15.73.00.40.74.22.31.41.21.41.60.71.82.43.02.30.92.40.70.90.80.72.90.75.03.30.44.1
8.391.9
1.60.72.21.39.82.41.20.30.17.83.00.70.82.72.00.81.31.01.31.11.52.62.82.70.81.80.70.90.70.62.41.25.13.50.42.9
7.392.8
1.40.21.81.1
10.22.81.10.30.16.23.10.30.84.32.31.31.11.31.40.61.72.13.62.80.72.20.60.80.70.53.00.55.93.20.43.7
28
8.492.3
1.40.21.51.1
11.91.81.50.40.25.72.40.50.54.92.31.41.41.41.60.51.82.33.41.71.02.40.50.80.70.53.40.76.93.00.34.2
7.892.2
1.30.31.70.9
12.32.21.30.30.26.12.70.50.64.02.11.21.01.41.40.62.02.43.42.20.82.10.50.70.70.62.80.66.22.90.33.8
8.891.2
1.50.41.91.1
10.52.31.30.30.16.53.00.50.63.52.01.21.11.31.50.72.12.23.12.10.92.20.60.80.80.72.30.74.53.20.33.8
8.891.2
2.00.81.81.1
10.22.41.00.20.17.83.60.70.82.41.81.01.21.41.40.82.32.42.71.80.91.90.61.11.10.81.81.13.93.60.32.8
7.792.3
1.40.31.51.0
11.62.41.10.30.25.53.20.40.74.32.31.41.01.61.40.61.82.33.62.50.82.20.40.80.60.52.40.56.33.00.33.8
8.891.2
1.30.21.71.0
12.01.91.40.30.26.62.20.50.54.12.21.41.31.21.40.72.02.33.31.80.82.10.50.80.80.52.90.66.12.70.33.8
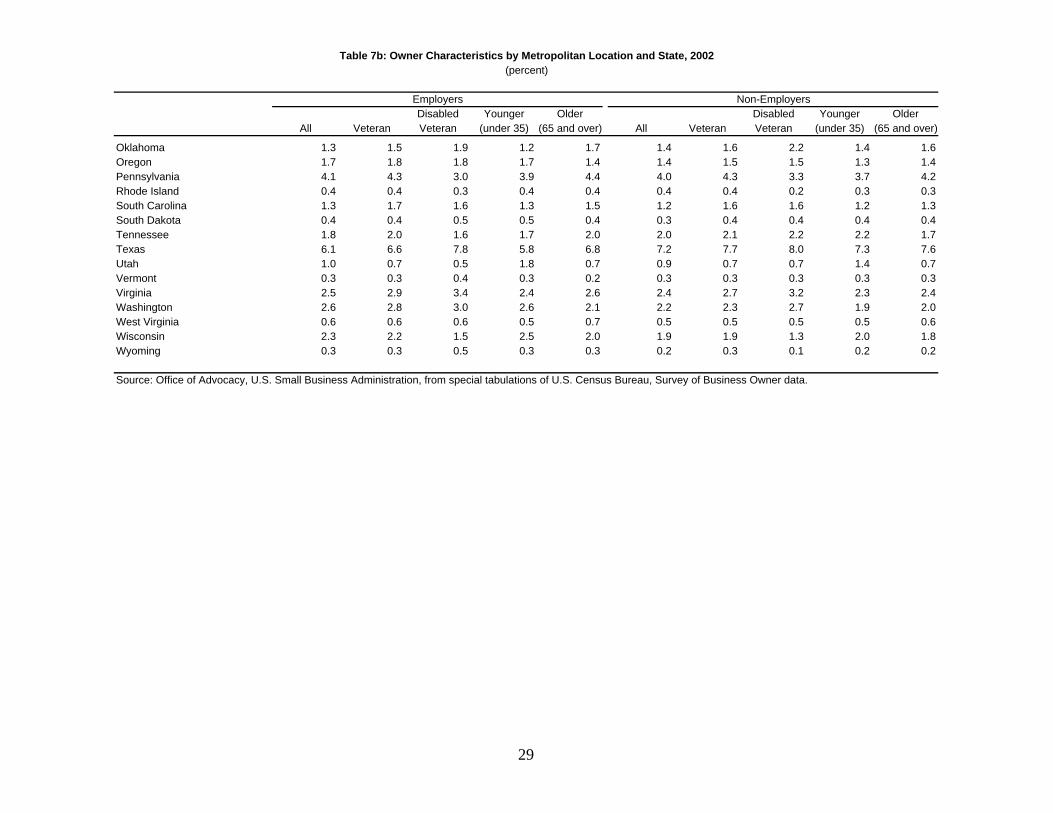
Table 7b: Owner Characteristics by Metropolitan Location and State, 2002(percent)
All
Employers Non-Employers
VeteranDisabledVeteran
Younger(under 35)
Older(65 and over) All Veteran
DisabledVeteran
Younger(under 35)
Older(65 and over)
OklahomaOregonPennsylvaniaRhode IslandSouth CarolinaSouth DakotaTennesseeTexasUtahVermontVirginiaWashingtonWest VirginiaWisconsinWyoming
1.31.74.10.41.30.41.86.11.00.32.52.60.62.30.3
1.51.84.30.41.70.42.06.60.70.32.92.80.62.20.3
1.91.83.00.31.60.51.67.80.50.43.43.00.61.50.5
1.21.73.90.41.30.51.75.81.80.32.42.60.52.50.3
1.71.44.40.41.50.42.06.80.70.22.62.10.72.00.3
1.41.44.00.41.20.32.07.20.90.32.42.20.51.90.2
1.61.54.30.41.60.42.17.70.70.32.72.30.51.90.3
2.21.53.30.21.60.42.28.00.70.33.22.70.51.30.1
1.41.33.70.31.20.42.27.31.40.32.31.90.52.00.2
1.61.44.20.31.30.41.77.60.70.32.42.00.61.80.2
Source: Office of Advocacy, U.S. Small Business Administration, from special tabulations of U.S. Census Bureau, Survey of Business Owner data.
29
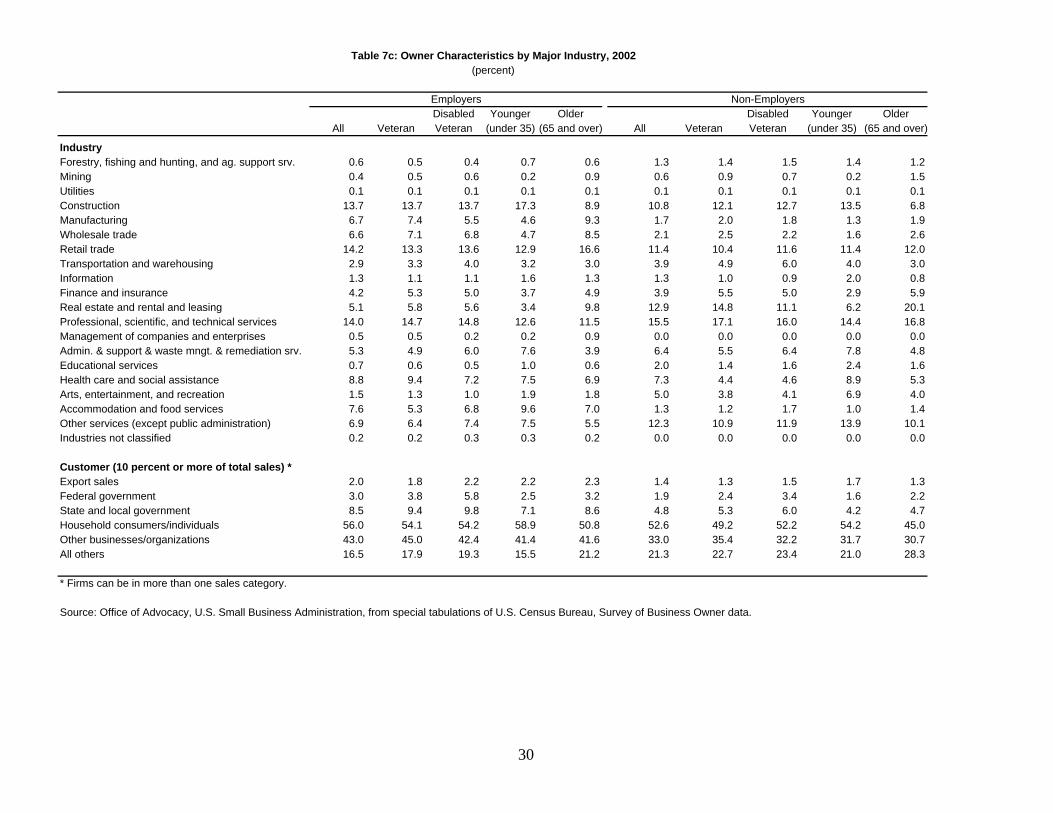
Table 7c: Owner Characteristics by Major Industry, 2002(percent)
All
Employers Non-Employers
VeteranDisabledVeteran
Younger Older(under 35) (65 and over) All Veteran
DisabledVeteran
Younger Older(under 35) (65 and over)
IndustryForestry, fishing and hunting, and ag. support srv.MiningUtilitiesConstructionManufacturingWholesale tradeRetail tradeTransportation and warehousingInformationFinance and insuranceReal estate and rental and leasingProfessional, scientific, and technical servicesManagement of companies and enterprisesAdmin. & support & waste mngt. & remediation srv.Educational servicesHealth care and social assistanceArts, entertainment, and recreationAccommodation and food servicesOther services (except public administration)Industries not classified
Customer (10 percent or more of total sales) *Export salesFederal governmentState and local governmentHousehold consumers/individualsOther businesses/organizationsAll others
0.60.40.1
13.76.76.6
14.22.91.34.25.1
14.00.55.30.78.81.57.66.90.2
2.03.08.5
56.043.016.5
0.50.50.1
13.77.47.1
13.33.31.15.35.8
14.70.54.90.69.41.35.36.40.2
1.83.89.4
54.145.017.9
0.40.60.1
13.75.56.8
13.64.01.15.05.6
14.80.26.00.57.21.06.87.40.3
2.25.89.8
54.242.419.3
0.70.20.1
17.34.64.7
12.93.21.63.73.4
12.60.27.61.07.51.99.67.50.3
2.22.57.1
58.941.415.5
0.60.90.18.99.38.5
16.63.01.34.99.8
11.50.93.90.66.91.87.05.50.2
2.33.28.6
50.841.621.2
1.30.60.1
10.81.72.1
11.43.91.33.9
12.915.50.06.42.07.35.01.3
12.30.0
1.41.94.8
52.633.021.3
1.40.90.1
12.12.02.5
10.44.91.05.5
14.817.10.05.51.44.43.81.2
10.90.0
1.32.45.3
49.235.422.7
1.50.70.1
12.71.82.2
11.66.00.95.0
11.116.00.06.41.64.64.11.7
11.90.0
1.53.46.0
52.232.223.4
1.40.20.1
13.51.31.6
11.44.02.02.96.2
14.40.07.82.48.96.91.0
13.90.0
1.71.64.2
54.231.721.0
1.21.50.16.81.92.6
12.03.00.85.9
20.116.80.04.81.65.34.01.4
10.10.0
1.32.24.7
45.030.728.3
* Firms can be in more than one sales category.
Source: Office of Advocacy, U.S. Small Business Administration, from special tabulations of U.S. Census Bureau, Survey of Business Owner data.
30

Table 7d: Owner Characteristics by Finance Type, 2002(percent)
All
Employers Non-Employers
VeteranDisabledVeteran
Younger Older(under 35) (65 and over) All Veteran
DisabledVeteran
Younger Older(under 35) (65 and over)
Start-up capitalBusiness loan from bankPersonal/business credit cardGovernment-guaranteed bank loanBusiness loan from governmentNone neededOther personal/family assetsOutside investorPersonal/family savings
Expansion financingBusiness loan from bankGovernment-guaranteed bank loanNone neededOutside investorPersonal/business credit cardBusiness loan from governmentOther personal/family assetsPersonal/family savings
24.79.92.01.79.4
15.34.6
69.7
23.10.7
51.91.8
13.30.96.6
25.7
25.08.21.81.6
10.114.44.1
69.3
22.20.6
54.91.3
11.60.86.2
24.0
22.113.32.41.88.9
17.44.3
73.3
22.20.8
45.91.7
18.11.29.8
33.4
24.016.82.52.38.1
17.65.9
69.7
23.51.0
42.92.9
20.41.29.4
32.7
23.83.91.31.4
11.213.83.9
69.3
19.60.5
61.11.16.40.74.6
20.6
9.89.30.40.8
30.89.12.3
55.7
6.90.2
61.11.1
11.80.45.4
28.1
10.98.20.50.8
28.79.62.0
57.5
7.50.2
62.70.9
10.50.45.3
26.7
8.611.30.50.8
27.010.21.8
60.4
7.30.3
55.20.9
15.30.87.0
32.9
6.511.80.30.7
38.17.52.4
50.4
4.90.2
60.61.4
13.90.45.2
29.9
10.63.60.40.8
34.58.72.0
52.3
5.90.1
72.00.65.00.33.4
19.9
Source: Office of Advocacy, U.S. Small Business Administration, from special tabulations of U.S. Census Bureau, Survey of Business Owner data.
31