Embed Size (px)
Citation preview
D.C. George © 2012
US Redistribution
of Wealth
D.C. George © 2012 [email protected]
Please forward, post or present as you wish, as long as it is complete and unedited
Version 1.2

Agenda
• Today we will explore Wealth Redistribution in the US
• Look mostly at government data
– In a fun and easy to understand way
– CBO, GAO, and US Census
– Focus on 2009, because it has great income data
• Lump Federal, State & Local together for the “Big Picture”
– Your mileage may vary
– Include both halves of SS and Medicare taxes
• Look at a wide variety of programs
– Entitlements, taxes, and other activities
– Objectives, results and who benefits
– Total impact on households and the National Debt
• Your job is to post and forward this presentation to others
D.C. George © 2012 2
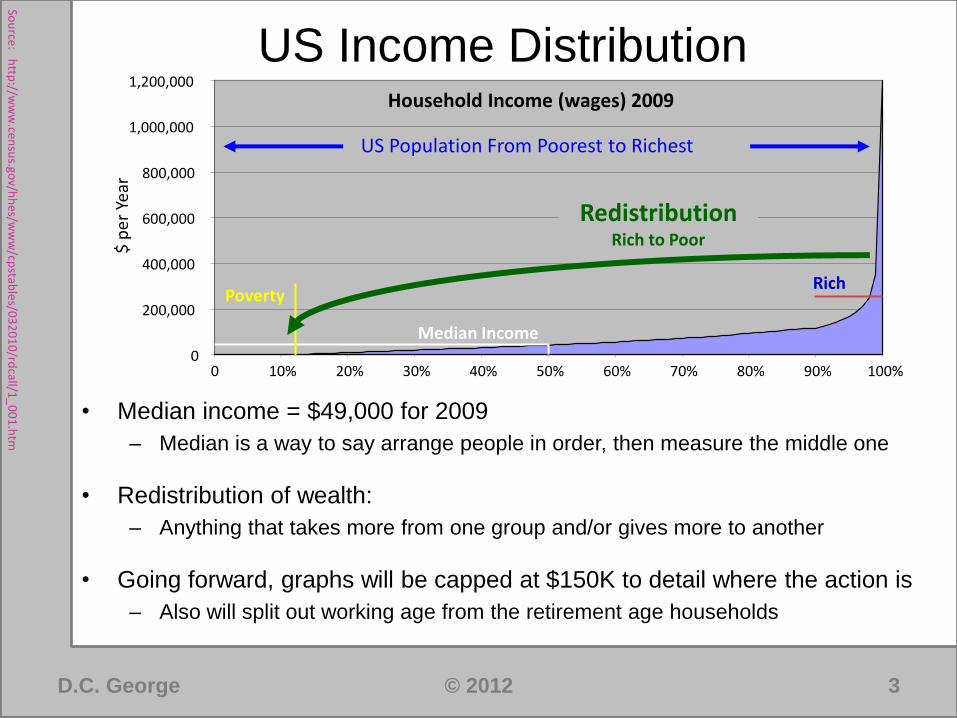
US Income Distribution
• Median income = $49,000 for 2009
– Median is a way to say arrange people in order, then measure the middle one
• Redistribution of wealth:
– Anything that takes more from one group and/or gives more to another
• Going forward, graphs will be capped at $150K to detail where the action is
– Also will split out working age from the retirement age households
0
200,000
400,000
600,000
800,000
1,000,000
1,200,000
0 10% 20% 30% 40% 50% 60% 70% 80% 90% 100%
$ p
er Y
ear
Household Income (wages) 2009
Median Income
Rich Poverty
Redistribution Rich to Poor
Sou
rce: http
://ww
w.cen
sus.go
v/hh
es/ww
w/cp
stable
s/03
20
10
/rdcall/1
_0
01
.htm
US Population From Poorest to Richest
D.C. George © 2012 3
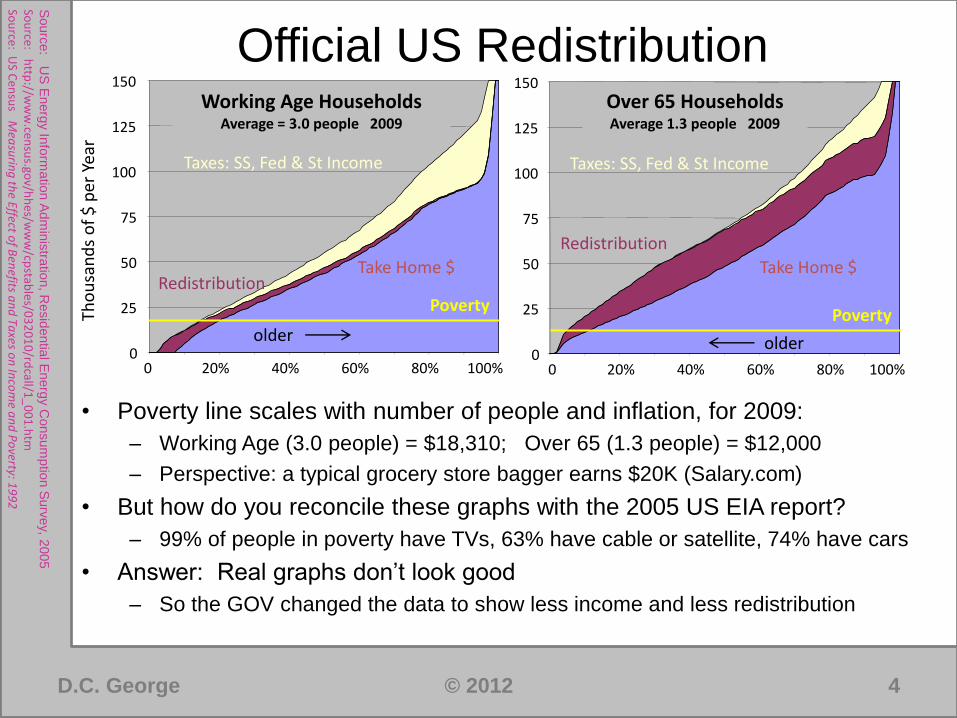
Official US Redistribution
• Poverty line scales with number of people and inflation, for 2009:
– Working Age (3.0 people) = $18,310; Over 65 (1.3 people) = $12,000
– Perspective: a typical grocery store bagger earns $20K (Salary.com)
• But how do you reconcile these graphs with the 2005 US EIA report?
– 99% of people in poverty have TVs, 63% have cable or satellite, 74% have cars
• Answer: Real graphs don’t look good
– So the GOV changed the data to show less income and less redistribution
0
25
50
75
100
125
150
0 20% 40% 60% 80% 100%
Tho
usa
nd
s o
f $
per
Yea
r Over 65 Households Average 1.3 people 2009
Poverty
0
25
50
75
100
125
150
0 20% 40% 60% 80% 100%
Working Age Households Average = 3.0 people 2009
Poverty
Taxes: SS, Fed & St Income
Redistribution Take Home $
Taxes: SS, Fed & St Income
Redistribution
Take Home $
Sou
rce: US C
ensu
s Mea
surin
g th
e Effect of B
enefits a
nd
Taxes o
n In
com
e an
d P
overty: 1
99
2
Sou
rce: http
://ww
w.cen
sus.go
v/hh
es/ww
w/cp
stable
s/03
20
10
/rdcall/1
_0
01
.htm
S
ourc
e: U
S E
nerg
y Info
rmatio
n A
dm
inis
tratio
n, R
esid
entia
l Energ
y Consum
ptio
n S
urv
ey, 2
005
D.C. George © 2012 4
older older
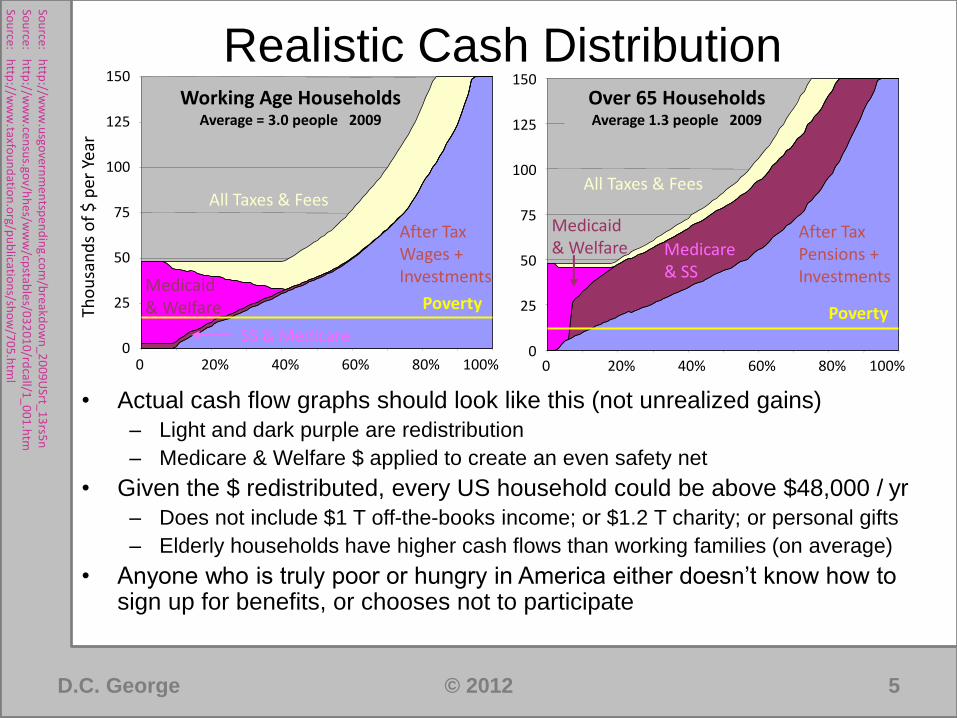
Realistic Cash Distribution
• Actual cash flow graphs should look like this (not unrealized gains)
– Light and dark purple are redistribution
– Medicare & Welfare $ applied to create an even safety net
• Given the $ redistributed, every US household could be above $48,000 / yr
– Does not include $1 T off-the-books income; or $1.2 T charity; or personal gifts
– Elderly households have higher cash flows than working families (on average)
• Anyone who is truly poor or hungry in America either doesn’t know how to sign up for benefits, or chooses not to participate
Tho
usa
nd
s o
f $
per
Yea
r Over 65 Households Average 1.3 people 2009
0 20% 40% 60% 80% 100% 0
25
50
75
100
125
150
Poverty
All Taxes & Fees
Medicare & SS
After Tax Pensions + Investments
Medicaid & Welfare
Working Age Households Average = 3.0 people 2009
0
25
50
75
100
125
150
0 20% 40% 60% 80% 100%
Poverty
All Taxes & Fees
SS & Medicare
After Tax Wages + Investments Medicaid
& Welfare
Sou
rce: http
://ww
w.taxfo
un
datio
n.o
rg/pu
blicatio
ns/sh
ow
/70
5.h
tml
Sou
rce: http
://ww
w.cen
sus.go
v/hh
es/ww
w/cp
stable
s/03
20
10
/rdcall/1
_0
01
.htm
So
urce: h
ttp://w
ww
.usgo
vernm
entsp
end
ing.co
m/b
reakdo
wn
_20
09
USrt_
13
rs5n
D.C. George © 2012 5
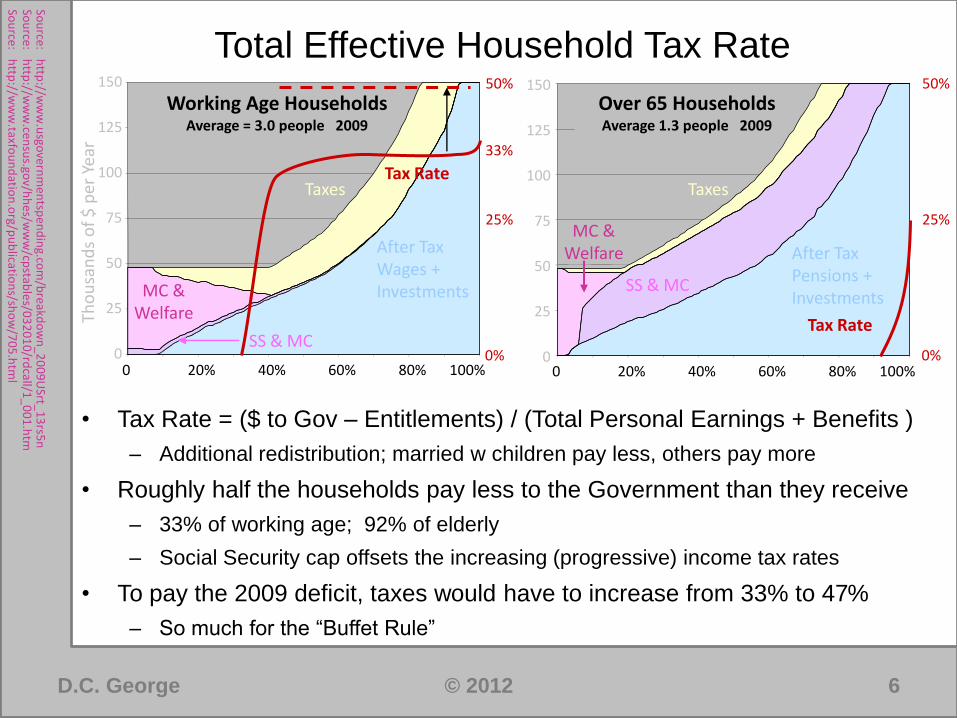
Total Effective Household Tax Rate
• Tax Rate = ($ to Gov – Entitlements) / (Total Personal Earnings + Benefits )
– Additional redistribution; married w children pay less, others pay more
• Roughly half the households pay less to the Government than they receive
– 33% of working age; 92% of elderly
– Social Security cap offsets the increasing (progressive) income tax rates
• To pay the 2009 deficit, taxes would have to increase from 33% to 47%
– So much for the “Buffet Rule”
Tho
usa
nd
s o
f $
per
Yea
r
0%
25%
50%
Over 65 Households Average 1.3 people 2009
0 20% 40% 60% 80% 100% 0
25
50
75
100
125
150
Taxes
SS & MC
MC & Welfare
Working Age Households Average = 3.0 people 2009
0
25
50
75
100
125
150
0 20% 40% 60% 80% 100%
SS & MC
MC & Welfare
0%
25%
50%
Tax Rate
Tax Rate
Taxes
After Tax Pensions + Investments
After Tax Wages + Investments
33%
Sou
rce: http
://ww
w.taxfo
un
datio
n.o
rg/pu
blicatio
ns/sh
ow
/70
5.h
tml
Sou
rce: http
://ww
w.cen
sus.go
v/hh
es/ww
w/cp
stable
s/03
20
10
/rdcall/1
_0
01
.htm
So
urce: h
ttp://w
ww
.usgo
vernm
entsp
end
ing.co
m/b
reakdo
wn
_20
09
USrt_
13
rs5n
D.C. George © 2012 6

Wages & Savings by Education & Age
• Income mostly a function of education and experience (age)
– Super “Rich” are celebrities, CEOs and/or entrepreneurs
– Poor are mentally, physically, &/or chemically disabled; or unwilling to bag groceries
• Most can be wealthy if they simply save 10% (house painter follows HS Grad line)
• For the young, looking at their parents, wealth looks like an impossible journey
– But this relative path is almost unchanged since 1940
– Easy to support redistribution when young, but not after working hard & saving
– If you make life too easy for the young, they will never struggle, grow and achieve
0
20
40
60
80
100
120
140
0 10 20 30 40 50 60 70
Tho
usa
nd
s o
f $
pe
r Ye
ar
Age
Median Wage by Education & Age
Professional
Doctorate
Masters
Bachelors
Associate
No HS grad HS Grad
Some C
0
250
500
750
1,000
1,250
1,500
0 10 20 30 40 50 60 70
Tho
usa
nd
s o
f $
Sav
ed
Age
Savings by Education 10% Wages + House
Professional
Bachelors
No HS grad
High School
Sou
rce: http
://ww
w.cen
sus.go
v/com
pen
dia/statab
/cats/edu
cation
.htm
l
D.C. George © 2012 7
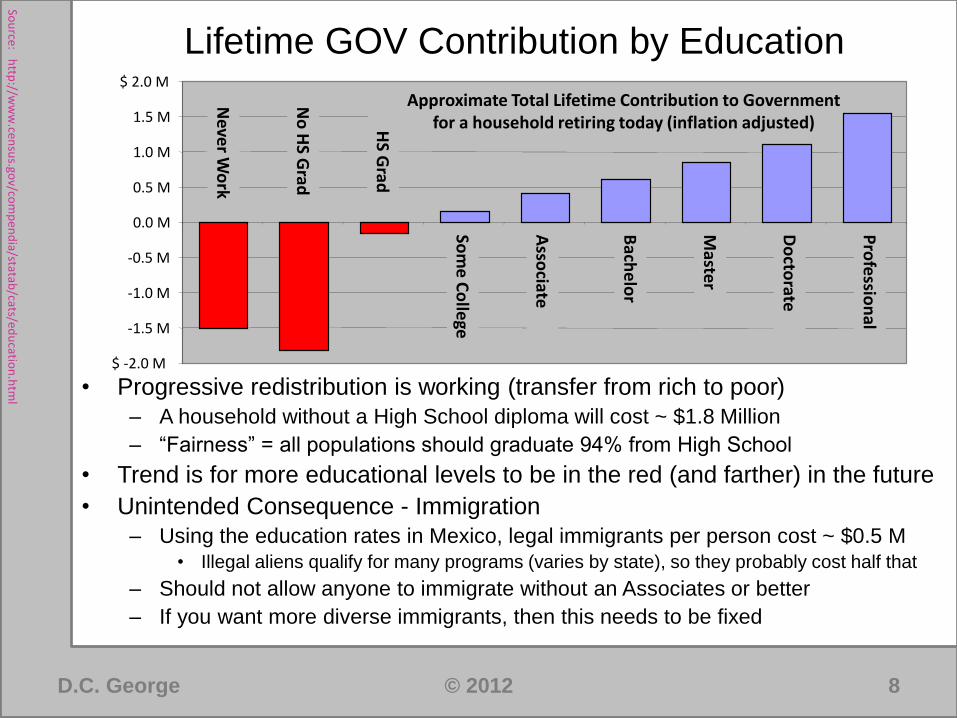
Lifetime GOV Contribution by Education
• Progressive redistribution is working (transfer from rich to poor)
– A household without a High School diploma will cost ~ $1.8 Million
– “Fairness” = all populations should graduate 94% from High School
• Trend is for more educational levels to be in the red (and farther) in the future
• Unintended Consequence - Immigration
– Using the education rates in Mexico, legal immigrants per person cost ~ $0.5 M
• Illegal aliens qualify for many programs (varies by state), so they probably cost half that
– Should not allow anyone to immigrate without an Associates or better
– If you want more diverse immigrants, then this needs to be fixed
$ -2.0 M
-1.5 M
-1.0 M
-0.5 M
0.0 M
0.5 M
1.0 M
1.5 M
$ 2.0 M Approximate Total Lifetime Contribution to Government
for a household retiring today (inflation adjusted)
Neve
r Wo
rk
No
HS G
rad
HS G
rad
Asso
ciate
Bach
elo
r
Maste
r
Do
ctorate
Pro
fessio
nal
Som
e C
olle
ge
Sou
rce: http
://ww
w.cen
sus.go
v/com
pen
dia/statab
/cats/edu
cation
.htm
l
D.C. George © 2012 8
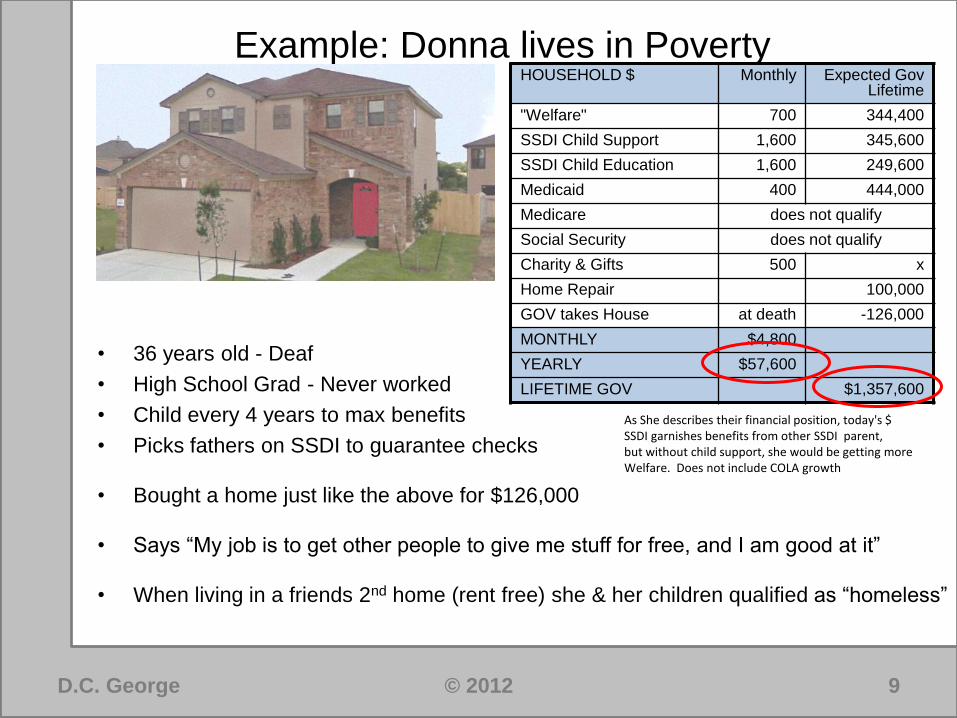
Example: Donna lives in Poverty
• 36 years old - Deaf
• High School Grad - Never worked
• Child every 4 years to max benefits
• Picks fathers on SSDI to guarantee checks
• Bought a home just like the above for $126,000
• Says “My job is to get other people to give me stuff for free, and I am good at it”
• When living in a friends 2nd home (rent free) she & her children qualified as “homeless”
HOUSEHOLD $ Monthly Expected Gov Lifetime
"Welfare" 700 344,400
SSDI Child Support 1,600 345,600
SSDI Child Education 1,600 249,600
Medicaid 400 444,000
Medicare does not qualify
Social Security does not qualify
Charity & Gifts 500 x
Home Repair 100,000
GOV takes House at death -126,000
MONTHLY $4,800
YEARLY $57,600
LIFETIME GOV $1,357,600
As She describes their financial position, today's $ SSDI garnishes benefits from other SSDI parent, but without child support, she would be getting more Welfare. Does not include COLA growth
D.C. George © 2012 9

Grade Redistribution Objectives 1
• Take care of those who can’t YES
– These people deserve our sympathy and 100% support
– Donna is a perfect example (even though she could)
• Provide safety net for those who can YES
– $48,000 is a pretty high safety net
• Lift people out of poverty NO
– $16 T for the “War on Poverty” has left poverty rates unchanged
• Poverty defined by income (wages) not total $ (wages + gifts + entitlements)
• No amount of GOV entitlements can lift people out of poverty, by definition
0%
5%
10%
15%
20%
1950 1960 1970 1980 1990 2000 2010 2020
Poverty Rates People
Households
War on Poverty
Sou
rce: http
://ww
w.cen
sus.go
v/hh
es/ww
w/p
overty/p
overty.h
tml
D.C. George © 2012 10

Grade Redistribution Objectives 2 • Train people to get a job / better paying job NO
– Men working percentage has declined since “War on Poverty”
– Women and Total population working percentage has declined since 2000
– Percentage not graduating High School seems fixed at 13%
• Reduce crime (economic inequality leads to crime) NO
– All crime rates increased as “War on Poverty” began, most still higher • Might suggest idleness and dependency lead to crime
0
1x
2x
3x
4x
5x
1950 1960 1970 1980 1990 2000 2010 2020
Violent Property Murder Rape Robbery Assault Burglary Theft Vehicle
Relative Crime Rates since 1965
War on Poverty
0%
20%
40%
60%
80%
100%
1950 1960 1970 1980 1990 2000 2010 2020
Men
Women
Total
Adults Working Percentage
War on Poverty
Sou
rce: http
://ww
w.d
isastercenter.co
m/crim
e/uscrim
e.htm
So
urce: h
ttp://w
ww
.censu
s.gov/h
hes/w
ww
/labo
rfor/fin
al2_b
8_n
ov6
.pd
f So
urce: h
ttp://w
ww
.bls.go
v/cps/tab
les.htm
#ann
ual
D.C. George © 2012 11
1965 rates = 1x
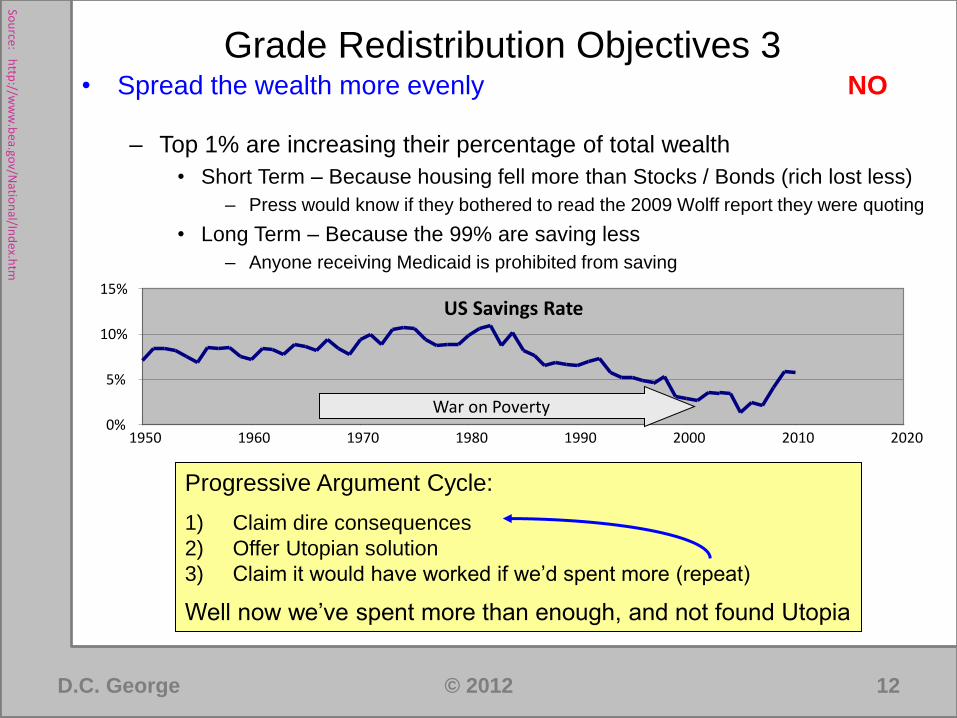
Grade Redistribution Objectives 3 • Spread the wealth more evenly NO
– Top 1% are increasing their percentage of total wealth
• Short Term – Because housing fell more than Stocks / Bonds (rich lost less)
– Press would know if they bothered to read the 2009 Wolff report they were quoting
• Long Term – Because the 99% are saving less
– Anyone receiving Medicaid is prohibited from saving
0%
5%
10%
15%
1950 1960 1970 1980 1990 2000 2010 2020
US Savings Rate
War on Poverty
Sou
rce: http
://ww
w.b
ea.gov/N
ation
al/Ind
ex.htm
Progressive Argument Cycle:
1) Claim dire consequences
2) Offer Utopian solution
3) Claim it would have worked if we’d spent more (repeat)
Well now we’ve spent more than enough, and not found Utopia
D.C. George © 2012 12

Social Security Retirement
• Social Security: a pension for US Citizens
– Who have worked 10 years, and their spouses, over age 65 (moving to 67)
• 1972, Cost Of Living Adjustment (COLA) so benefits would track inflation
– Got the COLA wrong; it is twice inflation; and our cowardly congress won’t fix it (purple line)
– Baby-boomers have paid for ~ 15% retirement, but expect ~ 25% retirement
• The more you pay in, the smaller percentage you get out (redistribution)
– Earning $10K at 64, gets SS retirement ~ $5500/year or 55% of income
– Earning $100K at 64, gets SS retirement ~ $19,800/year or 20% after tax
0%
5%
10%
15%
20%
25%
30%
35%
19
40
19
50
19
60
19
70
19
80
19
90
20
00
20
10
20
20
20
30
20
40
20
50
20
60
20
70
Social Security – Current Trends
Average Payout per person / Median HH Income
Tax Rate Needed to Break Even
Current Tax Rate
0%
10%
20%
30%
40%
50%
60%
0 50 100 150 200 250 Salary at age 64 in thousands of $
SS Benefit As % of Final Salary
After taxes
Sou
rce: http
://ww
w.ssa.go
v/OA
CT/q
uickcalc/in
dex.h
tml
Sou
rce: http
://ww
w.ssa.go
v/OA
CT/P
rogD
ata/
Sou
rce: http
://ww
w.cen
sus.go
v/com
pen
dia/statab
/cats/social_in
suran
ce_hu
man
_services/so
cial_security_retirem
en
t_plan
s.htm
l
D.C. George © 2012 13

SSI for disabled people over 65 But that’s another program
Social Security Disability Insurance
• GOV defines disabled as not being able to work a minimum wage job
– I know 8 people on SSDI, all of whom could bag groceries
• SSDI can only be received once in a lifetime
– Pays for special education of disabled child, or
– Pays for a disabled working age person (SS Retirement rates including COLAs)
• Changing GOV rules allow a higher percentage of people to qualify (graph)
• Allowed to “try” a new job for up to 9 months, while pulling full SSDI $
– Optimum lifestyle comes from working occasionally & getting fired before 9 months
0.0%
0.5%
1.0%
1.5%
2.0%
2.5%
3.0%
1950 1960 1970 1980 1990 2000 2010 2020
Percent of Population Receiving SSDI & SSI
Sou
rce: http
://ww
w.cen
sus.go
v/com
pen
dia/statab
/cats/social_in
suran
ce_hu
man
_services/so
cial_security_retirem
en
t_plan
s.htm
l
D.C. George © 2012 14

Welfare Trap (family of 4)
• Trap: most people at some time can be lured into not working
– Hard times drive you for help
– Get more/enough $ for not working • More $ with more programs
• Working reduces living standard
• Work under the table (cheat)
– Lose experience (years worked)
• Welfare becomes a lifestyle – Don’t need education
Scenario A B C D E F G
Earnings($) 0 4,000 8,000 12,000 16,000 20,000 24,000
TANF (“welfare”) 9,574 8,810 6,460 4,110 0 0 0
Food Stamps 7,036 6,474 5,346 4,218 3,090 1,962 834
Disability 11,351 9,600 7,250 4,900 2,550 200 0
Sec. 8 Housing 12,690 11,045 9,400 7,755 6,110 4,465 2,820
Federal EITC 0 1,880 3,760 5,053 4,819 3,832 2,845
Medicaid 5,000 5,000 5,000 5,000 2,000 1,000 1,000
FED Payroll Taxes 0 −306 −612 −918 −1,224 −1,530 −1,836
FED Income Tax 0 0 0 0 0 0 −190
Value 45,650 46,809 45,216 43,036 34,569 31,459 31,499
Based o
n 2
004 d
ata
from
ww
w.e
conlib
.org
- scale
d fo
r infla
tion fro
m 2
004 -2
010
Wel
fare
B
ased o
n U
S 2
010 C
ensus D
ata
0
20
40
60
80
100
120
140
0 10 20 30 40 50 60 70
Tho
usa
nd
s o
f $
pe
r Ye
ar
Age
Median Wage by Education & Age
Professional
Doctorate
Masters
Bachelors
Associate
No HS grad HS Grad
Some C
D.C. George © 2012 15

Medicare & Medicaid • Medicare is a medical plan for those who qualify for Social Security (or SSDI)
– Paid for by Payroll taxes and some fees, but ~ 60% comes from general funds
• Medicaid is a medical plan for the poor (some states cover illegal aliens)
– Poverty income & limits liquid assets to $4 K single; $6 K married
– Federal pays 57% of bills, State 43%, patient 0%
– Does not cover institutionalized people (prison, asylums)
• Payment rates create redistribution to the elderly and poor
– Medicare & Medicaid pay doctors ~ 80% of each bill (64% from FED, 16% patient)
– Hospitals often give discounts for cash (uninsured can pay ~ 70%)
– Emergency rooms help everyone, regardless of ability to pay (inc. illegal aliens)
– Doctors recover discounts by charging private insurance more
• Unintended consequences
– Healthy people w/o healthcare and few assets are better of without insurance
• If they get really sick, they spend until assets below the cap, then get Medicaid
– Severely mentally ill patients are on the street so Fed will pay 57% of their care
• Which is the lesson of the Gabriel Gifford’s shooting (we wish her well)
D.C. George © 2012 16

Education
• Harvard tuition increases with income (most schools not as blatant)
– Imagine paying more for a car based on how much you earn
– Remember education ~ income, and these people will be the future “rich”
• Free Pell grants to poor, children who have a parent who died or in the military
• Excessive scholarships drive out the average non-diverse students
– Should expect the Normal Curve but get blue actual education rates
• Under Obamacare, Government controls all student loans
– Giving the GOV control over who can afford college, and how much they pay
Sou
rce: http
://np
c.fas.harvard
.edu
/
0
10
20
30
40
50
60
0 50 100 150 200 250 300 350
Tuit
ion
in 1
00
’s o
f $
Harvard University Tuition
Parents Income 1000’s of $
1 Child in College
2 Children in College 0%
10%
20%
30%
40%
Education Rates P
rofe
ss
ion
al
Do
cto
rate
Ma
ste
rs
Bach
elo
rs
As
so
cia
te
No
HS
gra
d
HS
Gra
d
So
me
C
2010 Actual
Normal Curve
Sou
rce: http
://ww
w.cen
sus.go
v/com
pen
dia/statab
/cats/edu
cation
.htm
l
D.C. George © 2012 17
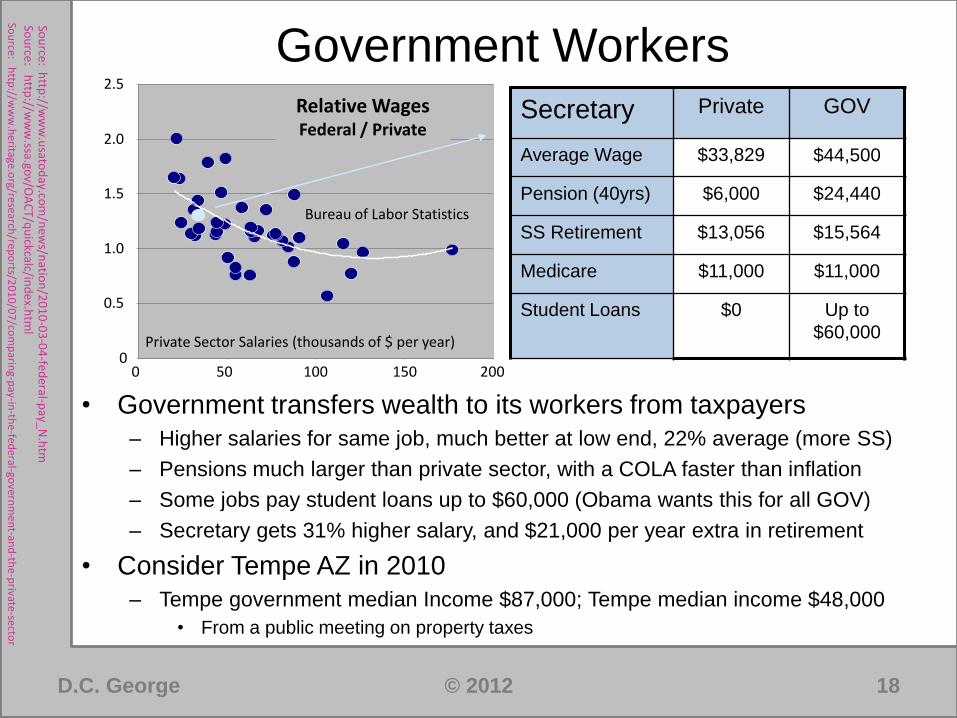
Government Workers
• Government transfers wealth to its workers from taxpayers
– Higher salaries for same job, much better at low end, 22% average (more SS)
– Pensions much larger than private sector, with a COLA faster than inflation
– Some jobs pay student loans up to $60,000 (Obama wants this for all GOV)
– Secretary gets 31% higher salary, and $21,000 per year extra in retirement
• Consider Tempe AZ in 2010
– Tempe government median Income $87,000; Tempe median income $48,000
• From a public meeting on property taxes
Secretary Private GOV
Average Wage $33,829 $44,500
Pension (40yrs) $6,000 $24,440
SS Retirement $13,056 $15,564
Medicare $11,000 $11,000
Student Loans $0 Up to
$60,000
0
0.5
1.0
1.5
2.0
2.5
0 50 100 150 200
Relative Wages Federal / Private
Sou
rce: http
://ww
w.u
satod
ay.com
/new
s/natio
n/2
01
0-0
3-0
4-fed
eral-pay_N
.htm
Bureau of Labor Statistics
Sou
rce: http
://ww
w.ssa.go
v/OA
CT/q
uickcalc/in
dex.h
tml
Sou
rce: http
://ww
w.h
eritage.org/research
/repo
rts/20
10
/07
/com
parin
g-pay-in
-the-fed
eral-govern
me
nt-an
d-th
e-private-secto
r
Private Sector Salaries (thousands of $ per year)
D.C. George © 2012 18
GM Bailout • To understand Obama’s involvement, look at what was different from a
standard Chapter 11 Bankruptcy
• Typical Chapter 11 Bankruptcy
– Company walks away from some debts, gets new cash, and continues
– There is a strict order of who gets paid and who doesn’t
– All employees get squeezed
• Differences suggest Obama got involved to redistribute wealth to the Union
– $20 B from bond holders to the Union retirement trusts
• Bond holders are ordinary people who’ve saved
– Invested $52 B to protect Union wages
• Those wages will come out of the stockholders value (Governments value)
– Potentially $27B from the Government to under funded Union pensions
D.C. George © 2012 19
Obamacare • Is mostly redistribution, not healthcare
– As we’ve seen everyone in the US was covered in one way or another
– Increases mandatory services, and therefore costs
– Subsidizes healthcare to “400% of Poverty” ($88K family of 4)
– Use control to force political agendas (recent contraception issue)
– Penalty on “uninsured” not enough to force enrolment
• Roughly the same choice for uninsured as before
• And with pre-existing coverage, more people will choose to be uninsured
• Seems to expand coverage for illegal aliens
– Only cost containment is the “Death Panel”
• Cost benefit analysis of service
• Can deny service even if you have the cash to pay
• Which means the Government will redistribute services
• Based on the 1200+ Obamacare waivers, redistribution will be arbitrary
D.C. George © 2012 20
Cap & Trade • Is a huge national and international redistribution scheme
– Thought up by Enron and pushed by Al Gore
• Nationally
– Government hands out carbon burning credits to companies
– Credits can be sold (from one needing less, to one wanting more)
– Government can reward industries or friends, while punishing enemies
• Literally the same as handing out cash, or taxing heavily
• Internationally
– The UN will do the same for nations – capping the credits a nation can hand out
– Redistributing from industrialized nations to others
• Allows UN to punish nations arbitrarily (tyranny)
• Remember, Global Warming is a hoax that supports Cap & Trade
– Perpetrated by the UN-IPCC and a handful of scientist
• See D.C. George paper on Global Warming and Green Energy
D.C. George © 2012 21

Other Redistribution
• Most tax breaks have a cut off at ~ $100,000 income
– Bush Tax Refund
– Obama first time home buyer tax credit
– Roth IRA
• Most GOV agencies practice some form of redistribution
– Transportation justifies busses, vans, & light rail as for the poor
• Most funding is from taxing non-riders (businesses & general funds)
• Free or reduced fares for poor, elderly, and students
– Free cell phones for the poor ($1.25 B) from the USAC (FCC)
– Tax discount; foreigners count relatives living back home as dependents
• Costs the government just as much as the “Buffet Rule” would collect
• Congress knows and does nothing ($4 B)
• These and countless more don’t count as Entitlements, but should
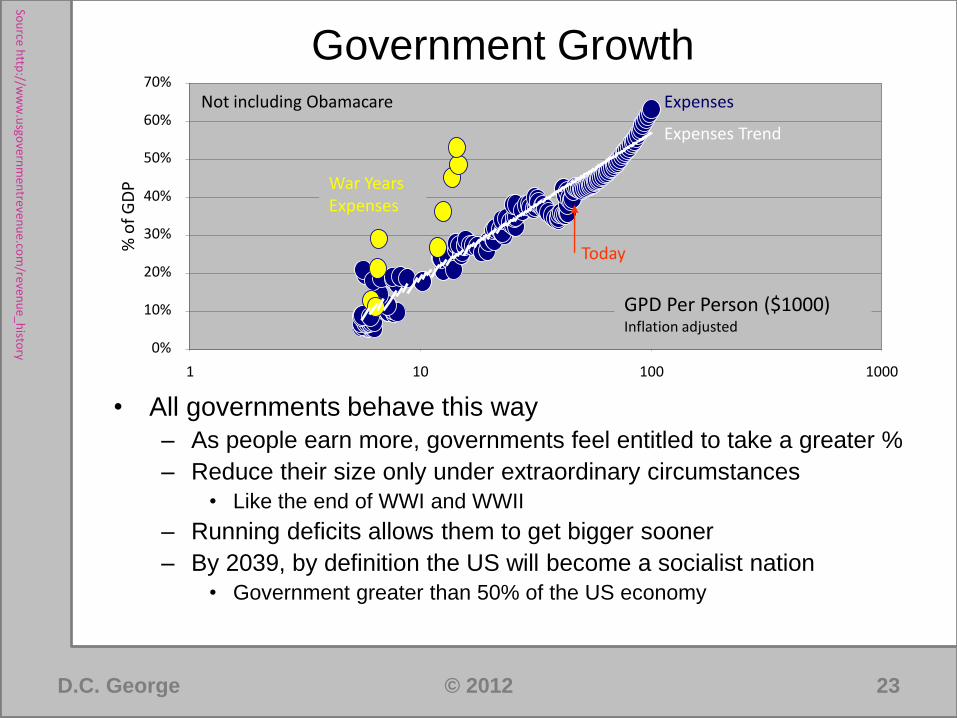
Government Growth
• All governments behave this way
– As people earn more, governments feel entitled to take a greater %
– Reduce their size only under extraordinary circumstances
• Like the end of WWI and WWII
– Running deficits allows them to get bigger sooner
– By 2039, by definition the US will become a socialist nation
• Government greater than 50% of the US economy
Sou
rce http
://ww
w.u
sgovern
men
trevenu
e.com
/revenu
e_h
istory
0%
10%
20%
30%
40%
50%
60%
70%
1 10 100 1000
GPD Per Person ($1000) Inflation adjusted
Expenses
Expenses Trend
War Years Expenses
% o
f G
DP
Today
Not including Obamacare
D.C. George © 2012 23
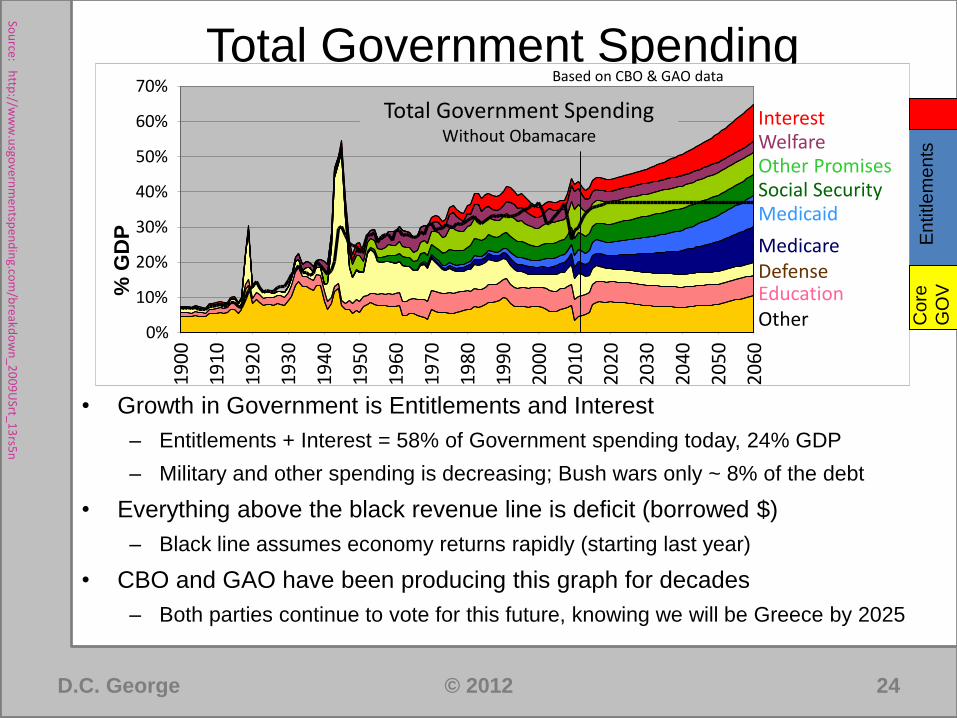
Total Government Spending
• Growth in Government is Entitlements and Interest
– Entitlements + Interest = 58% of Government spending today, 24% GDP
– Military and other spending is decreasing; Bush wars only ~ 8% of the debt
• Everything above the black revenue line is deficit (borrowed $)
– Black line assumes economy returns rapidly (starting last year)
• CBO and GAO have been producing this graph for decades
– Both parties continue to vote for this future, knowing we will be Greece by 2025
0%
10%
20%
30%
40%
50%
60%
70%
19
00
19
10
19
20
19
30
19
40
19
50
19
60
19
70
19
80
19
90
20
00
20
10
20
20
20
30
20
40
20
50
20
60
Interest Welfare Other Promises Social Security Medicaid
Medicare
Defense Education
Other
% G
DP
Based on CBO & GAO data
En
title
me
nts
C
ore
GO
V
Total Government Spending Without Obamacare
Sou
rce: http
://ww
w.u
sgovern
men
tspen
din
g.com
/breakd
ow
n_2
00
9U
Srt_1
3rs5
n
D.C. George © 2012 24

Debt
• Deficits redistribute from the next generation to the current
– When payment comes due, GOV will punish those who saved, and those who went to College
• Government is cash flow business, and will never repay Trust Fund IOUs
– Cites are beginning to declare bankruptcy to avoid under funded pensions
– If the Fed helps States avoid bankruptcy, then prudent States will be bail out the irresponsible
• How far are we going to go, before we start paying our debts?
– Answer: Current path is to accelerate into the wall …
Debt Source Amount
Federal Debt $16.0 T
State & Local Debt $ 2.4 T
Under Funded State Pensions $ 2.5 T
SS Retirement Trust Fund IOU $ 2.5 T
SS Disability Trust Fund IOU $ .2 T
Medicare Trust Funds IOU $ 0.4 T
Total Government Debt ~ $ 24.0 T
D.C. George © 2012 25
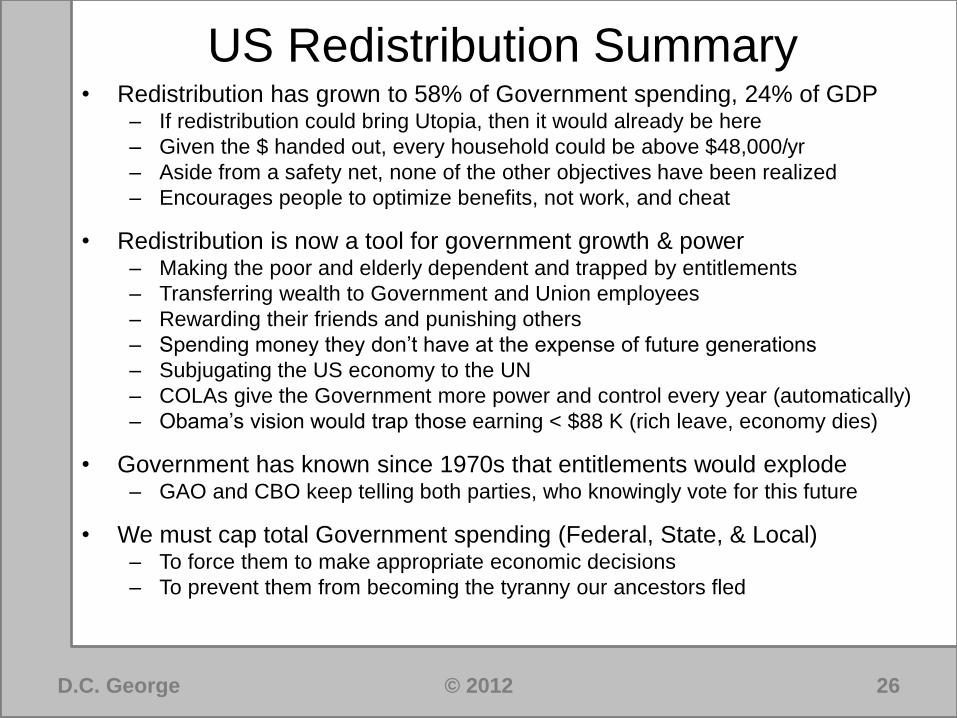
US Redistribution Summary • Redistribution has grown to 58% of Government spending, 24% of GDP
– If redistribution could bring Utopia, then it would already be here
– Given the $ handed out, every household could be above $48,000/yr
– Aside from a safety net, none of the other objectives have been realized
– Encourages people to optimize benefits, not work, and cheat
• Redistribution is now a tool for government growth & power – Making the poor and elderly dependent and trapped by entitlements
– Transferring wealth to Government and Union employees
– Rewarding their friends and punishing others
– Spending money they don’t have at the expense of future generations
– Subjugating the US economy to the UN
– COLAs give the Government more power and control every year (automatically)
– Obama’s vision would trap those earning < $88 K (rich leave, economy dies)
• Government has known since 1970s that entitlements would explode – GAO and CBO keep telling both parties, who knowingly vote for this future
• We must cap total Government spending (Federal, State, & Local) – To force them to make appropriate economic decisions
– To prevent them from becoming the tyranny our ancestors fled
D.C. George © 2012 26

D.C. George © 2012
Questions ?
D.C. George © 2012 [email protected]
Please forward, post or present as you wish, as long as it is complete and unedited

National Incomes
• Single Pie Theory (Robin Hood) – There is a fixed amount of wealth (nationally and internationally), so
– Rich people took too much from others, so fair to take it and give it back
• Data does not agree: Populations get wealthier together – Study from 1960 to 1980, most countries increased real $ per person
• Few that did not were tiny and could not have funded the others (ravaged by civil war or drugs)
– In 1900, most US homes did not have a car, electricity, or plumbing … • In 2005, 74% of US Poor had a car, 99% had a TV, 63% had Cable or Satellite, 75% had AC
100
1,000
10,000
10,0000
1960 1980
US
GDP $ Per Person Per Year Inflation Adjusted $
Source: Wikipedia
D.C. George © 2012 28
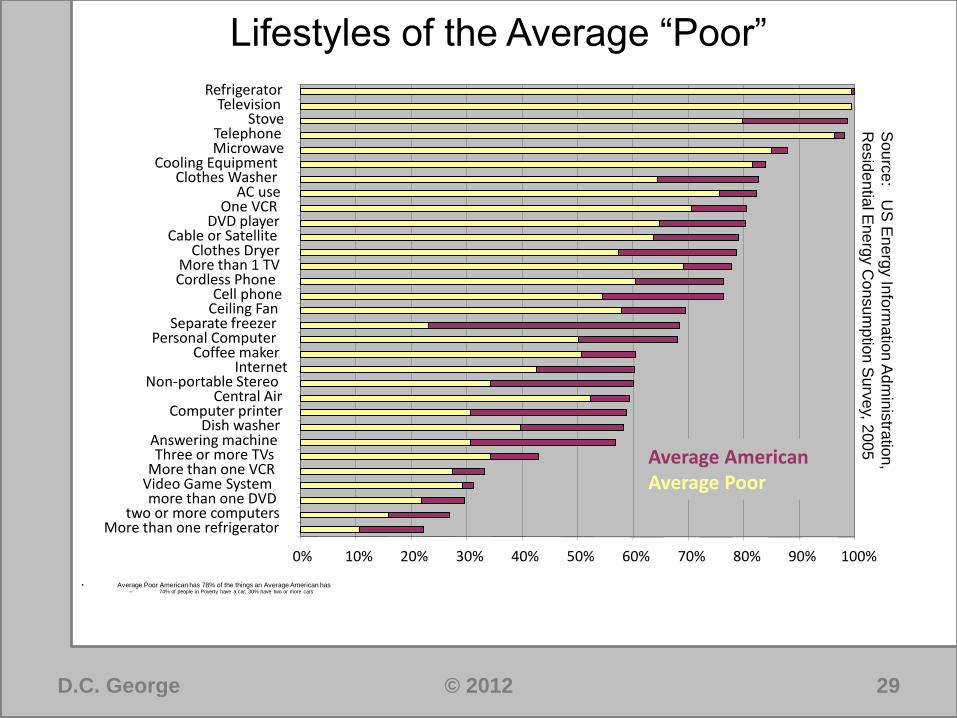
Lifestyles of the Average “Poor”
• Average Poor American has 78% of the things an Average American has – 74% of people in Poverty have a car; 30% have two or more cars
0% 10% 20% 30% 40% 50% 60% 70% 80% 90% 100%
More than one refrigerator two or more computers
more than one DVD Video Game System More than one VCR Three or more TVs
Answering machine Dish washer
Computer printer Central Air
Non-portable Stereo Internet
Coffee maker Personal Computer
Separate freezer Ceiling Fan Cell phone
Cordless Phone More than 1 TV
Clothes Dryer Cable or Satellite
DVD player One VCR
AC use Clothes Washer
Cooling Equipment Microwave Telephone
Stove Television
Refrigerator
Average American Average Poor
So
urc
e: U
S E
ne
rgy In
form
atio
n A
dm
inis
tratio
n,
Resid
en
tial E
ne
rgy C
on
su
mp
tion S
urv
ey, 2
00
5
D.C. George © 2012 29
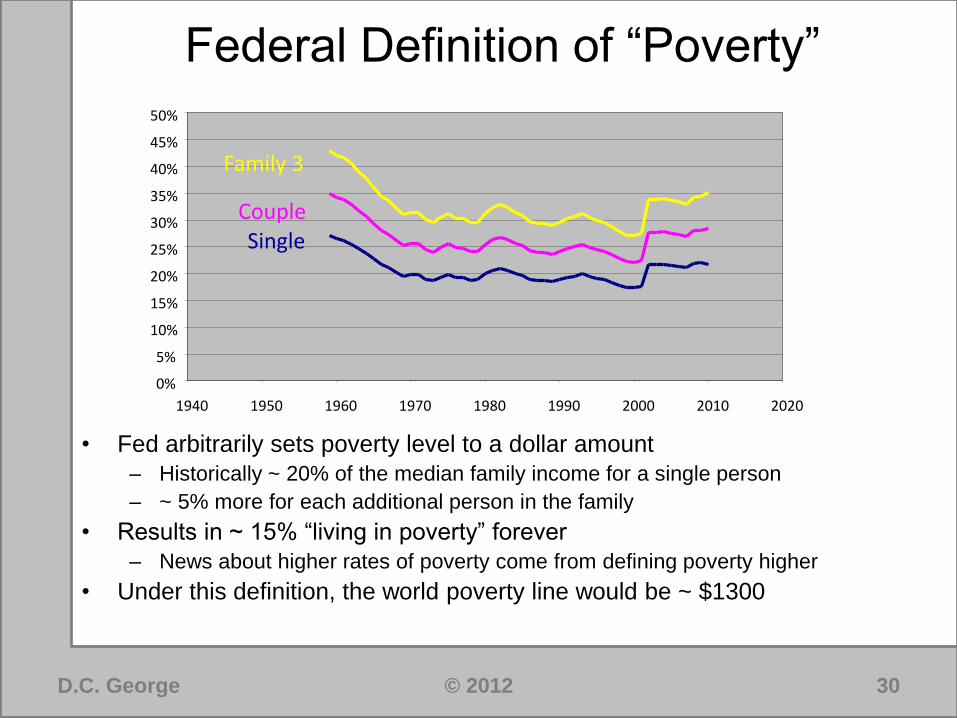
Federal Definition of “Poverty”
• Fed arbitrarily sets poverty level to a dollar amount
– Historically ~ 20% of the median family income for a single person
– ~ 5% more for each additional person in the family
• Results in ~ 15% “living in poverty” forever
– News about higher rates of poverty come from defining poverty higher
• Under this definition, the world poverty line would be ~ $1300
0%
5%
10%
15%
20%
25%
30%
35%
40%
45%
50%
1940 1950 1960 1970 1980 1990 2000 2010 2020
Single Couple
Family 3
D.C. George © 2012 30


![Market Profile -- Armour Square [34] · Population Density in 2009 14,323 Square Mileage 0.99 Median Household Income 2009 $32,039 Median Household Income 2000 $26,965 Average Household](https://img.pdfslide.us/doc/110x75/5f7c2e99da23b15fb70a4fc2/market-profile-armour-square-34-population-density-in-2009-14323-square-mileage.jpg)