Embed Size (px)
Citation preview
1Q 2018
US PE Middle Market
Sponsored by In partnership with Co-sponsored by

Predictable outcomes through changing market cycles. And a certainty of execution that our clients have come to expect from a market leader. Through 20+ years of innovative financing, our consistency is what makes us different.
Antares.com
ContentsKey takeaways 3
A note from Antares Capital 4
Overview 5
Spotlight: Add-ons 7
Antares Capital: Q&A 9
Exits 12
A note from Chubb 14
Fundraising 16
Credits & Contact
PitchBook Data, Inc.
John Gabbert Founder, CEOAdley Bowden Vice President, Market Development & Analysis
Content
Dylan Cox Senior Analyst, PE Darren Klees Data Analyst
Contact PitchBook
pitchbook.com
Research [email protected]
Editorial [email protected]
Sales [email protected]
Cover design by Eric Maloney
Click here for PitchBook’s report methodologies.
Key takeaways from the analyst
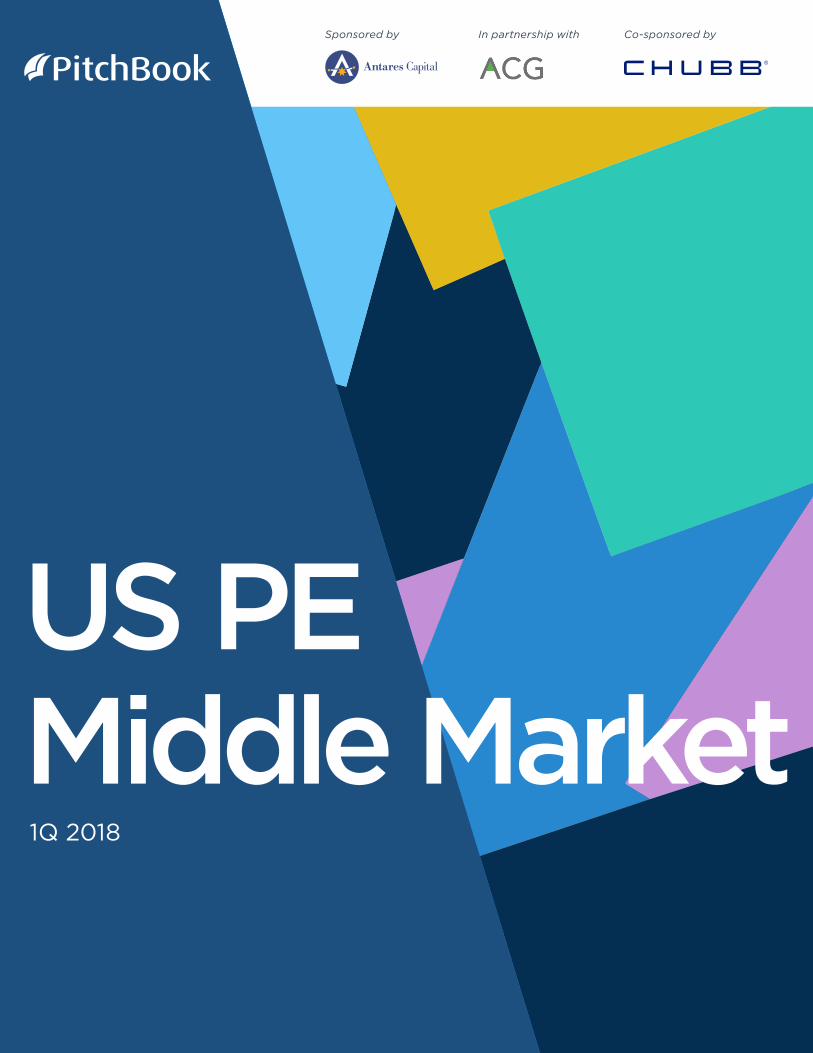
• After a record-setting 2017 in terms of
both deal value and transaction count,
the US PE middle market got off to
a mixed start in 1Q 2018. 619 middle-
market transactions were completed,
totaling $53.6 billion in deal value—a 17%
increase and 40% decrease, respectively,
compared to the prior year.
• US MM fundraising activity has
hovered at elevated levels in recent
years, and 2018 is shaping up for more
of the same. PE firms closed on $29
billion across 36 funds in 1Q 2018.
• After totaling at least $20 billion each
quarter for nearly two years, US PE
middle-market exit value dipped to just
$11.9 billion in 1Q 2018. In addition, just
165 exits were completed, representing
a 26% falloff from the previous year.
$53.6B in deal value across
619 middle-market PE transactions
$29B amount PE firms closed across 36 MM funds in
1Q 2018
$11.9B MM PE-backed exit value
in 1Q 2018
PITCHBOOK 1Q 2018 US PE MIDDLE MARKET REPORT3
Sponsored by In partnership with Co-sponsored by
Antares Capital
As noted in our January Compass
report, cyclical indicators coming into
2018 appeared favorable, suggesting
the sustained US economic expansion
still has room to run. Moreover, our
recent 2nd Annual Compass survey
of middle-market PE sponsors,
borrowers and investors suggests
that optimism over the US economy,
which had already been high, has
only gained steam. The vast majority
of respondents see a recession in
the next 12 months as unlikely or
very unlikely, with loan default rates
expected to remain low. Companies
are forecasting strong revenue
and EBITDA growth ahead and
are accelerating their hiring. More
recent upside surprises in March in
employment and consumer confidence
data would seem to lend support to
the favorable outlook.
Keep a firm hand on the tiller
Turning to loan markets, our
Compass survey indicated that most
respondents expect M&A/leveraged
buyout activity to continue to hold
up well in 2018, with 88% of middle-
market PE sponsors foreseeing a
net-neutral impact of the new tax
legislation on LBO activity, at least
on an aggregate level. Nevertheless,
strong demand from yield-hungry
investors continues to outpace new
loan supply. CLO issuance and middle-
market fundraising are expected to
remain robust, with loan mutual fund
inflows continuing.
Looking forward, healthy optimism
appears well-founded but can breed
complacency, as evidenced by rising
leverage, lower spreads and looser
terms. While there may well be smooth
sailing ahead, one must remember a
squall can form quickly. The 2-year to
10-year T-note spread has yet to invert
(a fairly reliable harbinger of recessions
historically), but it has continued to
narrow. The VIX—a measure of stock
market volatility—has picked up since
early February as worries related to
potential trade tariffs (which came
after our Compass survey) have rattled
the market. There is no shortage of
other risks that could potentially flare
up. As such, credit discipline has
become all the more critical. “We’re
always worried,” said David Brackett,
Antares co-CEO. “People ask us what
inning of the baseball game we are in.
As a lender, we have to presume we’re
in the bottom of the ninth.”
Optimism remains the prevailing wind, but the seas could start to get choppy.
With more than $20 billion of capital under management and administration, Antares
Capital is a private debt credit manager and leading provider of financing solutions
for middle-market PE-backed transactions. In 2017, Antares issued over $21 billion in
financing commitments to borrowers through its robust suite of products including
first-lien revolvers, term loans and delayed draw term loans, second-lien term loans,
unitranche facilities and equity investments. Antares was the lead left arranger for approximately $17 billion of first-lien and
second-lien credit facilities during 2017, and the company’s world-class capital markets experts hold relationships with over 400
banks and institutional investors allowing the firm to structure, distribute and trade syndicated loans on behalf of its customers.
Since its founding in 1996, Antares has been recognized by industry organizations as a leading provider of middle-market private
debt, most recently being named the 2017 Lender of the Year by ACG New York. The company maintains offices in Atlanta;
Chicago; Los Angeles; New York; Norwalk, CT; and Toronto. Visit Antares at www.antares.com or follow the company on Twitter at
www.twitter.com/antarescapital. Antares Capital is a subsidiary of Antares Holdings LP.
Sponsored by
PITCHBOOK 1Q 2018 US PE MIDDLE MARKET REPORT4
Overview
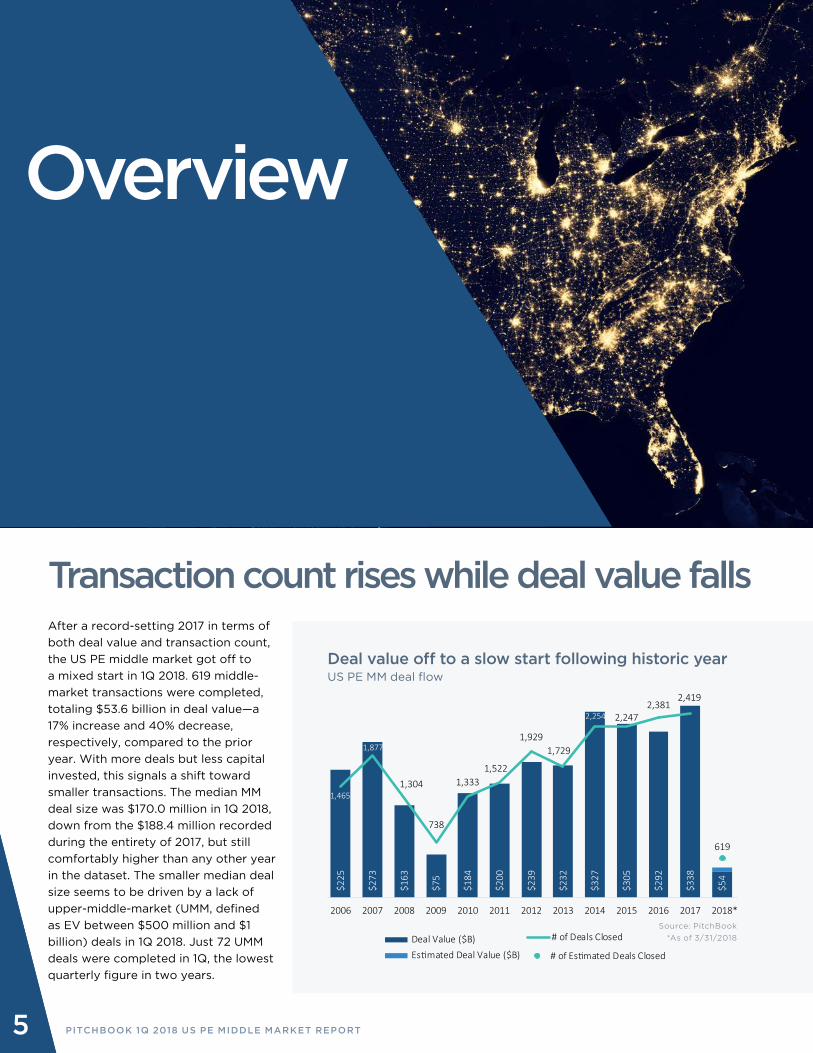
Transaction count rises while deal value fallsAfter a record-setting 2017 in terms of
both deal value and transaction count,
the US PE middle market got off to
a mixed start in 1Q 2018. 619 middle-
market transactions were completed,
totaling $53.6 billion in deal value—a
17% increase and 40% decrease,
respectively, compared to the prior
year. With more deals but less capital
invested, this signals a shift toward
smaller transactions. The median MM
deal size was $170.0 million in 1Q 2018,
down from the $188.4 million recorded
during the entirety of 2017, but still
comfortably higher than any other year
in the dataset. The smaller median deal
size seems to be driven by a lack of
upper-middle-market (UMM, defined
as EV between $500 million and $1
billion) deals in 1Q 2018. Just 72 UMM
deals were completed in 1Q, the lowest
quarterly figure in two years.
$225
$273
$163
$75
$184
$200
$239
$232
$327
$305
$292
$338
$54
1,465
1,877
1,304
738
1,333 1,522
1,929 1,729
2,254 2,247 2,381
2,419
619
2006 2007 2008 2009 2010 2011 2012 2013 2014 2015 2016 2017 2018*
Deal Value ($B)Es�mated Deal Value ($B)
# of Deals Closed
# of Es�mated Deals Closed
Deal value off to a slow start following historic year US PE MM deal flow
Source: PitchBook
*As of 3/31/2018
5 PITCHBOOK 1Q 2018 US PE MIDDLE MARKET REPORT
OVERVIEW
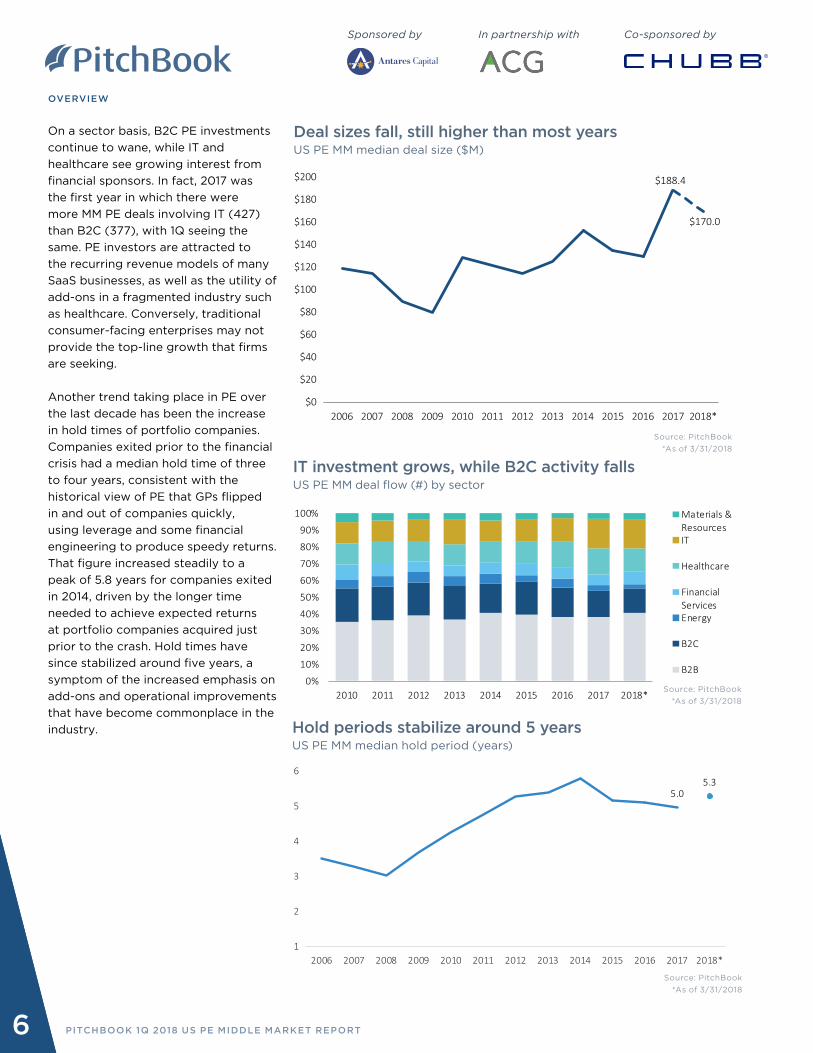
On a sector basis, B2C PE investments
continue to wane, while IT and
healthcare see growing interest from
financial sponsors. In fact, 2017 was
the first year in which there were
more MM PE deals involving IT (427)
than B2C (377), with 1Q seeing the
same. PE investors are attracted to
the recurring revenue models of many
SaaS businesses, as well as the utility of
add-ons in a fragmented industry such
as healthcare. Conversely, traditional
consumer-facing enterprises may not
provide the top-line growth that firms
are seeking.
Another trend taking place in PE over
the last decade has been the increase
in hold times of portfolio companies.
Companies exited prior to the financial
crisis had a median hold time of three
to four years, consistent with the
historical view of PE that GPs flipped
in and out of companies quickly,
using leverage and some financial
engineering to produce speedy returns.
That figure increased steadily to a
peak of 5.8 years for companies exited
in 2014, driven by the longer time
needed to achieve expected returns
at portfolio companies acquired just
prior to the crash. Hold times have
since stabilized around five years, a
symptom of the increased emphasis on
add-ons and operational improvements
that have become commonplace in the
industry.
$188.4
$170.0
$0
$20
$40
$60
$80
$100
$120
$140
$160
$180
$200
2006 2007 2008 2009 2010 2011 2012 2013 2014 2015 2016 2017 2018*
Deal sizes fall, still higher than most years
US PE MM median deal size ($M)
5.05.3
1
2
3
4
5
6
2006 2007 2008 2009 2010 2011 2012 2013 2014 2015 2016 2017 2018*
Hold periods stabilize around 5 years
US PE MM median hold period (years)
Source: PitchBook
*As of 3/31/2018
Source: PitchBook
*As of 3/31/2018
0%
10%
20%
30%
40%
50%
60%
70%
80%
90%
100%
2010 2011 2012 2013 2014 2015 2016 2017 2018*
Materials &ResourcesIT
Healthcare
FinancialServicesEnergy
B2C
B2B
IT investment grows, while B2C activity falls US PE MM deal flow (#) by sector
Source: PitchBook
*As of 3/31/2018
PITCHBOOK 1Q 2018 US PE MIDDLE MARKET REPORT6
Sponsored by In partnership with Co-sponsored by
SpotlightAdd-ons’ increasing popularity
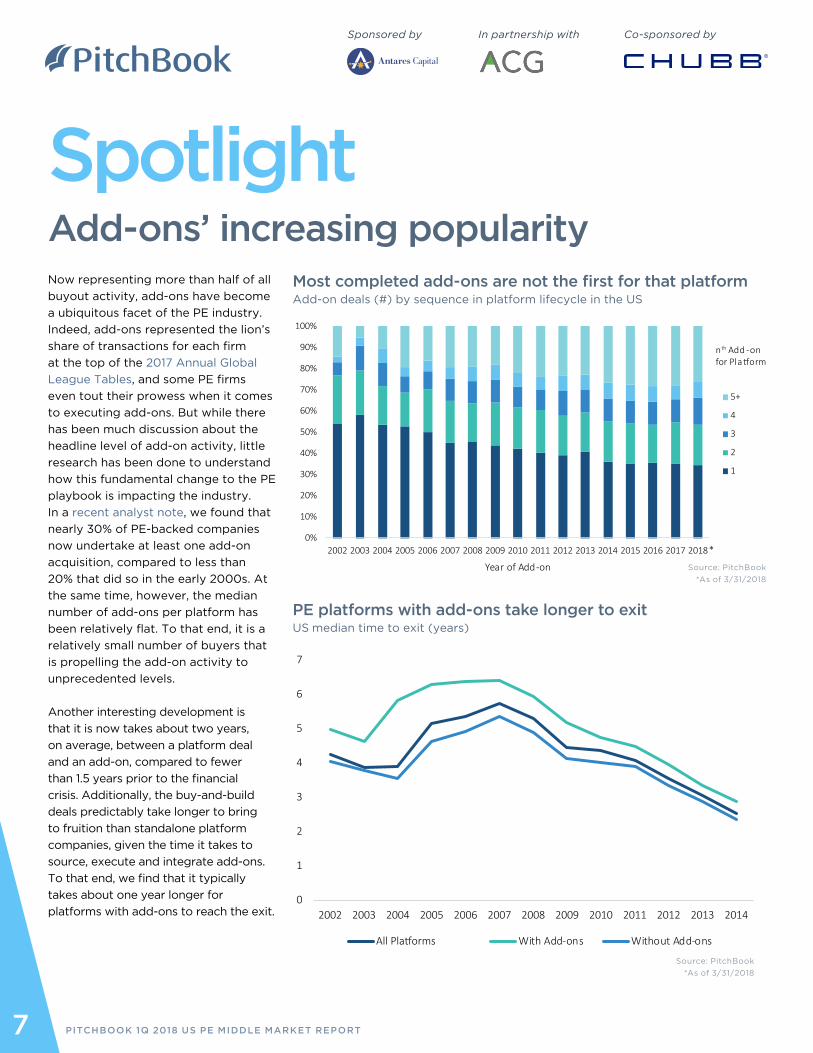
Now representing more than half of all
buyout activity, add-ons have become
a ubiquitous facet of the PE industry.
Indeed, add-ons represented the lion’s
share of transactions for each firm
at the top of the 2017 Annual Global
League Tables, and some PE firms
even tout their prowess when it comes
to executing add-ons. But while there
has been much discussion about the
headline level of add-on activity, little
research has been done to understand
how this fundamental change to the PE
playbook is impacting the industry.
In a recent analyst note, we found that
nearly 30% of PE-backed companies
now undertake at least one add-on
acquisition, compared to less than
20% that did so in the early 2000s. At
the same time, however, the median
number of add-ons per platform has
been relatively flat. To that end, it is a
relatively small number of buyers that
is propelling the add-on activity to
unprecedented levels.
Another interesting development is
that it is now takes about two years,
on average, between a platform deal
and an add-on, compared to fewer
than 1.5 years prior to the financial
crisis. Additionally, the buy-and-build
deals predictably take longer to bring
to fruition than standalone platform
companies, given the time it takes to
source, execute and integrate add-ons.
To that end, we find that it typically
takes about one year longer for
platforms with add-ons to reach the exit.
0%
10%
20%
30%
40%
50%
60%
70%
80%
90%
100%
2002 2003 2004 2005 2006 2007 2008 2009 2010 2011 2012 2013 2014 2015 2016 2017 2018
Year of Add-on
5+
4
3
2
1
nth Add -on for Pla�orm
*
0
1
2
3
4
5
6
7
2002 2003 2004 2005 2006 2007 2008 2009 2010 2011 2012 2013 2014
All Pla�orms With Add-ons Without Add-ons
Most completed add-ons are not the first for that platform
Add-on deals (#) by sequence in platform lifecycle in the US
PE platforms with add-ons take longer to exit
US median time to exit (years)
Source: PitchBook
*As of 3/31/2018
Source: PitchBook
*As of 3/31/2018
PITCHBOOK 1Q 2018 US PE MIDDLE MARKET REPORT7
Sponsored by In partnership with Co-sponsored by

What is CraftsmanshipSM?To be crafted is to meet exacting standards.
It’s the human touch that combines art andscience to create something unique.
We tend to think about craftsmanship in terms of physical things: fine wine, classic cars, custom furniture and iconic structures.
But what about the underwriting of insurance to craft protection for your unique and valuable things? And the service behind that coverage when you need it most — like claims and loss prevention?
For your business.
Your employees.
Your home.
The people you love.
Things that need a particular kind of protection and service.
The kind Chubb provides.
Not just coverage. Craftsmanship.SM
Not just insured.
Chubb. Insured.SM
©20
18 C
hubb
. Cov
erag
es u
nder
wri
tten
by o
ne o
r mor
e su
bsid
iary
com
pani
es. N
ot a
ll co
vera
ges a
vaila
ble
in a
ll ju
risd
ictio
ns.
Chub
b®, i
ts lo
go, N
ot ju
st c
over
age.
Cra
ftsm
ansh
ip.SM
and
Chu
bb. I
nsur
ed.SM
are
pro
tect
ed tr
adem
arks
of C
hubb
.
chubb.com
Amid an active yet pricey dealmaking
environment for PE firms, what key
trends in the lending market for US
middle-market companies will be most
impactful in 2018?
The capital markets for loans remain
wide open for business with favorable
pricing and terms. This is perhaps a
mixed blessing for middle-market
PE firms looking to do deals. On the
positive side, favorable capital markets
foster deal flow and allow PE firms
to bid competitively against strategic
competitors who are increasingly flush
with cash. We are seeing increased
repricing/refi activity, which had already
boomed early last year in the broadly
syndicated market, but has become
more prevalent of late in the middle
market. Meanwhile, terms continue
Q&A: Antares Capital’s David Brackett & John Martin
David Brackett Dave is a managing partner and co-CEO of Antares Capital. He is a member of Antares’ Investment Committee as well as Antares’ Board of Directors.
Previously, Dave served as president and CEO for GE Antares. He was a founding partner when Antares was formed in 1996. Prior to starting Antares, Dave was a senior executive with Heller Financial.
He began his career at Continental Illinois National Bank. Dave graduated from the University of Denver, and earned an MBA from Northwestern University’s Kellogg Graduate School of Management.
to loosen and spreads to narrow. Of
course, on the negative side, easy access
to capital has also contributed to the
rise in LBO purchase price multiples
that are making it increasingly difficult
for PE investors to hit their return
targets. Consequently, PE firms have
been increasingly turning to add-on
acquisitions as a means of averaging
down their purchase price multiples and/
or increasing platform value creation
opportunities.
While our working assumption is that
capital market conditions will remain
favorable, as history has demonstrated,
the window can close quickly if markets
get spooked for any number of reasons.
This is why we, as a lender, feel it is
critical to be able to offer our sponsor
clients multiple financing solutions
that allow for the best execution in any
market condition whether that entails
leveraging our deep capital markets
distribution capabilities, private club
deal networks or unitranche execution
capabilities (e.g., Antares Bain Capital
Complete Financing Solution (ABCS)).
One of the broader macro trends
we’ve seen in PE dealmaking has
been the popularity of secondary
buyouts. With regard to helping finance
these transactions, what’s Antares’
perspective on their benefits and
challenges?
Sponsor-to-sponsor activity has picked
up over the last few years, reflecting
pressures to put dry powder to work on
the buy side and desire for sponsors to
exit aging investments on the sell side.
John Martin John is a managing partner and co-CEO of Antares Capital. John is a member of Antares’ Investment Committee as well as Antares’ Board of Directors. He was a founding partner when Antares was formed in 1996. Previously, John was the leader of GE’s Global Capital Markets. He also served as president and CEO for GE Antares. Prior to forming Antares, John was a senior executive with Heller Financial. He began his career with Continental Illinois National Bank. John earned his BBA in finance from the University of Notre Dame.
PITCHBOOK 1Q 2018 US PE MIDDLE MARKET REPORT9
Sponsored by

Sponsors have increasingly been fishing
for deals in each other’s portfolios
because they know potentially promising
companies will come up for sale in
three or more years. This allows them
to focus early due diligence efforts
and potentially improve their bidding
position when auction time comes—or
perhaps even preempt the auction
process. In fact, often sponsors that lost
out in the initial auction may bid again
the next time the company comes up
for sale, having already done the initial
due diligence and found the business
attractive. We even see cases where the
sponsor owned the company before and
is buying it again.
PitchBook stats show over 50% of
middle-market exit volume being
secondary buyouts, which appears to
be directionally in line with what we
see. Also, a large proportion of our SBO
volume is related to companies already
in our portfolio, which underscores the
competitive advantage that comes with
having one of the largest sponsored
middle-market loan portfolios in the
industry.
From a lender perspective, while every
deal is unique, as a generalization, SBOs
are viewed favorably since the credit is
usually seasoned and well-understood
with a track record of revenue & EBITDA
growth. However, one must scrutinize
EBITDA add-backs and add-forwards in
the context of the next sponsor owner’s
phase 2 or 3 of value creation, as much
of the low-hanging fruit has likely already
been picked by the original sponsor owner.
Recently, it appears that cov-lite
incidence varies widely across different
segments of the market. What trends in
covenants are you seeing across the US
middle market? What other important
trends in structuring are you tracking?
Covenant-lite structures, which have
traditionally been common in the large
corporate/broadly syndicated loan
market, have increasingly penetrated
into the sponsored middle market, rising
from 9% of sponsored middle-market
issuance in 2016 to 26% in 2017 and to
37% in 4Q 2017. Traditionally cov-lite
was rare for companies in the sub-$50
million EBITDA range, but now it is more
common in the $40 million-$50 million
zone.
While covenants are important to
lenders to help mitigate potential losses,
historically, lender success has been
more reliant on picking solid credits
than enforcing convenants. In our case,
the vast majority of cov-lite deals we’ve
done in the last year or so have been
with portfolio companies whose credits
we know well.
Of course, EBITDA add-backs and add-
forwards and loosening of other terms
(e.g., around restricted payments and
incremental debt capacity) are other
important areas of challenge for lenders
in the current environment.
As Antares’ most recent Compass
Report details, leverage levels remain
a significant area of concern for many.
How are these concerns best mitigated
in the current environment by firms such
as Antares?
While leverage levels have crept upward
on middle-market LBOs in terms of debt
to EBITDA, they remain below broadly
syndicated deal levels, particularly in
the private/club deal market. Also,
equity contributions to middle-market
LBOs have risen meaningfully along
with enterprise valuations. Finally, debt
service measures remain favorable given
low interest rates. Of course, if interest
rates were to spike, that could change,
but in general leverage levels do not
seem unreasonably high. Also, there
may well be exceptions where unrealistic
EBITDA add-backs/add-forwards mask
true debt leverage. The best way to
mitigate the issue of rising debt leverage
is credit discipline gleaned over decades
of experience through various cycles. Its
also critical to long-term performance
to have solid work-out capabilities to
mitigate losses whenever the downcycle
does come—a capability many new
lending entrants lack.
With regard to recent evolution in
adjustments of earnings and other
similar measures, how significantly are
such changes affecting overall leverage
levels?
EBITDA add-backs and add-forwards
have become increasingly prevalent and
can have a material impact on leverage
measures. Some claim that regulated
lenders have used such add-backs as a
way to be able to get around leveraged
lending guidelines (LLG). There are
various firms (e.g., Covenant Review;
Proskauer) that report on EBITDA
adjustment measures. For example, in its
2017 report, Proskauer shows an upward
migration in deals toward the high end
of the cap range for run-rate synergies.
Specifically, 85% of the deals it tracked
in 2H 2017 had a cap on run-rate synergy
expenses of between 20%-29.9% (the
higher end of the cap range) versus
58% of deals in 1H 2017. Likewise, the
cap on non-recurring expense has also
been trending higher, as has been the
percentage of deals with no cap.
The information in this report is for
informational purposes only, is current
as of the date noted, and should not be
used or taken as finance, legal or other
advice. The information presented should
not be deemed as a recommendation
to purchase or sell any securities or
investments. Although Antares Capital LP
believes that the information contained
herein has been obtained from sources
believed to be reliable, Antares Capital
LP does not guarantee its accuracy and
it may be incomplete or condensed.
Nothing within this publication should
be deemed to be a research report. Past
performance is not indicative of future
results.
PITCHBOOK 1Q 2018 US PE MIDDLE MARKET REPORT10
Sponsored by

M&A Heatmap: Antares Capital’s M&A loan activity deal count by industry trend1
1: Compares Antares Capital’s M&A-related funded and lost deal count in trailing four-month period ending March 31, 2018, versus four-month period end-ing November 30, 2017. Does not include open pipeline. Size of box is proportionate to deal count. Color indicates whether activity heated up or cooled down during periods compared to. Moody’s-based industry categorization.
M&A activity cooled modestly the last four months through March 2018 versus the prior four months through November 2017,
largely reflecting sluggish activity in January and February 2018; however, activity picked up sharply in March, and the open
pipeline in April (not reflected in heatmap) is also up year over year, with high-tech industries (including software and services)
heating up recently.
PITCHBOOK 1Q 2018 US PE MIDDLE MARKET REPORT11
Sponsored by
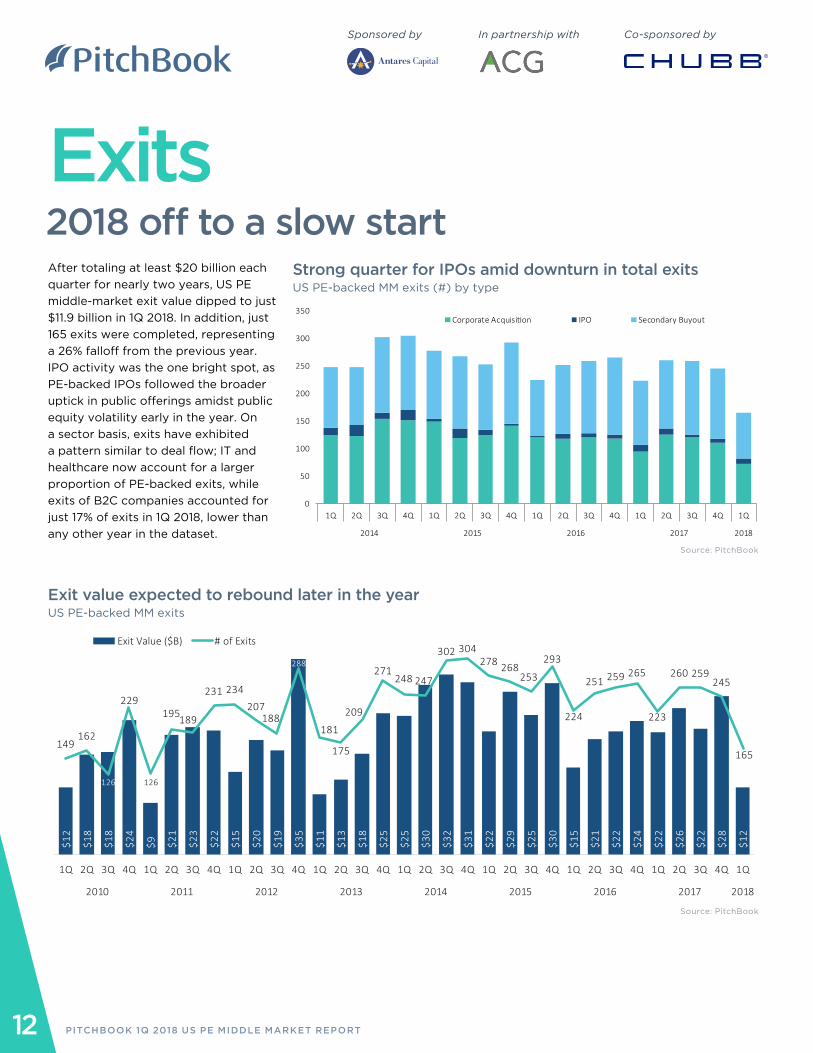
Exits After totaling at least $20 billion each
quarter for nearly two years, US PE
middle-market exit value dipped to just
$11.9 billion in 1Q 2018. In addition, just
165 exits were completed, representing
a 26% falloff from the previous year.
IPO activity was the one bright spot, as
PE-backed IPOs followed the broader
uptick in public offerings amidst public
equity volatility early in the year. On
a sector basis, exits have exhibited
a pattern similar to deal flow; IT and
healthcare now account for a larger
proportion of PE-backed exits, while
exits of B2C companies accounted for
just 17% of exits in 1Q 2018, lower than
any other year in the dataset.
$12
$18
$18
$24
$9 $21
$23
$22
$15
$20
$19
$35
$11
$13
$18
$25
$25
$30
$32
$31
$22
$29
$25
$30
$15
$21
$22
$24
$22
$26
$22
$28
$12
149162
126
229
126
195189
231 234207
188
288
181
175
209
271248 247
302 304278 268
253
293
224
251 259 265
223
260 259245
165
1Q 2Q 3Q 4Q 1Q 2Q 3Q 4Q 1Q 2Q 3Q 4Q 1Q 2Q 3Q 4Q 1Q 2Q 3Q 4Q 1Q 2Q 3Q 4Q 1Q 2Q 3Q 4Q 1Q 2Q 3Q 4Q 1Q
2010 2011 2012 2013 2014 2015 2016 2017 2018
Exit Value ($B) # of Exits
0
50
100
150
200
250
300
350
1Q 2Q 3Q 4Q 1Q 2Q 3Q 4Q 1Q 2Q 3Q 4Q 1Q 2Q 3Q 4Q 1Q
2014 2015 2016 2017 2018
Corporate Acquisi�on IPO Secondary Buyout
Exit value expected to rebound later in the year
US PE-backed MM exits
Strong quarter for IPOs amid downturn in total exits
US PE-backed MM exits (#) by type
Source: PitchBook
Source: PitchBook
2018 off to a slow start
PITCHBOOK 1Q 2018 US PE MIDDLE MARKET REPORT12
Sponsored by In partnership with Co-sponsored by
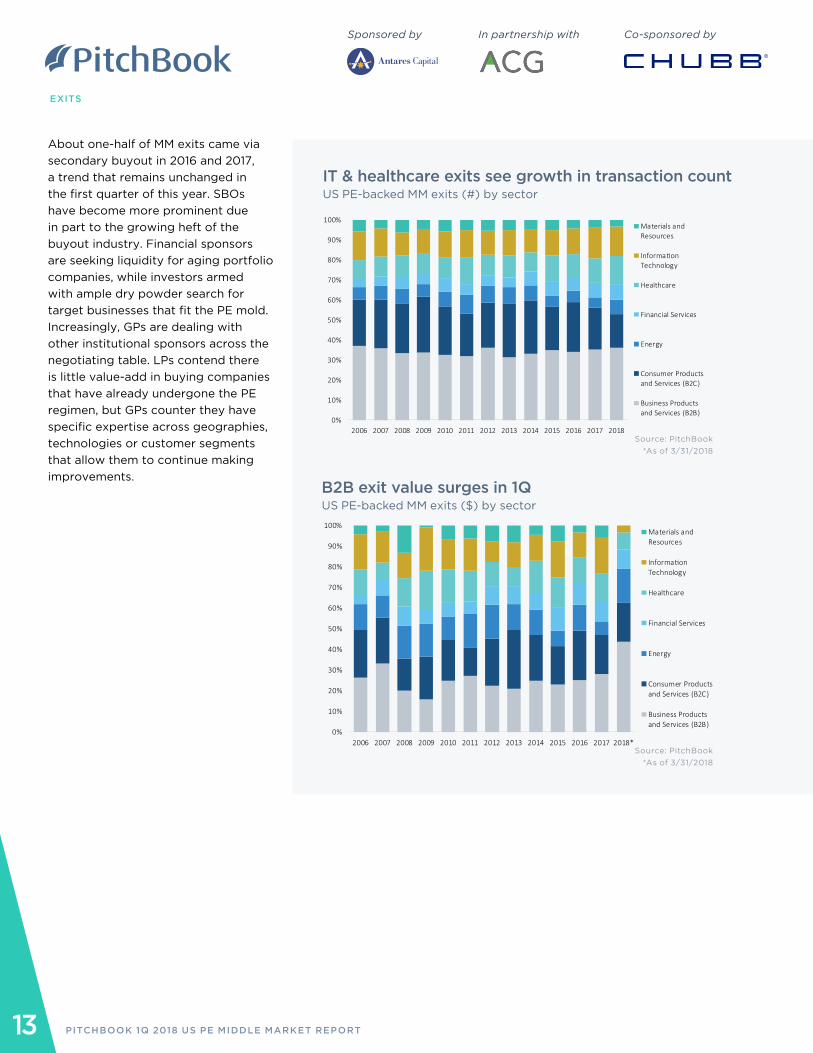
About one-half of MM exits came via
secondary buyout in 2016 and 2017,
a trend that remains unchanged in
the first quarter of this year. SBOs
have become more prominent due
in part to the growing heft of the
buyout industry. Financial sponsors
are seeking liquidity for aging portfolio
companies, while investors armed
with ample dry powder search for
target businesses that fit the PE mold.
Increasingly, GPs are dealing with
other institutional sponsors across the
negotiating table. LPs contend there
is little value-add in buying companies
that have already undergone the PE
regimen, but GPs counter they have
specific expertise across geographies,
technologies or customer segments
that allow them to continue making
improvements.
0%
10%
20%
30%
40%
50%
60%
70%
80%
90%
100%
2006 2007 2008 2009 2010 2011 2012 2013 2014 2015 2016 2017 2018
Materials andResources
Informa�onTechnology
Healthcare
Financial Services
Energy
Consumer Productsand Services (B2C)
Business Productsand Services (B2B)
IT & healthcare exits see growth in transaction count
US PE-backed MM exits (#) by sector
EXITS
Source: PitchBook
*As of 3/31/2018
Source: PitchBook
*As of 3/31/2018
B2B exit value surges in 1Q
US PE-backed MM exits ($) by sector
PITCHBOOK 1Q 2018 US PE MIDDLE MARKET REPORT13
Sponsored by In partnership with Co-sponsored by
0%
10%
20%
30%
40%
50%
60%
70%
80%
90%
100%
2006 2007 2008 2009 2010 2011 2012 2013 2014 2015 2016 2017 2018*
Materials andResources
Informa�onTechnology
Healthcare
Financial Services
Energy
Consumer Productsand Services (B2C)
Business Productsand Services (B2B)
PE dealmakers confront significant issues
over the cyber exposures of a target
acquisition. Last year was the worst on
record for cyberattacks, with nearly
half of all businesses held captive by
ransomware incidents alone, according to
a survey by Osterman Research.1
Companies of all sizes have experienced
data breaches, from the largest
enterprises to Main Street businesses.
The categories of cyberattacks are
also multiplying, as are the types of
attackers, which include hacktivists,
criminal enterprises and even possibly
nation-states.
Of notable concern, successful
cyberattacks are expected to increase
in the future. Attackers are proving to be
more sophisticated in their use of social
engineering techniques, cleverly inventing
new phishing scams that lure people to
click on malware-infected attachments.
Many companies are also rapidly
embracing new technologies that broaden
their exposure, including machine learning,
augmented intelligence, natural language
processing, big data analytics, robotics
and the Internet of Things. A forensic
analysis of a target acquisition’s cyber risks
that was performed during due diligence
1: Osterman Research, Understanding the Depth of the Global Ransomware Problem, August 2016
may no longer provide a credible
assessment of the company’s exposure
after the deal closes.
Even as the ink on the transaction
agreement dries, the merged entity’s
cyber exposures generally increase. As
the two organizations begin the process
of combining networks and multiple
systems, their respective data at specific
intersection points are vulnerable to
an attack. The reason is the need to
temporarily remove the filters at the
intersection points to permit data to flow
from one system to another.
Other factors can also contribute to
the combined entity’s enhanced cyber
risk profile. Each party’s cybersecurity
protocols may be dissimilar, and they
will need time to determine which
practices will remain in place, potentially
leaving the combined organization
exposed to security gaps in the interim.
Phishing-related data breaches post-
merger also tend to rise because each
company’s employees are unsure over
the authenticity of emails or other
communications they receive. Cyber
criminals are very cognizant of these
post-transaction vulnerabilities.
The growing concern over cybersecurity
is compelling investment managers to
conduct more thorough due diligence
of a potential acquisition’s cyber risks to
gauge the impact on post-transaction
value.
Even the best due diligence may not
uncover the full extent of a target
acquisition’s cyber risks, given the rapid
growth in the number and types of
sophisticated cyberattacks. One way
to mitigate such risks is to seek cyber
insurance from insurers that specialize
in M&A transactions. These insurers
typically provide a range of different
cyber insurance policies to absorb a
broad array of cyber risks, in addition to
multiline cyber peril endorsements that
address gaps in an insurance portfolio
placed with multiple brokers and carriers.
Some insurers also offer a variety of
valuable loss control services as part
of their insurance programs. These
services may include comprehensive
cyber risk assessments, continuous
detailed threat intelligence and analysis,
and post-incident forensic and crisis
management assistance. Thus, the right
cyber coverage along with associated
risk management services can help
identify and mitigate this evolving risk.
For more information about middle-
market PE, contact Ryan France at
[email protected]. For the full
whitepaper, click here.
ChubbAdaptation required Successful cyberattacks are expected to increase in the future
Chubb is the marketing name used to refer to subsidiaries of Chubb Limited providing insurance
and related services. For a list of these subsidiaries, please visit www.chubb.com. Insurance is
provided by US-based Chubb underwriting companies. All products may not be available in all
states. Coverage is subject to the language of the policies as actually issued. Surplus lines insurance is sold only through licensed surplus
lines producers. This information is advisory in nature and is for informational purposes only. No warranties or representations of any
kind are made to any party and no liability is assumed by reason of the information in this presentation. The information provided should
not be relied upon as legal advice. For such advice, a listener or reader should consult their own legal counsel. This presentation is
copyrighted and is the property of Chubb. Any use of this presentation without Chubb’s prior, written consent is prohibited.
PITCHBOOK 1Q 2018 US PE MIDDLE MARKET REPORT14
Co-sponsored by

FundraisingPoised to match prior years
US MM fundraising activity has hovered
at elevated levels in recent years, and
2018 is shaping up for more of the
same. PE firms closed on $29 billion
across 36 funds in 1Q 2018. While
this is in line with recent MM trends,
fundraising for mega-sized vehicles of
$5 billion or more hit a speed bump
early in the year. As a result, 79% of the
capital raised in 1Q came via MM funds,
up from just 52% in 2017; however,
we expect to see mean reversion in
the coming quarters, with Blackstone,
Oaktree and Carlyle amongst the firms
actively raising sizable vehicles that
appear primed to close later this year.
At the other end of the spectrum,
fundraising diminished for funds in
the $100 million-$250 million bucket,
with just nine such funds closed in
1Q. First-time fundraising, which had
shown signs of life recently, was also
lackluster. But while only two first-
time MM funds were raised during the
quarter, they were notable for their
size. Brightstar Capital Partners took
in $710 million for its inaugural vehicle,
while LightBay Capital soared past its
initial target of $450 million to hold a
final close on $615 million. One common
characteristic of these teams—and
many of those raising first-time funds—
is the experience that they bring. The
founding partners of LightBay worked
together at Ares for 15 years, while the
team at Brightstar boasts decades of
combined experience at firms Lindsay
Goldberg, Fifth Street and Goldman
Sachs.
0%
20%
40%
60%
80%
100%
120%
2006 2007 2008 2009 2010 2011 2012 2013 2014 2015 2016 2017 2018*
79%
52%
$122
$116
$76
$50
$90
$90
$103
$141
$128
$130
$125
$29
192175
98 92
118131
168
190180
192187
36
2007 2008 2009 2010 2011 2012 2013 2014 2015 2016 2017 2018*
Capital Raised ($B) # of Funds Closed
2018 fundraising off to a strong start
US PE MM fundraising
Source: PitchBook
*As of 3/31/2018
Source: PitchBook
*As of 3/31/2018
MM funds account for majority of capital raised in 1Q
US PE MM fundraising as a proportion of total ($)
PITCHBOOK 1Q 2018 US PE MIDDLE MARKET REPORT15
Sponsored by In partnership with Co-sponsored by

COPYRIGHT © 2018 by PitchBook Data, Inc. All rights reserved. No part of this publication may be reproduced
in any form or by any means—graphic, electronic, or mechanical, including photocopying, recording, taping,
and information storage and retrieval systems—without the express written permission of PitchBook Data,
Inc. Contents are based on information from sources believed to be reliable, but accuracy and completeness
cannot be guaranteed. Nothing herein should be construed as any past, current or future recommendation to
buy or sell any security or an offer to sell, or a solicitation of an offer to buy any security. This material does
not purport to contain all of the information that a prospective investor may wish to consider and is not to be
relied upon as such or used in substitution for the exercise of independent judgment.