Embed Size (px)
Citation preview

2017 2Q
US PE Middle Market
ReportIn partnership with Co-sponsored by
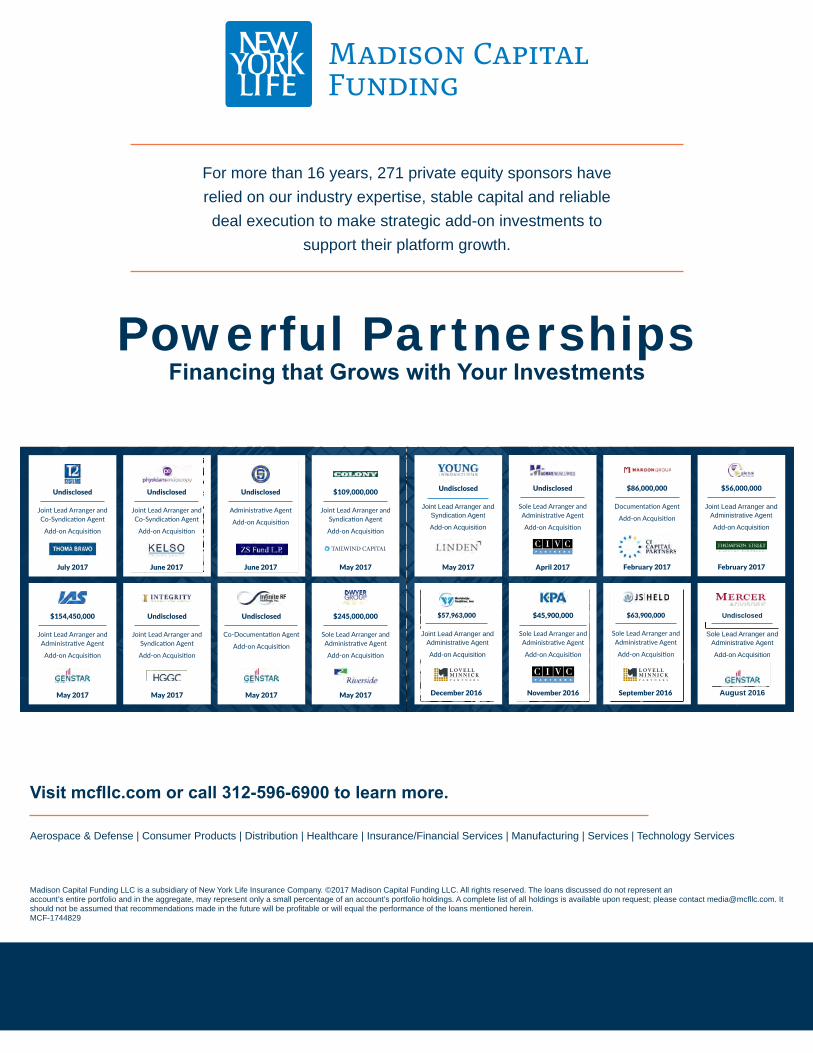
For more than 16 years, 271 private equity sponsors have relied on our industry expertise, stable capital and reliable deal execution to make strategic add-on investments to
support their platform growth.
Visit mcfllc.com or call 312-596-6900 to learn more.
Aerospace & Defense | Consumer Products | Distribution | Healthcare | Insurance/Financial Services | Manufacturing | Services | Technology Services
Powerful Partnerships Financing that Grows with Your Investments
Madison Capital Funding LLC is a subsidiary of New York Life Insurance Company. ©2017 Madison Capital Funding LLC. All rights reserved. The loans discussed do not represent an account’s entire portfolio and in the aggregate, may represent only a small percentage of an account’s portfolio holdings. A complete list of all holdings is available upon request; please contact [email protected]. It should not be assumed that recommendations made in the future will be profitable or will equal the performance of the loans mentioned herein. MCF-1744829
$154,450,000
Joint Lead Arranger and Administrative Agent
Add-on Acquisition
Undisclosed
Sole Lead Arranger and Administrative Agent
Add-on Acquisition
April 2017
November 2016
$45,900,000
Sole Lead Arranger and Administrative Agent
Add-on Acquisition
$233,185,000
Sole Lead Arranger and Administrative Agent
Add-on Acquisition
December 2016
$86,000,000
Documentation Agent
Add-on Acquisition
February 2017
September 2016
$63,900,000
Sole Lead Arranger and Administrative Agent
Add-on Acquisition
December 2016
$57,963,000
Co-Lead Arranger and Administrative Agent
Add-on Acquisition
$56,000,000
Co-Lead Arranger and Administrative Agent
Add-on Acquisition
February 2017
Undisclosed
Co-Lead Arranger and Syndication Agent
Add-on Acquisition
May 2017
Undisclosed
Co-Documentation Agent
Add-on Acquisition
May 2017
$245,000,000
Sole Lead Arranger and Administrative Agent
Add-on Acquisition
May 2017
Undisclosed
Joint Lead Arranger and Syndication Agent
Add-on Acquisition
$109,000,000
Joint Lead Arranger and Syndication Agent
Add-on Acquisition
May 2017
Undisclosed
Joint Lead Arranger and Co-Syndication Agent
Add-on Acquisition
July 2017
Undisclosed
Administrative Agent
Add-on Acquisition
June 2017
Undisclosed
Joint Lead Arranger and Co-Syndication Agent
Add-on Acquisition
June 2017
May 2017May 2017
Joint Lead Arranger andSyndication Agent
Add-on Acquisition
Joint Lead Arranger andAdministrative Agent
Add-on Acquisition
For more than 16 years, 271 private equity sponsors have relied on our industry expertise, stable capital and reliable deal execution to make strategic add-on investments to
support their platform growth.
Visit mcfllc.com or call 312-596-6900 to learn more.
Aerospace & Defense | Consumer Products | Distribution | Healthcare | Insurance/Financial Services | Manufacturing | Services | Technology Services
Powerful Partnerships Financing that Grows with Your Investments
Madison Capital Funding LLC is a subsidiary of New York Life Insurance Company. ©2017 Madison Capital Funding LLC. All rights reserved. The loans discussed do not represent an account’s entire portfolio and in the aggregate, may represent only a small percentage of an account’s portfolio holdings. A complete list of all holdings is available upon request; please contact [email protected]. It should not be assumed that recommendations made in the future will be profitable or will equal the performance of the loans mentioned herein. MCF-1744829
$154,450,000
Joint Lead Arranger and Administrative Agent
Add-on Acquisition
Undisclosed
Sole Lead Arranger and Administrative Agent
Add-on Acquisition
April 2017
November 2016
$45,900,000
Sole Lead Arranger and Administrative Agent
Add-on Acquisition
$233,185,000
Sole Lead Arranger and Administrative Agent
Add-on Acquisition
December 2016
$86,000,000
Documentation Agent
Add-on Acquisition
February 2017
September 2016
$63,900,000
Sole Lead Arranger and Administrative Agent
Add-on Acquisition
December 2016
$57,963,000
Co-Lead Arranger and Administrative Agent
Add-on Acquisition
$56,000,000
Co-Lead Arranger and Administrative Agent
Add-on Acquisition
February 2017
Undisclosed
Co-Lead Arranger and Syndication Agent
Add-on Acquisition
May 2017
Undisclosed
Co-Documentation Agent
Add-on Acquisition
May 2017
$245,000,000
Sole Lead Arranger and Administrative Agent
Add-on Acquisition
May 2017
Undisclosed
Joint Lead Arranger and Syndication Agent
Add-on Acquisition
$109,000,000
Joint Lead Arranger and Syndication Agent
Add-on Acquisition
May 2017
Undisclosed
Joint Lead Arranger and Co-Syndication Agent
Add-on Acquisition
July 2017
Undisclosed
Administrative Agent
Add-on Acquisition
June 2017
Undisclosed
Joint Lead Arranger and Co-Syndication Agent
Add-on Acquisition
June 2017
May 2017May 2017
Joint Lead Arranger andAdministrative Agent
Add-on Acquisition
Undisclosed
Sole Lead Arranger andAdministrative Agent
Add-on Acquisition
August 2016
For more than 16 years, 271 private equity sponsors have relied on our industry expertise, stable capital and reliable deal execution to make strategic add-on investments to
support their platform growth.
Visit mcfllc.com or call 312-596-6900 to learn more.
Aerospace & Defense | Consumer Products | Distribution | Healthcare | Insurance/Financial Services | Manufacturing | Services | Technology Services
Powerful Partnerships Financing that Grows with Your Investments
Madison Capital Funding LLC is a subsidiary of New York Life Insurance Company. ©2017 Madison Capital Funding LLC. All rights reserved. The loans discussed do not represent an account’s entire portfolio and in the aggregate, may represent only a small percentage of an account’s portfolio holdings. A complete list of all holdings is available upon request; please contact [email protected]. It should not be assumed that recommendations made in the future will be profitable or will equal the performance of the loans mentioned herein. MCF-1744829
$154,450,000
Joint Lead Arranger and Administrative Agent
Add-on Acquisition
Undisclosed
Sole Lead Arranger and Administrative Agent
Add-on Acquisition
April 2017
November 2016
$45,900,000
Sole Lead Arranger and Administrative Agent
Add-on Acquisition
$233,185,000
Sole Lead Arranger and Administrative Agent
Add-on Acquisition
December 2016
$86,000,000
Documentation Agent
Add-on Acquisition
February 2017
September 2016
$63,900,000
Sole Lead Arranger and Administrative Agent
Add-on Acquisition
December 2016
$57,963,000
Co-Lead Arranger and Administrative Agent
Add-on Acquisition
$56,000,000
Co-Lead Arranger and Administrative Agent
Add-on Acquisition
February 2017
Undisclosed
Co-Lead Arranger and Syndication Agent
Add-on Acquisition
May 2017
Undisclosed
Co-Documentation Agent
Add-on Acquisition
May 2017
$245,000,000
Sole Lead Arranger and Administrative Agent
Add-on Acquisition
May 2017
Undisclosed
Joint Lead Arranger and Syndication Agent
Add-on Acquisition
$109,000,000
Joint Lead Arranger and Syndication Agent
Add-on Acquisition
May 2017
Undisclosed
Joint Lead Arranger and Co-Syndication Agent
Add-on Acquisition
July 2017
Undisclosed
Administrative Agent
Add-on Acquisition
June 2017
Undisclosed
Joint Lead Arranger and Co-Syndication Agent
Add-on Acquisition
June 2017
May 2017May 2017
For more than 16 years, 271 private equity sponsors have
relied on our industry expertise, stable capital and reliable
deal execution to make strategic add-on investments to
support their platform growth.
Madison Capital Funding LLC is a subsidiary of New York Life Insurance Company. ©2017 Madison Capital Funding LLC. All rights reserved. The loans discussed do not represent anaccount’s entire portfolio and in the aggregate, may represent only a small percentage of an account’s portfolio holdings. A complete list of all holdings is available upon request; please contact [email protected]. It should not be assumed that recommendations made in the future will be profitable or will equal the performance of the loans mentioned herein.MCF-1744829
Visit mcfllc.com or call 312-596-6900 to learn more.
Aerospace & Defense | Consumer Products | Distribution | Healthcare | Insurance/Financial Services | Manufacturing | Services | Technology Services
Powerful PartnershipsFinancing that Grows with Your Investments
Credits & ContactPitchBook Data, Inc.
JOHN GABBERT Founder, CEO
ADLEY BOWDEN Vice President,
Market Development & Analysis
Content
NICO CORDEIRO Analyst
BRYAN HANSON Data Analyst
JENNIFER SAM Senior Graphic Designer
Contact PitchBook pitchbook.com
RESEARCH
EDITORIAL
SALES
COPYRIGHT © 2017 by PitchBook Data, Inc. All rights reserved. No part of this publication may be reproduced in any form or by any means—graphic, electronic, or mechanical, including photocopying, recording, taping, and information storage and retrieval systems—without the express written permission of PitchBook Data, Inc. Contents are based on information from sources believed to be reliable, but accuracy and completeness cannot be guaranteed. Nothing herein should be construed as any past, current or future recommendation to buy or sell any security or an offer to sell, or a solicitation of an offer to buy any security. This material does not purport to contain all of the information that a prospective investor may wish to consider and is not to be relied upon as such or used in substitution for the exercise of independent judgment.
Methodology 4
Introduction 5
Overview 6-7
Deals by Middle-Market Segment 8
Spotlight: Company Inventory 9
Exits 10
Fundraising 11
League Tables 12
CONTENTS
The PitchBook PlatformThe data in this report comes from the PitchBook Platform–our
data software for VC, PE and M&A. Contact [email protected]
to request a free trial.
IN PARTNERSHIP WITH
CO-SPONSOR3 PITCHBOOK 2Q 2017 US PE MIDDLE MARKET REPORT
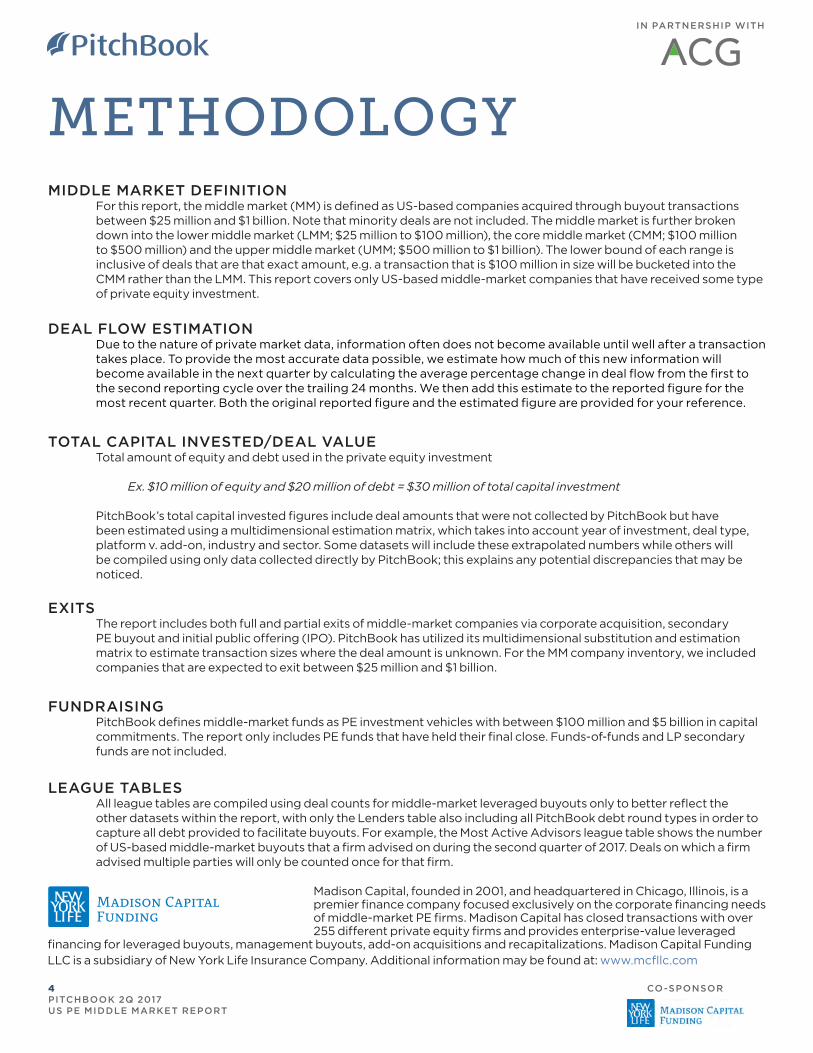
METHODOLOGY
Madison Capital, founded in 2001, and headquartered in Chicago, Illinois, is a premier finance company focused exclusively on the corporate financing needs of middle-market PE firms. Madison Capital has closed transactions with over 255 different private equity firms and provides enterprise-value leveraged
financing for leveraged buyouts, management buyouts, add-on acquisitions and recapitalizations. Madison Capital Funding LLC is a subsidiary of New York Life Insurance Company. Additional information may be found at: www.mcfllc.com
IN PARTNERSHIP WITH
CO-SPONSOR4 PITCHBOOK 2Q 2017 US PE MIDDLE MARKET REPORT
MIDDLE MARKET DEFINITIONFor this report, the middle market (MM) is defined as US-based companies acquired through buyout transactions between $25 million and $1 billion. Note that minority deals are not included. The middle market is further broken down into the lower middle market (LMM; $25 million to $100 million), the core middle market (CMM; $100 million to $500 million) and the upper middle market (UMM; $500 million to $1 billion). The lower bound of each range is inclusive of deals that are that exact amount, e.g. a transaction that is $100 million in size will be bucketed into the CMM rather than the LMM. This report covers only US-based middle-market companies that have received some type of private equity investment.
DEAL FLOW ESTIMATIONDue to the nature of private market data, information often does not become available until well after a transaction takes place. To provide the most accurate data possible, we estimate how much of this new information will become available in the next quarter by calculating the average percentage change in deal flow from the first to the second reporting cycle over the trailing 24 months. We then add this estimate to the reported figure for the most recent quarter. Both the original reported figure and the estimated figure are provided for your reference.
TOTAL CAPITAL INVESTED/DEAL VALUETotal amount of equity and debt used in the private equity investment
Ex. $10 million of equity and $20 million of debt = $30 million of total capital investment
PitchBook’s total capital invested figures include deal amounts that were not collected by PitchBook but have been estimated using a multidimensional estimation matrix, which takes into account year of investment, deal type, platform v. add-on, industry and sector. Some datasets will include these extrapolated numbers while others will be compiled using only data collected directly by PitchBook; this explains any potential discrepancies that may be noticed.
EXITSThe report includes both full and partial exits of middle-market companies via corporate acquisition, secondary PE buyout and initial public offering (IPO). PitchBook has utilized its multidimensional substitution and estimation matrix to estimate transaction sizes where the deal amount is unknown. For the MM company inventory, we included companies that are expected to exit between $25 million and $1 billion.
FUNDRAISINGPitchBook defines middle-market funds as PE investment vehicles with between $100 million and $5 billion in capital commitments. The report only includes PE funds that have held their final close. Funds-of-funds and LP secondary funds are not included.
LEAGUE TABLESAll league tables are compiled using deal counts for middle-market leveraged buyouts only to better reflect the other datasets within the report, with only the Lenders table also including all PitchBook debt round types in order to capture all debt provided to facilitate buyouts. For example, the Most Active Advisors league table shows the number of US-based middle-market buyouts that a firm advised on during the second quarter of 2017. Deals on which a firm advised multiple parties will only be counted once for that firm.
INTRODUCTION
Look up a company.
And its cap table.
And its investors.
And its EBITDA
multiples.
And its board
members.
In seconds.
The PitchBook Platform
has the data you need
to close your next deal.
Learn more at
pitchbook.com
Key takeaways
• Middle-market PE firms invested $236.9 billion across 1,086 deals in 1H 2017.
The volume of deals is nearly on pace with last year, but PE firms are spending
greater amounts of capital as activity has moved into the core and upper middle
markets.
• Middle-market PE investment in tech companies so far this year exceeds the
total amount invested in all of 2016, with $65 billion over 175 deals.
• There have been 23 PE exits through IPO this year, nearly as much as all
of 2016. With another 22 PE-backed companies in registration, it looks like
decreased M&A activity is resulting in an increase of IPOs for PE firms looking to
exit.
• Middle-market fundraising continues to be strong, making up 75% of all PE
funds closed this year. Despite a slight slowdown in fundraising numbers, the
time it’s taken for a fund to close is down from 15 months two years ago to just
10 months for funds closed this year.
We hope this report is useful in your practice. As always, feel free to send any
questions or comments to [email protected].
NICO CORDEIRO
Analyst
IN PARTNERSHIP WITH
CO-SPONSOR
5 PITCHBOOK 2Q 2017 US PE MIDDLE MARKET REPORT
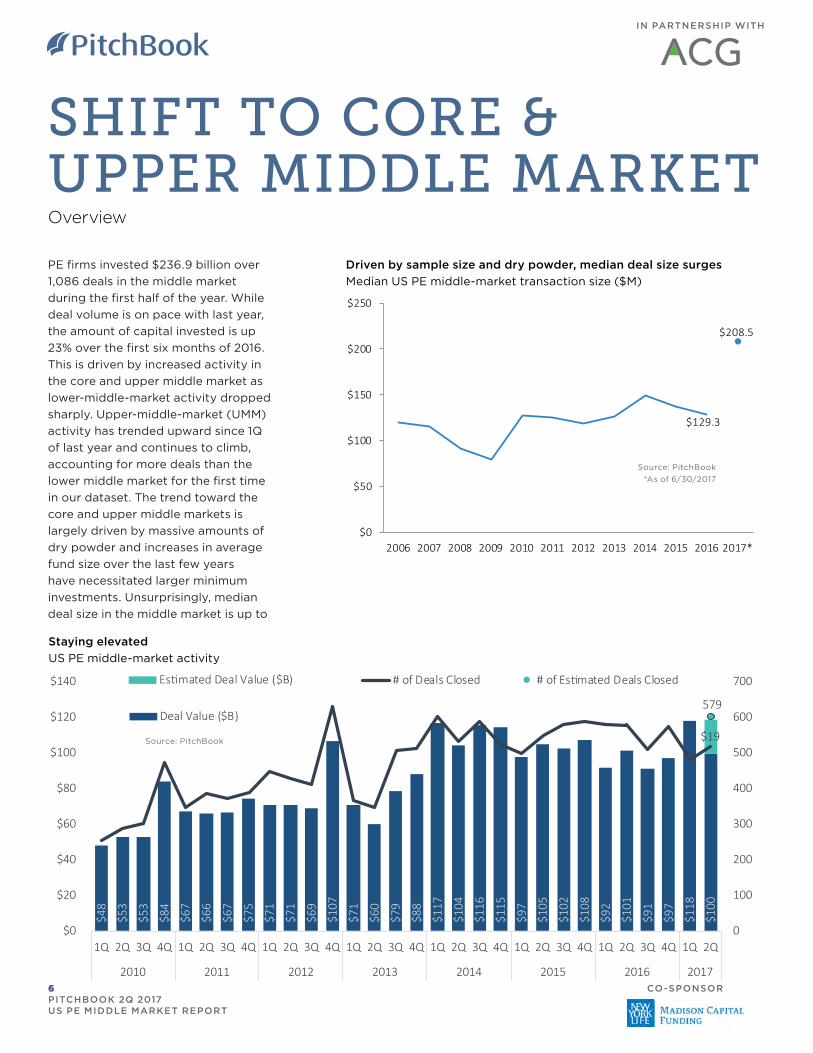
SHIFT TO CORE & UPPER MIDDLE MARKETOverview
PE firms invested $236.9 billion over
1,086 deals in the middle market
during the first half of the year. While
deal volume is on pace with last year,
the amount of capital invested is up
23% over the first six months of 2016.
This is driven by increased activity in
the core and upper middle market as
lower-middle-market activity dropped
sharply. Upper-middle-market (UMM)
activity has trended upward since 1Q
of last year and continues to climb,
accounting for more deals than the
lower middle market for the first time
in our dataset. The trend toward the
core and upper middle markets is
largely driven by massive amounts of
dry powder and increases in average
fund size over the last few years
have necessitated larger minimum
investments. Unsurprisingly, median
deal size in the middle market is up to
Staying elevated
US PE middle-market activity
Source: PitchBook
Driven by sample size and dry powder, median deal size surges
Median US PE middle-market transaction size ($M)
Source: PitchBook
*As of 6/30/2017
$48
$53
$53
$84
$67
$66
$67
$75
$71
$71
$69
$107
$71
$60
$79
$88
$117
$104
$116
$115
$97
$105
$102
$108
$92
$101
$91
$97
$118
$100
$19
579
0
100
200
300
400
500
600
700
$0
$20
$40
$60
$80
$100
$120
$140
1Q 2Q 3Q 4Q 1Q 2Q 3Q 4Q 1Q 2Q 3Q 4Q 1Q 2Q 3Q 4Q 1Q 2Q 3Q 4Q 1Q 2Q 3Q 4Q 1Q 2Q 3Q 4Q 1Q 2Q
2010 2011 2012 2013 2014 2015 2016 2017
Deal Value ($B)
Es�mated Deal Value ($B) # of Deals Closed # of Es�mated Deals Closed
$129.3
$208.5
$0
$50
$100
$150
$200
$250
2006 2007 2008 2009 2010 2011 2012 2013 2014 2015 2016 2017*
IN PARTNERSHIP WITH
CO-SPONSOR6 PITCHBOOK 2Q 2017 US PE MIDDLE MARKET REPORT
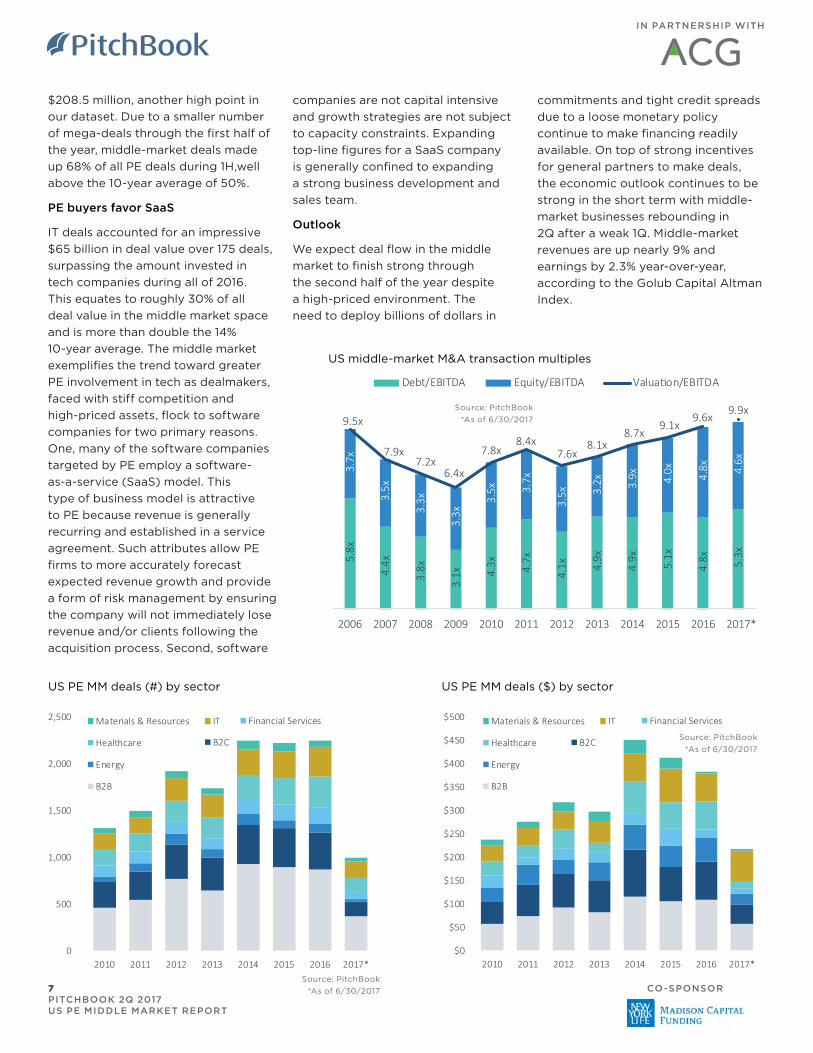
$208.5 million, another high point in
our dataset. Due to a smaller number
of mega-deals through the first half of
the year, middle-market deals made
up 68% of all PE deals during 1H,well
above the 10-year average of 50%.
PE buyers favor SaaS
IT deals accounted for an impressive
$65 billion in deal value over 175 deals,
surpassing the amount invested in
tech companies during all of 2016.
This equates to roughly 30% of all
deal value in the middle market space
and is more than double the 14%
10-year average. The middle market
exemplifies the trend toward greater
PE involvement in tech as dealmakers,
faced with stiff competition and
high-priced assets, flock to software
companies for two primary reasons.
One, many of the software companies
targeted by PE employ a software-
as-a-service (SaaS) model. This
type of business model is attractive
to PE because revenue is generally
recurring and established in a service
agreement. Such attributes allow PE
firms to more accurately forecast
expected revenue growth and provide
a form of risk management by ensuring
the company will not immediately lose
revenue and/or clients following the
acquisition process. Second, software
companies are not capital intensive
and growth strategies are not subject
to capacity constraints. Expanding
top-line figures for a SaaS company
is generally confined to expanding
a strong business development and
sales team.
Outlook
We expect deal flow in the middle
market to finish strong through
the second half of the year despite
a high-priced environment. The
need to deploy billions of dollars in
commitments and tight credit spreads
due to a loose monetary policy
continue to make financing readily
available. On top of strong incentives
for general partners to make deals,
the economic outlook continues to be
strong in the short term with middle-
market businesses rebounding in
2Q after a weak 1Q. Middle-market
revenues are up nearly 9% and
earnings by 2.3% year-over-year,
according to the Golub Capital Altman
Index.
US middle-market M&A transaction multiples
US PE MM deals (#) by sector US PE MM deals ($) by sector
Source: PitchBook
*As of 6/30/2017
$0
$50
$100
$150
$200
$250
$300
$350
$400
$450
$500
2010 2011 2012 2013 2014 2015 2016 2017*
Materials & Resources IT
Healthcare
Financial Services
Energy
B2C
B2B
0
500
1,000
1,500
2,000
2,500
2010 2011 2012 2013 2014 2015 2016 2017*
Materials & Resources IT
Healthcare
Financial Services
Energy
B2C
B2B
Source: PitchBook
*As of 6/30/2017
5.8x
4.4x
3.8x
3.1x 4.
3x 4.7x
4.1x 4.
9x
4.9x 5.1x
4.8x 5.3x
3.7x
3.5x
3.3x
3.3x
3.5x 3.
7x
3.5x 3.
2x 3.9x 4.0x 4.8x 4.
6x
9.5x
7.9x7.2x
6.4x
7.8x8.4x
7.6x8.1x
8.7x9.1x
9.6x 9.9x
2006 2007 2008 2009 2010 2011 2012 2013 2014 2015 2016 2017*
Debt/EBITDA Equity/EBITDA Valua�on/EBITDA
Source: PitchBook
*As of 6/30/2017
IN PARTNERSHIP WITH
CO-SPONSOR7 PITCHBOOK 2Q 2017 US PE MIDDLE MARKET REPORT
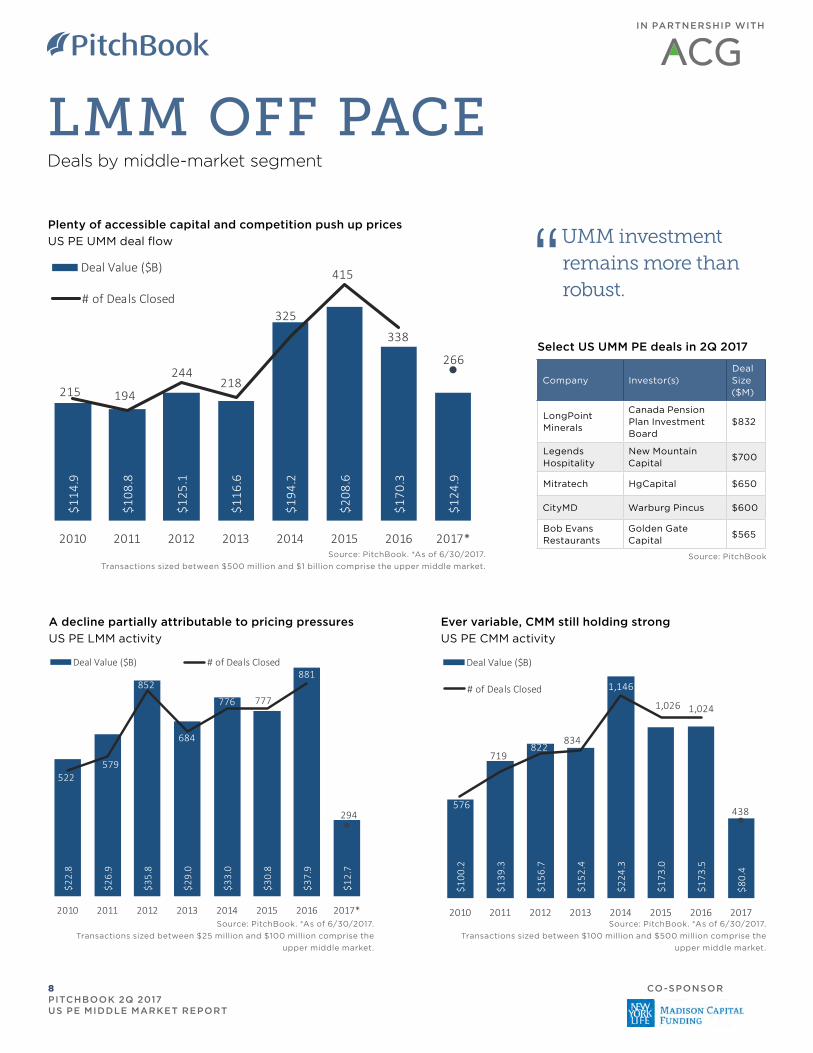
Plenty of accessible capital and competition push up prices
US PE UMM deal flow
LMM OFF PACEDeals by middle-market segment
UMM investment remains more than robust.
Select US UMM PE deals in 2Q 2017
Company Investor(s)Deal Size ($M)
LongPoint Minerals
Canada Pension Plan Investment Board
$832
Legends Hospitality
New Mountain Capital
$700
Mitratech HgCapital $650
CityMD Warburg Pincus $600
Bob Evans Restaurants
Golden Gate Capital
$565
Source: PitchBook
Ever variable, CMM still holding strong
US PE CMM activity
A decline partially attributable to pricing pressures
US PE LMM activity
Source: PitchBook. *As of 6/30/2017.
Transactions sized between $500 million and $1 billion comprise the upper middle market.
$114
.9
$108
.8
$125
.1
$116
.6
$194
.2
$208
.6
$170
.3
$124
.9
215 194
244 218
325
415
338
266
2010 2011 2012 2013 2014 2015 2016 2017*
Deal Value ($B)
# of Deals Closed
$100
.2
$139
.3
$156
.7
$152
.4
$224
.3
$173
.0
$173
.5
$80.
4
576
719 822
834
1,146
1,026 1,024
438
2010 2011 2012 2013 2014 2015 2016 2017
Deal Value ($B)
# of Deals Closed
Source: PitchBook. *As of 6/30/2017.
Transactions sized between $100 million and $500 million comprise the
upper middle market.
$22.
8
$26.
9
$35.
8
$29.
0
$33.
0
$30.
8
$37.
9
$12.
7
522 579
852
684
776 777
881
294
2010 2011 2012 2013 2014 2015 2016 2017*
Deal Value ($B) # of Deals Closed
Source: PitchBook. *As of 6/30/2017.
Transactions sized between $25 million and $100 million comprise the
upper middle market.
IN PARTNERSHIP WITH
CO-SPONSOR8 PITCHBOOK 2Q 2017 US PE MIDDLE MARKET REPORT
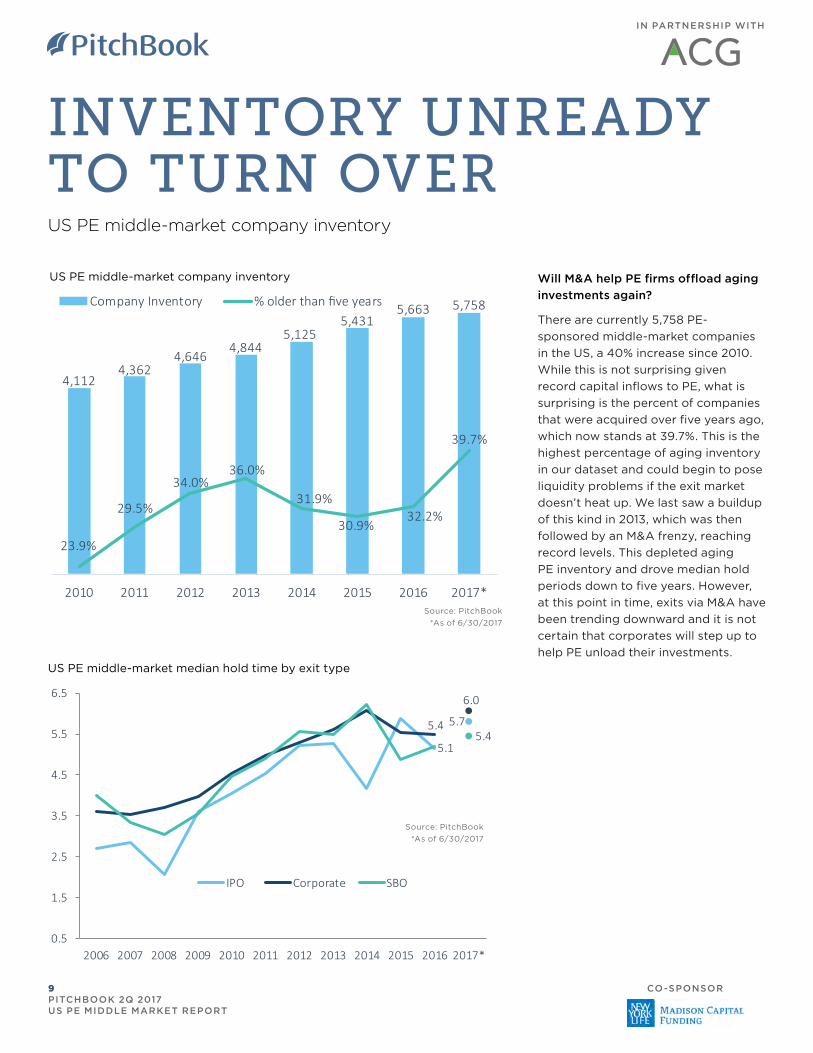
INVENTORY UNREADY TO TURN OVERUS PE middle-market company inventory
US PE middle-market company inventory
Source: PitchBook
*As of 6/30/2017
4,1124,362
4,6464,844
5,1255,431
5,663 5,758
23.9%
29.5%
34.0%36.0%
31.9%
30.9%32.2%
39.7%
2010 2011 2012 2013 2014 2015 2016 2017*
Company Inventory % older than five years
US PE middle-market median hold time by exit type
5.75.4
6.0
5.15.4
0.5
1.5
2.5
3.5
4.5
5.5
6.5
2006 2007 2008 2009 2010 2011 2012 2013 2014 2015 2016 2017*
IPO Corporate SBO
Source: PitchBook
*As of 6/30/2017
Will M&A help PE firms offload aging
investments again?
There are currently 5,758 PE-
sponsored middle-market companies
in the US, a 40% increase since 2010.
While this is not surprising given
record capital inflows to PE, what is
surprising is the percent of companies
that were acquired over five years ago,
which now stands at 39.7%. This is the
highest percentage of aging inventory
in our dataset and could begin to pose
liquidity problems if the exit market
doesn’t heat up. We last saw a buildup
of this kind in 2013, which was then
followed by an M&A frenzy, reaching
record levels. This depleted aging
PE inventory and drove median hold
periods down to five years. However,
at this point in time, exits via M&A have
been trending downward and it is not
certain that corporates will step up to
help PE unload their investments.
IN PARTNERSHIP WITH
CO-SPONSOR9 PITCHBOOK 2Q 2017 US PE MIDDLE MARKET REPORT
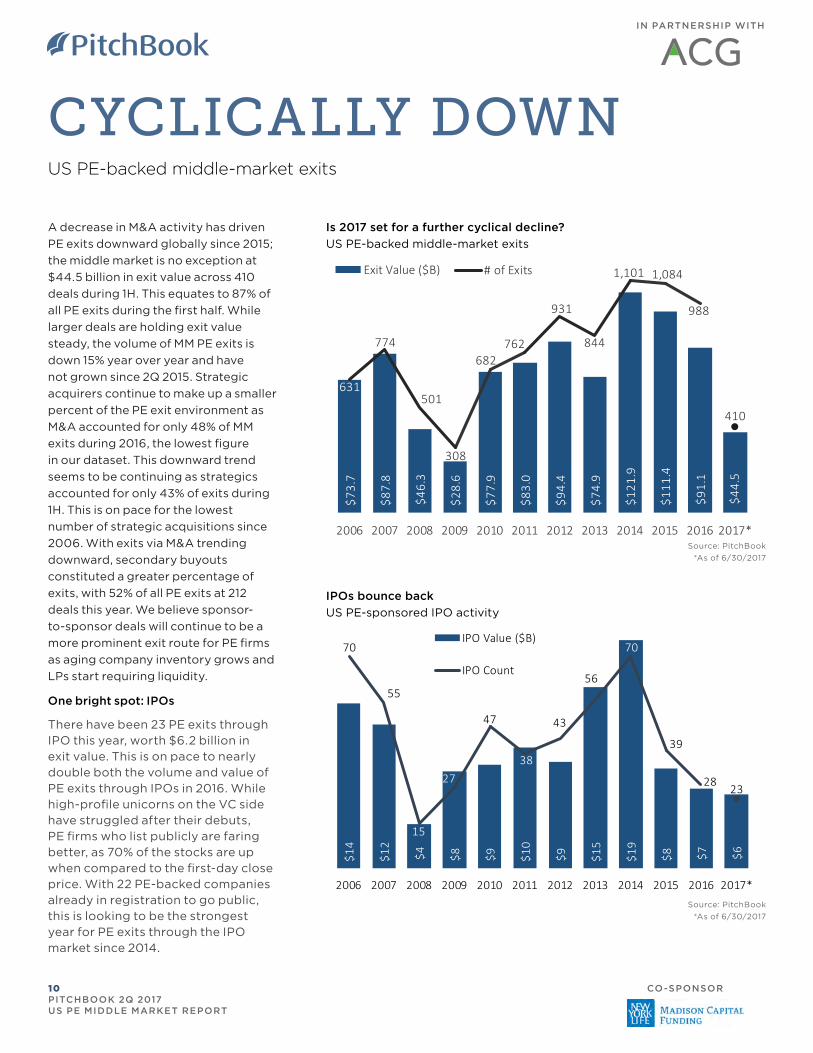
CYCLICALLY DOWNUS PE-backed middle-market exits
A decrease in M&A activity has driven
PE exits downward globally since 2015;
the middle market is no exception at
$44.5 billion in exit value across 410
deals during 1H. This equates to 87% of
all PE exits during the first half. While
larger deals are holding exit value
steady, the volume of MM PE exits is
down 15% year over year and have
not grown since 2Q 2015. Strategic
acquirers continue to make up a smaller
percent of the PE exit environment as
M&A accounted for only 48% of MM
exits during 2016, the lowest figure
in our dataset. This downward trend
seems to be continuing as strategics
accounted for only 43% of exits during
1H. This is on pace for the lowest
number of strategic acquisitions since
2006. With exits via M&A trending
downward, secondary buyouts
constituted a greater percentage of
exits, with 52% of all PE exits at 212
deals this year. We believe sponsor-
to-sponsor deals will continue to be a
more prominent exit route for PE firms
as aging company inventory grows and
LPs start requiring liquidity.
One bright spot: IPOs
There have been 23 PE exits through IPO this year, worth $6.2 billion in exit value. This is on pace to nearly double both the volume and value of PE exits through IPOs in 2016. While high-profile unicorns on the VC side have struggled after their debuts, PE firms who list publicly are faring better, as 70% of the stocks are up when compared to the first-day close price. With 22 PE-backed companies already in registration to go public, this is looking to be the strongest year for PE exits through the IPO market since 2014.
Is 2017 set for a further cyclical decline?
US PE-backed middle-market exits
$73.
7
$87.
8
$46.
3
$28.
6
$77.
9
$83.
0
$94.
4
$74.
9
$121
.9
$111
.4
$91.
1
$44.
5
631
774
501
308
682762
931
844
1,101 1,084
988
410
2006 2007 2008 2009 2010 2011 2012 2013 2014 2015 2016 2017*
Exit Value ($B) # of Exits
Source: PitchBook
*As of 6/30/2017
IPOs bounce back
US PE-sponsored IPO activity
$14
$12
$4 $8 $9 $10
$9 $15
$19
$8 $7 $6
70
55
15
27
47
38
43
56
70
39
28 23
2006 2007 2008 2009 2010 2011 2012 2013 2014 2015 2016 2017*
IPO Value ($B)
IPO Count
Source: PitchBook
*As of 6/30/2017
IN PARTNERSHIP WITH
CO-SPONSOR10 PITCHBOOK 2Q 2017 US PE MIDDLE MARKET REPORT
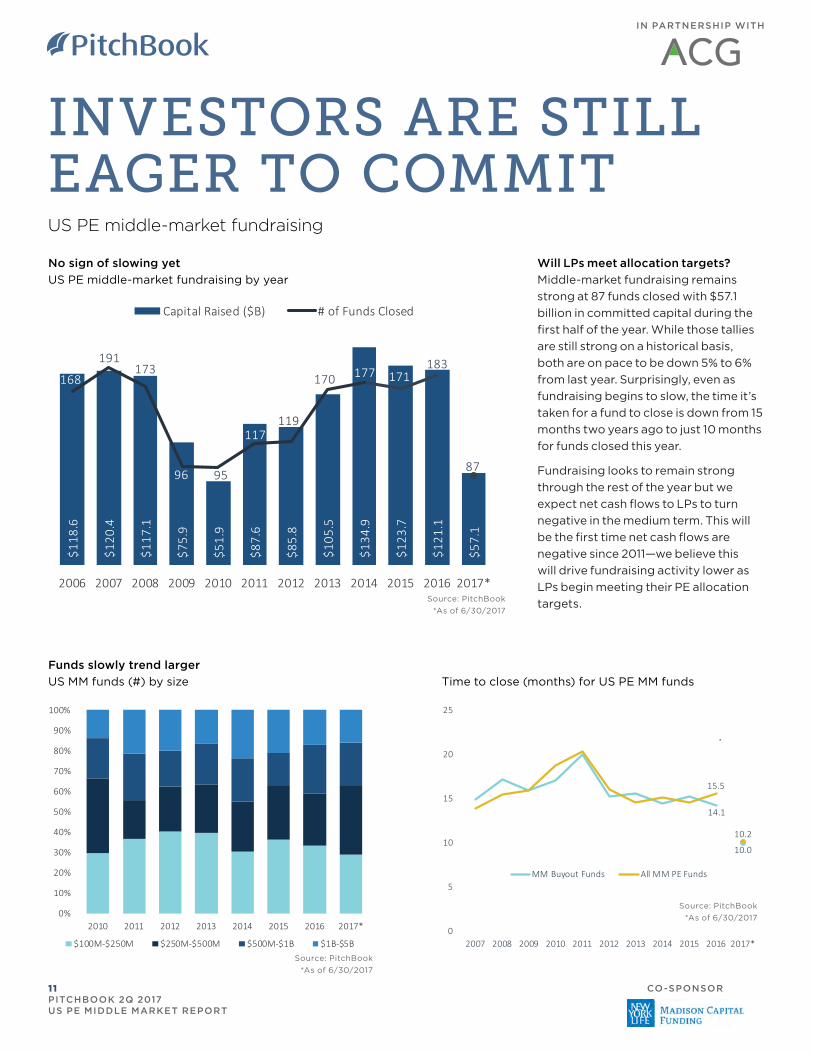
No sign of slowing yet
US PE middle-market fundraising by year
Funds slowly trend larger
US MM funds (#) by size
Time to close (months) for US PE MM funds
Will LPs meet allocation targets?
Middle-market fundraising remains
strong at 87 funds closed with $57.1
billion in committed capital during the
first half of the year. While those tallies
are still strong on a historical basis,
both are on pace to be down 5% to 6%
from last year. Surprisingly, even as
fundraising begins to slow, the time it’s
taken for a fund to close is down from 15
months two years ago to just 10 months
for funds closed this year.
Fundraising looks to remain strong
through the rest of the year but we
expect net cash flows to LPs to turn
negative in the medium term. This will
be the first time net cash flows are
negative since 2011—we believe this
will drive fundraising activity lower as
LPs begin meeting their PE allocation
targets.
INVESTORS ARE STILL EAGER TO COMMITUS PE middle-market fundraising
$118
.6
$120
.4
$117
.1
$75.
9
$51.
9
$87.
6
$85.
8
$105
.5
$134
.9
$123
.7
$121
.1
$57.
1
168
191173
96 95
117119
170 177 171183
87
2006 2007 2008 2009 2010 2011 2012 2013 2014 2015 2016 2017*
Capital Raised ($B) # of Funds Closed
0%
10%
20%
30%
40%
50%
60%
70%
80%
90%
100%
2010 2011 2012 2013 2014 2015 2016 2017*
$100M-$250M $250M-$500M $500M-$1B $1B-$5BSource: PitchBook
*As of 6/30/2017
14.1
10.0
15.5
10.2
0
5
10
15
20
25
2007 2008 2009 2010 2011 2012 2013 2014 2015 2016 2017*
MM Buyout Funds All MM PE Funds
Source: PitchBook
*As of 6/30/2017
Source: PitchBook
*As of 6/30/2017
IN PARTNERSHIP WITH
CO-SPONSOR11 PITCHBOOK 2Q 2017 US PE MIDDLE MARKET REPORT
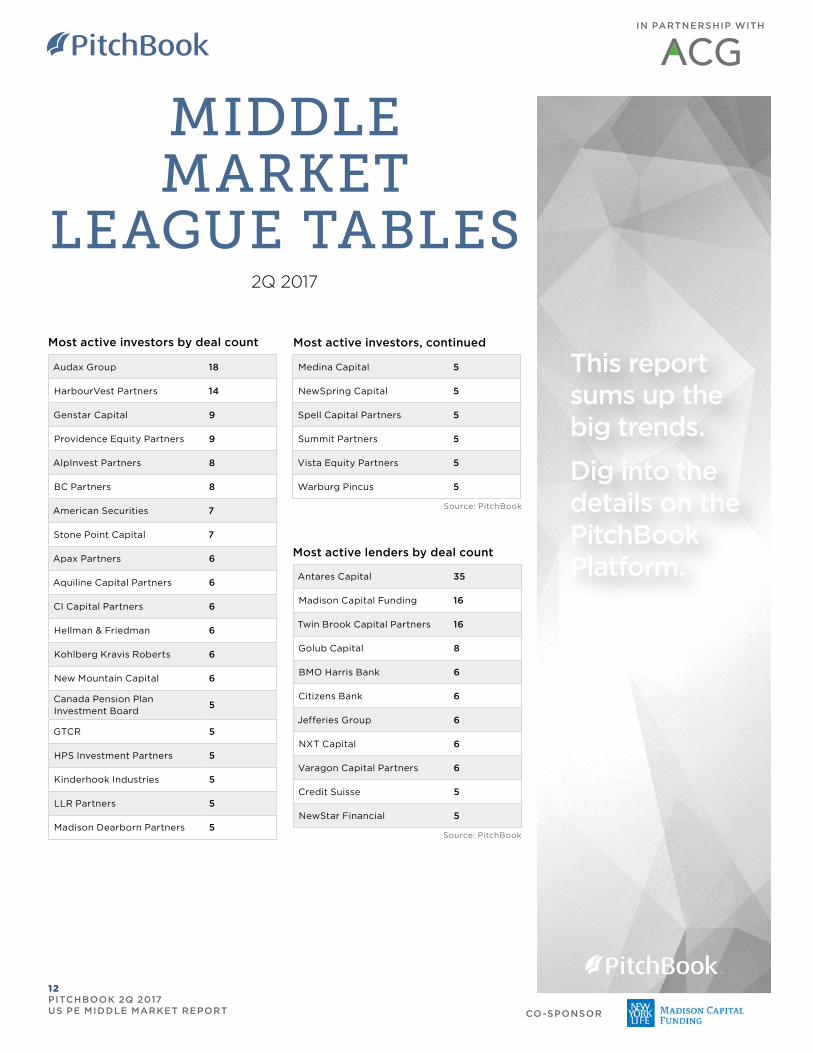
MIDDLE MARKET
LEAGUE TABLES2Q 2017
Audax Group 18
HarbourVest Partners 14
Genstar Capital 9
Providence Equity Partners 9
AlpInvest Partners 8
BC Partners 8
American Securities 7
Stone Point Capital 7
Apax Partners 6
Aquiline Capital Partners 6
CI Capital Partners 6
Hellman & Friedman 6
Kohlberg Kravis Roberts 6
New Mountain Capital 6
Canada Pension Plan Investment Board
5
GTCR 5
HPS Investment Partners 5
Kinderhook Industries 5
LLR Partners 5
Madison Dearborn Partners 5
Most active investors by deal count
Source: PitchBook
Antares Capital 35
Madison Capital Funding 16
Twin Brook Capital Partners 16
Golub Capital 8
BMO Harris Bank 6
Citizens Bank 6
Jefferies Group 6
NXT Capital 6
Varagon Capital Partners 6
Credit Suisse 5
NewStar Financial 5
Most active lenders by deal count
Source: PitchBook
Medina Capital 5
NewSpring Capital 5
Spell Capital Partners 5
Summit Partners 5
Vista Equity Partners 5
Warburg Pincus 5
Most active investors, continued
Find out more
at pitchbook.com
This report sums up the big trends.
Dig into the details on the PitchBook Platform.
IN PARTNERSHIP WITH
CO-SPONSOR
12 PITCHBOOK 2Q 2017 US PE MIDDLE MARKET REPORT
See how the PitchBook Platform can
help your private equity firm close your
next deal.
We do EBITDA multiples,private comps,valuations,market trends,growth metrics.
You build a better portfolio.