Embed Size (px)
Citation preview

GEORGETOWN UNIVERSITY LAW LIBRARY
3 0700 00M15370 5

GEORGETOWN UNIVERSITY LAW LIBRAR*

GAD United States General Accounting Office __
Report to the Honorable Richard A. Gephardt and the Honorable Sander M. Levin
July 1993
U.S.-MEXICO TRADE
The Maquiladora Industry and U.S. Employment
GAO/GGD-93-129

GAO
Background
United States General Accounting Office Washington, D.C. 20548
General Government Division
B-253952
July 20, 1993
The Honorable Richard A. Gephardt The Honorable Sander M. Levin House of Representatives
This report responds to your request that we (1) determine how U.S. trade with Mexico’s maquiladora industry has affected recent growth in U.S.-Mexican trade, especially trade in the top 10 U.S. manufactured exports to Mexico; and (2) review studies that have attempted to determine how the maquiladora program has affected U.S. employment.
A major debate is currently underway on how a North American Free Trade Agreement (nafta) would affect the U.S. economy, especially certain manufacturing industries. The United States, Mexico, and Canada began formal trilateral negotiations for nafta on June 12, 1991. Agreement was announced in August 1992, and nafta was signed on December 17, 1992. Ratification of nafta by the U.S. Congress is pending, awaiting submission of the implementing legislation.
Mexico’s maquiladora program may offer some insight into how nafta’s
elimination of trade and investment barriers between the two countries may affect U.S. employment. Mexico’s maquiladora program, which began in 1965 as part of the Mexican Border Industrialization Program, allows Mexican and foreign investors to establish manufacturing plants in selected areas of Mexico to produce for export. The manufacturing plants, called “maquiladoras,” use primarily U.S.-made components to produce finished or semifinished goods that are exported, usually back to the United States. Foreign investors may own up to 100 percent of such plants. As long as the maquiladora’s end product is exported, no Mexican duty is levied on imported machinery, raw materials, or components.
Certain U.S. tariff provisions provide benefits that extend to maquiladora products destined for the United States. For example, under provision 9802.00.80 of the Harmonized Tariff Schedule (iits) of the United States, products assembled in foreign countries from U.S.-made components are subject to duties only on the value added in the foreign country. Furthermore, under hts provision 9802.00.60, certain metal products of U.S. origin processed abroad and returned to the United States for further processing are subject to duties only on the value added by the foreign
Page 1 GAO/GGD-93-129 U.S.-Mexico Trade
B-253952
processing. These two tariff provisions are sometimes referred to as
“production-sharing” provisions.1,2
Results in Brief U.S. trade with and investment in Mexico in general have grown
substantially in recent years. Between 1985 and 1992, U.S. merchandise
exports to Mexico tripled in nominal (not adjusted for inflation) terms,
while imports from Mexico grew by about 80 percent. Between 1985 and
1991, the cumulative stock of U.S. direct foreign investment in Mexico
more than doubled, from $5.1 billion to $11.6 billion.
Precise data are not available on the proportion of U.S.-Mexican trade and
investment that involves maquiladora firms. Estimates using U.S. trade
data indicate that in nominal terms, U.S. exports to maquiladoras
increased from about $3 billion in 1985 to about $6.5 billion in 1990.
Mexican government import data show that in nominal terms, maquiladora
imports from the United States rose from $3.8 billion to $10.3 billion
during this same period. It is not clear which estimate is more accurate.
However, both show that the proportion of U.S.-Mexican trade that
involved maquiladoras rose from 1985 to 1987 and then fell between 1987
and 1990. U.S. production-sharing statistics show that between 1989 and
1992, the years for which complete data were available, the proportion of
the top 10 U.S. manufactured exports to Mexico that went to maquiladoras
fell from about 35 percent to about 28 percent.
Studies of the maquiladoras’ impact on U.S. employment are divided, and
it is difficult to determine which assessment, if any, is reliable. Because
these studies use different methodologies and assumptions, it is difficult to
compare their employment impact estimates. While these studies suggest
that exports to maquiladoras support some U.S. jobs, they also show that
maquiladora production—most of which the U nited States imports—has
displaced other U.S. jobs. Thus, it is especially important when assessing
the effect of changes in U.S.-Mexican trade on U.S. employment to
consider the impact of both exports to and imports from maquiladoras.
(See app. I for our scope and methodology.)
1 According to the U.S. International Trade Commission (1TC), production-sharing occurs when a company shares a portion of its production process with a foreign subsidiary or a foreign contractor to reduce the total cost of production. According to the Mexican government, almost one-half of maquiladoras registered through January 1992 are either wholly or majority owned by U.S. firms.
2 Before January 1, 1989, imports under HTS provisions 9802.00.60 and 9802.00.80 entered the United States under items 806.30 and 807.00 of the former Tariff Schedules of the United States.
Page 2 GAO/GGD-93-129 U.S.-Mexico Trade
B-253952
Recent Growth in U.S.-Mexican Trade and Investment
Proponents of nafta point to a boom in trade and investment between the
United States and Mexico in recent years as evidence that increased
economic interaction between the two countries benefits the United
States. Since 1985, U.S. trade with and investment in Mexico have greatly
increased. In nominal (not acljusted for inflation) terms, from 1985 to 1992,
U.S. merchandise exports to Mexico grew threefold, rising from $13.1
billion to $39.6 billion, and U.S. merchandise imports from Mexico grew by
around 80 percent, from $18.9 billion to $33.9 billion. As a result, the U.S.
merchandise trade balance with Mexico went from a deficit of about $5.9
billion in 1985 to a surplus of about $5.7 billion in 1992, an improvement in
the balance of trade of about $11.5 billion.3
When adjusted for inflation to 1992 dollars, U.S. merchandise exports to
Mexico in 1985 were $16.8 billion, and U.S. merchandise imports from
Mexico were $24.3 billion.4 Thus, in real terms, U.S. merchandise exports
to Mexico rose by about 136 percent from 1985 to 1992, and U.S.
merchandise imports from Mexico rose by about 40 percent. In 1992
dollars, the U.S. merchandise trade deficit with Mexico in 1985 was
$4.6 billion. Thus, the U.S. inflation-adjusted merchandise trade balance
with Mexico improved by $10.3 billion from 1985 to 1992.
Moreover, merchandise trade statistics exclude trade in services. In 1991,
the United States exported about $8.3 billion in services to Mexico, and
imported about $7.9 billion. U.S. service exports to Mexico represented
about 20 percent of U.S. service and merchandise exports to Mexico in
that year.
Growth in U.S. Investment U.S. government statistics show that the cumulative stock of U.S. direct
in Mexico foreign investment in Mexico more than doubled between 1985 and 1991, rising from $5.1 billion to $11.6 billion.5 Mexican government statistics
indicate that at the end of 1991, the United States was Mexico’s
'According to U.S. Census Bureau officials, U.S. merchandise trade data probably undercount U.S. exports to Mexico because, while Customs Service officials are able to collect export documents from large trucks crossing the border, they are less likely to collect these documents from the many small trucks that do so. Census believes that the size of this undereount, while unknown, may be higher than the 3-percent undercount Census has found for U.S. exports to several other countries. Thus, the U.S.’ current merchandise trade surplus with Mexico may be understated.
'Trade data are adjusted for inflation using the implicit gross domestic product price deflator as published in the January 1993 Economic Report, of the President.
r'As is common with foreign investment data, the numbers represent the historical value of investment, that is, the sum of t he amounts invested each year up to the year reported.
Page 3 GAO/GGD-93-129 U.S.-Mexieo Trade
B-253952
predominant foreign investor, with 63 percent of cumulative foreign direct
investment.
Precise information on U.S. investment in maquiladora firms is not
available. However, the number of maquiladora firms has more than
tripled since 1985, and, according to the Mexican government, about
one-half of the 2,522 maquiladoras registered with the Mexican
government through January 1992 were either wholly or majority owned
by U.S. firms.
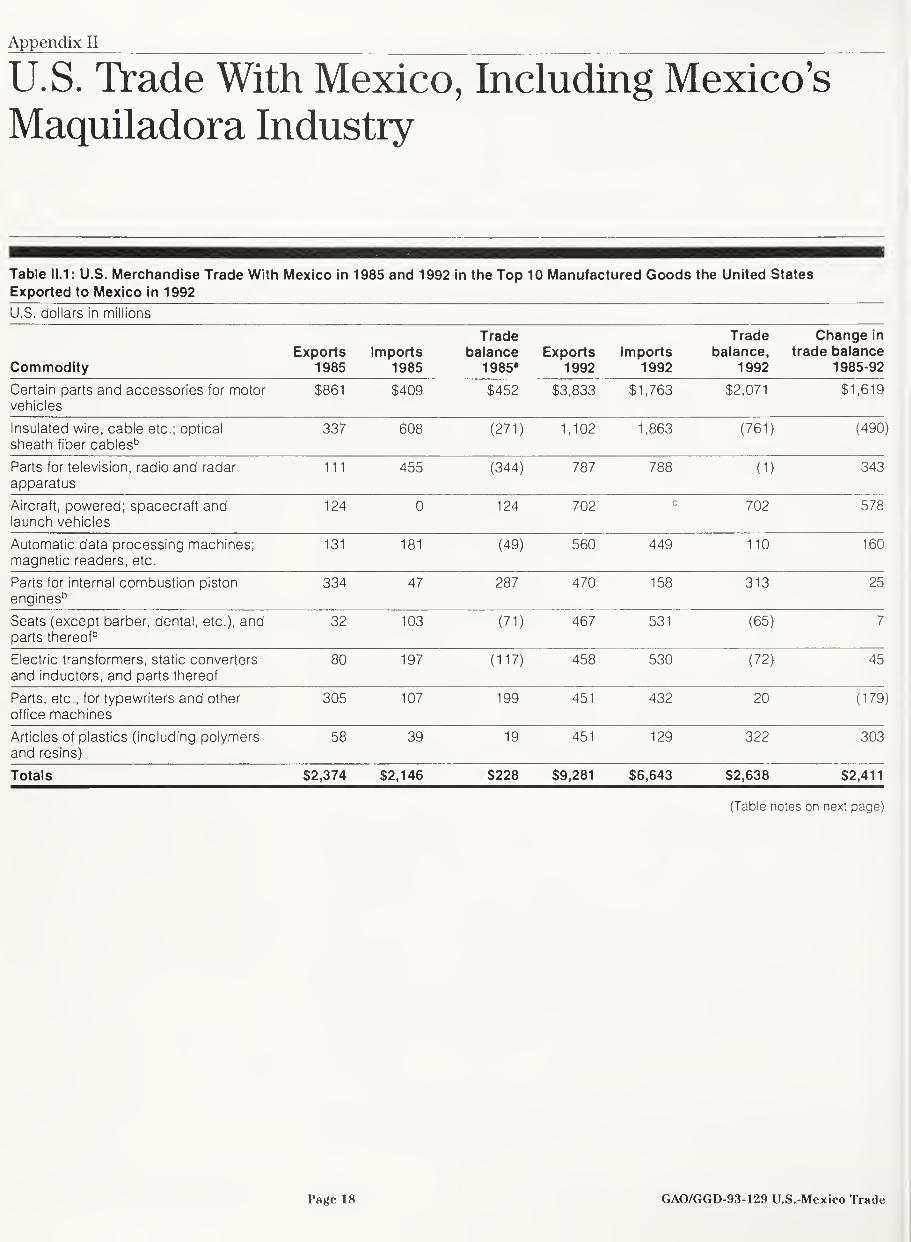
Top 10 U.S. Exports to The top 10 manufactured commodities that the United States exported to
Mexico Mexico in 1992 represented about 23 percent of U.S. merchandise exports
to Mexico in that year. Table II. 1 shows U.S.-Mexican trade in these 10
categories of goods. As can be seen from the table, the largest categories
of manufactured commodities the United States exported to Mexico in
1992, as defined at the 4-digit level of the hts, were certain parts and
accessories for motor vehicles; insulated wire and cable and optical fiber
cables; parts for television, radio, and radar apparatus; and powered
aircraft, spacecraft, and launch vehicles. In 1992, these four categories of
goods constituted about 16 percent of U.S. merchandise exports to Mexico
and about 13 percent of U.S. merchandise imports from Mexico.
As table II. 1 shows, in nominal dollars, in 1985 the United States exported
about $2.4 billion of these 10 products to Mexico and imported about
$2.1 billion. By 1992, U.S. exports to Mexico of these items had risen
almost fourfold, to about $9.3 billion, while imports from Mexico roughly
tripled, to about $6.6 billion. Consequently, between 1985 and 1992 the
U.S. merchandise trade surplus with Mexico in trade in these 10 items
improved by about $2.4 billion, from about $0.3 billion to about
$2.7 billion.
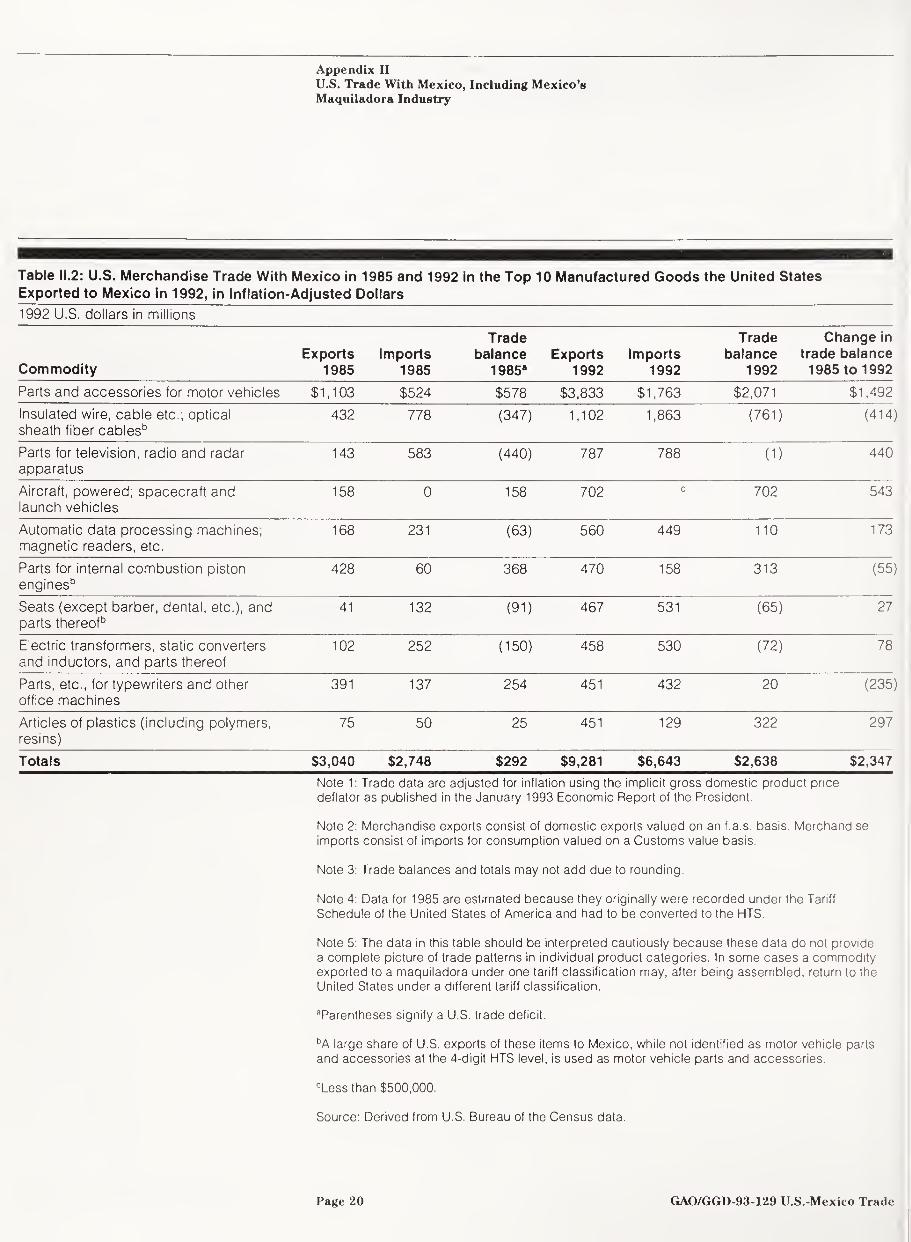
In real terms, between 1985 and 1992 U.S. exports to and imports from
Mexico of these 10 commodities grew more slowly than when the data are
expressed in nominal terms. Table II.2 shows U.S. trade with Mexico in
these 10 commodities in inflation-adjusted 1992 dollars. In real terms,
these exports approximately tripled, while imports grew by about
140 percent. However, according to table II.2, the U.S. trade surplus with
Mexico in these items grew by $2.3 billion—about the same amount as
when the data are expressed in nominal terms.
Page 4 GAO/GGD-93-129 U.S.-Mexico Trade
B-253952
Nearly two-thirds of the increased surplus was due to the top commodity,
certain motor vehicle parts and accessories. In inflation-adjusted dollars,
in 1992, the United States exported about $3.8 billion of certain motor
vehicle parts and accessories to Mexico, up from $1.1 billion in 1985, and
imported from Mexico about $1.8 billion of these goods, an increase from
$524 million in 1985. In 1992, U.S. exports to Mexico of these motor
vehicle parts and accessories accounted for about 10 percent of U.S.
merchandise exports to Mexico. However, according to an itc official,
many motor vehicle parts and accessories are not included in the 4-digit
hts motor vehicle parts and accessories category. Examples of motor
vehicle parts and accessories not included are engines and parts,
automotive furniture, tires, automotive glass, batteries, and some lighting
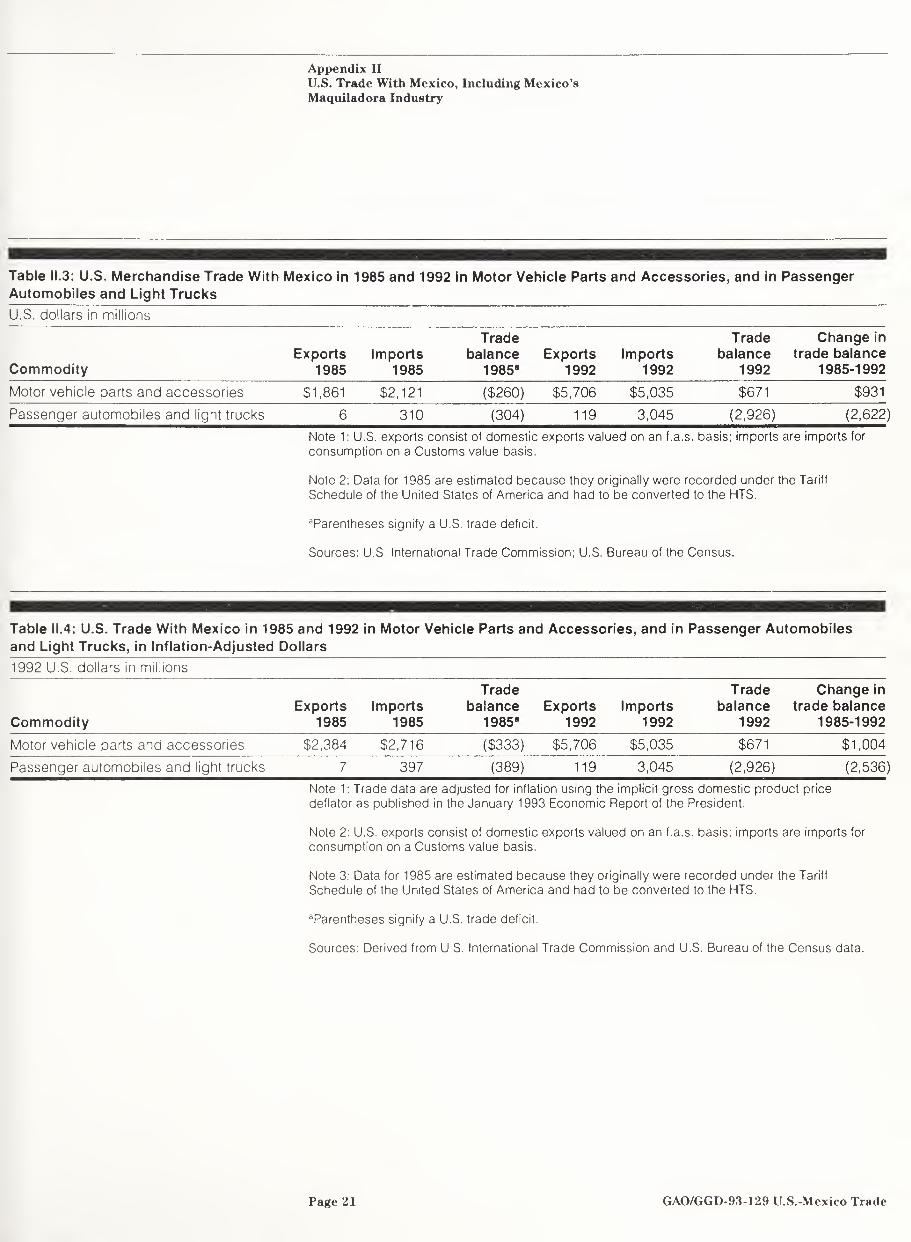
equipment. Table II.3 shows the itc’s estimate of U.S. trade with Mexico in
all motor vehicle parts and accessories in 1985 and 1992. The table
indicates that the United States exported about $1.9 billion of motor
vehicle parts and accessories to Mexico in 1985, and imported about
$2.1 billion. In 1992, U.S. exports of these items to Mexico had more than
tripled, to about $5.7 billion, while imports had risen by about 137 percent,
to about $5 billion. As a result, a U.S. trade deficit with Mexico of about
$260 million in 1985 had become a surplus of about $671 million in 1992,
an improvement of about $931 million.
Table II.3 also shows U.S.-Mexico trade in passenger automobiles and light
trucks in 1985 and 1992. According to the table, in 1992 the United States
ran a trade deficit in passenger automobiles and light trucks with Mexico
of about $2.9 billion, a nearly tenfold increase over the 1985 deficit of
about $304 million.
Table II.4 shows this trade in 1992 dollars. Like table II.3, table II.4
indicates that, in real terms, the U.S. merchandise trade balance with
Mexico in motor vehicle parts and accessories improved by about
$1 billion during this period, and the U.S. merchandise trade deficit in
passenger automobiles and light trucks rose by about $2.5 billion.
Proportion of Merchandise Trade Involving the Maquiladora Industry
No official U.S. government data are available on the amount of
U.S.-Mexican merchandise trade attributable to Mexico’s maquiladora
operations. U.S. government trade statistics do not distinguish between
transactions involving maquiladora operations and other transactions
because U.S. import and export documents do not require traders to
identify whether they participate in the maquiladora program.
Furthermore, the Mexican government’s trade statistics do not include this
Page 5 GAO/GGD-93-129 U.S.-Mexico Trade
B-253952
information because maquiladora trade is excluded from Mexico’s
merchandise trade account. Instead, the value added from maquiladora
operations is included in a separate assembly services category of
Mexico’s current account called “servicios por transformacion.”
However, Mexico’s central bank, the Banco de Mexico, does calculate the
aggregate total of imports and exports involving maquiladoras. According
to a Banco de Mexico official, almost 100 percent of the maquiladora
industry’s total imports and exports are traded with the United States. We
used the Banco de Mexico’s data on maquiladoras’ imports from the world
to approximate the maquiladora industry’s merchandise imports from the
United States.
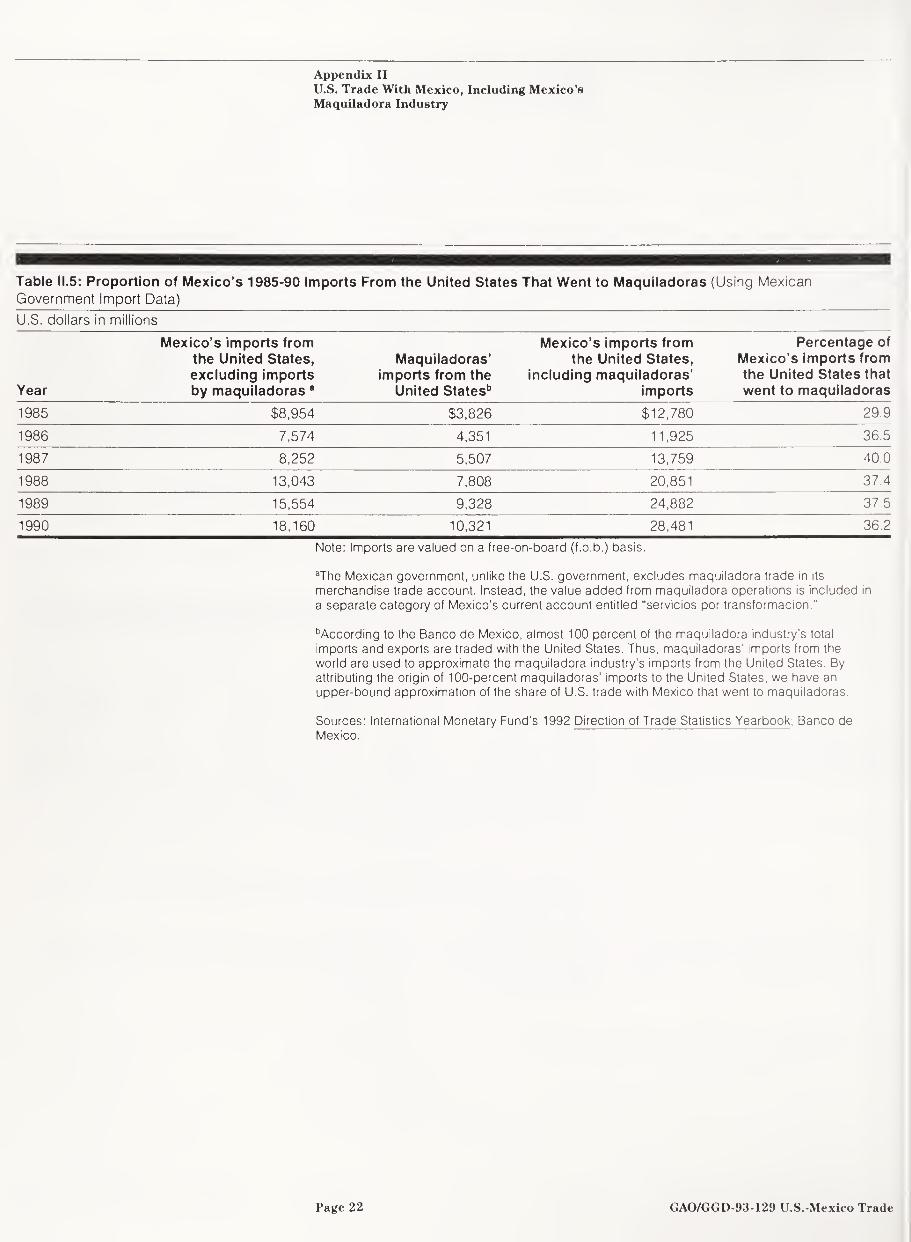
Table II.5 shows this analysis for 1985-90. The table shows that, in nominal
terms, maquiladoras’ imports grew by about 170 percent during this
period, from $3.8 billion in 1985 to $10.3 billion in 1990. During the same
period, Mexico’s merchandise imports from the United States, including
maquiladora imports, rose by about 123 percent in nominal terms, from
about $12.8 billion to about $28.5 billion. This information suggests that, if
100 percent of the maquiladora industry’s imports were from the United
States, then the proportion of Mexico’s imports from the United States that
went to the maquiladora industry over the period 1985-90 was about
37 percent.
Further, table II.5 also reveals that, while maquiladoras’ share of Mexico’s
imports from the United States increased from about 30 percent in 1985 to
about 40 percent in 1987, the proportion fell between 1988 and 1990, to
about 36 percent.
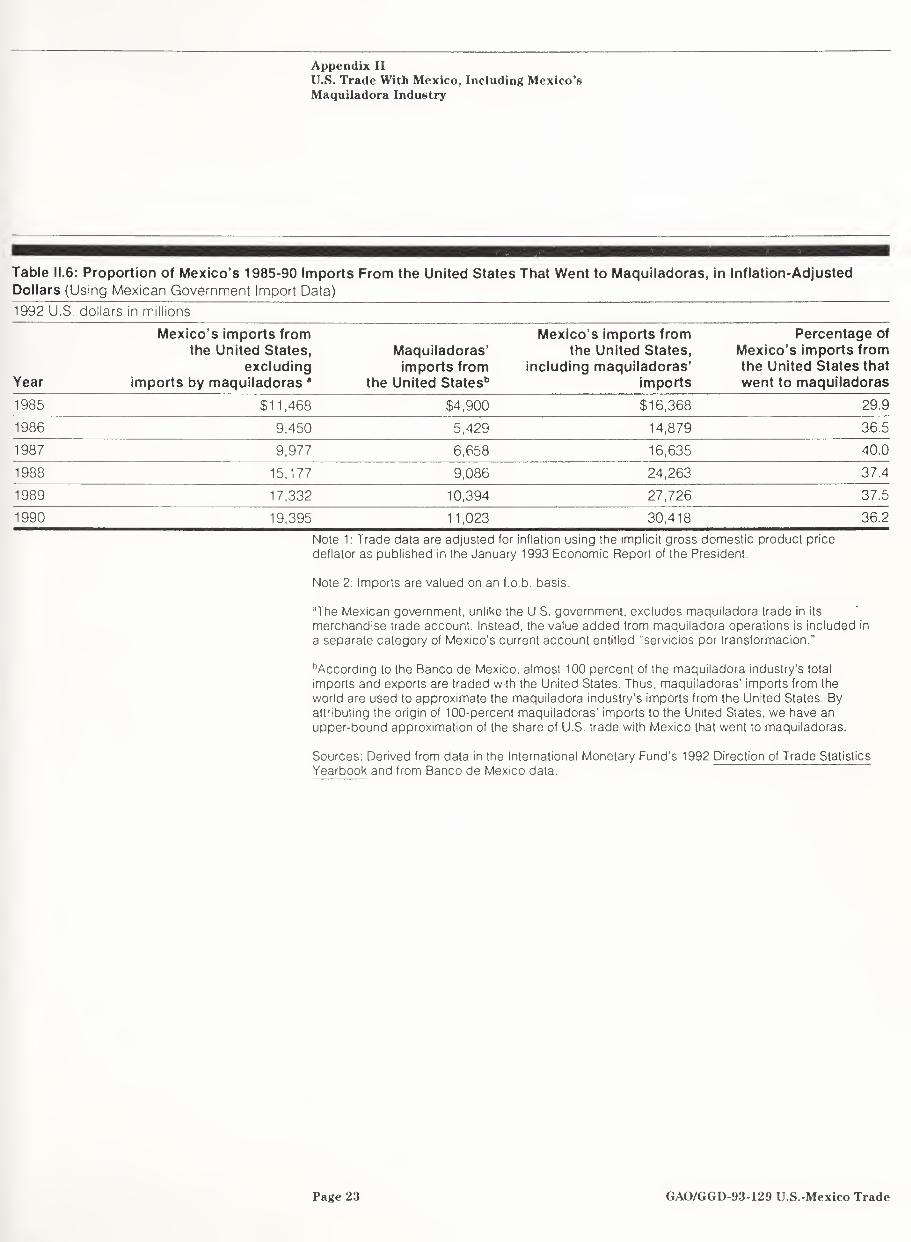
Table II.6 presents these trade data adjusted for inflation to 1992 dollars.
According to the table, in real terms, maquiladora imports from the United
States rose by about 125 percent from 1985 to 1990, from about $4.9 billion
to about $11 billion. The proportion of Mexico’s imports from the United
States that went to maquiladoras does not change when the data are
adjusted for inflation.
While there are no U.S. government data available on exports to the
maquiladora industry, estimates of such exports may be derived from U.S.
trade data on imports from Mexico under hts production-sharing
provisions. This is the case because a large proportion of
production-sharing imports are from maquiladoras. Further,
production-sharing import data distinguish content that originated in the
Page 6 GAO/GGD-93-129 U.S.-Mexico Trade
B-253952
United States from value added in the foreign country. Thus, the portion of
the production-sharing imports from Mexico that does not have duties can
be used to estimate U.S. exports to the maquiladoras.
It is not known how accurate such estimates are. One reason they might
be inaccurate may be that some U.S. exports to maquiladoras are not
returned by the maquiladoras to the United States under
production-sharing tariff provisions. For example, U.S. exports of capital
equipment to a maquiladora generally are returned to the United States
only when the maquiladora ceases operations. Similarly, as we have
previously testified,6 production-sharing imports exclude imports from
maquiladoras that are imported under other U.S. tariff provisions, such as
the Generalized System of Preferences.7 Another reason may be that some
maquiladora production containing U.S. content is not exported back to
the United States at all, but is sold inside Mexico or exported to other
countries.8
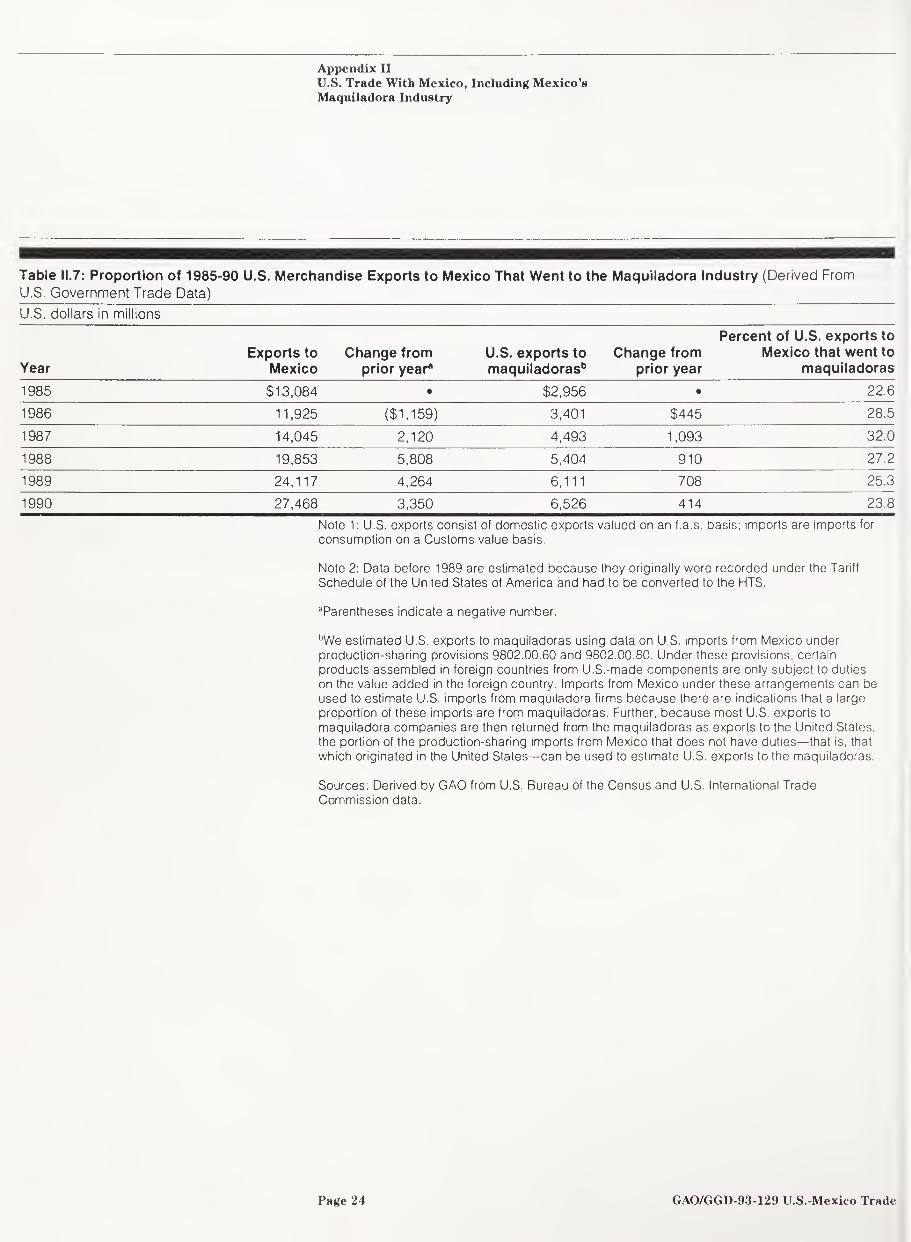
Although this technique has limitations, it is the method generally used to
estimate U.S.-maquiladora trade. We used this technique to estimate the
proportion of U.S. merchandise exports that went to maquiladoras for
1985-90 (the same years for which Mexican data were available). This
information is displayed in table II.7. The table shows that, in nominal
terms, the United States exported about $6.5 billion of goods to
maquiladoras in 1990, up from about $3 billion in 1985, an increase of
about 121 percent. According to the table, about 24 percent of U.S. exports
to Mexico in 1990 went to maquiladora firms, about the same proportion
as the nearly 23 percent in 1985. U.S. production-sharing data also are
available for 1991, and indicate that the percentage fell, from about 24
percent in 1990 to about 22 percent. For the entire 1985-91 period, about
25 percent of U.S. exports to Mexico went to the maquiladora industry.
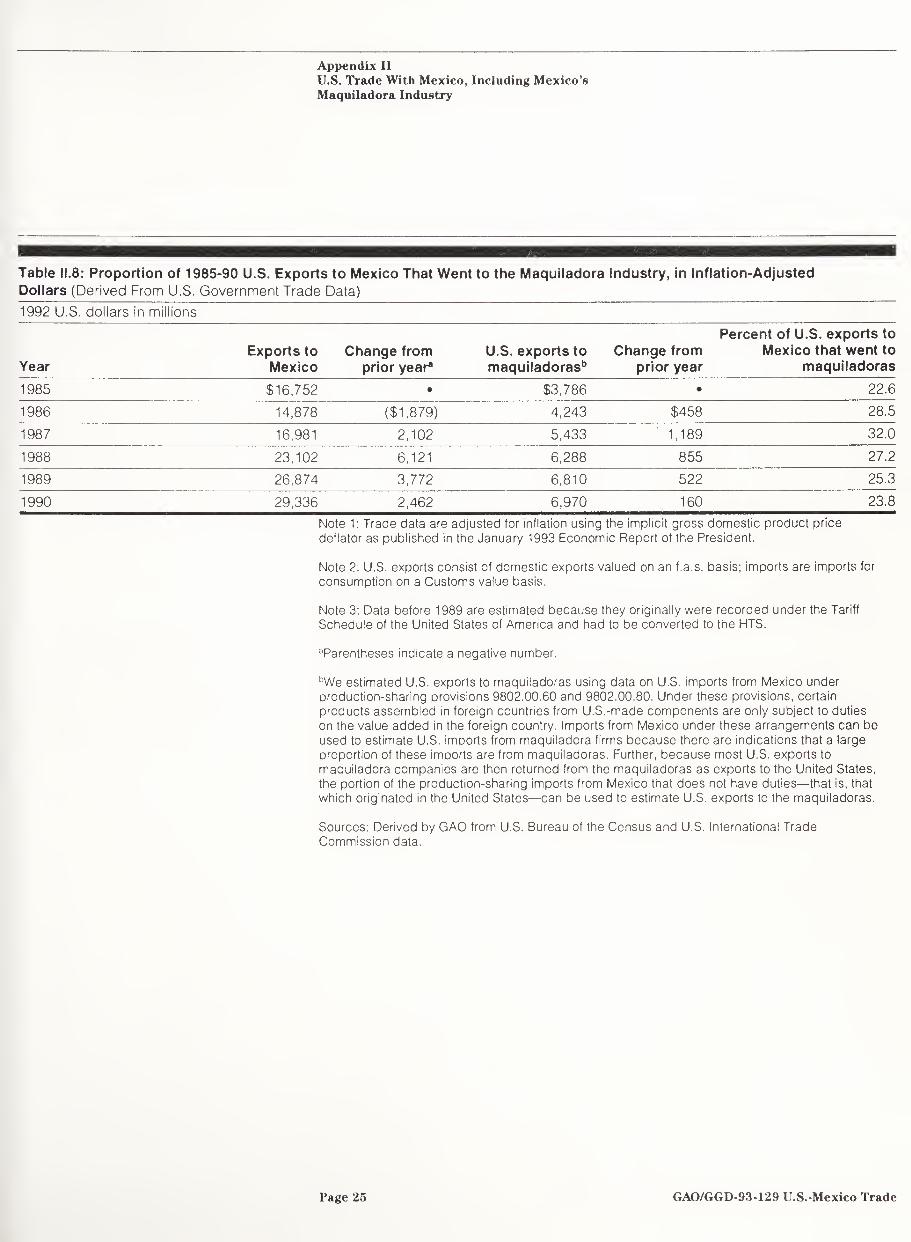
Table II.8 shows this trade in 1992 dollars. The table shows that, in real
terms, U.S. exports to maquiladoras nearly doubled between 1985 and
1990, from about $3.8 billion to about $7 billion. The share of U.S. exports
to Mexico that went to maquiladoras does not change when the data are
adjusted for inflation.
r,U.S. Trade Data: Limitations of U.S. Statistics on Trade with Mexico (GAO/T-GGD-93-25, Apr. 28, 1993f
7The Generalized System of Preferences is a program under which the United States grants duty-free status on selected products to certain developing nations and territories. Mexico is the largest
part icipant in this program.
^Mexican law permits maquiladoras to sell some of their production inside Mexico.
Page 7 GAO/GGD-93-129 U.S.-Mexico Trade
B-253952
We do not know whether the estimates of U.S.-maquiladora trade derived
from U.S. production-sharing imports are more accurate than estimates
derived from Mexican import data. However, both methods show that the
proportion of U.S. exports to Mexico that went to maquiladoras rose from
1985 to 1987, and then fell between 1987 and 1990. The trend of these data
suggests that, between 1987 and 1990, the share of U.S. exports to Mexico
that was processed and exported back to the United States may have
fallen slightly relative to the share that directly entered the Mexican
market.
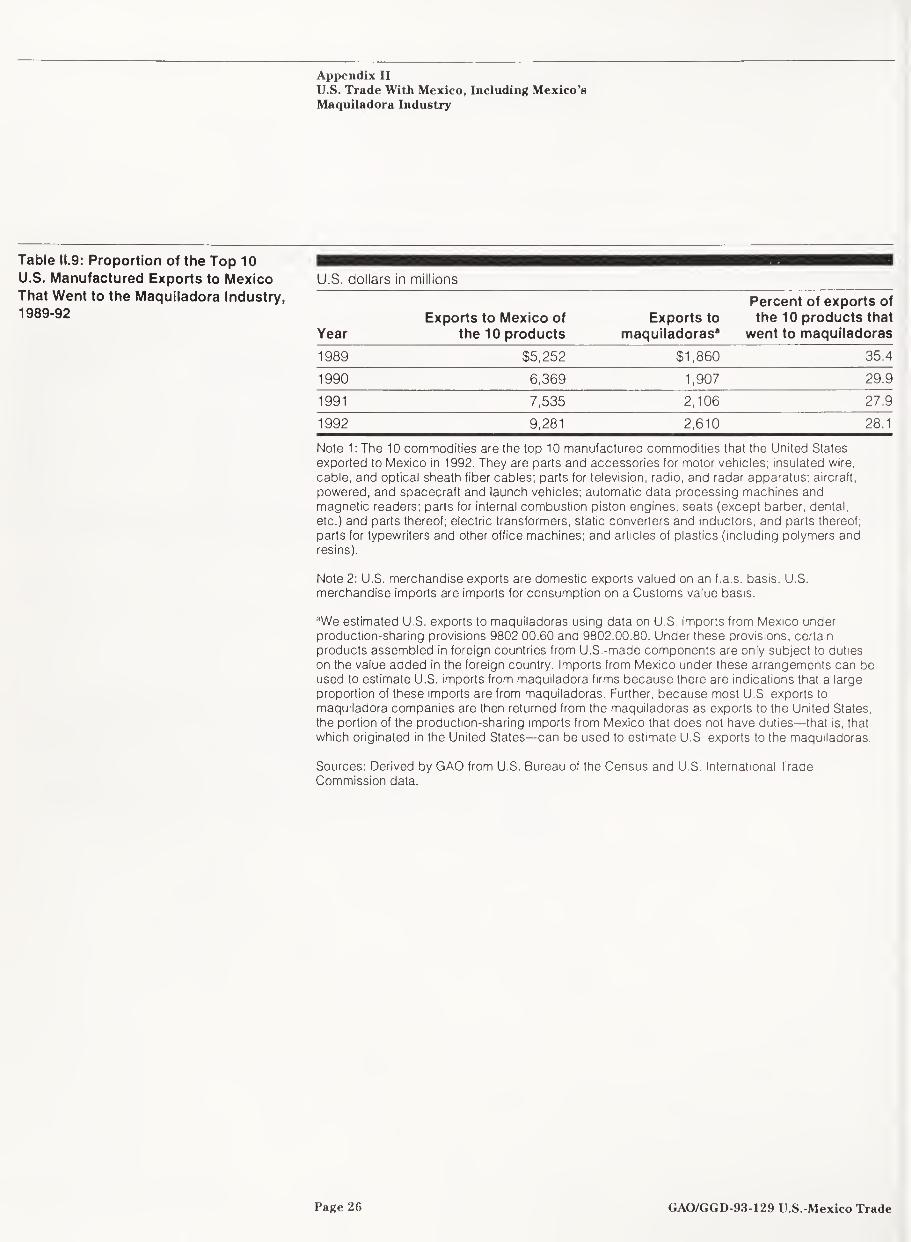
Our estimates of the share of the top 10 U.S. manufactured exports to
Mexico that went to maquiladoras during 1989-92 are displayed in table
II.9.9 However, these statistics do not provide a complete picture of
maquiladora industry trade patterns in individual product categories. In
some cases, items the United States exports to maquiladoras under one
fits classification may, after being assembled, return to the United States
under a different hts classification. For example, wire exported from the
United States to maquiladoras can be returned to the United States as an
automotive part. Thus, estimates of the share of U.S.-Mexican trade in
particular products that involves maquiladoras can be misleading.
Table II.9 shows that U.S. exports to maquiladoras of these 10
commodities grew from about $1.9 billion in 1989 to about $2.6 billion in
1992, an increase of about 40 percent. However, table II.9 shows that the
percent of U.S. exports to Mexico of these 10 commodities that went to
maquiladoras fell during this period, from about 35 percent in 1989 to
about 28 percent in 1992. Table II. 10 shows U.S.-Mexican trade in these 10
commodities in 1992 dollars.
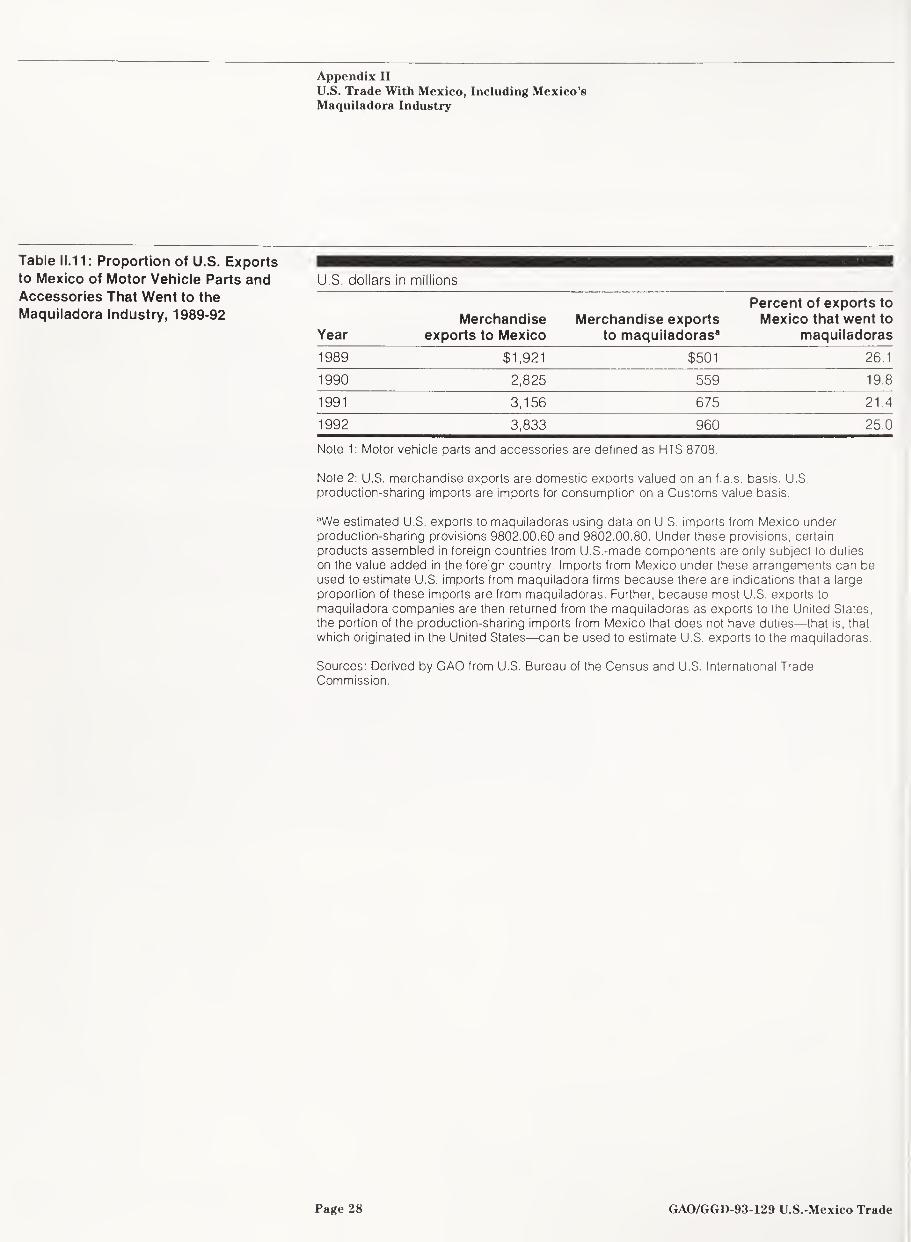
Information on the top manufactured export category, certain motor
vehicle parts and accessories, is presented in table II. 11. As the table
indicates, U.S. exports of these items to maquiladoras nearly doubled in
nominal terms between 1989 and 1992, from $501 million to $960 million.
The table also shows that the share of U.S. exports of motor vehicle parts
and accessories that went to maquiladoras fell from about 26 percent in
1989 to about 20 percent in 1990, but rose to about 25 percent by 1992.
Table 11.12 shows the same information in 1992 dollars.
‘■'An ITC official told us that production-sharing import data for these 10 products are not available before 1989 because they were recorded under the former Tariff Schedule of the United States and were not converted.
Page 8 GAO/GGD-93-129 U.S.-Mexico Trade
B-253952
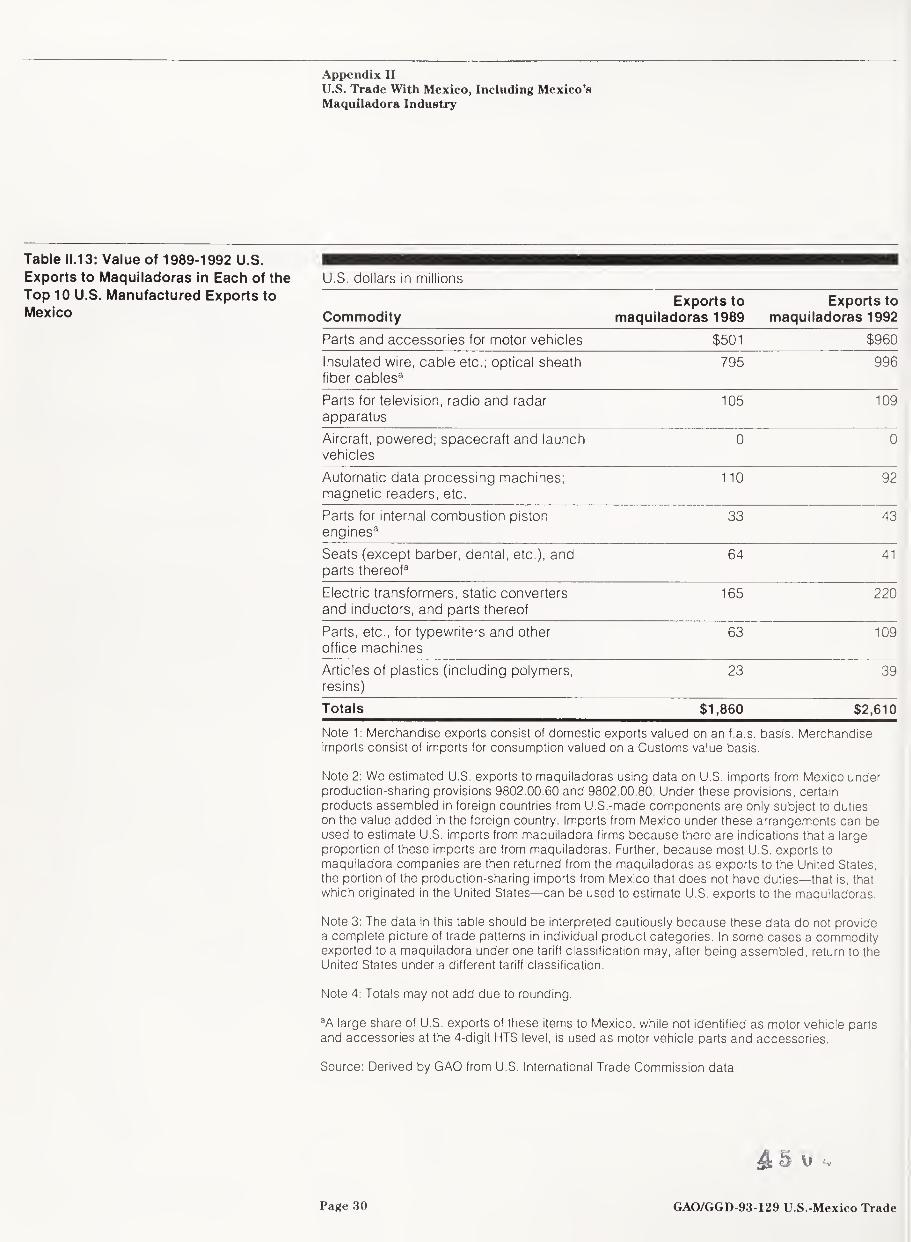
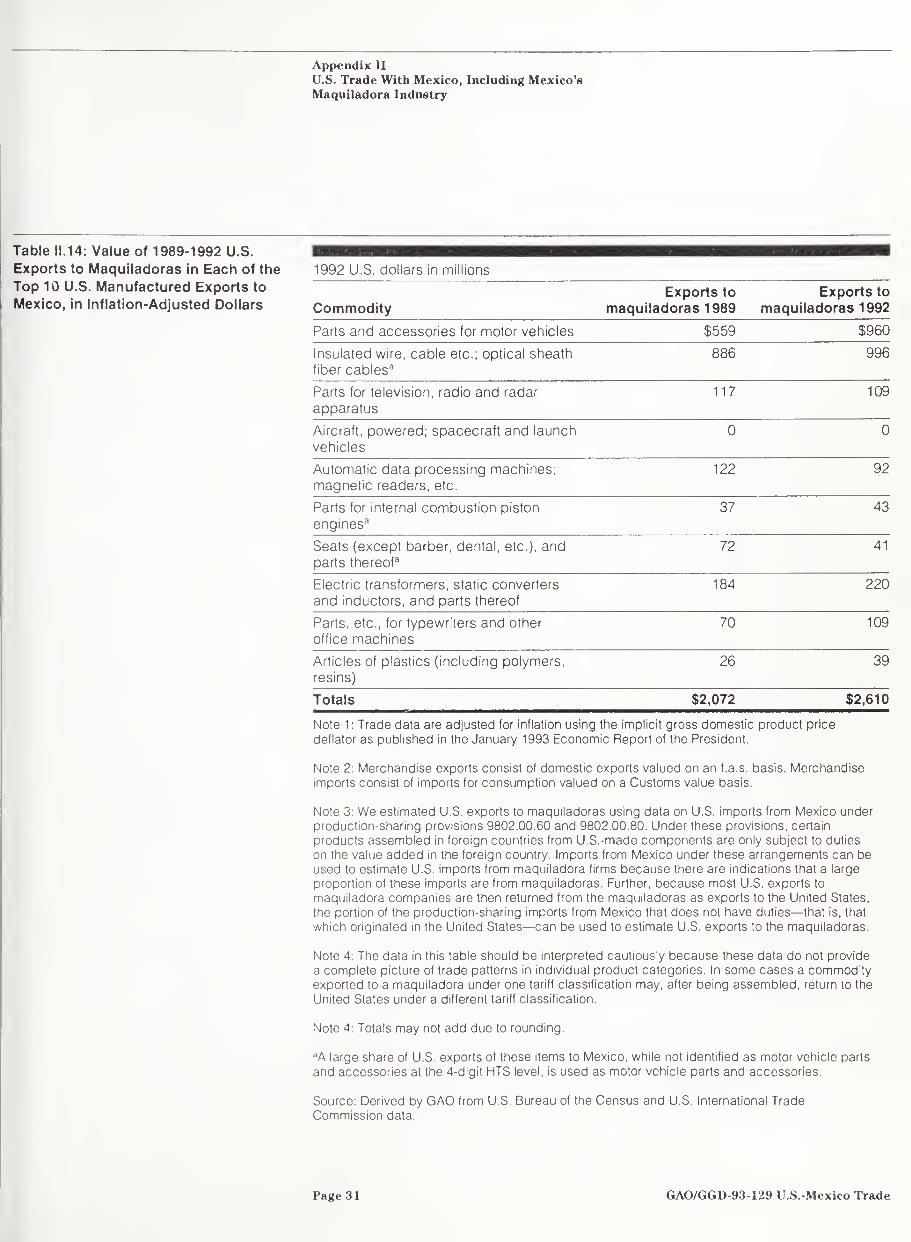
Information on the value of U.S. exports to Mexico of each of the top 10
commodities is presented in table 11.13. The same data, adjusted for
inflation to 1992 dollars, are shown in table 11.14.
Impact on U.S. Employment of Growth in Trade Mexico
Proponents of nafta contend that the recent increase in U.S. exports to
Mexico—including exports to maquiladoras—supports many U.S. jobs.
However, critics of nafta assert that the maquiladora industry has
With displaced U.S. workers and that, therefore, U.S. exports to maquiladoras
on balance do not support U.S. jobs. Several studies that we reviewed tried
to estimate maquiladoras’ effect on U.S. employment levels. These
estimates varied widely, in large part because they used different
methodologies. Moreover, all of these methodologies have inherent
limitations, and the conclusions they reached are very sensitive to
assumptions used in the analyses. Thus, it is difficult to determine which
of these studies offers the best estimate of the effect the maquiladora
industry has had on U.S. employment.
However, the studies generally agreed that, while U.S. exports to
maquiladoras support some U.S. jobs, the assembly and return of these
exports to the United States have supplanted U.S. jobs in some companies.
Therefore, it is important to assess the impact of both exports to and
imports from maquiladoras when evaluating the impact of trade with
Mexico on U.S. employment patterns.
Employment Impact of Growth in U.S. Exports to Mexico
The U.S. Department of Commerce has estimated that U.S. merchandise
exports to Mexico in 1990 supported about 538,000 U.S. jobs. According to
Commerce, this is an increase of about 75 percent since 1985, reflecting
the rise in U.S. exports to Mexico during that period. Similarly, the Office
of the U.S. Trade Representative (ustr), extrapolating from Commerce’s
analysis, estimated that the number of jobs supported by U.S. exports to
Mexico in 1992 had risen to about 700,000. The Commerce study estimated
that about 135,000 of the 538,000 jobs supported by exports to Mexico in
1990 were supported by exports to maquiladoras. The ustr study did not
indicate how many jobs supported in 1992 by U.S. exports to Mexico were
attributable to maquiladoras. Neither analysis included an evaluation of
the employment effect of U.S. imports from Mexico.
Analyses of the Maquiladora Industry’s U.S. Employment Impact
Maquiladora industry proponents assert that maquiladoras allow U.S. firms
to be more competitive by lowering their costs of production relative to
competitors in other countries. They say that this effect permits certain
Page 9 GAO/GGD-93-129 U.S.-Mexico Trade
B-253952
U.S. industries to remain internationally competitive by allowing
companies to move high labor-cost operations to Mexico, thus allowing
them to retain some U.S. jobs that otherwise would be lost to other
low-wage countries. In contrast, U.S. labor unions maintain that
maquiladora operations have resulted in the loss of many U.S. jobs. They
cite many instances of factories in the United States closing and reopening
in Mexico as maquiladoras, and note that a decline in U.S. employment in
some industries has coincided with increases in maquiladora employment.
They imply that there is a one-to-one relationship between jobs gained in
the maquiladora industry and jobs lost in the United States.
A number of analyses done in the late 1980s have tried to estimate what
effect maquiladoras or other production-sharing arrangements have had
on U.S. employment. These studies usually have attempted either to
(1) quantify the number of U.S. jobs supported by maquiladoras or other
production-sharing arrangements or (2) predict the impact that repealing
production-sharing tariff provisions would likely have on U.S.
employment. According to a U.S. Department of Labor review of some of
these studies,10 they generally have used one or more of five methods:
• Survey approach: Asking U.S. companies involved in maquiladora
operations how many U.S. jobs those operations support and how they
would respond to repeal of production-sharing provisions.
• Cost accounting approach: Evaluating the costs to a firm of pursuing a
new course of action in the event of repeal of production-sharing
provisions.
• Labor content analysis: Estimating how many U.S. jobs would be needed
to produce what maquiladoras produce, and then predicting how much
maquiladora production would return to the United States were
production-sharing provisions repealed.
• Partial equilibrium analysis: Measuring the effects of repeal of
production-sharing provisions on those U.S. industries directly affected by
the repeal. The only factor assumed to change as a result of the repeal is
the price of the imported production-sharing items.
• Macroeconomic models: Assessing the effect of repeal on all sectors of the U.S. economy simultaneously.
Although these studies of maquiladoras’ effect on U.S. employment
disagree on the precise impact, they generally agree that maquiladoras
support some U.S. jobs but have displaced others. According to these
"'Gregory K. Sehoepfle and Jorge F. Perez-Lopez, U.S. Employment. Impact, of TSUS 806.30 and 807.00 Provisions and Mexican Maquiladoras: A Survey of Issues and Estimates, U.S. Department of Labor (Washington, D.C.: Aug. 1988).
Page 10 GAO/GGD-93-129 U.S.-Mexico Trade*
B-253952
studies, most of the U.S. jobs supported are associated with the
production and transport of U.S.-made components that the United States
exports to maquiladoras for assembly. Maquiladoras, for the most part,
assemble these U.S.-made components and return them to the United
States. Consequently, most of the U.S. jobs lost to maquiladoras have been
assembly jobs. The value-added component of U.S. imports from
maquiladoras reflects the value added in this assembly process.
Limits of the Studies The Labor Department study stressed that surveys that have tried to
quantify the number of U.S. jobs production-sharing provisions support
can be unreliable because respondents may give self-serving answers.
Also, in some cases, the quality of surveys—collection methodologies,
response rates, sample sizes—varies widely from one survey to another. In
addition, these surveys in some cases attempt to estimate the impact of
repealing production-sharing provisions only on selected companies or
regions, not on whole industries nor on the entire U.S. economy.
In 1989, for example, a consulting firm, relying in large part on surveys of
maquiladora managers, concluded that one county in Texas gained
approximately 23,415 jobs from the presence of maquiladoras in the city of
Reynosa, Mexico.11 This result suggested that maquiladoras supported a far
larger number of U.S. jobs nationwide.
The other four methods require making assumptions about how
consumers and companies would react to repeal, including how much
maquiladora production would return to the United States. For instance, a
1988 itc study, using labor content and partial equilibrium approaches,
concluded that, even assuming that repeal of production-sharing
provisions would cause all maquiladora production to return to the United
States, the U.S. employment impact would be modest. Applying this
assumption, itc found that in the short run the United States might lose
about 37,000 jobs supported by U.S. exports to maquiladoras and gain
about 64,000 jobs that were equivalent to maquiladoras’ production.12 The
jobs gained would be mostly assembly jobs.
However, itc considered this to be an unrealistic assumption because in
most cases duties represent a small portion of a maquiladora’s production
"The Economic Impact of Maquiladoras on the McAllen-Hidalgo County Area, M. Ray Perryman Consultants, Inc. (Waco, Texas: Mar. 1989).
'-The Uses and Economic Impact of TSUS Items 806.30 and 807.00, U.S. International Trade Commission (Washington, D.C.: Jan. 1988).
Page 11 GAO/GGD-93-129 U.S.-Mexico Trade
B-253952
costs. Therefore, repeal would not lead to relocation of much maquiladora
production away from Mexico, back to the United States, itc therefore
modified this extreme assumption by assuming that a more realistic price
effect would lead to a smaller increase in U.S. production. Under this
scenario, itc estimated that the employment impact would be much
smaller. Under this assumption, about 5,000 of the jobs dependent on U.S.
exports to maquiladoras might have been eliminated, and about 6,000
assembly jobs might have returned to the United States.13
On the other hand, in 1988 a U.S. economic forecasting company, Wharton
Econometric Forecasting Associates (wefa), under contract to the
Department of Labor, used a macroeconomic model and found that
eliminating hts production-sharing provision 9802.00.80 for Mexico would
result in net output losses corresponding to about 76,000 U.S. jobs in
1992.14,16 In this study, wefa also estimated that, if, alternatively, the
Mexican government were to eliminate the maquiladora program, net
output losses corresponding to about 92,000 U.S. jobs would result in 1992..
This study assumed that U.S. imports from countries other than Mexico
would increase as a result of repeal of production-sharing provisions and
that U.S. output would decrease because of higher U.S. prices and lower
demand for U.S.-made components.
An Assessment of Trade’s Employment Impact Should Consider Both Exports and Imports
To assess the overall impact of U.S.-Mexican trade on U.S. employment,
we believe it is necessary to consider the effects of U.S. imports from
maquiladoras as well as U.S. exports to maquiladoras. However, it is
difficult to assess the effects of imports from Mexico because doing so
requires making assumptions about the extent to which Mexican goods
displace U.S. domestic production and imports from other countries. The
itc study used several such assumptions in estimating maquiladoras’ U.S.
employment impact. The results of the itc’s analysis were very sensitive to
these assumptions. The more realistic scenario presented by itc led to
virtually no net job impact. On the other hand, wefa’s study implicitly
estimated the displacement effect, but, unlike the itc study, concluded that
K,ITC warned the reader that it is improper to subtract these estimates of employment losses from employment gains to calculate the long-run U.S. employment impact because employment levels in the long run are determined by other factors, such as population growth. In the long run, changing trade patterns can affect the distribution of jobs among sectors in an economy, but not its overall employment level.
14 The Implication for the U.S. Economy of Tariff Schedule Item 807 and Mexico’s Maquila Program, Wharton Econometric Forecasting Associates (Bala Cynwyd, PA: 1988).
Ir’ About 99 percent of production-sharing imports into the United States enter under provision 9802.00.80.
Page 12 GAO/GGD-93-129 U.S.-Mexico Trade
B-253952
the repeal of production-sharing provisions would reduce U.S.
employment. These conclusions illustrate the varied results that can be
derived from differing methodologies and assumptions in employment
impact analyses.
Moreover, a full analysis of the impact of maquiladoras on U.S.-Mexican
trade and U.S. employment should take into account the direct impact of
the maquiladora program on U.S. trade patterns with the rest of the world.
For example, such an analysis should consider the extent to which the
United States would import from other countries the goods that it now
imports from Mexico under the maquiladora program. In addition, because
services trade is an important part of U.S.-Mexican trade, a full evaluation
of the effect of U.S.-Mexican trade on U.S. employment patterns should
include trade in services, including an evaluation of the extent to which
the maquiladora program might affect services trade.
Agency Comments In June 1993 we discussed the content of this report with responsible
officials at the Departments of Commerce and Labor, and at rrc. They
generally agreed with the report’s overall message, and their comments
have been incorporated as appropriate.
As you requested, we plan no further distribution of this report until 30
days after its issue date. At that time, we will send copies to the
Secretaries of Commerce and Labor, the Chairman of the U.S.
International Trade Commission, and the Acting Director of the Bureau of
the Census. We will also make copies available to other interested parties
upon request.
Please contact me on (202) 512-4812 if you have any questions concerning
this report. The major contributors to this report were Curtis Turnbow,
Assistant Director; Anthony L. Hill, Evaluator-in-Charge; and David
Genser, Evaluator.
(a§2-<_
Allan I. Mendelowitz, Director
International Trade, Finance,
and Competitiveness
Page 13 GAO/GGD-93-129 U.S.-Mexieo Trade
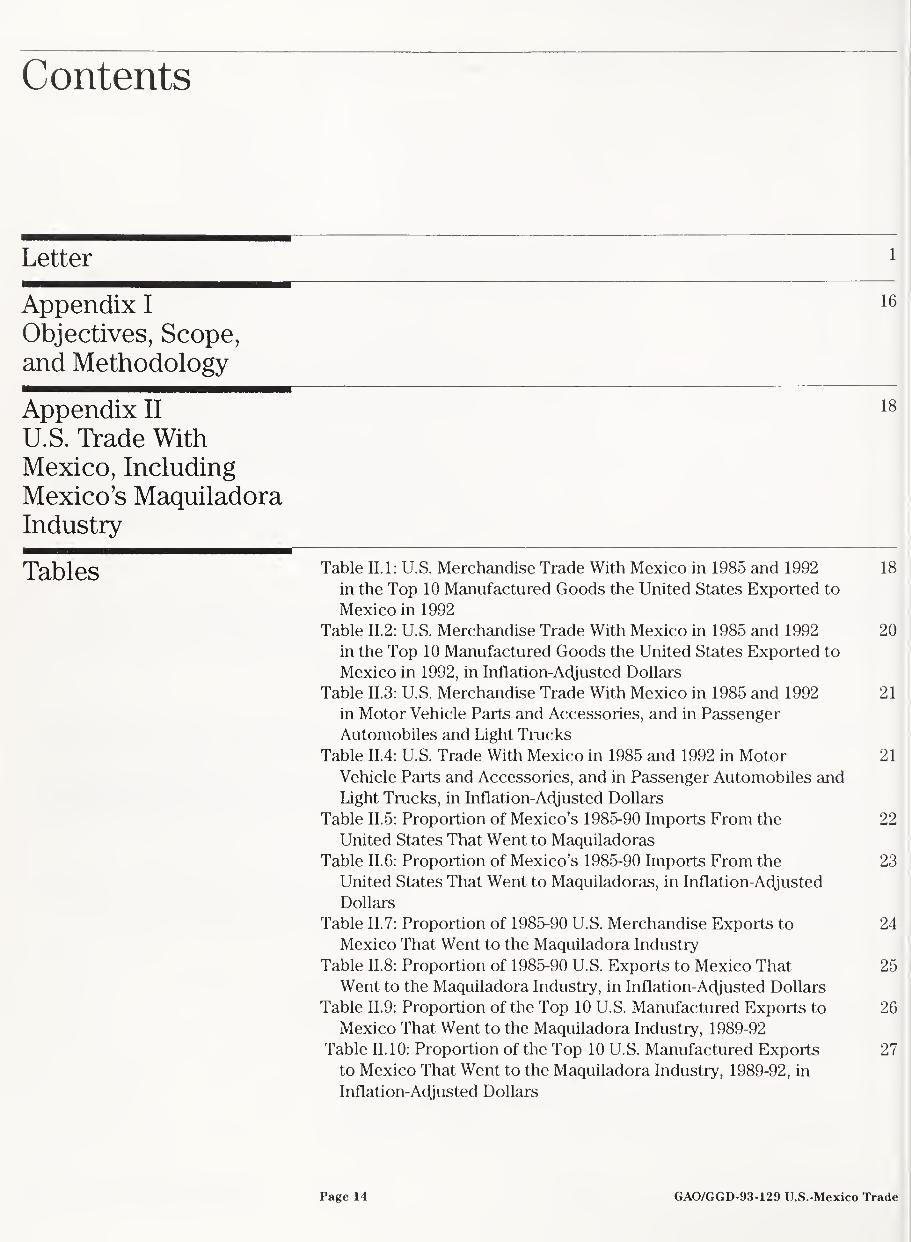
Contents
Letter 1
Appendix I 16
Objectives, Scope, and Methodology
Appendix II 18
U.S. Trade With Mexico, Including Mexico’s Maquiladora Industry
Tables Table II. 1: U.S. Merchandise Trade With Mexico in 1985 and 1992 18
in the Top 10 Manufactured Goods the United States Exported to
Mexico in 1992
Table II.2: U.S. Merchandise Trade With Mexico in 1985 and 1992 20
in the Top 10 Manufactured Goods the United States Exported to
Mexico in 1992, in Inflation-Adjusted Dollars
Table II.3: U.S. Merchandise Trade With Mexico in 1985 and 1992 21
in Motor Vehicle Parts and Accessories, and in Passenger
Automobiles and Light Trucks
Table II.4: U.S. Trade With Mexico in 1985 and 1992 in Motor 21
Vehicle Parts and Accessories, and in Passenger Automobiles and
Light Trucks, in Inflation-Adjusted Dollars
Table II.5: Proportion of Mexico’s 1985-90 Imports From the 22
United States That Went to Maquiladoras
Table II.6: Proportion of Mexico’s 1985-90 Imports From the 23
United States That Went to Maquiladoras, in Inflation-Adjusted
Dollars
Table II.7: Proportion of 1985-90 U.S. Merchandise Exports to 24
Mexico That Went to the Maquiladora Industry
Table II.8: Proportion of 1985-90 U.S. Exports to Mexico That 25
Went to the Maquiladora Industry, in Inflation-Adjusted Dollars
Table II.9: Proportion of the Top 10 U.S. Manufactured Exports to 26
Mexico That Went to the Maquiladora Industry, 1989-92
Table II. 10: Proportion of the Top 10 U.S. Manufactured Exports 27
to Mexico That Went to the Maquiladora Industry, 1989-92, in
Inflation-Adjusted Dollars
Page 14 GAO/GGD-93-129 U.S.-Mexico Trade

Contents
Table II. 11: Proportion of U.S. Exports to Mexico of Motor 28
Vehicle Parts and Accessories That Went to the Maquiladora
Industry, 1989-92
Table II. 12: Proportion of U.S. Exports to Mexico of Motor 29
Vehicle Parts and Accessories That Went to the Maquiladora
Industry, 1989-92, in Inflation-Adjusted Dollars
Table 11.13: Value of 1989-1992 U.S. Exports to Maquiladoras in 30
Each of the Top 10 U.S. Manufactured Exports to Mexico
Table II. 14: Value of 1989-1992 U.S. Exports to Maquiladoras in 31
Each of the Top 10 U.S. Manufactured Exports to Mexico, in
Inflation-Adjusted Dollars
Abbreviations
f.a.s. Free alongside ship
f o b. Free on board
gao General Accounting Office
hts Harmonized Tariff Schedule of the United States
itc U.S. International Trade Commission
nafta North American Free Trade Agreement
ustr Office of the U.S. Trade Representative
wefa Wharton Econometric Forecasting Associates
Page 15 GAO/GGD-93-129 U.S.-Mexico Trade
Appendix I
Objectives, Scope, and Methodology
Our objectives were to (1) determine how U.S. trade with Mexico’s
maquiladora industry has affected recent growth in U.S.-Mexican trade,
especially trade in the top 10 U.S. manufactured exports to Mexico; and
(2) review studies that have attempted to determine how the maquiladora
program has affected U.S. employment.
In order to determine how U.S. trade with Mexico’s maquiladora industry
has affected recent growth in U.S.-Mexican trade, we obtained and
analyzed 1985-92 U.S. merchandise trade data from the U.S. Bureau of the
Census and the U.S. International Trade Commission (itc). We defined the
top 10 manufactured commodities at the 4-digit level of Harmonized Tariff
Schedule of the United States (hts). The top manufactured export category
was certain motor vehicle parts and accessories. However, many motor
vehicle parts and accessories are not included in the 4-digit hts motor
vehicle parts and accessories category. Therefore, to obtain a more
accurate picture of trade in automotive parts and accessories, we used a
broader definition obtained from itc. The itc’s definition includes some
items that are not part of the 4-digit hts definition, such as tires and
automotive glass and furniture.
We obtained Mexican government 1985-90 import data from the
International Monetary Fund’s 1992 Direction of Trade Statistics
Yearbook. We obtained Mexican government 1985-90 data on the
maquiladora industry’s imports from a prior gao report1 and used these
data as appropriate in this report. We did not verify the data received from
the Mexican government or the sources it used.
To analyze the results of studies that have assessed how the maquiladora
program has affected employment in the United States, we reviewed the
literature to identify research studies that have attempted to measure this
effect. Further, we interviewed U.S. government officials at the
Department of Labor knowledgeable about the maquiladora program and
its U.S. employment effect. To obtain the views of U.S. industry and U.S.
labor unions, we judgmentally selected and obtained the views of
representatives from some of these organizations. For industry, we
selected the largest company in a major industry that is involved in
maquiladora operations. For labor, we selected two large unions that have
alleged that their members have lost jobs due to the maquiladora program.
'North American Free Trade Agreement: U.S.-Mexican Trade and Investment Data (GAO/GGD-92-131, Sept. 25, 1992).
Page 16 GAO/GGD-93-129 IJ.S.-Mexico Trade
Appendix I
Objectives, Scope, and Methodology
We did our work between January and June 1993 in accordance with
generally accepted government auditing standards.
Page 17 GAO/GGD-93-129 U.S.-Mexico Trade
Appendix II
U.S. Trade With Mexico, Including Mexico’s Maquiladora Industry
Table 11.1: U.S. Merchandise Trade With Mexico in 1985 and 1992 in the Top 10 Manufactured Goods the United States Exported to Mexico in 1992
U.S. dollars in millions
Commodity Exports
1985 Imports
1985
Trade balance
1985* Exports
1992 Imports
1992
Trade balance,
1992
Change in trade balance
1985-92
Certain parts and accessories for motor vehicles
$861 $409 $452 $3,833 $1,763 $2,071 $1,619
Insulated wire, cable etc.; optical sheath fiber cables6
337 608 (271) 1,102 1,863 (761) (490)
Parts for television, radio and radar apparatus
111 455 (344) 787 788 (1) 343
Aircraft, powered; spacecraft and launch vehicles
124 0 124 702 C 702 578
Automatic data processing machines; magnetic readers, etc.
131 181 (49) 560 449 110 160
Parts for internal combustion piston engines6
334 47 287 470 158 313 25
Seats (except barber, dental, etc.), and parts thereof6
32 103 (71) 467 531 (65) 7
Electric transformers, static converters and inductors, and parts thereof
80 197 (117) 458 530 (72) 45
Parts, etc., for typewriters and other office machines
305 107 199 451 432 20 (179)
Articles of plastics (including polymers and resins)
58 39 19 451 129 322 303
Totals $2,374 $2,146 $228 $9,281 $6,643 $2,638 $2,411
(Table notes on next page)
Page 18 GAO/GGD-93-129 U.S.-Mexieo Trade
Appendix II U.S. Trade With Mexico, Including Mexico’s Maquiladora Industry
Note 1: Merchandise exports consist of "domestic exports." According to the Guide to Foreign Trade Statistics, U.S. Bureau of the Census, (Washington, D C.: U.S. Government Printing Office, 1991), "exports of domestic merchandise include commodities which are grown, produced or manufactured in the United States, and commodities of foreign origin which have been changed in the United States, including U.S. Foreign Trade Zones, from the form in which they were imported, or which have been enhanced in value by further manufacture in the United States.”
Note 2: Merchandise imports consist of “imports for consumption." According to the Guide to Foreign Trade Statistics, "imports for consumption measure the total of merchandise that has physically cleared through Customs either entering consumption channels immediately or entering after withdrawal for consumption from bonded warehouses under Customs custody or from Foreign Trade Zones." Many countries use the term “special imports" to designate statistics compiled on this basis.
Note 3: Domestic exports are on a free-alongside-ship (fas.) value basis; imports for consumption are Customs value basis.
Note 4: Trade balances and totals may not add due to rounding.
Note 5: Data for 1985 are estimated because they originally were recorded under the Tariff Schedule of the United States of America and had to be converted to the Harmonized Tariff Schedule (HTS).
Note 6: The data in this table should be interpreted cautiously because these data do not provide a complete picture of trade patterns in individual product categories. In some cases a commodity exported to a maquiladora under one tariff classification may, after being assembled, return to the United States under a different tariff classification.
aParentheses signify a U.S. trade deficit.
bA large share of U.S. exports of these items to Mexico, while not identified as motor vehicle parts and accessories at the 4-digit HTS level, is used as motor vehicle parts and accessories.
cLess than $500,000.
Source: U.S. Bureau of the Census.
Page 19 GAO/GGD-93-129 U.S.-Mexico Trade
Appendix II
U.S. Trade With Mexico, Including Mexico’s Maquiladora Industry
Table 11.2: U.S. Merchandise Trade With Mexico in 1985 and 1992 in the Top 10 Manufactured Goods the United States Exported to Mexico in 1992, in Inflation-Adjusted Dollars
1992 U.S. dollars in millions
Commodity Exports
1985 Imports
1985
Trade balance
1985® Exports
1992 Imports
1992
Trade balance
1992
Change in trade balance
1985 to 1992
Parts and accessories for motor vehicles $1,103 $524 $578 $3,833 $1,763 $2,071 $1,492
Insulated wire, cable etc.; optical sheath fiber cables6
432 778 (347) 1,102 1,863 (761) (414)
Parts for television, radio and radar apparatus
143 583 (440) 787 788 (D 440
Aircraft, powered; spacecraft and launch vehicles
158 0 158 702 C 702 543
Automatic data processing machines; magnetic readers, etc.
168 231 (63) 560 449 110 173
Parts for internal combustion piston engines6
428 60 368 470 158 313 (55)
Seats (except barber, dental, etc.), and parts thereof6
41 132 (91) 467 531 (65) 27
Electric transformers, static converters and inductors, and parts thereof
102 252 (150) 458 530 (72) 78
Parts, etc., for typewriters and other office machines
391 137 254 451 432 20 (235)
Articles of plastics (including polymers, resins)
75 50 25 451 129 322 297
Totals $3,040 $2,748 $292 $9,281 $6,643 $2,638 $2,347
Note 1: Trade data are adjusted for inflation using the implicit gross domestic product price deflator as published in the January 1993 Economic Report of the President.
Note 2: Merchandise exports consist of domestic exports valued on an f.a.s. basis. Merchandise imports consist of imports for consumption valued on a Customs value basis.
Note 3: Trade balances and totals may not add due to rounding
Note 4: Data for 1985 are estimated because they originally were recorded under the Tariff
Schedule of the United States of America and had to be converted to the HTS.
Note 5: The data in this table should be interpreted cautiously because these data do not provide a complete picture of trade patterns in individual product categories. In some cases a commodity exported to a maquiladora under one tariff classification may, after being assembled, return to the United States under a different tariff classification.
aParentheses signify a U.S. trade deficit.
bA large share of U.S. exports of these items to Mexico, while not identified as motor vehicle parts and accessories at the 4-digit HTS level, is used as motor vehicle parts and accessories.
cLess than $500,000.
Source: Derived from U.S. Bureau of the Census data.
Page 20 GAO/GGD-93-129 U.S.-Mexico Trade
Appendix II U.S. Trade With Mexico, Including Mexico’a Maquiladora Industry
Table 11.3: U.S. Merchandise Trade With Mexico in 1985 and 1992 in Motor Vehicle Parts and Accessories, and in Passenger Automobiles and Light Trucks
U.S. dollars in millions
Commodity Exports
1985 Imports
1985
Trade balance
1985* Exports
1992 Imports
1992
Trade balance
1992
Change in trade balance
1985-1992
Motor vehicle parts and accessories $1,861 $2,121 ($260) $5,706 $5,035 $671 $931
Passenger automobiles and light trucks 6 310 (304) 119 3,045 (2,926) (2,622)
Note 1: U.S. exports consist of domestic exports valued on an f.a.s. basis; imports are imports for consumption on a Customs value basis.
Note 2: Data for 1985 are estimated because they originally were recorded under the Tariff Schedule of the United States of America and had to be converted to the HTS.
aParentheses signify a U.S. trade deficit.
Sources: U.S. International Trade Commission; U.S. Bureau of the Census.
Table 11.4: U.S. Trade With Mexico in 1985 and 1992 in Motor Vehicle Parts and Accessories, and in Passenger Automobiles and Light Trucks, in Inflation-Adjusted Dollars
1992 U.S. dollars in millions
Commodity Exports
1985 Imports
1985
Trade balance
1985* Exports
1992 Imports
1992
Trade balance
1992
Change in trade balance
1985-1992
Motor vehicle parts and accessories $2,384 $2,716 ($333) $5,706 $5,035 $671 $1,004
Passenger automobiles and light trucks 7 397 (389) 119 3,045 (2,926) (2,536)
Note 1: Trade data are adjusted for inflation using the implicit gross domestic product price deflator as published in the January 1993 Economic Report of the President.
Note 2: U.S. exports consist of domestic exports valued on an f.a.s. basis; imports are imports for consumption on a Customs value basis.
Note 3: Data for 1985 are estimated because they originally were recorded under the Tariff Schedule of the United States of America and had to be converted to the HTS.
aParentheses signify a U.S. trade deficit.
Sources: Derived from U.S. International Trade Commission and U.S. Bureau of the Census data.
Page 21 GAO/GGD-93-129 U.S.-Mexico Trade
Appendix II U.S. Trade With Mexico, Including Mexico’s Maquiladora Industry
Table 11.5: Proportion of Mexico’s 1985-90 Imports From the United States That Went to Maquiladoras (Using Mexican
Government Import Data)
U.S. dollars in millions
Mexico’s imports from Mexico’s imports from Percentage of the United States, Maquiladoras’ the United States, Mexico’s imports from excluding imports imports from the including maquiladoras’ the United States that
Year by maquiladoras 8 United Statesb imports went to maquiladoras
1985 $8,954 $3,826 $12,780 29.9
1986 7,574 4,351 11,925 36.5
1987 8,252 5,507 13,759 40.0
1988 13,043 7,808 20,851 37.4
1989 15,554 9,328 24,882 37 5
1990 18,160 10,321 28,481 36.2
Note: Imports are valued on a free-on-board (f.o.b.) basis.
aThe Mexican government, unlike the U.S. government, excludes maquiladora trade in its merchandise trade account. Instead, the value added from maquiladora operations is included in a separate category of Mexico’s current account entitled "servicios por transformacion.”
According to the Banco de Mexico, almost 100 percent of the maquiladora industry's total imports and exports are traded with the United States. Thus, maquiladoras' imports from the world are used to approximate the maquiladora industry's imports from the United States. By attributing the origin of 100-percent maquiladoras' imports to the United States, we have an upper-bound approximation of the share of U.S. trade with Mexico that went to maquiladoras.
Sources: International Monetary Fund’s 1992 Direction of Trade Statistics Yearbook; Banco de Mexico.
Page 22 GAO/GGD-93-129 U.S.-Mexico Trade
Appendix II U.S. Trade With Mexico, Including Mexico’s Maquiladora Industry
Table 11.6: Proportion of Mexico’s 1985-90 Imports From the United States That Went to Maquiladoras, Dollars (Using Mexican Government Import Data)
in Inflation-Adjusted
1992 U.S. dollars in millions
Year
Mexico’s imports from the United States,
excluding imports by maquiladoras a
Maquiladoras’ imports from
the United Statesb
Mexico’s imports from the United States,
including maquiladoras’ imports
Percentage of Mexico’s imports from the United States that went to maquiladoras
1985 $11,468 $4,900 $16,368 29.9
1986 9,450 5,429 14,879 36.5
1987 9,977 6,658 16,635 40.0
1988 15,177 9,086 24,263 37.4
1989 17,332 10,394 27,726 37.5
1990 19,395 11,023 30,418 36.2
Note 1: Trade data are adjusted for inflation using the implicit gross domestic product price deflator as published in the January 1993 Economic Report of the President.
Note 2: Imports are valued on an f.o.b. basis
aThe Mexican government, unlike the U.S. government, excludes maquiladora trade in its merchandise trade account. Instead, the value added from maquiladora operations is included in a separate category of Mexico’s current account entitled "servicios por transformacion.”
According to the Banco de Mexico, almost 100 percent of the maquiladora industry’s total imports and exports are traded with the United States. Thus, maquiladoras’ imports from the world are used to approximate the maquiladora industry's imports from the United States. By attributing the origin of 100-percent maquiladoras' imports to the United States, we have an upper-bound approximation of the share of U.S. trade with Mexico that went to maquiladoras.
Sources: Derived from data in the International Monetary Fund's 1992 Direction of Trade Statistics Yearbook and from Banco de Mexico data.
Page 23 GAO/GGD-93-129 U.S.-Mexico Trade
Appendix II U.S. Trade With Mexico, Including Mexico’s Maquiladora Industry
Table 11.7: Proportion of 1985-90 U.S. Merchandise Exports to Mexico That Went to the Maquiladora Industry (Derived From
U.S. Government Trade Data)
U.S. dollars in millions
Year Exports to
Mexico Change from
prior year® U.S. exports to maquiladoras6
Change from prior year
Percent of U.S. exports to Mexico that went to
maquiladoras
1985 $13,084 • $2,956 • 22.6
1986 11,925 ($1,159) 3,401 $445 28.5
1987 14,045 2,120 4,493 1,093 32.0
1988 19,853 5,808 5,404 910 27.2
1989 24,117 4,264 6,111 708 25.3
1990 27,468 3,350 6,526 414 23.8
Note 1: U.S. exports consist of domestic exports valued on an f.a.s. basis; imports are imports for consumption on a Customs value basis.
Note 2: Data before 1989 are estimated because they originally were recorded under the Tariff Schedule of the United States of America and had to be converted to the HTS.
aParentheses indicate a negative number.
bWe estimated U.S. exports to maquiladoras using data on U.S. imports from Mexico under production-sharing provisions 9802.00.60 and 9802.00.80. Under these provisions, certain products assembled in foreign countries from U.S.-made components are only subject to duties on the value added in the foreign country. Imports from Mexico under these arrangements can be used to estimate U.S. imports from maquiladora firms because there are indications that a large proportion of these imports are from maquiladoras. Further, because most U.S. exports to maquiladora companies are then returned from the maquiladoras as exports to the United States, the portion of the production-sharing imports from Mexico that does not have duties—that is, that which originated in the United States—can be used to estimate U.S. exports to the maquiladoras.
Sources: Derived by GAO from U.S. Bureau of the Census and U.S. International Trade Commission data.
Page 24 GAO/GGD-93-129 U.S.-Mexico Trade
Appendix II U.S. Trade With Mexico, Including Mexico’s Maquiladora Industry
Table 11.8: Proportion of 1985-90 U.S. Exports to Mexico That Went to the Maquiladora Industry, in Inflation-Adjusted Dollars (Derived From U.S. Government Trade Data)
1992 U.S. dollars in millions
Percent of U.S. exports to
Year Exports to
Mexico Change from
prior year® U.S. exports to maquiladoras6
Change from prior year
Mexico that went to maquiladoras
1985 $16,752 • $3,786 • 22.6
1986 14,878 ($1,879) 4,243 $458 28.5
1987 16,981 2,102 5,433 1,189 32.0
1988 23,102 6,121 6,288 855 27.2
1989 26,874 3,772 6,810 522 25.3
1990 29,336 2,462 6,970 160 23.8
Note 1: Trade data are adjusted tor inflation using the implicit gross domestic product price deflator as published in the January 1993 Economic Report of the President.
Note 2: U.S. exports consist of domestic exports valued on an f.a.s. basis; imports are imports for consumption on a Customs value basis.
Note 3: Data before 1989 are estimated because they originally were recorded under the Tariff Schedule of the United States of America and had to be converted to the FITS.
aParentheses indicate a negative number.
bWe estimated U.S. exports to maquiladoras using data on U.S. imports from Mexico under production-sharing provisions 9802.00.60 and 9802.00.80. Under these provisions, certain products assembled in foreign countries from U.S.-made components are only subject to duties on the value added in the foreign country. Imports from Mexico under these arrangements can be used to estimate U.S. imports from maquiladora firms because there are indications that a large proportion of these imports are from maquiladoras. Further, because most U.S. exports to maquiladora companies are then returned from the maquiladoras as exports to the United States, the portion of the production-sharing imports from Mexico that does not have duties—that is, that which originated in the United States—can be used to estimate U.S. exports to the maquiladoras.
Sources: Derived by GAO from U.S. Bureau of the Census and U.S. International Trade Commission data.
Page 25 GAO/GGD-93-129 U.S.-Mexico Trade
Appendix II U.S. Trade With Mexico, Including Mexico’s Maquiladora Industry
Table 11.9: Proportion of the Top 10 U.S. Manufactured Exports to Mexico U.S. dollars in millions
That Went to the Maquiladora Industry, 1989-92
Year Exports to Mexico of
the 10 products Exports to
maquiladoras*
Percent of exports of the 10 products that
went to maquiladoras
1989 $5,252 $1,860 35.4
1990 6,369 1,907 29.9
1991 7,535 2,106 27.9
1992 9,281 2,610 28.1
Note 1: The 10 commodities are the top 10 manufactured commodities that the United States exported to Mexico in 1992. They are parts and accessories for motor vehicles; insulated wire, cable, and optical sheath fiber cables; parts for television, radio, and radar apparatus; aircraft, powered, and spacecraft and launch vehicles; automatic data processing machines and magnetic readers; parts for internal combustion piston engines; seats (except barber, dental, etc.) and parts thereof; electric transformers, static converters and inductors, and parts thereof; parts for typewriters and other office machines; and articles of plastics (including polymers and resins).
Note 2: U.S. merchandise exports are domestic exports valued on an f.a.s. basis. U.S. merchandise imports are imports for consumption on a Customs value basis
aWe estimated U.S. exports to maquiladoras using data on U.S. imports from Mexico under production-sharing provisions 9802.00.60 and 9802.00.80. Under these provisions, certain products assembled in foreign countries from U.S.-made components are only subject to duties on the value added in the foreign country. Imports from Mexico under these arrangements can be used to estimate U.S. imports from maquiladora firms because there are indications that a large proportion of these imports are from maquiladoras. Further, because most U.S. exports to maquiladora companies are then returned from the maquiladoras as exports to the United States, the portion of the production-sharing imports from Mexico that does not have duties—that is, that which originated in the United States—can be used to estimate U.S. exports to the maquiladoras.
Sources: Derived by GAO from U.S. Bureau of the Census and U.S. International Trade Commission data.
Page 26 GAO/GGD-93-129 U.S.-Mexico Trade
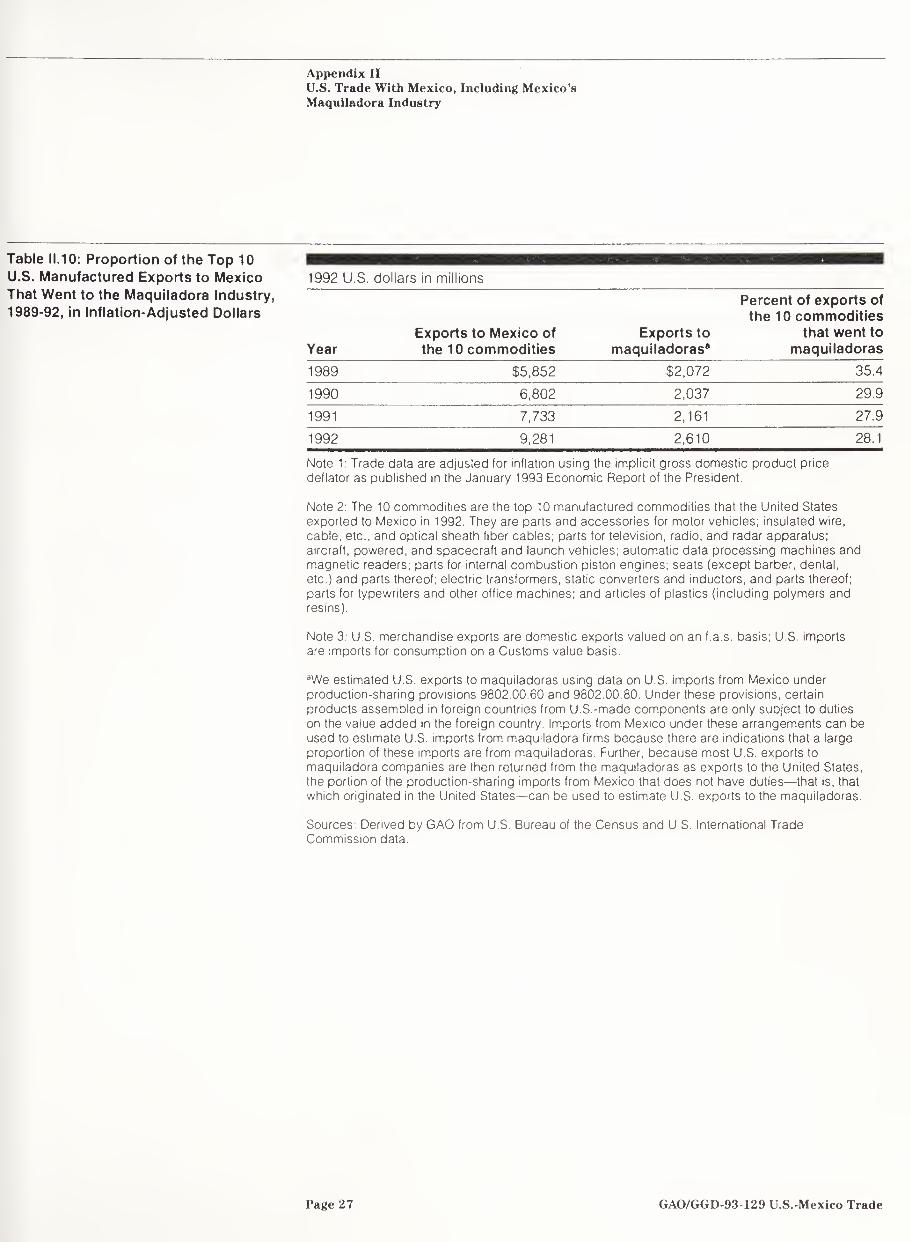
Appendix II U.S. Trade With Mexico, Including Mexico’s Maquiladora Industry
Table 11.10: Proportion of the Top 10 U.S. Manufactured Exports to Mexico 1992 U.S. dollars in millions
That Went to the Maquiladora Industry, 1989-92, in Inflation-Adjusted Dollars
Exports to Mexico of Exports to
Percent of exports of the 10 commodities
that went to Year the 10 commodities maquiladoras® maquiladoras
1989 $5,852 $2,072 35.4
1990 6,802 2,037 29.9
1991 7,733 2,161 27.9
1992 9,281 2,610 28.1
Note 1: Trade data are adjusted for inflation using the implicit gross domestic product price deflator as published in the January 1993 Economic Report of the President.
Note 2: The 10 commodities are the top 10 manufactured commodities that the United States exported to Mexico in 1992. They are parts and accessories for motor vehicles; insulated wire, cable, etc., and optical sheath fiber cables; parts for television, radio, and radar apparatus; aircraft, powered, and spacecraft and launch vehicles; automatic data processing machines and magnetic readers; parts for internal combustion piston engines; seats (except barber, dental, etc.) and parts thereof; electric transformers, static converters and inductors, and parts thereof; parts for typewriters and other office machines; and articles of plastics (including polymers and resins).
Note 3: U.S. merchandise exports are domestic exports valued on an f.a.s. basis; U.S. imports are imports for consumption on a Customs value basis.
aWe estimated U.S. exports to maquiladoras using data on U.S. imports from Mexico under production-sharing provisions 9802.00.60 and 9802.00.80. Under these provisions, certain products assembled in foreign countries from U.S.-made components are only subject to duties on the value added in the foreign country. Imports from Mexico under these arrangements can be used to estimate U.S. imports from maquiladora firms because there are indications that a large proportion of these imports are from maquiladoras. Further, because most U.S. exports to maquiladora companies are then returned from the maquiladoras as exports to the United States, the portion of the production-sharing imports from Mexico that does not have duties—that is, that which originated in the United States—can be used to estimate U.S. exports to the maquiladoras.
Sources: Derived by GAO from U.S. Bureau of the Census and U S. International Trade Commission data.
Page 27 GAO/GGD-93-129 U.S.-Mexieo Trade
Appendix II
U.S. Trade With Mexico, Including Mexico’s Maquiladora Industry
Table 11.11: Proportion of U.S. Exports to Mexico of Motor Vehicle Parts and U.S. dollars in millions Accessories That Went to the Maquiladora Industry, 1989-92 Merchandise
Year exports to Mexico Merchandise exports
to maquiladoras*
Percent of exports to Mexico that went to
maquiladoras
1989 $1,921 $501 26.1
1990 2,825 559 19.8
1991 3,156 675 21.4
1992 3,833 960 25.0
Note 1: Motor vehicle parts and accessories are defined as HTS 8708
Note 2: U.S. merchandise exports are domestic exports valued on an f.a.s. basis. U.S. production-sharing imports are imports for consumption on a Customs value basis.
aWe estimated U.S. exports to maquiladoras using data on U.S. imports from Mexico under production-sharing provisions 9802.00.60 and 9802.00.80. Under these provisions, certain products assembled in foreign countries from U.S.-made components are only subject to duties on the value added in the foreign country. Imports from Mexico under these arrangements can be used to estimate U.S, imports from maquiladora firms because there are indications that a large proportion of these imports are from maquiladoras. Further, because most U.S. exports to maquiladora companies are then returned from the maquiladoras as exports to the United States, the portion of the production-sharing imports from Mexico that does not have duties—that is, that which originated in the United States—can be used to estimate U.S. exports to the maquiladoras.
Sources: Derived by GAO from U.S. Bureau of the Census and U.S. International Trade Commission.
Page 28 GAO/GGD-93-129 U.S.-Mexico Trade
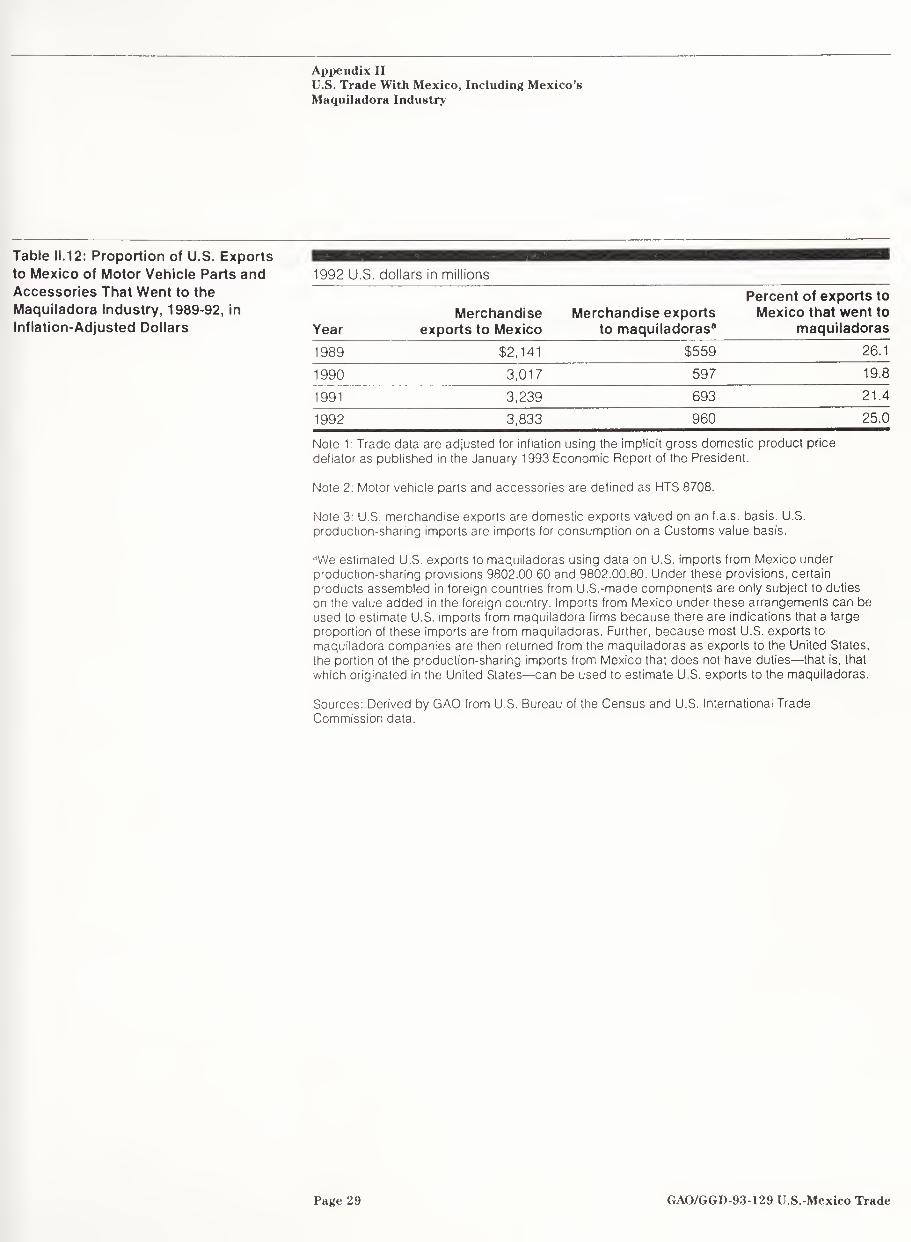
Appendix II U.S. Trade With Mexico, Including Mexico’s Maquiladora Industry
Table 11.12: Proportion of U.S. Exports to Mexico of Motor Vehicle Parts and 1992 U.S. dollars in millions
Accessories That Went to the Maquiladora Industry, 1989-92, in Inflation-Adjusted Dollars
Merchandise Year exports to Mexico
Merchandise exports to maquiladoras8
Percent of exports to Mexico that went to
maquiladoras
1989 $2,141 $559 26.1
1990 3,017 597 19.8
1991 3,239 693 21.4
1992 3,833 960 25.0
Note 1: Trade data are adjusted for inflation using the implicit gross domestic product price deflator as published in the January 1993 Economic Report of the President.
Note 2: Motor vehicle parts and accessories are defined as HTS 8708.
Note 3: U.S. merchandise exports are domestic exports valued on an f.a.s. basis. U.S. production-sharing imports are imports for consumption on a Customs value basis.
aWe estimated U.S. exports to maquiladoras using data on U.S. imports from Mexico under production-sharing provisions 9802.00.60 and 9802.00.80. Under these provisions, certain products assembled in foreign countries from U.S.-made components are only subject to duties on the value added in the foreign country. Imports from Mexico under these arrangements can be used to estimate U.S. imports from maquiladora firms because there are indications that a large proportion of these imports are from maquiladoras. Further, because most U.S. exports to maquiladora companies are then returned from the maquiladoras as exports to the United States, the portion of the production-sharing imports from Mexico that does not have duties—that is, that which originated in the United States—can be used to estimate U.S. exports to the maquiladoras.
Sources: Derived by GAO from U.S. Bureau of the Census and U.S. International Trade Commission data.
Page 29 GAO/GGD-93-129 U.S.-Mexieo Trade
Appendix II
U.S. Trade With Mexico, Including Mexico’s Maquiladora Industry
Table 11.13: Value of 1989-1992 U.S. Exports to Maquiladoras in Each of the Top 10 U.S. Manufactured Exports to Mexico
U.S. dollars in millions
Commodity Exports to
maquiladoras 1989 Exports to
maquiladoras 1992
Parts and accessories for motor vehicles $501 $960
Insulated wire, cable etc.; optical sheath fiber cables3
795 996
Parts for television, radio and radar apparatus
105 109
Aircraft, powered; spacecraft and launch vehicles
0 0
Automatic data processing machines; magnetic readers, etc.
110 92
Parts for internal combustion piston engines3
33 43
Seats (except barber, dental, etc.), and parts thereof3
64 41
Electric transformers, static converters and inductors, and parts thereof
165 220
Parts, etc., for typewriters and other office machines
63 109
Articles of plastics (including polymers, resins)
23 39
Totals $1,860 $2,610
Note 1: Merchandise exports consist of domestic exports valued on an f.a.s. basis. Merchandise imports consist of imports for consumption valued on a Customs value basis.
Note 2: We estimated U.S. exports to maquiladoras using data on U.S. imports from Mexico under production-sharing provisions 9802.00.60 and 9802.00.80. Under these provisions, certain products assembled in foreign countries from U.S.-made components are only subject to duties on the value added in the foreign country. Imports from Mexico under these arrangements can be used to estimate U.S. imports from maquiladora firms because there are indications that a large proportion of these imports are from maquiladoras. Further, because most U.S. exports to maquiladora companies are then returned from the maquiladoras as exports to the United States, the portion of the production-sharing imports from Mexico that does not have duties—that is, that which originated in the United States—can be used to estimate U.S. exports to the maquiladoras.
Note 3: The data in this table should be interpreted cautiously because these data do not provide a complete picture of trade patterns in individual product categories. In some cases a commodity exported to a maquiladora under one tariff classification may, after being assembled, return to the United States under a different tariff classification.
Note 4: Totals may not add due to rounding.
aA large share of U.S. exports of these items to Mexico, while not identified as motor vehicle parts and accessories at the 4-digit HTS level, is used as motor vehicle parts and accessories.
Source: Derived by GAO from U.S. International Trade Commission data.
5 Vi g
Page 30 GAO/GGD-93-129 U.S.-Mexico Trade
Appendix II
U.S. Trade With Mexico, Including Mexico’s Maquiladora Industry
Table 11.14: Value of 1989-1992 U.S. Exports to Maquiladoras in Each of the 1992 U.S. dollars in millions
Top 10 U.S. Manufactured Exports to Mexico, in Inflation-Adjusted Dollars Commodity
Exports to maquiladoras 1989
Exports to maquiladoras 1992
Parts and accessories for motor vehicles $559 $960
Insulated wire, cable etc.; optical sheath fiber cables3
886 996
Parts for television, radio and radar apparatus
117 109
Aircraft, powered; spacecraft and launch vehicles
0 0
Automatic data processing machines; magnetic readers, etc.
122 92
Parts for internal combustion piston engines3
37 43
Seats (except barber, dental, etc.), and parts thereof3
72 41
Electric transformers, static converters and inductors, and parts thereof
184 220
Parts, etc., for typewriters and other office machines
70 109
Articles of plastics (including polymers, resins)
26 39
Totals $2,072 $2,610
Note 1: Trade data are adjusted for inflation using the implicit gross domestic product price deflator as published in the January 1993 Economic Report of the President.
Note 2; Merchandise exports consist of domestic exports valued on an f.a.s. basis. Merchandise imports consist of imports for consumption valued on a Customs value basis.
Note 3: We estimated U.S. exports to maquiladoras using data on U.S. imports from Mexico under production-sharing provisions 9802.00.60 and 9802.00.80. Under these provisions, certain products assembled in foreign countries from U.S.-made components are only subject to duties on the value added in the foreign country. Imports from Mexico under these arrangements can be used to estimate U.S. imports from maquiladora firms because there are indications that a large proportion of these imports are from maquiladoras. Further, because most U.S. exports to maquiladora companies are then returned from the maquiladoras as exports to the United States, the portion of the production-sharing imports from Mexico that does not have duties—that is, that which originated in the United States—can be used to estimate U.S. exports to the maquiladoras.
Note 4: The data in this table should be interpreted cautiously because these data do not provide a complete picture of trade patterns in individual product categories. In some cases a commodity exported to a maquiladora under one tariff classification may, after being assembled, return to the United States under a different tariff classification.
Note 4: Totals may not add due to rounding.
aA large share of U.S. exports of these items to Mexico, while not identified as motor vehicle parts and accessories at the 4-digit HTS level, is used as motor vehicle parts and accessories.
Source: Derived by GAO from U.S. Bureau of the Census and U.S. International Trade Commission data.
Page 31 GAO/GGD-93-129 U.S.-Mexico Trade
GPO \Z~lb~9J Appendix II U.S. Trade With Mexico, Including Mexico’s Maquiladora Industry
(280043) Page 32 GAO/GGD-93-129 U.S.-Mexico Trad.
Ordering Information
The first copy of each GAO report and testimony is free. Additional copies are $2 each. Orders should be sent to the following address, accompanied by a check or money order made out to the Superintendent of Documents, when necessary. Orders for 100 or more copies to be mailed to a single address are discounted 25 percent.
Orders by mail:
U.S. General Accounting Office P.O. Box 6015 Gaithersburg, MD 20884-6015
or visit:
Room 1000 700 4th St. NW (corner of 4th and G Sts. NW) U.S. General Accounting Office Washington, DC
Orders may also be placed by calling (202) 512-6000 or by using fax number (301) 258-4066.
PRINTED ON RECYCLED PAPER
United States General Accounting Office Washington, D.C. 20548
First-Class Mail Postage & Fees Paid
GAO Permit No. G100 Official Business
Penalty for Private Use $300


FEB 16 1993
WERT BOOKBINDING
Grantville, Pa. (AN.- FEB 1994 We're Quality Bound