Embed Size (px)
Citation preview
1
US Protectionist Impulses in the Wake
of the Great Recession
Report to the International Chamber of Commerce Research Foundation
Gary Clyde Hufbauer, Jacob Funk Kirkegaard, Woan Foong Wong, and
Jared Woollacott Peterson Institute for International Economics
Washington, DC
March 2010
© Peterson Institute for International Economics. All rights reserved.
2
TABLE OF CONTENTS: PAGE
EXECUTIVE SUMMARY 3
SECTION I: INTRODUCTION: THE BIG PICTURE 5
SECTION II: A BRIEF HISTORY OF ECONOMIC NATIONALISM IN THE UNITED STATES 11
SECTION III: RECENT U.S. TRADE DISPUTES 14
SECTION IV: JOBS, JOBS, JOBS 28
SECTION V: FOREIGN EMULATION OR RETALIATION 40
SECTION VI: PRESIDENT OBAMA SHIFTS HIS TRADE POLICY STANCE 49
SECTION VII: POLICY RECOMMENDATIONS 56
APPENDICES 61
REFERENCES 65
3
EXECUTIVE SUMMARY
This report describes the history and current political and economic context for U.S.
protectionism in the aftermath of the Great Recession. Section I describes how, despite the
politics of a labor market crisis, protectionist impulses in the U.S. Congress have been
constrained—in part by a rapidly improving U.S. external trade balance on the back of strong
export performance. However, the section concludes that, with economic recovery unfolding
more rapidly in America than in Europe or Japan, the U.S. external balance will likely
deteriorate well before noteworthy improvement in the jobs picture. The risk of renewed
protectionism may correspondingly escalate.
Section II provides a brief history of U.S. economic nationalism going back to the early Republic.
Section III summarizes in some detail the recent instances of U.S. trade protection, with a focus
on implemented trade distortive measures, such as “Buy American” and “Chinese tires,” before
listing potential (but not yet implemented) trade distortive measures.
Section IV gives an overview of the employment effects of the 2009 American Reconstruction
and Recovery Act (ARRA) and updates earlier work by Hufbauer and Schott on the employment
effects of the Buy American provision. The section concludes that the biggest job creating force
between 2008 and 2009 was automatic contraction of the trade deficit, saving perhaps 2.7
million manufacturing jobs, compared to the 1.5‐2 million jobs saved or created by the stimulus
package (the American Recovery and Reinvestment Act, ARRA), of which around 200,000 may
have been in the manufacturing sector. As a generous estimate, the Buy American amendment
may have saved or created around 43,000 manufacturing jobs. This figure constitutes less than
3 percent of the total jobs saved or created by the ARRA. The U.S. steel industry gained at most
about 13,000 jobs from the Buy American amendment. The political influence of the industry
far exceeds its employment count.
4
Section V provides case study examples of foreign emulation and retaliation against the Buy
American provision, and illustrates the real damage from this blowback on American firms,
workers, Federal agencies, and municipalities. Some of the most important U.S. trade
partners—Canada, Japan, and China—have demonstrated the potential adverse effects on the
U.S. economy from protectionist measures.
Section VI describes the recent shift in the trade policy stance of the Obama Administration
with a “National Export Initiative” and a presidential promise to double U.S. exports within five
years. The section concludes that this welcome change is inspired by the Obama
Administration’s desire to generate U.S. jobs through an “export‐led job creation strategy.”
Bradford, Grieco, and Hufbauer (2005) show that postwar globalization has contributed around
$1 trillion to the U.S. economy annually, while Adler and Hufbauer (2009) estimate that a
quarter of total U.S. trade growth between 1980 and 2004 can be attributed to lower tariff and
non‐tariff barriers in the United States and abroad. Based on this experience it seems clear that
trade liberalization will play a crucial role in cementing the success of President Obama’s
strategy. Only far reaching new trade initiatives, significantly beyond what has been announced
so far, can hope to reach the goal of doubling exports in five years.
Section VII presents our top policy recommendations for how the Obama Administration should
implement a successful U.S. international trade agenda and how the G‐20 should build on its
earlier success at crisis management and adopt a long‐term strategy to safe‐guard the global
trading system against renewed protectionism among its leading members. High on our priority
list is the recommendation that the United States should lead the way to a successful
conclusion of the Doha Development Round. With an ambitious outcome, the Round could
deliver GDP gains for the world of over $280 billion annually (Hufbauer, Schott, and Wong,
2010).
5
I INTRODUCTION: THE BIG PICTURE
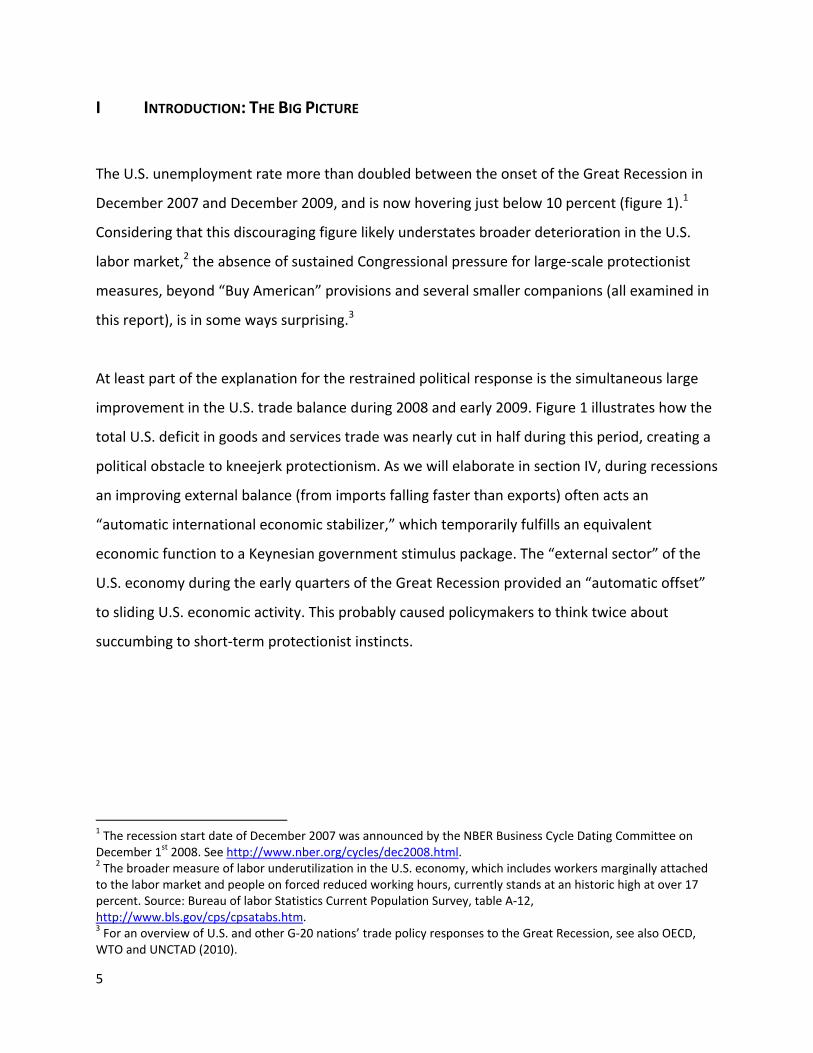
The U.S. unemployment rate more than doubled between the onset of the Great Recession in
December 2007 and December 2009, and is now hovering just below 10 percent (figure 1).1
Considering that this discouraging figure likely understates broader deterioration in the U.S.
labor market,2 the absence of sustained Congressional pressure for large‐scale protectionist
measures, beyond “Buy American” provisions and several smaller companions (all examined in
this report), is in some ways surprising.3
At least part of the explanation for the restrained political response is the simultaneous large
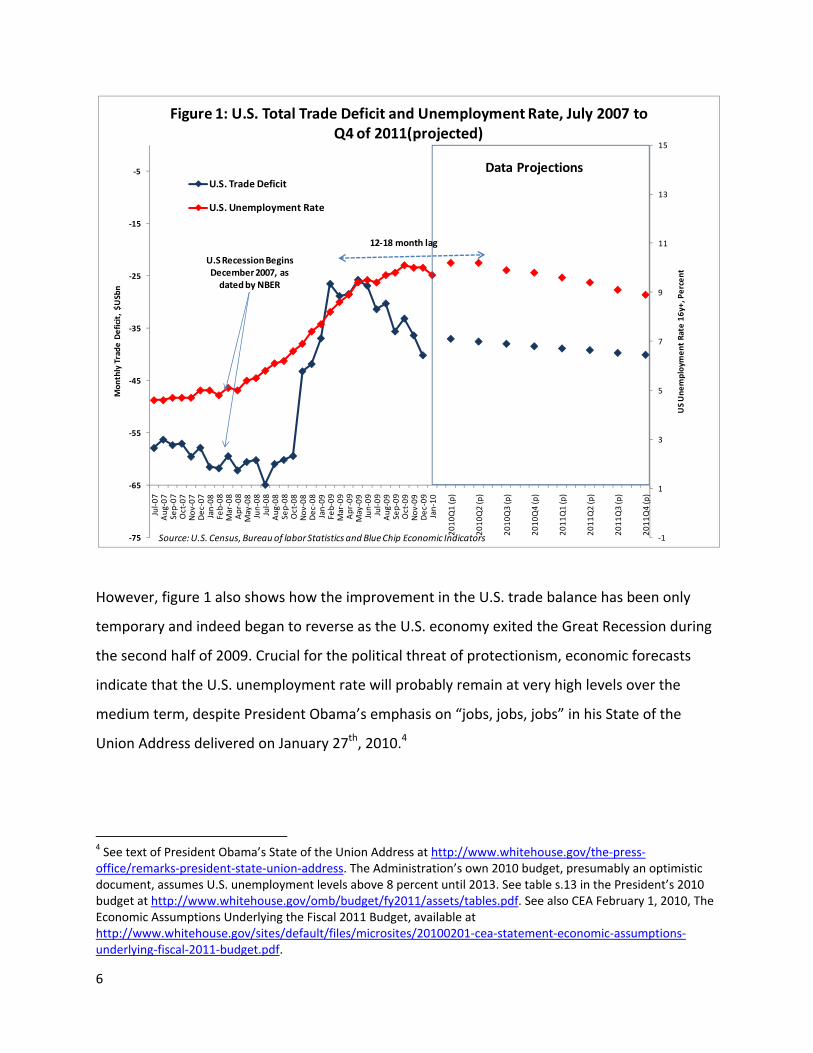
improvement in the U.S. trade balance during 2008 and early 2009. Figure 1 illustrates how the
total U.S. deficit in goods and services trade was nearly cut in half during this period, creating a
political obstacle to kneejerk protectionism. As we will elaborate in section IV, during recessions
an improving external balance (from imports falling faster than exports) often acts an
“automatic international economic stabilizer,” which temporarily fulfills an equivalent
economic function to a Keynesian government stimulus package. The “external sector” of the
U.S. economy during the early quarters of the Great Recession provided an “automatic offset”
to sliding U.S. economic activity. This probably caused policymakers to think twice about
succumbing to short‐term protectionist instincts.
1 The recession start date of December 2007 was announced by the NBER Business Cycle Dating Committee on December 1st 2008. See http://www.nber.org/cycles/dec2008.html. 2 The broader measure of labor underutilization in the U.S. economy, which includes workers marginally attached to the labor market and people on forced reduced working hours, currently stands at an historic high at over 17 percent. Source: Bureau of labor Statistics Current Population Survey, table A‐12, http://www.bls.gov/cps/cpsatabs.htm. 3 For an overview of U.S. and other G‐20 nations’ trade policy responses to the Great Recession, see also OECD, WTO and UNCTAD (2010).
6
However, figure 1 also shows how the improvement in the U.S. trade balance has been only
temporary and indeed began to reverse as the U.S. economy exited the Great Recession during
the second half of 2009. Crucial for the political threat of protectionism, economic forecasts
indicate that the U.S. unemployment rate will probably remain at very high levels over the
medium term, despite President Obama’s emphasis on “jobs, jobs, jobs” in his State of the
Union Address delivered on January 27th, 2010.4
4 See text of President Obama’s State of the Union Address at http://www.whitehouse.gov/the‐press‐office/remarks‐president‐state‐union‐address. The Administration’s own 2010 budget, presumably an optimistic document, assumes U.S. unemployment levels above 8 percent until 2013. See table s.13 in the President’s 2010 budget at http://www.whitehouse.gov/omb/budget/fy2011/assets/tables.pdf. See also CEA February 1, 2010, The Economic Assumptions Underlying the Fiscal 2011 Budget, available at http://www.whitehouse.gov/sites/default/files/microsites/20100201‐cea‐statement‐economic‐assumptions‐underlying‐fiscal‐2011‐budget.pdf.
‐1
1
3
5
7
9
11
13
15
‐75
‐65
‐55
‐45
‐35
‐25
‐15
‐5
Jul‐0
7Aug
‐07
Sep‐07
Oct‐07
Nov
‐07
Dec
‐07
Jan‐08
Feb‐08
Mar‐08
Apr‐08
May‐08
Jun‐08
Jul‐0
8Aug
‐08
Sep‐08
Oct‐08
Nov
‐08
Dec
‐08
Jan‐09
Feb‐09
Mar‐09
Apr‐09
May‐09
Jun‐09
Jul‐0
9Aug
‐09
Sep‐09
Oct‐09
Nov
‐09
Dec
‐09
Jan‐10
2010
Q1 (p)
2010
Q2 (p)
2010
Q3 (p)
2010
Q4 (p)
2011
Q1 (p)
2011
Q2 (p)
2011
Q3 (p)
2011
Q4 (p)
US Une
mploymen
t Rate 16y+, Percent
Mon
thly Trade
Deficit, $U
Sbn
Figure 1: U.S. Total Trade Deficit and Unemployment Rate, July 2007 to Q4 of 2011(projected)
U.S. Trade Deficit
U.S. Unemployment Rate
U.S Recession BeginsDecember 2007, as dated by NBER
Source: U.S. Census, Bureau of labor Statistics and Blue Chip Economic Indicators
12‐18 month lag
Data Projections
7
A time lag of at least 12 to 18 months probably separates the point at which the U.S. trade
balance showed maximum improvement (spring 2009) and the expected drop in measured
unemployment well below 10 percent (fall 2010). Absent the “feel good” factor of an improving
trade balance, but facing continuing high unemployment levels, protectionist sentiment in the
U.S. Congress may increase in the coming months, especially as the November 2010 midterm
election draws near.
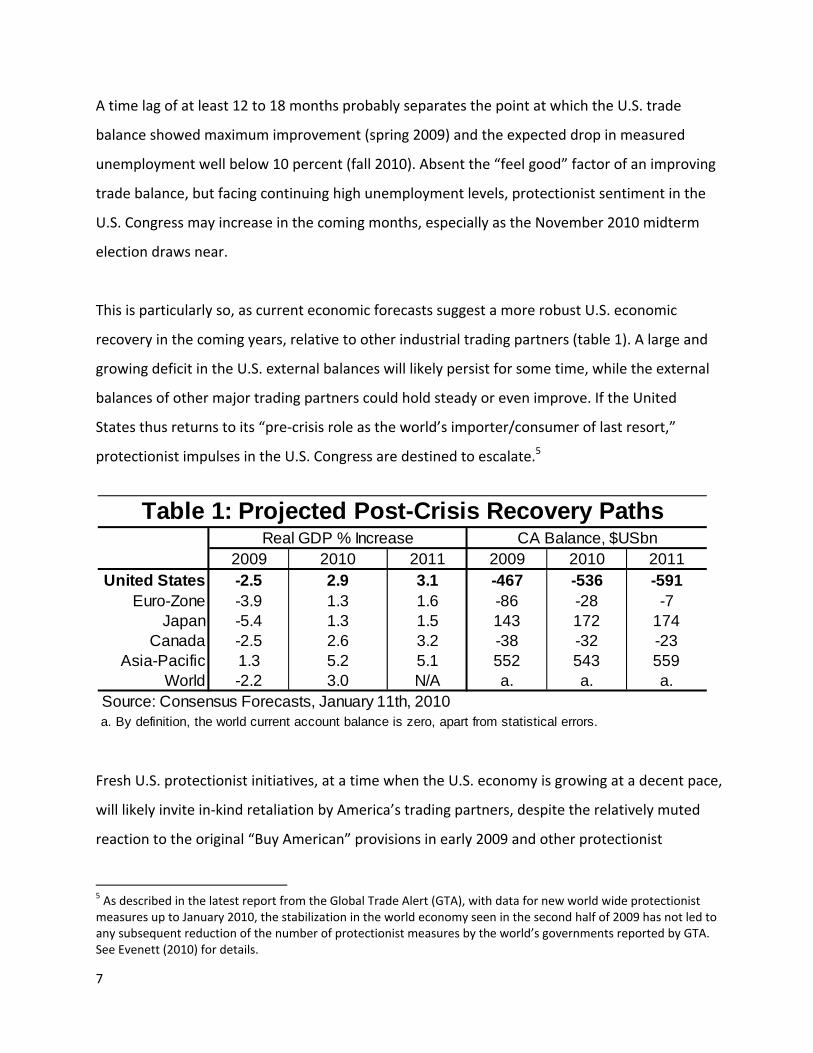
This is particularly so, as current economic forecasts suggest a more robust U.S. economic
recovery in the coming years, relative to other industrial trading partners (table 1). A large and
growing deficit in the U.S. external balances will likely persist for some time, while the external
balances of other major trading partners could hold steady or even improve. If the United
States thus returns to its “pre‐crisis role as the world’s importer/consumer of last resort,”
protectionist impulses in the U.S. Congress are destined to escalate.5
Fresh U.S. protectionist initiatives, at a time when the U.S. economy is growing at a decent pace,
will likely invite in‐kind retaliation by America’s trading partners, despite the relatively muted
reaction to the original “Buy American” provisions in early 2009 and other protectionist
5 As described in the latest report from the Global Trade Alert (GTA), with data for new world wide protectionist measures up to January 2010, the stabilization in the world economy seen in the second half of 2009 has not led to any subsequent reduction of the number of protectionist measures by the world’s governments reported by GTA. See Evenett (2010) for details.
2009 2010 2011 2009 2010 2011United States -2.5 2.9 3.1 -467 -536 -591
Euro-Zone -3.9 1.3 1.6 -86 -28 -7Japan -5.4 1.3 1.5 143 172 174
Canada -2.5 2.6 3.2 -38 -32 -23Asia-Pacific 1.3 5.2 5.1 552 543 559
World -2.2 3.0 N/A a. a. a.
a. By definition, the world current account balance is zero, apart from statistical errors.
Real GDP % Increase CA Balance, $USbnTable 1: Projected Post-Crisis Recovery Paths
Source: Consensus Forecasts, January 11th, 2010
8
measures implemented since then. No longer facing a newly‐elected U.S. president, who
entered office with considerable global appeal in the midst of an unprecedented economic
crisis, foreign leaders are unlikely to give the U.S. an easy pass on future new instances of U.S.
protectionism.
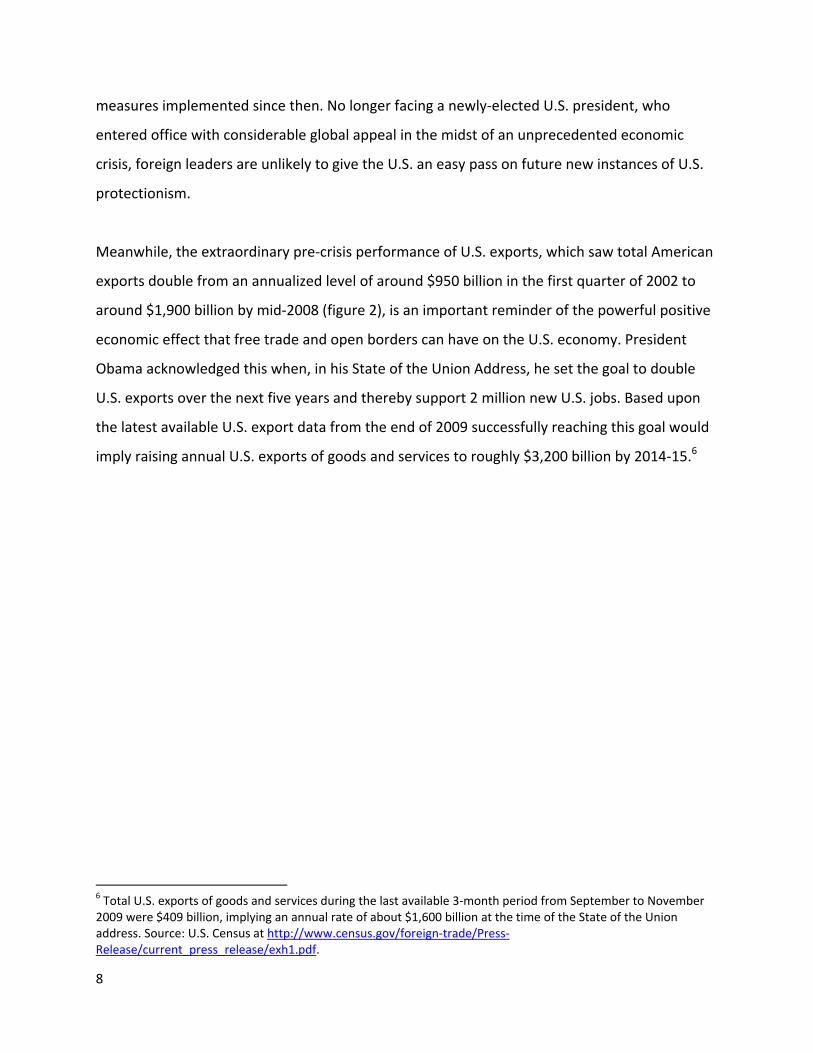
Meanwhile, the extraordinary pre‐crisis performance of U.S. exports, which saw total American
exports double from an annualized level of around $950 billion in the first quarter of 2002 to
around $1,900 billion by mid‐2008 (figure 2), is an important reminder of the powerful positive
economic effect that free trade and open borders can have on the U.S. economy. President
Obama acknowledged this when, in his State of the Union Address, he set the goal to double
U.S. exports over the next five years and thereby support 2 million new U.S. jobs. Based upon
the latest available U.S. export data from the end of 2009 successfully reaching this goal would
imply raising annual U.S. exports of goods and services to roughly $3,200 billion by 2014‐15.6
6 Total U.S. exports of goods and services during the last available 3‐month period from September to November 2009 were $409 billion, implying an annual rate of about $1,600 billion at the time of the State of the Union address. Source: U.S. Census at http://www.census.gov/foreign‐trade/Press‐Release/current_press_release/exh1.pdf.
9
Figure 2 shows that the rapid expansion of U.S. goods and services exports between 2002 and
2008 occurred during a period when the value of the U.S. dollar declined by about 25 percent in
real trade‐weighted terms, and ultimately reached a level significantly below its long‐term
index average of 97.3. The dollar did increase sharply amidst the upheavals of the global
financial crisis in late 2008, but today it has again declined to a level substantially below its
long‐term average trade‐weighted value. Hence it seems unlikely that sizable additional
support for U.S. exports will be found from a further sharp decline in the real exchange rate
going forward.7
7 Even allowing for the long two‐year or three‐year time lags before the exchange rate effects from the dollar’s decline fully pass through to export performance, almost all positive effects on U.S. exports from the 2002‐2008 decline in the trade‐weighted value of the dollar have already occurred.
10
Our conclusion is that new U.S. trade promotion policies—such as the National Export Initiative
announced by President Obama in his State of the Union Address—will surely be required to
sustain the rebound in American exports, which began in the second quarter of 2009. In
present circumstances, further U.S. protectionist measures would be particularly harmful, since
the United States cannot effectively promote its exports abroad while erecting new barriers to
imports at home.
11
II A BRIEF HISTORY OF ECONOMIC NATIONALISM IN THE UNITED STATES
Recent acts passed and contemplated by the U.S. Congress contain provisions that violate the
spirit and even the letter of WTO rules and other trade agreements. Indeed, some of the
legislation is now under review by the WTO Dispute Settlement Body in Geneva. However,
protectionist sentiments have been a recurring feature of U.S. history. This section provides a
short history of U.S. economic nationalism more broadly and U.S. domestic procurement
legislation in particular.
Early U.S. History
Economic nationalism is older than the republic. As early as the 1760s and 1770s, non‐
importation agreements gained wide acceptance in the colonies, culminating in the Continental
Association of 1774, which prohibited merchants from purchasing British goods and solidified
support for the revolution.8 The economic dimension of early American nationalism enabled
protectionism to become embedded in early U.S. trade policy, particularly as tariffs were an
essential source of federal revenue throughout the 19th century.
Rising tariffs in the early 1800s were largely a response to fiscal demands. However, the
“American System,” propounded by James Madison and Henry Clay with the Tariff of 1816,
initiated a spirited debate over the use of tariff policy for the explicit protection of domestic
industry, and drew a political line between northern industrialists and southern agriculturalists.
The debate reached a climax in 1833 when, following the threat of secession by South Carolina,
a compromise was reached that reduced tariffs back to their 1816 levels (approximately twenty
percent ad valorem) over the following ten years.9
8 Text of the original Boston non‐importation agreement of 1768 is available online at: http://avalon.law.yale.edu/18th_century/boston_non_importation_1768.asp, accessed January 30, 2010. 9 “Westward Expansion and Regional Differences.” America.gov . April 5th, 2008. http://www.america.gov/st/educ‐english/2008/April/20080407113634eaifas0.4282495.html, accessed January 30, 2010.
12
As the Civil War approached, tariffs were sharply escalated in 1860 with the Morrill Tariff and
were further raised by President Lincoln to meet the fiscal demands of a vast army. While none
of the nineteenth century measures were explicitly “Buy American,” they relied on themes of
loyalty akin to later domestic procurement legislation.
Economic Nationalism in the 1930s
Beyond the landmark Smoot‐Hawley Tariff of 1930, the Great Depression inspired explicit “Buy
American” legislation. In 1933, amidst growing public sentiment for Buy American legislation,
Congress passed, and President Hoover signed, the original Buy America Act (BAA). The BAA
received considerable support from the American Federation of Labor and an aggressive media
campaign led by William Randolph Hearst.10 The United States was not alone in calling for
domestic preferences. Economic nationalism also gained favor in Europe and American
proponents were well aware of European nationalism.11 The BAA imposed several domestic
source requirements on federal procurement of goods. While many of these requirements are
to this day shielded in U.S. trade agreements (e.g., NAFTA and the Government Procurement
Agreement of WTO), several are not.12
Among the most severe domestic procurement requirements are those observed by the
Department of Defense (DoD) under the Defense Federal Acquisition Regulation Supplement
(DFARS), pursuant to the so‐called Berry Amendment to the BAA. Enacted during the Second
World War, the limits imposed by the Berry Amendment varied by year until it was codified in
FY2002 (10 U.S.C. 2533a). The justification offered for these restrictions is to ensure that the
American defense industrial base is not eroded. DoD procurement is also constrained by the so‐
called Balance of Payments Program, which mandates that all end product and construction
material purchases outside the United States be made from U.S. sources,13 although certain
10 Frank (1999), ch. 3. 11 Frank (1999), pp. 61‐64. 12 Hufbauer and Burki (2006). 13 Hufbauer and Burki (2006).
13
cost and availability waivers are available.14 Outside of military procurement, the BAA imposes
domestic procurement requirements on federally funded transportation projects, food
assistance programs and small‐business assistance. Several of the individual states also restrict
foreign procurement of goods, and some have placed limits on services.15
Economic Nationalism in the 1970s
Economic nationalism rose again in the 1970s, in response to economic stagnation and the
apparent migration of manufacturing jobs to foreign lands. Buy American sentiment in the
1970s was led by industrial unions facing competitive pressures from abroad, notably garment
workers (represented by the International Ladies Garment Workers Union—ILGWU) and
automobile, aerospace and agricultural workers (represented by the United Auto Workers—
UAW).16
Yet overall tariff protection had dropped dramatically by the 1970s and would continue to do so
despite the efforts of economic nationalists. At the end of the decade, concluding the Tokyo
Round of Multilateral Trade Negotiations, Congress passed the Trade Agreements Act of 1979,
which overrode certain provisions of the Buy America Act by extending national treatment to
signatories of the GATT Government Procurement Code. Domestic source requirements were
addressed again during the Uruguay Round, leading to the somewhat broader WTO
Government Procurement Agreement, which took effect in 1996.17
14 “Subpart 25.3—Balance of Payments Program” Integrated Acquisition Environment. See https://www.acquisition.gov/FAR/0219/html/Subpart_25_3.html, accessed February 5, 2010. 15 Hufbauer and Burki (2006). 16 Frank (1999), Ch. 6. 17 “The plurilateral Agreement on Government Procurement (GPA).” World Trade Organization (WTO). See http://www.wto.org/english/tratop_E/gproc_e/gp_gpa_e.htm, accessed February 5, 2010.
14
III RECENT U.S. TRADE DISPUTES
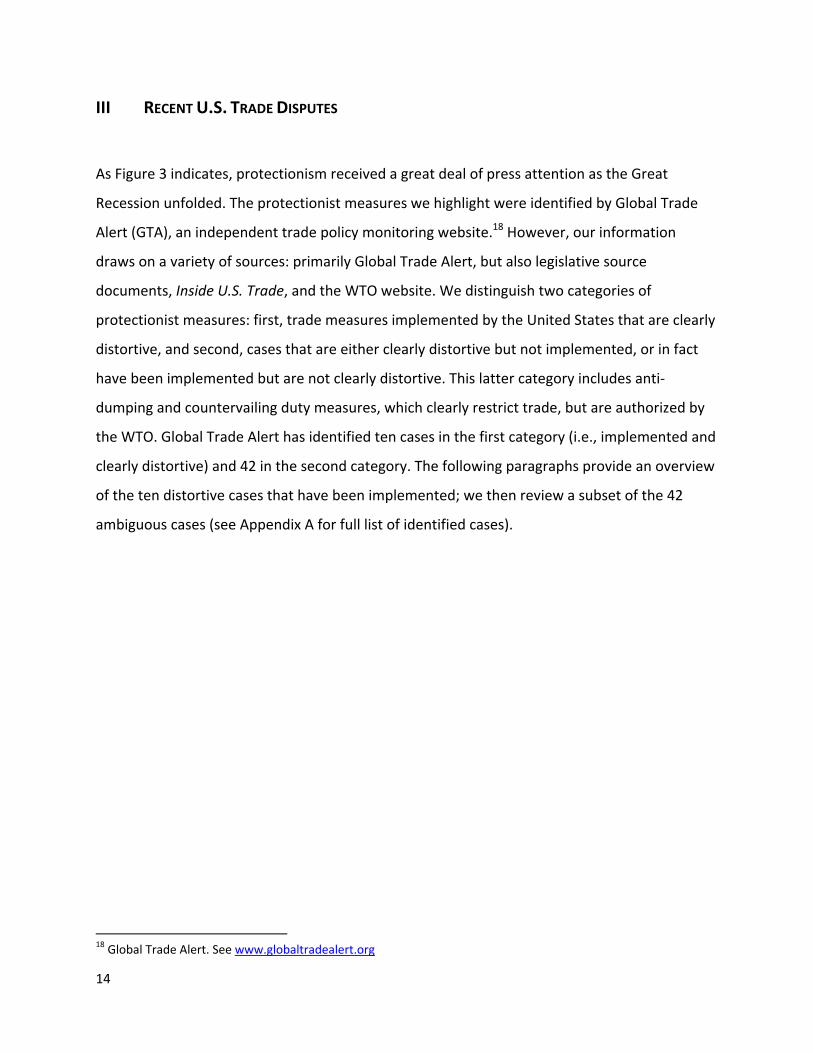
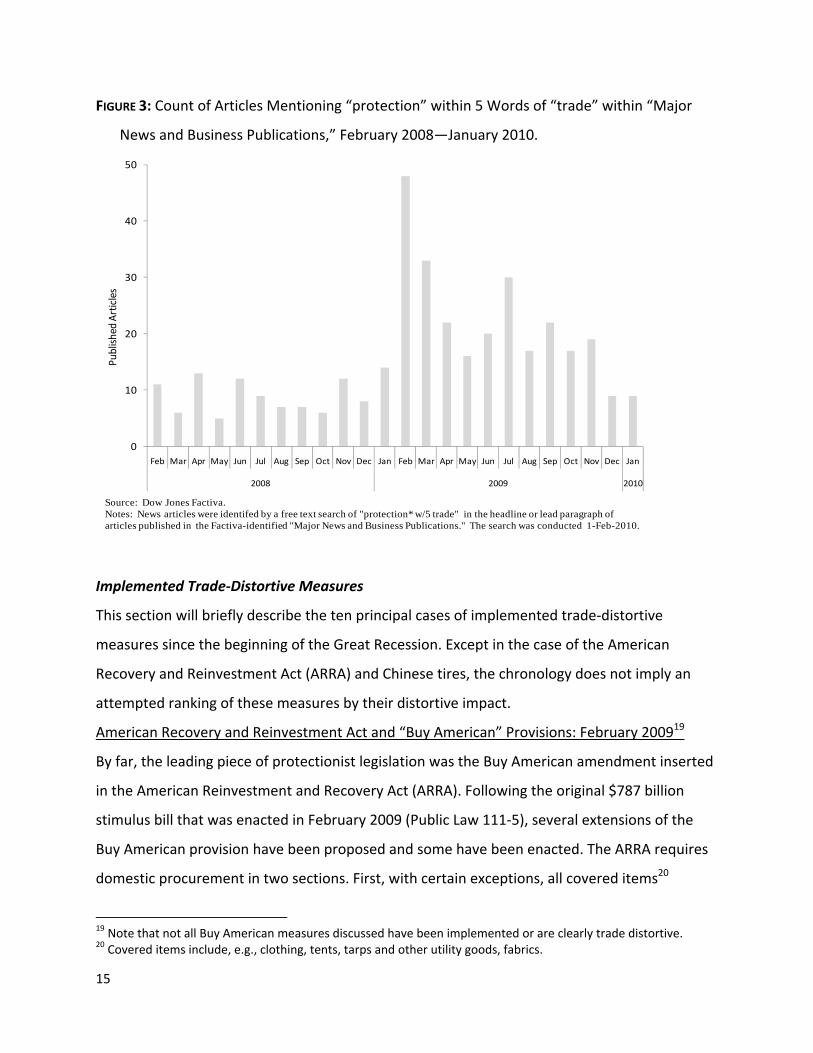
As Figure 3 indicates, protectionism received a great deal of press attention as the Great
Recession unfolded. The protectionist measures we highlight were identified by Global Trade
Alert (GTA), an independent trade policy monitoring website.18 However, our information
draws on a variety of sources: primarily Global Trade Alert, but also legislative source
documents, Inside U.S. Trade, and the WTO website. We distinguish two categories of
protectionist measures: first, trade measures implemented by the United States that are clearly
distortive, and second, cases that are either clearly distortive but not implemented, or in fact
have been implemented but are not clearly distortive. This latter category includes anti‐
dumping and countervailing duty measures, which clearly restrict trade, but are authorized by
the WTO. Global Trade Alert has identified ten cases in the first category (i.e., implemented and
clearly distortive) and 42 in the second category. The following paragraphs provide an overview
of the ten distortive cases that have been implemented; we then review a subset of the 42
ambiguous cases (see Appendix A for full list of identified cases).
18 Global Trade Alert. See www.globaltradealert.org
15
FIGURE 3: Count of Articles Mentioning “protection” within 5 Words of “trade” within “Major
News and Business Publications,” February 2008—January 2010.
Implemented Trade‐Distortive Measures
This section will briefly describe the ten principal cases of implemented trade‐distortive
measures since the beginning of the Great Recession. Except in the case of the American
Recovery and Reinvestment Act (ARRA) and Chinese tires, the chronology does not imply an
attempted ranking of these measures by their distortive impact.
American Recovery and Reinvestment Act and “Buy American” Provisions: February 200919
By far, the leading piece of protectionist legislation was the Buy American amendment inserted
in the American Reinvestment and Recovery Act (ARRA). Following the original $787 billion
stimulus bill that was enacted in February 2009 (Public Law 111‐5), several extensions of the
Buy American provision have been proposed and some have been enacted. The ARRA requires
domestic procurement in two sections. First, with certain exceptions, all covered items20
19 Note that not all Buy American measures discussed have been implemented or are clearly trade distortive. 20 Covered items include, e.g., clothing, tents, tarps and other utility goods, fabrics.
0
10
20
30
40
50
Feb Mar Apr May Jun Jul Aug Sep Oct Nov Dec Jan Feb Mar Apr May Jun Jul Aug Sep Oct Nov Dec Jan
2008 2009 2010
Publish
ed Articles
Source: Dow Jones Factiva.Notes: News articles were identifed by a free text search of "protection* w/5 trade" in the headline or lead paragraph of articles published in the Factiva-identified "Major News and Business Publications." The search was conducted 1-Feb-2010.
16
procured by the Department of Homeland Security with stimulus funds must be “grown,
reprocessed, reused, or produced in the United States.”21 Next, and much bigger, the ARRA
requires that “all of the iron, steel, and manufactured goods used in [an ARRA] project [must
be] produced in the United States.”22 One minor exception is allowed when the cost of the
overall project would be increased by more than 25 percent to meet the Buy American
provision.23 After strong objections were voiced both domestically and internationally, the Buy
American amendment was further amended to stipulate that the provisions “shall be applied in
a manner consistent with United States obligations under international agreements.”24 The
term “international agreements” most notably includes the WTO Government Procurement
Agreement (GPA) and bilateral free trade agreements (FTAs). A certain amount of compliance
guidance has been issued by federal agencies (e.g., OMB, DHS, FHA), but rather little has been
said about compliance in “a manner consistent” with international agreements.25
Since the ARRA was enacted, five additional Buy American provisions have been proposed but
not yet enacted. The proposed measures are for: public projects, Amtrak, electric cars and
batteries, defense appropriations, and school construction. H.R. 2847 was approved by the
House in December 2009, and is now with the Senate. Title IV of the bill, the “Jobs for Main
Street Act,” appropriates $27.5 billion dollars under the Buy American section (1605) of the
stimulus package (PL 111‐5), but imposes additional requirements on the procedure for waiving
21 See section 604 of Public Law 111‐5. Note that certain DHS purchases may be exempted under the Government Procurement Agreement. 22 See section 1605 of Public Law 111‐5. 23 See section 1605.b.3. Note that relating the exception for the purchase of any single good to an increase in the combined total project costs means that this exception was not intended by Congress to be utilized to any great extent. 24 See sections 604 and 1605 (d) of Public Law 111‐5. 25 “United States of America: Buy American provisions in stimulus package.” Global Trade Alert. See http://www.globaltradealert.org/measure/united‐states‐america‐buy‐american‐provisions‐stimulus‐package; “United States of America: Expanded Buy American Provisions for Public Projects.” Global Trade Alert. See http://www.globaltradealert.org/measure/united‐states‐america‐expanded‐buy‐american‐provisions‐public‐projects, accessed February 2, 2010.
17
the Buy American obligations. In particular, senior officials must analyze the impact on
domestic employment before issuing a waiver.26
The ARRA’s Buy American provision would be further expanded with The Consolidated
Appropriations Act of 2010 (Public Law 111‐117), which forbids Amtrak from issuing “contracts
[for] . . . services provided at or from any location outside the United States” (Sec. 152).27
The 21st Century Green High‐Performing Public School Facilities Act (H.R. 2187) has passed the
House and is now with the Senate. The bill would authorize $6.4 billion in funds for renovation,
subject to the same Buy American provisions set forth in the ARRA.28
The National Defense Authorization Act for Fiscal Year 2010 (H.R. 2647), passed by the House,
has several provisions that require components of military uniforms to be produced within the
United States. Exceptions can only be made by the Secretary of Defense. The corresponding
Senate bill (S.1390) does not contain these provisions. Both bills, however, expand the
definition of small arms and explicitly require that they be made in the United States. The
House bill restricts the amount of work that can be done on certain construction projects in
Guam by persons holding temporary H‐2B work visas. Both bills have passed their respective
chambers and await reconciliation.29
The American Clean Energy and Security Act (H.R. 2454), better known as the Waxman‐Markey
climate and energy bill, awaits a contentious future in the Senate. However, the central
disputes are far removed from the Buy American provisions. The bill would enable the
26 “Buy American Provisions In Jobs Bill Could Complicate Canada Talks,” Inside U.S. Trade, December 25, 2009. See also http://www.globaltradealert.org/measure/united‐states‐america‐expanded‐buy‐american‐provisions‐public‐projects, accessed February 4, 2010. 27 “United States of America: Buy American provisions for Amtrak.” Global Trade Alert. See http://www.globaltradealert.org/measure/united‐states‐america‐buy‐american‐provisions‐amtrak, accessed February 4, 2010. 28 “United States of America: Buy American provisions in school construction bill.” Global Trade Alert. See http://www.globaltradealert.org/measure/united‐states‐america‐buy‐american‐provisions‐school‐construction‐bill, accessed February 4, 2010. 29 “United States of America: Buy American provisions and set‐asides in the Fiscal Year 2010 defense appropriations bill.” Global Trade Alert. See http://www.globaltradealert.org/measure/united‐states‐america‐buy‐american‐provisions‐and‐set‐asides‐fiscal‐year‐2010‐defense‐approp, accessed February 4, 2010.
18
Secretary of Energy to “provide financial assistance to automobile manufacturers [in the United
States] to facilitate the manufacture of plug‐in electric drive vehicles” (Sec. 123). Financial
assistance is also available for manufacturers investing capital toward “qualifying advanced
technology vehicles . . . [or] components.” This includes manufacturers of new technology
batteries for such vehicles. No explicit appropriations are made for the financial assistance;
rather funding is at the discretion of the Secretary of Energy. The bill contemplates a
competitive grant process similar to the Energy Independence and Security Act of 2007 (Public
Law 110‐140).30
Chinese Tires Case: September 2009
After Buy American, the second most noticed protectionist measure was President Obama’s
decision to limit imports of automobile tires from China. Section 421 of the U.S.‐China Relations
Act of 2000 (H.R.4444) allows the imposition of safeguard measures by the president in the
event of a “market disruption.” The U.S. International Trade Commission (USITC) recommended
on three occasions in 2003 that the president impose duties on various Chinese imports under
this statute, but President Bush rejected all three cases.31
In June 2009, the USITC recommended by a vote of 4‐to‐2 that President Obama raise tariffs on
imported Chinese tires, which the majority found to cause or threaten “market disruption.”
Article 16.4 of the Chinese WTO accession protocol states that disruptions can occur when a
rapid increase in imports, relative or absolute, threaten or cause “material injury” to domestic
producers of a like or competitive product.32 President Obama responded to the USITC finding
in September 2009 by imposing a three‐year descending ad valorem tariff starting at 35 percent
and ending at 25 percent in the third year. These rates were lower than those proposed by the
30 “United States of America: Subsidies and Buy American provisions for electric cars and batteries.” Global Trade Alert. See http://www.globaltradealert.org/measure/united‐states‐america‐subsidies‐and‐buy‐american‐provisions‐electric‐cars‐and‐batteries, accessed February 4, 2010. 31 “United States of America: Safeguards against imports of consumer tires from China.” Global Trade Alert. See http://www.globaltradealert.org/measure/united‐states‐america‐safeguards‐against‐imports‐consumer‐tires‐china, accessed February 2, 2010. 32 “WTO Establishes Panel To Examine China Tire Safeguard,” Inside U.S. Trade, January 22, 2010.
19
USITC.33 In 2008, the United States imported $1.8 billion worth of tires from China, or 10.9
percent of U.S. consumption by value (16.7 percent by volume).34
At the December 2009 meeting of the WTO Dispute Settlement Body the United States blocked
a request by China to form a DSB panel to investigate the legality of the safeguard tariff. The
United States was unable to block a second request, however, which China submitted during
the January 2010 meeting of the DSB. The WTO consequently established a dispute settlement
panel to evaluate China’s challenge to the tariff.35
Solar Panel Tariff Reclassification: January 2009
In January 2009, the U.S. Customs and Border Protection agency made a ruling that solar panels
equipped with a particular diode fell under the U.S. Harmonized Tariff Schedule classification of
“electric motors and generators.”36 This reclassification subjected the panels to a 2.5 percent
tariff as opposed to zero. In the WTO Doha Round talks, the United States has campaigned for
free trade in environmental goods and services. Clearly this decision cuts the other way.
Employ American Workers Act (EAWA): February 2009
The EAWA restricts Troubled Asset Relief Program (TARP) fund recipients from hiring certain
foreign workers. The EAWA became Section 1611 of the ARRA (Public Law 111‐5) and sunsets
two years from enactment (i.e., February 17, 2011). TARP fund recipients are prohibited from
hiring H‐1B workers unless the firms first attempt to recruit U.S. workers. This procedure was
originally reserved for firms employing a large number of H‐1B workers; the EAWA, however,
33 “U.S.ITC Announces Remedy Proposals in its China Safeguard Investigation Involving Imports of Certain Passenger and Light Truck Tires from China,” U.S.ITC News Release 09‐048, June 29, 2009. 34 “Certain Passenger Vehicle and Light Truck Tires From China,” U.S.ITC Investigation No. TA‐421‐7, Publication 4085, July 2009, p. I‐2. 35 “WTO Establishes Panel To Examine China Tire Safeguard,” Inside U.S. Trade, January 22, 2010. 36 “United States of America: Reclassification of subjecting certain solar panels to a 2.5 percent tariff.” Global Trade Alert. See http://www.globaltradealert.org/measure/united‐states‐america‐reclassification‐subjecting‐certain‐solar‐panels‐25‐tariff, accessed February 7, 2010.
20
applied the requirement to all TARP fund recipients.37 The New York Times has identified more
than 650 firms that have received $400 billion in TARP funds; these are the firms that must
observe the EAWA restrictions.38
Mexican Truck Access: March 2009
In March 2009, Congress passed the Omnibus Appropriations Act, which contained a provision
prohibiting Mexican trucks from long‐distance shipments into the United States (Section 136).39
The measure, along with previous bans, contradicts a NAFTA article intended to enable
Mexican‐domiciled firms to provide trucking services in the United States, and vice versa. In
2001, a NAFTA dispute‐settlement panel ruled that, by refusing access to Mexican trucking
firms, the United States was in breach of its obligations.40 The 2009 Omnibus Act overrode a
compromise that had been implemented by a Federal Motor Carrier Safety Administration pilot
program in 2007, which allowed a limited number of Mexican trucks on U.S. highways. The
Mexican government retaliated shortly after the passage of the Omnibus Act by levying punitive
duties on imports of U.S. agriculture, processed food, textiles, appliances and metal products.41
The U.S. Chamber of Commerce estimated that the Mexican retaliation resulted in $421 million
in tariffs faced by U.S. exporters. It further estimated that U.S. firms would incur $739 million in
annual drayage costs as a result of the continued ban on Mexican trucks.42
Chinese Poultry Import Ban: March 2009
37 “United States of America: Employ American Workers Act.” Global Trade Alert. See http://www.globaltradealert.org/measure/united‐states‐america‐employ‐american‐workers‐act, accessed February 2, 2010. 38 Ericson, Matthew, Elaine He, and Amy Schoenfeld. “Tracking the $700 Billion Bailout.” New York Times. See http://projects.nytimes.com/creditcrisis/recipients/table, accessed February 11, 2010. 39 “United States of America: Access for Mexican trucks.” Global Trade Alert. See http://www.globaltradealert.org/measure/united‐states‐america‐access‐mexican‐trucks, accessed February 2, 2010. 40 North American Free Trade Agreement Arbitral Panel Established Pursuant To Chapter Twenty, In The Matter of Cross‐Border Trucking Services, Secretariat File No. U.S.A‐MEX‐98‐2008‐01 ¶295. 41 “Mexico: Retaliatory tariffs against the United States.” Global Trade Alert. See http://www.globaltradealert.org/measure/mexico‐retaliatory‐tariffs‐against‐united‐states, accessed February 5, 2010. 42 “Trade Action—or Inaction: The Cost for American Workers and Companies,” U.S. Chamber of Commerce, September 15, 2009.
21
Under the same Omnibus Appropriations Act, which prohibited Mexican trucks, Chinese poultry
imports were also banned. Section 727 of the Act states, “None of the funds made available in
this Act may be used to establish or implement a rule allowing poultry products to be imported
into the United States from the People’s Republic of China.” The House Appropriations
Committee cited “concerns about contaminated foods from China” in defending the poultry
ban.43 The United States imported $135 million (14,000 metric tons) of poultry from China in
2007.44
China requested consultations with the United States under WTO auspices in April 2009; in July
2009 the WTO Dispute Settlement Body panel was established, and began work in
September.45 While the 2010 appropriations bill is intended to replace the import ban with
food safety guidelines that allow importation, the Chinese government continues to pursue the
WTO dispute.46 Very likely as a response to the ban, China imposed its own countervailing duty
on United States chicken imports in February 2010, following the conclusion of a Chinese
Ministry of Commerce investigation begun in September 2009.47
Dairy Export Incentive Program: May 2009
The Dairy Export Incentive Program (DEIP) was revived by Secretary of Agriculture Vilsack in
May 2009. The program itself is over twenty years old, but has not been utilized to the extent
permitted under the limits established in the Uruguay Round. Revival of the DEIP was triggered
by higher European dairy subsidies implemented in January 2009. The new DEIP allocations
provide for “68,201 metric tons of nonfat dry milk; 21,097 metric tons of butterfat; 3,030
metric tons of various cheeses and 34 metric tons of other dairy products, as well as individual 43 “United States of America: Ban on poultry imports from China.” Global Trade Alert. See http://www.globaltradealert.org/measure/united‐states‐america‐ban‐poultry‐imports‐china, accessed February 2, 2010. 44 Becker, Geoffrey, “CRS Report for Congress, Food and Agricultural Imports from China,” Congressional Research Service, Order Code RL34080, September 26, 2008, p. CRS‐6. 45 “United States—Certain Measures Affecting Imports of Poultry from China.” WTO. See http://www.wto.org/english/tratop_e/dispu_e/cases_e/ds392_e.htm, accessed February 5, 2010. 46 “United States of America: Ban on poultry imports from China.” Global Trade Alert. 47 “China: Preliminary antidumping duty on imported chicken products originated from the U.S..” Global Trade Alert. See http://www.globaltradealert.org/measure/china‐antidumping‐duty‐imported‐chicken‐products‐originated‐us, accessed February 11, 2010.
22
product and country allocations.”48 The ultimate DEIP program allocations are determined by
the USDA in a bidding process, the results of which are posted on its website.49 As of February
2010, the DEIP program had approved 99 submitted bids.50 The program subsidies are not
expected to exceed one percent of the U.S. dairy market according to the Congressional
Research Service. Despite being within the WTO subsidy limits and its negligible impact, the
program attracted an international backlash given its dissonance from the commitment to
restrain protectionist measures pledged at the London G‐20 summit just two months prior.51
General Motors and Chrysler Financial Support: December 2008–September 2009
In March 2009, the U.S. and Canadian governments invested nearly $40 billion in General
Motors in exchange for debt, preferred stock and 72 percent of GM’s equity. While no explicit
trade distortive border measures were enacted to favor GM or Chrysler, government control
over GM and the absence of similar support for the operations of competing foreign auto firms
could have an impact on trade and investment patterns. For example, it was speculated that
government ownership may have dissuaded GM from investing in Chinese production
facilities.52
In November 2008, auto industry executives appeared before a congressional hearing and
requested $25 billion in public aid.53 Just prior to this hearing, European Commission President
Barroso warned of potential WTO action against U.S. subsidies to domestic automakers. By the
end of 2008, the initial stimulus included $17.4 billion in loans to GM and Chrysler, half of what
48 “USDA announces 2008‐2009 allocations for Dairy Export Incentive Program.” United States Department of Agriculture (U.S.DA). See http://www.fas.usda.gov/scriptsw/PressRelease/pressrel_dout.asp?Entry=valid&PrNum=0081‐09, accessed February 11, 2010. 49 “United States of America: Dairy Export Incentive Program.” Global Trade Alert. See http://www.globaltradealert.org/measure/united‐states‐america‐dairy‐export‐incentive‐program, accessed February 2, 2010. 50 “Dairy Export Incentive Program (DEIP).” U.S.DA. See http://www.fas.usda.gov/excredits/deip/deip‐new.asp, accessed February 11, 2010. 51 “U.S. Revival of Dairy Subsidies Sparks Global Outrage, but Effect Minimal,” Inside U.S. Trade, May 29, 2009. 52 “United States of America: Support for General Motors and Chrysler.” Global Trade Alert. See http://www.globaltradealert.org/measure/united‐states‐america‐support‐general‐motors‐and‐chrysler, accessed February 2, 2010. 53 Ibid.
23
the industry ultimately requested but nonetheless on terms far more favorable than those
commercially available to the automakers. The automakers received additional support from
the stimulus package but, aside from the electric‐drive vehicle and battery technology
provisions discussed above, the support has been non‐discriminatory. Following the 2009
bankruptcy filings by Chrysler (April) and GM (June), coupled with additional government
financing in the context of both proceedings, the House passed a provision that would have
limited new cars eligible for purchase incentives to those produced by the “big three;” however,
this provision was eliminated in the September reconciliation with the Senate.54
Bail‐Out of GMAC: December 2009
In December 2009, the U.S. Treasury Department expanded its $12.5 billion stake in General
Motors Acceptance Corporation (GM’s financing arm, known as GMAC) by $3.5 billion.55 The
sum of this expanded capital investment and conversion of a portion of previously held
preferred equity into common stock (a 35 percent interest) made the U.S. Treasury a 56
percent majority shareholder.56 The Treasury appointed four of nine GMAC directors. Both the
majority interest and terms of the capital investment are potentially trade distortive, since they
give GM better access to credit than other auto firms.
Expanded Bailout to Mortgage Guarantors: December 2009
The Federal Home Loan Mortgage Corporation (Freddie Mac) and the Federal National
Mortgage Association (Fannie Mae) were taken into conservatorship by the Treasury
Department in September 2008. Under the initial agreement a cap existed on the stake the
Treasury could take in the preferred stock of either Government‐Sponsored Enterprise (GSE).
The December 2009 expansion lifts this cap and extends the period over which the Treasury can
54 Ibid. 55 “United States of America: Bail‐out of GMAC.” Global Trade Alert. See http://www.globaltradealert.org/measure/united‐states‐america‐bail‐out‐gmac, accessed February 2, 2010. 56 “Treasury Announces Restructuring of Commitment to GMAC” U.S. Department of the Treasury. December 30, 2009. See http://www.treas.gov/press/releases/tg501.htm, accessed February 5, 2010.
24
maintain its stake through the end of 2012.57 The Treasury estimated that, “[b]y the conclusion
of its MBS purchase program . . . it will have purchased approximately $220 billion of securities
across a range of maturities.”58 The Treasury also relaxed the initial requirement for a more
rapid reduction of the mortgage portfolios held by the GSEs; however, in a public statement
issued December 24, 2009, the Treasury affirmed that it “remains committed to the principle of
reducing the [GSE’s] retained portfolios.”59 Nevertheless, through its huge presence in the
national mortgage market, the Treasury clearly influences and possibly distorts the
international flow of capital.
Potentially Trade‐Distortive Measures
This section describes the four principal instances in which the U.S. government has
implemented potentially trade‐distortive measures since the beginning of the Great Recession.
Country‐of‐Origin Labeling (COOL)
Canada and Mexico have brought a dispute to the WTO over meat labeling requirements
imposed by the COOL amendment to the Agriculture Marketing Act of 1946 implemented
under the Food, Conservation, and Energy Act of 2008. The two countries allege that the COOL
labeling requirement violates the WTO rules on Technical Barriers to Trade, specifically Article
2.4.60 The WTO established a panel in November 2009 to consider the claims but has yet to
rule.61
57 “United States of America: Expanded bailout to mortgage guarantors.” Global Trade Alert. See http://www.globaltradealert.org/measure/united‐states‐america‐expanded‐bailout‐mortgage‐guarantors, accessed February 2, 2010. 58 “Treasury Issues Updates on Status of Support for Housing Programs.” U.S. Department of the Treasury. December 24, 2009. See http://www.ustreas.gov/press/releases/2009122415345924543.htm, accessed February 5, 2010. 59 Ibid. 60 “Processors, Cattle Groups Square off over WTO Challenges of COOL,” Inside U.S. Trade, January 15, 2010. 61 “Dispute Settlement: Dispute DS384. United States—Certain Country of Origin Labelling (COOL) Requirements.” WTO. http://www.wto.org/english/tratop_e/dispu_e/cases_e/ds384_e.htm, accessed February 5, 2010.
25
Antidumping and Countervailing Duties Cases and Safeguard Measures: 2009‐2010
U.S. firms, sometimes with the support of U.S. labor unions, have filed a total of sixteen
antidumping and/or countervailing duties petitions against imports from different countries
since 2009. In addition, as already described, President Obama authorized safeguard measures
against imports of consumer tires from China on September 11, 2009.
Out of seventeen petitions, fourteen were aimed against China. The second most targeted
country is Taiwan with three cases, followed by Indonesia and Mexico with two cases each. The
concentrated targeting of China speaks for itself.
The imported goods most often targeted are steel and iron products. They make up six of the
seventeen cases filed. Most recently, on December 31, 2009, a number of unions joined in a
petition against imports of drill pipe from China.
Trade Reform, Accountability, Development and Employment (TRADE) Act: June 2009
This bill (H.R. 3012), introduced by Congressman Bill Michaud (D‐ME), would require a review of
all existing trade agreements, measured against “security, human rights, social, and
environmental indicators” before any additional trade legislation could be approved.62 The bill
sets standards within fourteen different categories (e.g. labor, environment, agriculture,
national security) that must be met by all trade agreements.63 It then requires the president to
submit a plan for renegotiation of existing and deficient trade agreements in order to bring
them into compliance with the standards set by the bill. The standards are to be evaluated by a
“Congressional Trade Agreement Review Committee,” which the bill would create. The process
would preclude the fast‐track process from operating as it has in the past, since all new
agreements would be subject to a lengthy evaluation as to whether set objectives had been
met. The bill has just over 100 supporters in the House but is not expected to pass; however the
62 “United States of America: Trade Reform, Accountability, Development and Employment (TRADE) Act.” Global Trade Alert. See http://www.globaltradealert.org/measure/united‐states‐america‐trade‐reform‐accountability‐development‐and‐employment‐trade‐act, accessed February 11, 2010. 63 “H.R. 2012—Trade Reform, Accountability, Development, and Employment Act of 2009.” Open Congress. See http://www.opencongress.org/bill/111‐h3012/show, accessed February 11, 2010.
26
sentiment of the supporting members is to tie up the Obama Administration in lengthy reviews
of existing trade agreements, and to obstruct future agreements.
Trade Enforcement Act: January 2009
Before he “temporarily” handed over the gavel to Sander M. Levin (D‐MI), House Ways and
Means Committee Chairman Charles Rangel (D‐NY) offered his own trade bill (the Trade
Enforcement Act) which addresses trade issues in a different manner. Among Congressional
Democrats, Rangel has a “free trader” reputation compared to Levin. 64
The Trade Enforcement Act (TEA) introduced by Congressman Charles Rangel (D‐NY) would
establish an “Office of the Congressional Trade Enforcer” (CTE), intended to monitor trade‐
relevant practices of United States trading partners. If the CTE found a violation of Uruguay
Round rules, it would require the United States Trade Representative (USTR) to bring an action
in the WTO. If the USTR decided not to act, it would need to provide a written response to the
CTE explaining the decision. The USTR is further required to identify and investigate trade
practices of partners “the elimination of which is likely to have the most significant potential to
increase United States exports” and would appoint a general counsel (new position) to aid him
in doing so.65
The TEA would require the U.S. Department of Commerce to disregard the WTO Appellate Body
ruling with respect to the “zeroing” in dumping cases.66 The bill goes further to state that the
WTO “dispute settlement panel is obligated to follow the text of an agreement negotiated by
the WTO members themselves, and not the ‘jurisprudence’ of the WTO Appellate Body.”67
Section 207 seeks to revise the rules on presidential action following ITC rulings of market
disruption. Section 301 establishes an “Import Safety Program” intended to privilege firms
64 Kane, Paul. “Sander Levin replaces Rangel as Ways and Means chairman.” The Washington Post. March 5, 2010. 65 H.R. 496 Title I. 66 Under its zeroing procedure, the Commerce Department ignores shipments which indicate a “negative dumping margin.” This procedure has been repeatedly held inconsistent with WTO rules by the Appellate Body. 67 H.R. 496 Sec. 205.
27
complying with the Customs‐Trade Partnership Against Terrorism (C‐TPAT) with expedited
customs handling. The bill contains additional measures to monitor the supply chain, including
tougher penalties for intellectual property rights violations. Two supply chain monitoring
systems (the International Trade Data System and the Automated Commercial Environment)
would be established to monitor essentially all parties involved in producing and transporting
goods to the United States.68
Other Cases: 2009
There are 20 additional ambiguous cases of U.S. protectionism identified by Global Trade Alert
(GTA). Each is listed in Appendix A. Some of the cases involve proposed outright import bans;
e.g., against switch blade knives or wind turbines from China. Several involve either the
imposition of additional fees or tariffs on imports or subsidies to domestic industry. Full
descriptions of the cases are available on the GTA website.
68 “United States of America: Trade Enforcement Act.” Global Trade Alert. See http://www.globaltradealert.org/measure/united‐states‐america‐trade‐enforcement‐act, accessed February 11, 2010.
28
IV JOBS, JOBS, JOBS
As President Obama made clear in his State of the Union Address, the American people are
fixated on three political goals: jobs, jobs, jobs. Many pundits have echoed this call,69 so it is
worth putting some perspective on the international dimension of the jobs quest.
Automatic stabilizers and manufacturing jobs
Students of fiscal policy know about automatic stabilizers. These come into play when an
economy goes into recession: tax receipts drop quickly while safety net expenditures normally
rise, even without any policy initiatives. The combined result is to put more money into
household pockets, thereby cushioning the economic decline. A similar phenomenon is at work
in the external accounts of the American economy. When a recession looms, imports normally
drop faster, in percentage terms, than exports. Moreover, because the dollar value of
merchandise imports regularly exceeds the dollar value of merchandise exports, the effect is to
amplify the ensuing contraction of the trade deficit, and further cushion the job impact of a
shrinking economy.
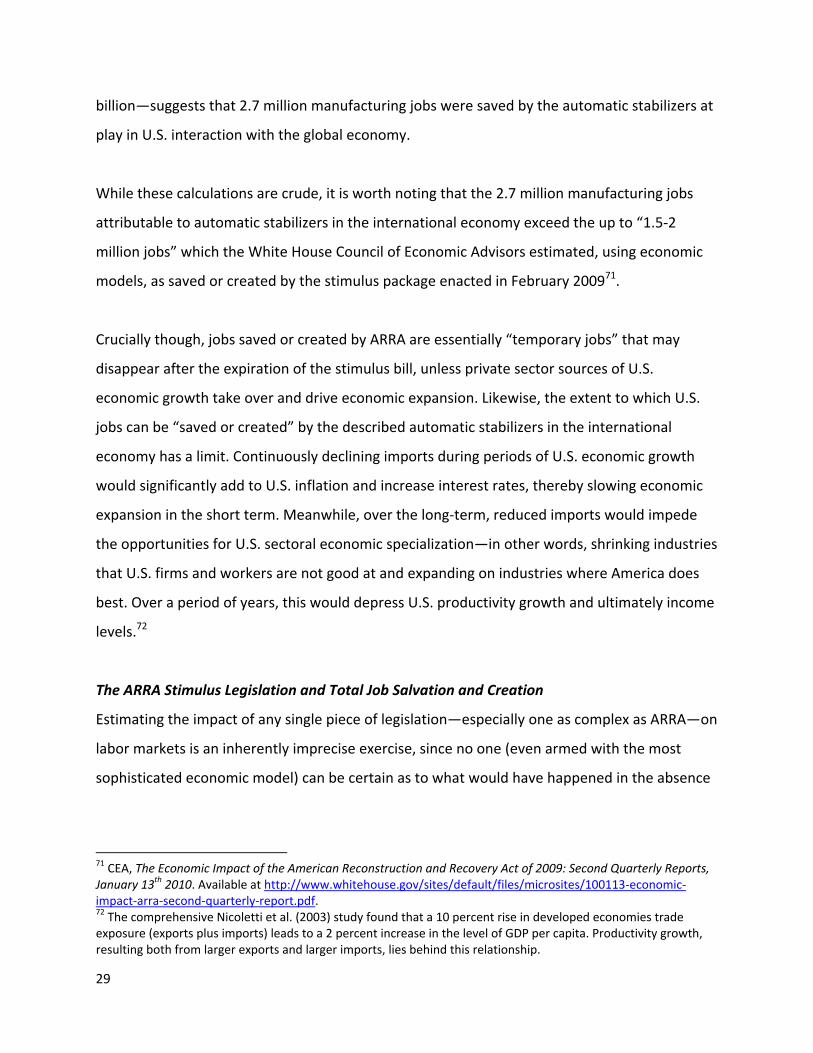
As described in the introduction, the U.S. merchandise trade deficit decreased by about 50
percent as a direct result of the Great Recession. To estimate the number of manufacturing jobs
potentially saved by the contracting trade deficit, we apply a coefficient of 8,200 manufacturing
jobs per billion dollars of reduction in the merchandise trade deficit.70 The resulting
calculation—8,200 jobs per billion dollars, times a reduction in the trade deficit of $331
69 See, for example, the posting by former Governor Doug Wilder of Virginia on the Politico blog, www.politico.com, February 9, 2010. 70 The derivation of this coefficient is explained in appendix B. A similar coefficient would not be appropriate in times of full employment, (defined as unemployment around 5 percent, and manufacturing capacity utilization around 80 percent) for the simple reason that threatened inflation would very likely compel the Federal Reserve to tighten monetary conditions if more demand, through a reduced trade deficit, was added to an already brisk economy. But these are not times of full employment; these are times of Keynesian unemployment. A smaller trade deficit can save jobs in a slack economy; therefore, applying a jobs coefficient to changes in the trade deficit gives a reasonable approximation.
29
billion—suggests that 2.7 million manufacturing jobs were saved by the automatic stabilizers at
play in U.S. interaction with the global economy.
While these calculations are crude, it is worth noting that the 2.7 million manufacturing jobs
attributable to automatic stabilizers in the international economy exceed the up to “1.5‐2
million jobs” which the White House Council of Economic Advisors estimated, using economic
models, as saved or created by the stimulus package enacted in February 200971.
Crucially though, jobs saved or created by ARRA are essentially “temporary jobs” that may
disappear after the expiration of the stimulus bill, unless private sector sources of U.S.
economic growth take over and drive economic expansion. Likewise, the extent to which U.S.
jobs can be “saved or created” by the described automatic stabilizers in the international
economy has a limit. Continuously declining imports during periods of U.S. economic growth
would significantly add to U.S. inflation and increase interest rates, thereby slowing economic
expansion in the short term. Meanwhile, over the long‐term, reduced imports would impede
the opportunities for U.S. sectoral economic specialization—in other words, shrinking industries
that U.S. firms and workers are not good at and expanding on industries where America does
best. Over a period of years, this would depress U.S. productivity growth and ultimately income
levels.72
The ARRA Stimulus Legislation and Total Job Salvation and Creation
Estimating the impact of any single piece of legislation—especially one as complex as ARRA—on
labor markets is an inherently imprecise exercise, since no one (even armed with the most
sophisticated economic model) can be certain as to what would have happened in the absence
71 CEA, The Economic Impact of the American Reconstruction and Recovery Act of 2009: Second Quarterly Reports, January 13th 2010. Available at http://www.whitehouse.gov/sites/default/files/microsites/100113‐economic‐impact‐arra‐second‐quarterly‐report.pdf. 72 The comprehensive Nicoletti et al. (2003) study found that a 10 percent rise in developed economies trade exposure (exports plus imports) leads to a 2 percent increase in the level of GDP per capita. Productivity growth, resulting both from larger exports and larger imports, lies behind this relationship.
30
of the legislation. Accordingly, it is difficult to agree on a counterfactual scenario from which to
compare the effects of the legislation in question.
Yet beliefs about “the future,” in the absence of new policy action, are crucial for estimating the
effect of the policy action in question and invariably shape views as to whether the new
legislation should be deemed a success or a failure. The on‐going political fight over the effects
of ARRA offers a classical example of this dynamic. In January 2009, the White House published
an estimate for the jobs impact of a future hypothetical ARRA‐size stimulus package of just over
$775 billion.73 This report claimed that the effect of the stimulus could be as large as 3.675
million jobs saved or created and prevent the U.S. unemployment rate from breaching 8
percent. This report assumed that the U.S. unemployment rate would—in the absence of any
stimulus legislation—peak at around 9 percent in the middle of 2010.
Judged against what has factually occurred in the U.S. labor market since the passage of ARRA
in February 2009, with unemployment hovering just below 10 percent since early 2010, the
large fiscal stimulus can be claimed to have failed, since U.S. unemployment remains at very
high levels (and certainly above the 8 percent envisioned by the Obama Administration in
January 2009). Leading Republican members of Congress repeatedly claim that ARRA has failed,
referring precisely to this point.74 On the other hand, if one believed in early 2009 that—in the
absence of a large fiscal stimulus—the U.S. economy was headed for a Great Depression
scenario and unemployment levels of 20 percent or higher, what has since actually come to
transpire in the U.S. labor market is not a bad outcome. Unsurprisingly, this is the position of
the Obama Administration.
73 This study is no longer available on the White House website, but was authored by CEA (then nominee) Chair Christina Romer and Jared Bernstein from Vice President Biden’s office. It is widely available on the internet at for instance “The Job Impact of the American Recovery and Reinvestment Plan –Jan 10, 2009,” Twine. See http://www.twine.com/item/11s7k2tcr‐1vc/the‐job‐impact‐of‐the‐american‐recovery‐and‐reinvestment‐plan‐jan‐10‐2009 (accessed on February 1, 2010). 74 See detailed discussion at politifact.com at “Cantor and other Republicans say Obama promised stimulus would keep unemployment rates below 8 percent.” http://www.politifact.com/truth‐o‐meter/statements/2009/jul/09/eric‐cantor/Cantor‐and‐other‐republicans‐say‐obama‐promised‐s/. See also Mitchell, Daniel J. 2010. “Making Government Bigger Is Not Stimulus—and It Won’t Create Jobs.” Available at Cato Liberty, www.cato‐at‐libery.org (accessed on February 4, 2010).
31
What is clear, however, is that even the Administration’s assessment of the labor market
effects of ARRA are far below what was assumed in early 2009. The CEA’s own updated
estimates from January 2010 of 1.5‐2 million jobs either saved or created by ARRA is thus only
around a third or half of what the Administration itself claimed immediately before passage of
the stimulus package. At the same time, the CEA’s updated jobs estimates are generally higher
than private sector forecasters such as Macroeconomic Advisors, HIS/Global Insight or Moody,
are relatively close to the CBO’s “High Forecast” of ARRA effects.75
The latest CEA estimates, similar to other economic forecasters like the Congressional Budget
Office and private sector organizations, are based on a macro economic model.76 This type of
estimate has the advantage of including all indirect effects from stimulus spending, like higher
or maintained consumer outlays. At the same time, though, as illustrated above, macro‐
economic models may suffer from incorrect baseline scenarios and assumptions. Therefore,
another way to try to figure out the jobs impact of ARRA is to try to add up reported individual
instances of job salvation and creation from stimulus funds to get to a total—in other words, to
create aggregate jobs data from a host of individual anecdotes.77
The Obama Administration, on its www.recovery.gov website, regularly publishes this type of
data collected from individual recipients of ARRA money. Recipients are required to estimate
the number of jobs funded under the Recovery Act.78 So far aggregate data of this kind are
available for two periods: February 17‐September 30, 2009, when a total of about 634,000 full‐
75 See CEA (2010, table 8). 76 In more detail, the CEA estimates rely on a vector auto‐regression (or VAR) model using the logarithms of real GDP and employment over the period 1990:Q1‐2007:Q4 with four lags of each variable to make an estimate of the effects of ARRA. GDP and employment are subsequently forecast for the second, third, and fourth quarters of 2009 using actual data through the first quarter of the year. The monetary stimulus, which was put in place before the end of Q1 2009, is included in the baseline estimates, but the fiscal stimulus and other actions that took effect after the first quarter are not. 77 See also Burtless, Gary. 2009. “Counting the Jobs Produced by the Stimulus,” Available at Brookings Institution at www.brookings.edu (accessed February 4, 2010). 78 Jobs Summary—National. Reovery.gov. See http://www.recovery.gov/Transparency/RecipientReportedData/Pages/JobSummary.aspx (accessed February 4, 2010).
32
time‐equivalent jobs were reported either saved or created by ARRA funds; and October 1 to
December 31, 2009, when about 595,000 full‐time‐equivalent jobs were reported saved or
created by stimulus money.
Some care however must be taken in interpreting this type of “anecdote aggregating jobs
data.”79 First of all, they are gross jobs data, which cannot be immediately compared to the
traditional “net employment change data” published monthly by the Bureau of labor
statistics.80 Secondly, reported data only covers the parts of ARRA funds for which reporting is
mandatory and excludes ARRA funding to projects under a certain threshold or related to tax
breaks, unemployment insurance, and direct aid to states included in ARRA. Funds subject to
the recipient reporting requirement comprise about 35 percent of the total funding of the
Act.81 Lastly aggregate sums for different time periods cannot, due to the method of data
reporting, be immediately added up to equal the total impact of the stimulus bill.82
For these reasons, data in the aggregate should not be used to measure the total impact of the
ARRA bill, but the figures do contain relevant information regarding the sectoral distribution of
ARRA job salvation and creation across the U.S. economy.
Stimulus legislation and manufacturing jobs
As the manufacturing sector in recent years has accounted for about 9 to 10 percent of total
U.S. non‐farm employment, a rough and ready estimate is that the stimulus package saved or
created around 150,000 to 200,000 manufacturing jobs (10 percent of the total 1.5‐2 million
jobs estimated by the CEA). Turning again to the “anecdotal ARRA data” from
79 For a detailed analysis of these data, see also GAO (2009). 80 Net changes in employment arise from changes in the gross numbers of jobs created and the gross numbers of jobs destroyed in the economy during a given period. As such, gross jobs data are generally far higher than net changes in employment during a given period. See the Bureau of Labor Statistics Business Employment Dynamics program for a detailed discussion at http://www.bls.gov/bdm/bdmfaq.htm. 81 CEA (2010, p.27) 82 Substantial double counting will occur between two individual reporting periods, as reporters were initially instructed to submit the average number of full time equivalent jobs supported over the entire lifetime of an ARRA‐funded project. A host of other methodological issues concern these data, but are beyond the scope of this report to describe.
33
www.recovery.gov, by looking at the detailed program descriptions, one can add up the kind of
projects (like highway construction, airport improvements or weatherization funding) likely to
yield substantial manufacturing sector orders.83 Doing so also suggests that perhaps 10 percent
of the jobs saved or created by ARRA are manufacturing jobs.
A more detailed (but still rough) estimate can be made by combining calculations of the jobs
coefficient per billion dollars of trade with the amount of government procurement funded by
the ARRA and possibly directed to the U.S. manufacturing sector. For this exercise, we rely on
our own calculation of 8,200 jobs per billion dollars (explained in appendix B),84 the U.S.
government’s report of manufacturing procurement, and figures on ARRA money awarded to
the states and territories in 2009.
According to the website of the Federal Procurement Data System, federal procurement of
goods in NAICS sector codes 21, 31, 32, and 33 (corresponding to manufactured goods),
between February 17, 2009 and December 31, 2009, was $129 billion. Of course a good deal of
this procurement had nothing to do with ARRA; in particular, during the period in question, the
Department of Defense had procurement expenditures of $295 billion, little or none supported
by ARRA, but much spent on manufactured goods. On the other hand, during the same period,
states and territories were awarded $199 billion of ARRA money and actually received $57
billion (counting all contracts, grants and loans). Much of the procurement flowing from funds
awarded to the states and territories would have been spent on manufactured goods, but little
would have been recorded as federal procurement.
83 Detailed program descriptions are available at “Top Programs, as reported by recipients (Oct 1—Dec 31, 2009).” Recovery.gov. See http://www.recovery.gov/Pages/TextView.aspx?data=jobSummaryProgram&topnumber=200&qtr=2009Q4 (accessed February 4, 2010). 84 This figure is similar to the calculations of 9,254 jobs per billion dollars of U.S. purchases as a result of the Buy American amendment to ARRA, and 8,558 jobs per billion dollars of U.S. GDP lost from not ratifying the U.S.‐Colombia and U.S.‐Korea Free Trade Agreements, both coefficients reported in Laura M. Baughman and Joseph F. Francoise, Trade Action—or Inaction: The Cost for American Workers and Companies, report for the U.S. Chamber of Commerce, September 15, 2009.
34
As a very rough but probably high guess, we estimate that 25 percent of federal procurement
of manufactured goods was ARRA related, giving a federal figure of $32 billion. As another
rough but high guess, we estimate that 50 percent of ARRA money actually received by the
states led to orders for manufactured goods. This amounts to $28 billion. Together, the two
figures come to an estimate of $60 billion for manufactured goods sales in 2009 related to the
stimulus package. Applying a jobs coefficient of 8,200 per billion dollars suggests that 492,000
manufacturing jobs may have been saved or created in 2009 by ARRA money.
This figure is far larger than the 150,000 to 200,000 jobs suggested in the opening paragraph of
this section, and is probably too high, but a somewhat larger number might be justified by the
character of stimulus spending—more devoted to “shovel ready” projects, intensive in
manufactured goods, than the normal composition of jobs in the American economy. Similarly,
the manufacturing sector is typically among the most cyclically sensitive sectors in the U.S.
economy that will have benefitted from the broader boost to GDP growth from ARRA, as well
as benefitted from the effects of business tax incentives on investment included in the bill.
Impact of Buy American on All Manufacturing Jobs
Baughman and Francoise (2009) calculate that 10 percent of all federally procured products
come from foreign sources, but that some 1.3 percent out of that amount is either sourced
from trade agreement partners, is not available domestically, or is exempt from a Buy American
requirement due to a public interest determination. We assume (as do Baughman and
Francoise) that these same proportions apply to the ARRA package, whether the stimulus
money is spent by the federal government or the states and territories. This assumption means
than 8.7 percent of ARRA spending is vulnerable to the Buy American amendment.
The consequence is that Buy American may shift 8.7 percent of ARRA purchases from foreign
firms to U.S. suppliers. If we apply the 8.7 percent figure to the previous estimate of $60 billion
of new orders for manufactures related to ARRA spending, the calculation is that $5.2 billion of
spending was shifted from imported manufactures to domestically made products. The
35
implication is that around 43,000 manufacturing jobs were saved or created in 2009 by the Buy
American amendment.
Impact of Buy American on Steel Jobs
The U.S. steel industry led the battle for the “Buy American” amendment attached to the $787
billion stimulus program enacted on February 17, 2009. 85 Hence it is worth tracking the
numbers to gauge the impact of ARRA on steel industry jobs. Federal procurement directly from
the iron and steel industry (NAICS sector codes 3311 and 3312) is very small, only $121 million
between February 17, 2009 and December 31, 2009. Clearly most iron and steel purchases in
response to the stimulus package are not made directly by the Federal government, but rather
indirectly through construction contracts awarded by the states. However, no database of state
procurement records the amount of iron and steel purchased.
Accordingly, to gauge the impact of Buy American on U.S. domestic steel production, we apply
a “shift share” analysis to domestic production and import data. Nearly all U.S. crude steel is
further processed by integrated mills into finished steel; moreover, imports of semi‐finished
steel products are usually turned into finished products by domestic mills. Hence we measure
the tonnage of domestic steel production as the sum of U.S. crude steel production plus
imports of semi‐finished steel, plus steel produced by electric minimills.86 Our estimates are
presented in Appendix C. We assume that U.S. steel demand equals the sum of domestic steel
production plus finished steel products imported from abroad, and that the two sources are
substitutes for each other.87 The Buy American amendment was designed to change the
sourcing mix in favor of domestic production.
85 The steel industry’s political clout vastly exceeds its employment level. According to the Bureau of Labor Statistics, employment in a broadly defined proxy for the U.S. steel industry (NAICS industry 331—Primary Metals) was 400,000 in early 2009, or about 3 percent of total manufacturing employment at that time. 86 Working from scrap metal, minimills supply a large share of the finished steel market, some 57 percent of national steel production (U.S. Environmental Protection Agency. 2009. AP 42 Compilation of Air Pollutant Emission Factors, Fifth Edition, Volume I, Chapter 12: Metallurgical Industry, 12.5.1 Minimills (April 2009). Available at www.epa.gov (accessed on February 2nd, 2010).) 87 This assumption neglects inventory changes.
36
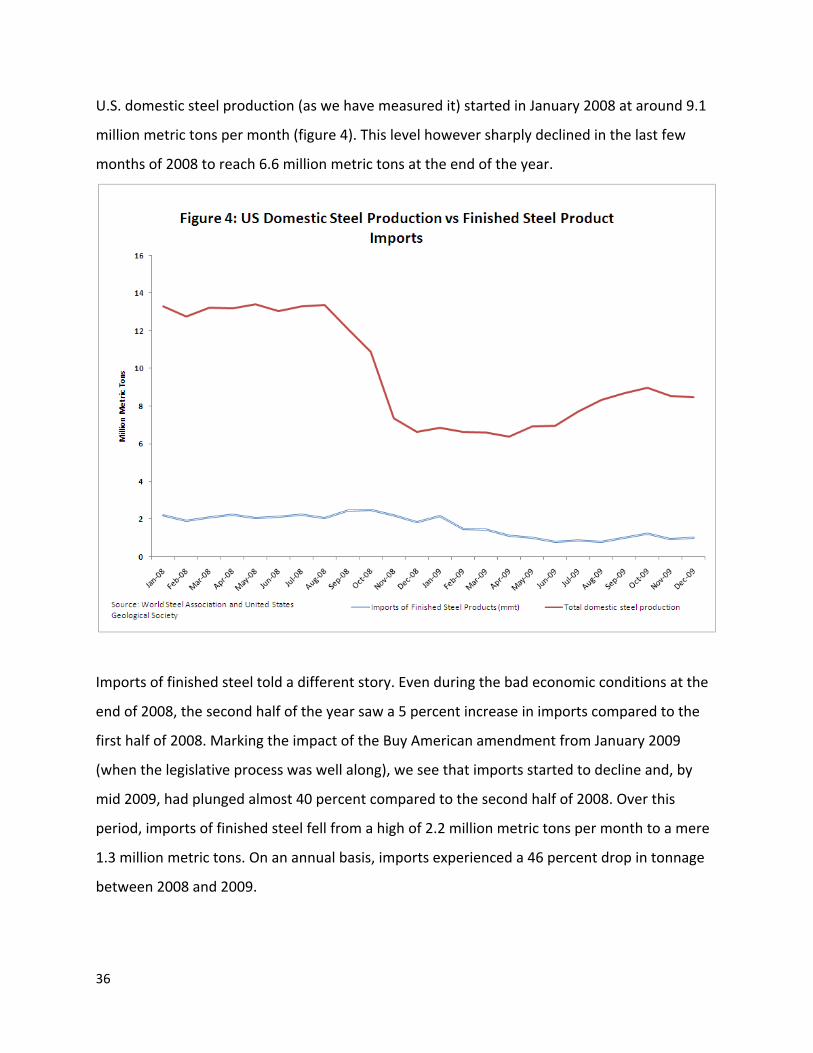
U.S. domestic steel production (as we have measured it) started in January 2008 at around 9.1
million metric tons per month (figure 4). This level however sharply declined in the last few
months of 2008 to reach 6.6 million metric tons at the end of the year.
Imports of finished steel told a different story. Even during the bad economic conditions at the
end of 2008, the second half of the year saw a 5 percent increase in imports compared to the
first half of 2008. Marking the impact of the Buy American amendment from January 2009
(when the legislative process was well along), we see that imports started to decline and, by
mid 2009, had plunged almost 40 percent compared to the second half of 2008. Over this
period, imports of finished steel fell from a high of 2.2 million metric tons per month to a mere
1.3 million metric tons. On an annual basis, imports experienced a 46 percent drop in tonnage
between 2008 and 2009.
37
U.S. domestic steel production, however, started on a recovery path around April 2009, as the
Buy American provisions took hold. The second half of 2009 saw a 26 percent increase in
production compared to its first half (figure 4).
To measure the impact of Buy American, we compare the average of steel production and
imports in November and December 2008 (Nov/Dec 2008) against the average in November
and December 2009 (Nov/Dec 2009). The idea is to compare pre‐stimulus, pre‐Buy American
market shares with post‐stimulus, post‐Buy American market shares. Before the stimulus, U.S.
domestic production commanded 77.5 percent of U.S. demand for steel, while imports only
accounted for 22.5 percent. After the stimulus and Buy American legislation, U.S. domestic
production increased its market share to 89.5 percent, leaving imports with only 10.5 percent.
We attribute the entire shift in market share, some 12.1 percent, to the Buy American
amendment (see Appendix C).88
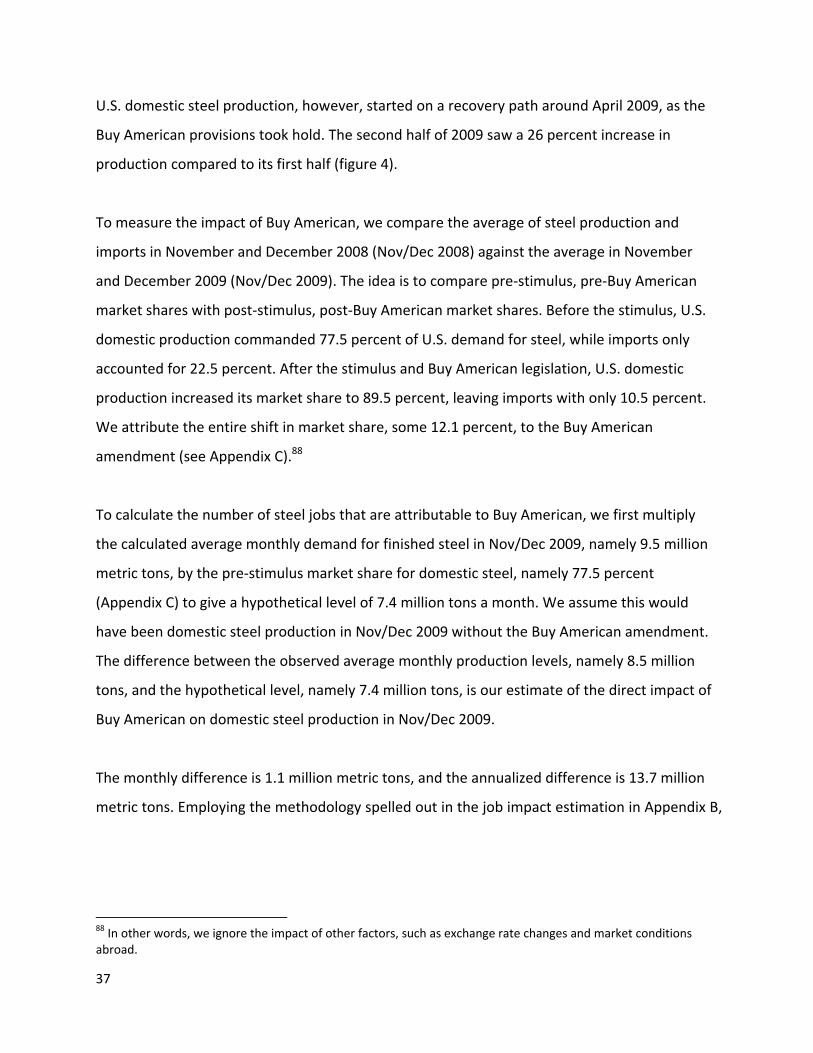
To calculate the number of steel jobs that are attributable to Buy American, we first multiply
the calculated average monthly demand for finished steel in Nov/Dec 2009, namely 9.5 million
metric tons, by the pre‐stimulus market share for domestic steel, namely 77.5 percent
(Appendix C) to give a hypothetical level of 7.4 million tons a month. We assume this would
have been domestic steel production in Nov/Dec 2009 without the Buy American amendment.
The difference between the observed average monthly production levels, namely 8.5 million
tons, and the hypothetical level, namely 7.4 million tons, is our estimate of the direct impact of
Buy American on domestic steel production in Nov/Dec 2009.
The monthly difference is 1.1 million metric tons, and the annualized difference is 13.7 million
metric tons. Employing the methodology spelled out in the job impact estimation in Appendix B,
88 In other words, we ignore the impact of other factors, such as exchange rate changes and market conditions abroad.
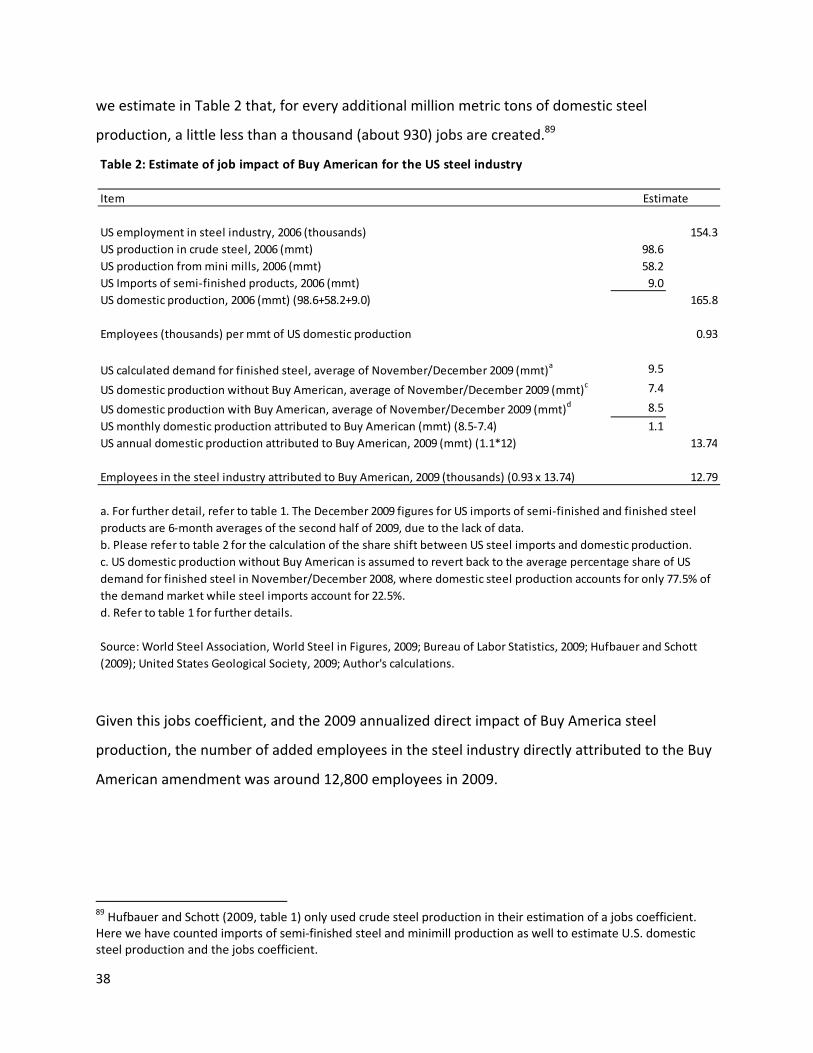
38
we estimate in Table 2 that, for every additional million metric tons of domestic steel
production, a little less than a thousand (about 930) jobs are created.89
Given this jobs coefficient, and the 2009 annualized direct impact of Buy America steel
production, the number of added employees in the steel industry directly attributed to the Buy
American amendment was around 12,800 employees in 2009.
89 Hufbauer and Schott (2009, table 1) only used crude steel production in their estimation of a jobs coefficient. Here we have counted imports of semi‐finished steel and minimill production as well to estimate U.S. domestic steel production and the jobs coefficient.
Item
US employment in steel industry, 2006 (thousands) 154.3US production in crude steel, 2006 (mmt) 98.6US production from mini mills, 2006 (mmt) 58.2US Imports of semi‐finished products, 2006 (mmt) 9.0US domestic production, 2006 (mmt) (98.6+58.2+9.0) 165.8
Employees (thousands) per mmt of US domestic production 0.93
9.5
7.4
8.5
1.113.74
Employees in the steel industry attributed to Buy American, 2009 (thousands) (0.93 x 13.74) 12.79
b. Please refer to table 2 for the calculation of the share shift between US steel imports and domestic production.
d. Refer to table 1 for further details.
Table 2: Estimate of job impact of Buy American for the US steel industry
Estimate
US calculated demand for finished steel, average of November/December 2009 (mmt)a
US domestic production without Buy American, average of November/December 2009 (mmt)c
US domestic production with Buy American, average of November/December 2009 (mmt)d
US monthly domestic production attributed to Buy American (mmt) (8.5‐7.4)US annual domestic production attributed to Buy American, 2009 (mmt) (1.1*12)
a. For further detail, refer to table 1. The December 2009 figures for US imports of semi‐finished and finished steel products are 6‐month averages of the second half of 2009, due to the lack of data.
c. US domestic production without Buy American is assumed to revert back to the average percentage share of US demand for finished steel in November/December 2008, where domestic steel production accounts for only 77.5% of the demand market while steel imports account for 22.5%.
Source: World Steel Association, World Steel in Figures, 2009; Bureau of Labor Statistics, 2009; Hufbauer and Schott (2009); United States Geological Society, 2009; Author's calculations.
39
The Bottom line on Stimulus, Buy American and U.S. Jobs
As this section has described, estimations of the jobs effects of stimulus spending and Buy
American are complex, inherently imprecise and driven by assumptions. However, despite all
these caveats, the simple order of magnitude impact of the results in section makes the
conclusions both simple and powerful.
• The biggest force for saving jobs between 2008 and 2009 was automatic contraction of
the trade deficit—the result of stabilizing forces in America’s engagement with the
global economy. The figure is about 2.7 million manufacturing jobs saved.
• The next biggest force was the stimulus package enacted in February 2009. The ARRA
saved or created as many as 1.5‐2 million throughout the U.S. economy.
• Perhaps as many as 150‐200,000 manufacturing jobs were saved or created by ARRA. A
high estimate of the impact of federal and state procurement spending on total
manufacturing jobs saved or created by the ARRA is 492,000.
• The Buy American amendment saved or created around 43,000 manufacturing jobs,
accounting for a minor share of total manufacturing jobs saved or created by the ARRA,
and at most 2 percent of the Administration’s total jobs claim.
• At most, the U.S. steel industry gained 12,800 jobs from Buy American. This figure does
not take into account the negative impact on the rest of the U.S. economy from
emulation or retaliation by foreign countries—a subject we now consider.
40
V Foreign Emulation, Retaliation and the Real Losses From Buy American
In February 2009, the ARRA was signed into law amidst heavy criticism of the Buy American
amendment by foreign governments and some U.S. business firms. Commentators suggested
that foreign emulation or retaliation could more than offset any U.S. job gains by reducing U.S.
exports. In an early policy brief, Hufbauer and Schott (2009) calculated that, if foreign
governments foreclosed just 1 percent of their government procurement to U.S. exports, Buy
American would end up costing 6,500 U.S. jobs. In an extreme scenario, in which the United
States lost 10 percent of these exports, as many as 65,000 jobs could vanish.
In a report issued in October 2009, Baughman and Francoise (2009) contended that U.S. jobs
saved or created by the Buy American amendment to the ARRA would be more than offset if
other countries implemented their own buy national policies. Baughman and Francoise
calculated that, if foreign emulation or retaliation caused U.S. companies to lose just 1 percent
of the potential sales opportunities created by foreign stimulus programs, U.S. exporters would
lose 200,900 jobs, and the U.S. net employment loss as a result of the Buy American
amendment might total 176,800.
Whatever the right number, the calculated gain of 43,000 manufacturing jobs by the Buy
American amendment could be wiped out completely by “blowback” employment losses.
However, job losses would be spread out across the entire manufacturing sector while the jobs
gained would be concentrated in iron and steel and a few other industries. Based on
knowledgeable but sometimes confidential industry sources, as well as the public media, we
summarize several case studies as anecdotal evidence of Buy American’s widespread damage
and inconvenience to U.S. companies, foreign firms, as well as U.S. Federal agencies and
municipalities. We focus on Canadian responses, because Canada was significantly affected and,
as a large trading partner, was capable of inflicting damage of a similar scale on U.S. exporters.
We then recount a number of emulation cases where foreign governments have started
implementing protectionist measures on local procurement.
41
Case 1: Harm toward Canadian firms
IPEX Inc. has been a Canadian exporter of thermoplastic pipes to the United States for 60 years.
It recently landed a contract to supply plastic piping to a new health‐care center at Camp
Pendleton Marine Base in California. In May 2009, the pipes had to be ripped out of the ground
because they were labeled with the words “Made in Canada.”90 IPEX has since lost contracts
from U.S. municipalities and has not been allowed to bid on numerous U.S. projects.
Company X is a market leader in aeration equipment for waste water projects. As a result of
Buy American, its customers, mostly municipalities, now have to apply for a waiver to use the
firm’s equipment. This has affected 90 percent of the firm’s projects. Furthermore, U.S.
competitors have been using the Buy American amendment to force municipalities to reopen
contracts and award the projects to them instead of Company X.
Company Y has been universally described as an innovative and environmentally‐friendly
company. Most of the firm’s customers are municipalities and utilities. As a result of Buy
American, company Y had to move some of its production and distribution facilities across the
border to the United States. The relocation entailed at higher costs, since the firm’s supply
chains are mostly based in Canada.
Case 2: Burden on local companies
Canadian communities, angered by Buy American, have started a campaign to buy goods from
countries that do not discriminate against Canadian products. Aquarius Technologies is a
company from Wisconsin that makes equipment to treat sewage. The firm states that it will see
25 percent of its business disappear as a result of the Canadian reaction.91 Furthermore, the
firm uses a significant input that is only available in Canada. In the wake of Buy American, the
firm is seeking an expensive and time‐consuming work‐around for that input. The U.S. waiver
90 Whittington, Les. “Buy‐American rules shutting out Canadians” Ottawa Bureau, The Star. May 6, 2009. Available at http://www.thestar.com/news/canada/article/629729 (accessed February 9th, 2010). 91 Fritsch, Peter and Corey Boles. “How ‘Buy American’ Can Hurt U.S. Firms.” The Wall Street Journal. September 17, 2009 (available at http://online.wsj.com/article/SB125306012124114135.html?mg=com‐wsj). Accessed on February 9, 2010.
42
process is useless because waivers cannot be used by manufacturers to qualify imported
Canadian products for purposes of bidding on stimulus projects; waivers can only be used
directly by municipalities. Many water projects are stalled as a result.
Case 3: Municipal Retaliation
On April 15, 2009, the Canadian town of Halton Hills passed a resolution requesting all
municipalities in Canada to adopt a procurement policy that would only source from companies
whose countries do not impose trade restrictions against Canadian goods. This resolution was
later supported by Temiskaming Shores, Marystown and other municipalities. On June 6, 2009,
the Federation of Canadian Municipalities (FCM) adopted a fair trade resolution by the FCM’s
membership that endorses countervailing procurement measures against Buy American but
held back from implementing it for 120 days to give Canadian and U.S. officials time to reach an
agreement.92 These retaliatory efforts were significant in alerting U.S. companies to the
potential business they might lose. The Water and Wastewater Equipment Manufacturers
Association was particularly energized since its members sell a great deal to Canada and could
suffer huge losses from Canadian retaliation.93
Case 4: Losing U.S. Jobs
Duferco Farrell Corp, a Swiss‐Russian partnership, took over a previously bankrupt U.S. steel
plant in the 1990s near Pittsburgh. The plant manufactures coils using steel slabs that are not
sold commercially in the United States. The introduction of these foreign slabs mean that the
company’s coils do not fit the current definition of “made in the United States of America.”
With the new Buy American provisions so broadly interpreted, Duferco Farrell is on the verge of
shutting down. When its largest client—a steel pipemaker located just down the road—
cancelled its orders from Duferco Farrell in order to buy from companies with 100 percent U.S.
production to meet the new regulations, Duferco Farrell had to furlough 80 percent of its
92 Resolution Text. “One Hundred Twenty Days for Fair Trade Deal, Say Municipalities.” June 6, 2009. Available at http://www.fcm.ca/English/View.asp?mp=1055&x=1139 (accessed on February 9, 2010). 93 Retaliatory efforts were suspended in October 2009, because FCM officials were encouraged by talks between Canadian and U.S. officials. President’s Statement. “FCM Suspends Buy American Deadline.” October 3, 2009. Available at http://www.fcm.ca/English/View.asp?mp=1055&x=1200 (accessed on February 9, 2010).
43
workforce. “You need to tell me how inhibiting business between two companies located one
mile apart is going to save American jobs,” said Bob Miller, Duferco Farrell’s executive vice
president. “I’ve got 600 United Steel Workers out there who are going got lose their jobs
because of this. And you tell me this is good for America?”94
Case 5: U.S. recovery projects delayed
Officials from five federal agencies—the Departments of Commerce, Education, Homeland
Security, Housing and Urban Development, as well as the Environmental Protection Agency
have stated that Buy American has affected their ability, directly and indirectly, to select or
start Recovery Act projects. Two states and one local entity have echoed the delay in timing. In
particular, the Transportation Security Administration’s Electronic Baggage Screening Program
implemented by Homeland Security has been hampered as officials await a Buy American
waiver to allow contractors to use foreign‐made components. This waiver is necessary because
U.S.‐made components are not compatible with the security systems at some airports. Similar
problems are being faced by the Chicago Housing Authority where the only security cameras
compatible with its existing system and the City of Chicago police systems are not made in the
United States.95
Lessons Learned
The experiences of the Canadian companies and communities as well as U.S. federal agencies
and firms highlighted above are faced by many others. While the primary objective of the Buy
American amendment is to favor U.S. manufacturers and create U.S. jobs in ARRA projects, the
actual outcomes are not clear‐cut.
94 Faiola, Anthony and Lori Montgomery. “Trade Wars Brewing in Economic Malaise” The Washington Post. May 15, 2009. Available at http://www.washingtonpost.com/wp‐dyn/content/article/2009/05/14/AR2009051404241.html (accessed March 2, 2010). 95 Government Accountability Office. “Recovery Act: Project Selection and Starts are Influenced by Certain Federal Requirements and Other Factors” February 2010. Available at http://www.gao.gov/new.items/d10383.pdf (accessed on March 1, 2010).
44
Canada and the United States share integrated supply chains. Many products are shipped back
and forth across the border before they are marketable. However, the final “Made in Canada”
or “Made in United States” label is normally slapped on the product only at the point of final
assembly. Buy American interrupted these supply chains by targeting intermediate components
that have a “Made in Canada” label, not considering how much of the component could
actually have been produced by U.S. workers and companies.
The plight of Duferco Farrell highlights the full negative extent of Buy American for U.S. workers.
This company, which has its plant in the United States, will be forced to lay off its 600 United
Steel workers since its product does not meet the “Made in United States of America” standard.
Given the current unemployment rate and the slow economic growth, these workers are
unlikely to find new employment in the near future. This creates an unnecessary strain on the
public safety net, since the workers would have been employed otherwise.
Another example comes from IPEX Inc. The firm has production plants both in Canada and the
United States. The resin used to make pipes actually comes from Texas. The U.S. content in IPEX
products is ranges from 70 percent to 90 percent. However, since the pipes are assembled in
Canada, their label causes them to be rejected for all projects funded by stimulus money. This is
ironic because a good part of the blow is felt by the IPEX resin plant in Texas. The irony is
compounded when U.S. companies buy semi‐finished products from Asia and transform them
domestically, in adherence to Buy American, resulting in a lower U.S. content in the end
product.
The inability of company X and IPEX Inc. to bid on projects or ensure smooth delivery shuts
them out of the U.S. market. This effectively limits the competition for the qualifying U.S.
companies. Without more choice, the municipalities are forced to pay higher prices. The result
is that municipalities can undertake fewer projects with their stimulus dollars. While some
manufacturing firms are no doubt pleased, this seems unfair to average citizens.
45
Company Y’s plight is not rare. A number of Canadian companies have had to move production
or distribution facilities across the border to the United States. In the short run, this means
more jobs for the United States; in the long run, it means higher costs and less efficient supplier
networks. Costs and delays are ultimately passed on to customers, in this case the
municipalities armed with stimulus money.
Delays are worth emphasizing. When IPEX pipes have to be ripped out, when U.S. Federal and
municipal agencies have to wade through different waiver processes in order to implement
beneficial programs, or even when municipalities have to ponder the complex rules of origin
that are baked in the cake with Buy American legislation, projects are delayed. Delay means
that the recovery process is that much longer.
Also worth emphasizing is that some of the Federal and local projects held up by the Buy
American mandate are crucial national security facilities—illustrated by Homeland Security
baggage screening programs and security cameras in Chicago.
Lastly, it is important to note that overworked municipal staff may not have the time to
decipher what can and cannot be bought with stimulus money. Consequently, municipalities
may turn around and buy local for everything, going well beyond the letter of Buy American,
even for procurement funded by the municipality’s own money. For convenience, the
municipality may use just one supplier for a given line, and stick to the same supplier for
everything. This means a U.S. supplier, for better or worse.
Happy ending?
As a result of the economic nonsense created by Buy American, and pressure on both sides of
the border, Canada and the United States reached a tentative agreement on government
procurement on February 5, 2010.96 Both countries agree to permanent and reciprocal
96 United States Trade Representative. “U.S.‐Canada joint statement on government procurement” February 5, 2010. Available at http://www.ustr.gov/about‐us/press‐office/press‐releases/2010/february/us‐canada‐joint‐statement‐government‐procurement (accessed on February 9, 2010).
46
commitments under the World Trade Organization (WTO) Government Procurement
Agreement (GPA) with respect to provincial, territorial, and state procurement. Canada agreed
to provide U.S. suppliers with access to a range of construction contracts across provinces,
territories, and a number of municipalities. In return, the United States has agreed to provide
Canadian suppliers with access to state and local public works projects in a range of programs
funded by ARRA.
This agreement, if implemented, will not help companies based in countries other than Canada,
but the measures taken by Canadians served to show how much U.S. companies stand to lose
when the U.S. government adopts protectionist policies. In this instance, the self‐interest of
firms linked across the world by supply chains, coupled with the real threat of retaliation, may
yet correct a misguided policy adopted at a time when the world economy seemed to be
plunging into a crevasse.
Months of intense negotiations between the U.S. and Canadian governments were required to
reach the bilateral February 2010 agreement. This, combined with the unique depth of the U.S.‐
Canadian economic relationship, means that similar bilateral U.S. government procurement
deals with other large trading partners are unlikely to be feasible. Renewed multilateral policy
initiatives will therefore be required to sustain the positive momentum generated by the U.S.‐
Canadian agreement.
Indeed, this agreement will not by itself contain the damage that Buy American has triggered.
On January 18th 2010, Global Trade Alert published two “Public Procurement” protectionist
measures implemented by China and Japan.97 A number of eastern coastal provinces in China
are giving priority to locally manufactured products like automobiles and home appliances for
local procurement and purchases. Furthermore, these companies are required to source raw
97 “China: ‘Buy local’ clauses at the provincial level.” Global Trade Alert. See http://www.globaltradealert.org/measure/china‐buy‐local‐clauses‐provincial‐level (accessed march 2, 2010). “Japan: ‘Buy local’ at the provincial level.” Global Trade Alert. See http://www.globaltradealert.org/measure/japan‐buy‐local‐provincial‐level (accessed march 2, 2010)
47
materials or equipment locally as well. In Japan, a few local governments as well have
implemented policies to encourage local purchases of manufactured goods such as cars, TV sets,
and other electronic equipment. While these implemented measures were not announced as a
direct retaliation against Buy American, like the Canadian municipalities, they are evidence of a
much larger problem: emulation of protectionist policies. When the United States falls back on
protectionist measures, those actions provide an implicit blessing for other countries to follow
suit. The Obama Administration must stop this parade before more American firms, American
cities, and American people are harmed.
Perhaps the Biggest Loss From Buy America Is What Should Have Been
Direct retaliation by foreign governments against the Buy American legislation has so far been
relatively muted and, in the case of Canada, further damage has been averted though the
bilateral agreement just described. However, the broader impact of the Buy American
legislation does not require direct retaliation to translate potential damage into actual damage.
First there is the problem, described in section III, of “Congressional copycatting.” Once the
language of Buy American has been enacted in a significant piece of legislation, the provision
gets on political autopilot to be inserted into future legislation. It takes too much political
capital on the part of opposition Congressmen to remove the offending provision. Only the
president can take a stand.
Second, and longer term, though far bigger is the “reputational risk” associated with Buy
American. Trade liberalization has historically played a crucial role in U.S. trade expansion. Since
World War II, successive rounds of multilateral trade liberalization coupled with unilateral
liberalization at home and abroad, and free trade agreements, have sharply reduced barriers
both to U.S. exports and U.S. imports. According to Hufbauer (2008), postwar globalization has
contributed $1 trillion to the U.S. economy each year.98 Adler and Hufbauer (2009) estimate
that about a quarter of total U.S. trade growth between 1980 and 2004 can be attributed to
98 See Bradford, Grieco, and Hufbauer (2005) for the underlying study.
48
lower tariff and non‐tariff barriers in the United States and abroad (the remainder of U.S. trade
expansion comes from rising U.S. and foreign income levels, technological innovation and
declining trade costs).
“Reputational risk” can be thought of as the risk that—in the absence of the traditional U.S.
leadership role—the long‐term historical trend toward greater policy liberalization will grind to
a halt. A large share of potential future trade expansion could therefore be forfeited by the
world’s trading nations, as a consequence of their departure from the historical path of steady
ongoing trade liberalization. Even optimistically assuming that the world trading system does
not go backwards thanks to retaliatory measures, but merely stops moving forward at its
historical rates, very serious costs would be visited on the United States and the rest of the
world.
We described how the approximate number of U.S. jobs saved or created by Buy American, at
perhaps 43,000, is quite modest. The importance of continuing trade liberalization is easily a
different order of magnitude than the direct short‐term employment gains from the Buy
American provision. If President Obama’s goal of doubling U.S. exports for instance falls short
by the 25 percent implied by Adler and Hufbauer (2009), as a result of forfeited future trade
liberalization, a back‐of‐the‐envelope calculation suggests that a quarter of President Obama’s
associated 2 million jobs, or perhaps 500,000 jobs, might never be created.
49
VI President Obama Shifts His Trade Policy Stance
The election in 2008 of President Obama and his large Congressional majorities followed the
most protectionist U.S. election campaign in decades. Correspondingly, during the first year of
his administration, President Obama (and the 111th Congress) pursued what generously has
been termed a “passive free trade agenda”99—rhetorically in favor of liberal trade, but willing
to commit only just enough political capital to avoid outrageously protectionist initiatives.
This “damage mitigation” approach to trade was most clearly evident during the first “Buy
American” debate in February 2009, when the Obama Administration—rather than forcefully
persuading Congress to scrap the Buy American provision—only asked for an amendment to
the American Recovery and Reconstruction Act (ARRA) to prevent the stimulus bill from
overriding and thus violating existing U.S. trade agreements.100
This early response set the tone for almost the rest of 2009. The Obama Administration trade
policy agenda focused on defensive “trade enforcement actions,” largely with an objective of
limiting politically sensitive imports into the U.S. market (see section III for details on specific
cases). At the same time, the Administration sought to reduce foreign restrictions on U.S.
agricultural exports.
The Obama Administration did not pursue the Bush Administration’s agenda of pushing for
Congressional ratification of completed bilateral free trade agreements with U.S. friends and
allies, namely Panama, Columbia and South Korea. Instead the President’s initial Trade Policy
Agenda, published by USTR in late February 2009,101 called for “a review the implementation of
our FTAs and bilateral investment treaties (BITs) to ensure that they advance the public interest.”
99 See for instance VanGrassek (2009), Building without BRICs: Lessons from the “Buy American” Debate. Bridges Volume 13, Number 1, March 2009. Available at http://ictsd.net/news/bridges/44271. See also Barsfield and Levy (2007), In Search of an Obama Trade Policy, August 2009. Available at http://www.aei.org/docLib/20090805‐IEO‐Aug‐2009g.pdf. 100 See Hufbauer and Schott (2009) for a detailed discussion about the interplay between the Buy American provision of ARRA and existing U.S. trade agreements. 101 “The President’s Trade Policy Agenda.” United States Trade Representative (USTR). Available at http://www.ustr.gov/sites/default/files/uploads/reports/2009/asset_upload_file810_15401.pdf.
50
While expressing the hope to move forward on ratification of the Panama FTA, the Trade Policy
Agenda established new and unspecified “benchmarks for progress” on the economically
important Colombia and South Korea trade deals. Concrete new proposals by the Obama
Administration to conclude the multilateral Doha Round in the WTO were not announced.
Lastly, it should be repeated, aspects of the government’s bail‐outs for the U.S. auto industry,
designed early in 2009, might violate existing WTO rules on subsidies and certainly departed
from the prior U.S. negotiating position, which advocated tighter rules on subsidies.102
Late in 2009, the Obama Administration was rethinking its initial neglect of trade. On December
14, 2009, the Obama Administration announced its intention to engage in talks with the Trans‐
Pacific‐Partnership (TPP), an intended “high‐standard regional FTA” that could link the United
States with countries in the Asia‐Pacific region.103 Most dramatically, President Obama, in his
State of The Union Address to Congress on January 27, 2010, announced the verifiable goal of
“doubling U.S. exports over the next five years,” a goal that would entail more than $1,500
billion in additional foreign sales of U.S. goods and services early in a potential second Obama
term. If achieved, conceivably this goal would reduce the U.S. trade deficit in goods and
services by $250 to $300 billion, which in turn could support an additional 2 million U.S. jobs.104
The daunting scale of President Obama’s export goal must be emphasized and is illustrated by
the historical record of U.S. exports. Only during the highly inflationary 1970s and early 1980s
have U.S. exports of goods and services doubled in current dollar terms during any 5‐year
102 This position was formulated by the Bush Administration early in the Doha Round. See Brunel, Claire, and Gary Hufbauer. 2009. “Money for the Auto Industry: Consistent With WTO Rules?” Policy Brief 09‐4. Washington: Peterson Institute for International Economics. 103 See USTR website for an overview at http://www.ustr.gov/about‐us/press‐office/fact‐sheets/2009/december/tpp‐statements‐and‐actions‐date. Currently, the TPP process includes Australia, Brunei, Chile, New Zealand, Peru, Singapore, and Vietnam, but is intended to expand to the entire region. 104 The calculation of U.S. jobs is based on a coefficient of direct and indirect employment of 7,000 to 8,000 jobs per billion dollars of exports. We assume that a rise in exports of $1,500 billion over 5 years would be accompanied by a rise in imports of at least $1,200 billion over the same period. It should be noted that our estimated coefficient of 7,000 to 8,000 jobs/$1 billion of additional exports is more optimistic than the 6,000 jobs/$1 billion mentioned by President Obama in his remarks at the U.S. Export‐Import Bank on March 11, 2010 (available at http://www.whitehouse.gov/the‐press‐office/remarks‐president‐export‐import‐banks‐annual‐conference). However, the President’s more conservative jobs coefficient may prove correct for 2015, given the rapid productivity growth in export industries.
51
period since 1960.105 Measured in real dollar terms, this has never been achieved.106 To tackle
this challenge, in his State of the Union Address, the President announced a “National Export
Initiative” (NEI) aimed at assisting U.S. farmers and small businesses in increasing their exports,
as well as an intended reform of America’s existing national security related export controls.
Concrete details about the Administration’s new trade initiatives have gradually been
announced to the public since the State of the Union Address. Commerce Secretary Locke in
remarks on February 4, 2010, indicated that the NEI will include at least three principal
activities:107
1) Additional funding for export promotion and the establishment of a an Export
Promotion Cabinet, reporting to the president, and consisting of top representatives
from the Commerce, Treasury and State Departments, the Department of Agriculture,
the Export‐Import Bank, the United States Trade Representative and the Small Business
Administration.
2) Improving access to credit for small‐ and medium‐sized business firms with an interest
in exporting.
3) Continuing enforcement of international trade laws to help remove barriers that
prevent U.S. companies from getting open and fair access to foreign markets.
Then on March 11, 2010, President Obama himself delivered remarks at the Export‐Import
Bank of the United States and offered further details on the content of the NEI:108
1) The Export Promotion Cabinet has been established by Presidential Executive Order 105 U.S current dollar exports rose by more than 100 percent during the 5‐year periods 1968‐77, 1975‐80, and 1976‐81. Data from BEA Table 1: U.S. International Transactions, available at http://www.bea.gov/international/index.htm#bop. 106 Data from NIPA table 4.2.3, Bureau of Economic Analysis. Available at http://www.bea.gov/national/nipaweb/SelectTable.asp?Selected=N. 107 For full text of speech, “Secretary of Commerce Gary Locke National Exports Initiative Remarks.” Department of Commerce. Available at http://www.commerce.gov/NewsRoom/SecretarySpeeches/PROD01_008893. See also “Back to Basics” Creating New Jobs with the National Export Initiative.” The White House Blog. Available at http://www.whitehouse.gov/blog/2010/02/04/back‐basics‐creating‐new‐jobs‐with‐national‐export‐initiative. 108 Text of the President’s remarks is available at http://www.whitehouse.gov/the‐press‐office/remarks‐president‐export‐import‐banks‐annual‐conference.
52
2) The creation of the President’s Export Council, a private sector advisory committee on
international trade, initially chaired by the CEO of The Boeing Company James
McNerney, with the CEO of Xerox Corporation Ursula M. Burns as vice‐chair
3) The authorization of an additional $10 billion in trade financing capacity for the Export‐
Import Bank, starting the first quarter of 2010; this boost roughly matches the pace of
expansion of Export‐Import Bank expansion during FY2009.
4) The authorization of an additional $2 billion in annual trade financing available from the
Export‐Import Bank, earmarked to small and medium‐sized businesses.
5) The establishment of “one‐stop‐export‐shops” across to the United States and at U.S.
embassies and consulates abroad to assist U.S. exporters identify new overseas markets
6) Continued aggressive enforcement of existing U.S. trade agreements and IPR related
issues, including a proposed Anti‐Counterfeiting Trade Agreement (ACTA)109
7) Begin reform of the U.S. Export Control System through:
a. The introduction of a one‐time online technical review to sharply reduce
processing time for products with encryption capabilities (e.g., cell phones and
network storage devices)
b. Harmonizing diverging export standards for products sold to companies with
dual‐national and third‐country‐national employees.
It would be premature to assert that these recent declarations amount to “a new dawn” in the
form of a substantive policy shift by the Obama Administration toward a genuinely proactive
foreign economic policy agenda that will emphasize trade liberalization in the United States and
abroad. Recent statements may simply reflect the Administration’s desire to seize political high
ground in the jobs debate.
109 Discussions about ACTA, with the aim to establish international standards for enforcing intellectual property rights, were launched by the Bush Administration and the Japanese government in 2006. Initial negotiations began in 2008, with the participation of Australia, Canada, the EU, Japan, Mexico, Morocco, New Zealand, South Korea, Singapore, Switzerland and the United States. A comprehensive set of proposals or a draft negotiation text do not exist at this point. See USTR ACTA Summary at http://www.ustr.gov/sites/default/files/uploads/factsheets/2009/asset_upload_file917_15546.pdf. In 2008, total U.S. receipts of “Royalties and License Fees” amounted to approximately $91 billion, indicating that a successful ACTA agreement that raised such U.S. receipts by 20 percent would improve the U.S. external balance by about $18 billion dollars. See BEA Data at http://www.bea.gov/international/international_services.htm.
53
In fact, judging from President Obama’s framing of his new initiatives, jobs trump trade
liberalization. In the State of the Union Address, President Obama noted that fulfilling his new
export goal of doubling U.S. exports in 5 years “will support two million jobs in America.”
Statements by U.S. Trade Representative Ron Kirk on January 28, 2010, further declared that
“my talking to you about trade, goes back to the President's main point last night: it's all about
jobs. And if done right, President Obama and I firmly believe that a smart aggressive progressive
trade policy of the United States can be a critical part of our overall economic recovery
program.”110 And again on March 11th, 2010 President Obama was very explicit in his intention
to rely on exports to alleviate the current crisis in the U.S. labor market, when he stated “In a
time when millions of Americans are out of work, boosting our exports is a short‐term
imperative. Our exports support millions of American jobs…. Jobs that pay about 15 percent
more than average.”111
Newfound eagerness for trade initiatives therefore seems based on a view of trade
liberalization as a means to the urgent but short‐term goal of job creation, rather than as a way
of furthering the historic goal—embraced since the Second World War—of improving the
global climate for U.S. foreign and economic policy interests. In this respect, the current trade
policy agenda is similar to the way in which the Administration and Congressional leaders have
tried to marshal support for U.S. climate change legislation by emphasizing its potential for
“green job creation.”112
On March 1, 2010, the Office of the United States Trade Representative (USTR) released the
“2010 Trade Policy Agenda and 2009 Annual Report of the President of the United States on the
110 For full remarks see “Kirk Comments on Exports, U.S. Jobs” United States Trade Representative. http://www.ustr.gov/about‐us/press‐office/press‐releases/2010/january/kirk‐comments‐exports‐us‐jobs. 111 Full text available at http://www.whitehouse.gov/the‐press‐office/remarks‐president‐export‐import‐banks‐annual‐conference. 112 See Browner, Carol. “183 projects, 43 states, Tens of Thousands of High Quality Clean Energy Jobs.” The White House Blog. http://www.whitehouse.gov/blog/2010/01/08/183‐projects‐43‐states‐tens‐tthousands‐high‐quality‐clean‐energy‐jobs.
54
Trade Agreements Program.”113 The report highlights the 2010 trade priorities of the Obama
Administration and also an overview of 2009 trade activities and USTR initiatives. The central
2010 Obama trade agenda is, not surprisingly, focused on doubling U.S. exports in the next five
years.
While the Obama Administration’s trade agenda outline has been much anticipated and
welcomed, the report is lacking in details and specifics. Quoting Shea (2010) from White & Case,
“much of the language in the report appeared similar to the 2009 Trade Policy Agenda in terms
of general descriptions and vague policy outlines.”114 There is no clear indication of direction on
the pending FTAs with Panama, Colombia, and Korea and also no details on the U.S. negotiating
stance towards the stalled Doha Round, other than expressing the administration’s continuing
support.
New in the 2010 USTR report is the inclusion of more language on trade enforcement and
monitoring, especially keeping a close eye on the compliance of trading partners with trade
agreements and rules, both at the bilateral and multilateral level. The United States will also be
monitoring their compliance with labor and environmental provisions included in trade
agreements.
As well, the administration’s focus on exports and doubling them over the next five years is new
to the Trade Policy Agenda. New initiatives, focusing on exports, include the creation of an
Export Promotion cabinet comprising officials from different government agencies,
enforcement of international trade laws, combating foreign tariff and non‐tariff barriers, and
protecting intellectual property rights. Shea (2010) notes that the “administration’s outward
focus on U.S. exports will likely do little for U.S. trade policy and unlikely to do much for the
pending FTAs or stalled Doha Round. Instead the new focus on U.S. exports is likely to
113 Shea, James J. “USTR Releases 2010 Trade Policy Agenda.” White & Case. March 3, 2010. For full report, “2010 Trade Policy Agenda and 2009 Annual Report.” Office of United States Trade Representative. Available at http://www.ustr.gov/2010‐trade‐policy‐agenda (accessed March 5, 2010). 114 Shea (2010), page 6.
55
overshadow what some trade observers consider to be the more traditional elements of a
comprehensive U.S. trade policy.” Shea (2010) concludes that the 2010 U.S. trade agenda will
continue to be a “back‐burner” issue for the Obama Administration.
While this reality may not calm foreign apprehensions about America’s long‐term commitment
to all facets of trade liberalization, it does have several potential advantages. Foremost, the
United States cannot credibly promote exports while closing its own borders. Trade
liberalization, as seen from Hufbauer (2008), Adler and Hufbauer (2009), and other sources, has
historically proven to be essential for the expansion of both exports and imports. The
President’s commitment to dramatically increase U.S. exports practically ensures that the
Administration will take seriously the risk of side‐swiping major U.S. trading partners, such as
Canada, Japan, Mexico, China or the European Union. Hence, the Administration will likely
commit more political capital to resist future instances of Congressionally‐instigated
protectionism.
The pursuit of an “export‐led job creation strategy” by the United States will require an
extraordinary expansion of foreign sales to narrow the merchandise trade deficit, since larger
U.S. exports will almost certainly be accompanied by larger U.S. imports. The president’s
assertion that a doubling of U.S. exports would support 2 million new jobs rests on underlying
calculations that were not spelled out. Very likely the President’s advisors assumed that imports
would rise, by around $1,200 billion, against an export rise of $1,500 billion. The difference
between export and import growth would spell a contraction of the U.S. current account deficit
of around $300 billion annually. Assuming an optimistic “jobs coefficient” of around 7,000 to
8,000 jobs per billion dollars of exports, the jobs gain would be around 2 million. To generate a
serious number of export jobs at home and a sharp reduction in the trade deficit—at a time
when more than 8.4 million jobs have been lost and labor utilization has reached an historic
low—will require far‐reaching trade liberalization initiatives well beyond what the
administration has announced so far.
56
VII Policy Recommendations
While the Great Recession is gradually abating, the threat of new bouts of protection remains
high. Unemployment will continue to linger at politically critical levels in for a year or more, and
the fiscal implications of earlier bold policy actions may force a premature scaling back of
stimulus programs. At the same time, to spur domestic U.S. jobs, President Obama is politically
committed to an almost unprecedented doubling of American exports in five years. To stave off
the risk of renewed U.S. protectionism and to achieve his ambitious U.S. export expansion,
President Obama should announce several new policy initiatives;
1) Conclude the WTO Doha Development Agenda. Only an expeditious conclusion of the
current overdue WTO Round of multilateral trade negotiations has the potential to
provide the global economic stimulus and open the foreign trade opportunities
necessary for U.S. exports to achieve the goals set forth by President Obama in his
National Export Initiative. Ratifying pending U.S. bilateral trade agreements will not
suffice. Hufbauer, Schott, and Wong (2010) estimated that an ambitious Doha outcome
could achieve GDP gains of over $280 billion annually for participants in the Round. The
United States could realize $36 billion GDP gains annually, adding 0.3 percent to its 2007
GDP.115
2) Expedite the Final WTO Negotiating Process. Far too many WTO deadlines have come
and gone. Only through the explicit commitment of the personal political capital
possessed by President Obama and other G‐20 leaders can the remaining high profile
stumbling blocks be overcome. Trade ministers must be ordered by their respective
heads of government to seal the deal by a hard deadline through a “Desert Island
Negotiating Process” including only trade ministers themselves and a few senior aides.
There should be no access to the negotiating venue for representatives of the NGO
community or business lobbyists. Trade ministers should not leave before a final deal
has been agreed.
115 See Hufbauer, Schott, Adler, Brunel, and Wong (forthcoming) for the actual study.
57
3) Expand U.S. Export Financing. The Great Recession has shown how trade financing
matters.116 While recent Obama Administration proposals to boost the Export‐Import
Bank of the United States are helpful, much more money is needed. To help double U.S.
exports in five years, during a period when private commercial bank export financing
will be adversely affected by the losses of 2009, the Obama Administration should
commit to quadruple official U.S. export support through the Export‐Import Bank of the
United States to $100 billion a year. This would bring U.S. official export assistance
about in line with other major industrialized countries, greatly assist U.S. exporters of
expensive capital goods and open new export opportunities for U.S. small and medium
sized enterprises (a group of U.S. firms that has historically had little export experience).
In addition, and more important, the U.S. government should provide tax incentives for
banks to provide export credits for small and medium enterprises.
4) Reform the U.S. Corporate Tax Code. America’s biggest exporters are its multinational
companies, whose overseas activities stimulate the final sales of U.S. made goods and
services abroad and facilitate international intra‐company trade through global
production networks. The U.S. corporate tax code must stop penalizing the global
activities of this crucial group of America’s most competitive firms. The tax law should
be reformed by lowering U.S. corporate tax rates while expanding the corporate tax
base. The United States should end its world‐wide corporate taxation system and
associated foreign tax credits, and instead (similar to other advanced countries) adopt a
territorial tax system. Active income from the foreign operations of U.S. multinational
corporations should not be taxed in America.
5) Reform the U.S. Export Control System. Extensive restrictions on U.S. exports of
advanced technology products remain in place today. Despite recent statements of
Administration intentions to liberalize certain parts of the U.S. export control system, a
far more comprehensive approach is needed to make a difference. Many restrictions are
leftovers from the Cold War era in the form of lists that curtail foreign sales of so‐called
“dual‐use technologies”—items that can be used in both civilian activities and pursuits 116 See Amiti and Weinstein (2009) for a detailed historical analysis of the connection between exports and financial shocks.
58
potentially harmful to U.S. national security. It makes little sense to try to boost U.S.
exports on one hand, but then restrict sales of U.S. technology products on the other,
when those items are available from other sources or when the buyer is a friend of
America. The Obama Administration should put more emphasis on the issues of “foreign
availability” and “trusted customers” when it revises the lists of curtailed items.
6) Promote a Multilateral Expansion of the Existing Agreement on Government
Procurement (GPA). The U.S. and Canadian governments should build upon their recent
successful bilateral agreement on procurement by all levels of governments and
propose a new round of plurilateral GPA negotiations at the WTO. A joint U.S.‐Canadian
proposal to immediately extend the provisions of their bilateral agreement to all other
interested major trading partners, especially the European Union and Japan, on a
reciprocal basis would be a constructive foundation for such a deepening of the
multilateral GPA.
Renewed policy action to prevent protectionism cannot come from America alone. It is equally
imperative that the G‐20 should build upon its record of success in coordinating global crisis
management and live up to its strong rhetorical commitment to “do whatever is necessary to
promote global trade and reject protectionism.”117 As part of their shift to a post‐crisis agenda,
G‐20 leaders should therefore take the following three initiatives.
1) Appoint a G‐20 Group of “Trade Wisemen” to Establish the “I Know It When I See It
Doctrine”118 against Trade Protectionism. To prevent future tit‐for‐tat protectionist
spirals, it is necessary to move beyond the focus on a “legal” definition (namely,
whether a new measure is strictly compatible with WTO rules) and focus on a broader 117 Leaders’ statement at the April 2nd G‐20 Summit in London, “The Global Plan for Recovery and Reform” available at http://www.g20.org/Documents/final‐communique.pdf. The G‐20 leaders have at each summit in Washington, November 15th 2008; London, April 2nd 2009 and Pittsburgh September 24‐25th 2009 reaffirmed commitments to promote global trade and reject protectionism. 118 U.S. Supreme Court Justice Potter Stewart in his 1964 concurring opinion on Jacobellis v. Ohio 378 U.S. 184 noted that in the description of a threshold of obscenity that “under the First and Fourteenth Amendments, criminal laws in this area are constitutionally limited to hard core pornography. I shall not today attempt further to define the kinds of material I understand to be embraced within that shorthand description, and perhaps I could never succeed in intelligibly doing so. But I know it when I see it [emphasis added], and the motion picture involved in this case is not that.” Full court text, “Jacobellis v. Ohio, 378 U.S. 184 (1964).” U.S. Supreme Court Center. Available at http://supreme.justia.com/us/378/184/case.html.
59
“consequences” identification of protectionist measures. Under this approach, a
measure should be of concern when it leads to justifiable demands, on the part of
trading partners, for emulation or retaliation. The G‐20 should consequently appoint a
small group of widely recognized and globally representative trade experts to quickly
identify new government initiatives, whether WTO compliant or not, that constitute
“protectionism in a political sense.”119 This high‐profile naming‐and‐shaming exercise
could have a powerful preventive effect and could possibly initially only cover the G‐20’s
own membership. We commend respected trade persona, such as Ernesto Zedillo, Carla
Hills, Peter Sutherland, Ross Garnaut, Long Yongtu or Zhu Rongji, as potential “G‐20
Wisemen.”
2) Expedite the WTO’s Dispute Settlement Mechanism. Faster determinations are
imperative if “illicit gains” from implementing novel protectionist measures are to be
minimized. Regrettably, the principal international means of deterring new
protectionism, the WTO Dispute Settlement Mechanism (DSM), currently takes a long
time to issue a definitive ruling, and delay provides an incentive for countries to try out
doubtful policies. Scofflaws know that it can take the panel and the Appellate Body
three or four years to issue an adverse decision. Political and economic gains sought by
a protectionist government may be reaped long before the WTO finally authorizes
aggrieved parties the right to retaliate.120 The G‐20 should spearhead a push to expedite
the WTO DSM process. The first step might involve the appointment of a permanent
group of “WTO Panelists,” based near the WTO in Geneva, who could start work
immediately when a case is filed. This group of “trial jurists” would complement the
sitting Appellate Body, and avoid the long delays that are now encountered in
establishing panels constituted of experts based in distant cities, and arranging for their
meetings in Geneva.
3) Establish a Regular G‐20 Trade Ministers Meeting. The G‐20 leaders, at their first
meeting in Washington in November 2008, tasked their trade ministers with concluding
119 The work of this group could build on the web‐based Global Trade Alert (http://www.globaltradealert.org/), which has for some time published instances of broadly defined new protectionist measures. 120 The U.S. steel tariffs imposed in 2002 were a classic example.
60
the WTO’s Doha Development Round, and pledged to “stand ready to assist directly, as
necessary.”121 In these difficult times, trade ministers need all the assistance they can
get from their G‐20 leaders. Tough issues that block the Doha Development Round, as
well as fresh conflicts sparked by episodes of protection, invariably involve high politics.
Today’s circumstances require that trade issues be brought directly into the G‐20
process, similar to the manner in which finance ministers meet independently and
alongside their political leaders. To ensure broad representation of the multilateral
trading system at regular G‐20 Trade Ministers Meetings, the Director General of the
WTO should serve as the chair.
121 See G‐20 Declaration after the Washington Summit, “Declaration Summit on Financial Markets and the World Economy,” November 25th 2008, available at http://www.g20.org/Documents/g20_summit_declaration.pdf.
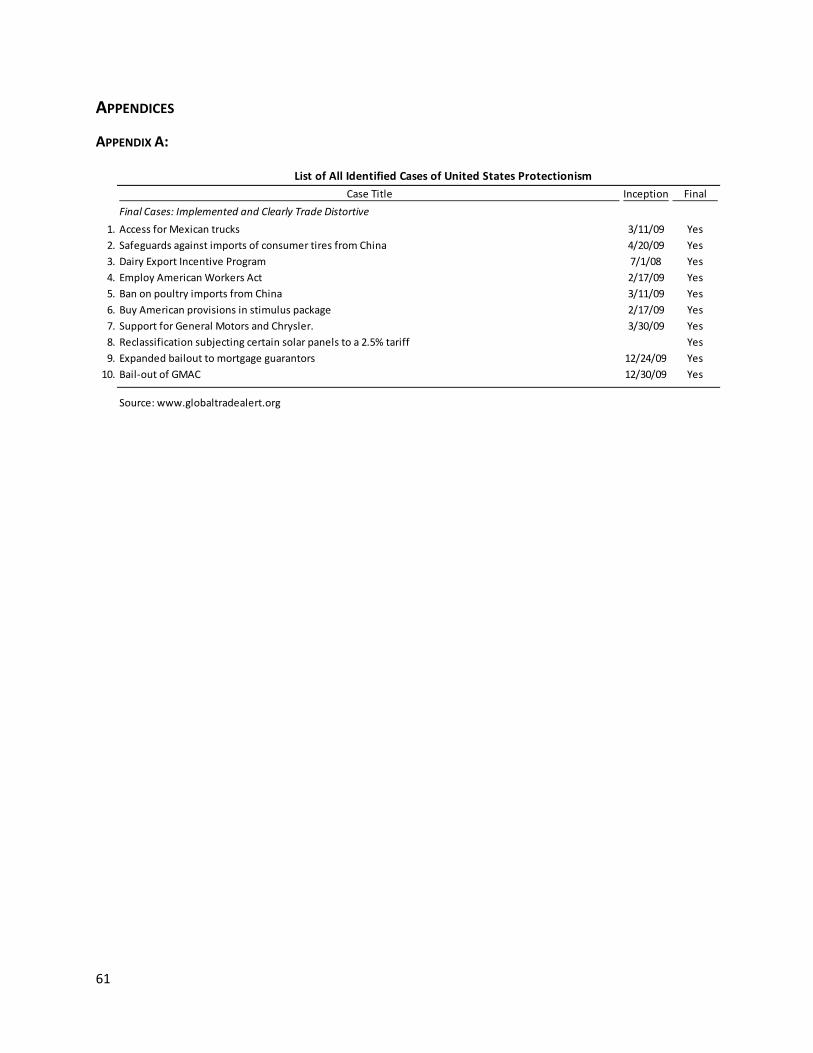
61
APPENDICES
APPENDIX A:
List of All Identified Cases of United States Protectionism
Case Title Inception Final
Final Cases: Implemented and Clearly Trade Distortive
1. Access for Mexican trucks 3/11/09 Yes2. Safeguards against imports of consumer tires from China 4/20/09 Yes3. Dairy Export Incentive Program 7/1/08 Yes4. Employ American Workers Act 2/17/09 Yes5. Ban on poultry imports from China 3/11/09 Yes6. Buy American provisions in stimulus package 2/17/09 Yes7. Support for General Motors and Chrysler. 3/30/09 Yes8. Reclassification subjecting certain solar panels to a 2.5% tariff Yes9. Expanded bailout to mortgage guarantors 12/24/09 Yes10. Bail‐out of GMAC 12/30/09 Yes
Source: www.globaltradealert.org
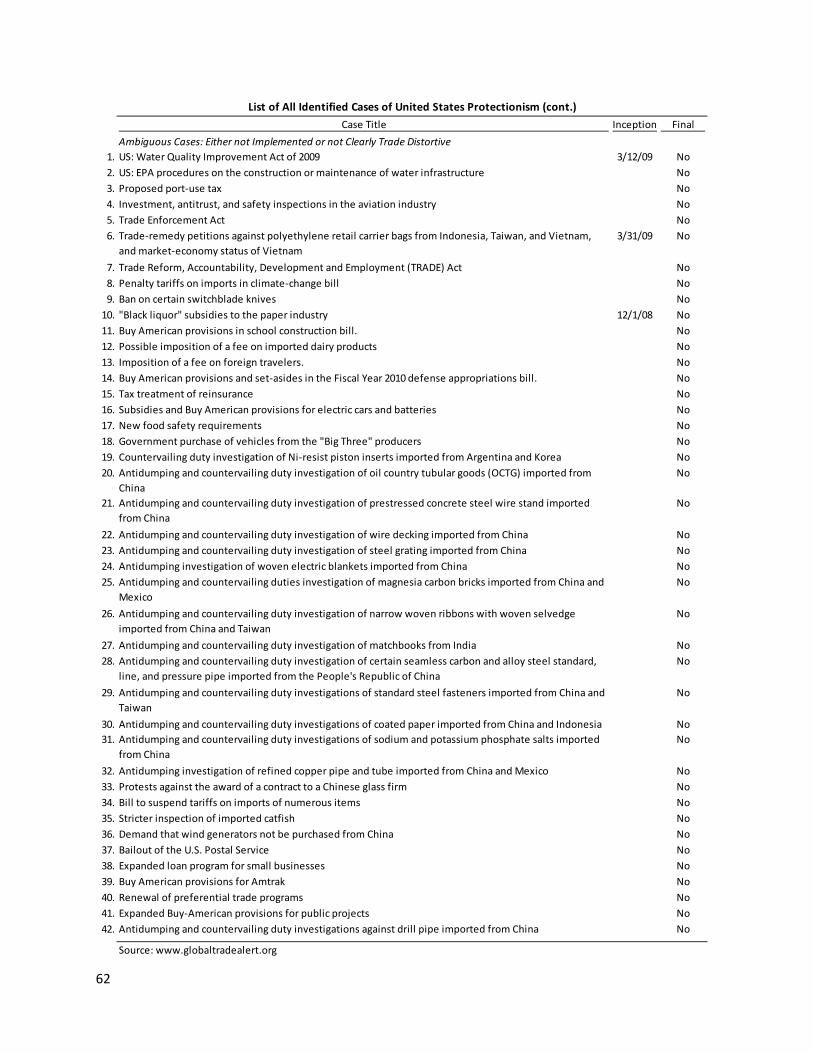
62
List of All Identified Cases of United States Protectionism (cont.)
Case Title Inception Final
Ambiguous Cases: Either not Implemented or not Clearly Trade Distortive 1. US: Water Quality Improvement Act of 2009 3/12/09 No2. US: EPA procedures on the construction or maintenance of water infrastructure No3. Proposed port‐use tax No4. Investment, antitrust, and safety inspections in the aviation industry No5. Trade Enforcement Act No6. Trade‐remedy petitions against polyethylene retail carrier bags from Indonesia, Taiwan, and Vietnam,
and market‐economy status of Vietnam3/31/09 No
7. Trade Reform, Accountability, Development and Employment (TRADE) Act No8. Penalty tariffs on imports in climate‐change bill No9. Ban on certain switchblade knives No10. "Black liquor" subsidies to the paper industry 12/1/08 No11. Buy American provisions in school construction bill. No12. Possible imposition of a fee on imported dairy products No13. Imposition of a fee on foreign travelers. No14. Buy American provisions and set‐asides in the Fiscal Year 2010 defense appropriations bill. No15. Tax treatment of reinsurance No16. Subsidies and Buy American provisions for electric cars and batteries No17. New food safety requirements No18. Government purchase of vehicles from the "Big Three" producers No19. Countervailing duty investigation of Ni‐resist piston inserts imported from Argentina and Korea No20. Antidumping and countervailing duty investigation of oil country tubular goods (OCTG) imported from
ChinaNo
21. Antidumping and countervailing duty investigation of prestressed concrete steel wire stand imported from China
No
22. Antidumping and countervailing duty investigation of wire decking imported from China No23. Antidumping and countervailing duty investigation of steel grating imported from China No24. Antidumping investigation of woven electric blankets imported from China No25. Antidumping and countervailing duties investigation of magnesia carbon bricks imported from China and
MexicoNo
26. Antidumping and countervailing duty investigation of narrow woven ribbons with woven selvedge imported from China and Taiwan
No
27. Antidumping and countervailing duty investigation of matchbooks from India No28. Antidumping and countervailing duty investigation of certain seamless carbon and alloy steel standard,
line, and pressure pipe imported from the People's Republic of ChinaNo
29. Antidumping and countervailing duty investigations of standard steel fasteners imported from China and Taiwan
No
30. Antidumping and countervailing duty investigations of coated paper imported from China and Indonesia No31. Antidumping and countervailing duty investigations of sodium and potassium phosphate salts imported
from ChinaNo
32. Antidumping investigation of refined copper pipe and tube imported from China and Mexico No33. Protests against the award of a contract to a Chinese glass firm No34. Bill to suspend tariffs on imports of numerous items No35. Stricter inspection of imported catfish No36. Demand that wind generators not be purchased from China No37. Bailout of the U.S. Postal Service No38. Expanded loan program for small businesses No39. Buy American provisions for Amtrak No40. Renewal of preferential trade programs No41. Expanded Buy‐American provisions for public projects No42. Antidumping and countervailing duty investigations against drill pipe imported from China No
Source: www.globaltradealert.org
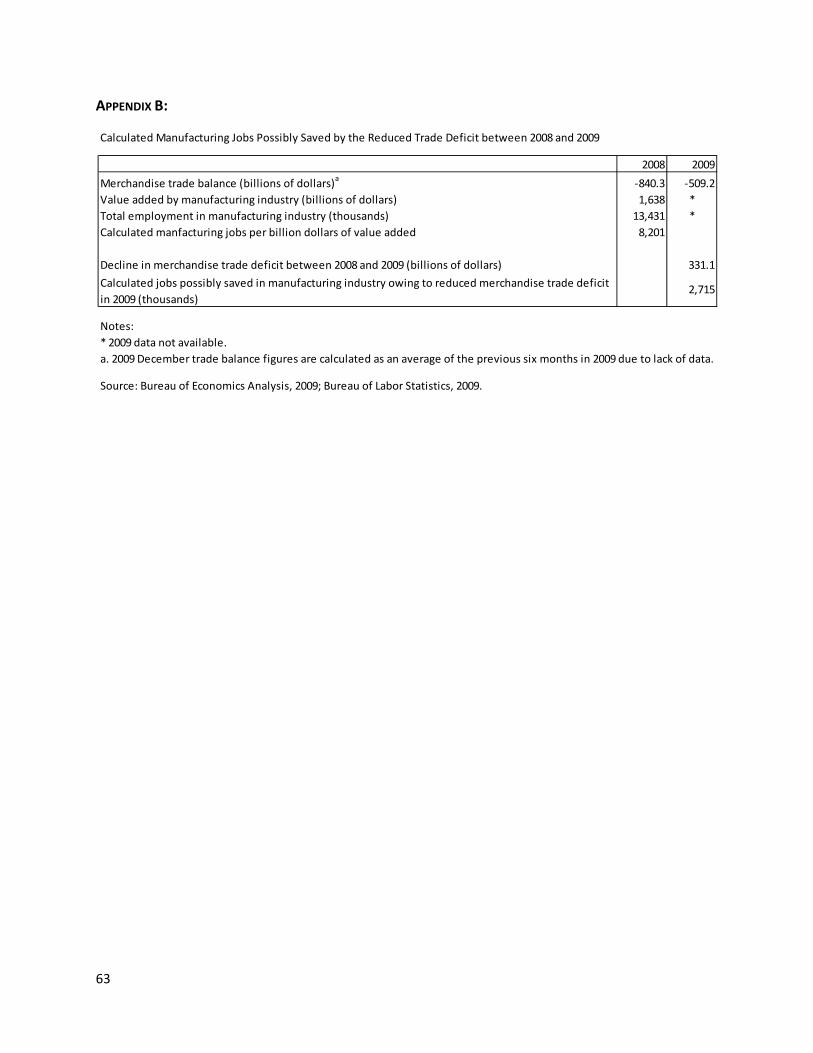
63
APPENDIX B:
Calculated Manufacturing Jobs Possibly Saved by the Reduced Trade Deficit between 2008 and 2009
2008 2009
Merchandise trade balance (billions of dollars)a ‐840.3 ‐509.2Value added by manufacturing industry (billions of dollars) 1,638 *Total employment in manufacturing industry (thousands) 13,431 *Calculated manfacturing jobs per billion dollars of value added 8,201
Decline in merchandise trade deficit between 2008 and 2009 (billions of dollars) 331.1
Notes:* 2009 data not available.a. 2009 December trade balance figures are calculated as an average of the previous six months in 2009 due to lack of data.
Source: Bureau of Economics Analysis, 2009; Bureau of Labor Statistics, 2009.
Calculated jobs possibly saved in manufacturing industry owing to reduced merchandise trade deficit in 2009 (thousands)
2,715
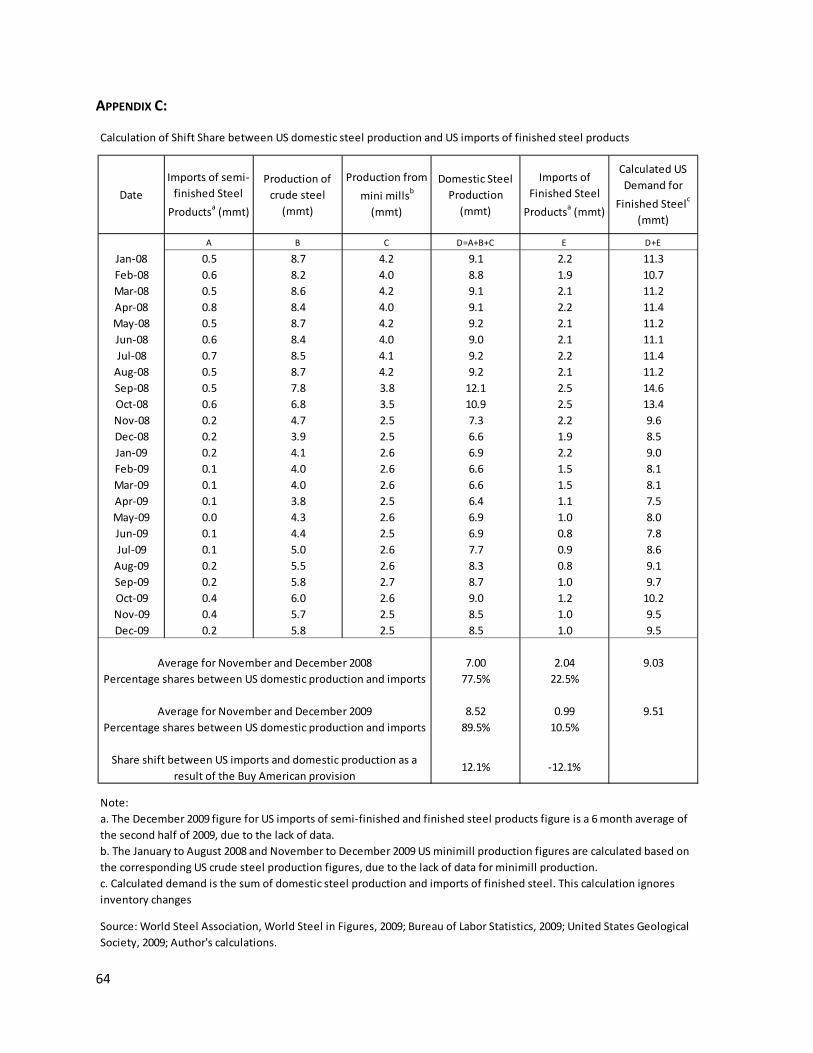
64
APPENDIX C:
A B C D=A+B+C E D+E
Jan‐08 0.5 8.7 4.2 9.1 2.2 11.3Feb‐08 0.6 8.2 4.0 8.8 1.9 10.7Mar‐08 0.5 8.6 4.2 9.1 2.1 11.2Apr‐08 0.8 8.4 4.0 9.1 2.2 11.4May‐08 0.5 8.7 4.2 9.2 2.1 11.2Jun‐08 0.6 8.4 4.0 9.0 2.1 11.1Jul‐08 0.7 8.5 4.1 9.2 2.2 11.4Aug‐08 0.5 8.7 4.2 9.2 2.1 11.2Sep‐08 0.5 7.8 3.8 12.1 2.5 14.6Oct‐08 0.6 6.8 3.5 10.9 2.5 13.4Nov‐08 0.2 4.7 2.5 7.3 2.2 9.6Dec‐08 0.2 3.9 2.5 6.6 1.9 8.5Jan‐09 0.2 4.1 2.6 6.9 2.2 9.0Feb‐09 0.1 4.0 2.6 6.6 1.5 8.1Mar‐09 0.1 4.0 2.6 6.6 1.5 8.1Apr‐09 0.1 3.8 2.5 6.4 1.1 7.5May‐09 0.0 4.3 2.6 6.9 1.0 8.0Jun‐09 0.1 4.4 2.5 6.9 0.8 7.8Jul‐09 0.1 5.0 2.6 7.7 0.9 8.6Aug‐09 0.2 5.5 2.6 8.3 0.8 9.1Sep‐09 0.2 5.8 2.7 8.7 1.0 9.7Oct‐09 0.4 6.0 2.6 9.0 1.2 10.2Nov‐09 0.4 5.7 2.5 8.5 1.0 9.5Dec‐09 0.2 5.8 2.5 8.5 1.0 9.5
7.00 2.04 9.0377.5% 22.5%
8.52 0.99 9.5189.5% 10.5%
Note:
Calculation of Shift Share between US domestic steel production and US imports of finished steel products
Date
Imports of semi‐finished Steel
Productsa (mmt)
Production of crude steel (mmt)
Production from
mini millsb
(mmt)
Domestic Steel Production (mmt)
Imports of Finished Steel
Productsa (mmt)
Calculated US Demand for
Finished Steelc
(mmt)
Average for November and December 2008Percentage shares between US domestic production and imports
Average for November and December 2009Percentage shares between US domestic production and imports
Share shift between US imports and domestic production as a result of the Buy American provision
‐12.1%
a. The December 2009 figure for US imports of semi‐finished and finished steel products figure is a 6 month average of the second half of 2009, due to the lack of data.b. The January to August 2008 and November to December 2009 US minimill production figures are calculated based on the corresponding US crude steel production figures, due to the lack of data for minimill production.c. Calculated demand is the sum of domestic steel production and imports of finished steel. This calculation ignores inventory changes
12.1%
Source: World Steel Association, World Steel in Figures, 2009; Bureau of Labor Statistics, 2009; United States Geological Society, 2009; Author's calculations.
65
REFERENCES
Text Amiti, Mary and David E. Weinstein, “Exports and Financial Shocks,” CEPR Discussion Paper No. 7590,
December 2009. CEPR London. Becker, Geoffrey, “CRS Report for Congress, Food and Agricultural Imports from China,” Congressional
Research Service, Order Code RL34080, September 26, 2008, p. CRS‐6. Bradford, Scott, Paul L Grieco, and Gary Hufbauer. 2005. The Payoff to America from Global Integration.
In The United States and the World Economy, C Fred Bergsten. Washington: Institute for International Economics.
Brunel, Claire, and Gary Hufbauer. 2009. “Money for the Auto Industry: Consistent With WTO Rules?” Policy Brief 09‐4. Washington: Peterson Institute for International Economics.
Burtless, Gary, “Counting the Jobs Produced by the Stimulus,” Brookings Institution. 2009. “Certain Passenger Vehicle and Light Truck Tires From China,” U.S. International Trade Commission,
Investigation No. TA‐421‐7, Publication 4085, July 2009, p. I‐2. Evenett, Simon, “The Global Overview: Has Stabilization Affected the Landscape of Crisis‐Era
Protectionism?” in Will Stabilization Limit Protectionism?: The 4th GTA Report. Global Trade Alert and CEPR, February 15th 2010, London.
Frank, Dana. Buy American : The Untold Story of Economic Nationalism: Boston, Mass. : Beacon Press, ©1999.
Hufbauer, Gary Clyde. 2008. “Answering the Critics: Why Large American Gains from Globalization Are Plausible.” Washington: Peterson Institute for International Economics.
Hufbauer, Gary Clyde, and Jeffrey Schott. 2009. “Buy American: Bad for Jobs, Worse for Reputation” PB09‐2. Washington: Peterson Institute for International Economics.
Hufbauer, Gary Clyde, Jeffrey Schott, and Woan Foong Wong. 2010. “Figuring Out the Doha Round,” Vox‐EU.org. February 22. 2010. Available at http://www.voxeu.org/index.php?q=node/4657 (accessed March 9, 2010).
Hufbauer, Gary Clyde, Jeffrey Schott, Matthew Adler, Claire Brunel, and Woan Foong Wong. Forthcoming (2010). “Figuring Out the Doha Round.” Washington: Peterson Institute for International Economics.
Hufbauer, Gary Clyde, and Shahid Javed Burki. Sustaining Reform with a Us‐Pakistan Free Trade Agreement, Policy Analyses in International Economics ; 80: Washington, DC : Peterson Institute for International Economics, ©2006.
Government Accountability Office. Recipient Reported Jobs Data Provide Some Insight into Use of Recovery Act Funding, but Data Quality and Reporting Issues Need Attention. GAO Report to Congress GAO‐10‐223. November 2009, Washington, D.C.
Nicoletti, Giuseppe, Steve Golub, Dana Hajkova, Daniel Mirza, and Kwang‐Yeol Yoo. 2003. Policies and International Integration: Influences on Trade and Foreign Direct Investments. OECD Economics Department Working Paper 359. OECD, Paris
OECD, WTO and UNCTAD, 2010. Report on G‐20 Trade and Investment Measures, September 2009 to February 2010, March 8th 2010.
Available at http://www.wto.org/english/news_e/news10_e/trim_report_08mar10_e.doc. Pomeranz, Toward a New International Order in Government Procurement, 12 PUB. CONT. L.J. 129
(1982). “Trade Action—or Inaction: The Cost for American Workers and Companies,” U.S. Chamber of
Commerce, September 15, 2009.
66
Press Barsfield and Levy (2007), In Search of an Obama Trade Policy, August 2009. Available at
http://www.aei.org/docLib/20090805‐IEO‐Aug‐2009g.pdf. Ericson, Matthew, Elaine He, and Amy Schoenfeld. “Tracking the $700 Billion Bailout.” New York Times.
See http://projects.nytimes.com/creditcrisis/recipients/table, accessed February 11, 2010. “Buy American Provisions in Jobs Bill Could Complicate Canada Talks,” Inside U.S. Trade, December 25,
2009. “Certain Passenger Vehicle and Light Truck Tires From China,” USITC Investigation No. TA‐421‐7,
Publication 4085, July 2009, p. I‐2. Faiola, Anthony and Lori Montgomery. “Trade Wars Brewing in Economic Malaise” The Washington Post.
May 15, 2009. Available at http://www.washingtonpost.com/wp‐dyn/content/article/2009/05/14/AR2009051404241.html (accessed March 2, 2010).
Fritsch, Peter and Corey Boles. “How ‘Buy American’ Can Hurt U.S. Firms.” The Wall Street Journal. September 17, 2009 (available at http://online.wsj.com/article/SB125306012124114135.html?mg=com‐wsj). Accessed on February 9, 2010.
Government Accountability Office. “Recovery Act: Project Selection and Starts are Influenced by Certain Federal Requirements and Other Factors” February 2010. Available at http://www.gao.gov/new.items/d10383.pdf (accessed on March 1, 2010).
Kane, Paul. “Sander Levin replaces Rangel as Ways and Means chairman.” The Washington Post. March 5, 2010.
“Processors, Cattle Groups Square off over WTO Challenges of COOL,” Inside U.S. Trade, January 15, 2010.
Resolution Text. “One Hundred Twenty Days for Fair Trade Deal, Say Municipalities.” June 6, 2009. Available at http://www.fcm.ca/English/View.asp?mp=1055&x=1139 (accessed on February 9, 2010).
Retaliatory efforts were suspended in October 2009, because FCM officials were encouraged by talks between Canadian and U.S. officials. President’s Statement. “FCM Suspends Buy American Deadline.” October 3, 2009. Available at http://www.fcm.ca/English/View.asp?mp=1055&x=1200 (accessed on February 9, 2010).
Shea, James J. “USTR Releases 2010 Trade Policy Agenda.” White & Case. March 3, 2010. “The President’s Trade Policy Agenda.” United States Trade Representative (USTR). Available at
http://www.ustr.gov/sites/default/files/uploads/reports/2009/asset_upload_file810_15401.pdf. “U.S. Revival of Dairy Subsidies Sparks Global Outrage, but Effect Minimal,” Inside U.S. Trade, May 29,
2009. “USITC Announces Remedy Proposals in its China Safeguard Investigation Involving Imports of Certain
Passenger and Light Truck Tires from China,” USITC News Release 09‐048, June 29, 2009. United States Trade Representative. “U.S.‐Canada joint statement on government procurement”
February 5, 2010. Available at http://www.ustr.gov/about‐us/press‐office/press‐releases/2010/february/us‐canada‐joint‐statement‐government‐procurement (accessed on February 9, 2010).
VanGrassek (2009), Building without BRICs: Lessons from the ‘Buy American’ Debate. Bridges Volume 13, Number 1, March 2009. Available at http://ictsd.net/news/bridges/44271.
Whittington, Les. “Buy‐American rules shutting out Canadians” Ottawa Bureau, The Star. May 6, 2009. Available at http://www.thestar.com/news/canada/article/629729 (accessed February 9th, 2010).
“WTO Establishes Panel To Examine China Tire Safeguard,” Inside U.S. Trade, January 22, 2010.
67
Data
Bureau of Economic Analysis, 2010. www.bea.gov Bureau of Labor Statistics, 2009. www.bls.gov Environmental Protection Agency, www.epa.gov Global Trade Alert, www.globaltradealert.org Irwin, Douglas A., “Merchandise imports and duties: 1790‐2000.” Table Ee424‐430 in Historical Statistics
of the United States, Earliest Times to the Present: Millennial Edition, edited by Susan B. Carter, Scott Sigmund Gartner, Michael R. Haines, Alan L. Olmstead, Richard Sutch, and Gavin Wright. New York: Cambridge University Press, 2006. http://dx.doi.org/10.1017/ISBN‐9780511132971.Ee362‐611
Recovery.gov, http://www.recovery.gov/ Sutch, Richard, “Business cycle turning dates and duration ‐ monthly: 1854‐2001.” Table Cb5‐8 in
Historical Statistics of the United States, Earliest Times to the Present: Millennial Edition, edited by Susan B. Carter, Scott Sigmund Gartner, Michael R. Haines, Alan L. Olmstead, Richard Sutch, and Gavin Wright. New York: Cambridge University Press, 2006. http://dx.doi.org/10.1017/ISBN‐9780511132971.Cb1‐8
Sutch, Richard, “Business cycle turning dates and duration ‐ annual: 1790‐1855.” Table Cb1‐4 in Historical Statistics of the United States, Earliest Times to the Present: Millennial Edition, edited by Susan B. Carter, Scott Sigmund Gartner, Michael R. Haines, Alan L. Olmstead, Richard Sutch, and Gavin Wright. New York: Cambridge University Press, 2006. http://dx.doi.org/10.1017/ISBN‐9780511132971.Cb1‐8
United States Geological Society, 2009. http://www.usgs.gov/ World Steel Association, World Steel in Figures, 2009. http://www.worldsteel.org/
Internet
“Back to Basics” Creating New Jobs with the National Export Initiative.” The White House Blog. Available at http://www.whitehouse.gov/blog/2010/02/04/back‐basics‐creating‐new‐jobs‐with‐national‐export‐initiative.
“Boston Non‐Importation Agreement, August 1, 1768,” http://avalon.law.yale.edu/18th_century/ boston_non_importation_1768.asp, accessed January 30, 2010.
Browner, Carol. “183 projects, 43 states, Tens of Thousands of High Quality Clean Energy Jobs.” The White House Blog. http://www.whitehouse.gov/blog/2010/01/08/183‐projects‐43‐states‐tens‐tthousands‐high‐quality‐clean‐energy‐jobs.
Bureau of labor Statistics http://www.bls.gov/, accessed February 11, 2010. “Cantor and other Republicans say Obama promised stimulus would keep unemployment rates below 8
percent.” Politico. Available at http://www.politifact.com/truth‐o‐meter/statements/2009/jul/09/eric‐cantor/Cantor‐and‐other‐republicans‐say‐obama‐promised‐s/.
Council of Economic Advisors, The Economic Impact of the American Reconstruction and Recovery Act of 2009: Second Quarterly Reports, January 13th 2010. Available at http://www.whitehouse.gov/sites/default/files/microsites/100113‐economic‐impact‐arra‐second‐quarterly‐report.pdf.
“Dairy Export Incentive Program,” http://www.fas.usda.gov/excredits/deip/deip‐new.asp, accessed February 11, 2010.
“Declaration Summit on Financial Markets and the World Economy,” November 25th 2008, available at http://www.g20.org/Documents/g20_summit_declaration.pdf.
68
“Dispute Settlement: Dispute DS 392,” http://www.wto.org/english/tratop_e/dispu_e/cases_e/ ds392_e.htm, accessed February 5, 2010.
“Dispute Settlement: Dispute DS384,” http://www.wto.org/english/tratop_e/dispu_e/cases_e/ ds384_e.htm, accessed February 5, 2010.
“Henry Clay, In Defense of the American System,” http://www.senate.gov/artandhistory/history/ common/generic/Speeches_ClayAmericanSystem.htm, accessed February 5, 2010.
“Jacobellis v. Ohio, 378 U.S. 184 (1964).” U.S. Supreme Court Center. Available at http://supreme.justia.com/us/378/184/case.html.
“Kirk Comments on Exports, U.S. Jobs” United States Trade Representative. http://www.ustr.gov/about‐us/press‐office/press‐releases/2010/january/kirk‐comments‐exports‐us‐jobs.
Mitchell, Daniel J. 2010. “Making Government Bigger Is Not Stimulus—and It Won’t Create Jobs.” Available at Cato Liberty, www.cato‐at‐libery.org (accessed on February 4, 2010).
“NBER Business Cycle Dating Committee” http://www.nber.org/cycles/dec2008.html, accessed February 10, 2010
Politico blog, www.politico.com, accessed multiple times throughout writing of study. “President Obama’s State of the Union Address,” http://www.whitehouse.gov/the‐press‐
office/remarks‐president‐state‐union‐address, accessed February 10, 2010
“Remarks by the President at the Export‐Import Bank's Annual Conference,” http://www.whitehouse.gov/the‐press‐office/remarks‐president‐export‐import‐banks‐annual‐conference, accessed March 11, 2010.
“President’s 2010 budget,” http://www.whitehouse.gov/omb/budget/fy2011/assets/tables.pdf, accessed February 14, 2010
“Public Law 111‐5—Feb. 17, 2009” http://www.gpo.gov/fdsys/pkg/PLAW‐111publ5/pdf/PLAW‐111publ5.pdf accessed February 2, 2010.
“Open Congress: H.R.3012 ‐ Trade Reform, Accountability, Development, and Employment Act of 2009,” http://www.opencongress.org/bill/111‐h3012/show, accessed February 11, 2010.
“Secretary of Commerce Gary Locke National Exports Initiative Remarks.” Department of Commerce. Available at http://www.commerce.gov/NewsRoom/SecretarySpeeches/PROD01_008893
“Subpart 25.3—Balance of Payments Program,” https://www.acquisition.gov/FAR/0219/html/ Subpart_25_3.html, accessed February 5, 2010.
“The Anti‐Counterfeiting Trade Agreement (ACTA)—Summary of Key Elements Under Discussion.” Available at http://www.ustr.gov/sites/default/files/uploads/factsheets/2009/asset_upload_file917_15546.pdf. Accessed March 11, 2010.
“The Job Impact of the American Recovery and Reinvestment Plan –Jan 10, 2009,” Twine. See http://www.twine.com/item/11s7k2tcr‐1vc/the‐job‐impact‐of‐the‐american‐recovery‐and‐reinvestment‐plan‐jan‐10‐2009 (accessed on February 1, 2010).
“The Plurilateral Agreement on Government Procurement (GPA).” http://www.wto.org/english/ tratop_E/gproc_e/gp_gpa_e.htm , accessed January 29, 2010.
The Global Plan for Recovery and Reform” April 2nd G‐20 Summit, London, available at http://www.g20.org/Documents/final‐communique.pdf.
“THOMAS (Library of Congress),” http://thomas.loc.gov, accessed February 4, 2010. “Tracking the $700 Billion Bailout,” http://projects.nytimes.com/creditcrisis/recipients/table, accessed
February 11, 2010. “Treasury Announces Restructuring of Commitment to GMAC,” http://www.treas.gov/press/
releases/tg501.htm, accessed February 5, 2010.
69
“Treasury Issues Update on Status of Support for Housing Programs,” http://www.ustreas.gov/ press/releases/2009122415345924543.htm, accessed February 5, 2010.
“U.S.DA Announces 2008‐2009 Allocations for Dairy Export Incentive Program,” http://www.fas.usda.gov/scriptsw/PressRelease/pressrel_dout.asp?Entry=valid&PrNum=0081‐09, accessed February 11, 2010.
“Westward Expansion and Regional Differences,” http://www.america.gov/st/educ‐english/ 2008/April/20080407113634eaifas0.4282495.html, accessed January 30, 2010.
“2010 Trade Policy Agenda and 2009 Annual Report.” Office of United States Trade Representative. Available at http://www.ustr.gov/2010‐trade‐policy‐agenda (accessed March 5, 2010).