Embed Size (px)
Citation preview

GED Focus Paper
Global Impact of a Protectionist U.S. Trade Policy
Thieß Petersen, Ulrich Schoof, Erdal Yalcin, Gabriel Felbermayr, Marina Steininger

GED Focus Paper
Global Impact of a Protectionist U.S. Trade Policy
Thieß Petersen, Ulrich Schoof, Erdal Yalcin, Gabriel Felbermayr, Marina Steininger

5
Inhalt
Executive Summary 6
1. Introduction 7
2. Model-theoretical Fundamentals 9
3. Scenario I: Withdrawal from NAFTA 12
4. Scenario II: Introduction of a Border Adjustment Tax 14
5. Scenario III: Protectionist U.S. Trade Policy with Respect to the Rest of the World 16
6. Summary and Outlook 19
Bibliography 19
Appendix 20
Imprint 23
5
6
The inauguration of Donald Trump as President of the
United States has raised the risk that U.S. trade policy
will increasingly adopt protectionist measures. The three
policies relevant in this context—a withdrawal from the
North American Free Trade Agreement, destination-based
cash flow taxation with subsidized exports and general
economic isolation from the rest of the world—have been
modelled by the ifo Institute in corresponding scenarios
for the Bertelsmann Stiftung in order to quantify the
global economic impact of these policies.
Currently, the US administration is examining the goods
trade with all nations of the world and evaluating whether
the trade is „fair“ from the point of view of the USA.
If partner countries’ practices are classified as non-
competitive or unfair, the US administration intends to
restrict access to the American market.The goal of such
a potential U.S. isolationist policy is to secure jobs and
income in the United States. In reality, however, such
protectionist measures would lead to the fact that a
weakness in international trade, triggered by the United
States, results in losses of income worldwide—above all in
the United States. In all the modelled scenarios, the United
States is one of the four countries that will lose the most
in income. For this reason, the U.S. government should
generally distance itself from the threatened protectionist
trade policies in its own interests.
The re-introduction of customs and non-tariff trade
barriers in the North American free trade zone, which
includes the United States, Canada and Mexico, would
damage the American economy. Real per capita annual
income would fall by roughly US $125 in the long run
there.1 Only in Canada would the loss of income be greater
at roughly US $730 per resident. Many other countries
could even gain slight advantages if there is a decline in
cross-border trade between the United States, Canada
1 The per capita income indicated here does not include customs revenue.
Executive Summary
and Mexico. The corresponding increases in income would
be hardly noticeable, however. In Germany, for example,
long-term per capita annual income would rise by less
than US $12.
The now withdrawn consideration of a border adjustment
tax, which would act as a 20% import tax and a 20% subsidy
of U.S. exports would reduce U.S. exports and income in
the United States. The long-term losses of income would
be greater in the United States at just under US $380 per
resident than they would be from the reintroduction of
trade barriers in the North American free trade zone. The
economic impact on other countries would also be greater.
Real per capita annual income in Germany would be almost
US $350 less in the long run. In addition, there would also
be individual countries that could increase their production
of goods. The greatest increases in income per resident
connected with this would be achieved in the United
Kingdom and Canada at roughly US $330 in each case.
A U.S. protectionist policy for trade with other countries
would cause the greatest economic damage—above all if
these countries adopt protectionist policies for the United
States as a countermeasure. If customs duties and non-
tariff trade barriers in bilateral trade between the United
States and other countries increased by 20 percent, for
example, U.S. imports from these countries would decrease
by 50 to 60 percent. U.S. exports to the individual other
countries would even fall by 70 percent or more. The
consequences would be high losses of income: Real per
capita annual income in the United States would be US
$1,300 less in the long run, and in Canada it would even
be roughly US $1,800 less. A loss of income in the amount
of roughly US $160 per resident would be expected for
Germany. Different than in the two preceding scenarios,
there is no individual country in this scenario that could see
rises in income if trade barriers are erected on both sides.
7
One of the core messages in Donald Trump‘s election
campaign was the isolation of domestic markets from
competition abroad. After his inauguration in January 2017,
he followed up his campaign promises with action. One
of his first acts in office was to issue an executive order to
suspend the Trans-Pacific Partnership (TPP).
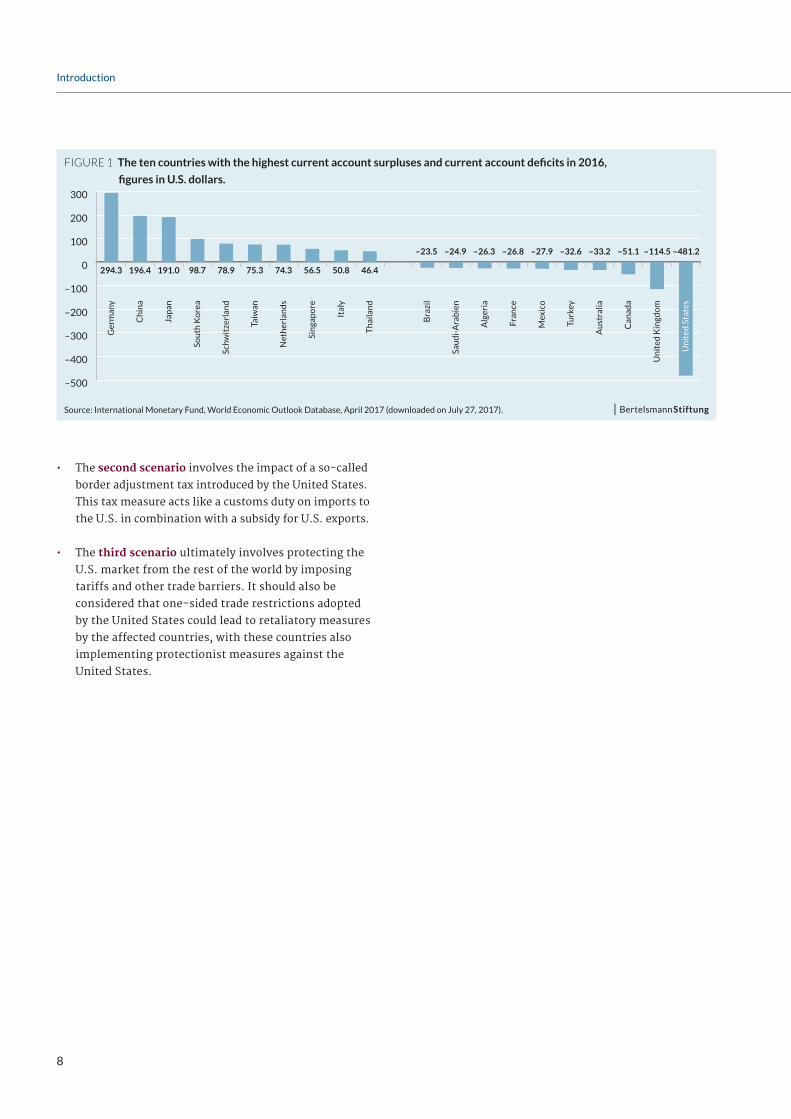
The goal of this and other envisioned protectionist
measures is to secure jobs and income in the United
States and to reduce the high current account deficit in
the United States. According to the preliminary figures of
the International Monetary Fund, the American current
account deficit was almost US $500 billion in 2016. This is
by far the highest deficit in the world (see Figure 1).
In reality, however, these goals cannot be achieved
by isolating the U.S. economy. On the contrary: if the
United States imposes import duties on foreign products,
for example, this may increase the prices of imported
consumer goods and intermediate goods and services.
The consequence will be an increase in the price level in
the United States and also an increase in production costs.
This will worsen the international competitiveness of the
American economy and reduce U.S. exports as a result.
The explanatory remarks below summarize the most
important results of a study prepared by the ifo institute
on behalf of the Bertelsmann Stiftung (see Yalcin,
Felbermayr and Steininger 2017). This study calculates
the possible impact of three fundamental scenarios
involving protectionist U.S. trade policy:
• In the first scenario, there is a partial withdrawal
from the North American Free Trade Agreement. This
Agreement entered into force on January 1, 1994, and
includes the U.S., Canada and Mexico.
1. Introduction
It is necessary to consider in all these results that the
simulation models used do not take account of dynamic
effects and the parameters applied are conservative in
nature. For this reason, these results represent the lower
bound of the long-term impact (approx. 10-12 years) that
a protectionist U.S. trade policy would have on income and
production.
8
Introduction
• The second scenario involves the impact of a so-called
border adjustment tax introduced by the United States.
This tax measure acts like a customs duty on imports to
the U.S. in combination with a subsidy for U.S. exports.
• The third scenario ultimately involves protecting the
U.S. market from the rest of the world by imposing
tariffs and other trade barriers. It should also be
considered that one-sided trade restrictions adopted
by the United States could lead to retaliatory measures
by the affected countries, with these countries also
implementing protectionist measures against the
United States.
FIGURE 1 The ten countries with the highest current account surpluses and current account deficits in 2016,
figures in U.S. dollars.
Source: International Monetary Fund, World Economic Outlook Database, April 2017 (downloaded on July 27, 2017).
–500
–400
–300
–200
–100
0
100
200
300
Un
ited
Sta
tes
Un
ited
Kin
gdo
m
Can
ada
Au
stra
lia
Turk
ey
Mex
ico
Fran
ce
Alg
eria
Sau
di-
Ara
bie
n
Bra
zil
Th
aila
nd
Ital
y
Sin
gap
ore
Net
her
lan
ds
Taiw
an
Schw
itze
rlan
d
Sou
th K
ore
a
Jap
an
Ch
ina
Ger
man
y
–481.2–114.5–51.1–33.2–32.6–27.9–26.8–26.3–24.9–23.5
46.450.856.574.375.378.998.7191.0196.4294.3
9
are falling exports in the United States, i.e. also
lower production and lower employment. However,
there may be positive production and employment
effects for some sectors. For example, this is the
case in sectors that would not be able to compete
with Canadian suppliers without the import duties
and—after the import duties increased the prices
for Canadian products—would be competitive again.
However, this will also lead to an increase in the price
level in the United States since American companies
can only offer these products at a higher price due to
the higher production costs. Theoretically, the effects
could also be positive if the structure of comparative
advantages in a U.S. sector largely matches those in
Canada, and the other sectors have structures that are
complementary to the Canadian ones.
• In Canada the lower exports to the United States will
cause a decline in production, employment and income.
The lower demand for products connected with this
weakens the Canadian economy even more since the
United States is its most important trading partner. The
lower demand for goods also affects American products.
For the United States, this means a decline in exports
with a negative impact on production and employment
in its own country.
• Finally, external countries such as Germany will also
be affected by American customs duties on Canadian
products. A possible scenario could look like this: If
German consumers purchase U.S. products, they must
pay a higher price for them due to the general increase
in prices in the United States. This reduces real income
in Germany and has a negative impact on demand
and production in Germany. The production costs
increase for German companies that need American
intermediate products. This reduces the international
competitiveness of these companies and decreases
German exports to the rest of the world. Furthermore,
The calculations forming the basis of these explanatory
remarks were prepared with the simulation model of the
ifo institute (see Aichele, Heiland and Felbermayer 2016
for a more in-depth discussion). This involves a static,
general equilibrium model for international trade. Trade
flows are influenced by customs duties and non-tariff
trade barriers (e.g. technical requirements, documentation
obligations, etc.), among others. The model covers 43
individual countries and the rest of the world. The base
year for the simulation calculations is 2014. The trade data
is reported for 50 sectors. This allows for statements about
the structural adjustments to protectionist measures in
the individual countries, i.e. statements about changes in
trade flows and production structures and their impact on
real gross income and real wages. Since the model involves
a real economic model, it does not include monetary
aspects—and thus also changes in exchange rates.
The fundamental economic interrelations can be clarified in
one simple example. Let us assume that the United States
imposes higher customs duties on imports from Canada.
This measure will have numerous economic consequences
and involves many interdependencies. Some of the most
important ones are the following:
• In the United States, the higher price for Canadian
products means that demand for these products will
drop due to lower competitiveness, and imports from
Canada will fall as a result. American consumers must
pay a higher price for products that continue to be
purchased from Canada. This reduces their purchasing
power and their real income. The demand for U.S.
products will fall due to the lower purchasing power.
This means that production, employment and income
will drop in the United States. If U.S. companies
purchase intermediate goods or services from
Canada, they must also pay a higher price for these
products. Their production costs and international
competitiveness decline as a result. The consequences
2. Model-theoretical Fundamentals
10
Model-theoretical Fundamentals
Clarification of terms: The trade model used calculates
the change in income for all house-holds in a society. This
metric is the annual gross household income or real in-
come without taking account of customs revenue. Divi-
ding this metric by the total population produces the real
per capita income. The latter mainly corresponds in turn
to real per capita gross domestic product (GDP).
In reality, an adjustment to a change in trade costs takes
time. Experience with existing free trade agreements shows
that a dismantling of trade barriers requires 10–12 years to
have its full impact. It is therefore plausible to assume that
the reintroduction of trade barriers would also entail an
adjustment period. The associated path of adjustment over
time can be seen in Figure 2.
As a result, it is possible to interpret the changes in real
gross household income discussed below, i.e. the long-term
losses and gains in income resulting from the application
of various protectionist measures. These changes are also
described as losses or gains in well-being.
To reduce the complexity of the comparison, this focus
paper will limit itself to a discussion of the results
in nine countries: the three NAFTA member states
(the United States, Canada, Mexico), the three largest
European economies (Germany, the U.K., France) and the
three Asian countries with the highest current account
surpluses (Japan, China, South Korea). The results for the
other countries can be found in the long version (Yalcin,
Felbermayr and Stein-inger 2017) and in Appendices 1 to 3.
German exports to Canada will decline because the drop
in Canadian real income will lower demand for German
products. At the same time, German exports to the
United States may increase. This is the case if Canadian
products are no longer competitive due to the import
duties in the United States, and American consumers
switch to German products instead. On balance,
production, employment and income in Germany could
even rise due to the American import duties on Canadian
products: Since Germany only imports relatively few
products from the United States, the increase in prices
connected with that is hardly of relevance. To the
extent that the additional exports to the United States
are relatively high, the positive production and income
effects connected with that can overcompensate the
outlined negative effects of these import duties.
Overall, the model allows for an analysis of complex
structural adjustments due to consideration of the economic
structure. The price for the consideration of the structural
adjustments is the omission of dynamic effects. The model
does not take account of investment activities and thus the
connected changes in productivity, for example. Since the
dynamic effects resulting from economic isolation are not
taken into account, the results presented below represent
the lower bound of the long-term impact that protectionist
U.S. trade policies would have on income and production.
The results of the calculations in the simulation are to be
interpreted as follows: The starting point is the economic
actual situation in 2014 (base year). In each case, the
scenarios calculate a hypothetical situation for the world
in which various protectionist measures are implemented.
Consequently, an alternative world will be modelled for
2014 in which all the framework conditions are identical
with the exception of protectionist measures adopted.
The protectionist measures increase the costs of cross-
border trade. The adjustments companies and consumers
make to the change in trade costs have effects on the trade
flows and the production structure. These effects have
consequences for wages, macroeconomic gross income and
gross domestic product. Since monetary aspects are not
included in the model, the metrics involve real figures.

11
Model-theoretical Fundamentals
FIGURE 2 The modelled path of adjustment in annual per capita income (without consideration of customs revenue) as a
reaction to the introduction of a protectionist measure in 2014
Source: Trade model of the German Institute for Economic Research (ifo).
per capita income growth without protectionism
growth with protectionism
2014 2016 2021
adjustment path
first 5 years
long-term effect
anticipation effect
year

12
U.S. imports from other countries increase in part. In total,
the United States lifts its imports from the rest of the world
by roughly US $29 billion. In absolute figures, imports from
China (plus US $5.4 billion), Japan (plus US $5.0 billion) and
Germany (plus US $4.4 billion) rise the most. However, it
is clear that the United States will have difficulty replacing
the close, long-standing trade relations with Canada and
Mexico.
Changes in trade flows and the associated adjustments in
the production of goods and services have an impact on the
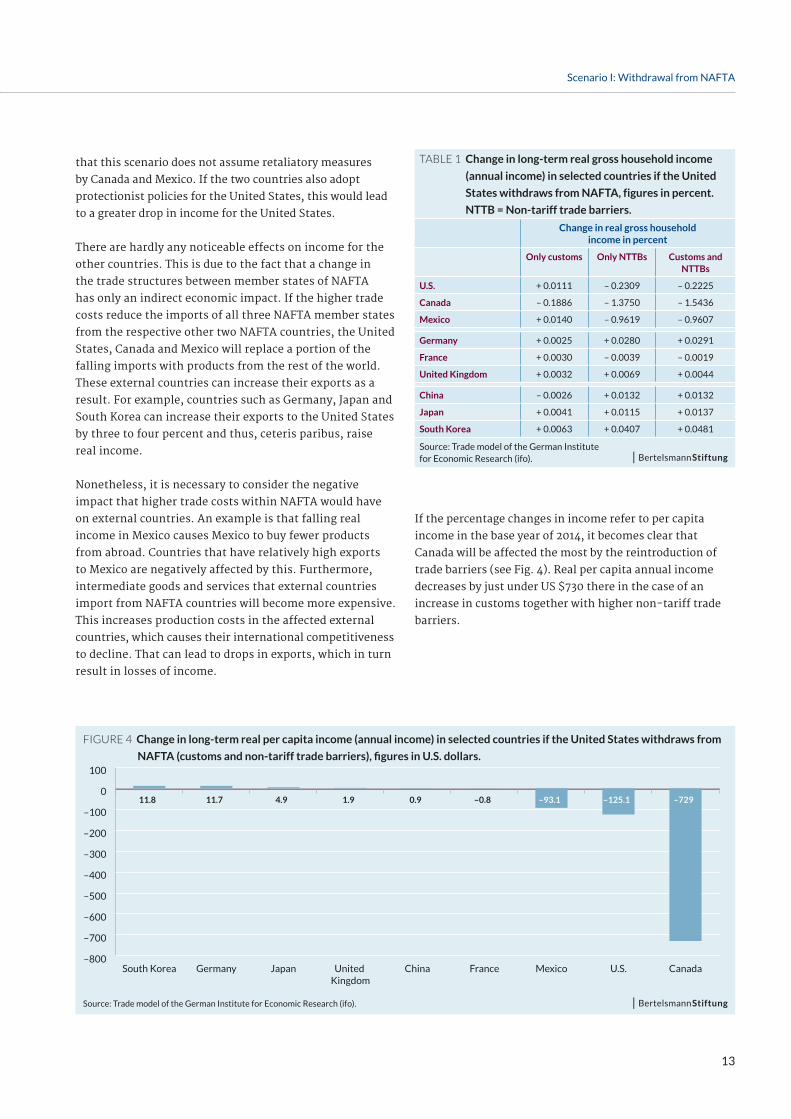
annual real income of citizens. Table 1 shows the simulation
results for selected countries. It can be seen that an increase
only in customs causes just a minor loss of well-being.
If non-tariff trade barriers are erected at the same time,
Canada suffers the greatest percentage decline in income
with a long-term drop of roughly 1.5 percent. The decline
in income for the United States is relatively moderate at
roughly 0.2 percent. It is necessary to consider, however,
In this scenario, it is assumed that the United States
reintroduces trade barriers in the North American free
trade zone. The amount of the import duties collected by
the United States from Canada and Mexico corresponds to
the customs duty rates that apply to all members states of
the World Trade Organization (WTO). The amount of non-
tariff trade barriers corresponds to the costs that were
eliminated in the regional free trade agreements concluded
to date and are now reintroduced.
The increase in trade costs for imports from Canada and
Mexico to the United States as a result of import duties
and non-tariff trade barriers primarily changes trade flows
within the North American free trade zone. U.S. imports
from Canada drop the most (minus US $74 billion or minus
21 percent) as do its imports from Mexico (minus US $36
billion or minus 13.6 percent, see Fig. 3).
3. Scenario I: Withdrawal from NAFTA
FIGURE 3 Change in long-term bilateral trade relations between the United States and selected countries if the United States
withdraws from NAFTA (customs and non-tariff trade barriers), figures in percent.
Source: Trade model of the German Institute for Economic Research (ifo).
–25
–20
–15
–10
–5
0
5
GermanySouth KoreaJapanChinaUnited Kingdom
FranceMexicoCanada
bilateral U.S. importebilateral U.S. exporte
–0.8–1.1–1.2–1.2–1.3–2.0
–9.8–11.4
3.23.54.11.52.11.7
–13.7
–21.2
13
Scenario I: Withdrawal from NAFTA
If the percentage changes in income refer to per capita
income in the base year of 2014, it becomes clear that
Canada will be affected the most by the reintroduction of
trade barriers (see Fig. 4). Real per capita annual income
decreases by just under US $730 there in the case of an
increase in customs together with higher non-tariff trade
barriers.
that this scenario does not assume retaliatory measures
by Canada and Mexico. If the two countries also adopt
protectionist policies for the United States, this would lead
to a greater drop in income for the United States.
There are hardly any noticeable effects on income for the
other countries. This is due to the fact that a change in
the trade structures between member states of NAFTA
has only an indirect economic impact. If the higher trade
costs reduce the imports of all three NAFTA member states
from the respective other two NAFTA countries, the United
States, Canada and Mexico will replace a portion of the
falling imports with products from the rest of the world.
These external countries can increase their exports as a
result. For example, countries such as Germany, Japan and
South Korea can increase their exports to the United States
by three to four percent and thus, ceteris paribus, raise
real income.
Nonetheless, it is necessary to consider the negative
impact that higher trade costs within NAFTA would have
on external countries. An example is that falling real
income in Mexico causes Mexico to buy fewer products
from abroad. Countries that have relatively high exports
to Mexico are negatively affected by this. Furthermore,
intermediate goods and services that external countries
import from NAFTA countries will become more expensive.
This increases production costs in the affected external
countries, which causes their international competitiveness
to decline. That can lead to drops in exports, which in turn
result in losses of income.
FIGURE 4 Change in long-term real per capita income (annual income) in selected countries if the United States withdraws from
NAFTA (customs and non-tariff trade barriers), figures in U.S. dollars.
Source: Trade model of the German Institute for Economic Research (ifo).
–800
–700
–600
–500
–400
–300
–200
–100
0
100
CanadaU.S.MexicoFranceChinaUnited Kingdom
JapanGermanySouth Korea
–729–125.1–93.1–0.80.91.94.911.711.8
Table 1 Change in long-term real gross household income
(annual income) in selected countries if the United
States withdraws from NAFTA, figures in percent.
NTTB = Non-tariff trade barriers.
Change in real gross household income in percent
Only customs Only NTTBs Customs and NTTBs
U.S. + 0.0111 – 0.2309 – 0.2225
Canada – 0.1886 – 1.3750 – 1.5436
Mexico + 0.0140 – 0.9619 – 0.9607
Germany + 0.0025 + 0.0280 + 0.0291
France + 0.0030 – 0.0039 – 0.0019
United Kingdom + 0.0032 + 0.0069 + 0.0044
China – 0.0026 + 0.0132 + 0.0132
Japan + 0.0041 + 0.0115 + 0.0137
South Korea + 0.0063 + 0.0407 + 0.0481
Source: Trade model of the German Institute for Economic Research (ifo).
14
rate will neutralize the tax policy in the long run and the
net trade balance will remain constant. Nonetheless, this
will lead to adjustments in trade on the sectoral level—
both in the United States and in the rest of the world.
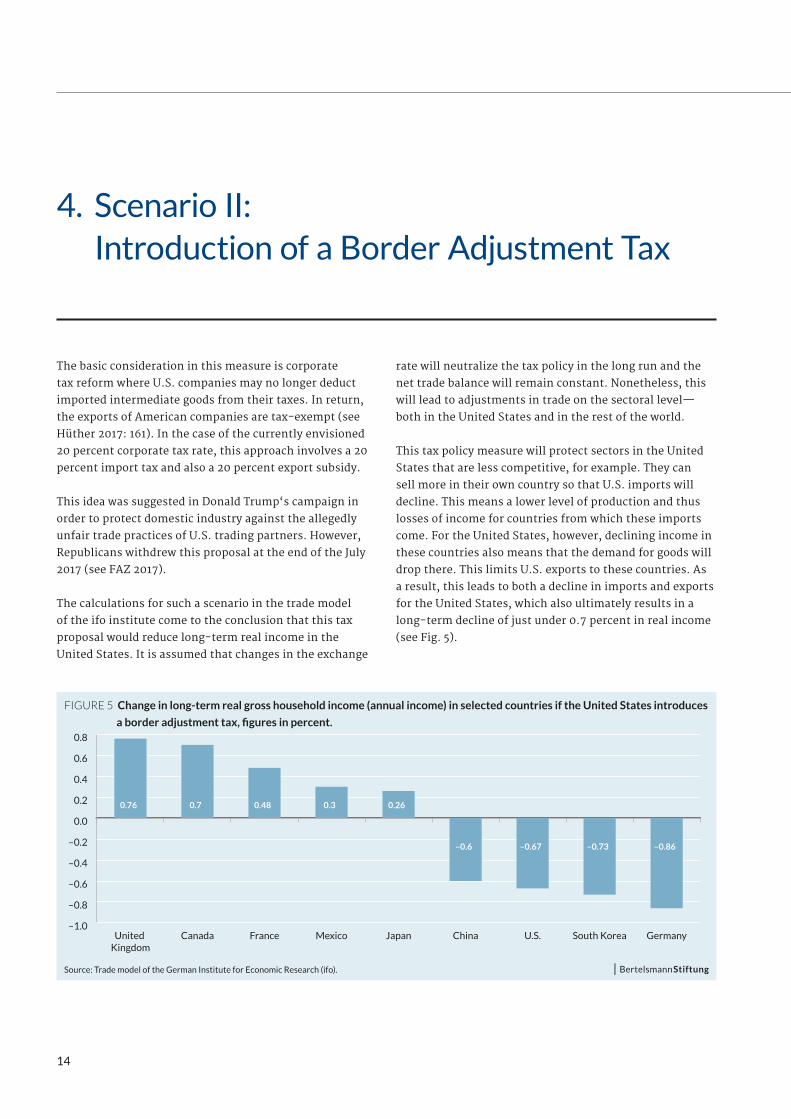
This tax policy measure will protect sectors in the United
States that are less competitive, for example. They can
sell more in their own country so that U.S. imports will
decline. This means a lower level of production and thus
losses of income for countries from which these imports
come. For the United States, however, declining income in
these countries also means that the demand for goods will
drop there. This limits U.S. exports to these countries. As
a result, this leads to both a decline in imports and exports
for the United States, which also ultimately results in a
long-term decline of just under 0.7 percent in real income
(see Fig. 5).
The basic consideration in this measure is corporate
tax reform where U.S. companies may no longer deduct
imported intermediate goods from their taxes. In return,
the exports of American companies are tax-exempt (see
Hüther 2017: 161). In the case of the currently envisioned
20 percent corporate tax rate, this approach involves a 20
percent import tax and also a 20 percent export subsidy.
This idea was suggested in Donald Trump‘s campaign in
order to protect domestic industry against the allegedly
unfair trade practices of U.S. trading partners. However,
Republicans withdrew this proposal at the end of the July
2017 (see FAZ 2017).
The calculations for such a scenario in the trade model
of the ifo institute come to the conclusion that this tax
proposal would reduce long-term real income in the
United States. It is assumed that changes in the exchange
4. Scenario II: Introduction of a Border Adjustment Tax
FIGURE 5 Change in long-term real gross household income (annual income) in selected countries if the United States introduces
a border adjustment tax, figures in percent.
Source: Trade model of the German Institute for Economic Research (ifo).
–1.0
–0.8
–0.6
–0.4
–0.2
0.0
0.2
0.4
0.6
0.8
GermanySouth KoreaU.S.ChinaJapanMexicoFranceCanadaUnited Kingdom
–0.86–0.73–0.67–0.6
0.260.30.480.70.76
15
Scenario II: Introduction of a Border Adjustment Tax
In addition, however, there are also some countries where
real income will rise as a result of a change in U.S. tax
policy. One reason for this, among others, is the lower
number of U.S. exports, which makes it possible for
individual countries to increase their exports to other
external countries (trade diversion effects). Furthermore,
relative changes in prices resulting from structural changes
in production can increase the competitiveness of a country
and thus be a cause for the increase in income. This would
be the case if the structure of comparative advantages
in a country largely coincides with that of the United
States, and the other countries have structures that are
complementary to the U.S. American ones.
If the percentage changes in income refer in turn to per
capita income in the base year of 2014, the changes in
income fluctuate for the nine countries observed here,
ranging from an increase in income of roughly US $330
in Canada and the United Kingdom to a per capita drop in
income of almost US $380 in the United States. A decline
in real per capita annual income of almost US $350 is
calculated for Germany.

16
duties on imports and non-tariff trade barriers,
respectively, by all WTO countries for the United States
as a countermeasure.
The increases in trade costs between the United States and
the rest of the world as a result of these trade-restricting
measures lead to significant declines in U.S. exports and
imports. Even in the most harmless case in which solely
the United States increases its customs duties on imports
by 20 percent, U.S. exports to individual other countries
fall by 20 to 30 percent. The higher the trade costs rise on
account of the protectionist measures adopted, the more
cross-border trade will decline. In the sub-scenario with
both increases in customs duties and higher non-tariff
trade barriers, U.S. exports to other countries fall by 70
percent or more. U.S. imports from other countries drop
by 50 to 60 percent or more (see Fig. 6).
The outlined trade effects reduce real gross income. Only
in the case of a one-sided increase in customs duties by the
United States can the United States achieve a 0.26 percent
rise in real income (see Table 2). This rise is due to the
principle of optimal customs. U.S. citizens also profit from
an increase in customs duties due to U.S. customs revenue.
Otherwise, the worldwide decline in foreign trade leads to
production and income losses.
Above all in the two sub-scenarios with a simultaneous
increase in tariff and non-tariff trade barriers, the United
States suffers the fourth-largest percentage decline in
income. Only in Canada, Mexico and Ireland (not included
here), at minus 3.8, 3.4 and 3.6 percent, respectively, will
the losses of income be greater since these countries
depend greatly on the U.S. American market. Consequently,
the United States cannot achieve the goal of improving
its domestic population‘s income situation by economic
isolation. On the contrary: the more extreme the
protectionist measures are, the greater its own losses of
income will be due to higher trade costs and the related
In the last scenario, it is assumed that the United States
adopts protectionist measures against all WTO countries.
This case assumes a 20 percent increase in all customs
duties. If a certain product is currently subject to five
percent import duties, the customs duties in this scenario
rise by 20 percent and are therefore six percent. Individual
higher increases in customs duties are being discussed for
selected countries. But since this scenario involves one
U.S. measure that affects all countries, a conservative rise
in customs duties is applied.
A pure increase in customs duties—as already discussed
in the NAFTA scenario—and also an increase in non-tariff
trade barriers are considered here. In this case, too, it is
assumed that there will be a 20 percent rise in existing
non-tariff trade barriers.
Both measures (an increase in customs duties and an
increase in non-tariff trade barriers) are considered in
two separate cases: 1) only the United States adopts such
measures; or 2) the rest of the world also implements
corresponding trade measures in response to the U.S.
isolation policy. This results in a total of four sub-scenarios:
• 20 percent increase by the United States in customs
duties on imports.
• 20 percent increase by the United States in customs
duties on imports and also a 20 percent increase in
customs duties by all WTO countries on imports from
the United States as a countermeasure.
• 20 percent increase by the United States in customs
duties on imports and non-tariff trade barriers,
respectively.
• 20 percent increase by the United States in customs
duties on imports and non-tariff trade barriers,
respectively, and also a 20 percent increase in customs
5. Scenario III: Protectionist U.S. Trade Policy with Respect to the Rest of the World
17
Scenario III: Protectionist U.S. Trade Policy with Respect to the Rest of the World
price increases. Countries with especially close ties to the
American economy—Canada and Mexico—would also have
to deal with above-average high losses of income due to
their heavy dependency on the U.S. market.
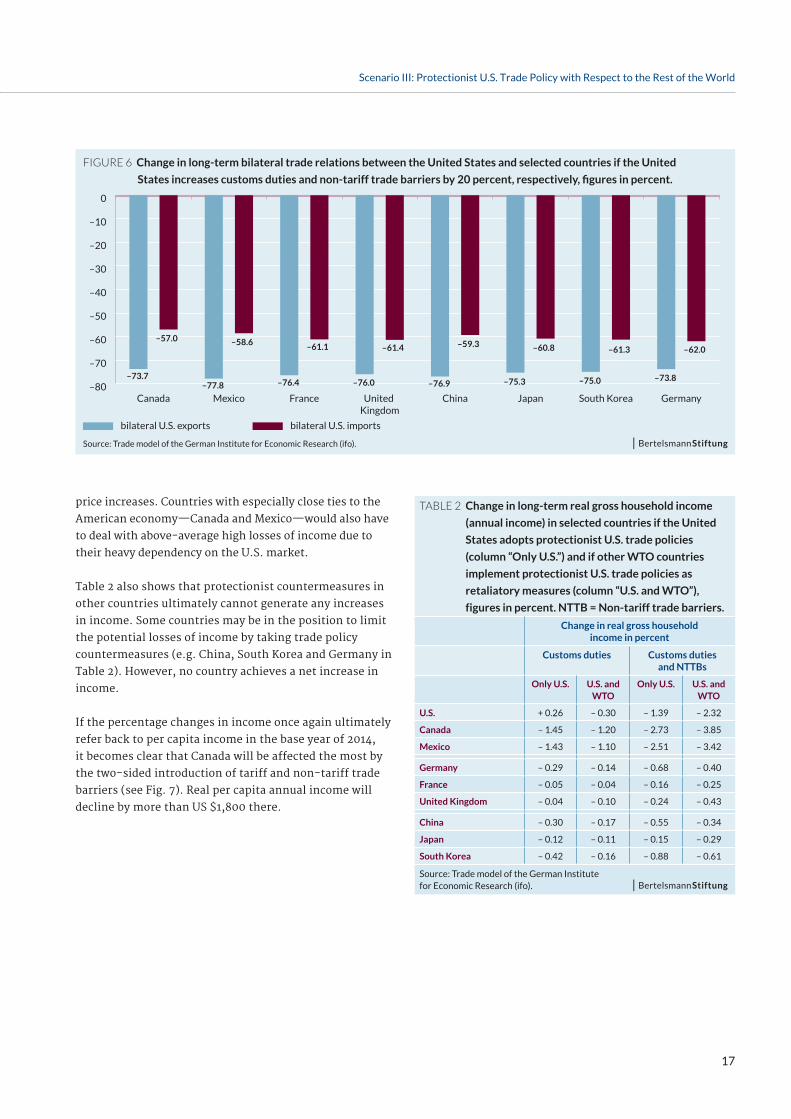
Table 2 also shows that protectionist countermeasures in
other countries ultimately cannot generate any increases
in income. Some countries may be in the position to limit
the potential losses of income by taking trade policy
countermeasures (e.g. China, South Korea and Germany in
Table 2). However, no country achieves a net increase in
income.
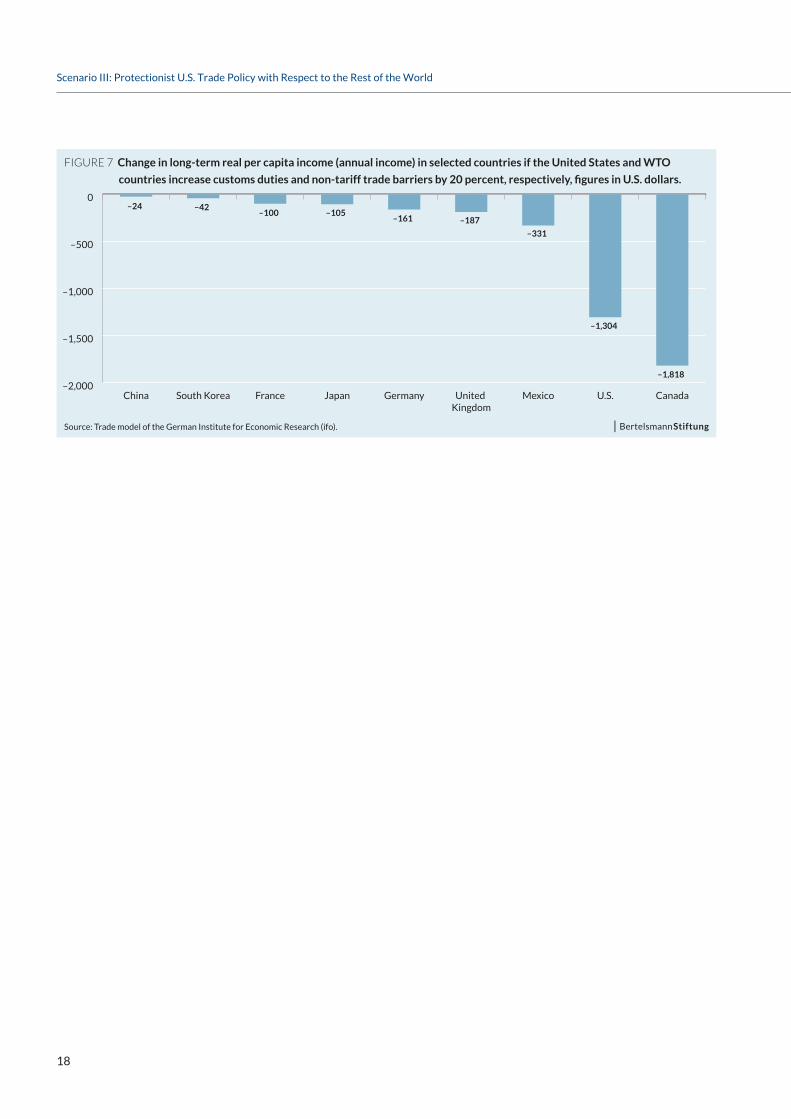
If the percentage changes in income once again ultimately
refer back to per capita income in the base year of 2014,
it becomes clear that Canada will be affected the most by
the two-sided introduction of tariff and non-tariff trade
barriers (see Fig. 7). Real per capita annual income will
decline by more than US $1,800 there.
Table 2 Change in long-term real gross household income
(annual income) in selected countries if the United
States adopts protectionist U.S. trade policies
(column “Only U.S.”) and if other WTO countries
implement protectionist U.S. trade policies as
retaliatory measures (column “U.S. and WTO”),
figures in percent. NTTB = Non-tariff trade barriers.
Change in real gross household income in percent
Customs duties Customs duties and NTTBs
Only U.S. U.S. and WTO
Only U.S. U.S. and WTO
U.S. + 0.26 – 0.30 – 1.39 – 2.32
Canada – 1.45 – 1.20 – 2.73 – 3.85
Mexico – 1.43 – 1.10 – 2.51 – 3.42
Germany – 0.29 – 0.14 – 0.68 – 0.40
France – 0.05 – 0.04 – 0.16 – 0.25
United Kingdom – 0.04 – 0.10 – 0.24 – 0.43
China – 0.30 – 0.17 – 0.55 – 0.34
Japan – 0.12 – 0.11 – 0.15 – 0.29
South Korea – 0.42 – 0.16 – 0.88 – 0.61
Source: Trade model of the German Institute for Economic Research (ifo).
FIGURE 6 Change in long-term bilateral trade relations between the United States and selected countries if the United
States increases customs duties and non-tariff trade barriers by 20 percent, respectively, figures in percent.
Source: Trade model of the German Institute for Economic Research (ifo).
–80
–70
–60
–50
–40
–30
–20
–10
0
GermanySouth KoreaJapanChinaUnited Kingdom
FranceMexicoCanada
bilateral U.S. importsbilateral U.S. exports
–62.0–61.3–60.8–59.3–61.4–61.1–58.6–57.0
–73.8–75.0–75.3–76.9–76.0–76.4–77.8–73.7
18
Scenario III: Protectionist U.S. Trade Policy with Respect to the Rest of the World
FIGURE 7 Change in long-term real per capita income (annual income) in selected countries if the United States and WTO
countries increase customs duties and non-tariff trade barriers by 20 percent, respectively, figures in U.S. dollars.
Source: Trade model of the German Institute for Economic Research (ifo).
–2,000
–1,500
–1,000
–500
0
CanadaU.S.MexicoUnited Kingdom
GermanyJapanFranceSouth KoreaChina
–1,818
–1,304
–331
–187–161–105–100
–42–24
19
Aichele, Rahel, Inga Heiland and Gabriel Felbermayr.
“Going Deep: The Trade and Welfare Effects of TTIP.”
Ifo Working Paper No. 219. Munich 2016.
FAZ (Frankfurter Allgemeine Zeitung). “Republikaner
ziehen brisanten Importsteuer-Vorschlag zurück.” FAZ
Online on July 28, 2017 (http://www.faz.net/aktuell/
wirtschaft/unternehmen/usa-republikaner-ziehen-
vorschlag-zu-importsteuer-zurueck-15126124.html).
Hüther, Michael. “Das große Experiment: Wirtschaftspolitik
für Renationalisierung und Rein-dustrialisierung.”
Wirtschaftsdienst (97) 2017. 159–162.
Yalcin, Erdal, Gabriel Felbermayr and Marina Steininger.
Konsequenzen einer protektionistischen Handelspolitik
der USA – Eine Studie im Auftrag der Bertelsmann
Stiftung. Munich 2017.
The discussed results of the simulation show that the
U.S. administration‘s plan to secure jobs and prosperity
in the United States through protectionist measures is a
fallacy. In the long term, all the measures examined here
would have a negative impact on the U.S. economy and
lead to losses of income. Above all in the likely case that
the countries affected by the trade-restricting measures
would also introduce protectionist trade measures for the
United States, there would be a very high loss for the U.S.
economy.
The U.S. government should generally distance itself
from the threatened protectionist trade policies in its own
interests. The withdrawal of the border adjustment tax is
a first step in the right direction and shows that the U.S.
government under Trump is not acting without economic
reason.
6. Summary and Outlook
Bibliography
20
Appendix
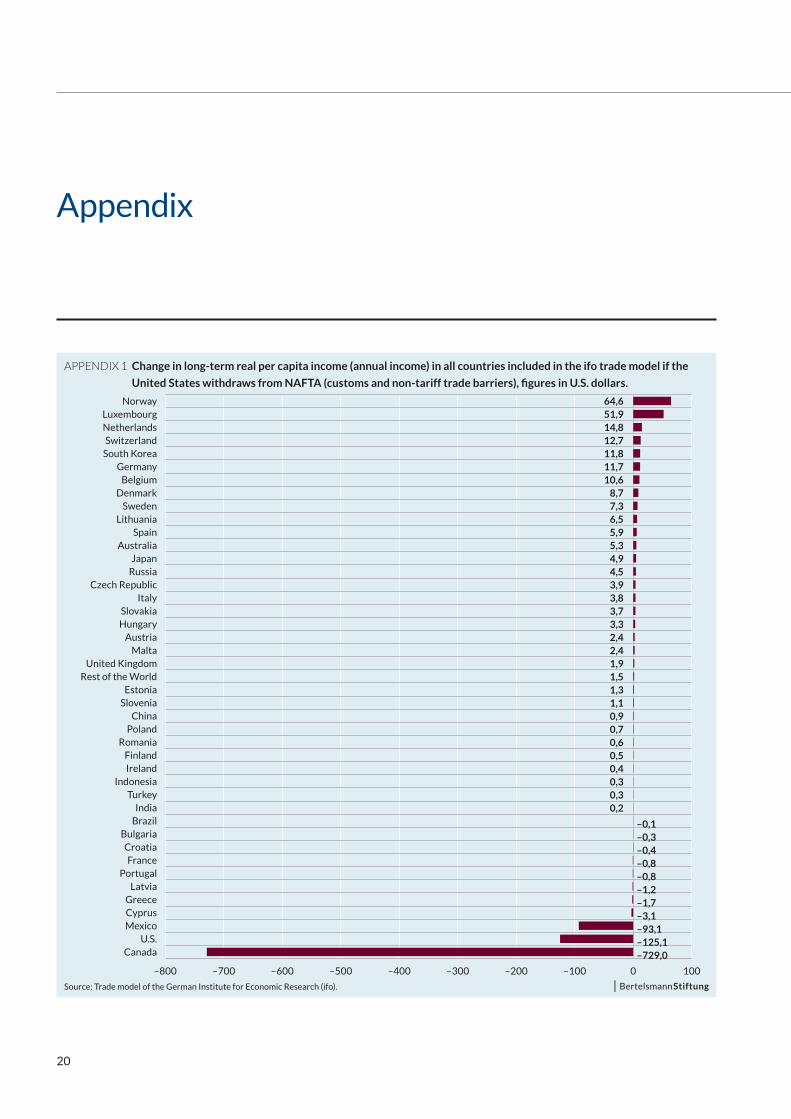
APPENDIX 1 Change in long-term real per capita income (annual income) in all countries included in the ifo trade model if the
United States withdraws from NAFTA (customs and non-tariff trade barriers), figures in U.S. dollars.
Source: Trade model of the German Institute for Economic Research (ifo).
–800 –700 –600 –500 –400 –300 –200 –100 0 100
CanadaU.S.
MexicoCyprusGreece
LatviaPortugal
FranceCroatia
BulgariaBrazilIndia
TurkeyIndonesia
IrelandFinland
RomaniaPoland
ChinaSlovenia
EstoniaRest of the World
United KingdomMalta
AustriaHungarySlovakia
ItalyCzech Republic
RussiaJapan
AustraliaSpain
LithuaniaSweden
DenmarkBelgium
GermanySouth KoreaSwitzerland
NetherlandsLuxembourg
Norway 64,651,914,812,711,811,710,6
8,77,36,55,95,34,94,53,93,83,73,32,42,41,91,51,31,10,90,70,60,50,40,30,30,2
–0,1–0,3–0,4–0,8–0,8–1,2–1,7–3,1–93,1–125,1–729,0
21
Appendix
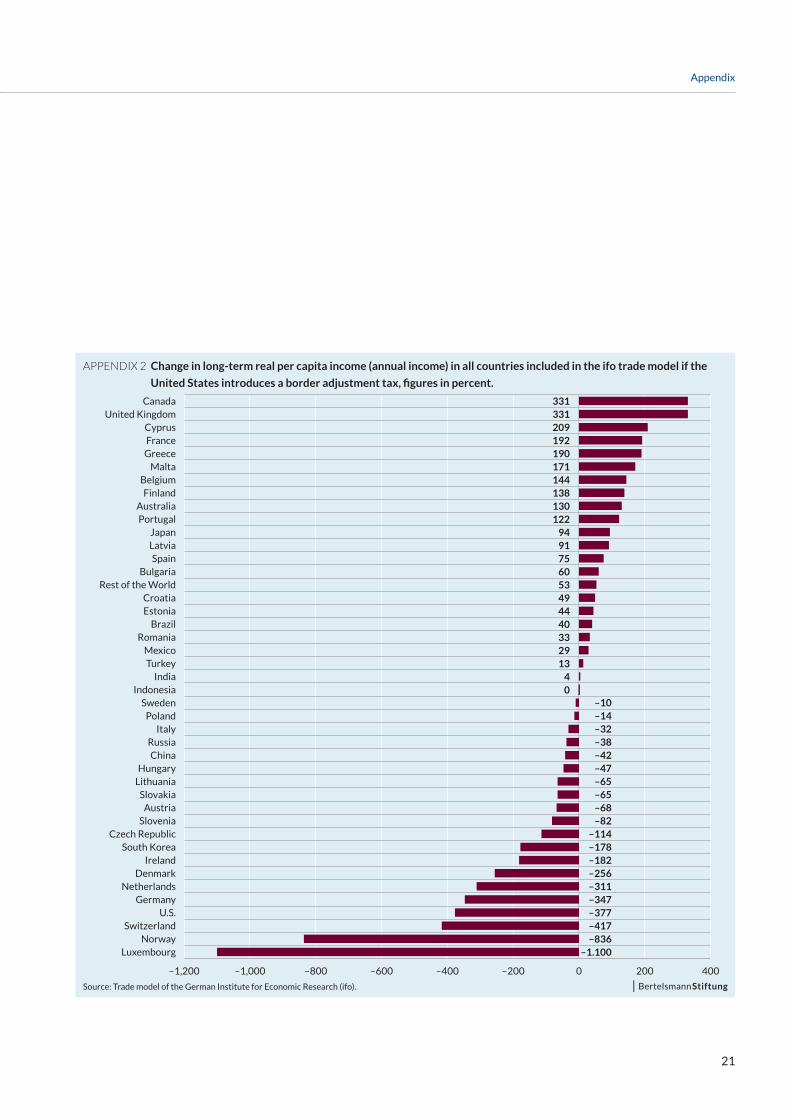
APPENDIX 2 Change in long-term real per capita income (annual income) in all countries included in the ifo trade model if the
United States introduces a border adjustment tax, figures in percent.
Source: Trade model of the German Institute for Economic Research (ifo).
–1,200 –1,000 –800 –600 –400 –200 0 200 400
LuxembourgNorway
SwitzerlandU.S.
GermanyNetherlands
DenmarkIreland
South KoreaCzech Republic
SloveniaAustria
SlovakiaLithuaniaHungary
ChinaRussia
ItalyPoland
SwedenIndonesia
IndiaTurkey
MexicoRomania
BrazilEstoniaCroatia
Rest of the WorldBulgaria
SpainLatviaJapan
PortugalAustralia
FinlandBelgium
MaltaGreeceFranceCyprus
United KingdomCanada 331
331209192190171144138130122
9491756053494440332913
40
–10–14–32–38–42–47–65–65–68–82
–114–178–182–256–311–347–377–417–836
–1.100
22
Appendix
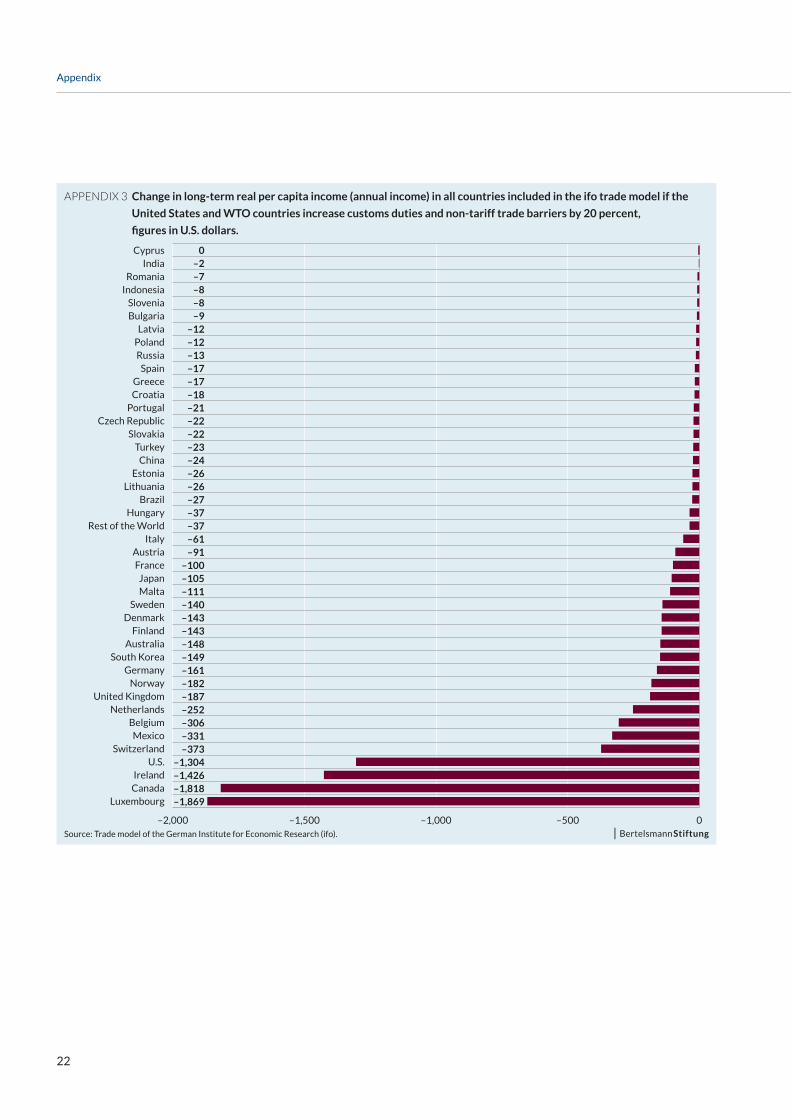
APPENDIX 3 Change in long-term real per capita income (annual income) in all countries included in the ifo trade model if the
United States and WTO countries increase customs duties and non-tariff trade barriers by 20 percent,
figures in U.S. dollars.
Source: Trade model of the German Institute for Economic Research (ifo).
–2,000 –1,500 –1,000 –500 0
LuxembourgCanadaIreland
U.S.Switzerland
MexicoBelgium
NetherlandsUnited Kingdom
NorwayGermany
South KoreaAustralia
FinlandDenmark
SwedenMaltaJapan
FranceAustria
ItalyRest of the World
HungaryBrazil
LithuaniaEstonia
ChinaTurkey
SlovakiaCzech Republic
PortugalCroatiaGreece
SpainRussia
PolandLatvia
BulgariaSlovenia
IndonesiaRomania
IndiaCyprus 0
–2–7–8–8–9
–12–12–13–17–17–18–21–22–22–23–24–26–26–27–37–37–61–91
–100–105–111–140–143–143–148–149–161–182–187–252–306–331–373
–1,304–1,426–1,818–1,869

23
Imprint
Imprint© September 2017 Bertelsmann Stiftung, GüterslohBertelsmann Stiftung
Carl-Bertelsmann-Straße 256
33311 Gütersloh
Phone +49 5241 81-0
www.bertelsmann-stiftung.de
ResponsibleDr. Thieß Petersen
AuthorsDr. Thieß Petersen, Bertelsmann Stiftung
Dr. Ulrich Schoof, Bertelsmann Stiftung
Dr. Erdal Yalcin, ifo Institut and CESifo
Prof. Gabriel Felbermayr, ifo Institut and LMU München
Marina Steininger, ifo Institut
TranslationETC Europe scri
Grafic designNicole Meyerholz, Bielefeld
PictureShutterstock | Hachi888

Address | Contact
Bertelsmann Stiftung
Carl-Bertelsmann-Straße 256
33311 Gütersloh
Phone +49 5241 81-0
GED-Team
Program Shaping Sustainable Economies
Phone +49 5241 81-81353
www.ged-project.de
www.bertelsmann-stiftung.de