Embed Size (px)
Citation preview
U.S. Department of TransportationReport to Congress
Webinar, June 16, 2010www.climate.dot.gov
1

2
Beth Osborne
Deputy Assistant Secretary for Transportation Policy,U.S. Department of Transportation

Mandate and Scope Mandated by the Energy Independence
and Security Act of 2007
Produced by the U.S. DOT Climate Change Center
Analyzes: Transportation greenhouse gas
(GHG) emissions levels and trends Strategies for reducing these
emissions
Scope: Full range of strategies All transportation modes Primarily synthesis GHG reduction, costs, co-benefits,
impact on DOT goals, key interactions
3
4
Linda Lawson
Co-Chair of the US. DOT Center for Climate Change and Environmental Forecasting
Director of the Office of Safety, Energy, and Environment in the Office of the Secretary of Transportation

Presentation Outline
Background Emissions Levels and Trends Strategies for GHG Reduction
Low Carbon Fuels Vehicle Efficiency System Efficiency Reduce Carbon-Intensive Travel Activity Price Carbon Transportation Planning and Investment
Key Interactions Impacts on other DOT Goals Research Gaps Policy Options
5

Background:
Climate impacts significant Average global temp. to rise 2 to 11.5 F by 2100 depending
on scenario. Sea level rise 7-23” – IPCC; 3-4 feet by 2100 – USGCRP Impacts in US: increase in severity of storms, draughts,
floods, heat waves, spread of pests, forest fires, decreased snow pack, changes in agricultural productivity.
Widespread climate impacts are occurring now and expected to increase.
However, the extent of climate change, and its impacts, depends on choices made today to mitigate human caused emissions of GHGs. – USGCRP
6

Emissions Levels and Trends:
CO2 is predominant GHG
7
CO295%
N2O1.5%
CH40.1%
HFCs3.3%
CO284%
CH47.4%
N2O6.5%
HFCs, PFCs &
SF62%
All U.S. Sources Transportation
Weighted by Global Warming Potential (GWP)
Not Included in Official Inventories:Tropospheric Ozone Black Carbon
Source: EPA. Inventory of U.S. Greenhouse Gas Emissions and Sinks, 1990 to 2006. 2008.

Emissions Levels and Trends:
On road sources largest share
8
Transport, 29%
Agriculture8%
Commercial6%
Residential5%
Industry, 19%
Electric Power Industry, 34%
Light Duty Vehicles
58%
Buses0.6%
Motorcycles0.1%
Freight Trucks19%
Aircraft12%
Rail3%
Marine5%
Pipelines1%
Lubricants1%
Source: EPA. Inventory of U.S. Greenhouse Gas Emissions and Sinks, 1990 to 2006. 2008.Note: Above figures include international bunker fuels purchased in the U.S.

Emissions Levels and Trends:
Freight trucks grew fastest
Source Change from 1990 to 2006
All U.S. GHG Sources 15%
U.S. Transportation 27%
Light Duty Vehicles 24%
Freight Trucks 77%
Commercial Aircraft 4%
9
0
1
2
3
4
1975 1980 1985 1990 1995 2000 2005
U.S. Vehicle Miles Traveled (in Trillions)
0
2
4
6
8
10
12
1975 1980 1985 1990 1995 2000 2005
Passenger Cars
Light Trucks
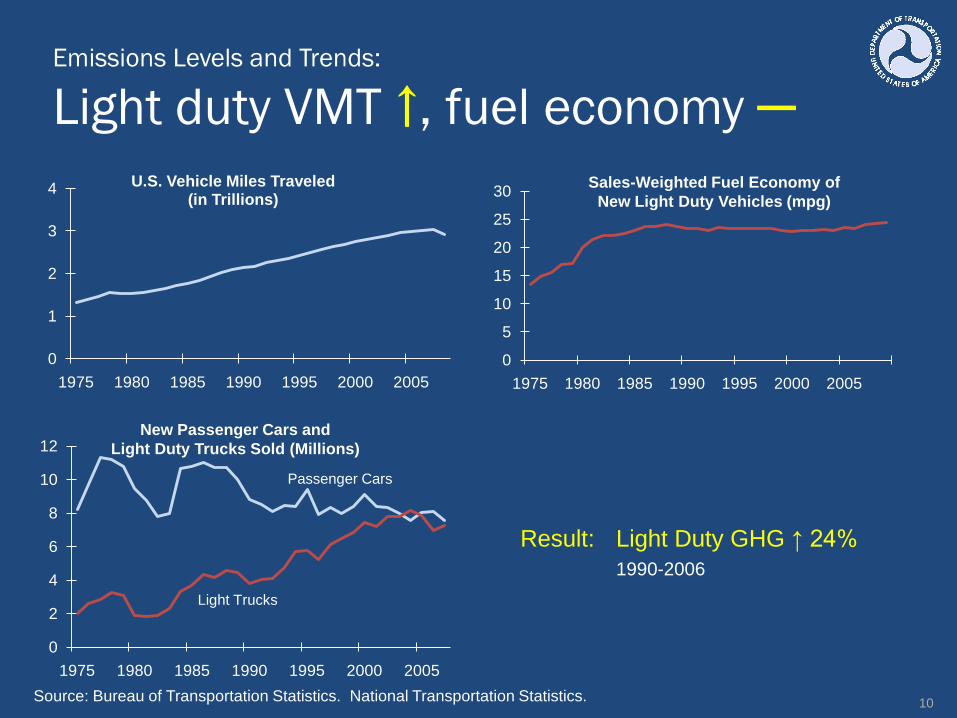
Emissions Levels and Trends:
Light duty VMT ↑, fuel economy ─
10
New Passenger Cars and Light Duty Trucks Sold (Millions)
0
5
10
15
20
25
30
1975 1980 1985 1990 1995 2000 2005
Sales-Weighted Fuel Economy of New Light Duty Vehicles (mpg)
Result: Light Duty GHG ↑ 24%1990-2006
Source: Bureau of Transportation Statistics. National Transportation Statistics.

Emissions Levels and Trends:
Airline passenger miles ↑, but loads ↑
11
0%10%20%30%40%50%60%70%80%90%
1990 1993 1995 1997 1999 2001 2003 2005 2007 2009
Passenger Loads
0100,000200,000300,000400,000500,000600,000700,000
1990 1992 1994 1996 1998 2000 2002 2004 2006
Passenger Miles
Source: Bureau of Transportation Statistics. National Transportation Statistics.
0
10
20
30
40
50
60
1990 1992 1994 1996 1998 2000 2002 2004 2006
Fuel Efficiency(seat miles per gallon)
Result: Airline GHG ↑ 4%1990-2006

Emissions Levels and Trends:
Freight GHG varies by mode
12
Ton-miles carried by freight trucks ↑58% Changes favoring trucks:
Just-in-time manufacturing and retailing Higher-value, lower weight, time sensitive goods
12
0
50
100
150
200
250
300
350
400
450
1990 1992 1994 1996 1998 2000 2002 2004 2006
Trucks
Freight Rail
Ships and Boats (Domestic)Pipelines
MMT CO2e
297
2553 36
1540
0
50
100
150
200
250
300
1550
Trucks Rail Marine Pipelines Aircraft
g CO2e / ton mile
Source: EPA. Inventory of U.S. Greenhouse Gas Emissions and Sinks, 1990 to 2006. 2008. and Bureau of Transportation Statistics. National Transportation Statistics.

Emissions Levels and Trends:
Life cycle emissions show full impact
Fuel Cycle
• Extracting petroleum, mining coal for electricity, growing and harvesting biofuelplants; transport; refining; distribution
• Combustion (tailpipe emissions)
• Disposal of products
Vehicle Cycle
• Raw material extraction, processing, transport; manufacture; assembly, distribution
• Maintenance• Disposal of vehicles
Infrastructure Cycle• Asphalt, steel, cement
production; clearing land; construction
• Maintenance –resurfacing, cleaning
• Disposal
13
Greenhouse Gas Emissions

Emissions Levels and Trends:
Including life cycle increases total
0 100 200 300 400 500 600 700
Boeing 747
Embraer 145
Boston Light Rail
San Fran Heavy Rail
Caltrain
Transit Bus
Pickup
SUV
Sedan Non-operating
14Source: Mikhail Chester, Life-Cycle Environmental Inventory of Passenger Transportation Modes in the United States, 2008.
grams CO2e / passenger mile
Operating

Emissions Levels and Trends:
Projected U.S. transport GHGs flat
15
0
500
1,000
1,500
2,000
2,500
1990 1995 2000 2005 2010 2015 2020 2025 2030
MMT CO2e
Annual Energy Outlook 2009
Includes previous CAFE standard of 35.5mpg by 2020 and renewable fuels standard
Source: Energy Information Administration, Annual Energy Outlook 2009, adjusted from CO2 only to include all transport GHGs.

Strategies for GHG Reduction
Low Carbon Fuels
Vehicle Fuel Efficiency
System Efficiency
Reduce Carbon Intense Travel Activity
16
Transport Planning
and Investment
Price Carbon
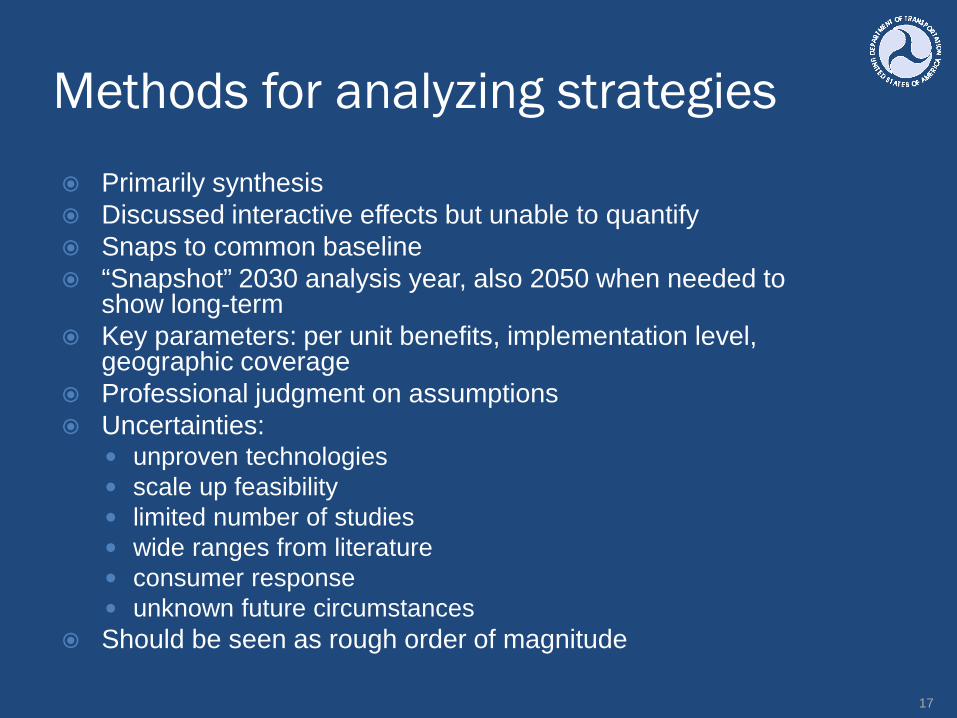
Methods for analyzing strategies Primarily synthesis Discussed interactive effects but unable to quantify Snaps to common baseline “Snapshot” 2030 analysis year, also 2050 when needed to
show long-term Key parameters: per unit benefits, implementation level,
geographic coverage Professional judgment on assumptions Uncertainties:
unproven technologies scale up feasibility limited number of studies wide ranges from literature consumer response unknown future circumstances
Should be seen as rough order of magnitude
17
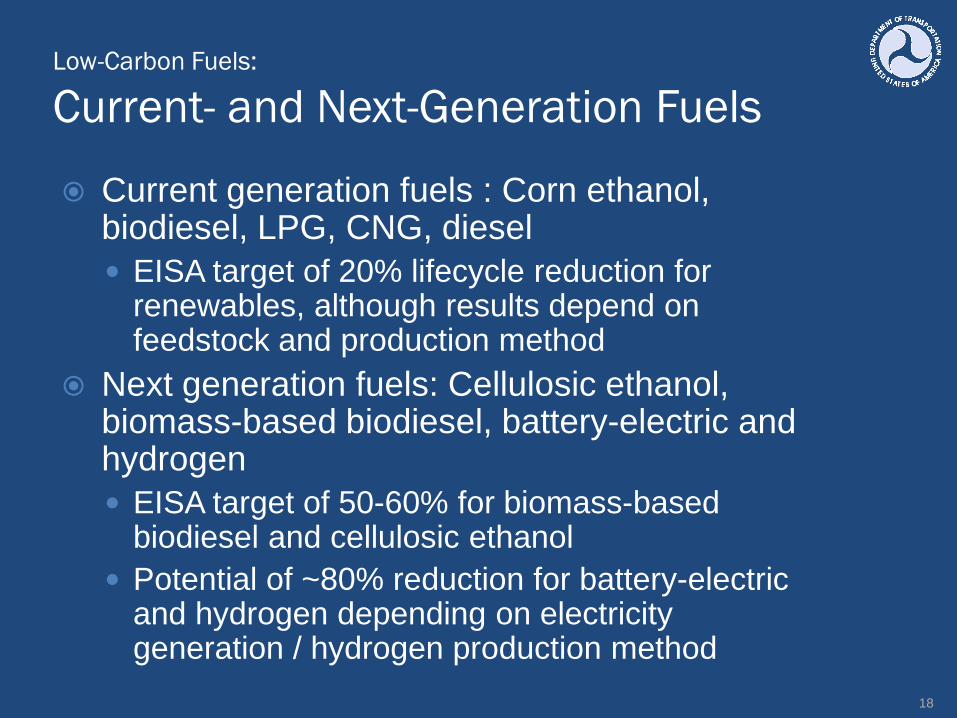
Low-Carbon Fuels:
Current- and Next-Generation Fuels
Current generation fuels : Corn ethanol, biodiesel, LPG, CNG, diesel EISA target of 20% lifecycle reduction for
renewables, although results depend on feedstock and production method
Next generation fuels: Cellulosic ethanol, biomass-based biodiesel, battery-electric and hydrogen EISA target of 50-60% for biomass-based
biodiesel and cellulosic ethanol Potential of ~80% reduction for battery-electric
and hydrogen depending on electricity generation / hydrogen production method
18

Low Carbon Fuels:
Biofuel GHGs vary, life cycle key Corn ethanol, cellulosic ethanol, biodiesel,
advanced biofuels Emissions depend on
feedstock production method carbon intensity of energy used in
production land use change effect on agricultural markets evaluation timeframe
Cellulosic and advanced biofuels offer steeper GHG reductions, but require more research and scaling up of production
See detailed EPA analysis for Renewable Fuel Standard
19
Fuel Cycle
• Extracting petroleum, coal for electricity, growing and harvesting biofuel plants; transport; refining; distribution
• Combustion (tailpipe emissions)
• Disposal of products

Low Carbon Fuels:
Aviation fuels - unique circumstances
Fuel Requirements Safety Weight and storage issues prohibit
heavy battery packs and low energy density fuels
International fuel availability and standards
Commercial Aviation Alternative Fuels Initiative (CAAFI) Drop-in synthetic fuels and
biofuels
20
Source: www.caafi.org
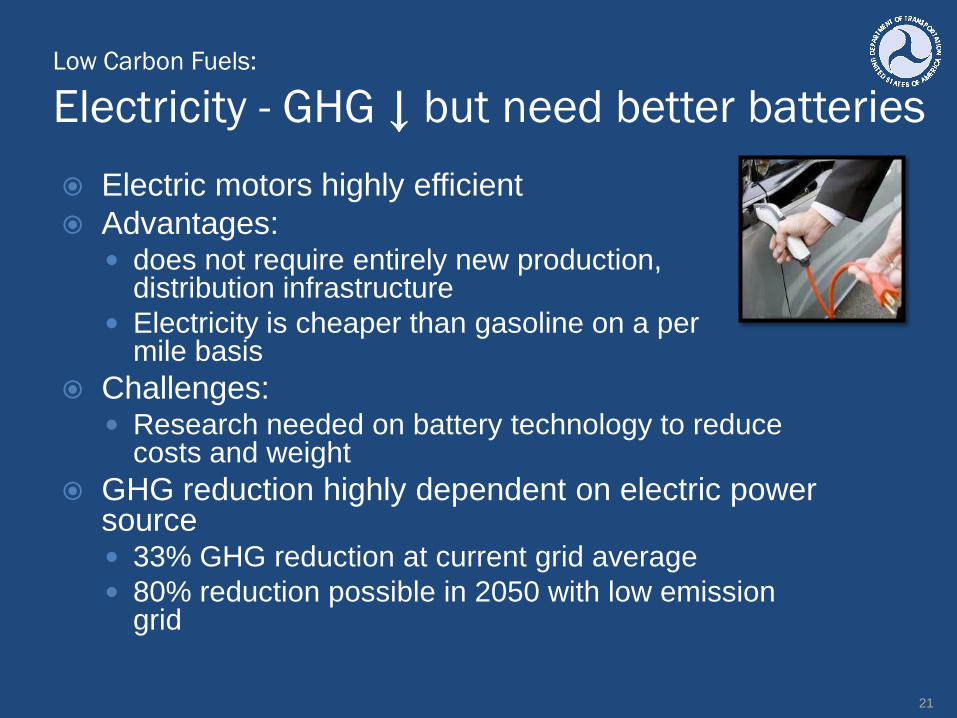
Low Carbon Fuels:
Electricity - GHG ↓ but need better batteries Electric motors highly efficient Advantages:
does not require entirely new production, distribution infrastructure
Electricity is cheaper than gasoline on a per mile basis
Challenges: Research needed on battery technology to reduce
costs and weight GHG reduction highly dependent on electric power
source 33% GHG reduction at current grid average 80% reduction possible in 2050 with low emission
grid
21

Low Carbon Fuels:
Electricity emissions intensity ↓ key
0
100
200
300
400
500
600
700
800
900
1000
Today EPRI est. 2030 EPRI est. 2050
GH
G in
gra
ms
/ kilo
wat
t hou
r
Upstate New York
Kansas and western Missouri
National Average
22
Source: Current emissions from EPA eGRID. Future estimates from Electric Power Research Institute (EPRI), Environmental Assessment of Plug-in Hybrid Electric Vehicles, 2007.

Low Carbon Fuels:
HFCV has promise but many hurdles Hydrogen fuel cell vehicles (HFCV) have twice
the thermal efficiency of internal combustion engines
Benefits depend strongly on method of hydrogen production
Reduction of up to 84% per vehicle possible by 2050
Applications for LDV, HDV, rail, marine Challenges
production distribution network cost of fuel cells more research and development needed
23

Vehicle Efficiency:
Range of technologies possible
24
0
10
20
30
40
50
60
70
80
90
100
Diesel Advanced conventional
gasoline
Hybrid electric Plug-in hybrid electric
Battery electric Hydrogen fuel cell
% Per Vehicle GHG Reduction vs. Conventional Gasoline Vehicle, 2030 to 2050 timeframe

Vehicle Efficiency:
Near-term cost effective tech available Potential for improvements beyond AEO baseline. Advanced conventional vehicles
advanced engine controls, component electrification, etc 8-30% GHG reduction per vehicle Incremental cost ~$1,000 per vehicle, but more than
paid back in fuel savings Hybrid electric vehicles (HEV)
26-54% GHG reduction per vehicle < 2% of the current fleet, but HEV market shares are
rising rapidly cost premium of ~$4,500 near term, expected to fall to
~$3,000 fuel cost savings could lead to net savings over the
vehicle’s lifetime as production costs come down
25

Vehicle Efficiency:
Plug-in hybrids available mid-term Plug-in hybrid electric vehicles (PHEV)
46 to 70% GHG reduction per vehicle (2030), 49-75% (2050), assuming less GHG-intensive electricity generation
PHEV battery costs currently high (about $16,000 per vehicle), $3,000 to $8,000 in medium to long term
In absence of improvements in electricity GHG intensity, PHEV benefits become more comparable to HEVs, yet costs are greater
26

Low Carbon Fuels and Vehicle Efficiency:
Translating to sector-wide
Per vehicle reduction
compared to conventional
Aggressive market penetration
Transportation sector reduction
Hydrogen Fuel Cell, 2030 40-55% 18% of LDV 2.4 – 3.4%
Battery Electric, 2030 68-80% 5% of LDV 2.2-2.5%
Hydrogen Fuel Cell, 2050 70-84% 60% of LDV 18-22%
Battery Electric, 2050 78-87% 56% of LDV 26-30%
27
Per Vehicle GHG Reduction
Tech improvementsScale Up
Cost reductionFleet turn over
Market Penetration
Transportation sector reduction

Vehicle Efficiency:
Heavy duty truck, rail Improvements Heavy-duty trucks
Near term: retrofits with aerodynamic fairings, trailer side skirts, and low-rolling resistance tires, 10-15% per truck
Medium to long term: engine and powertrain technologies, 10-30% per truck
Yield net cost savings over vehicle life
Rail – 20% or more from power system and train efficiency
28
Aerodynamic styled truck with low profile front, aerodynamic bumper, full-height roof fairing, hidden exhaust stacks, and fuel tank side fairings.Source: Schubert and Kromer, 2008.

Vehicle Efficiency
Aviation, marine can contribute
Aviation Engine technology and airframe
improvements, 10-40% per aircraft over 20-30 years
Marine Ship design, 4-15% per vessel Diesel electric for vessels that
change speed frequently (cruise ships, ferries, tugboats), up to 20%
Fleet turnover 20-40 years These sectors smaller share of
transport GHGs, so smaller impact
29
Nozzles Enclosing Propeller to Reduce Friction Losses
Blended Wing

System Efficiency:
Use existing system better
Optimize design, construction, operation, and use of transportation networks
Benefits: Reduced congestion Reduced travel time Reduced travel costs Economic benefits
Challenges: Induced demand
(included in analysis)
30

System Efficiency:
Combined 3-6% GHG ↓Sub-sector
2030 GHG reduction subsector
2030 GHG reduction all transport
Key Parameters
Traffic management On-road 0.1–0.9%* <0.1-0.5%* Signal coordination, faster clearance of incidents, ramp metering
Real-time traveler information On-road 0.1-0.3%* <0.1%* Electronic message boards, 511, web
Highway bottleneck relief On-road 0.1-0.4%* <0.1-0.3%* Improve top 100-200 bottlenecks by 2030
Reduced speed limits On-road 1.7-2.7% 1.1-1.8% 55mph national speed limit
Truck idling reduction HDV 0.4-1.2% 0.1-0.3% 26-100% of sleeper cabs with on board idle reduction tech
Freight rail and marine operations
HRV, rail, marine
<0.1-0.9% <0.1-.4% Reduce rail chokepoints, shore-side power for ships, reduce VMT in intermodal terminal, limited modal diversion
Air traffic operations Domestic aircraft
2.5-6% (cumulative)
0.3-0.7% Airport efficiency, direct routing, reduced separation, continuous descents
Construction materials 0.7-0.8%** Recycled material in cement, low temp asphalt
Other 0.3% Truck size and weight, freight urban consolidation centers, transportation agency energy efficient buildings, alt fuel fleet and construction vehicles
Combined Strategies 3-6%
31*Values from Moving Cooler. The DOT report did not quantify these strategies as more work is underway at FHWA. **Construction emissions not included in the baseline. 15-18 MMT correspond to 0.7-0.8% of U.S. transport GHGs.

System Efficiency:
Highway Management Traffic management, traveler
information, and bottleneck relief Reduce GHGs through smoothing
traffic flow and reducing acceleration and deceleration
Analysis challenging Needs to account for potentially subtle
changes in travel speeds and traffic flow
Also needs to account for additional system-level travel resulting from improvements in travel conditions (induced demand)
Strategy impacts were evaluated using FHWA’s HERS model
Because of modeling limitations (including estimation of induced demand effects), results were not formally quantified in the report
32
Example MPG / Speed Relationship
Source: www.fueleconomy.gov

System Efficiency:
Truck Idle Reduction Two types:
Truck stop electrification Auxiliary power units (APUs)
Only effects one subsector of transport GHGs, so overall magnitude small
But very cost effective, -$480 to -$180 / ton Initial start-up costs, low fuel costs, lack of info,
added weight of APU Current policies: EPA voluntary SmartWay
program and patchwork of state laws
33

System Efficiency:
Aviation More direct routing Efficient take-off and land profiles Airport operational improvements
single-engine taxi electric gate power
2.5-6% GHG reduction cumulative through 2035 Co-benefits: air quality near airports, airline cost
savings Many being implemented through FAA’s NextGen Improvements that reduce travel cost could be
offset by increases in demand
34
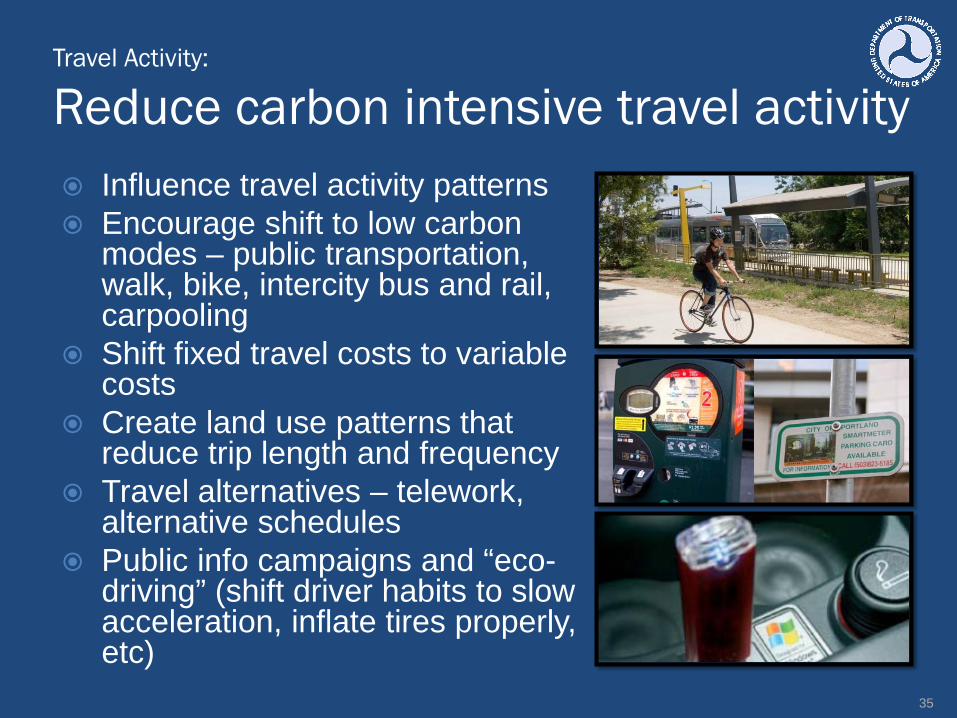
Travel Activity:
Reduce carbon intensive travel activity Influence travel activity patterns Encourage shift to low carbon
modes – public transportation, walk, bike, intercity bus and rail, carpooling
Shift fixed travel costs to variable costs
Create land use patterns that reduce trip length and frequency
Travel alternatives – telework, alternative schedules
Public info campaigns and “eco-driving” (shift driver habits to slow acceleration, inflate tires properly, etc)
35

Travel Activity:
Combined 5-17% GHG ↓
36
2030 reduction Key Assumptions
Pay as you drive insurance 1.1-3.5% Require states to allow (low)Require companies to offer (high)
Congestion pricing 0.4–1.6% LOS D on all roads (avg 65c/mi for 29% of urban and 7% of rural VMT)
Public transportation 0.2-0.9% 2.4-4.6% annual increase in service
Non-motorized travel 0.2-0.6% Comprehensive urban bike/pedimprovements 2010-2025
Land use 1.2-3.9% 60-90% of new urban growth in approx. >5 units/acre
Parking management 0.2% Downtown workers pay for parking ($5/day avg. for those not already paying)
Commuter / worksite trip reduction 0.1-0.6% Widespread employer outreach and alternative mode support
Telework / compressed work week 0.5-0.7% Doubling of current levels
Individualized marketing 0.3-0.4% Reaches 10% of population
Eco-driving 0.8-4.3% 10-50% of drivers reached, half implement
Combined Strategies 5-17% Does not include interactive effects. Includes induced demand.
VMT fee (not included above) 1.1-3.5% 2 to 5 cents per mile

Travel Activity:
Land use is multifaceted strategy
37
Destination accessibility Density
Distance to activity centers
Diversity of land uses
Neighborhood design
Street connectivity
Proximity to transit

Travel Activity:
Land use finding based on 3 reports
38
Year 2050 TRB Special Report 298
Moving Cooler Growing Cooler
LDV VMT reduction 1-11% 1.7-12.6%* 12-18%*
% of new urban development “compact”
25-75% 43-90% 60-90%
Definition of “compact”** 1.98 DU/acre(~4 DU / residential
acre)
>4000 persons per square mile (~>5 DU
/ residential acre)
Density, diversity, design, destination,
accessibility, distance to transit
VMT in compact development 5-25% lower 23% lower 30% lower
% of structures re/developed present-2050
41-55% 64% 67%
U.S. transport GHG reduction (baselines vary)
0.6-6.5% 2-3.4% 7-10%
Finding: 1-4% (2030), 3-8% (2050)How?: Relied primarily on three reports with independent
methods and assumptions:
* Urban only ** Illustrated on next slide

Source: Lincoln Institute of Land Policy, Visualizing Density: Image Gallery Search, photos by Alex MacLeanhttp://www.lincolninst.edu/subcenters/visualizing-density/gallery/index.aspx
Beauford, SC, 1 unit / acre Levittown, NY, 5 units / acre
Washington, DC, 21.8 units / acre San Francisco, CA, 222 units / acre
39

Travel Activity:
Transit importance varies by region GHG Reduction:
0.3-0.8% (2030) 0.4-1.5% (2050)
Key Assumption: 2.4-4.6% annual increase in
ridership Starting from relatively low
national mode share (2%) Only 5% of Americans live
near rail transit Transit shares for commutes in
US CBDs with major transit infrastructure are high 55% in Chicago 14% in Atlanta 35% in Seattle
Could be key in some areas Reduces household costs, but
increases public costs40
Source: FTA, Public Transportation’s Role in Responding to Climate Change, 2010. Data sources: FTA National Transit Database, U.S. Department of Energy, U.S. Environmental Protection Agency

Travel Activity:
Pricing encourages efficiency Shift fixed costs to variable costs VMT fee (not included in 5-17% figure)
fee of 2 to 5 cents / mile 1.1-3.5% GHG reduction, 2030
Pay-as-You-Drive Insurance Makes fixed cost variable Would reduce costs for majority of drivers
Key assumption: Elasticity of VMT with respect to total travel costs of -0.45
○ 10% cost 4.5% in travel○ Fuel price only 1/3 to 1/10 of travel cost
Equivalent to that used in FHWA HERS Same used for induced demand
Elasticity will be greater if alternatives available.41
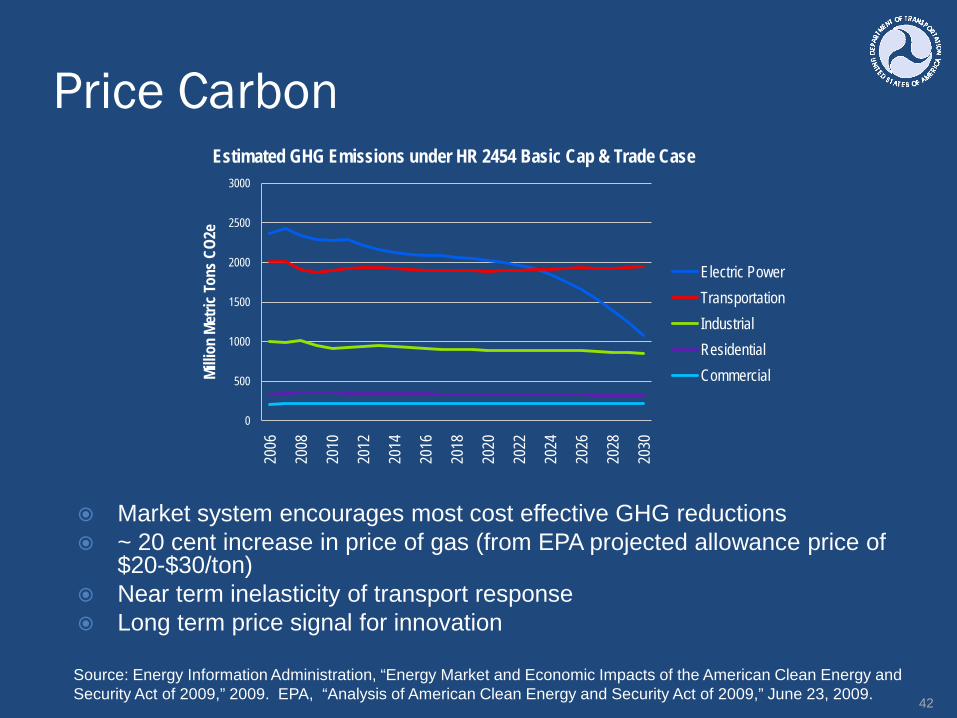
Price Carbon
42
0
500
1000
1500
2000
2500
3000
2006
2008
2010
2012
2014
2016
2018
2020
2022
2024
2026
2028
2030
Millio
n Me
tric T
ons C
O2e
Estimated GHG Emissions under HR 2454 Basic Cap & Trade Case
Electric PowerTransportationIndustrialResidentialCommercial
Market system encourages most cost effective GHG reductions ~ 20 cent increase in price of gas (from EPA projected allowance price of
$20-$30/ton) Near term inelasticity of transport response Long term price signal for innovation
Source: Energy Information Administration, “Energy Market and Economic Impacts of the American Clean Energy and Security Act of 2009,” 2009. EPA, “Analysis of American Clean Energy and Security Act of 2009,” June 23, 2009.

Price CarbonCap and Trade Sectors where most cost effective reductions possible will reduce
first. Environmental benefits do not depend on emission source. Market failures inhibit cost effect responses (e.g. drivers
undervalue fuel savings) Complementary measures
CAFE, travel alternatives, system efficiency, R&D, … When allowance prices are higher in the future, transportation
would be prepared to make cuts as technologies and travel alternatives would be available
Do not reduce overall emissions (capped), but can lower implementation costs. May force reductions that are not cost effective if not well designed.
Gas Tax Similar impact, but only transportation sector Precedent for revenues to be used for transportation
43
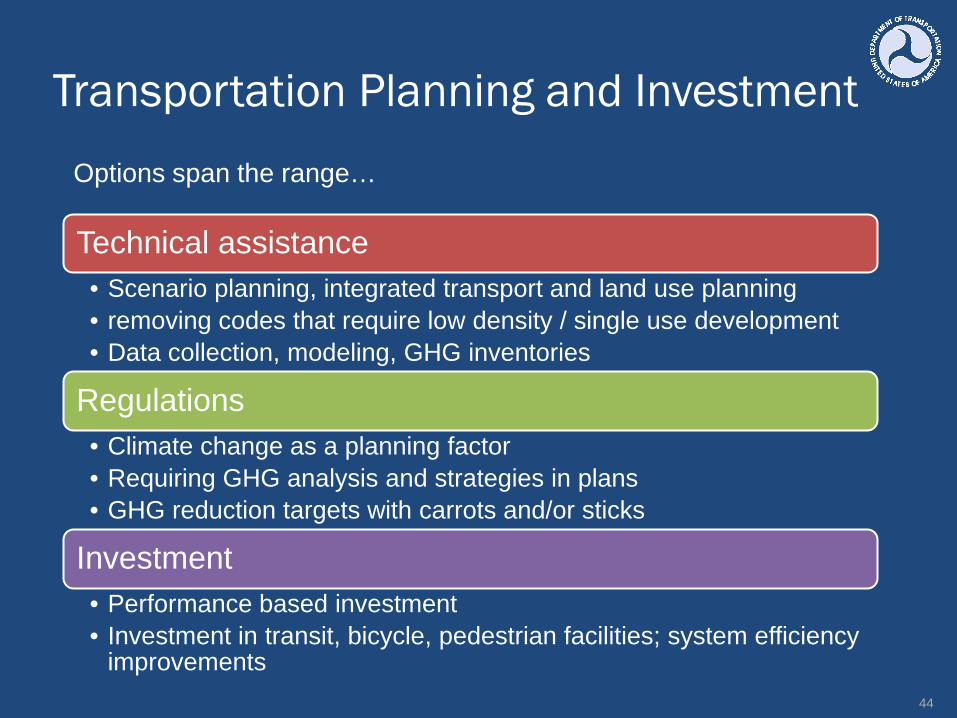
Transportation Planning and Investment
44
Technical assistance• Scenario planning, integrated transport and land use planning• removing codes that require low density / single use development • Data collection, modeling, GHG inventories
Regulations• Climate change as a planning factor• Requiring GHG analysis and strategies in plans• GHG reduction targets with carrots and/or sticks
Investment• Performance based investment• Investment in transit, bicycle, pedestrian facilities; system efficiency
improvements
Options span the range…

Transportation Planning and Investment:
Example: Envision Utah
A: Continuation
of Recent Trends
B:Dispersed
Development
C: Growth is walkable,
transit-oriented
D: Significant increase in
densities, infill, redevelopment
45Residents selected Scenario C – walkable, TOD
Source: Envision Utah, FregoneseCalthorpeAssociates

Key Interactions
46
Fuel economy standards
Market mechanism
Overlaps Synergies
R&D
Price signal
Market penetration and GHG
impact
Vehicle Technology
Travel ActivitySystem
Efficiency

Impacts on other Transportation Goals
All result in reduced petroleum dependence Most improve air quality Land use, transit, bike/ped result in livability benefits System efficiency strategies reduce congestion, travel times, costs Most strategies reduce gas consumption, and consequently
Highway Trust Fund Receipts Pricing strategies raise revenue
47
Petroleum Savings in 2030Billions of gallons saved, gas and diesel
System efficiency (on-road) 5-8
System efficiency (air, rail, marine) 2-5
Travel Activity 12-40

Research Gaps
Elasticities, and how they shift under different conditions
Key interactions Induced demand Cost effectiveness Life cycle emissions Data, tools, decision support for MPOs and
states Information technologies to support efficiency Policy oriented research
48

Policy Options
Efficiency standards• Fuel economy / GHG emission standards• Low carbon fuel standards
Transportation planning and investment• Technical assistance in integrated transportation and land use planning• Technical assistance in removing codes that require low density / single use development• Requiring GHG analysis and strategies in plans• Performance based investment• Investment in transit, bicycle, pedestrian facilities; system efficiency improvements
Market-based incentives• Tax credits, feebates, VMT fees, gas tax
Research and Development• Advanced vehicles and fuels• Data, tools, decision support, policy oriented research on costs and benefits
Economy-wide price signal• Cap and trade, carbon tax
49
Report does not contain recommendations, but does analyze policy options . . .
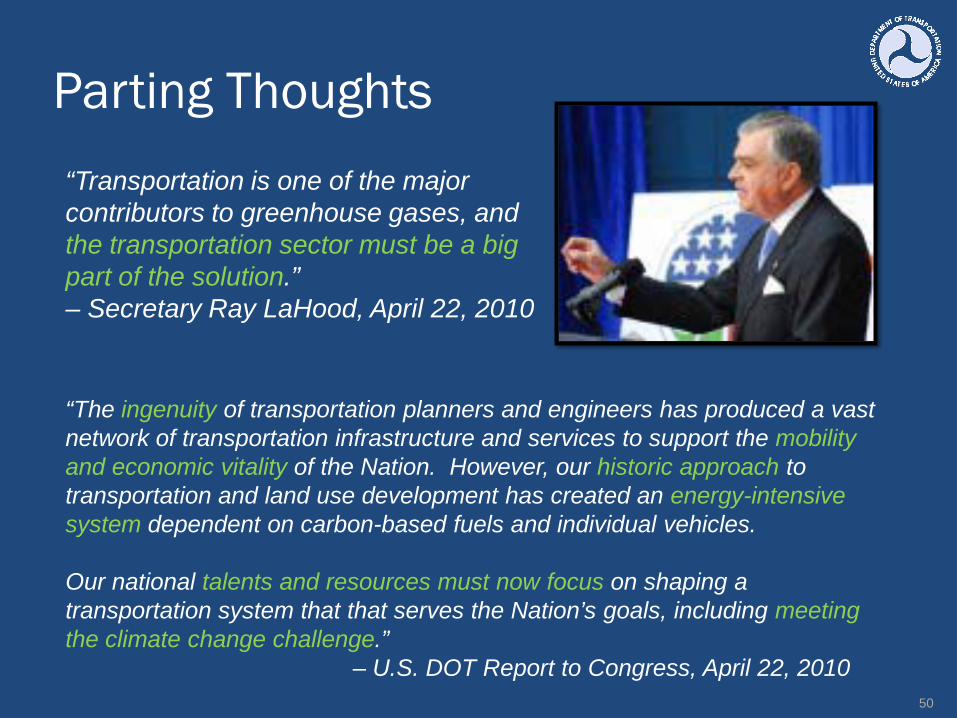
Parting Thoughts
“The ingenuity of transportation planners and engineers has produced a vast network of transportation infrastructure and services to support the mobility and economic vitality of the Nation. However, our historic approach to transportation and land use development has created an energy-intensive system dependent on carbon-based fuels and individual vehicles.
Our national talents and resources must now focus on shaping a transportation system that that serves the Nation’s goals, including meeting the climate change challenge.”
– U.S. DOT Report to Congress, April 22, 201050
“Transportation is one of the major contributors to greenhouse gases, and the transportation sector must be a big part of the solution.” – Secretary Ray LaHood, April 22, 2010

Annex: Additional Slides
51

What DOT is already doing
CAFE standards announced in April 2010 will save 900 mmt CO2e and 1.8 billion barrels of oil over life of vehicles
Medium and heavy-duty truck fuel economy – new statutory authority
NextGen to improve aviation mobility, performance, and efficiency
Sustainable Communities Partnership supports low carbon transportation
52

14%
23%
20%
25%
18%
2000Actual
12%
17%
16%31%
24%
2030Most Aggressive
<0.6 DU/acre0.6-2.5 DU/acre2.5-5.0 DU/acre5.0-12.5 DU/acre>12.5 DU/acre
10%
12%
12%
37%
29%
2050Most Aggressive
Travel Activity: Land Use
Shift muted by existing developmentUnder Moving Cooler most aggressive scenario, new development at higher density, but low density areas remain, and rural unchanged.
53
Very low density, <0.6 dwelling units / residential acreLow density, 0.6-2.5 dwelling units / residential acreMedium-low density, 2.5-5 dwelling units / residential acreMedium-high density, 5-12.5 dwelling units / residential acreHigh density, >12.5 dwelling units / residential acre
U.S. Urban Population