Embed Size (px)
Citation preview
Freight Performance Indicators –
“Map the Gap”
Sudhir Gota
Consultant / Advisor
Regional Workshop on Green Freight & Logistics in Southeast Asia
2-3 June 2016
Bangkok
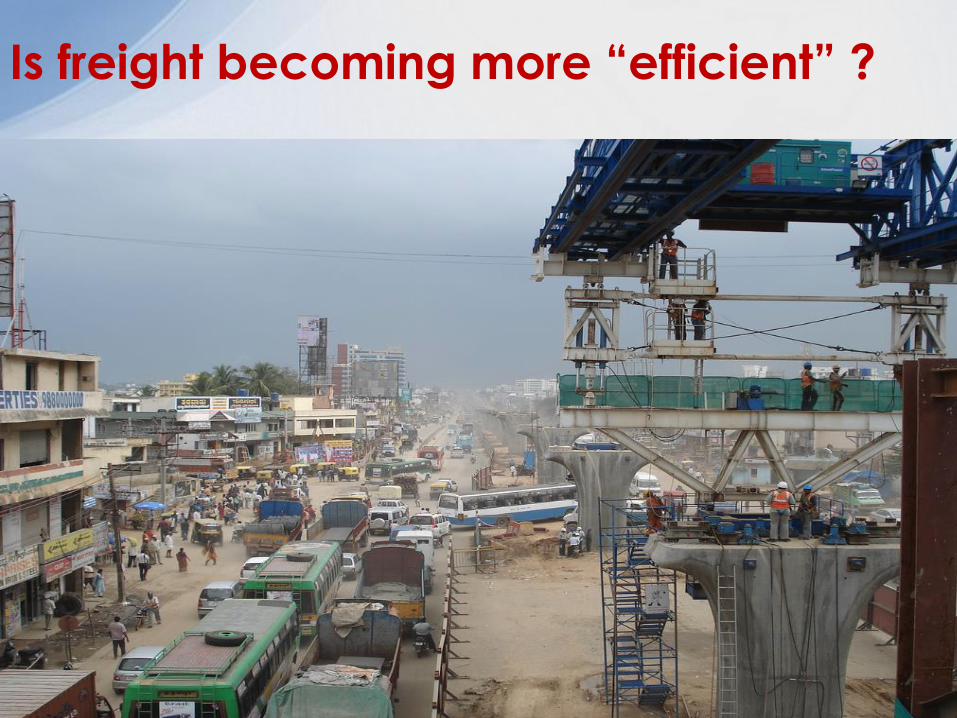
Is freight becoming more “efficient” ?
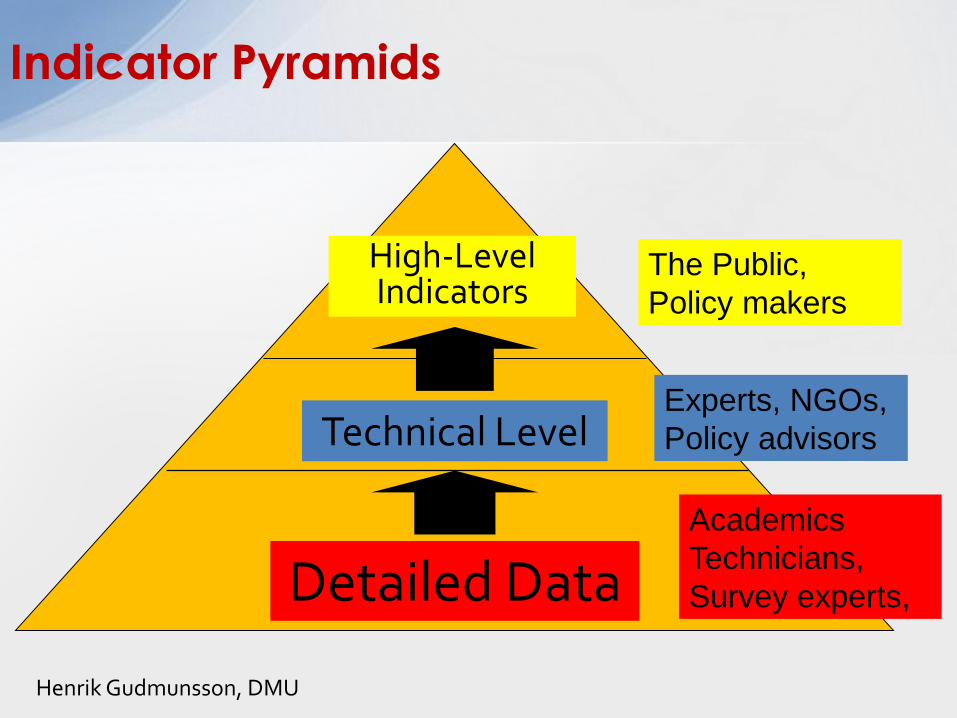
High-Level Indicators
Detailed Data
Technical Level
The Public,
Policy makers
Experts, NGOs,
Policy advisors
Academics
Technicians,
Survey experts,
Indicator Pyramids
Henrik Gudmunsson, DMU
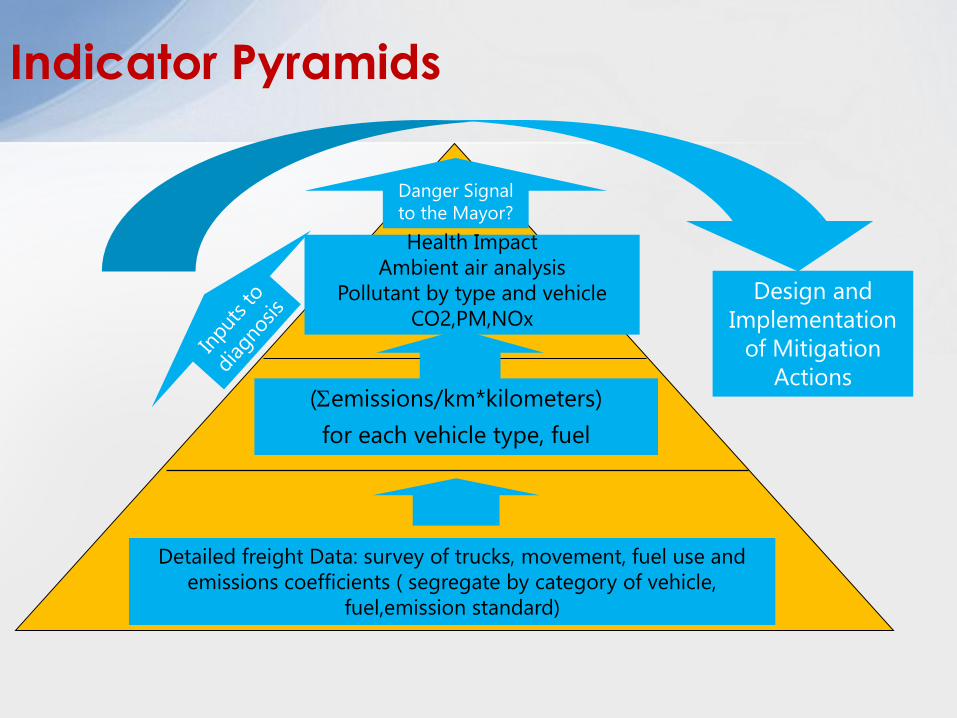
Indicator Pyramids
Health Impact
Ambient air analysis
Pollutant by type and vehicle
CO2,PM,NOx
Detailed freight Data: survey of trucks, movement, fuel use and
emissions coefficients ( segregate by category of vehicle,
fuel,emission standard)
(emissions/km*kilometers)
for each vehicle type, fuel
Danger Signal
to the Mayor?
Design and
Implementation
of Mitigation
Actions
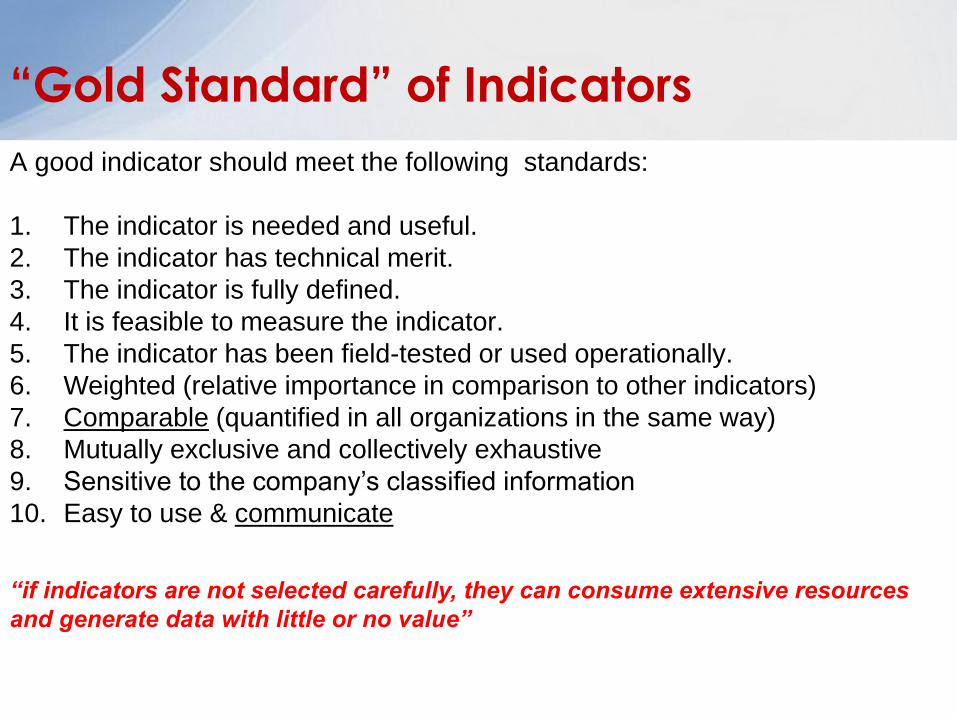
A good indicator should meet the following standards:
1. The indicator is needed and useful.
2. The indicator has technical merit.
3. The indicator is fully defined.
4. It is feasible to measure the indicator.
5. The indicator has been field-tested or used operationally.
6. Weighted (relative importance in comparison to other indicators)
7. Comparable (quantified in all organizations in the same way)
8. Mutually exclusive and collectively exhaustive
9. Sensitive to the company’s classified information
10. Easy to use & communicate
“Gold Standard” of Indicators
“if indicators are not selected carefully, they can consume extensive resources
and generate data with little or no value”
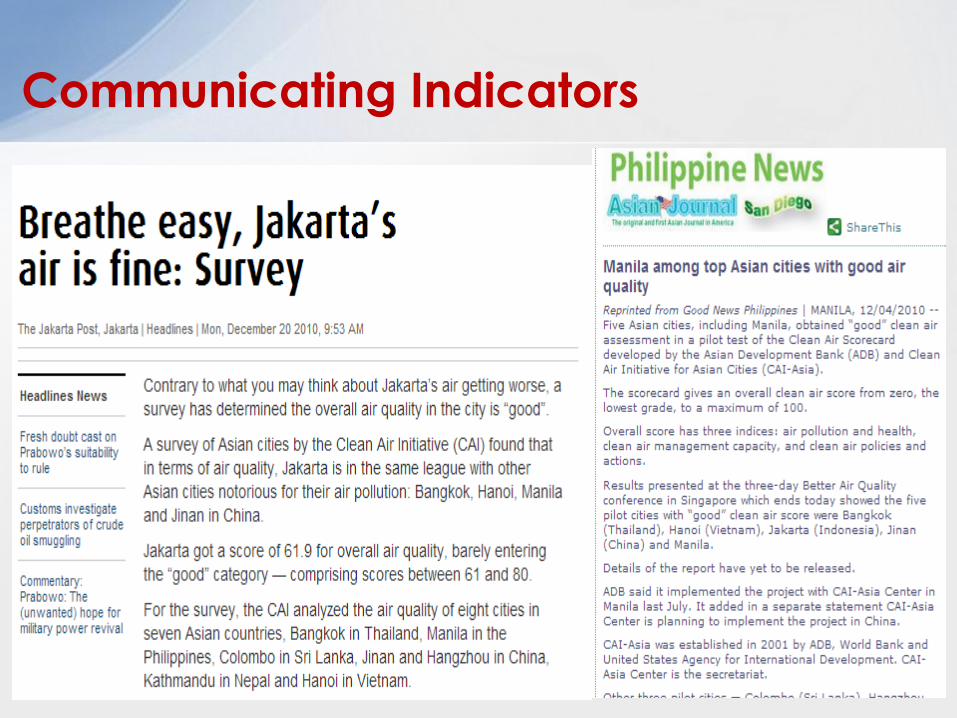
Communicating Indicators
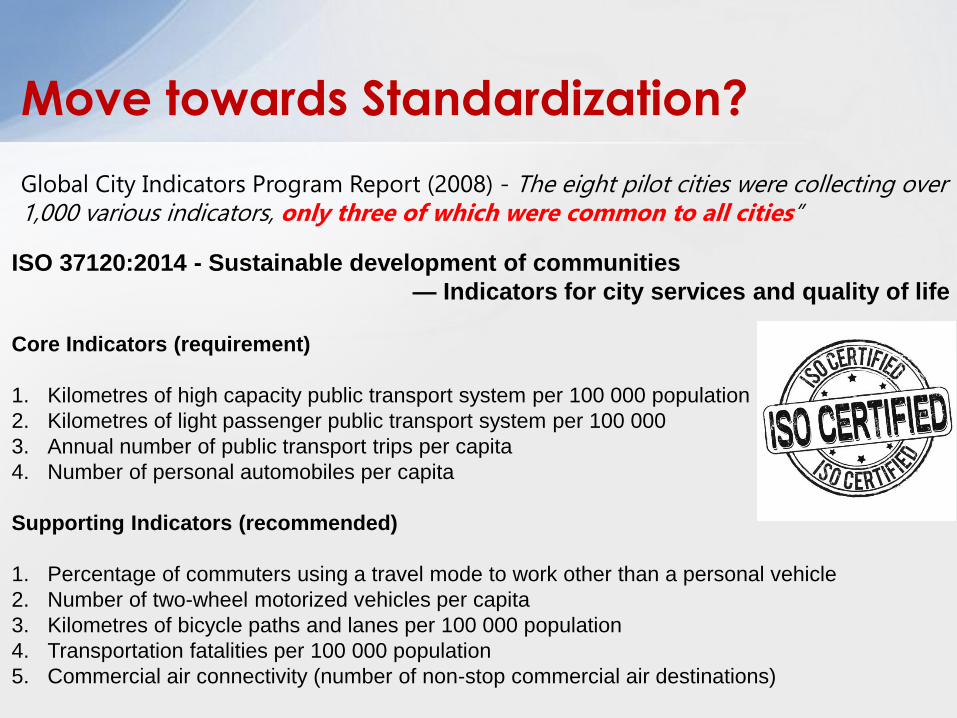
ISO 37120:2014 - Sustainable development of communities
— Indicators for city services and quality of life
Core Indicators (requirement)
1. Kilometres of high capacity public transport system per 100 000 population
2. Kilometres of light passenger public transport system per 100 000
3. Annual number of public transport trips per capita
4. Number of personal automobiles per capita
Supporting Indicators (recommended)
1. Percentage of commuters using a travel mode to work other than a personal vehicle
2. Number of two-wheel motorized vehicles per capita
3. Kilometres of bicycle paths and lanes per 100 000 population
4. Transportation fatalities per 100 000 population
5. Commercial air connectivity (number of non-stop commercial air destinations)
Move towards Standardization?
Global City Indicators Program Report (2008) - The eight pilot cities were collecting over 1,000 various indicators, only three of which were common to all cities”
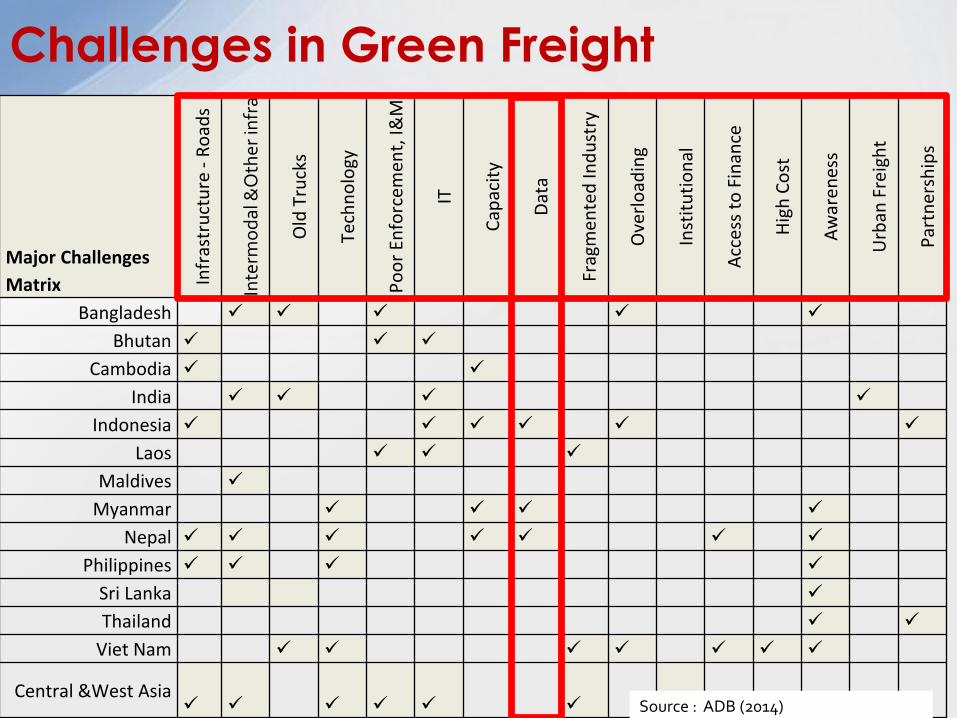
Major Challenges
Matrix Infr
astr
uct
ure
-R
oad
s
Inte
rmo
dal
&O
ther
infr
a
Old
Tru
cks
Tech
no
logy
Po
or
Enfo
rcem
ent,
I&M
IT
Cap
acit
y
Dat
a
Frag
men
ted
Ind
ust
ry
Ove
rlo
adin
g
Inst
itu
tio
nal
Acc
ess
to F
inan
ce
Hig
h C
ost
Aw
aren
ess
Urb
an F
reig
ht
Par
tner
ship
s
Bangladesh
Bhutan
Cambodia
India
Indonesia
Laos
Maldives
Myanmar
Nepal
Philippines
Sri Lanka
Thailand
Viet Nam
Central &West Asia Source : ADB (2014)
Challenges in Green Freight
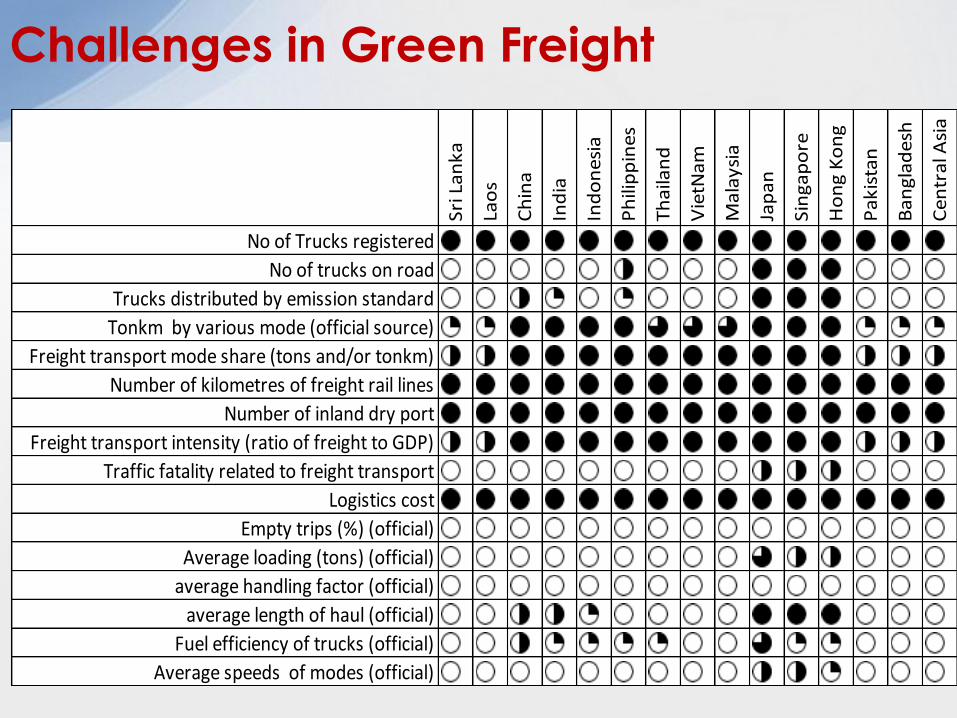
Challenges in Green Freight
Sri
La
nk
a
Lao
s
Ch
ina
Ind
ia
Ind
on
esi
a
Ph
ilip
pin
es
Th
aila
nd
Vie
tNa
m
Ma
lay
sia
Jap
an
Sin
ga
po
re
Ho
ng
Ko
ng
Pa
kis
tan
Ba
ng
lad
esh
Ce
ntr
al A
sia
No of Trucks registered
No of trucks on road
Trucks distributed by emission standard
Tonkm by various mode (official source)
Freight transport mode share (tons and/or tonkm)
Number of kilometres of freight rail lines
Number of inland dry port
Freight transport intensity (ratio of freight to GDP)
Traffic fatality related to freight transport
Logistics cost
Empty trips (%) (official)
Average loading (tons) (official)
average handling factor (official)
average length of haul (official)
Fuel efficiency of trucks (official)
Average speeds of modes (official)
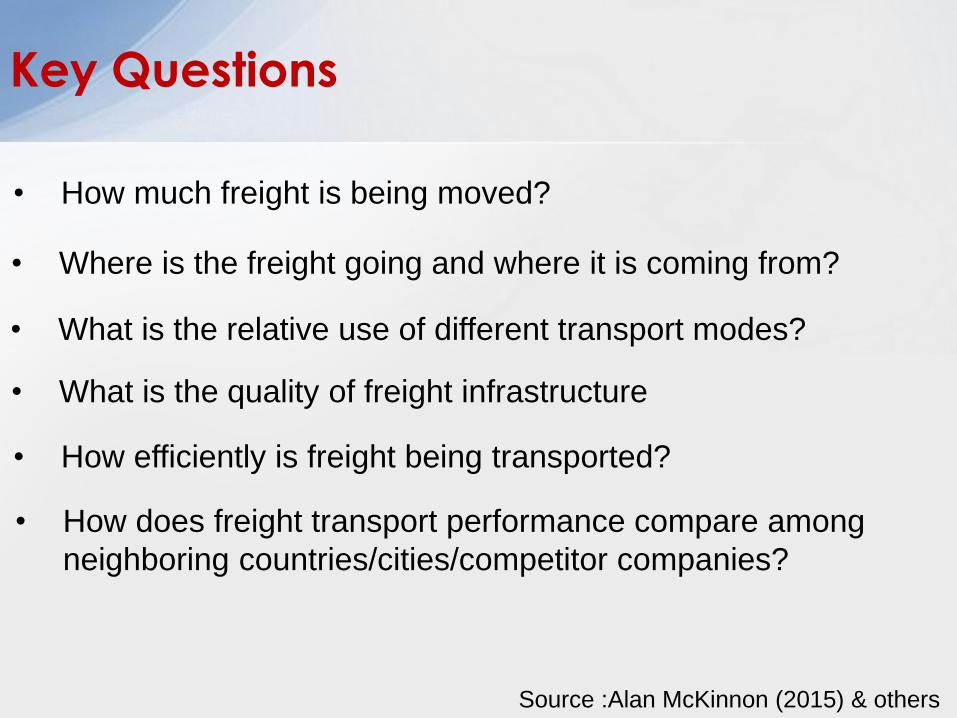
Key Questions
• How much freight is being moved?
• Where is the freight going and where it is coming from?
• What is the relative use of different transport modes?
• How efficiently is freight being transported?
Source :Alan McKinnon (2015) & others
• How does freight transport performance compare among
neighboring countries/cities/competitor companies?
• What is the quality of freight infrastructure
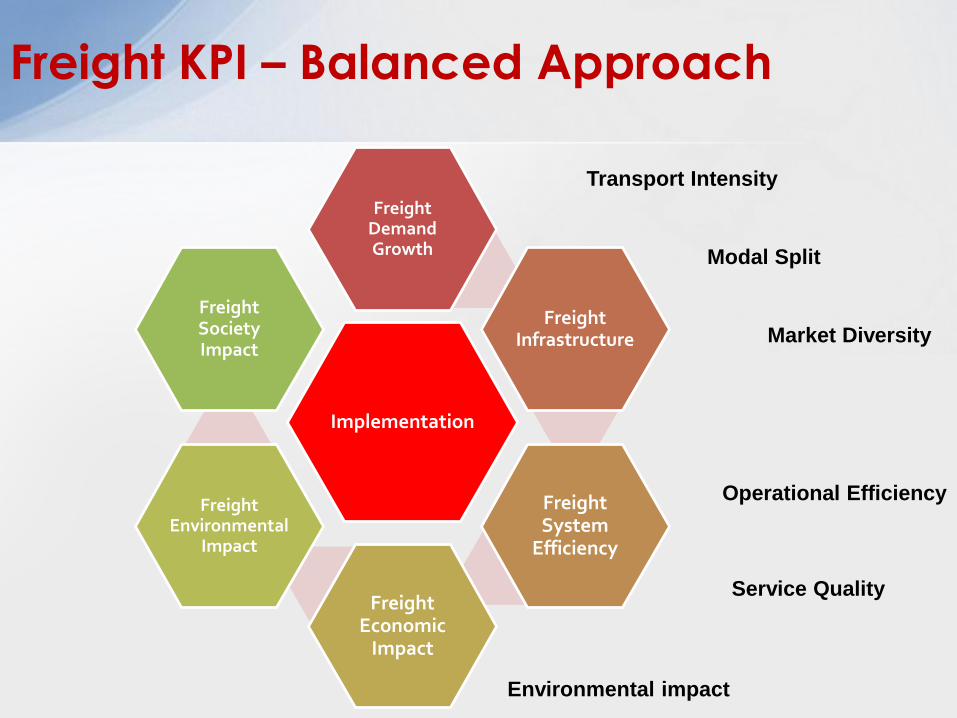
Implementation
Freight Demand Growth
Freight Infrastructure
Freight System
Efficiency
Freight Economic
Impact
Freight Environmental
Impact
Freight Society Impact
Freight KPI – Balanced Approach
Transport Intensity
Modal Split
Market Diversity
Operational Efficiency
Service Quality
Environmental impact
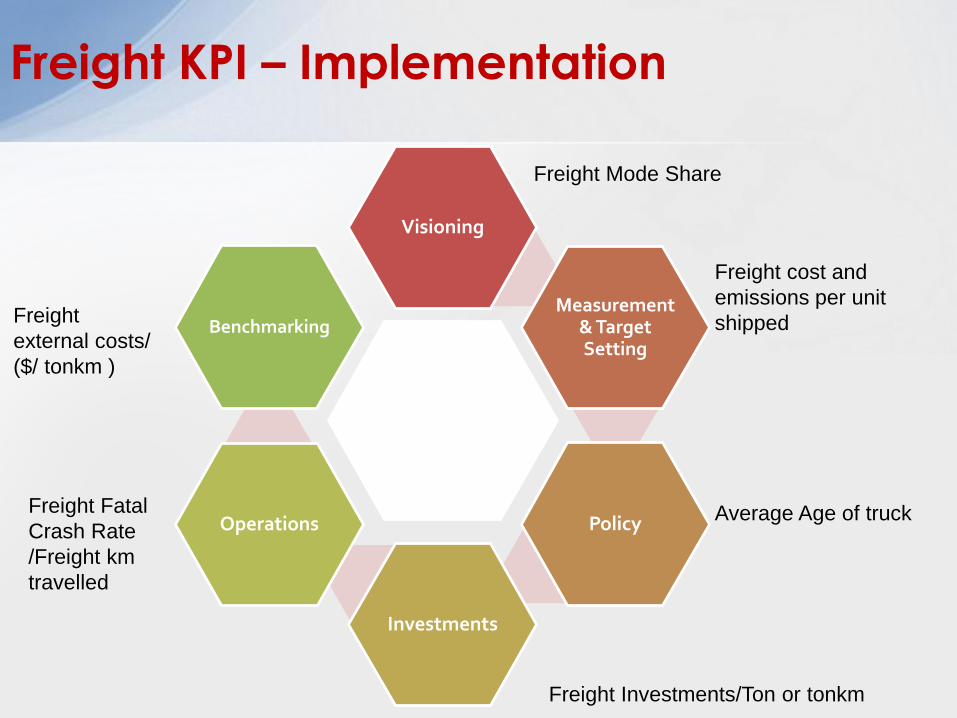
Visioning
Measurement & Target Setting
Policy
Investments
Operations
Benchmarking
Freight Mode Share
Freight cost and
emissions per unit
shipped
Average Age of truck
Freight Investments/Ton or tonkm
Freight Fatal
Crash Rate
/Freight km
travelled
Freight
external costs/
($/ tonkm )
Freight KPI – Implementation
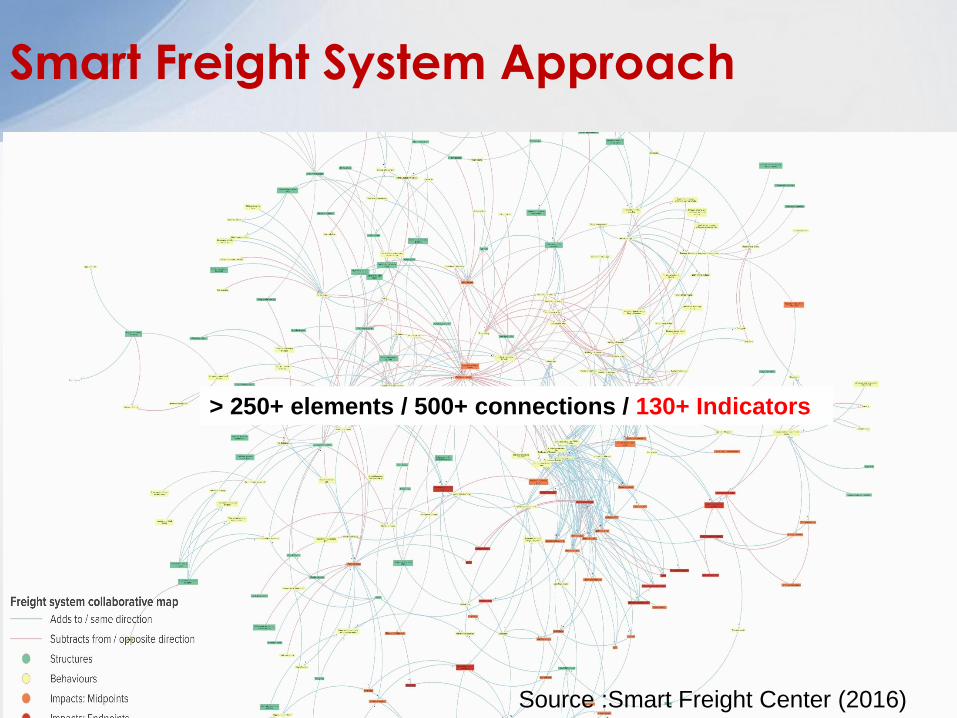
Smart Freight System Approach
> 250+ elements / 500+ connections / 130+ Indicators
Source :Smart Freight Center (2016)

Examples
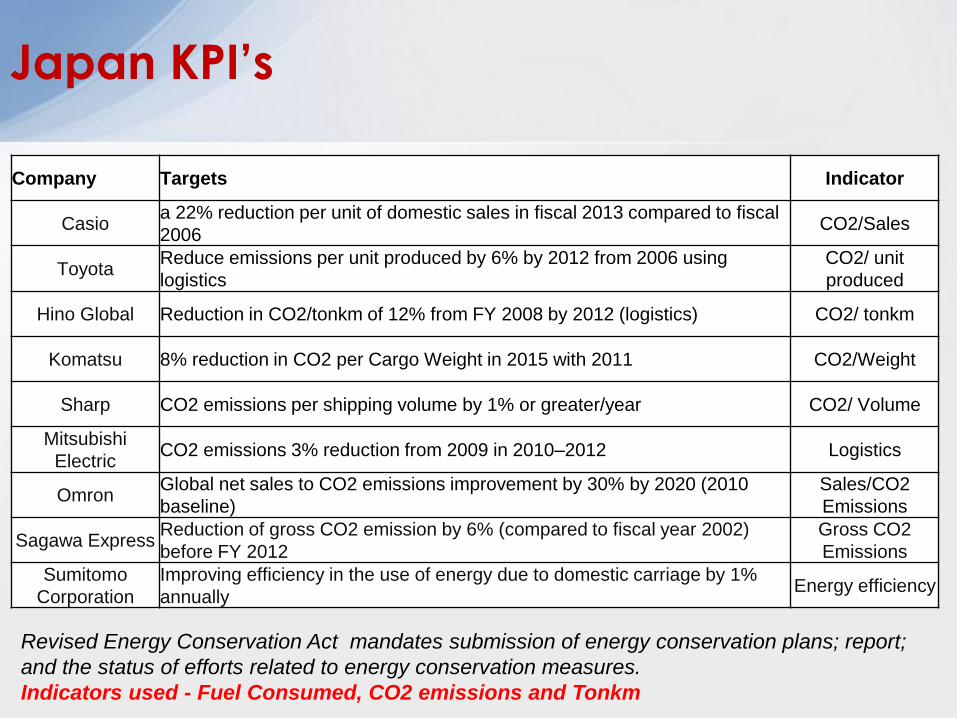
Company Targets Indicator
Casio a 22% reduction per unit of domestic sales in fiscal 2013 compared to fiscal
2006 CO2/Sales
Toyota Reduce emissions per unit produced by 6% by 2012 from 2006 using
logistics
CO2/ unit
produced
Hino Global Reduction in CO2/tonkm of 12% from FY 2008 by 2012 (logistics) CO2/ tonkm
Komatsu 8% reduction in CO2 per Cargo Weight in 2015 with 2011 CO2/Weight
Sharp CO2 emissions per shipping volume by 1% or greater/year CO2/ Volume
Mitsubishi
ElectricCO2 emissions 3% reduction from 2009 in 2010–2012 Logistics
OmronGlobal net sales to CO2 emissions improvement by 30% by 2020 (2010
baseline)
Sales/CO2
Emissions
Sagawa ExpressReduction of gross CO2 emission by 6% (compared to fiscal year 2002)
before FY 2012
Gross CO2
Emissions
Sumitomo
Corporation
Improving efficiency in the use of energy due to domestic carriage by 1%
annuallyEnergy efficiency
Revised Energy Conservation Act mandates submission of energy conservation plans; report;
and the status of efforts related to energy conservation measures.
Indicators used - Fuel Consumed, CO2 emissions and Tonkm
Japan KPI’s
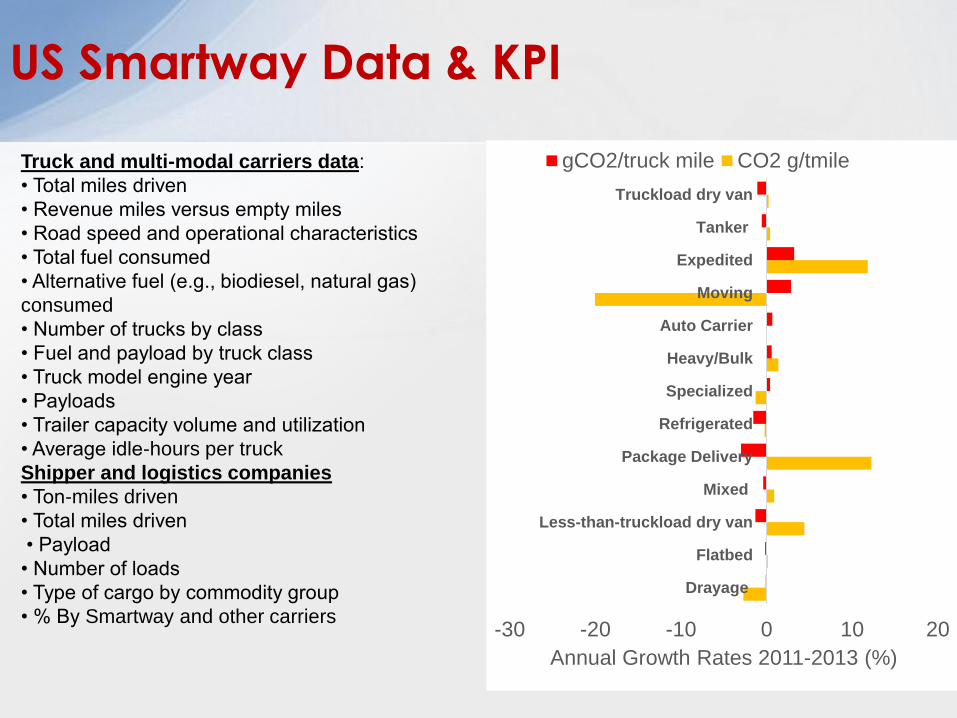
-30 -20 -10 0 10 20
Drayage
Flatbed
Less-than-truckload dry van
Mixed
Package Delivery
Refrigerated
Specialized
Heavy/Bulk
Auto Carrier
Moving
Expedited
Tanker
Truckload dry van
Annual Growth Rates 2011-2013 (%)
gCO2/truck mile CO2 g/tmile
US Smartway Data & KPI
Truck and multi-modal carriers data:
• Total miles driven
• Revenue miles versus empty miles
• Road speed and operational characteristics
• Total fuel consumed
• Alternative fuel (e.g., biodiesel, natural gas)
consumed
• Number of trucks by class
• Fuel and payload by truck class
• Truck model engine year
• Payloads
• Trailer capacity volume and utilization
• Average idle-hours per truck
Shipper and logistics companies
• Ton-miles driven
• Total miles driven
• Payload
• Number of loads
• Type of cargo by commodity group
• % By Smartway and other carriers
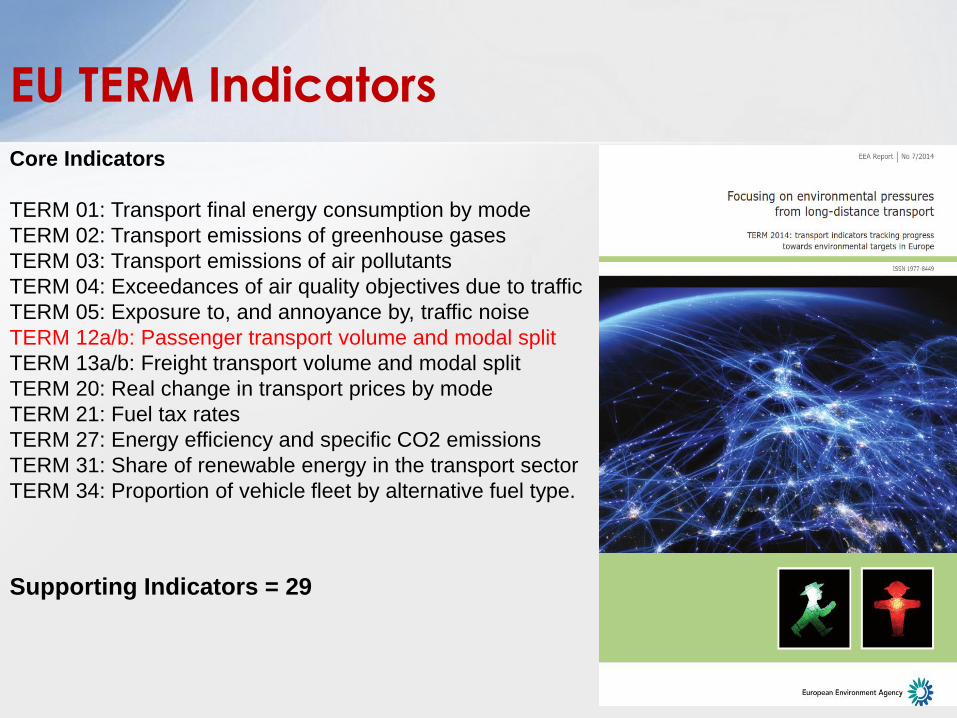
EU TERM Indicators
Core Indicators
TERM 01: Transport final energy consumption by mode
TERM 02: Transport emissions of greenhouse gases
TERM 03: Transport emissions of air pollutants
TERM 04: Exceedances of air quality objectives due to traffic
TERM 05: Exposure to, and annoyance by, traffic noise
TERM 12a/b: Passenger transport volume and modal split
TERM 13a/b: Freight transport volume and modal split
TERM 20: Real change in transport prices by mode
TERM 21: Fuel tax rates
TERM 27: Energy efficiency and specific CO2 emissions
TERM 31: Share of renewable energy in the transport sector
TERM 34: Proportion of vehicle fleet by alternative fuel type.
Supporting Indicators = 29
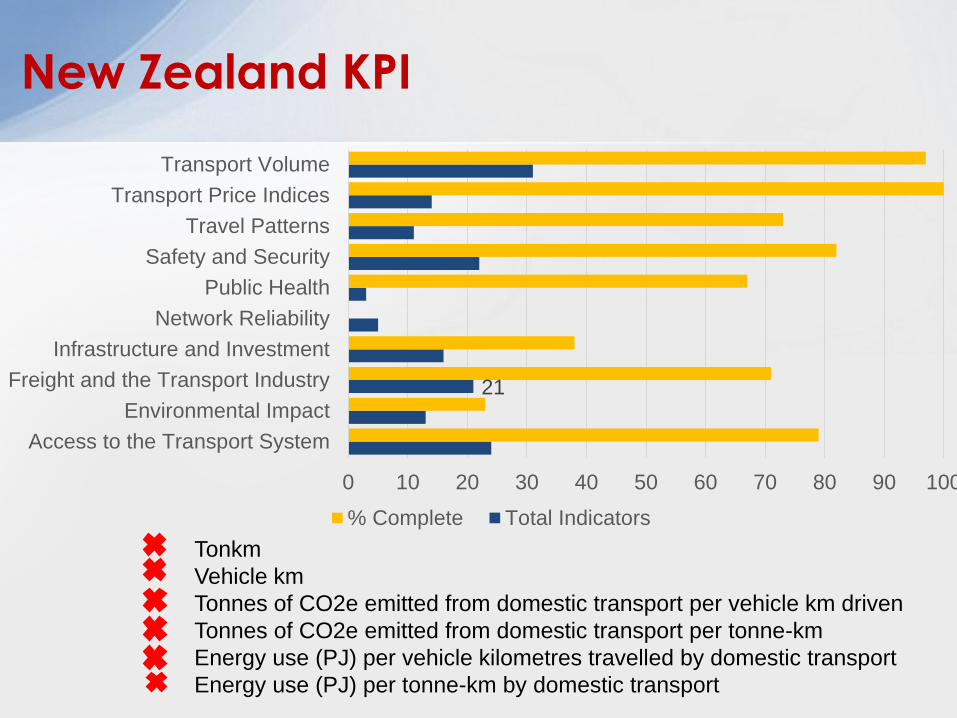
New Zealand KPI
21
0 10 20 30 40 50 60 70 80 90 100
Access to the Transport System
Environmental Impact
Freight and the Transport Industry
Infrastructure and Investment
Network Reliability
Public Health
Safety and Security
Travel Patterns
Transport Price Indices
Transport Volume
% Complete Total Indicators
Tonkm
Vehicle km
Tonnes of CO2e emitted from domestic transport per vehicle km driven
Tonnes of CO2e emitted from domestic transport per tonne-km
Energy use (PJ) per vehicle kilometres travelled by domestic transport
Energy use (PJ) per tonne-km by domestic transport
France KPI
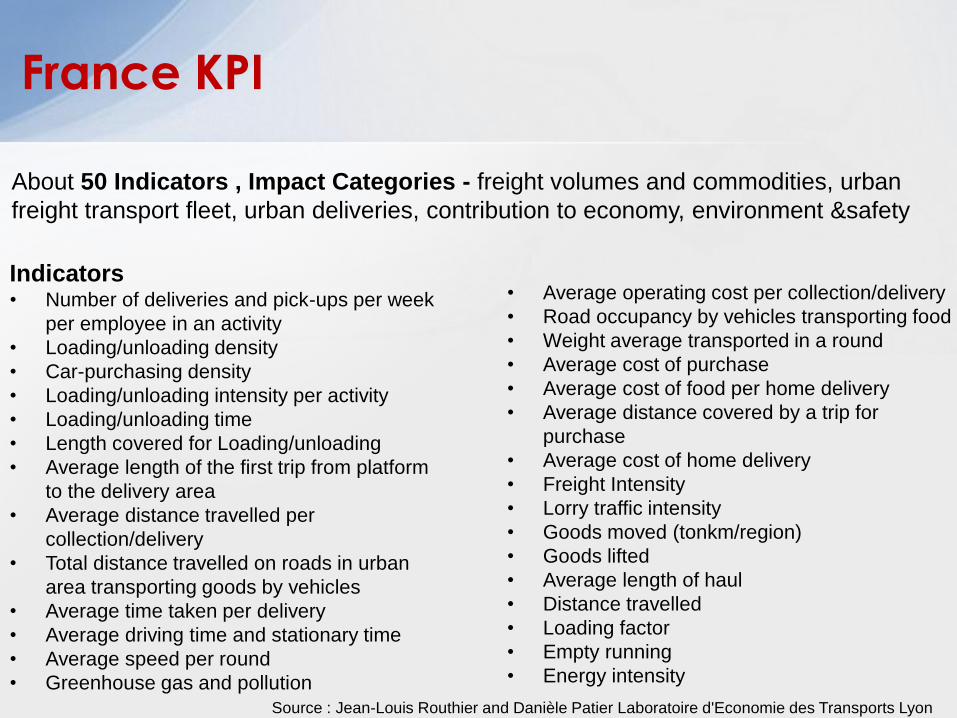
Indicators• Number of deliveries and pick-ups per week
per employee in an activity
• Loading/unloading density
• Car-purchasing density
• Loading/unloading intensity per activity
• Loading/unloading time
• Length covered for Loading/unloading
• Average length of the first trip from platform
to the delivery area
• Average distance travelled per
collection/delivery
• Total distance travelled on roads in urban
area transporting goods by vehicles
• Average time taken per delivery
• Average driving time and stationary time
• Average speed per round
• Greenhouse gas and pollution
• Average operating cost per collection/delivery
• Road occupancy by vehicles transporting food
• Weight average transported in a round
• Average cost of purchase
• Average cost of food per home delivery
• Average distance covered by a trip for
purchase
• Average cost of home delivery
• Freight Intensity
• Lorry traffic intensity
• Goods moved (tonkm/region)
• Goods lifted
• Average length of haul
• Distance travelled
• Loading factor
• Empty running
• Energy intensity
Source : Jean-Louis Routhier and Danièle Patier Laboratoire d'Economie des Transports Lyon
About 50 Indicators , Impact Categories - freight volumes and commodities, urban
freight transport fleet, urban deliveries, contribution to economy, environment &safety
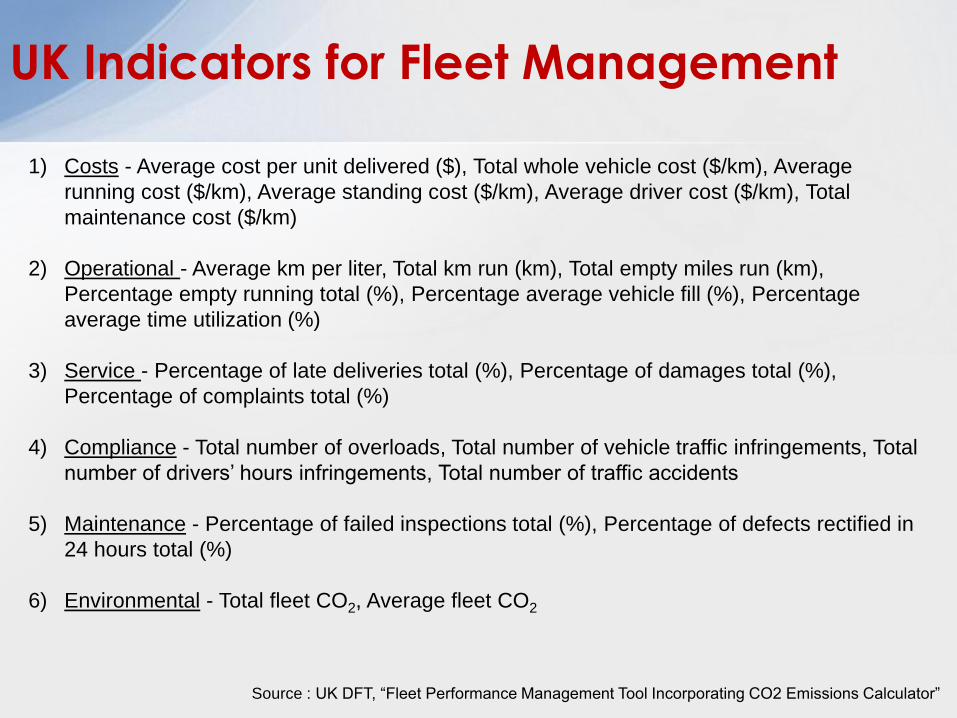
UK Indicators for Fleet Management
1) Costs - Average cost per unit delivered ($), Total whole vehicle cost ($/km), Average
running cost ($/km), Average standing cost ($/km), Average driver cost ($/km), Total
maintenance cost ($/km)
2) Operational - Average km per liter, Total km run (km), Total empty miles run (km),
Percentage empty running total (%), Percentage average vehicle fill (%), Percentage
average time utilization (%)
3) Service - Percentage of late deliveries total (%), Percentage of damages total (%),
Percentage of complaints total (%)
4) Compliance - Total number of overloads, Total number of vehicle traffic infringements, Total
number of drivers’ hours infringements, Total number of traffic accidents
5) Maintenance - Percentage of failed inspections total (%), Percentage of defects rectified in
24 hours total (%)
6) Environmental - Total fleet CO2, Average fleet CO2
Source : UK DFT, “Fleet Performance Management Tool Incorporating CO2 Emissions Calculator”
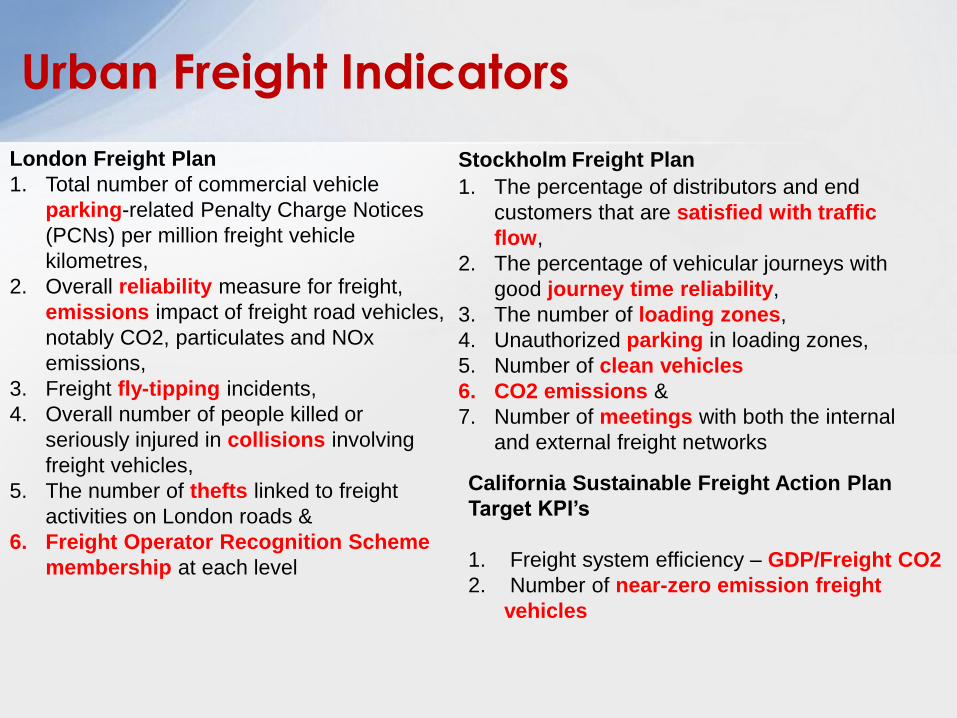
Urban Freight Indicators
London Freight Plan
1. Total number of commercial vehicle
parking-related Penalty Charge Notices
(PCNs) per million freight vehicle
kilometres,
2. Overall reliability measure for freight,
emissions impact of freight road vehicles,
notably CO2, particulates and NOx
emissions,
3. Freight fly-tipping incidents,
4. Overall number of people killed or
seriously injured in collisions involving
freight vehicles,
5. The number of thefts linked to freight
activities on London roads &
6. Freight Operator Recognition Scheme
membership at each level
Stockholm Freight Plan
1. The percentage of distributors and end
customers that are satisfied with traffic
flow,
2. The percentage of vehicular journeys with
good journey time reliability,
3. The number of loading zones,
4. Unauthorized parking in loading zones,
5. Number of clean vehicles
6. CO2 emissions &
7. Number of meetings with both the internal
and external freight networks
California Sustainable Freight Action Plan
Target KPI’s
1. Freight system efficiency – GDP/Freight CO2
2. Number of near-zero emission freight
vehicles
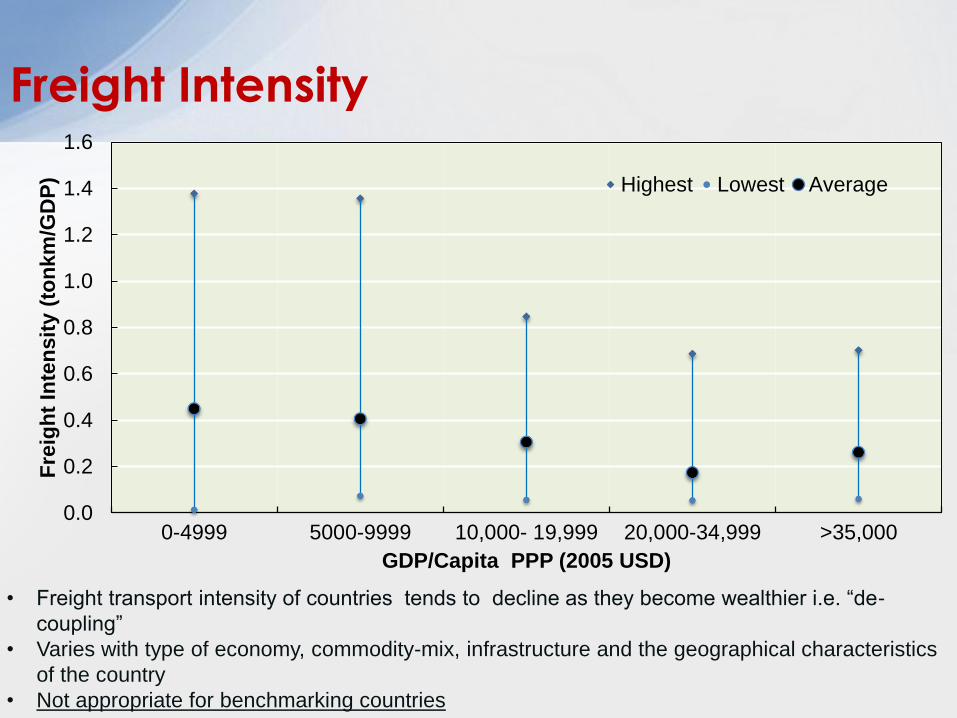
Freight Intensity
0.0
0.2
0.4
0.6
0.8
1.0
1.2
1.4
1.6
0-4999 5000-9999 10,000- 19,999 20,000-34,999 >35,000
Fre
igh
t In
ten
sit
y (
ton
km
/GD
P)
GDP/Capita PPP (2005 USD)
Highest Lowest Average
• Freight transport intensity of countries tends to decline as they become wealthier i.e. “de-
coupling”
• Varies with type of economy, commodity-mix, infrastructure and the geographical characteristics
of the country
• Not appropriate for benchmarking countries
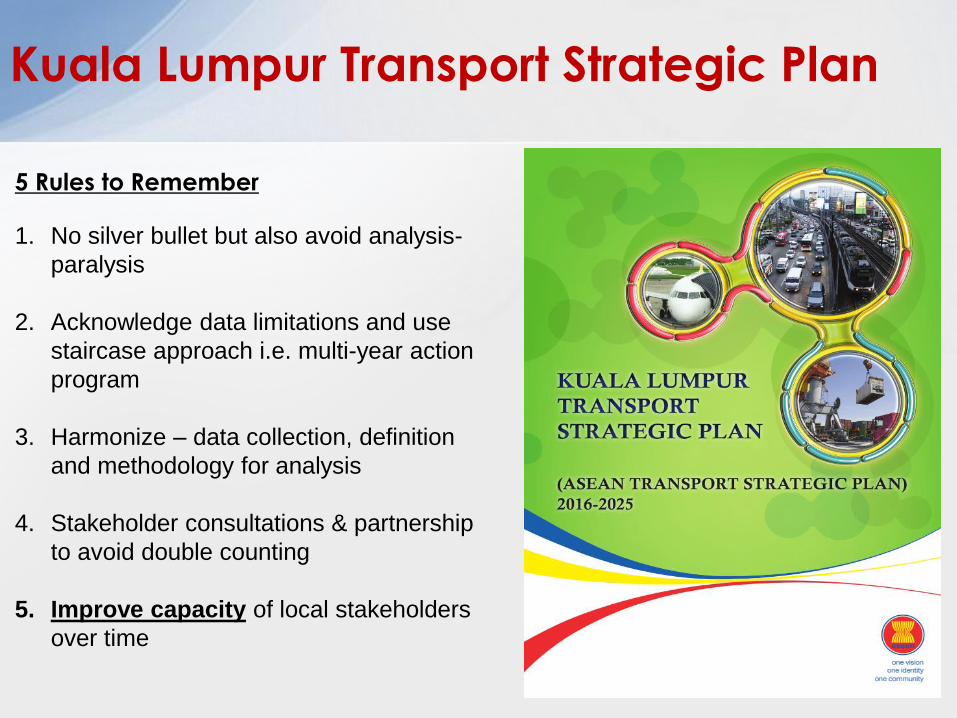
Kuala Lumpur Transport Strategic Plan
1. No silver bullet but also avoid analysis-
paralysis
2. Acknowledge data limitations and use
staircase approach i.e. multi-year action
program
3. Harmonize – data collection, definition
and methodology for analysis
4. Stakeholder consultations & partnership
to avoid double counting
5. Improve capacity of local stakeholders
over time
5 Rules to Remember
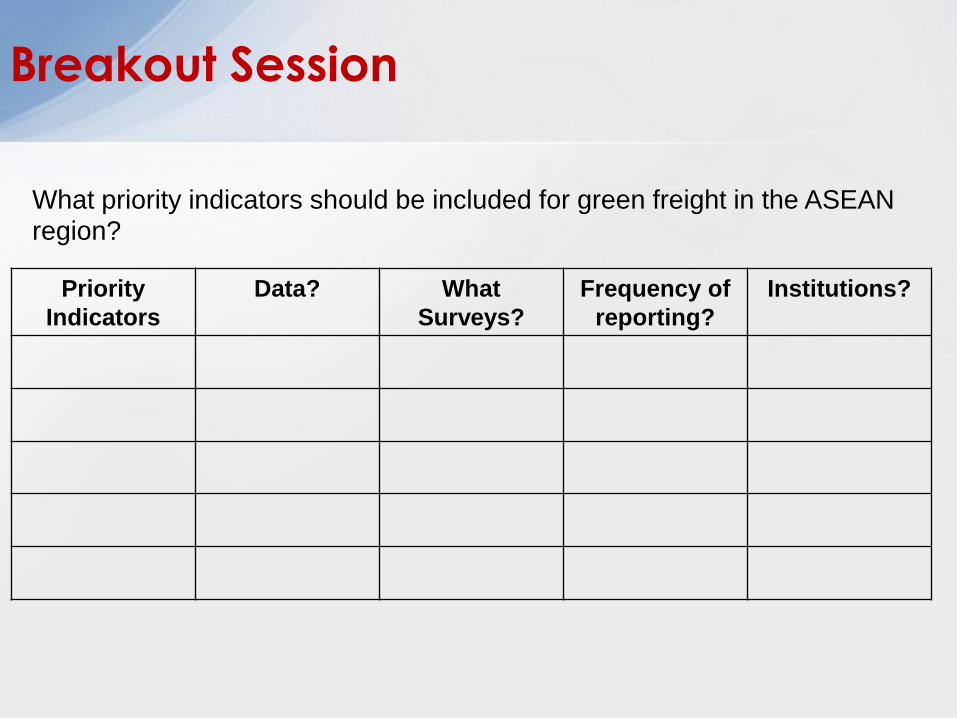
Breakout Session
Priority
Indicators
Data? What
Surveys?
Frequency of
reporting?
Institutions?
What priority indicators should be included for green freight in the ASEAN region?

sudhirgota
Skype - sudhirgota
Thank you
Lee Schipper 1947-2011