Embed Size (px)
Citation preview

U.S. DEPARTMENT OF COMMERCETechnology AdmistrationNational Institute of Standards and TechnologyComputer Systems LaboratoryGaithersburg, MD 20899
Software Error Analysis
NIST Special Publication 500-209
Wendy W. PengDolores R. WallaceMarch 1993
ABSTRACT
This document provides guidance on software error analysis. Software error analysis includes error detection, analysis,and resolution. Error detection techniques considered in the study are those used in software development, softwarequality assurance, and software verification, validation and testing activities. These techniques are those frequently citedin technical literature and software engineering standards or those representing new approaches to support errordetection. The study includes statistical process control techniques and relates them to their use as a software qualityassurance technique for both product and process improvement. Finally, the report describes several software reliabilitymodels.
KEYWORDS
Data Collection; Error Detection; Error Removal; High Integrity Software; Metrics; Software Error Analysis; SoftwareQuality Assurance; Software Verification and Validation; Statistical Process Control
EXECUTIVE SUMMARY
The main purpose of this document is to provide the software engineering community with current information regardingerror analysis for software, which will assist them to do the following:
-- Understand how error analysis can aid in improving the software development process;●
-- Assess the quality of the software, with the aid of error detection techniques;●
-- Analyze errors for their cause and then fix the errors; and●
-- Provide guidelines for the evaluation of high-integrity software.●
The software industry is currently still young, without sufficient knowledge and adequate standards to guaranteefault-free software. Although research continues to identify better processes for error prevention, with current practices,errors will probably occur during software development and maintenance. Hence, there is the need for error analysis.Error analysis for software includes the activities of detecting errors, collecting and recording error data, analyzing andremoving single errors, and analyzing collective error data to remove classes of errors. The collective error data may beused with statistical process control (SPC) techniques to improve the product and the processes used in developing,maintaining, and assuring the quality of software.
This report provides a description of error detection techniques which are cited frequently in technical literature andstandards and describes the cost benefits of applying error detection early in the lifecycle. However, error detection alone

is not sufficient for removal of an error. Information must be recorded about the error to assist in the analysis of its cause,its removal, and its relationship to the project and to other similar projects. This report provides guidance on datacollection, analysis, and removal as well as error detection.
This report describes how several SPC techniques can be used for software quality assurance technique and for processimprovement. The report identifies metrics related to software error detection and identifies several software reliabilityestimation models. Metrics are used to assess the product or process, while SPC techniques are used to monitor a projectby observing trends. SPC techniques help to locate major problems in the development process, the assurance processes(e.g., software quality assurance, verification and validation), and the product itself.
The study of software engineering standards reported in [NUREG, NIST204] indicates that standards are beginning toassociate requirements for error detection techniques with the quality requirements and problem types of the softwareproject implementing the standard. Further examination of these documents and additional standards and guidelines forhigh integrity software indicates that these documents vary widely in their recommendations of specific error techniques.Appendix B provides a summary of the error detection techniques required or recommended by these documents for theassurance of the quality of high integrity software.
This report recommends collection of error data into an organizational database for use by a vendor (1) over severalprojects, and modified collections of these databases for use by government auditors (e.g., Nuclear RegulatoryCommission, Environmental Protection Agency). Software organizations should consider institutionalizing mechanismsfor establishing and maintaining a database of error analysis data within their organization. Over time, it may becomeapparent that some error analysis techniques are more effective than others with respect to a given type of problem. Itmay also become apparent that problems in these areas occur most often with certain development practices and lessfrequently with others. The database must contain both developmental and operational error data to be effective. In theregulators' environment, auditors may use the information in the database to identify the most error-prone features ofspecific high integrity systems and may ensure that their audits examine these features carefully. The auditors may usethe data to identify acceptance limits on different aspects of a high integrity system.
An organizational database may also play an important role in software reuse within an organization. In deciding whetheror not to reuse a particular software component, one can examine its error history to determine whether it satisfies thelevel of assurance required by the intended application. One can evaluate the component by observing its past failurerates and fault densities to ensure that the component is appropriate for reuse. A software component may sometimes bereused to build a system which is of a higher level of assurance than that in which the component was originally used.The database would provide data on the reliability or other quality attributes to help determine how much additional workis needed to increase the quality of the component to the desired level.~~~~~~~~~~~~~~~~~~~~~~~~~~~~~~~~~~~~~~~~~~~~(1) In this report, the term "vendor" includes software developers.~~~~~~~~~~~~~~~~~~~~~~~~~~~~~~~~~~~~~~~~~~~~
TABLE OF CONTENTSABSTRACT●
EXECUTIVE SUMMARY●
1. OVERVIEW●
1.1. Definitions●
2. INTRODUCTION TO SOFTWARE ERROR ANALYSIS●
2.1. Cost Benefits of Early Error Detection●
2.2. Approach to Selecting Error Analysis Techniques●
3. TECHNIQUES FOR DETECTING ERRORS●
3.1. Classes of Error Detection Techniques●

3.2. Techniques Used During the Lifecycle
■ 3.2.1. Requirements
■ 3.2.2. Design
■ 3.2.3. Implementation
■ 3.2.4. Test
■ 3.2.5. Installation and Checkout
■ 3.2.6. Operation and Maintenance
●
3.3. Benefits of Classes of Error Detection Techniques●
4. REMOVAL OF ERRORS●
4.1. Identification●
4.2. Investigation●
4.3. Resolution
■ 4.3.1. Resolution Plan
■ 4.3.2. Resolution Action
■ 4.3.3. Corrective Action
■ 4.3.4. Follow-up
●
4.4. Use of Individual Error Data●
5. TECHNIQUES FOR THE COLLECTION AND ANALYSIS OF ERROR DATA●
5.1. Error History Profile / Database●
5.2. Data Collection Process●
5.3. Metrics
■ 5.3.1. Metrics Throughout the Lifecycle
■ 5.3.1.1. Metrics Used in All Phases
■ 5.3.1.2. Requirements Metrics
■ 5.3.1.3. Design Metrics
■ 5.3.1.4. Implementation Metrics
■ 5.3.1.5. Test Metrics
■ 5.3.1.6. Installation and Checkout Metrics
■ 5.3.1.7. Operation and Maintenance Metrics
●
5.4. Statistical Process Control Techniques
■ 5.4.1. Control Chart
■ 5.4.2. Run Chart
■ 5.4.3. Bar Graph
■ 5.4.4. Histogram
■ 5.4.5. Scatter Diagram
■ 5.4.6. Method of Least Squares (Regression Technique)
●
5.5. Software Reliability Estimation Models●
6. SUMMARY●
7. REFERENCES●

APPENDIX A. ERROR DETECTION TECHNIQUES●
A.1. Algorithm Analysis●
A.2. Back-to-Back Testing●
A.3. Boundary Value Analysis●
A.4. Control Flow Analysis/Diagrams●
A.5. Database Analysis●
A.6. Data Flow Analysis●
A.7. Data Flow Diagrams●
A.8. Decision Tables (Truth Tables)●
A.9. Desk Checking (Code Reading)●
A.10. Error Seeding●
A.11. Finite State Machines●
A.12. Formal Methods (Formal Verification, Proof of Correctness, Formal Proof of Program)●
A.13. Information Flow Analysis●
A.14. (Fagan) Inspections●
A.15. Interface Analysis●
A.16. Interface Testing●
A.17. Mutation Analysis●
A.18. Performance Testing●
A.19. Prototyping / Animation●
A.20. Regression Analysis and Testing●
A.21. Requirements Parsing●
A.22. Reviews●
A.23. Sensitivity Analysis●
A.24. Simulation●
A.25. Sizing and Timing Analysis●
A.26. Slicing●
A.27. Software Sneak Circuit Analysis●
A.28. Stress Testing●
A.29. Symbolic Execution●
A.30. Test Certification●
A.31. Traceability Analysis (Tracing). .●
A.32. Walkthroughs●
APPENDIX B. ERROR ANALYSIS TECHNIQUES CITED IN SOFTWARE STANDARDS●
TABLESTable 3-1. Error Detection Techniques and Related Techniques●
Table 5-1. Types of Control Charts●
Table B-1. List of Reviewed Documents●
Table B-2. Error Analysis Techniques Cited in Reviewed Documents●

FIGURESFigure 5-1. Example np Control Chart -●
Figure 5-2a. Example Bar Chart - Customer Ratings●
Figure 5-2b. Example Bar Chart - Number of Modules with n Defects●
Figure 5-3. Example Pareto Chart - Percentage of Defects by Type●
Figure 5-4. Example Histogram●
Figure 5-5. Scatter Diagram With Hypothetical Data - Complexity vs. Defect Density●
1. OVERVIEW
This document provides guidance on software error analysis. Error analysis includes the activities of detecting errors, ofrecording errors singly and across projects, and of analyzing single errors and error data collectively. The purpose oferror analysis is to provide assurance of the quality of high integrity software.
The software industry is currently still young, without sufficient knowledge and adequate standards to guaranteefault-free software. Although research continues to identify better processes for error prevention, with current practices,errors will likely be entered into the software some time during development and maintenance. Hence, there is the needfor error analysis, to aid in detecting, analyzing, and removing the errors.
The main purpose of this study is to provide the software engineering community with current information regardingerror analysis, which will assist them to do the following:
-- Understand how error analysis can aid in improving the software development process;●
-- Assess the quality of software, with the aid of error detection techniques;●
-- Analyze errors for their cause and then fix the errors; and●
-- Provide guidelines for the evaluation of high integrity software.●
Section 2 discusses how error detection and analysis techniques can be used to improve the quality of software. Section 3provides a global description of the principal detection techniques used in each software lifecycle phase and cost benefitsfor selected categories of these techniques. Section 4 provides guidance on collecting individual error data and removingsingle errors. Section 5 describes techniques for the collection and analysis of sets of error data, including statisticalprocess control techniques and software reliability models. Section 6 provides a summary and recommendations based onthis study of error analysis, and Section 7 provides a list of references. Appendix A contains detailed descriptions ofcommon error detection techniques. Appendix B contains the results of a study of standards for high integrity software todetermine the extent of coverage of error analysis techniques.
The error detection techniques and statistical techniques described in this report are a representative sampling of the mostwidely-used techniques and those most frequently referenced in standards, guidelines and technical literature. This reportalso describes the more common software reliability estimation models, most which are described in the AmericanInstitute of Aeronautics and Astronautics (AIAA) draft handbook for software reliability [AIAA]. Inclusion of anytechnique in this report does not indicate endorsement by the National Institute of Standards and Technology (NIST).
1.1. Definitions
Definitions of the following key terms used in this report are based on those in [IEEEGLOSS], [JURAN], [FLORAC],[SQE], [SHOOMAN], and [NIST204]. However, this report does not attempt to differentiate between "defect," "error,"and "fault," since use of these terms within the software community varies (even among standards addressing theseterms). Rather, this report uses those terms in a way which is consistent with the definitions given below, and with otherreferences from which information was extracted.
anomaly. Any condition which departs from the expected. This expectation can come from documentation (e.g.,

requirements specifications, design documents, user documents) or from perceptions or experiences.Note: An anomaly is not necessarily a problem in the software, but a deviation from the expected, so that errors, defects,faults, and failures are considered anomalies.
computed measure. A measure that is calculated from primitive measures.
defect. Any state of unfitness for use, or nonconformance to specification.
error. (1) The difference between a computed, observed, or measured value and the true, specified, or theoreticallycorrect value or condition. (2) An incorrect step, process, or data definition. Often called a bug. (3) An incorrect result.(4) A human action that produces an incorrect result.Note: One distinction assigns definition (1) to error, definition (2) to fault, definition (3) to failure, and definition (4) tomistake.
error analysis. The use of techniques to detect errors, to estimate/predict the number of errors, and to analyze error databoth singly and collectively.
fault. An incorrect step, process, or data definition in a computer program. See also: error.
failure. Discrepancy between the external results of a program's operation and the software product requirements. Asoftware failure is evidence of the existence of a fault in the software.
high integrity software. Software that must and can be trusted to work dependably in some critical function, and whosefailure to do so may have catastrophic results, such as serious injury, loss of life or property, business failure or breach ofsecurity. Examples: nuclear safety systems, medical devices, electronic banking, air traffic control, automatedmanufacturing, and military systems.
primitive measure. A measure obtained by direct observation, often through a simple count (e.g., number of errors in amodule).
primitive metric. A metric whose value is directly measurable or countable.
measure. The numerical value obtained by either direct or indirect measurement; may also be the input, output, or valueof a metric.
metric. The definition, algorithm or mathematical function used to make a quantitative assessment of product or process.
problem. Often used interchangeably with anomaly, although problem has a more negative connotation, and impliesthat an error, fault, failure or defect does exist.
process. Any specific combination of machines, tools, methods, materials and/or people employed to attain specificqualities in a product or service.
reliability (of software). The probability that a given software system operates for some time period, without systemfailure due to a software fault, on the machine for which it was designed, given that it is used within design limits.
statistical process control. The application of statistical techniques for measuring, analyzing, and controlling thevariation in processes.
2. INTRODUCTION TO SOFTWARE ERROR ANALYSIS
Software error analysis includes the techniques used to locate, analyze, and estimate errors and data relating to errors. Itincludes the use of error detection techniques, analysis of single errors, data collection, metrics, statistical process controltechniques, error prediction models, and reliability models.
Error detection techniques are techniques of software development, software quality assurance (SQA), softwareverification, validation and testing used to locate anomalies in software products. Once an anomaly is detected, analysisis performed to determine if the anomaly is an actual error, and if so, to identify precisely the nature and cause of the

error so that it can be properly resolved. Often, emphasis is placed only on resolving the single error. However, the singleerror could be representative of other similar errors which originated from the same incorrect assumptions, or it couldindicate the presence of serious problems in the development process. Correcting only the single error and not addressingunderlying problems may cause further complications later in the lifecycle.
Thorough error analysis includes the collection of error data, which enables the use of metrics and statistical processcontrol (SPC) techniques. Metrics are used to assess a product or process directly, while SPC techniques are used tolocate major problems in the development process and product by observing trends. Error data can be collected over theentire project and stored in an organizational database, for use with the current project or future projects. As an example,SPC techniques may reveal that a large number of errors are related to design, and after further investigation, it isdiscovered that many designers are making similar errors. It may then be concluded that the design methodology isinappropriate for the particular application, or that designers have not been adequately trained. Proper adjustments canthen be made to the development process, which are beneficial not only to the current project, but to future projects.
The collection of error data also supports the use of reliability models to estimate the probability that a system willoperate without failures in a specified environment for a given amount of time. A vendor (2) may use software reliabilityestimation techniques to make changes in the testing process, and a customer may use these techniques in decidingwhether to accept a product.
The error data collected by a vendor may be useful to auditors. Auditors could request that vendors submit error data, butwith the understanding that confidentiality will be maintained and that recriminations will not be made. Data collectedfrom vendors could be used by the auditors to establish a database, providing a baseline for comparison when performingevaluations of high integrity software. Data from past projects would provide guidance to auditors on what to look for, byidentifying common types of errors, or other features related to errors. For example, it could be determined whether theerror rates of the project under evaluation are within acceptable bounds, compared with those of past projects.
~~~~~~~~~~~~~~~~~~~~~~~~~~~~~~~~~~~~~~~~~~~~(2) In this report, the term "vendor" includes software developers.~~~~~~~~~~~~~~~~~~~~~~~~~~~~~~~~~~~~~~~~~~~~
2.1. Cost Benefits of Early Error Detection
Ideally, software development processes should be so advanced that no errors will enter a software system duringdevelopment. Current practices can only help to reduce the number of errors, not prevent all errors. However, even if thebest practices were available, it would be risky to assume that no errors enter a system, especially if it is a systemrequiring high integrity.
The use of error analysis allows for early error detection and correction. When an error made early in the lifecycle goesundetected, problems and costs can accrue rapidly. An incorrectly stated requirement may lead to incorrect assumptionsin the design, which in turn cause subsequent errors in the code. It may be difficult to catch all errors during testing, sinceexhaustive testing, which is testing of the software under all circumstances with all possible input sets, is not possible[MYERS]. Therefore, even a critical error may remain undetected and be delivered along with the final product. Thisundetected error may subsequently cause a system failure, which results in costs not only to fix the error, but also for thesystem failure itself (e.g., plant shutdown, loss of life).
Sometimes the cost of fixing an error may affect a decision not to fix an error. This is particularly true if the error isfound late in the lifecycle. For example, when an error has caused a failure during system test and the location of theerror is found to be in the requirements or design, correcting that error can be expensive. Sometimes the error is allowedto remain and the fix deferred until the next version of the software. Persons responsible for these decisions may justifythem simply on the basis of cost or on an analysis which shows that the error, even when exposed, will not cause acritical failure. Decision makers must have confidence in the analyses used to identify the impact of the error, especiallyfor software used in high integrity systems.
A strategy for avoiding the high costs of fixing errors late in the lifecycle is to prevent the situation from occurringaltogether, by detecting and correcting errors as early as possible. Studies have shown that it is much more expensive tocorrect software requirements deficiencies late in the development effort than it is to have correct requirements from thebeginning [STSC]. In fact, the cost to correct a defect found late in the lifecycle may be more than one hundred times thecost to detect and correct the problem when the defect was born [DEMMY]. In addition to the lower cost of fixingindividual errors, another cost benefit of performing error analysis early in development is that the error propagation rate

will be lower, resulting in fewer errors to correct in later phases. Thus, while error analysis at all phases is important,there is no better time, in terms of cost benefit, to conduct error analysis than during the software requirements phase.
2.2. Approach to Selecting Error Analysis Techniques
Planning for error analysis should be part of the process of planning the software system, along with system hazardanalysis (3) and software criticality analysis. System hazard analysis is used to identify potential events and circumstancesthat might lead to problems of varying degrees of severity, from critical failures resulting in loss of life, to less seriousmalfunctions in the system. Software hazard analysis focuses on the role of the software relative to the hazards. Softwarecriticality analysis may use the results of system and software hazard analyses to identify the software requirements (ordesign and code elements) whose erroneous implementation would cause the most severe consequences. Criticalityanalysis may also be used to identify project requirements that are essential to achieving a working software system.Critical software requirements are traced through the development process, so that developers can identify the softwareelements which are most error-prone, and whose errors would be catastrophic.
The results of hazard analysis and criticality analysis can be used to build an effective error analysis strategy. They aid inchoosing the most appropriate techniques to detect errors during the lifecycle (see sec. 3). They also aid in the planningof the error removal process (i.e., the removal of individual errors, as described in sec. 4). Lastly, they aid in the selectionof metrics, statistical process control techniques, and software reliability estimation techniques, which are described insection 5. Error analysis efforts and resources can be concentrated in critical program areas. Error analysis techniquesshould be chosen according to which type of errors they are best at locating. The selection of techniques should take intoaccount the error profile and the characteristics of the development methodology. No project can afford to apply everytechnique, and no technique guarantees that every error will be caught. Instead, the most appropriate combination oftechniques should be chosen to enable detection of as many errors as possible in the earlier phases.
~~~~~~~~~~~~~~~~~~~~~~~~~~~~~~~~~~~~~~~~~~~~(3) In this report, system hazard analysis may also include analysis of threats to security features of the software.~~~~~~~~~~~~~~~~~~~~~~~~~~~~~~~~~~~~~~~~~~~~
3. TECHNIQUES FOR DETECTING ERRORS
Software development and maintenance involves many processes resulting in a variety of products collectively essentialto the operational software. These products include the statement of the software requirements, software designdescriptions, code (source, object), test documentation, user manuals, project plans, documentation of software qualityassurance activities, installation manuals, and maintenance manuals. These products will probably contain at least someerrors. The techniques described in this section can help to detect these errors. While not all products are necessarilydelivered to the customer or provided to a regulatory agency for review, the customer or regulatory agency should haveassurance that the products contain no errors, contain no more than an agreed upon level of estimated errors, or containno errors of a certain type.
This section of the report identifies classes of error detection techniques, provides brief descriptions of these techniquesfor each phase of the lifecycle, and discusses the benefits for certain categories of these techniques. Detailed descriptionsof selected techniques appear in Appendix A. Detailed checklists provided in [NISTIR] identify typical problems thaterror detection techniques may uncover.
Error detection techniques may be performed by any organization responsible for developing and assuring the quality ofthe product. In this report, the term "developer" is used to refer to developers, maintainers, software quality assurancepersonnel, independent software verification and validation personnel, or others who perform error detection techniques.
3.1. Classes of Error Detection Techniques
Error detection techniques generally fall into three main categories of analytic activities: static analysis, dynamicanalysis, and formal analysis. Static analysis is "the analysis of requirements, design, code, or other items either manuallyor automatically, without executing the subject of the analysis to determine its lexical and syntactic properties as opposedto its behavioral properties" [CLARK]. This type of technique is used to examine items at all phases of development.Examples of static analysis techniques include inspections, reviews, code reading, algorithm analysis, and tracing. Otherexamples include graphical techniques such as control flow analysis, and finite state machines, which are often used withautomated tools. Traditionally, static analysis techniques are applied to the software requirements, design, and code, butthey may also be applied to test documentation, particularly test cases, to verify traceability to the software requirements

and adequacy with respect to test requirements [WALLACE].
Dynamic analysis techniques involve the execution of a product and analysis of its response to sets of input data todetermine its validity and to detect errors. The behavioral properties of the program are also observed. The most commontype of dynamic analysis technique is testing. Testing of software is usually conducted on individual components (e.g.,subroutines, modules) as they are developed, on software subsystems when they are integrated with one another or withother system components, and on the complete system. Another type of testing is acceptance testing, often conducted atthe customer's site, but before the product is accepted by the customer. Other examples of dynamic analyses includesimulation, sizing and timing analysis, and prototyping, which may be applied throughout the lifecycle.
Formal methods involve rigorous mathematical techniques to specify or analyze the software requirements specification,design, or code. Formal methods can be used as an error detection technique. One method is to write the softwarerequirements in a formal specification language (e.g., VDM, Z), and then verify the requirements using a formalverification (analysis) technique, such as proof of correctness. Another method is to use a formal requirementsspecification language and then execute the specification with an automated tool. This animation of the specificationprovides the opportunity to examine the potential behavior of a system without completely developing a system first.
3.2. Techniques Used During the Lifecycle
Criteria for selection of techniques for this report include the amount of information available on them, their citation instandards and guidelines, and their recent appearance in research articles and technical conferences. Other techniquesexist, but are not included in this report. Table 3-1 provide a mapping of the error detection techniques described inAppendix A to software lifecycle phases. In these tables, the headings R, D, I, T, IC, and OM represent the requirements,design, implementation, test, installation and checkout, and operation and maintenance phases, respectively. Thetechniques and metrics described in this report are applicable to the products and processes of these phases, regardless ofthe lifecycle model actually implemented (e.g., waterfall, spiral). Table B-2 in Appendix B lists which high integritystandards cite these error detection techniques.
Table 3-1a. Error Detection Techniques and Related Techniques (part 1)
TECHNIQUES R D I T IC
OM
Algorithm analysis
Back-to-back testing
Boundary value analysis
Control flow analysis
Database analysis
Data flow analysis
Data flow diagrams
Decision tables (truth tables)
Desk checking (code reading)
Error seeding
Finite state machines
Formal methods (formal verification)
Information flow analysis
Inspections
Interface analysis
Interface testing
Mutation analysis
Performance testing
Prototyping / animation

Regression analysis and testing
Requirements parsing
Reviews
Sensitivity analysis
Simulation
Sizing and timing analysis
Slicing
Software sneak circuit analysis
Stress testing
Symbolic evaluation
Test certification
Tracing (traceability analysis)
Walkthroughs
3.2.1. Requirements
During the requirements phase, static analysis techniques can be used to check adherence to specification conventions,consistency, completeness, and language syntax. Commonly used static analysis techniques during the requirementsphase include control flow analysis, data flow analysis, algorithm analysis, traceability analysis, and interface analysis.Control and data flow analysis are most applicable for real time and data driven systems. These flow analyses employtransformation of text describing logic and data requirements into graphic flows which are easier to examine. Examplesof control flow diagrams include state transition and transaction diagrams. Algorithm analysis involves rederivation ofequations or the evaluation of the suitability of specific numerical techniques. Traceability analysis involves tracing therequirements in the software requirements specification to system requirements. The identified relationships are thenanalyzed for correctness, consistency, completeness, and accuracy. Interface analysis in this phase involves evaluatingthe software requirements specification with the hardware, user, operator, and software interface requirements forcorrectness, consistency, completeness, accuracy, and readability.
Dynamic analysis techniques can be used to examine information flows, functional interrelationships, and performancerequirements. Simulation is used to evaluate the interactions of large, complex systems with many hardware, user, andother interfacing software components. Prototyping helps customers and developers to examine the probable results ofimplementing software requirements. Examination of a prototype may help to identify incomplete or incorrectrequirements statements and may also reveal that the software requirements will not result in system behavior thecustomer wants. Prototyping is usually worthwhile when the functions of the computer system have not previously beenused in automated form by the customer. In this case, the customer can change the requirements before costlyimplementation. Unless the project is small or an automated method can be used to build a prototype quickly, usuallyonly carefully selected functions are studied by prototyping.
One approach for analyzing individual requirements is requirements parsing. This manual technique involvesexamination to ensure that each requirement is defined unambiguously by a complete set of attributes (e.g., initiator of anaction, source of the action, the action, the object of the action, constraints). Because this technique identifies undefinedattributes, it may prevent release of incomplete requirements to the designers. In those cases where the requirements areto be represented by a formal language specification, this analysis aids in clarifying a requirement before itstransformation.
Languages based on formal methods, i.e., mathematically based languages, may be used to specify system requirements.The act of specifying the software requirements in a formal language forces reasoning about the requirements andbecomes an error detection technique. When requirements have been written in a formal language, the task of simulationmay be easier. Then, the behavior of the potential system can be observed through use of the simulation. It may be thecombination of formal specifications with other error detection techniques (e.g., control flow analysis and data flowanalysis) that provides the biggest payoff for using formal methods.
3.2.2. Design

Evaluation of the design provides assurance that the requirements are not misrepresented, omitted, or incompletelyimplemented, and that unwanted features are not designed into the product by oversight. Design errors can be introducedby implementation constraints relating to timing, data structures, memory space, and accuracy.
Static analysis techniques help to detect inconsistencies, such as those between the inputs and outputs specified for a highlevel module and the inputs and outputs of the submodules. The most commonly used static analysis techniques duringthis phase include algorithm analysis, database analysis, (design) interface analysis, and traceability analysis. As in therequirements phase, algorithm analysis examines the correctness of the equations and numerical techniques, but inaddition, it examines truncation and rounding effects, numerical precision of word storage and variables (single vs.extended-precision arithmetic), and data typinginfluences. Database analysis is particularly useful for programs that storeprogram logic in data parameters. Database analysis supports verification of the computer security requirement ofconfidentiality, by checking carefully the direct and indirect accesses to data. Interface analysis aids in evaluating thesoftware design documentation with hardware, operator, and software interface requirements for correctness, consistency,completeness, and accuracy. Data items should be analyzed at each interface. Traceability analysis involves tracing thesoftware design documentation to the software requirements documentation and vice versa.
Commonly used dynamic analysis techniques for this phase include sizing and timing analysis, prototyping, andsimulation. Sizing and timing analysis is useful in analyzing real-time programs with response time requirements andconstrained memory and execution space requirements. This type of analysis is especially useful for determining thatallocations for hardware and software are made appropriately for the design architecture; it would be quite costly to learnin system test that the performance problems are caused by the basic system design. An automated simulation may beappropriate for larger designs. Prototyping can be used as an aid in examining the design architecture in general or aspecific set of functions. For large complicated systems prototyping can prevent inappropriate designs from resulting incostly, wasted implementations.
Formal analysis involves tracing paths through the design specification and formulating a composite function for each, inorder to compare these composite functions to that of the previous level. This process ensures that the design continues tospecify the same functional solution as is hierarchically elaborated. This process can be applied manually, if thespecification is sufficiently formal and exact, but is most feasible only for high level design specifications. However, withautomated tools, the functional effects of all levels of the design can be determined, due to the speed and capacity of thetools for manipulating detailed specifications.
3.2.3. Implementation
Use of static analysis techniques helps to ensure that the implementation phase products (e.g., code and relateddocumentation) are of the proper form. Static analysis involves checking that the products adhere to coding anddocumentation standards or conventions, and that interfaces and data types are correct. This analysis can be performedeither manually or with automated tools.
Frequently used static analysis techniques during this phase include code reading, inspections, walkthroughs, reviews,control flow analysis, database analysis, interface analysis, and traceability analysis. Code reading involves theexamination by an individual, usually an expert other than the author, for obvious errors. Inspections, walkthroughs, andreviews, which are all used to detect logic and syntax errors, are effective forerunners to testing. As in previous phases,control flow diagrams are used to show the hierarchy of main routines and their subfunctions. Database analysis isperformed on programs with significant data storage to ensure that common data and variable regions are usedconsistently between all calling routines; that data integrity is enforced and no data or variable can be accidentallyoverwritten by overflowing data tables; and that data typing and use are consistent throughout the program. Withinterface analysis, source code is evaluated with the hardware, operator, and software interface design documentation, asin the design phase. Traceability analysis involves tracing the source code to corresponding design specifications andvice versa.
One category of static analysis techniques performed on code is complexity analysis. Complexity analysis measures thecomplexity of code based on specific measurements (e.g., number of parameters passed, number of global parameters,number of operands/operators). Although not an error detection technique, complexity analysis can be used as an aid inidentifying where use of error detection techniques should be concentrated and also in locating test paths and otherpertinent information to aid in test case generation.
Other static analysis techniques used during implementation which aid in error detection include software sneak circuit

analysis and slicing. Software sneak circuit analysis is a rigorous, language-independent technique for the detection ofanomalous software (i.e., "sneaks") which may cause system malfunction. The methodology involves creation of acomprehensive "pictorial" database using quasi-electrical symbology which is then analyzed using topological andapplication "clues" to detect faults in the code [PEYTON]. Slicing is a program decomposition technique used to trace anoutput variable back through the code to identify all code statements relevant to a computation in the program [LYLE].This technique may be useful to demonstrate functional diversity.
Dynamic analysis techniques help to determine the functional and computational correctness of the code. Regressionanalysis is used to reevaluate requirements and design issues whenever any significant code change is made. Thisanalysis ensures awareness of the original system requirements. Sizing and timing analysis is performed duringincremental code development and analysis results are compared against predicted values.
A formal method used in the implementation phase is proof of correctness, which is applied to code.
3.2.4. Test
Dynamic analysis in the test phase involves different types of testing and test strategies. Traditionally there are four typesof testing: unit, integration, system, and acceptance. Unit testing may be either structural or functional testing performedon software units, modules, or subroutines. Structural testing examines the logic of the units and may be used to supportrequirements for test coverage, that is, how much of the program has been executed. Functional testing evaluates howsoftware requirements have been implemented. For functional testing, testers usually need no information about thedesign of the program because test cases are based on the software requirements.
Integration testing is conducted when software units are integrated with other software units or with system components.During integration testing, various strategies can be employed (e.g., top-down testing, bottom-up testing, sandwichtesting) but may depend on the overall strategy for constructing the system. Integration testing focuses on software,hardware, and operator interfaces.
Both system testing and acceptance testing execute the complete system. The primary difference is that the developerconducts system testing, usually in the development environment, while the customer conducts acceptance testing (orcommissions the developer to conduct the acceptance testing in the presence of the customer). Acceptance testing issupposed to occur in a fully operational customer environment, but in some cases (e.g., nuclear power plants, flightcontrol systems), some parts of the environment may need to be simulated.
For all four types of testing, different strategies may be used, according to the project's characteristics. Some strategiesinclude stress testing, boundary value testing, and mutation testing. Operational profile testing allows testers to selectinput data that are of special interest to the customer. For example, input data that causes execution of the most frequentlyused functions in operation may be the most important profile for testing for some systems. In other cases, it may bemore important to choose an input profile that should not occur in reality. For nuclear power plants, this means choosinga profile that causes the software safety system to react; the system responses can be examined to determine systembehavior in adverse circumstances.
A major problem with testing is knowing when to stop. Software reliability estimation techniques, such as thosedescribed in section 5 of this report, can be used to estimate the number of errors still present in the system, and todetermine how much more testing is needed. Sensitivity analysis, a promising technique emerging from the researchcommunity and entering the marketplace, is intended to indicate where to test, and hence to determine how much to test[VOAS]. Because sensitivity analysis is derived from mutation testing which is intended for detecting small changes to aprogram, this technique depends on code that is already "close to correct" for its effectiveness.
3.2.5. Installation and Checkout
During this phase, it is necessary to validate that the software operates correctly with the operational hardware systemand with other software, as specified in the interface specifications. It is also necessary to verify the correctness andadequacy of the installation procedures and certify that the verified and validated software is the same as the executablecode approved for installation. There may be several installation sites, each with different parameters. It is necessary tocheck that the programs have been properly tailored for each site.
The most commonly used dynamic analysis techniques for this phase are regression analysis and test, simulation, and test

certification. When any changes to the product are made during this phase, regression analysis is performed to verify thatthe basic requirements and design assumptions affecting other areas of the program have not been violated. Simulation isused to test operator procedures and to isolate installation problems. Test certification, particularly in critical softwaresystems, is used to verify that the required tests have been executed and that the delivered software product is identical tothe product subjected to software verification and validation (V&V).
3.2.6. Operation and Maintenance
During operation of an on-line continuous system, test cases may be constructed that will check periodically if the systemis behaving as expected. For any software maintenance activity, error detection techniques should be selected as if themaintenance activity were a new development activity, but considering the impact of new changes to the system. Use oftraceability analysis on the software products, including test documentation, is crucial to identifying the extent of use ofany selected error detection technique on the total software system. Regression testing must be applied in this phase.
3.3. Benefits of Classes of Error Detection Techniques
In the early days of computers, static analysis of software involved hours of tedious manual checking of code forstructural errors, syntax errors, and other types of errors. Today automation handles the tedious bookkeeping in bothdesign and code activities. In the past, manual reading by an individual not only took longer, but may not always havebeen thorough. Design tools force consistency to some extent and support other static analyses. Techniques such ascontrol flow analysis were difficult to perform manually, but with modern Computer Aided Software Engineering(CASE) tools, most static analyses can be performed more quickly and efficiently. As the power and ease of use of thetools improve, then static analyses become more effective.
A tool commonly used to perform static analysis is the compiler, which can detect syntactical code errors. The directcosts are the amount of electrical power and resources needed to conduct the compilation. However, not everyone agreeson the usefulness of compilers for producing error-free code. Supporters of Cleanroom engineering, a methodology fordeveloping and assuring the quality of software, argue that the costs of rework and recompile are significant and shouldnot be ignored. They believe that complete reliance on the tools to perform some of the intellectual work may reducequality, because clean compilations can give a false sense of complete correctness [MILLS]. With Cleanroomengineering, programmers do not compile their code. Instead they spend more time on design, using a "box structure"method, and on analyzing their own work. When the programmers are confident of their work, it is submitted to anothergroup who then compiles and tests the code. The Software Engineering Laboratory (SEL) at the National Aeronauticsand Space Administration Goddard Space Flight Center collected sufficient data over 16 years to establish baselines forerror and productivity rates. In recent years, two experiments were conducted on the Cleanroom approach [GREEN].Results of the two Cleanroom experiments compared with SEL baselines show a lower error rate in the finished productand an increase in productivity across the lifecycle.
Software inspection, another static technique, is time consuming because it requires line by line, or graph by graphreading of the software element. Data collected from over 203 software inspections at the Jet Propulsion Laboratory inPasadena, California, showed a significantly higher density of defects during requirements inspections [KELLY].However, the defect densities of the products decreased exponentially from the requirements phase to the coding phase,implying that testing and rework will take less time. Code reading is another static analysis technique that has beenshown in another SEL study to be quite effective [BASILI]. Researchers found that effectiveness increased with theexperience level of the code readers, the reason being that experienced personnel were mentally executing the code. Thistechnique may be difficult to schedule and implement formally; usually it is used when a programmer seeks help from apeer, and is conducted on small sections of code at a time. Also, errors found by code reading may not always be handledwith a formal anomaly report.
Inspection and code reading have one drawback in common. The maximum benefits for these techniques are achievedwhen they are performed on all elements of the design and code, which tends to be time-consuming. Because of the timefactor, they are usually conducted on only small portions of a program at a time, usually in three- or four-hour meetings.When the objective is to examine the entire program or many modules for global features, then other techniques withspecific objectives (e.g., interface consistency, control flow, logic flow analysis) are more appropriate. Many of the staticanalysis techniques are intended to be conducted by individual members of a team, perhaps over days, and probably withautomated support. There may be interaction among the team, especially to discuss possible anomalies. These types oftechniques are effective for examining the integration of design or code modules.

Dynamic analyses tend to use large amounts of computer resources and involve human effort to prepare, execute andanalyze tests. Testing can never guarantee that a system is completely correct, but it can demonstrate exactly what willoccur under specific circumstances. Testing helps to establish an operational profile under which the system will workcorrectly. Testing also helps to uncover errors that were previously not discovered. Acceptance testing assures a customerthat the software system will behave appropriately under specific circumstances as the customer has requested. SomeCASE tools provide test aids (e.g., test case generators, test result capture, documentation). Although the power ofmodern computers has reduced execution time of test cases, nevertheless, exhaustive testing with all possible inputsunder all circumstances is still not possible. In order to obtain maximum benefits from testing, careful planning anddevelopment of test goals, and strategies to achieve those goals are required.
While some static and dynamic analyses have become easier to perform with CASE tools, CASE technology has noteliminated all problems of software development and assurance. There are the problems of cost,methodology-dependence, and difficulty in understanding and using them. Two other major problems with CASEinclude restrictions on using the environments when they are not built on the concept of open systems [NIST187] andwhen information developed by the tools cannot be readily exchanged among tools of different vendors.
While journal articles and other literature describing usage of formal methods are available, they do not provide sufficientinformation to draw conclusions about the cost/quality benefits of using formal methods for the assurance of the qualityof software. A study of formal methods was funded by NIST, the U.S. Naval Research Laboratory, and the AtomicEnergy Control Board of Canada, to determine whether the benefits of using formal methods are significant relative tothe costs of using them. The results of this study are published in [NISTGCR]. In the United Kingdom, there is anexisting standard for safety critical software used in defense equipment, which requires the use of formal languages forspecifications [MOD55].
The cost benefits of using specific error detection techniques or classes of techniques will differ from project to project.A balanced error detection program will depend on many factors, including the consequences of failure caused by anundetected error, the complexity of the software system, the types of errors likely to be committed in developing specificsoftware, the effort needed to apply a technique, the automated support available, and the experience of the developmentand assurance staff. Another factor to consider is the interplay among techniques (e.g., whether the output of onetechnique can be used readily by another technique). If a specific error type is likely, then a technique known for findingthat type of error should be selected. The application of formal verification techniques is appropriate when failure of thesoftware would be disastrous. For planning a balanced program, an important requirement should be to ensure thatanalyses are applied to all the software products at all phases of the lifecycle in an orderly manner. The program shouldbe evaluated frequently to ensure that the analyses are being used correctly and are aiding in error detection. The SPCtechniques described in section 5 aid in this evaluation.
A final consideration for selecting techniques based on their cost benefit takes into account who will be conducting theanalysis, and under what circumstances. For auditors, techniques which examine interfaces across the entire program,control flow, and critical operational paths are more appropriate than those involving detailed line by line analysis (e.g.,software code inspection). When an anomaly is found, however, the auditors may choose to examine in greater detail theareas suspected of contributing to the anomaly.
4. REMOVAL OF ERRORS
This section describes the process of analyzing anomalies and removing errors. This is performed after an anomaly hasbeen discovered using any error detection technique, such as those discussed in section 3. Analysis of an anomaly willnot only aid in the removal of errors related to the anomaly, but will also help to detect other similar errors which havenot yet manifested themselves. In addition, information obtained from this analysis can provide valuable feedback thatmay improve subsequent efforts and development processes in future projects.
The handling of an anomaly generally follows three steps: identification, investigation, and resolution. However, exactprocedures for dealing with an anomaly will depend on many factors. First, it may be that the anomaly is not actually anerror.(4) For example, the anomaly may be a result of misinterpreting test results. In these situations, an explanation aboutwhy the anomaly is not an error should be recorded, and no further action is required. Second, the procedures will dependon the activity used to detect the anomaly. For example, anomalies discovered during walkthroughs and code reading areoften fixed immediately, without having to go through the formal error resolution process. During integration testing, allanomaly reports may be collected and then addressed to locate probable cause and recommend fixes. Third, the severitylevel of the anomaly will determine how soon the error should be fixed. Generally, the more severe the error, the sooner

it needs to be fixed.
The general policy for handling anomalies should include rules/regulations concerning the administration of the entireerror removal activity (e.g., who must fill out problem reports, where or to whom this information is distributed, how toclose out problem reports, who enters the collected information into the error database). These issues are not addressed inthis report, because the policy will be specific to an organization.
General project information which supports the error removal process should be maintained. This information mayinclude, but is not limited to, descriptions of the design methodology, the verification plan used in design, the test plan,the configuration control plan, identification of tools used to design and test software (e.g., CASE tools), and theprogramming language used.
~~~~~~~~~~~~~~~~~~~~~~~~~~~~~~~~~~~~~~~~~~~~(4) Or, the anomaly may be caused by a problem external to the software under analysis (e.g., the modem used for testingwas not configured properly), not by an error in the software. In this case, the information on the anomaly is sent to theresponsible party, but is not further addressed by the error removal activity.~~~~~~~~~~~~~~~~~~~~~~~~~~~~~~~~~~~~~~~~~~~~
4.1. Identification
As soon as an anomaly is detected, information about it should be recorded to help identify, analyze, and correct theanomaly. Typically, this information is presented in an anomaly, or problem report. While the formats may differ, reportsshould include the following types of information.
Locator. Identify the person(s) who discovered the anomaly including name, address, phone number, email address, faxnumber, and company identification.
Date and Time. Specify the date and time that the anomaly occurred and/or was discovered. Time can be specified bywall clock time, system time, or CPU time. For distributed systems, specify the time zone.
Activity. Identify the activity taking place at the time the anomaly was discovered. These activities include error detectionactivities employed during the development and release of a product, including static and dynamic analysis, review,inspection, audit, simulation, timing analysis, testing (unit, integration, system, acceptance), compiling/assembling, andwalkthrough.
Phase Encountered. Identify the lifecycle phase in which the anomaly was encountered (e.g., requirements, design,implementation, test, installation and checkout, and operation and maintenance). If possible, specify the activity withinthe phase (e.g., during preliminary design in the design phase).
Operational Environment. Specify the hardware, software, database, test support software, platform, firmware,monitor/terminal, network, and peripherals being used.
Status of Product. Specify the effect of the problem on the product (e.g., unusable, degraded, affected, unaffected).
Repeatability. Determine if the anomaly is a one-time occurrence, intermittent, recurring, or reproducible.
Symptom. Describe the symptoms, which are indications that a problem exists (e.g., inconsistency between the designand the requirements, violation of a constraint imposed by the requirements, operating system crash, program hang-up,input or output problem, incorrect behavior or result, error message, inconsistent logic or behavior, infinite loop, andunexpected abort).
Location of Symptom. The location of the anomaly can be in the actual product (hardware, software, database, ordocumentation), the test system, the platform, or in any development phase product (e.g., specification, code, database,manuals and guides, plans and procedures, reports, standards/policies). Identify the documentation that was analyzed, orthe code that was executed, the tools and documentation used to support the activity. Identify the specific location(s)where the anomaly is evident in documentation, or the test case in which the anomaly occurred.
Severity. Severity is a measure of the disruption an anomaly gives the user when encountered during operation of theproduct. Severity can be divided into several levels, with the highest level being catastrophic, and the lowest being at the

annoyance level. A severity classification system should be tailored to particular systems or class of systems. The numberof levels and the corresponding descriptions of the levels may vary. An example of a severity classification is givenbelow:
Level 6 Critical. Major feature not working, system crashes, loss of data
Level 5 Serious. Impairment of critical system functions, no workaround
Level 4 Major. Workaround is difficult
Level 3 Moderate. Workaround is simple
Level 2 Cosmetic. Tolerable, or fix is deferrable
Level 1 User misunderstanding
Level 0 No problem (e.g., testing error)
4.2. Investigation
Following the identification stage, all errors should be investigated to obtain further information on the nature and causein order to propose solutions for resolution action or corrective action. Information that should be recorded during thisstage include the following:
Phase Introduced. Identify the lifecycle phase in which the error was introduced. If possible, specify the activity withinthe phase (e.g., during preliminary design in the design phase).
Type. This attribute describes the type of error found, e.g., logic error, computational error, interface/timing error, datahandling error, data error, documentation error, document quality error (e.g., out of date, inconsistent, incomplete), andenhancement errors (e.g., errors caused by change in requirements, errors caused by a previous fix).
Location of Error. The location of the error may be the same as the location of the symptom. See Location of Symptomin section 4.1.
Cause. Typical causes of an error include human errors (e.g., misunderstanding, omission errors) and inadequatemethodology (e.g., incomplete inspection process,inappropriate design methodology).
Units Affected. This attribute identifies the software unit(s) affected by the error and its related fix, e.g., whichcomponents, modules, or documents are affected.
Priority. Priority is the degree of importance that is given to the resolution of an error. Based on the priority level, it isdetermined whether the error should be fixed immediately, eventually, or not at all (e.g., if error becomes obsolete asresult of other changes). However, fixes should be performed according to the software configuration managementpolicies of the project. The relationship between the priority scale and the severity scale should be specified by theadministrative policy. An example of a priority scale is:
Level 5 Resolve error immediately
Level 4 Error gets high attention
Level 3 Error will be placed in normal queue
Level 2 Use workaround or fix in the interim
Level 1 Will be fixed last
Level 0 Will not be fixed
4.3. Resolution
Error resolution consists of the steps to correct the error. The policy of the project determines if the person whoinvestigates the error will also correct the error. The procedures for distribution and retention of the error information isalso identified by the policy. Typically, the recipients of the error information are the project manager, SQA manager,corporate database manager, and the customer. The amount of formalism (e.g., whether the plan needs to be documented)depends on the scope, risk, and size of the project. For small errors in small projects, this scheme may not be necessary.
4.3.1. Resolution Plan

The proposed procedures for resolution action should be documented in a resolution plan.
Item to Fix. Identify the item to be fixed (e.g., name, ID number, revision), the component within the item, textdescription of the fix.
Estimated Date or Time. Specify the proposed dates for start and completion of the fix.
Personnel. Identify the manager, engineer, or other members responsible for performing the fix and for follow-up.
4.3.2. Resolution Action
The resolution action is the actual fix, i.e., making changes in the product to correct and remove the error. The followinginformation should be provided by the person(s) who perform the resolution action, upon completion.
Date Completed. Specify the date when resolution action (fix) was completed.
Personnel. Identify the person(s) who fixed the error.
Time Length. Specify the number of minutes or hours required for the fix.
Size of Fix. Specify the size of the fix in terms of the number of source lines of code (SLOC) added / modified, or thenumber of document pages added / modified.
4.3.3. Corrective Action
The corrective action stage is optional, because not all anomalies will require individual corrective actions.
Standards, Policies or Procedures. Identify the standards, policies, or procedures to be revised, created, or reinforced.
Other Action. This includes other revisions to the development process (e.g., implementing training, reallocation ofpeople or resources, and improving or enforcing audit activities).
4.3.4. Follow-up
For all errors, there should be a follow-up to verify that the necessary resolution action or corrective action has beenperformed correctly.
Personnel. Identify the person or organization that performed follow-up of resolution action and/or corrective action.
Verification of Action. Confirm that the "right fix" has been performed, that the error has actually been removed, andthat the fix has not adversely affected other areas of the software.
Disposition. Describe the status of the anomaly, whether it is closed (resolution was implemented and verified, or notwithin scope of project), deferred, merged with another problem, or referred to another project.
Closeout. Identify procedures for retention of the error data.
4.4. Use of Individual Error Data
The data that is collected for the purpose of removing a single error can be used for other purposes. This data can aid inremoving all errors similar to the original error. In addition to making improvements in the product, data on single errorscan be used to improve the current development process. For instance, if many errors are found to be requirements errors,this may prompt a change to the requirements specification process. Data on single errors can also be used inmeasurement and statistical process control activities such as those discussed in section 5. For example, the data can beused to calculate measures or it can be used as input to control charts. Finally, individual error data can be entered into anerror database, in order to maintain an error history of all projects in the organization.

5. TECHNIQUES FOR THE COLLECTION AND ANALYSIS OF ERROR DATA
Techniques for collecting and analyzing sets of error data during the lifecycle aid in understanding, evaluating andimproving the development and maintenance process or aid in evaluating or estimating product quality. Softwaremeasures provide insights about both process and product. Measures may feed into statistical process control (SPC)techniques; SPC techniques may be used for both process and product evaluation. Software reliability estimationtechniques are usually applied only to the product. Most of these techniques operate on error history profiles of error datadiscovered by error detection techniques.
This section addresses only the error aspects of these techniques. Other information may need to be collected whenmaking major decisions to change a policy or development activity (e.g., project information, customer requirements,company policy, methodologies being used, tools being used, number of people using a certain technique). These typesof information are not discussed in this report.
5.1. Error History Profile / Database
An error history profile is needed to perform error analysis effectively. An organizational database can be used both totrack the status of a project and to track the use of error analysis techniques. Data collected for the purpose of resolvingsingle errors (e.g., source, cause, type, severity), should be placed in the error database to enable the establishment ofanomaly histories. Other data collected specifically for the purpose of measurement or statistical process control shouldalso be entered into the database. The database serves as a baseline for validation as well as for improvement. Pastmistakes can be avoided from lessons learned. Maintaining a database serves the following purposes:
-- To identify which development processes work well (or poorly) for an application domain,●
-- To support process improvement for the current project as well as for future projects,●
-- To identify whether the processes are being applied properly (or at all),●
-- To identify error classes by cause,●
-- To estimate the error growth rate throughout development, and therefore to be able to adjust plans for assuranceactivities, and
●
-- To measure the quality of the software at delivery.●
Error data collected from an error detection technique in one phase can support process improvement in an earlierlifecycle phase (for future projects), as well as in a later phase. For example, in a presentation at a COMPASSConference, (5) one panel member explained that analysis of the data collected from code inspections at his organizationrevealed that a high percentage of the code errors were the result of errors in the software requirements specification. Inresponse to this finding, the organization began investigating the use of formal languages for specifying softwarerequirements. This example demonstrates the necessity of collecting and analyzing data for both error removal andprocess improvement.
Data histories can help managers to recognize when there is a significant deviation from project plans duringdevelopment. Past error data can be used to estimate the number of expected errors at different times in the developmentcycle. For instance, if the reported error count for a particular product was smaller than was expected, compared withsimilar past projects, this may suggest that the development team generated an unusually low number of errors. However,further investigation may reveal that the project was behind schedule, and to save time, planned inspections were notheld. Thus, many existing errors remained undetected, so that the low error count did not reflect the true quality of theproduct. This example illustrates how a history profile enables an organization to recognize and correct a processproblem to avoid delivering a product with residual errors.
~~~~~~~~~~~~~~~~~~~~~~~~~~~~~~~~~~~~~~~~~~~~(5) Dr. John Kelly, of the Jet Propulsion Laboratory, was a member of the "Formal Methods in Industry" panel at the 1992COMPASS Conference, held at NIST in Gaithersburg, Maryland on June 15-18, 1992. The panel discussion was notdocumented in the conference proceedings.~~~~~~~~~~~~~~~~~~~~~~~~~~~~~~~~~~~~~~~~~~~~5.2. Data Collection Process

This section describes the process of collecting error data for a specific purpose (e.g., to use with control charts). Some ofthe error data may include data previously collected during error detection. This data can be retrieved from theorganizational database, or can be collected directly upon discovery or during resolution of an error. Data must becollected properly in order for any error analysis technique to be effective. The recommended steps of the data collectionprocess are listed below [AIAA]:
Establish the objectives.1.
Prepare a data collection plan. The plan may include the following recommended elements:
Data definition and type. Specify/define the data to be collected and the type (i.e., attribute or variable data).An attribute is a characteristic that an item may or may not possess. It is obtained by noting the presence orabsence of a characteristic and counting occurrences of the characteristic with a specified unit. For example:a module may or may not contain a defect. This type of data takes on only discrete (integer) values. Variabledata is obtained by recording a numerical value for each item observed. Variable data can be eithercontinuous or discrete. Examples: cost of fixing an error (continuous), lines of code (discrete).
Analysis technique. Identify the technique requiring the data. Each technique has unique data requirements,so the technique to be used should be specified prior to data collection.
Measurement method. Measurements can be taken by equipment, observation, or selecting data fromexisting records. The reliability, determined by accuracy and precision, of the measurement method must beestablished prior to data collection.
Sampling Procedure. The data collection interval, amount of data to be collected, and the sampling methodshould be specified (e.g., random sampling using a random number table). When determining the datacollection interval, issues such as process volume, process stability, and cost should be considered.
Personnel. Identify persons responsible for specific data collection tasks.
Forms for data reporting (e.g., electronic spreadsheet, paper forms, etc.).
Recording and processing of data. One method for processing data is blocking, the separating of data intopotential comparison categories during the recording of data. Blocking can be accomplished by recordingeach category separately, or through labeling information that enables future sorting.
Monitoring. Describe how the data collection process is to be monitored.
2.
Apply tools. Automated tools should be considered whenever possible, in order to minimize impact on the project'sschedule. Factors to consider include the following: availability of the tool, reliability of the tool, cost ofpurchasing or developing the tool, and whether it can handle any necessary adjustments.
3.
Provide training. Once tools and plans are in place, training should be provided to ensure that data collectorsunderstand the purpose of the measurements and know explicitly what data is to be collected.
4.
Perform trial run. A trial run of the data collection plan should be made to resolve any problems or misconceptionsabout the plan. This can save vast amounts of time and effort.
5.
Implement the plan. Collect the data and review them promptly, so that problems can be resolved before thedisappearance of information required to resolve them (e.g., if test results on a screen are not saved).
6.
Monitor data collection. Monitor the process to ensure that objectives are met and that procedures are implementedaccording to the data collection plan.
7.
Use the data. Use the data as soon as possible to achieve maximum benefit.8.

Provide feedback to all involved. Those involved need to know what impact their efforts had, and the end result.This will enable them to understand the purpose of their efforts and agree to undertake similar tasks in the future.
9.
Additional recommendations for the data collection process are listed below [ROOK]:
-- Data collection should be integrated into the development process (e.g., as part of the quality managementsystem).
●
-- Data collection should be automated whenever possible.●
-- Time-scales between data collection and data analysis should be minimized.●
-- Data should be treated as a company resource and facilities should be available to keep historical records ofprojects as well as to monitor current projects.
●
-- The problem of motivating personnel to keep accurate records should not be underestimated. Proper training andquick analysis facilities are essential, but are not sufficient.
●
5.3. Metrics
Within the software engineering community, there is much confusion and inconsistency over the use of the terms metricand measure. In this report, a metric is defined to be the mathematical definition, algorithm, or function used to obtain aquantitative assessment of a product or process. The actual numerical value produced by a metric is a measure. Thus, forexample, cyclomatic complexity is a metric, but the value of this metric is the cyclomatic complexity measure.
Data on individual errors (see sec. 4) can be used to calculate metrics values. Two general classes of metrics include thefollowing:
management metrics, which assist in the control or management of the development process; and
quality metrics, which are predictors or indicators of the product qualities
Management metrics can be used for controlling any industrial production or manufacturing activity. They are used toassess resources, cost, and task completion. Examples of resource-related metrics include elapsed calendar time, effort,and machine usage. Typical metrics for software estimate task completion include percentage of modules coded, orpercentage of statements tested. Other management metrics used in project control include defect-related metrics.Information on the nature and origin of defects are used to estimate costs associated with defect discovery and removal.Defect rates for the current project can be compared to that of past projects to ensure that the current project is behavingas expected.
Quality metrics are used to estimate characteristics or qualities of a software product. Examples of these metrics includecomplexity metrics, and readability indexes for software documents. The use of these metrics for quality assessment isbased on the assumptions that the metric measures some inherent property of the software, and that the inherent propertyitself influences the behavioral characteristics of the final product.
Some metrics may be both management metrics and quality metrics, i.e., they can be used for both project control andquality assessment. These metrics include simple size metrics (e.g., lines of code, number of function points) andprimitive problem, fault, or error metrics. For example, size is used to predict project effort and time scales, but it canalso be used as a quality predictor, since larger projects may be more complex and difficult to understand, and thus moreerror-prone.
A disadvantage of some metrics is that they do not have an interpretation scale which allows for consistent interpretation,as with measuring temperature (in degrees Celsius) or length (in meters). This is particularly true of metrics for softwarequality characteristics (e.g., maintainability, reliability, usability). Measures must be interpreted relatively, throughcomparison with plans and expectations, comparison with similar past projects, or comparison with similar componentswithin the current project. While some metrics are mathematically-based, most, including reliability models, have notbeen proven.
Since there is virtually an infinite number of possible metrics, users must have some criteria for choosing which metrics

to apply to their particular projects. Ideally, a metric should possess all of the following characteristics:
-- Simple - definition and use of the metric is simple●
-- Objective - different people will give identical values; allows for consistency, and prevents individual bias●
-- Easily collected - the cost and effort to obtain the measure is reasonable●
-- Robust - metric is insensitive to irrelevant changes; allows for useful comparison●
-- Valid - metric measures what it is supposed to; this promotes trustworthiness of the measure●
Within the software engineering community, two philosophies on measurement are embodied by two major standardsorganizations. A draft standard on software quality metrics sponsored by the Institute for Electrical and ElectronicsEngineers Software Engineering Standards Subcommittee supports the single value concept. This concept is that a singlenumerical value can be computed to indicate the quality of the software; the number is computed by measuring andcombining the measures for attributes related to several quality characteristics. The international community, representedby the ISO/IEC organization through its Joint Technical Committee, Subcommittee 7 for software engineering appears tobe adopting the view that a range of values, rather than a single number, for representing overall quality is moreappropriate.
5.3.1. Metrics Throughout the Lifecycle
Metrics enable the estimation of work required in each phase, in terms of the budget and schedule. They also allow forthe percentage of work completed to be assessed at any point during the phase, and establish criteria for determining thecompletion of the phase.
The general approach to using metrics, which is applicable to each lifecycle phase, is as follows: [ROOK]
-- Select the appropriate metrics to be used to assess activities and outputs in each phase of the lifecycle.●
-- Determine the goals or expected values of the metrics.●
-- Determine or compute the measures, or actual values.●
-- Compare the actual values with the expected values or goals.●
-- Devise a plan to correct any observed deviations from the expected values.●
Some complications may be involved when applying this approach to software. First, there will often be many possiblecauses for deviations from expectations and for each cause there may be several different types of corrective actions.Therefore, it must be determined which of the possible causes is the actual cause before the appropriate corrective actioncan be taken. In addition, the expected values themselves may be inappropriate, when there are no very accurate modelsavailable to estimate them.
In addition to monitoring using expected values derived from other projects, metrics can also identify anomalouscomponents that are unusual with respect to other components values in the same project. In this case, project monitoringis based on internally generated project norms, rather than estimates from other projects.
The metrics described in the following subsections are defined in [ROOK], [IEEE982.2] and [AIRFORCE], [SQE], and[ZAGE] and comprise a representative sample of management and quality metrics that can be used in the lifecycle phasesto support error analysis. This section does not evaluate or compare metrics, but provides definitions to help readersdecide which metrics may be useful for a particular application.
5.3.1.1. Metrics Used in All Phases
Primitive metrics such as those listed below can be collected throughout the lifecycle. These metrics can be plotted usingbar graphs, histograms, and Pareto charts as part of statistical process control. The plots can be analyzed by managementto identify the phases that are most error prone, to suggest steps to prevent the recurrence of similar errors, to suggest

procedures for earlier detection of faults, and to make general improvements to the development process.
Problem Metrics
Primitive problem metrics.
Number of problem reports per phase, priority, category, or cause
Number of reported problems per time period
Number of open real problems per time period
Number of closed real problems per time period
Number of unevaluated problem reports
Age of open real problem reports
Age of unevaluated problem reports
Age of real closed problem reports
Time when errors are discovered
Rate of error discovery
Cost and Effort Metrics
Primitive cost and effort metrics.
Time spent
Elapsed time
Staff hours
Staff months
Staff years
Change Metrics
Primitive change metrics.
Number of revisions, additions, deletions, or modifications
Number of requests to change the requirements specification and/or design during
lifecycle phases after the requirements phase
Fault Metrics
Primitive fault metrics. Assesses the efficiency and effectiveness of fault resolution/removal activities, and checkthat sufficient effort is available for fault resolution/removal.
Number of unresolved faults at planned end of phase
Number of faults that, although fully diagnosed, have not been corrected, and number of outstanding changerequests
Number of requirements and design faults detected during reviews and walkthroughs
5.3.1.2. Requirements Metrics
The main reasons to measure requirements specifications is to provide early warnings of quality problems, to enablemore accurate project predictions, and to help improve the specifications.
Primitive size metrics. These metrics involve a simple count. Large components are assumed to have a largernumber of residual errors, and are more difficult to understand than small components; as a result, their reliabilityand extendibility may be affected.
Number of pages or words
Number of requirements
Number of functions
Requirements traceability. This metric is used to assess the degree of traceability by measuring the percentage ofrequirements that has been implemented in the design. It is also used to identify requirements that are eithermissing from, or in addition to the original requirements. The measure is computed using the equation: RT =

R1/R2 x 100%, where R1 is the number of requirements met by the architecture (design), and R2 is the number oforiginal requirements. [IEEE982.2]
Completeness (CM). Used to determine the completeness of the software specification during requirements phase.This metric uses eighteen primitives (e.g., number of functions not satisfactorily defined, number of functions,number of defined functions, number of defined functions not used, number of referenced functions, and numberof decision points). It then uses ten derivatives (e.g., functions satisfactorily defined, data references having anorigin, defined functions used, reference functions defined), which are derived from the primitives. The metric is
the weighted sum of the ten derivatives expressed as CM = wi Di, where the summation is from i=1 to i=10,each weight wi has a value between 0 and 1, the sum of the weights is 1, and each Di is a derivative with a valuebetween 1 and 0. The values of the primitives also can be used to identify problem areas within the requirementsspecification. [IEEE982.2]
Fault-days number. Specifies the number of days that faults spend in the software product from its creation totheir removal. This measure uses two primitives: the phase, date, or time that the fault was introduced, and thephase, date, or time that the fault was removed. The fault days for the ith fault, (FDi), is the number of days from
the creation of the fault to its removal. The measure is calculated as follows: FD = FDi.
This measure is an indicator of the quality of the software design and development process. A high value may beindicative of untimely removal of faults and/or existence of many faults, due to an ineffective developmentprocess. [IEEE982.2]
Function points. This measure was originated by Allan Albrecht at IBM in the late 1970's, and was furtherdeveloped by Charles Symons. It uses a weighted sum of the number of inputs, outputs, master files and inquiriesin a product to predict development size [ALBRECHT]. To count function points, the first step is to classify eachcomponent by using standard guides to rate each component as having low, average, or high complexity. Thesecond basic step is to tabulate function component counts. This is done by entering the appropriate counts in theFunction Counting Form, multiplying by the weights on the form, and summing up the totals for each componenttype to obtain the Unadjusted Function Point Count. The third step is to rate each application characteristic from 0to 5 using a rating guide, and then adding all the ratings together to obtain the Characteristic Influence Rating.Finally, the number of function points is calculated using the equation
Function pts.= Unadjusted function * (.65 + .01 * Character Influence Rating) point count [SQE]
5.3.1.3. Design Metrics
The main reasons for computing metrics during the design phase are the following: gives early indication ofproject status; enables selection of alternative designs; identifies potential problems early in the lifecycle; limitscomplexity; and helps in deciding how to modularize so the resulting modules are both testable and maintainable.In general, good design practices involve high cohesion of modules, low coupling of modules, and effectivemodularity. [ZAGE]
Size Metrics
Primitive size metrics. These metrics are used to estimate the size of the design or design documents.
Number of pages or words
DLOC (lines of PDL)
Number of modules
Number of functions
Number of inputs and outputs
Number of interfaces

(Estimated) number of modules (NM). Provides measure of product size, against which the completeness ofsubsequent module based activities can be assessed. The estimate for the number of modules is given by,NM = S/M, where S is the estimated size in LOC, M is the median module size found in similar projects.The estimate NM can be compared to the median number of modules for other projects. [ROOK]
Fault Metrics
Primitive fault metrics. These metrics identify potentially fault-prone modules as early as possible. [ROOK]
Number of faults associated with each module
Number of requirements faults and structural design faults detected during detailed design
Complexity Metrics
Primitive complexity metrics. Identifies early in development modules which are potentially complex orhard to test. [ROOK]
Number of parameters per module
Number of states or data partitions per parameter
Number of branches in each module
Coupling. Coupling is the manner and degree of interdependence between software modules [IEEE982.2].Module coupling is rated based on the type of coupling, using a standard rating chart, which can be found in[SQE]. According to the chart, data coupling is the best type of coupling, and content coupling is the worst.The better the coupling, the lower the rating. [SQE], [ZAGE]
Cohesion. Cohesion is the degree to which the tasks performed within a single software module are relatedto the module's purpose. The module cohesion value for a module is assigned using a standard rating chart,which can be found in [SQE]. According to the chart, the best cohesion level is functional, and the worst iscoincidental , with the better levels having lower values. Case studies have shown that fault rate correlateshighly with cohesion strength. [SQE], [ZAGE]
(Structural) fan-in / fan-out. Fan-in/fan-out represents the number of modules that call/are called by agiven module. Identifies whether the system decomposition is adequate (e.g., no modules which causebottlenecks, no missing levels in the hierarchical decomposition, no unused modules ("dead" code),identification of critical modules). May be useful to compute maximum, average, and total fan-in/fan-out.[ROOK], [IEEE982.2]
Information flow metric (C). Represents the total number of combinations of an input source to an outputdestination, given by, C = Ci (fan-in fan-out) 2, where C i is a code metric, which may be omitted. Theproduct inside the parentheses represents the total number of paths through a module. [ZAGE]
Design Inspection Metrics
Staff hours per major defect detected. Used to evaluate the efficiency of the design inspection processes.The following primitives are used: time expended in preparation for inspection meeting (T1), time expendedin conduct of inspection meeting (T2), number of major defects detected during the ith inspection (Si ), andtotal number of inspections to date (I). The staff hours per major defect detected is given below, with thesummations being from i=1 to i=I.
M = (T1 + T2)i
--------------------
Si

This measure is applied to new code, and should fall between three and five. If there is significant deviationfrom this range, then the matter should be investigated. (May be adapted for code inspections). [IEEE982.2]
Defect Density (DD). Used after design inspections of new development or large block modifications inorder to assess the inspection process. The following primitives are used: total number of unique defectsdetected during the ith inspection or ith lifecycle phase (D i), total number of inspections to date (I), andnumber of source lines of design statements in thousands (KSLOD). The measure is calculated by the ratio
DD = Di where the sum is from i=1 to i=I.---------------KSLOD
This measure can also be used in the implementation phase, in which case the number of source lines ofexecutable code in thousands (KSLOC) should be substituted for KSLOD. [IEEE982.2]
Test Related Metrics.
Test related primitives. Checks that each module will be / has been adequately tested, or assesses theeffectiveness of early testing activities. [ROOK]
Number of integration test cases planned/executed involving each module
Number of black box test cases planned/executed per module
Number of requirements faults detected during testing (also re-assesses quality of requirementsspecification)
5.3.1.4. Implementation Metrics
Metrics used during the implementation phase can be grouped into four basic types: size metrics, control structuremetrics, data structure metrics, and other code metrics.
Size Metrics
Lines of Code (LOC). Although lines of code is one of the most popular metrics, it has no standarddefinition(6) . The predominant definition for line of code is "any line of a program text that is not a commentor blank line, regardless of the number of statements or fragments of statements on the line." [SQE] It is anindication of size, which allows for estimation of effort, timescale, and total number of faults. For the sameapplication, the length of a program partly depends on the language the code is written in, thus makingcomparison using LOC difficult. However, LOC can be a useful measure if the projects being compared areconsistent in their development methods (e.g., use the same language, coding style). Because of itsdisadvantages, the use of LOC as a management metric (e.g., for project sizing beginning from therequirements phase) is controversial, but there are uses for this metric in error analysis, such as to estimatethe values of other metrics. The advantages of this metric are that it is conceptually simple, easilyautomated, and inexpensive. [SQE]
Halstead software science metrics. This set of metrics was developed by Maurice Halstead, who claimedthey could be used to evaluate the mental effort and time required to create a program, and how compactly aprogram is expressed. These metrics are based on four primitives listed below:
n1 = number of unique operators
n2 = number of unique operands
N1 = total occurrences of operators
N2 = total occurrences of operands
The program length measure, N, is the sum of N1 and N2. Other software science metrics are listed below.[SQE]

Vocabulary: n = n1+ n2
Predicted length: N^ = (n1 * log 2 n1 ) + (n2 * log2n2)
Program volume: V = N * log2n
Effort: E = (n1N2 Nlog2 n)/(2n2)
Time: T = E/B ; Halstead B=18
Predicted number of bugs: B = V/3000
Control Structure Metrics
Number of entries/exits per module. Used to assess the complexity of a software architecture, by countingthe number of entry and exit points for each module. The equation to determine the measure for the ithmodule is simply mi = ei + xi, where e i is the number of entry points for the ith module, and xi is the numberof exit points for the ith module. [IEEE982.2]
Cyclomatic complexity (C). Used to determine the structural complexity of a coded module in order to limitits complexity, thus promoting understandability. In general, high complexity leads to a high number ofdefects and maintenance costs. Also used to identify minimum number of test paths to assure test coverage.The primitives for this measure include the number of nodes (N), and the number of edges (E), which can bedetermined from the graph representing the module. The measure can then be computed with the formula, C= E - N + 1. [IEEE982.2], [SQE]
Data Structure Metrics
Amount of data. This measure can be determined by primitive metrics such as Halstead's n2 and N2, numberof inputs/outputs, or the number of variables. These primitive metrics can be obtained from a compiler crossreference. [SQE]
Live variables. For each line in a section of code, determine the number of live variables (i.e., variableswhose values could change during execution of that section of code). The average number of live variablesper line of code is the sum of the number of live variables for each line, divided by the number of lines ofcode. [SQE]
Variable scope. The variable scope is the number of source statements between the first and last reference ofthe variable. For example, if variable A is first referenced on line 10, and last referenced on line 20, then thevariable scope for A is 9. To determine the average variable scope for variables in a particular section ofcode, first determine the variable scope for each variable, sum up these values, and divide by the number ofvariables [SQE]. With large scopes, the understandability and readability of the code is reduced.
Variable spans. The variable span is the number of source statements between successive references of thevariable. For each variable, the average span can be computed. For example, if the variable X is referencedon lines 13, 18, 20, 21, and 23, the average span would be the sum of all the spans divided by the number ofspans, i.e., (4+1+0+1)/4 = 1.5. With large spans, it is more likely that a far back reference will be forgotten.[SQE]
~~~~~~~~~~~~~~~~~~~~~~~~~~~~~~~~~~~~~~~~~~~~(6) The SEI has made an effort to provide a complete definition for LOC. See [PARK].~~~~~~~~~~~~~~~~~~~~~~~~~~~~~~~~~~~~~~~~~~~~
5.3.1.5. Test Metrics
Test metrics may be of two types: metrics related to test results or the quality of the product being tested; andmetrics used to assess the effectiveness of the testing process.
PRODUCT METRICSDefect/Error/Fault Metrics

Primitive defect/error/fault metrics. These metrics can be effectively used with SPC techniques, such as barcharts, and Pareto diagrams. These metrics can also be used to form percentages (e.g., percentage of logicerrors = number of logic errors / total number of errors).
Number of faults detected in each module
Number of requirements, design, and coding faults found during unit and integration testing
Number of errors by type (e.g., number of logic errors, number of computational errors, number ofinterface errors, number of documentation errors)
Number of errors by cause or origin
Number of errors by severity (e.g., number of critical errors, number of major errors, number ofcosmetic errors)
Fault density (FD). This measure is computed by dividing the number of faults by the size (usually inKLOC, thousands of lines of code). It may be weighted by severity using the equation
FDw = (W1 S/N + W2 A/N + W3 M/N) / Size
where
N = total number of faults
S = number of severe faults
A = number of average severity faults
M = number of minor faults
Wi = weighting factors (defaults are 10, 3, and 1)
FD can be used to perform the following: predict remaining faults by comparison with expected faultdensity; determine if sufficient testing has been completed based on predetermined goals; establish standardfault densities for comparison and prediction. [IEEE982.2], [SQE]
Defect age. Defect age is the time between when a defect is introduced to when it is detected or fixed.Assign the numbers 1 through 6 to each of the lifecycle phases from requirements to operation andmaintenance. The defect age is then the difference of the numbers corresponding to the phase introduced and
phase detected. The average defect age = (phase detected - phase introduced)/number of defects, the sumbeing over all the defects. [SQE]
Defect response time. This measure is the time between when a defect is detected to when it is fixed orclosed. [SQE]
Defect cost. The cost of a defect may be a sum of the cost to analyze the defect, the cost to fix it, and thecost of failures already incurred due to the defect. [SQE]
Defect removal efficiency (DRE). The DRE is the percentage of defects that have been removed during aprocess, computed with the equation:
DRE = Number of defects removed ---------------------------------- x 100% Number of defects at start of process
The DRE can also be computed for each lifecycle phase and plotted on a bar graph to show the relativedefect removal efficiencies for each phase. Or, the DRE may be computed for a specific process (e.g., design

inspection, code walkthrough, unit test, six- month operation, etc.). [SQE]
PROCESS METRICS Test case metrics
Primitive test case metrics.
Total number of planned white/black box test cases run to completion
Number of planned integration tests run to completion
Number of unplanned test cases required during test phase
Coverage metrics(7)
Statement coverage. Measures the percentage of statements executed (to assure that each statement has beentested at least once). [SQE]
Branch coverage. Measures the percentage of branches executed. [SQE]
Path coverage. Measures the percentage of program paths executed. It is generally impractical andinefficient to test all the paths in a program. The count of the number of paths may be reduced by treating allpossible loop iterations as one path. [SQE] Path coverage may be used to ensure 100 percent coverage ofcritical (safety or security related) paths.
Data flow coverage. Measures the definition and use of variables and data structures. [SQE]
Test coverage. Measures the completeness of the testing process. Test coverage is the percentage ofrequirements implemented (in the form of defined test cases or functional capabilities) multiplied by thepercentage of the software structure (in units, segments, statements, branches, or path test results) tested.[AIRFORCE]
Failure metrics
Mean time to failure (MTTF). Gives an estimate of the mean time to the next failure, by accuratelyrecording failure times t i, the elapsed time between the ith and the (i-1)st failures, and computing theaverage of all the failure times. This metric is the basic parameter required by most software reliabilitymodels. High values imply good reliability. [IEEE982.2]
Failure rate. Used to indicate the growth in the software reliability as a function of test time and is usuallyused with reliability models. This metric requires two primitives: ti, the observed time between failures for agiven severity level i, and fi, the number of failures of a given severity level in the ith time interval. The
failure rate (t) can be estimated from the reliability function R(t), which is obtained from the cumulativeprobability distribution F(t) of the time until the next failure, using a software reliability estimation model,
such as the non-homogeneous Poisson process (NHPP) or Bayesian type model. The failure rate is (t) =-1/R(t) [dR(t)]/dt where R(t) = 1 - F(t). [IEEE982.2]
Cumulative failure profile. Uses a graphical technique to predict reliability, to estimate additional testingtime needed to reach an acceptable reliability level, and to identify modules and subsystems that requireadditional testing. This metric requires one primitive, fi, the total number of failures of a given severity leveli in a given time interval. Cumulative failures are plotted on a time scale. The shape of the curve is used toproject when testing will be complete, and to assess reliability. It can provide an indication of clustering offaults in modules, suggesting further testing for these modules. A non-asymptotic curve also indicates theneed for continued testing. [IEEE982.2]
~~~~~~~~~~~~~~~~~~~~~~~~~~~~~~~~~~~~~~~~~~~~(7) Commercial tools are available for statement coverage, branch coverage, and path coverage, but only privatetools exist for data flow coverage. [BEIZER] Coverage tools report the percentage of items covered and lists what

is not covered. [SQE]~~~~~~~~~~~~~~~~~~~~~~~~~~~~~~~~~~~~~~~~~~~~
5.3.1.6. Installation and Checkout Metrics
Most of the metrics used during the test phase are also applicable during installation and checkout. The specificmetrics used will depend on the type of testing performed. If acceptance testing is conducted, a requirements tracemay be performed to determine what percentage of the requirements are satisfied in the product (i.e., number ofrequirements fulfilled divided by the total number of requirements).
5.3.1.7. Operation and Maintenance Metrics
Every metric that can be applied during software development may also be applied during maintenance. Thepurposes may differ somewhat. For example, requirements traceability may be used to ensure that maintenancerequirements are related to predecessor requirements, and that the test process covers the same test areas as for thedevelopment. Metrics that were used during development may be used again during maintenance for comparisonpurposes (e.g., measuring the complexity of a module before and after modification). Elements of support, such ascustomer perceptions, training, hotlines, documentation, and user manuals, can also be measured.
Change Metrics
Primitive change metrics.
Number of changes
Cost/effort of changes
Time required for each change
LOC added, deleted, or modified
Number of fixes, or enhancements
Customer Related Metrics
Customer ratings. These metrics are based on results of customer surveys, which ask customers to provide arating or a satisfaction score (e.g., on a scale of one to ten) of a vendor's product or customer services (e.g.,hotlines, fixes, user manual). Ratings and scores can be tabulated and plotted in bar graphs.
Customer service metrics.
Number of hotline calls received
Number of fixes for each type of product
Number of hours required for fixes
Number of hours for training (for each type of product)
5.4. Statistical Process Control Techniques
Statistical process control is the application of statistical methods to provide the information necessary tocontinuously control or improve processes throughout the entire lifecycle of a product [OPMC]. SPC techniqueshelp to locate trends, cycles, and irregularities within the development process and provide clues about how wellthe process meets specifications or requirements. They are tools for measuring and understanding process variationand distinguishing between random inherent variations and significant deviations so that correct decisions can bemade about whether to make changes to the process or product.
To fully understand a process, it is necessary to determine how the process changes over time. To do this, one canplot error data (e.g., total number of errors, counts of specific types of errors) over a period of time (e.g., days,weeks, lifecycle phases) and then interpret the resulting pattern. If, for instance, a large number of errors are foundin a particular phase, an investigation of the activities in that phase or preceding ones may reveal that necessarydevelopment activities were omitted (e.g., code reviews were not conducted during the implementation phase). Aplot of the sources of errors may show that a particular group is the most frequent source of errors. Furtherinvestigation may confirm that members of the group do not have sufficient experience and training. A plot of the

number of specific types of errors may show that many errors are related to incorrect or unclear requirementsspecifications (e.g., requirements are written in a way that consistently causes misinterpretations, or they fail to listenough conditions and restrictions). This would indicate that the process of requirements specification needs to bemodified.
There are several advantages to using SPC techniques. First, errors may be detected earlier or prevented altogether.By monitoring the development process, the cause of the error (e.g., inadequate standards, insufficient training,incompatible hardware) may be detected before additional errors are created. Second, using SPC techniques iscost-effective, because less effort may be required to ensure that processes are operating correctly than is requiredto perform detailed checks on all the outputs of that process. Thus, higher quality may be achieved at a lowerdevelopment expense. Finally, use of SPC techniques provides quantitative measures of progress and of problemsso less guesswork is required [DEMMY].
Despite the advantages, there are also several potential disadvantages. To be successful, SPC requires discipline,planning, continuous commitment to the timely solution of process problems, and frequent access to informationfrom the software lifecycle process [DEMMY].
5.4.1. Control Chart
The primary statistical technique used to assess process variation is the control chart. The control chart displayssequential process measurements relative to the overall process average and control limits. The upper and lowercontrol limits establish the boundaries of normal variation for the process being measured. Variation within controllimits is attributable to random or chance causes, while variation beyond control limits indicates a process changedue to causes other than chance -- a condition that may require investigation. [OPMC] The upper control limit(UCL) and lower control limit (LCL) give the boundaries within which observed fluctuations are typical andacceptable. They are usually set, respectively, at three standard deviations above and below the mean of allobservations. There are many different types of control charts, pn, p, c, etc., which are described in Table 5-1. Thissection is based on [OPMC], [SMITH], [CAPRIO], and [JURAN].
Table 5-1. Types of Control Charts
TYPE DESCRIPTION IMPLEMENTATION
npnumber of nonconforming units (e.g.,number of defective units)
The number of units in each sample with the selected characteristicis plotted; sample size is constant.
pfraction of nonconforming units (e.g.,fraction of defective units)
For each sample, the fraction nonconforming, obtained by dividingthe number nonconforming by the total number of units observed, isplotted; sample size can change.
cnumber of nonconformities (e.g.,number of errors)
For each sample, the number of occurrences of the characteristic in agroup is plotted; sample size is constant.
unumber of nonconformities per unit(e.g., number of errors per unit)
For each sample, the number of nonconformities per unit, obtainedby dividing the number of nonconformities by the number of unitsobserved, is plotted; sample size can change.
X single observed value The value for each sample of size 1 is plotted.
XB X-BarFor each sample, the mean of 2 to 10 observations (4 or 5 areoptimal) is plotted.
R rangeThe difference between the largest and smallest values in eachsample is plotted.
XM median The median of each sample is plotted.
MR moving rangeThe difference between adjacent measurements in each sample isplotted.
Implementation
Identify the purpose and the characteristics of the process to be monitored.1.
Select the appropriate type of control chart based on the type of characteristic measured, the data available, and the2.

purpose of the application.
Determine the sampling method (e.g., number of samples (n), size of samples, time frame).3.
Collect the data.4.
Calculate the sample statistics: average, standard deviation, upper and lower control limits.5.
Construct the control chart based on sample statistics.6.
Monitor the process by observing pattern of the data points and whether they fall within control limits.7.
InterpretationThe existence of outliers, or data points beyond control limits, indicates that non-typical circumstances exist. A run, orconsecutive points on one side of the average line (8 in a row, or 11 of 12, etc.) indicates a shift in process average. Asawtooth pattern, which is a successive up and down trend with no data points near the average line, indicatesoveradjustment or the existence of two processes. A trend, or steady inclining or declining progression of data pointsrepresents gradual change in the process. A hug, in which all data points fall near the average line, may indicateunreliable data. A cycle, or a series of data points which is repeated to form a pattern, indicates a cycling process.
Figure 5-1. Example np Control Chart - Number of Defects Per Work Week.
Application ExamplesControl charts are applicable to almost any measurable activity. Some examples for software include the following:number of defects/errors, training efforts, execution time, and number of problem reports per time period. An example ofa np control with hypothetical data is shown in Figure 5-1. In this example, the number of samples (n) is 100. Each datapoint represents the number of defects found in the software product in a work week.5.4.2. Run Chart
A run chart is a simplified control chart, in which the upper and lower control limits are omitted. The purpose of the runchart is more to determine trends in a process, rather than its variation. Although very simple, run charts can be usedeffectively to monitor a process, e.g., to detect sudden changes and to assess the effects of corrective actions. Run chartsprovide the input for establishing control charts after a process has matured or stabilized in time. Limitations of thistechnique are that it analyzes only one characteristic over time, and it does not indicate if a single data point is an outlier.This section is based on [OPMC] and [CAPRIO].
Implementation
Decide which outputs of a process to measure.1.
Collect the data.2.
Compute and draw the average line.3.
Plot the individual measurements chronologically.4.
Connect data points for ease of interpretation.5.
InterpretationSee Interpretation for Control Charts.

Application ExamplesRun charts are applicable to almost any measurable activity. Some examples for software include the following: numberof defects/errors, number of failures, execution time, and downtime.5.4.3. Bar Graph
A bar graph is a frequency distribution diagram in which each bar represents a characteristic/attribute, and the height ofthe bar represents the frequency of that characteristic. The horizontal axis may represent a continuous numerical scale(e.g., hours), or a discrete non-numerical scale (e.g., Module A, Module B or Requirements Phase, Design Phase).Generally, numerical-scale bar charts in which the bars have equal widths are more useful for comparison purposes;numerical-scale bar charts with unequal intervals can be misleading because the characteristics with the largest bars (interms of area) do not necessarily have the highest frequency. This section is based on [SMITH].
Implementation
Define the subject and purpose.1.
Collect the data. Check that the sample size is sufficient.2.
Sort the data by frequency (or other measure) of characteristics.3.
For numerical-scale bar charts, determine the number of bars and the width of the bars (class width), by tryingseries of class widths, avoiding too fine or too coarse a granularity. The class widths in a chart may be all the same,or they may vary (as in fig. 5-2b), depending on how one wants to show the distribution of the data.
4.
Construct the chart and draw the bars. The height of a bar represents the frequency of the correspondingcharacteristic.
5.
InterpretationIn a simple bar graph in which the characteristics being measured are discrete and non-numerical (e.g., in fig. 5-2a) or ifeach bar has the same width, the measures for each characteristic can be compared simply by comparing the heights ofthe bars. For numerical-scale graphs with unequal widths, one can still compare the heights of the bars, but shouldremember not to interpret large bars as necessarily meaning that a large proportion of the entire population falls in thatrange.
Figure 5-2a. Example Bar Chart - Customer Ratings (5 is best, 1 is worst).
Application ExamplesBar graphs are useful for analyzing and displaying many different types of data. It is mostly used to compare thefrequencies of different attributes. For example, in Figure 5-2a, it is used to plot the average customer rating for eachevaluation category (e.g., customer service, hotlines, overall satisfaction). The graph shows clearly that Category D hasthe highest rating. Figure 5- 2b illustrates how numerical-scale bar charts can be used for software analysis. Based onhypothetical data, it shows the percentage of modules falling in each defect range. For instance, the graph shows that30% of all modules contain 10-20 defects and 5% contain 20-25 defects. Other examples of characteristics that may beplotted include: number or percentage of errors by lifecycle phase, by type, or by cause, and number or percentage ofproblem reports by phase or by type. See also section 5.3.1.1 on primitive problem metrics for additional examples.

Figure 5-2b. Example Bar Chart - Number of Modules with n Defects.
5.4.4. Pareto Diagram
A Pareto diagram is a special use of the bar graph in which the bars are arranged in descending order of magnitude. Thepurpose of Pareto analysis, using Pareto diagrams, is to identify the major problems in a product or process, or moregenerally, to identify the most significant causes for a given effect. This allows a developer to prioritize problems anddecide which problem area to work on first. This section is based on [OPMC] and [CAPRIO].
Implementation
Follow the steps for constructing a bar graph, except that the bars should be in descending order of magnitude(height).
1.
Determine the "vital few" causes by drawing a cumulative percent line and applying the 20/80 rule.2.
Compare and identify the major causes. Repeat process until root cause of the problem is revealed.3.
InterpretationPareto analysis is based on the 20/80 rule, which states that approximately 20% of the causes (the "vital few") account for80% of the effects (problems). The "vital few" can be determined by drawing a cumulative percent line and noting whichbars are to the left of the point marking 80% of the total count. The vital few are usually indicated by significantly higherbars and/or a relatively steep slope of the cumulative percent line. In Figure 5-2, the vital few are logic, computational,and interface errors since 80% of the errors are found in these modules. By knowing the primary causes of a problem oreffect, the developer can decide where efforts should be concentrated.
Application ExamplesMost data that can be plotted on a non-numerical scale bar graph can also be plotted on a Pareto diagram. Examplesinclude: number or percentage of errors by type, by cause, or by lifecycle phase, and number or percentage of problemreports by type or by lifecycle phase.
Figure 5-3. Example Pareto Chart - Percentage of Defects by Type.

5.4.4. Histogram
A histogram is a frequency distribution diagram in which the frequencies of occurrences of the different variables beingplotted are represented by bars. The purpose is to determine the shape of the graph relative to the normal distribution (orother distributions). It is often confused with a bar graph, in which the frequency of a variable is indicated by the heightof the bars. In a histogram, the frequency is indicated by the area of the bar. Histograms can only be used with variabledata, which require measurements on a continuous scale. Only one characteristic can be shown per histogram, and at least30 observations representing homogenous conditions are needed. This section is based on [OPMC], [CAPRIO], and[FREEDMAN].
Implementation
Define the subject and purpose.1.
Collect the data and organize from smallest to largest values. Check that sample size is sufficient.2.
Calculate the range (r), i.e. the difference between the largest and smallest values.3.
Decide arbitrarily on the number of bars (k), usually between 7 and 13.4.
To make bars of equal width, use the equation, w = r/k to calculate the interval or width (w) of the bars.5.
Sort the data into the appropriate intervals and count the number of data points that fall in each interval.6.
Calculate the frequencies (actual counts or percent) for each interval.7.
Draw the bars. The height of the bar is calculated by dividing the frequency by w, the width of the bar (inhorizontal units).
8.
Figure 5-4. Example Histogram - Number of Modules with n Defects.
InterpretationA histogram is a frequency distribution, in which the area of each bar is always proportional to the actual percentage ofthe total falling in a given range. For example, Figure 5-4 shows that 30% of all modules contain 10-20 defects, indicatedby the largest bar. Both Figure 5-4 and Figure 5-2a are plotted with the same data. Note the difference in the relative sizeof the bars. If the bars are of equal width, then the histogram is equivalent to a bar graph, in which the relative size of thebars depends only on their heights. A histogram can be compared to the normal distribution (or other distribution). Forexample, if the graph is off-center or skewed, this may indicate that a process requires adjustment.
Application ExamplesHistograms are essentially used for the same applications as bar graphs, except that the horizontal scale in a histogrammust be numerical, usually representing a continuous random variable. See Application Examples for Bar Graphs.5.4.5. Scatter Diagram
A scatter diagram is a plot of the values of one variable against those of another variable to determine the relationshipbetween them. This technique was popularized by Walter Shewhart at Bell Laboratories. Scatter diagrams are usedduring analysis to understand the cause and effect relationship between two variables. They are also called correlationdiagrams. This section is based on [KITCHENHAM], [OPMC], and [CAPRIO].
Implementation
Define the subject and select the variables.1.
Collect the data.2.
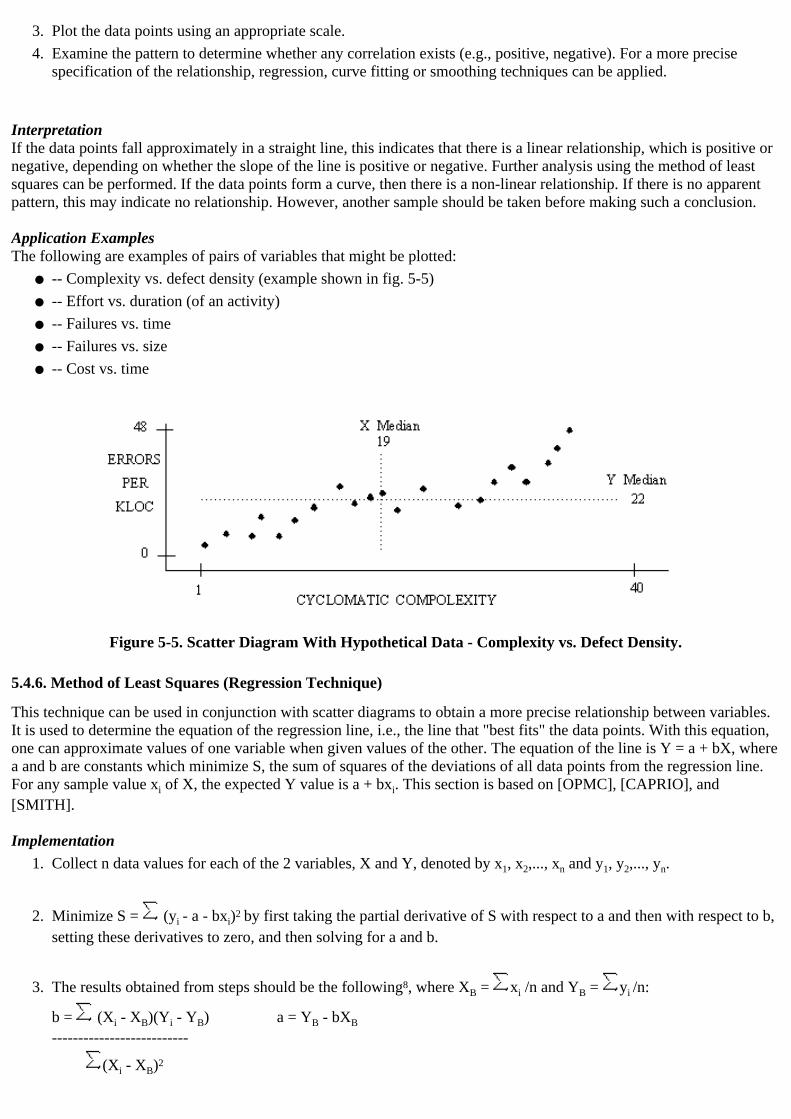
Plot the data points using an appropriate scale.3.
Examine the pattern to determine whether any correlation exists (e.g., positive, negative). For a more precisespecification of the relationship, regression, curve fitting or smoothing techniques can be applied.
4.
InterpretationIf the data points fall approximately in a straight line, this indicates that there is a linear relationship, which is positive ornegative, depending on whether the slope of the line is positive or negative. Further analysis using the method of leastsquares can be performed. If the data points form a curve, then there is a non-linear relationship. If there is no apparentpattern, this may indicate no relationship. However, another sample should be taken before making such a conclusion.
Application ExamplesThe following are examples of pairs of variables that might be plotted:
-- Complexity vs. defect density (example shown in fig. 5-5)●
-- Effort vs. duration (of an activity)●
-- Failures vs. time●
-- Failures vs. size●
-- Cost vs. time●
Figure 5-5. Scatter Diagram With Hypothetical Data - Complexity vs. Defect Density.
5.4.6. Method of Least Squares (Regression Technique)
This technique can be used in conjunction with scatter diagrams to obtain a more precise relationship between variables.It is used to determine the equation of the regression line, i.e., the line that "best fits" the data points. With this equation,one can approximate values of one variable when given values of the other. The equation of the line is Y = a + bX, wherea and b are constants which minimize S, the sum of squares of the deviations of all data points from the regression line.For any sample value xi of X, the expected Y value is a + bxi. This section is based on [OPMC], [CAPRIO], and[SMITH].
Implementation
Collect n data values for each of the 2 variables, X and Y, denoted by x1, x2,..., xn and y1, y2,..., yn.1.
Minimize S = (yi - a - bxi)2 by first taking the partial derivative of S with respect to a and then with respect to b,setting these derivatives to zero, and then solving for a and b.
2.
The results obtained from steps should be the following8, where XB = xi /n and YB = yi /n:
b = (Xi - XB)(Yi - YB) a = YB - bXB
--------------------------
(Xi - XB)2
3.

InterpretationThe constant a represents the intercept of the regression line, i.e., the value of Y when X is 0, and b represents the slopeof the regression line. The idea of this technique is to minimize S, so that all data points will be as close to the regressionline as possible. The reason for taking the squares of the deviations, rather than simply the deviations, is so that positiveand negative deviations will not cancel each other when they are summed. It would also be possible to sum the absolutevalues of the deviations, but absolute values are generally harder to work with than squares.
Application ExamplesSee Application Examples for Scatter Diagrams. ~~~~~~~~~~~~~~~~~~~~~~~~~~~~~~~~~~~~~~~~~~~~8 Another form of the equation for b, which is often easier to compute is
b = XiYi - nXBYB
------------------
Xi2 - n(XB)2
~~~~~~~~~~~~~~~~~~~~~~~~~~~~~~~~~~~~~~~~~~~~
5.5. Software Reliability Estimation Models
"Reliability" is used in a general sense to express a degree of confidence that a part or system will successfully functionin a certain environment during a specified time period [JURAN]. Software reliability estimation models can predict thefuture behavior of a software product, based on its past behavior, usually in terms of failure rates. Since 1972, more than40 software reliability estimation models have been developed, with each based on a certain set of assumptionscharacterizing the environment generating the data. However, in spite of much research effort, there is no universallyapplicable software reliability estimation model which can be trusted to give accurate predictions of reliability in allcircumstances [BROCKLEHURST].
It is usually possible to obtain accurate reliability predictions for software, and to have confidence in their accuracy, ifappropriate data is used [ROOK]. Also, the use of reliability estimation models is still under active research, soimprovements to model capability are likely. Recent work by Littlewood (1989), for example, involves the use oftechniques for improving the accuracy of predictions by learning from the analysis of past errors [ROOK], andrecalibration [BROCKLEHURST].
Some problems have been encountered by those who have tried to apply reliability estimation models in practice. Thealgorithms used to estimate the model parameters may fail to converge. When they do, the estimates can vary widely asmore data is entered [DACS]. There is also the difficulty of choosing which reliability model to use, especially since onecan not know a priori which of the many models is most suitable in a particular context [BROCKLEHURST]. In general,the use of these models is only suitable for situations in which fairly modest reliability levels are required [ROOK].
There are three general classes of software reliability estimation models: nonhomogeneous Poisson process (NHPP)models, exponential renewal NHPP models, and Bayesian models. Some of the more common reliability estimationmodels are described below [DUNN], [LYU].
-- Jelinski-Moranda (JM). One of the earliest models, it assumes the debugging process is purely deterministic, thatis, that each defect in the program is equally likely to produce failure (but at random times), and that each fix isperfect, i.e., introduces no new defects. It also assumes that the failure rate is proportional to the number ofremaining defects and remains constant between failures. This model tends to be too optimistic and tounderestimate the number of remaining faults; this effect has been observed in several actual data sets.
●
-- Goel-Okumoto (GO). This model is similar to JM, except it assumes the failure rate (number of failureoccurrences per unit of time) improves continuously in time.
●
-- Yamada Delayed S-Shape. This model is similar to GO, except it accounts for the learning period that testers gothrough as they become familiar with the software at the start of testing.
●
-- Musa-Okumoto (MO). This NHPP model is similar to GO, except it assumes that later fixes have a smallereffect on a program's reliability than earlier ones. Failures are assumed to be independent of each other.
●

-- Geometric. This model is a variation of JM, which does not assume a fixed, finite number of program errors, nordoes it assume that errors are equally likely to occur.
●
-- Schneidewind. Similar to JM, this model assumes that as testing proceeds with time, the error detection processchanges, and that recent error counts are usually more useful than earlier counts in predicting future counts.
●
-- Bayesian Jelinski-Moranda (BJM) Model. This model is similar to JM, except that it uses a Bayesian inferencescheme, rather than maximum likelihood. Although BJM does not drastically underestimate the number ofremaining errors, it does not offer significant improvement over JM. Actual reliability predictions of the twomodels are usually very close.
●
-- Littlewood. This model attempts to answer the criticisms of JM and BJM by assuming that different faults havedifferent sizes, i.e., they contribute unequally to the unreliability of the software. This assumption represents theuncertainty about the effect of a fix.
●
-- Littlewood-Verrall (LV). This model takes into account the uncertainty of fault size and efficacy of a fix (i.e., afix is of uncertain magnitude and may make a program less reliable), by letting the size of the improvement in thefailure rate at a fix vary randomly.
●
-- Brooks and Motley (BM). The BM binomial and Poisson models attempt to consider that not all of a program istested equally during a testing period and that only some portions of the program may be available for testingduring its development.
●
-- Duane. This model assumes that the failure rate changes continuously in time, i.e., it follows a nonhomogeneousPoisson process. The cumulative failure rate when plotted against the total testing time on a ln-ln graph follows astraight line. The two parameters for the equation of the line can be derived using the method of least squares.
●
Implementation
The following is a generic procedure for estimating software reliability [AIAA]. It can be tailored to a specific project orlifecycle phase; thus some steps may not be used in some applications.
Identify the application. The description of the application should include, at a minimum, the identification of theapplication, the characteristics of the application domain that may affect reliability, and details of the intendedoperation of the application system.
1.
Specify the requirement. The reliability requirement should be specific enough to serve as a goal (e.g., failure rateof 10-9 per hour).
2.
Allocate the requirement. The reliability requirement may be distributed over several components, which should beidentified.
3.
Define failure. A specific failure definition is usually agreed upon by testers, developers, and users prior to thebeginning of testing. The definition should be consistent over the life of the project. Classification of failures (e.g.,by severity) is continuously negotiated.
4.
Characterize the operational environment. The operational environment should be described in terms of the systemconfiguration (arrangement of the system's components), system evolution and system operational profile (howsystem will be used).
5.
Select tests. The test team selects the most appropriate tests for exposing faults. Two approaches to testing can betaken: testing duplicates actual operational environments as closely as possible; or testing is conducted under moresevere conditions than expected in normal operational environments, so that failures can occur in less time.
6.
Select the models. The user should compare the models prior to selection based on the following criteria:7.

predictive validity, ease of parameter measurement, quality of the model's assumptions, capability, applicability,simplicity, insensitivity to noise, and sensitivity to parameter variations.
Collect data. See section 5.2.8.
Determine the parameters. There are three common methods of estimating the parameters from the data: method ofmoments, least squares, and maximum likelihood. Each of these methods has useful attributes, but maximumlikelihood estimation is the most commonly used approach. However, for some models, the maximum likelihoodmethod does not yield equations for the parameters in closed form, so instead numerical methods (e.g., Newton'smethod) must be used [ROME]. As stated previously, some datasets may cause the numerical methods not toconverge. There exist automated software reliability engineering tools, which are capable of performing parameterestimation.
9.
Validate the model. The model should be continuously checked to verify that it fits the data, by using a predictivevalidity criteria or a traditional statistical goodness-of-fit test (e.g., Chi-square).
10.
Perform analysis. The results of software reliability estimation may be used for several purposes, including, but notlimited to, estimating current reliability, forecasting achievement of a reliability goal, establishing conformancewith acceptance criteria, managing entry of new software features or new technology into an existing system, orsupporting safety certification.
11.
Interpretation
A disadvantage of these models is that they rely on testing and hence are used rather late in the development life cycle.The models are usually time based, that is, the probability is based on time to failure. Research is needed to identify howto use more valuable parameters with these models. See [ROOK]
Application ExamplesApplicability of the models should be examined through various sizes, structures, functions and application domains. Anadvantage of a reliability model is its usability in different development and operational environments, and in differentlifecycle phases. Software reliability models should be used when dealing with the following situations:
-- Evolving software (i.e., software that is incrementally integrated during testing)●
-- Classification of failure severity●
-- Incomplete failure data●
-- Hardware execution rate differences●
-- Multiple installations of the same software●
-- Project environments departing from model assumptions●
6. SUMMARY
Error analysis for software consists of many activities to assure the quality of delivered software. The activities includeerror detection, analysis, resolution on an individual level and also on a collective level. In the latter case, the collectivedata may be used to locate common errors within a product, to identify areas for improvement in software developmentand maintenance, and to identify areas for improvement in error analysis.
Many activities of error analysis may be conducted during the early phases of the software development lifecycle toprevent error propagation and to reduce costs of fixing the errors at a later time in the lifecycle. Finding the root cause ofan error discovered in system test may require analysis of code, design specifications, software requirementsdocumentation, and perhaps analysis and test documentation. Correction of the error results in additional verification andtesting activities through the lifecycle products. The time spent initially in preparing correctly stated softwarerequirements will pay off in reduced time needed for rework in the later phases.
The error detection techniques described in this report are a representative sampling of the most widely-used errordetection techniques and those most frequently referenced in standards, guidelines and technical literature. The reportalso describes some techniques which represent new approaches and are not yet widespread. The techniques include

those that examine software products without executing the software, those that execute (or simulate the execution of) thesoftware, and those that are based on mathematical analysis and proof of correctness techniques. Evidence of theeffectiveness of any of these techniques may be hard to find. Journal articles report success of some techniques, but mostoften anecdotal evidence is provided through conference presentations and discussions among colleagues.
With many techniques to choose from, appropriate selection for a specific project depends on the characteristics of theproject, such as the types of problems most likely to occur. Other selection criteria, which are outside the scope of thisreport, include parameters like development processes, skill of the technical staff, project resources, and qualityrequirements of the project.
The study of standards for high integrity software reported in [NUREG, NIST204] indicated that these standards arebeginning to require techniques of all kinds with some guidelines attempting to base the requirement on the qualityrequirements and problem types of the software project. An examination of approximately 50 standards, draft standards,and guidelines indicates that these documents vary widely in their recommendations for error analysis.
Error detection is only one activity of error analysis. Information about the detected error must be reported and deliveredto any persons responsible for correcting the error, managing the project, analyzing the data for process improvement andidentifying similar problems in the product. Individual problem reports may be collected and analyzed using statisticalprocess control techniques, to determine and monitor the efficiency and adequacy of the development process. Findingswhich result from using SPC techniques should be used as feedback to improve the development process for the current,as well as future, products. Data on single errors is also used in estimating software reliability and in predicting thenumber of errors (at later stages in the lifecycle).
Vendors should use error analysis to collect error data and to build corporate memory databases for use across projects.They may use the error information to identify appropriate techniques for similar projects and to better understand how toproduce quality software systems.
Regulatory agencies should also consider establishing and maintaining a database of error analysis data for softwaresystems. Willingness of vendors to participate must include mechanisms to assure confidentiality of proprietaryinformation and that vendor data will not be used in a recriminatory sense. The database must contain bothdevelopmental and operational error data for effective use. Vendors, auditors, regulators, and the software engineeringcommunity may all benefit from use of error databases.
Auditors may use the information in the database to identify the most error-prone features of specific high integritysystems and may ensure that their audits examine these features carefully. The auditors may use the data to identifyacceptance limits on different aspects of the high integrity software safety system.
Regulators may use the information from a database in several ways. First, over time, it may become apparent that someerror analysis techniques are more effective than others with respect to a given type of problem. It may also becomeapparent that problems in these areas occur most often with certain development practices or occur less frequently withother development practices. This knowledge may influence recommendations in regulatory documents.
Finally, careful analysis of the information in the database may enable the software engineering community in general toidentify research needs for software development practices to prevent specific problems from occurring and erroranalysis techniques to locate problems as soon as possible in the software lifecycle.
7. REFERENCES[AIAA]
R-013-1992, "Recommended Practice for Software Reliability," American Institute of Aeronautics andAstronautics, Space-Based Observation Systems Committee on Standards, Software Reliability Working Group,1992, c/o Jim French, AIAA Headquarters, 370 L'Enfant Promenade, SW, Washington, DC 20024-2518W.
[AIRFORCE]
AFSCP 800-14, Air Force Systems Command, Software Quality Indicators, "Management Quality Insight,"Department of the Air Force, January 20, 1987.
[ALBRECHT]
Albrecht, Allan J. and John E. Gaffney, Jr., "Software Function, Source Lines of Code, and Development EffortPrediction: A Software Science Validation," IEEE Transactions on Software Engineering, Vol. SE-9, No. 6,November, 1983.
[ANS104]
ANSI/ANS-10.4-1987, "Guidelines for the Verification and Validation of Scientific and Engineering ComputerPrograms for the Nuclear Industry," American Nuclear Society, May 13, 1987.
[ASMENQA2]
ASME NQA-2a-1990 Part 2.7, "Quality Assurance Requirements for Nuclear Facility Applications," TheAmerican Society of Mechanical Engineers, November 1990.
[BASILI]
Basili, V.R. and R.W. Selby, "Comparing the Effectiveness of Software Testing Strategies," IEEE Transactionson Software Engineering , IEEE Computer Society, Volume SE-13, Number 12, December 1987, pp. 1278-1296.
[BEIZER]
Beizer, Boris, Software Testing Techniques, Van Nostrand Reinhold Company, New York, 1983.
[BROCKLEHURST]
Brocklehurst, S., P. Y. Chan, Bev Littlewood, and John Snell, "Recalibrating Software Reliability Models," IEEETransactions on Software Engineering , Vol. 16, No. 4, 1990.
[CAPRIO]
Caprio, William H., "The Tools for Quality," Total Quality Management Conference, Ft. Belvoir, Virginia, July13-15, 1992.
[CLARK]
Clark, Peter, and Bard S. Crawford, Evaluation and Validation (E&V) Reference Manual, TASC No. TR-5234-3,Version 3.0, February 14, 1991.
[DACS]
"Software Reliability Models," DACS Newsletter, Data & Analysis Center for Software, Volume X, Number 2,Summer, 1992.
[DEMILLO]
DeMillo, Richard A. et al. Software Testing and Evaluation , The Benjamin/Cummings Publishing Company,Inc., Menlo Park, CA, 1987.
[DEMMY]
Demmy, W. Steven and Arthur B. Petrini, "Statistical Process Control in Software Quality Assurance,"Proceedings of the 1989 National Aerospace and Electronics Conference, NAECON, May 22-26, 1989, Dayton,OH, IEEE, Inc., Piscataway, NJ, p. 1585-1590.
[DUNN]
Dunn, Robert. Software Defect Removal, McGraw-Hill, Inc., 1984.
[EWICS3]
Bishop, P. G. (ed.), Dependability of Critical Computer Systems 3 - Techniques Directory, The EuropeanWorkshop on Industrial Computer Systems Technical Committee 7 (EWICS TC7), Elsevier Science PublishersLtd, 1990.

[FAGAN]
Fagan, M. E., "Design and Code Inspections to Reduce Errors in Program Development," IBM Systems Journal,Volume 15, Number 3, 1976.
[FLORAC]
CMU/SEI-92-TR-ZZZ, "Software Quality Measurement: A Framework for Counting Problems, Failures, andFaults," William Florac, The Quality Subgroup of the Software Metrics Definition Working Group and theSoftware Process Measurement Project Team, Software Engineering Institute, Carnegie Mellon University,Pittsburgh, PA, Draft, 1992.
[FREEDMAN]
Freedman, David, Robert Pisani, and Roger Purves, "Statistics," W.W. Norton & Company, Inc., New York, 1978.
[GRADY]
Grady, Robert B. and Caswell, Deborah, Software Metrics: Establishing a Company-Wide Program,Prentice-Hall, Inc., Englewood Cliffs, New Jersey, 1987.
[GREEN]
Green, Scott E. and Rose Pajerski, "Cleanroom Process Evolution in the SEL," Proceedings of the SixteenthAnnual Software Engineering Workshop, National Aeronautics and Space Administration, Goddard Space FlightCenter, Greenbelt, MD 20771, December 1991.
[IEC65A94]
IEC 65A(Secretariat)94, "Draft British Standard 0000: Software for Computers in the Application of IndustrialSafety-Related Systems," WG9, December 6, 1989.
[IEC65A122]
IEC 65A(Secretariat)122, "Software for Computers in the Application of Industrial Safety- Related Systems,"WG9, Version 1.0, September 26, 1991.
[IEEEGLOSS]
ANSI/IEEE Std 610.12, "IEEE Standard Glossary of Software Engineering Terminology," The Institute ofElectrical and Electronics Engineers, February, 1991.
[IEEEP1044]
IEEE P1044, "Draft Standard of: A Standard Classification for Software Errors, Faults, and Failures," The Instituteof Electrical and Electronics Engineers, August 1991.
[IEEE982.2]
ANSI/IEEE Std 982.2-1988, "Guide for the Use of IEEE Standard Dictionary of Measures to Produce ReliableSoftware," The Institute of Electrical and Electronics Engineers, June, 1989.
[IEEE1012]
ANSI/IEEE Std 1012-1986, "IEEE Standard for Software Verification and Validation Plans," The Institute ofElectrical and Electronics Engineers, Inc., November 14, 1986.
[JURAN]
Juran, J. M. (ed.), Juran's Quality Control Handbook, 4th ed., McGraw-Hill, Inc., New York, 1988.
[KELLY]
Kelly, John C., Joseph S. Sherif, and Jonathan Hops, "An Analysis of Defect Densities Found During SoftwareInspections," Proceedings of the Fifteenth Annual Software Engineering Workshop, National Aeronautics and

Space Administration, Goddard Space Flight Center, Greenbelt, MD 20771, November, 1990.
[KITCHENHAM]
Kitchenham, B. A. and B. Littlewood, Measurement for Software Control and Assurance, Elsevier SciencePublishers Ltd, London and New York, 1989.
[LYLE]
Lyle, Jim, "Program Slicing," to be published in Encyclopedia of Software Engineering, John Wiley PublishingCo., New York, New York.
[LYU]
Lyu, Michael and Allen Nikora, "Applying Reliability Models More Effectively," IEEE Software, Vol. 9., No. 4,July, 1992.
[MAKOWSKY]
Makowsky, Lawrence C., Technical Report, USA-BRDEC-TR//2516, "A Guide to Independent Verification andValidation of Computer Software," United States Army, Belvoir Research, Development and Engineering Center,June 1992.
[MILLER]
Miller, Keith W., et al, "Estimating the Probability of Failure When Testing Reveals No Failures," IEEETransactions on Software Engineering, Vol.18, No.1, January 1992.
[MILLS]
Mills, H. D., M. Dyer, and R. C. Linger, "Cleanroom Software Engineering," IEEE Software, September, 1987,pp. 19-25.
[MOD55]
Interim Defence Standard 00-55, "The Procurement of Safety Critical Software in Defence Equipment," Parts 1and 2, Ministry of Defence, UK, April 5, 1991.
[MYERS]
Myers, Glenford J., The Art of Software Testing, John Wiley & Sons, New York, 1979.
[NBS93]
Powell, Patricia B., NBS Special Publication 500-93, "Software Validation, Verification, and Testing Techniqueand Tool Reference Guide," U.S. Department of Commerce/National Bureau of Standards (U.S.), September 1982.
[NIST187]
NIST SPEC PUB 500-187, "Application Portability Profile (APP) The U.S. Government's Open SystemEnvironment Profile OSE/1 Version 1.0," U.S. Department of Commerce/National Institute of Standards andTechnology, April 1991.
[NIST204]
Wallace, D.R., L.M. Ippolito, D.R. Kuhn, NIST SPEC PUB 500-204, "High Integrity Software Standards andGuidelines," U.S. Department of Commerce/National Institute of Standards and Technology, September, 1992.
[NISTGCR]
Craigen, Dan, Susan Gerhart, Ted Ralston, NISTGCR 93/626, "An International Surveyof Industrial Applicationsof Formal Methods," Volumes 1 and 2, U.S. Department of Commerce/National Institute of Standards andTechnology, March, 1993.

[NISTIR]
Wallace, D.R., W.W. Peng, L.M. Ippolito, NISTIR 4909,"Software Quality Assurance: Documentation andReviews," U.S. Department of Commerce/National Institute of Standards and Technology, 1992.
[NUREG]
Wallace, D.R., L.M. Ippolito, D.R. Kuhn, NUREG/CR-5930, "High Integrity Software Standards and Guidelines,"U.S. Nuclear Regulatory Commission, September, 1992.
[OPMC]
The Organizational Process Management Cycle Programmed Workbook, Interaction Research Institute, Inc.,Fairfax, Virginia.
[PARK]
Park, Robert, CMU/SEI-92-TR-20, ESC-TR-92-20, "Software Size Measurement: A Framework for CountingSource Statements," Software Engineering Institute, Carnegie Mellon University, September, 1992.
[PEYTON]
Peyton and Hess, "Software Sneak Analysis," IEEE Seventh Annual Conference of the Engineering in Medicineand Biology Society , The Institute of Electrical and Electronics Engineers, 1985.
[PUTNAM]
Putnam, Lawrence H. and Ware Myers, Measures for Excellence, Reliable Software On Time, Within Budget,Prentice-Hall, Inc., Englewood Cliffs, NJ, 1992.
[RIFKIN]
Rifkin, Stan and Charles Cox, "Measurement in Practice," Technical Report, CMU/SEI- 91-TR-16,ESD-TR-91-16, Carnegie Mellon University, 1991.
[ROME]
Iuorno, Rocco and Robert Vienneau, "Software Measurement Models," Draft, Prepared for Rome AirDevelopment Center, Griffiss Air Force Base, NY, July 1987.
[ROOK]
Rook, Paul, Software Reliability Handbook, Elsevier Science Publishers Ltd, Crown House, London and NewYork, 1990.
[SCHULMEYER]
Schulmeyer, G. Gordon. Zero Defect Software, McGraw-Hill, Inc., 1990.
[SHOOMAN]
Shooman, Martin L., "A Class of Exponential Software Reliability Models," Workshop on Software Reliability,IEEE Computer Society Technical Committee on Software Reliability Engineering, Washington, DC, April 13,1990.
[SQE]
"Software Measurement," Seminar Notebook, Version 1.2, Software Quality Engineering, 1991.
[SMITH]
Smith, Gary, Statistical Reasoning, Allyn and Bacon, Boston, MA, 1991.
[STSC]

MAC010/STSC, "Software Management Guide," Software Technology Center, Hill AFB, UT 84-56, October,1990.
[ROME]
Proceedings of the 3rd Annual Software Quality Workshop; Alexandria Bay, New York: August 11-15, 1991,Rome Laboratory, Griffiss AFB, New York.
[VOAS]
Voas, Jeffrey M. and Keith W. Miller," A Model for Improving the Testing of Reusable Software Components,"10th Pacific Northwest Software Quality Conference, October 19- 21, 1992, Portland, Oregon.
[WALLACE]
Wallace, Dolores R. "Software Verification and Validation," to be published in Encyclopedia of SoftwareEngineering, John Wiley Publishing Co., New York, NY.
[WALLACEFUJII]
Wallace, Dolores R. and Roger U. Fujii, "Verification and Validation: Techniques to Assure Reliability," IEEESoftware, May 1989.
[ZAGE]
Zage, Wayne M. "Code Metrics and Design Metrics; An ACM Professional Development Seminar," November 19,1991.
APPENDIX A. ERROR DETECTION TECHNIQUES
A.1. Algorithm Analysis
Description:The purpose is to determine the correctness of an algorithm with respect to its intended use, to determine its operationalcharacteristics, or to understand it more fully in order to modify, simplify, or improve. The analysis involves rederivingequations or evaluating the suitability of specific numerical techniques. Algorithms are analyzed for correctness,efficiency (in terms of time and space needed), simplicity, optimality, and accuracy. Algorithm analysis also examinestruncation and round-off effects, numerical precision of word storage and variables (e.g., single- vs. extended-precisionarithmetic), and data typing influences.
Advantages:
-- Effective and useful in general●
Disadvantages:
-- A particular analysis depends on the particular model of computation (e.g, Turing machine, random accessmachine). If the assumptions of the model are inappropriate, then the analysis will be inaccurate.
●
Type of Errors Detected:
-- Incorrect, inappropriate, or unstable algorithms●
-- Program does not terminate●
-- Inability to operate on the full range of data - e.g., trigonometric routine only works in the first quadrant●
-- Incorrect analysis of computational error (effect of round-off and truncation errors)●
-- Incompatible data representations - e.g., input in lbs., program processes kilograms●
-- Incompatibility with hardware or software resources●
References: [IEEE1012], [DUNN], [WALLACE], [NBS93]

A.2. Back-to-Back Testing
Description:This technique is used to detect test failures by comparing the output of two or more programs implemented to the samespecification. The same input data is applied to two or more program versions and their outputs are compared to detectanomalies. Any test data selection strategy can be used for this type of testing, although random testing is well suited tothis approach. Also known as comparison testing.
Advantages:
-- Permits a large number of tests to be made with little effort●
-- Rapid fault detection●
Disadvantages:
-- Requires the construction of at least one secondary program, although this may be available as part of the overalldevelopment
●
-- Discrepancies must be analyzed manually to determine which program is at fault (it is not sufficient to assumethat majority is always correct)
●
Types of Errors Detected:
-- Does not detect specific errors, only anomalies or discrepancies between programs●
References: [EWICS3]A.3. Boundary Value Analysis
Description:The purpose is to detect and remove errors occurring at parameter limits or boundaries. The input domain of the programis divided into a number of input classes. The tests should cover the boundaries and extremes of the classes. The testscheck that the boundaries of the input domain of the specification coincide with those in the program. The value zero,whether used directly or indirectly, should be used with special attention (e.g., division by zero, null matrix, zero tableentry). Usually, boundary values of the input produce boundary values for the output. Test cases should also be designedto force the output to its extreme values. If possible, a test case which causes output to exceed the specification boundaryvalues should be specified. If output is a sequence of data, special attention should be given to the first and last elementsand to lists containing zero, one, and two elements.
Advantages:
-- Verifies that program will behave correctly for any permissible input or output●
Disadvantages:
-- No significant disadvantages in itself but for programs with many types of input cannot test all combinations ofinput and therefore cannot identify problems resulting from unexpected relationships between input types
●
Types of Errors Detected
-- Algorithm errors●
-- Array size●
-- Specification errors●
References: [MYERS]A.4. Control Flow Analysis/Diagrams
Description:This technique is most applicable to real time and data driven systems. Logic and data requirements are transformed fromtext into graphic flows, which are easier to analyze. Examples of control flow diagrams include PERT, state transition,and transaction diagrams. For large projects, control flow analysis using control flow diagrams that show the hierarchy ofmain routines and subfunctions are useful to understand the flow of program control. Purpose is to detect poor andpotentially incorrect program structures. The program is represented by a directed graph, which is analyzed for the errors

below.
Advantages:
-- Simple to apply●
-- Readily automated●
Disadvantages:
-- Results require some interpretation. Identified anomalies may not be faults.●
-- Sometimes difficult to deal with "aliasing" where different variables are associated with the same locations inmemory
●
Types of Errors Detected:
-- Inaccessible/unreachable code●
-- Knotted code - If code is well-structured the directed graph can be reduced to a single node. If code is poorlystructured, it can only be reduced to a "knot" composed of several nodes.
●
References: [IEEE1012], [EWICS3]A.5. Database Analysis
Description:Database analysis is performed on programs with significant data storage to ensure that common data and variableregions are used consistently between all call routines; data integrity is enforced and no data or variable can beaccidentally overwritten by overflowing data tables; data access through indirect access is checked; and data typing anduse are consistent throughout all program elements. Useful for programs that store program logic in data parameters. Thepurpose is to ensure that the database structure and access methods are compatible with the logical design. Diagrams areuseful for understanding user privileges.
Advantages:
-- Supports interface analysis●
Disadvantages:
-- May require manual examination of diagrams for access problems●
Types of Errors Detected:
-- Inconsistent use of data types●
-- Incorrect access protections●
References: [IEEE1012]A.6. Data Flow Analysis
Description:The purpose is to detect poor and potentially incorrect program structures. Data flow analysis combines the informationobtained from the control flow analysis with information about which variables are read or written in different portions ofcode. May also be used in the design and implementation phases.
Advantages:
-- Readily automated●
-- Easy to apply●
Disadvantages:
-- Requires some interpretation●
-- Some anomalies may not be faults●

Types of Errors Detected:
-- Undefined input/output data or format●
-- Incorrect data flow●
-- Variables that are read before they are written (likely to be an error, and is bad programming practice)●
-- Omitted code - indicated by variables that are written more than once without being read●
-- Redundant code - indicated by variables that are written but never read●
References: [EWICS3], [IEEE1012]A.7. Data Flow Diagrams
Description:Data flow diagrams are used to describe the data flow through a program in a diagrammatic form. They show how datainput is transformed to output, with each stage representing a distinct transformation. The diagrams use three types ofcomponents:
Annotated bubbles - bubbles represent transformation centers and the annotation specifies the transformation1.
Annotated arrows - arrows represent the data flow in and out of the transformation centers, annotations specifywhat the data is
2.
Operators (AND, XOR) - used to link the annotated arrows3.
Data flow diagrams only describe data, and should not include control or sequencing information. Each bubble can beconsidered a black box which, as soon as its inputs are available, transforms them to outputs. Each should represent adistinct transformation, whose output is somehow different from its input. There are no rules regarding the overallstructure of the diagram.
Advantages:
-- They show transformations without making assumptions about how the transformations are implemented.●
Disadvantages:
-- Inability to provide information about the transformation process●
Type of Errors Detected:
-- Incorrect data input/output●
-- Inconsistencies in data usage●
References: [IEC65A94]A.8. Decision Tables (Truth Tables)
Description:The purpose is to provide a clear and coherent analysis of complex logical combinations and relationships. This methoduses two-dimensional tables to concisely describe logical relationships between boolean program variables.
Advantages:
-- Their conciseness and tabular nature enable the analysis of complex logical combinations expressed in code.●
-- Potentially executable if used as specifications●
Disadvantages:
-- Tedious effort required●
Types of Errors Detected:
-- Logic●
References: [IEC65A122]

A.9. Desk Checking (Code Reading)
Description:Code is read by an expert, other than the author of the code, who performs any of the following: looking over the codefor obvious defects, checking for correct procedure interfaces, reading the comments to develop a sense of what the codedoes and then comparing it to its external specifications, comparing comments to design documentation, comparingcomments to design documentation, stepping through with input conditions contrived to "exercise" all paths includingthose not directly related to the external specifications, checking for compliance with programming standards andconventions, any combination of the above.
Advantages:
-- Inexpensive●
-- Capable of catching 30% of all errors, if performed meticulously●
-- Can be more effective than functional testing or structural testing (NASA Goddard Space Flight Centerexperiment, see [BASILI])
●
Disadvantages:
-- Requires enormous amount of discipline●
-- Few people are able to use this technique effectively●
-- Usually less effective than walkthroughs or inspections●
Types of errors detected:LOGIC AND CONTROL
-- unreachable code●
-- improper nesting of loops and branches●
-- inverted predicates●
-- incomplete predicates●
-- improper sequencing of processes●
-- infinite loops●
-- instruction modification●
-- failure to save or restore registers●
-- unauthorized recursion●
-- missing labels or code●
-- unreferenced labels●
COMPUTATIONAL-- missing validity tests●
-- incorrect access of array components●
-- mismatched parameter lists●
-- initialization faults●
-- anachronistic data●
-- undefined variables●
-- undeclared variables●
-- misuse of variables (locally and globally)●
-- data fields unconstrained by natural or defined data boundaries●
-- inefficient data transport●
OTHER-- calls to subprograms that do not exist●
-- improper program linkages●
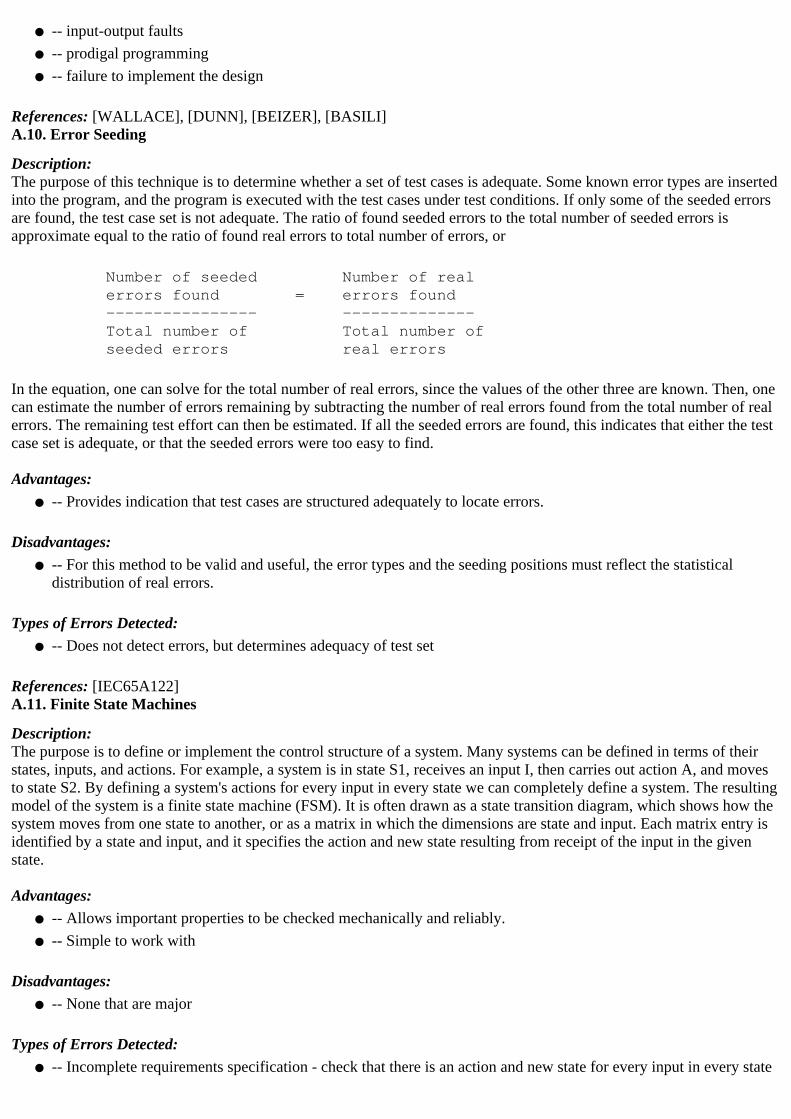
-- input-output faults●
-- prodigal programming●
-- failure to implement the design●
References: [WALLACE], [DUNN], [BEIZER], [BASILI]A.10. Error Seeding
Description:The purpose of this technique is to determine whether a set of test cases is adequate. Some known error types are insertedinto the program, and the program is executed with the test cases under test conditions. If only some of the seeded errorsare found, the test case set is not adequate. The ratio of found seeded errors to the total number of seeded errors isapproximate equal to the ratio of found real errors to total number of errors, or
Number of seeded Number of real errors found = errors found ---------------- -------------- Total number of Total number of seeded errors real errors
In the equation, one can solve for the total number of real errors, since the values of the other three are known. Then, onecan estimate the number of errors remaining by subtracting the number of real errors found from the total number of realerrors. The remaining test effort can then be estimated. If all the seeded errors are found, this indicates that either the testcase set is adequate, or that the seeded errors were too easy to find.
Advantages:
-- Provides indication that test cases are structured adequately to locate errors.●
Disadvantages:
-- For this method to be valid and useful, the error types and the seeding positions must reflect the statisticaldistribution of real errors.
●
Types of Errors Detected:
-- Does not detect errors, but determines adequacy of test set●
References: [IEC65A122]A.11. Finite State Machines
Description:The purpose is to define or implement the control structure of a system. Many systems can be defined in terms of theirstates, inputs, and actions. For example, a system is in state S1, receives an input I, then carries out action A, and movesto state S2. By defining a system's actions for every input in every state we can completely define a system. The resultingmodel of the system is a finite state machine (FSM). It is often drawn as a state transition diagram, which shows how thesystem moves from one state to another, or as a matrix in which the dimensions are state and input. Each matrix entry isidentified by a state and input, and it specifies the action and new state resulting from receipt of the input in the givenstate.
Advantages:
-- Allows important properties to be checked mechanically and reliably.●
-- Simple to work with●
Disadvantages:
-- None that are major●
Types of Errors Detected:
-- Incomplete requirements specification - check that there is an action and new state for every input in every state●

-- Inconsistent requirements - check that only one state change is defined for each state and input pair●
References: [EWICS3]A.12. Formal Methods (Formal Verification, Proof of Correctness, Formal Proof of Program)
Description:The purpose is to check whether software fulfills its intended function. Involves the use of theoretical and mathematicalmodels to prove the correctness of a program without executing it. The requirements should be written in a formalspecification language (e.g., VDM, Z) so that these requirements can then be verified using a proof of correctness. Usingthis method, the program is represented by a theorem and is proved with first-order predicate calculus. A number ofassertions are stated at various locations in the program, and are used as pre and post conditions to various paths in theprogram. The proof consists of showing that the program transfers the preconditions into the postconditions according toa set of logical rules, and that the program terminates.
Advantages:
-- Allows for rigorous statement concerning correctness●
-- Possibly the only way of showing the correctness of general WHILE loops●
Disadvantages:
-- Time consuming to do manually●
-- Requires enormous amount of intellectual effort●
-- Must be checked mechanically for human errors●
-- Difficult to apply to large software systems●
-- If formal specifications are not used in the design, then formal verification (proof of correctness afterimplementation tends to be extremely difficult
●
-- Only applicable to sequential programs, not concurrent program interactions●
References: [IEC65A122], [ROOK]A.13. Information Flow Analysis
Description:An extension of data flow analysis, in which the actual data flows (both within and between procedures) are comparedwith the design intent. Normally implemented with an automated tool where the intended data flows are defined using astructured comment that can be read by the tool.
Advantages:
-- Simple to apply●
-- Readily automated●
Disadvantages:
-- Results require some interpretation●
-- Some anomalies may not be faults●
Types of Errors Detected:
-- Undefined input / output data or format●
-- Incorrect flow of information●
References: [EWICS3]A.14. (Fagan) InspectionsDescription:An inspection is an evaluation technique in which software requirements, design, code, or other products are examinedby a person or group other than the author to detect faults, violations of development standards, and other problems. Aninspection begins with the distribution of the item to be inspected (e.g., a specification, some code, test data). Eachparticipant is required to analyze the item on his own. During the inspection, which is the meeting of all the participants,

the item is jointly analyzed to find as many errors as possible. All errors found are recorded, but no attempt is made tocorrect the errors at that time. However, at some point in the future, it must be verified that the errors found have actuallybeen corrected. Inspections may also be performed in the design and implementation phases.
Advantages:
-- Provides comprehensive statistics on classes of errors●
-- Studies have shown that inspections are an effective method of increasing product quality (e.g., reliability,usability, maintainability)
●
-- Effective for projects of all sizes●
-- Qualitative benefits: less complex programs, subprograms written in a consistent style, highly visible systemdevelopment, more reliable estimating and scheduling, increased user satisfaction, improved documentation, lessdependence on key personnel for critical skills
●
Disadvantages:
-- Inspectors must be independent of programmers●
-- Programmers may feel inspection is a personal attack on their work●
-- Time consuming, involving several staff (2 or 3 pages of not-difficult code may take 3 h to inspect)●
Type of Errors Detected:
-- Weak modularity●
-- Failure to handle exceptions●
-- Inexpansible control structure●
-- Nonexisting or inadequate error traps●
-- Incomplete requirements●
-- Infeasible requirements●
-- Conflicting requirements●
-- Incorrect specification of resources●
References: [DUNN], [FAGAN], [IEC65A94], [MYERS], [NBS93]A.15. Interface Analysis
Description:This technique is used to demonstrate that the interfaces of subprograms do not contain any errors or any errors that leadto failures in a particular application of the software or to detect all errors that may be relevant. Interface analysis isespecially important if interfaces do not contain assertions that detect incorrect parameter values. It is also important afternew configurations of pre-existing subprograms have been generated. The types of interfaces that are analyzed includeexternal, internal, hardware/hardware, software/software, software/hardware, and software/database. Interface analysismay include the following:
-- Analysis of all interface variables at their extreme positions●
-- Analysis of interface variables individually at their extreme values with other interface variables at normalvalues
●
-- Analysis of all values of the domain of each interface variable with other interface variables at normal values●
Advantages:
-- Can locate problems that would prevent system from functioning due to improper interfaces●
-- Especially useful for software requirements verification and design verification●
-- When used with prototyping or simulation, can find many critical errors that would be costly to correct in thedelivered system
●
-- Software design tools exist for analysis of interfaces, during design phase●
Disadvantages:
-- Manual effort may be time-consuming●

Types of Errors detected:
-- Input / output description errors (e.g., values of input variables altered)●
-- Actual and formal parameters mismatch (precision, type, units, and number)●
-- Incorrect functions used or incorrect subroutine called●
-- Inconsistency of attributes of global variables (common, etc.)●
-- Incorrect assumptions about static and dynamic storage of values (i.e., whether local variables are saved betweensubroutine calls)
●
-- Inconsistencies between subroutine usage list and called subroutine●
References: [WALLACE], [MAKOWSKY]A.16. Interface Testing
Description:Similar to interface analysis, except test cases are built with data that tests all interfaces. Interface testing may include thefollowing:
-- Testing all interface variables at their extreme positions●
-- Testing interface variables individually at their extreme values with other interface variables at normal values●
-- Testing all values of the domain of each interface variable with other interface variables at normal values●
-- Testing all values of all variables in combination (may be feasible only for small interfaces).●
Advantages:
-- Locates errors that may prevent system from operating at all or locates errors in timing of interface responses(e.g., slow system response to users was a factor in the failure of the THERAC medical system)
●
Disadvantages:
-- Without automation of design, or code modules, manual searching for interface parameters in all design or codemodules can be time consuming
●
Types of Errors Detected:
-- Input / output description errors●
-- Inconsistent interface parameters●
References: [IEC65A122]A.17. Mutation Analysis
Description:The purpose is to determine the thoroughness with which a program has been tested, and in the process, detect errors.This procedure involves producing a large set of versions or "mutations" of the original program, each derived by alteringa single element of the program (e.g., changing an operator, variable, or constant). Each mutant is then tested with agiven collection of test data sets. Since each mutant is essentially different from the original, the testing shoulddemonstrate that each is in fact different. If each of the outputs produced by the mutants differ from the output producedby the original program and from each other, then the program is considered adequately tested and correct.
Advantages:
-- Applicable to any algorithmic solution specification●
-- Results are good predictors of operational reliability●
Disadvantages:
-- Likely to require significant amounts of human analyst time and good insight●
-- Requires good automated tools to be effective●
-- Reliable only if all possible mutation errors are examined●

-- Cannot assure the absence of errors which cannot be modeled as mutations●
Type of Errors Detected:
-- Any errors that can be found by test●
References: [ANS104], [NBS93], [DEMILLO]A.18. Performance Testing
Description:The purpose is to measure how well the software system executes according to its required response times, cpu usage,and other quantified features in operation. These measurements may be simple to make (e.g., measuring process timerelative to volumes of input data) or more complicated (e.g., instrumenting the code to measure time per functionexecution).
Advantages:
-- Useful for checking timing synchronization of functions, memory locations, memory requirements and otherperformance features.
●
Disadvantages:
-- Caution required in instrumenting code to ensure the instrumentation itself does not interfere with processing offunctions or with locations of bytes under examination
●
Types of Errors Detected:
-- Timing, synchronization, and memory allocation●
References: [ROOK]A.19. Prototyping / Animation
Description:Purpose is to check the feasibility of implementing a system against the given constraints and to communicate thespecifier's interpretation of the system to the customer, in order to locate misunderstandings. A subset of systemfunctions, constraints, and performance requirements are selected. A prototype is built using high level tools, is evaluatedagainst the customer's criteria, and the system requirements may be modified as a result of this evaluation.
Advantages:
-- Better communication with customer●
-- Early detection of problems●
-- Check feasibility of new ideas or techniques●
Disadvantages:
-- Unnecessary and expensive if problem is well understood●
-- Tools are needed for quick implementation●
Types of Errors Detected:
-- User related●
-- Interface related●
-- Omitted functions●
-- Undesired functions●
-- Poorly defined functionality (e.g., specifications that do not cover all expected cases)●
-- Errors in the specification that lead to inconsistent states, failure conditions, erroneous results●
-- Contradictions in requirements●
-- Impossibility, infeasibility of requirements●

A.20. Regression Analysis and Testing
Description:Regression analysis is used to reevaluate requirements and design issues whenever any significant code change is made.It involves retesting of a software product to detect faults made during modification, to verify that modification has notcaused unintended side effects, and to verify that the modified software still meets its specified requirements. Anychanges made during installation and test are reviewed using regression analysis and test to verify that the basicrequirements and design assumptions, which affect other areas of the program, have not been violated.
Advantages:
-- Effectiveness depends on the quality of the data used. If tests based on the functional requirements are used tocreate the test data, technique is highly effective
●
Disadvantages:
-- Expense can appear to be prohibitive, especially for small changes. However, it can often be determined whichfunctions may be affected by a given change, so that the amount of testing can be reduced in these cases
●
Types of Errors Detected:
-- Errors caused by system modifications or corrections●
References: [ANS104], [WALLACE], [IEEE1012], [NBS93]A.21. Requirements Parsing
Description:This technique involves the examination of individual requirements statements to ensure that each statement is complete,readable, accurate, and consistent with other requirements. The manual technique requires analysis of the attributes of astatement: initiator of action, the action, the object of the action, conditions (e.g., when positive state reached), constraints(limits), source of action, destination (e.g., printer, screen, plotter), mechanism, reason for the action. When the data froma set of requirements is examined collectively, the results of the analysis may aid in identifying trends.
Advantages:
-- Promotes clarity, correctness, completeness, testability, and accuracy●
-- Can help to establish an English base from which to write a formal specification●
Disadvantages:
-- Very narrow look at each requirement. Could detract from analysis of more global examination of how therequirements fit together.
●
Types of errors detected:
-- Inconsistency in requirements●
-- Incomplete requirement●
-- Untestable requirement●
A.22. Reviews
Description:A review is a meeting at which the requirements, design, code, or other products of a software development project arepresented to the user, sponsor, or other interested parties for comment and approval, often as a prerequisite forconcluding a given phase of the software development process. Usually held at end of a phase, but may be called whenproblems arise. Often referred to as "Formal Review" versus desktop review of materials.
Advantages:
-- Provides opportunity to change course of a project before start of next phase.●
-- Because scope of review is usually broad, gives opportunity to recognize global problems●

Disadvantages:
-- If participants do not have materials ahead of time and spend time preparing, review will accomplish little ornothing.
●
-- Attention focus on major issues●
References: [ANS104], [IEEE1028]A.23. Sensitivity Analysis
Description:Sensitivity analysis is a new method of quantifying ultra-reliable software during the implementation phase. It is basedon the fault-failure model of software and attempts to approximate this model. There are three necessary conditions:
The fault must be executed.1.
The fault must affect the computational data state directly after the fault location.2.
The affected data state must propagate to an output variable.3.
Sensitivity analysis is based on the premise that software testability can predict the probability that failure will occurwhen a fault exists given a particular input distribution. A sensitive location is one in which faults cannot hide duringtesting. The approach expects reasonably "close to correct" code; results are tied to selected input distribution. Theinternal states are perturbed to determine sensitivity. Researchers of this technique have developed a tool that performsseveral analyses on source code to estimate the testability and sensitivity of the code. These analyses requireinstrumentation of the code and produce a count of the total executions through an operation (execution analysis), aninfection rate estimate, and a propagation analysis.
Advantages:
-- While software testing provides some quantification of reliability, sensitivity analysis provides quantification ofsoftware testing.
●
-- Presents a different approach to software reliability assessment, which usually is based on an exponentialdistribution of remaining faults over time.
●
-- Promising research that those needing ultra-reliable software should continue to follow.●
Disadvantages:
-- Intended to operate on code that has already been formally verified●
-- Still new, so that effectiveness of this technique is not yet known and use is not yet widespread●
-- Developed and currently promoted by only one company●
-- Tool is not sold, but rather the service of operating the tool on a client's code is sold●
Types of Errors Detected:
-- None, but is an aid to error detection techniques●
References: [MILLER], [VOAS]A.24. Simulation
Description:Simulation is used to test the functions of a software system, together with its interface to the real environment, withoutmodifying the environment in any way. The simulation may be software only or a combination of hardware and software.Simulation is used to evaluate the interactions of large, complex systems with many hardware, user, and other interfaces.A model of the system to be controlled by the actual system under test is created. This model mimics the behavior of thecontrolled system, and is for testing purposes only. It must provide all inputs of the system under test which will existwhen that system is installed; respond to outputs from the system in a way which accurately represents the controlledsystem; have provision for operator inputs to provide any perturbations with which the system under test is required tocope. When software is being tested, the simulation may be a simulation of the target hardware with its inputs andoutputs. In the installation phase, it is used to test operator procedures and to help isolate installation problems.

Advantages:
-- Enables simulation of critical aspects of the software that would not be practical to analyze manually.●
-- Provides means of performing functional tests of the system's behavior in the event of catastrophes which couldnot otherwise not be tested
●
-- Can provide a means of achieving "long term" test in a short period●
-- Can provide a means of investigating behavior at critical points by slowing the timescale or single stepping●
Disadvantages:
-- Difficult to achieve independently of the software being tested●
-- May require considerable resource both to create the simulation and to operate it●
-- Dependent on a model of the system which itself could contain safety related flaws●
Types of Errors Detected:
-- Interface errors●
-- Logical errors●
-- Errors in performance●
References: [IEEE1012], [WALLACE], [IEC65A122], [IEC65A94]A.25. Sizing and Timing Analysis
Description:Sizing/timing analysis is performed during incremental code development by obtaining program sizing and executiontiming values to determine if the program will satisfy processor size and performance requirements allocated to thesoftware. Significant deviations between actual and predicted values is a possible indication of problems or the need foradditional examination. This technique is most applicable to real-time programs having response time requirements andconstrained memory execution space requirements.
Advantages:
-- Opportunity to study sequence of operations, especially interfaces between humans and response to usercommands
●
-- Indicator of whether integrated system will perform appropriately●
Disadvantages:
-- Time consuming when conducted by poring over control flow or data flow diagrams●
-- When timing results are collected by executing code, must be careful that test code does not alter timing as itwould be without the test code
●
Types of Error Detected:
-- Unacceptable processor load●
-- Control structure ignores processing priorities●
References: [WALLACE], [DUNN], [IEEE1012]A.26. Slicing
Description:Slicing is a program decomposition technique that is based on extracting statements relevant to a specific computationfrom a program. It produces a smaller program that is a subset of the original program. Without intervening irrelevantstatements, it is easier for a programmer interested in a subset of the program's behavior to understand the correspondingslice rather than to deal with the entire program. This technique can be applied to program debugging, testing, parallelprogram execution and software maintenance. Several variations of this technique have been developed, includingprogram dicing, dynamic slicing and decomposition slicing.

Advantages:
-- Readily automated●
-- Reduces time needed for debugging and testing●
Disadvantages:
-- Resource consuming tool/ method●
Types of Errors Detected:
-- Aids in finding root of errors during debugging and testing, by narrowing the focus of investigation●
References: [LYLE]A.27. Software Sneak Circuit Analysis
Description:This technique is used to detect an unexpected path or logic flow which causes undesired program functions or inhibitsdesired functions. Sneak circuit paths are latent conditions inadvertently designed or coded into a system, which cancause it to malfunction under certain conditions.
To perform sneak circuit analysis, source code is first converted, usually by computer, into an input language descriptionfile into topological network trees. Then the trees are examined to identify which of the six basic topological patternsappear in the trees. Analysis takes place using checklists of questions about the use and relationships between the basictopological components.
Advantages:
-- Effective in finding errors not usually detected by desk checking or standard V&V techniques●
-- Applicable to programs written in any language●
-- Applicable to hardware, software, and the combined system●
Disadvantages:
-- Labor intensive●
-- Likely to be performed late in the development cycle, so changes will be costly●
Types of Error Detected:
-- Unintended functions/outputs●
References: [PEYTON], [EWICS3]A.28. Stress Testing
Description:Involves testing the response of the system to extreme conditions (e.g., with an exceptionally high workload over a shortspan of time) to identify vulnerable points within the software and to show that the system can withstand normalworkloads. Examples of testing conditions that can be applied include the following:
-- If the size of the database plays an important role, then increase it beyond normal conditions.●
-- Increase the input changes or demands per time unit beyond normal conditions.●
-- For the most extreme case, put all influential factors to the boundary conditions at the same time.●
Under these test conditions, the time behavior can be evaluated and the influence of load changes observed. The correctdimension of internal buffers or dynamic variables, stacks, etc. can be checked.
Advantages:
-- Often the only method to determine that certain kinds of systems will be robust when maximum numbers ofusers are using the system, at fastest rate possible (e.g., transaction processing) and to identify that contingencyactions planned when more than maximum allowable numbers of users attempt to use system, when volume isgreater than allowable amount, etc.
●

Disadvantages:
-- Requires large resources●
Types of Errors Detected:
-- Design errors related to full-service requirements of system and errors in planning defaults when system isover-stressed
●
References: [MYERS]A.29. Symbolic Execution
Description:This is an evaluation technique in which program execution is simulated using symbols rather than actual values for inputdata, and program output is expressed as logical or mathematical expressions involving these symbols.
Advantages:
-- No input data values are needed●
-- Results can be used in program proving●
-- Useful for discovering a variety of errors●
Disadvantages:
-- Result will consist of algebraic expressions which easily get very bulky and difficult to interpret●
-- Difficult to analyze loops with variable length●
-- For most programs, the number of possible symbolic expressions is excessively large●
-- Unlikely to detect missing paths●
-- Studies have shown that in general, it is not more effective than the combined use of other methods such as staticand dynamic analyses
●
Types of Errors Detected:
-- None, but is an aid for detecting errors. A person must verify the correctness of the output generated bysymbolic execution in the same way that output is verified when generated by executing a program over actualvalues.
●
References: [ANS104], [EWICS3], [NBS93]A.30. Test Certification
Description:The purpose is to ensure that reported test results are the actual finding of the tests. Test related tools, media, anddocumentation shall be certified to ensure maintainability and repeatability of tests. This technique is also used to showthat the delivered software product is identical to the software product that was subjected to V&V.
Advantages:
-- Assurance that the test results are accurately presented●
-- Assurance that the corrected version of product is in compliance with test findings●
Disadvantages:
-- Often mistaken as a certification of system quality●
Type of Errors Detected:
-- Incorrect test results reported●
-- Tests reported that never occurred●
-- Incorrect version of product shipped●

References: [IEEE1012]A.31. Traceability Analysis (Tracing)
Description:There are several types of traceability analysis, including requirements trace, design trace, code trace, and test trace.Traceability analysis is the process of verifying that each specified requirement has been implemented in the design /code, that all aspects of the design / code have their basis in the specified requirements, and that testing produces resultscompatible with the specified requirements.
Advantages:
-- Highly effective for detecting errors during design and implementation phases●
-- Valuable aid in verifying completeness, consistency, and testability of software●
-- Aids in retesting software when a system requirement has been changed●
Disadvantages:
-- No significant disadvantages●
Types of Errors Detected:REQUIREMENTS:
-- Omitted functions●
-- Higher-order requirement improperly translated●
-- Software specification incompatible with other system specifications●
DESIGN:-- Omission or misinterpretation of specified requirements●
-- Detailed design does not conform to top-level design●
-- Failure to conform to standards●
CODE:-- Omission or misinterpretation of specified requirements●
-- Code does not conform to detailed design●
-- Failure to conform to standards●
TEST:-- Software does not perform functions and produce outputs in conformance with the requirements specification●
References: [DUNN], [ANS104], [NBS93]A.32. Walkthroughs
Description:A walkthrough is an evaluation technique in which a designer or programmer leads one or more other members of thedevelopment team through a segment of design or code, while the other members ask questions and make commentsabout technique, style, and identify possible errors, violations of development standards, and other problems.Walkthroughs are similar to reviews, but are less formal. Other essential differences include the following:
-- Participants are fellow programmers rather than representatives of other functions●
-- Scope - standards usually ignored. Successful static analysis results generally not confirmed●
-- Checklists are rarely used●
-- Follow-up is often ignored●
Advantages:
-- Less intimidating than formal reviews●

-- Identifies the most error-prone sections of the program, so more attention can be paid to these sections duringtesting
●
-- Very effective in finding logic design and coding errors●
Disadvantages:
-- Designers or programmers may feel walkthrough is an attack on their character or work●
Types of Errors Detected:
-- Interface●
-- Logic●
-- Data●
-- Syntax●
References: [ANS104], [DUNN], [IEC65A94]APPENDIX B. ERROR ANALYSIS TECHNIQUES CITED IN SOFTWARE STANDARDS
For [NUREG, NIST204], NIST conducted a survey of software engineering standards and guidelines used in theassurance of the quality of high integrity systems. Many of those documents require or recommend use of softwarequality assurance and software verification and validation techniques to locate errors in all phases of the softwarelifecycle. However, these techniques may not be sufficient to detect all errors. NIST extended that study to include otherstandards and guidelines in order to determine the extent of recommendations, requirements, and guidance for erroranalysis techniques. The results of this study are presented here.
This study included the examination of approximately 50 documents, which include software standards, draft standards,and guidelines, all selected from a bibliographic search. These documents pertain to high integrity systems, such as safetysystems for nuclear power plants, message transmitting devices, medical devices, and other safety-critical software. Thelist of documents that were reviewed, with the full document titles and corresponding identifiers, are shown in Table B-1.
One objective of this study of standards was to determine whether there is readily available supporting literature ontechniques that are required by the standards. The study showed that in most cases, there is not adequate informationavailable in the standards on how to use the techniques, and that a developer would have to rely on library searches (e.g.,books, journal articles) or information collected from previous projects. Another objective of this study was to look forconsensus in the standards to determine which techniques are generally agreed upon by experts for use.
Results showed that the standards varied in coverage of techniques. Some address techniques in detail, while others onlymention them. The study also found that some commonly used techniques like complexity analysis were citedinfrequently. Yet, technical literature and availability of complexity metrics tools indicate that complexity analysis isoften used to support error detection.
The specific findings are presented in Table B-2 below. For each technique, the table specifies the type, the standardswhich cite the technique, and the depth of discussion, e.g., whether the technique is mentioned, recommended, defined,or required. Although all of the selected documents were reviewed, information on them does not appear in the tableunless they address error analysis in some way.
Only a few techniques are explicitly required. These techniques may be required only under certain circumstances (e.g.,reviews are required only during the design phase). Many standards only mention techniques, and do not define,recommend, or require their use. Techniques that are "mentioned" may be examples of appropriate techniques that satisfycertain criteria. A few standards provide extensive information on several techniques, such as IEC65A(Secretariat)122and AFISC SSH 1-1.
Several documents have appendices which are not part of the standard, but are included with the standard for informationpurposes. These include ANSI/IEEE-ANS-7-4.3.2-19XX Draft 2, ANSI/ANS-10.4-1987, and ANSI/IEEE Std1012-1986. The appendices provide short definitions of the selected techniques.
FIPS 101 recommends techniques that can be used in each lifecycle phase. ANSI/IEEE Std 1012-1986 provides similarinformation in a chart containing optional and required techniques and specifies the lifecycle phases in which they can be

used.
Table B-1. List of Reviewed Documents
IDENTIFIER NUMBER AND TITLE
AFISC SSH 1-1AFISC SSH 1-1, "Software System Safety," Headquarters Air Force Inspection and SafetyCenter, 5 September 1985.
ANSI X9.9-1986ANSI X9.9-1986, "Financial Institution Message Authentication (Wholesale)," X9Secretariat, American Bankers Association, August 15, 1986.
ANSI X9.17-1985ANSI X9.17-1985, "Financial Institution Key Management (Wholesale)," X9 Secretariat,American Bankers Association, April 4, 1985.
ANSI/ANS-10.4-1987ANSI/ANS-10.4-1987, "Guidelines for the Verification and Validation of Scientific andEngineering Computer Programs for the Nuclear Industry," American Nuclear Society, May13, 1987.
ANSI/ASQC A3-1987ANSI/ASQC A3-1987, "Quality Systems Terminology," American Society or QualityControl, 1987.
ANSI/IEEE Std730.1-1989
ANSI/IEEE Std 730.1-1989, "IEEE Standard for Software Quality Assurance Plans,"Institute of Electrical and Electronics Engineers, Inc., October 10, 1989.
ANSI/IEEE Std1012-1986
ANSI/IEEE Std 1012-1986, "IEEE Standard for Software Verification and ValidationPlans," The Institute of Electrical and Electronics Engineers, Inc., November 14, 1986.
ANSI/IEEE-ANS-7-4.3.2-19XX
ANSI/IEEE-ANS-7-4.3.2-1982, "Application Criteria for Programmable Digital ComputerSystems in Safety Systems of Nuclear Power Generating Stations," American NuclearSociety, 1982. AND ANSI/IEEE-ANS-7- 4.3.2-19XX, Draft 2, as of November, 1991.
AQAP-13 AQAP-13, "NATO Software Quality Control System Requirements," NATO, August 1991.
ASME NQA-1-1989Supplement 17S-1
Supplement 17S-1, ASME NQA-1-1989, "Supplementary Requirements for QualityAssurance Records," The American Society of Mechanical Engineers.
ASME NQA-2a-1990ASME NQA-2a-1990, "Quality Assurance Requirements for Nuclear Facility Applications,"The American Society of Mechanical Engineers, November 1990.
ASME NQA-3-1989ASME NQA-3-1989, "Quality Assurance Program Requirements for the Collection ofScientific and Technical Information for Site Characterization of High-Level Nuclear WasteRepositories," The American Society of Mechanical Engineers, March 23, 1990.
CAN/CSA-Q396.1.2-89CAN/CSA-Q396.1.2-89, "Quality Assurance Program for Previous Developed SoftwareUsed in Critical Applications," Canadian Standards Association, January 1989.
CSC-STD-003-85CSC-STD-003-85, "Computer Security Requirements--Guidance for Applying theDepartment of Defense Trusted Computer System Evaluation Criteria in SpecificEnvironments," Department of Defense, 25 June 1985.
DLP880DLP880, "(DRAFT) Proposed Standard for Software for Computers in the Safety Systemsof Nuclear Power Stations (based on IEC Standard 880)," David L. Parnas, Queen'sUniversity, Kingston, Ontario, March, 1991.
DOD 5200.28-STDDOD 5200.28-STD, "Department of Defense Trusted Computer System EvaluationCriteria," Department of Defense, December 1985.
E.F.T. MessageAuthenticationGuidelines
Criteria and Procedures for Testing, Evaluating, and Certifying Message AuthenticationDevices for Federal E.F.T. Use," United States Department of the Treasury, September 1,1986.
FDA/HIMA (DRAFT)FDA/HIMA, "(DRAFT) Reviewer Guidance for Computer-Controlled Devices," MedicalDevice Industry Computer Software Committee, January 1989.
FIPS 74FIPS 74, "Guidelines for Implementing and Using the NBS Data Encryption Standard," U.S.Department of Commerce/National Bureau of Standards, 1981 April 1.
FIPS 81FIPS 81, "DES Modes of Operation," U.S. Department of Commerce/ National Bureau ofStandards, 1980 December 2.
FIPS 46-1FIPS 46-1, "Data Encryption Standard," U.S. Department of Commerce/National Bureau ofStandards, 1988 January 22.

FIPS 101FIPS 101, "Guideline for Lifecycle Validation, Verification, and Testing of ComputerSoftware," U.S. Department of Commerce/National Bureau of Standards, 1983 June 6.
FIPS 132FIPS 132, "Guideline for Software Verification and Validation Plans," U.S. Department ofCommerce/National Bureau of Standards, 1987 November 19.
FIPS 140 FS 1027FIPS 140 FS 1027, "General Security Requirements for Equipment Using the DataEncryption Standard," General Services Administration, April 14, 1982.
FIPS 140-1FIPS 140-1, "Security Requirements for Cryptographic Modules," U.S. Department ofCommerce/National Institute of Standards and Technology, 1990 May 2.
Guide to the AssessmentofReliability
"89/97714-Guide to the Assessment of Reliability of Systems Containing Software," BritishStandards Institution, 12 September 1989.
Guideline for theCategorization ofSoftware
"Guideline for the Categorization of Software in Ontario Hydro's Nuclear Facilities withRespect to Nuclear Safety," Revision 0, Nuclear Safety Department, June 1991.
Guidelines for AssuringTestability (DRAFT)
"(DRAFT) Guidelines for Assuring Testability," The Institution of Electrical Engineers,May 1987.
IEC 880IEC 880, "Software for Computers in the Safety Systems of Nuclear Power Stations,"International Electrotechnical Commission, 1986.
IEC 880 Supplement
45A/WG-A3(Secretary)42, "(DRAFT) Software for Computers Important to Safety forNuclear Power Plants as a Supplement to IEC Publication 880," InternationalElectrotechnical Commission Technical Committee: Nuclear Instrumentation,Sub-Committee 45A: Reactor Instrumentation, Working Group A3: Data Transmission andProcessing Systems, May 1991.
IEC65A(Secretariat)122IEC/TC65A WG9, "89/33006 DC - (DRAFT) Software for Computers in the Application ofIndustrial Safety-Related Systems," British Standards Institution, 6 December 1989.
IEC65A(Secretariat)123IEC/TC65A WG10, "89/33005 DC - (DRAFT) Functional Safety ofElectrical/Electronic/Programmable Electronic Safety-Related Systems: Generic Aspects,Part 1: General Requirements," British Standards Institution, January 1992.
IFIP WG 10.4IFIP WG 10.4, "Dependability: Basic Concepts and Terminology," IFIP Working Group onDependable Computing and Fault Tolerance, October 1990.
Interim Defence Std00-55
Interim Defence Standard 00-55, "The Procurement of Safety Critical Software in DefenceEquipment," Parts 1 and 2, Ministry of Defence, 5 April 1991.
Interim Defence Std00-56
Interim Defence Standard 00-56, "Hazard Analysis and Safety Classification of theComputer and Programmable Electronic System Elements of Defence Equipment," Ministryof Defence, 5 April 1991.
ISO 9000 ISO 9000, "International Standards for Quality Management," May 1990.
ITSEC 1.1989ITSEC 1.1989, "Criteria for the Evaluation of Trustworthiness of Information Technology(IT) Systems," GISA - German Information Security Agency, 1989.
ITSEC 1.2 1991ITSEC 1.2 1990, "Information Technology Security Evaluation Criteria (ITSEC),"Provisional Harmonised Criteria, June 28, 1990.
Management PlanDocumentation Standard
"Management Plan Documentation Standard and Data Item Descriptions (DID)," NASA,2/28/89.
MIL-HDBK-347MIL-HDBK-347, "Mission-Critical Computer Resources Software Support," Department ofDefense, 22 May 90.
MIL-STD-882BMIL-STD-882B, "System Safety Program Requirements," Department of Defense, 30March 1984.
NCSC-TG-005NCSC-TG-005, "Trusted Network Interpretation of the Trusted Computer SystemEvaluation Criteria," National Computer Security Center, 31 July 1987.
NCSC-TG-021NCSC-TG-021, "Trusted Database Management System Interpretation of the TrustedComputer System Evaluation Criteria," National Computer Security Center, April 1991.

NPR-STD-6300NPR-STD-6300, "Management of Scientific, Engineering and Plant Software," Office ofNew Production Reactors, U.S. Department of Energy, March 1991.
NSA Spec. 86-16NSA Spec. 86-16, "Security Guidelines for COMSEC Software Development," NationalSecurity Agency, 10 July 1986.
NSWC TR 89-33NSWC TR 89-33, "Software Systems Safety Design Guidelines and Recommendations,"Naval Surface Warfare Center, March 1989.
Ontario Hydro Standard"Standard for Software Engineering of Safety Critical Software," Rev. 0, Ontario Hydro,December 1990.
P1228 (DRAFT)P1228, "(DRAFT) Standard for Software Safety Plans," The Institute of Electrical andElectronics Engineers, Inc, July 19, 1991.
Product SpecificationDocumentation
"Product Specification Documentation Standard and Data Item Descriptions (DID)," NASA,2/28/89.
Programmable ElectronicSystems
"Programmable Electronic Systems in Safety Related Applications," Parts 1 and 2, Healthand Safety Executive, 1987.
RTCA/DO-178ARTCA/DO-178A, "Software Considerations in Airborne Systems and EquipmentCertification," Radio Technical Commission for Aeronautics, March, 1985.
SafeIT"SafeIT," Volumes 1 and 2, Interdepartmental Committee on Software Engineering, June1990.
UL 1998UL 1998, "The Proposed First Edition of the Standard for Safety-Related Software,"Underwater Laboratories, August 17, 1990.
Mentioned
Table B-2. Error Analysis Techniques Cited in Reviewed DocumentsTECH DESCRIPTION STANDARDS STATUSacceptancesampling statistical technique for quality control ANSI/ASQC A3-1987 Recommended during instal-
lation, defined in glossary
acceptance testingformal testing to determine if system satisfiesacceptance criteria and to enable customerto decide whether or not to accept the product
FIPS 101;
Guidelines for AssuringTestability (DRAFT);ISO 9000 (9004);FDA/HIMA (DRAFT);ANSI/IEEE Std 1012-1986
Recommended, defined inglossary
Defined brieflyMentionedMentionedDefined briefly
algorithmanalysis
check that algorithms are correct, appropriate,stable, and meet all accuracy, timing, andsizingrequirements
ANSI/ANS-10.4-1987;ANSI/IEEE Std 1012-1986
Defined in appendix onlyOptional, in appendix
analysis ofvariance
statistical technique for comparing the meansoftwo or more groups to see if the means differsignificantly as a result of somefactor/treatment
ISO 9000 (9004) Mentioned
boundary valueanalysis(boundarychecking)
input test data is selected to create on oraroundrange limits of input or output variable rangesinorder to remove errors occurring at parameterlimits or boundaries
Guide to the Assessment ofReliability;
FDA/HIMA (DRAFT);NSWC TR 89-33;IEC65A(Secretariat)122;SafeIT
Defined brieflyRecommended (p. 17);RequiredRecommended and definedRecommended
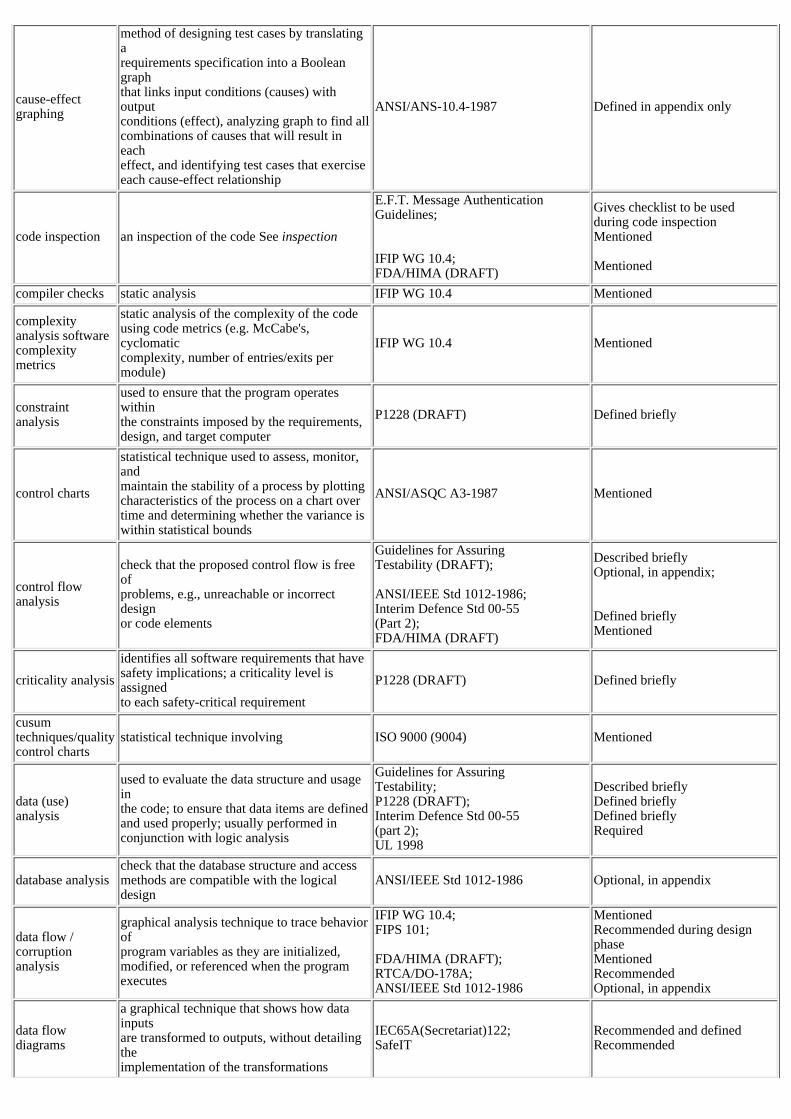
cause-effectgraphing
method of designing test cases by translatingarequirements specification into a Booleangraphthat links input conditions (causes) withoutputconditions (effect), analyzing graph to find allcombinations of causes that will result ineacheffect, and identifying test cases that exerciseeach cause-effect relationship
ANSI/ANS-10.4-1987 Defined in appendix only
code inspection an inspection of the code See inspection
E.F.T. Message AuthenticationGuidelines;
IFIP WG 10.4;FDA/HIMA (DRAFT)
Gives checklist to be usedduring code inspectionMentioned
Mentioned
compiler checks static analysis IFIP WG 10.4 Mentioned
complexityanalysis softwarecomplexitymetrics
static analysis of the complexity of the codeusing code metrics (e.g. McCabe's,cyclomaticcomplexity, number of entries/exits permodule)
IFIP WG 10.4 Mentioned
constraintanalysis
used to ensure that the program operateswithinthe constraints imposed by the requirements,design, and target computer
P1228 (DRAFT) Defined briefly
control charts
statistical technique used to assess, monitor,andmaintain the stability of a process by plottingcharacteristics of the process on a chart overtime and determining whether the variance iswithin statistical bounds
ANSI/ASQC A3-1987 Mentioned
control flowanalysis
check that the proposed control flow is freeofproblems, e.g., unreachable or incorrectdesignor code elements
Guidelines for AssuringTestability (DRAFT);
ANSI/IEEE Std 1012-1986;Interim Defence Std 00-55(Part 2);FDA/HIMA (DRAFT)
Described brieflyOptional, in appendix;
Defined brieflyMentioned
criticality analysis
identifies all software requirements that havesafety implications; a criticality level isassignedto each safety-critical requirement
P1228 (DRAFT) Defined briefly
cusumtechniques/qualitycontrol charts
statistical technique involving ISO 9000 (9004) Mentioned
data (use)analysis
used to evaluate the data structure and usageinthe code; to ensure that data items are definedand used properly; usually performed inconjunction with logic analysis
Guidelines for AssuringTestability;P1228 (DRAFT);Interim Defence Std 00-55(part 2);UL 1998
Described brieflyDefined brieflyDefined brieflyRequired
database analysischeck that the database structure and accessmethods are compatible with the logicaldesign
ANSI/IEEE Std 1012-1986 Optional, in appendix
data flow /corruptionanalysis
graphical analysis technique to trace behaviorofprogram variables as they are initialized,modified, or referenced when the programexecutes
IFIP WG 10.4;FIPS 101;
FDA/HIMA (DRAFT);RTCA/DO-178A;ANSI/IEEE Std 1012-1986
MentionedRecommended during designphaseMentionedRecommendedOptional, in appendix
data flowdiagrams
a graphical technique that shows how datainputsare transformed to outputs, without detailingtheimplementation of the transformations
IEC65A(Secretariat)122;SafeIT
Recommended and definedRecommended

desk checking(code reading)
the reviewing of code by an individual tocheckfor defects and to verify the correctness of theprogram logic flow, data flow, and output
ANSI/IEEE-ANS-7-4.3.2-19XX, Draft 1;Guidelines for AssuringTestability;AFISC SSH 1-1
Defn. briefly in appendix onlyMentionedDefined
error guessing
use of experience and intuition combinedwithknowledge and curiosity to add uncategorizedtest cases to the designed test case set in ordertodetect and remove common programmingerrors
IEC65A(Secretariat)122;SafeIT
Recommended and definedRecommended
error seeding
used to ascertain whether a test case set isadequate by inserting known error types intotheprogram, and examining the ability of theprogram to detect the seeded errors
IEC65A(Secretariat)122;SafeIT
Recommended and definedRecommended
execution flowand timinganalysis
See data flow analysis and sizing and timinganalysis RTCA/DO-178A Recommended
factorial analysis statistical technique ISO 9000 (9004) Mentioned
Fagan inspectionsa formal audit on quality assurancedocumentsaimed at finding errors and omissions
IEC65A(Secretariat)122;SafeIT
Recommended and definedRecommended
failure datamodels
statistical / probabilistic technique forassessingsoftware reliability
Guide to the Assessment ofReliability Defined
finite stateautomata/finite statemachines/state transitiondiagram
modelling technique that defines the controlstructure of a system and is used to performstatic analysis of system behavior
IFIP WG 10.4;FIPS 140-1;IEC65A(Secretariat)122;SafeIT
MentionedRequiredRecommended and definedRecommended
(formal)mathematicalmodelling
modelling technique, static analysis
ANSI/ASQC A3-1987;IEC65A(Secretariat)122;SafeIT;Management PlanDocumentation Standard
MentionedRecommended and definedRecommendedMentioned
formal analysis(formal proofs,formalverification,formal testing)
use of rigorous mathematical techniques toanalyze the algorithms of a solution fornumerical properties, efficiency, and/orcorrectness
formal verification - proving mathematicallythata program satisfies its specifications
ITSEC 1991ANSI/ANS-10.4-1987;ANSI/IEEE-ANS-7-4.3.2-19XX, Draft 2;Guide to the Assessment ofReliability;Guidelines for AssuringTestability (DRAFT);SafeIT;P1228 (DRAFT);IEC65A(Secretariat)122;NCSC-TG-005
Defined, required p. 98Defined in appendix onlyDefn. briefly in appendix onlyDefined brieflyDefinedRecommendedMentionedRecommended and definedDefined
frequencydistribution
a graph that displays the frequency of avariableas a bar, whose area represents the frequency
ANSI/ASQC A3-1987 Mentioned
functional testing
application of test data derived from thespecified functional requirements withoutregardto the final program structure
ANSI/IEEE-ANS-7-4.3.2-19XX, Draft 2;IFIP WG 10.4;Guide to the Assessment ofReliability;FIPS 101;ANSI/ANS-10.4-1987;IEC65A(Secretariat)122;SafeIT;NCSC-TG-005;FDA/HIMA (DRAFT)
Defined in appendix onlyMentionedDefined brieflyDefined in glossaryDefined in appendix onlyRecommended and definedRecommendedMentioned, definedMentioned

global roundoffanalysis ofalgebraicprocesses(algorithmicanalysis)
determines how rounding errors propagate inanumerical method for permissible sets ofinputdata; one type of algorithm analysis
ANSI/ANS-10.4-1987 Defined, in appendixonly
inspection
software requirements, design, code, or otherproducts are examined by a person or groupother than the author to detect faults,violationsof standards, and other problems
IFIP WG 10.4;Guide to the Assessment ofReliability;FIPS 101;
ANSI/ANS-10.4-1987;ANSI/ASQC A3-1987;FDA/HIMA (DRAFT)
MentionedDefined brieflyDefined in glossary,recommended for design phaseDefined in appendix onlyDefined brieflyDefined in glossary
integrated criticalpath analysis (N/A) MIL-STD-882B Mentioned
integration testing
orderly progression of testing in whichsoftwareelements, hardware elements, or both, arecombined and tested until all intermodulecommunication links have been integrated
FIPS 101;FDA/HIMA (DRAFT)
Defined in glossaryMentioned
interface analysis(testing)
checking that intermodule communicationlinksare performed correctly; ensurescompatibility ofprogram modules with each other and withexternal hardware and software
IEEE Std 1012-1986;FIPS 101;
MIL-HDBK-347;NSWC TR 89-33;P1228 (DRAFT)
RequiredRecommended during designphase, defined in glossaryRequiredRequiredDefined briefly
logic analysis
evaluates the sequence of operationsrepresentedby the coded program and detectsprogrammingerrors that might create a hazard
P1228 (DRAFT) Defined briefly
Markov models
graphical technique used to model a systemwithregard to its failure states in order to evaluatethe reliability, safety or availability of thesystem
Interim Defence Standard 00-56IEC65A(Secretariat)122
MentionedRecommended and defined
measure ofcentral tendencyand dispersion
statistical technique for quality control ANSI/ASQC A3-1987 Mentioned
module functionalanalysis
verifies the relevance of software modules tosafety-critical requirements, assuring thateachrequirement is adequately covered and that acriticality level is assigned to each module
P1228 (DRAFT) Defined briefly
mutation analysis(testing)
process of producing a large set of programversions, each derived from a trivialalteration tothe original program, and evaluating theabilityof the program test data to detect eachalteration
IFIP WG 10.4;ANSI/ANS-10.4-1987
MentionedIn appendix only
NO-GO (path)testing type of failure testing UL 1998;
NSWC TR 89-33RequiredRequired
peer review
software requirements, design, code, or otherproducts are examined by persons whoserank,responsibility, experience, and skill arecomparable to that of the author
ANSI/ANS-10.4-1987 Defined in appendix only
performancemodelling
modelling of the system to ensure that itmeetsthroughput and response requirements forspecific functions, perhaps combined withconstraints on use of total system resources
IEC65A(Secretariat)122;SafeIT
Recommended and definedRecommended
periodic testing security testing NCSC-TG-005 Mentioned, defined
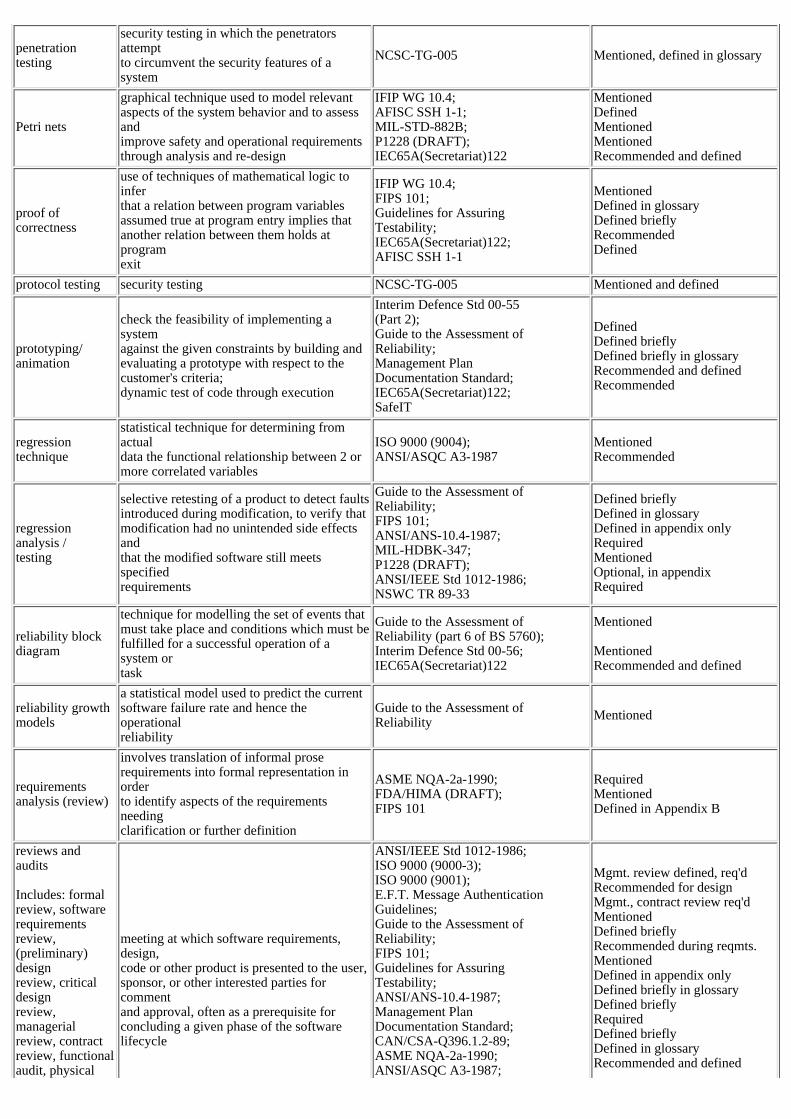
penetrationtesting
security testing in which the penetratorsattemptto circumvent the security features of asystem
NCSC-TG-005 Mentioned, defined in glossary
Petri nets
graphical technique used to model relevantaspects of the system behavior and to assessandimprove safety and operational requirementsthrough analysis and re-design
IFIP WG 10.4;AFISC SSH 1-1;MIL-STD-882B;P1228 (DRAFT);IEC65A(Secretariat)122
MentionedDefinedMentionedMentionedRecommended and defined
proof ofcorrectness
use of techniques of mathematical logic toinferthat a relation between program variablesassumed true at program entry implies thatanother relation between them holds atprogramexit
IFIP WG 10.4;FIPS 101;Guidelines for AssuringTestability;IEC65A(Secretariat)122;AFISC SSH 1-1
MentionedDefined in glossaryDefined brieflyRecommendedDefined
protocol testing security testing NCSC-TG-005 Mentioned and defined
prototyping/animation
check the feasibility of implementing asystemagainst the given constraints by building andevaluating a prototype with respect to thecustomer's criteria;dynamic test of code through execution
Interim Defence Std 00-55(Part 2);Guide to the Assessment ofReliability;Management PlanDocumentation Standard;IEC65A(Secretariat)122;SafeIT
DefinedDefined brieflyDefined briefly in glossaryRecommended and definedRecommended
regressiontechnique
statistical technique for determining fromactualdata the functional relationship between 2 ormore correlated variables
ISO 9000 (9004);ANSI/ASQC A3-1987
MentionedRecommended
regressionanalysis /testing
selective retesting of a product to detect faultsintroduced during modification, to verify thatmodification had no unintended side effectsandthat the modified software still meetsspecifiedrequirements
Guide to the Assessment ofReliability;FIPS 101;ANSI/ANS-10.4-1987;MIL-HDBK-347;P1228 (DRAFT);ANSI/IEEE Std 1012-1986;NSWC TR 89-33
Defined brieflyDefined in glossaryDefined in appendix onlyRequiredMentionedOptional, in appendixRequired
reliability blockdiagram
technique for modelling the set of events thatmust take place and conditions which must befulfilled for a successful operation of asystem ortask
Guide to the Assessment ofReliability (part 6 of BS 5760);Interim Defence Std 00-56;IEC65A(Secretariat)122
Mentioned
MentionedRecommended and defined
reliability growthmodels
a statistical model used to predict the currentsoftware failure rate and hence theoperationalreliability
Guide to the Assessment ofReliability Mentioned
requirementsanalysis (review)
involves translation of informal proserequirements into formal representation inorderto identify aspects of the requirementsneedingclarification or further definition
ASME NQA-2a-1990;FDA/HIMA (DRAFT);FIPS 101
RequiredMentionedDefined in Appendix B
reviews andaudits
Includes: formalreview, softwarerequirementsreview,(preliminary)designreview, criticaldesignreview,managerialreview, contractreview, functionalaudit, physical
meeting at which software requirements,design,code or other product is presented to the user,sponsor, or other interested parties forcommentand approval, often as a prerequisite forconcluding a given phase of the softwarelifecycle
ANSI/IEEE Std 1012-1986;ISO 9000 (9000-3);ISO 9000 (9001);E.F.T. Message AuthenticationGuidelines;Guide to the Assessment ofReliability;FIPS 101;Guidelines for AssuringTestability;ANSI/ANS-10.4-1987;Management PlanDocumentation Standard;CAN/CSA-Q396.1.2-89;ASME NQA-2a-1990;ANSI/ASQC A3-1987;
Mgmt. review defined, req'dRecommended for designMgmt., contract review req'dMentionedDefined brieflyRecommended during reqmts.MentionedDefined in appendix onlyDefined briefly in glossaryDefined brieflyRequiredDefined brieflyDefined in glossaryRecommended and defined

audit,in-process audit,SCMplan review, etc.
FDA/HIMA (DRAFT);IEC65A(Secretariat)122;SafeIT;ANSI/IEEE 730.1-1989
RecommendedDescribed briefly, givesdocumentation requirements
safetyevaluation/riskanalysis
statistical analysis ISO 9000 (9004) Mentioned
simulation(simulationanalysis)
simulate critical aspects of the softwareenvironment to analyze logical orperformancecharacteristics that would not be practical toanalyze manuallyuse of an executable model to examine thebehavior of the software
ANSI/IEEE Std 1012-1986;FIPS 101;Guidelines for AssuringTestability (DRAFT);IEC65A(Secretariat)122;SafeIT;ANSI/IEEE Std 1012-1986
Optional, in glossaryDefined in glossaryDescribed brieflyRecommended and definedRecommendedOptional, in appendix
sizing and timinganalysis
determine whether the program will satisfyprocessor size and performance requirementsallocated to software
P1228 (DRAFT);ANSI/IEEE Std 1012-1986
DefinedOptional, in appendix
specificationanalysis
evaluates each safety-critical requirementwithrespect to quality attributes (e.g., testability)
P1228 (DRAFT);FDA/HIMA (DRAFT)
sneak circuitanalysis
graphical technique which relies on therecognition of basic topological patterns inthesoftware structure, used to detect anunexpectedpath or logic flow which, under certainconditions, initiates an undesired function orinhibits a desired function
AFISC SSH 1-1;MIL-STD-882B;IEC65A(Secretariat)122;SafeIT;P1228 (DRAFT)
DefinedMentionedRecommended and definedRecommendedMentioned
standards audit check to ensure that applicable standards areused properly FIPS 101 Recommended during code
phase, defined in glossary
statisticalsamplinginspection
method for evaluating a product by testingrandom samples ISO 9000 (9004) Mentioned
statistical testingtype of testing where the test patterns areselected according to a defined probabilitydistribution on the input domain
IFIP WG 10.4 Mentioned, defined in glossary
stress testingtesting a product using exceptionally highworkload in order to show that it would standnormal workloads easily
NCSC-TG-005;IEC65A(Secretariat)122;FDA/HIMA (DRAFT)
Mentioned, definedDefinedMentioned
structural analysis(testing)
uses automated tool that seeks and recordserrorsin the structural makeup of a program
ANSI/IEEE-ANS-7-4.3.2-19XX, Draft 2IFIP WG 10.4;Guide to the Assessment ofReliability;AFISC SSH 1-1
Defined in appendix onlyMentioned, defined in glossaryDefined brieflyDefined
structurediagrams
a notation complementing data flowdiagrams,shows hierarchy of system as a tree; showsrelationships between program units withoutincluding information about the order ofexecution of these units
IEC65A(Secretariat)122;SafeIT
Recommended and definedRecommended
symbolicevaluation(execution)
program execution is simulated usingsymbolsrather than actual numerical values for inputdata, and output is expressed as logical ormathematical expressions involving thesesymbols
IFIP WG 10.4;Guide to the Assessment ofReliability;FIPS 101;
ANSI/ANS-10.4-1987
Mentioned, defined in glossaryDefined brieflyRecommended for code,defined in glossaryDefined in appendix only
system testtesting an integrated hardware and softwaresystem to verify that the system meets itspecified requirements
FIPS 101;FDA/HIMA (DRAFT)
Defined in glossaryMentioned
test certification
check that reported test results are the actualfindings of the tests. Test-related tools,media,and documentation should be certified toensuremaintainability and repeatability of tests
ANSI/IEEE Std 1012-1986 Optional, in appendix

tests ofsignificance statistical technique ISO 9000 (9004);
ANSI/ASQC A3-1987MentionedMentioned
tracing(traceabilityanalysis)
cross-checking between software products(e.g.design and code) of different lifecycle phasesforconsistency, correctness, and completeness
ANSI/ANS-10.4-1987;ANSI/IEEE Std 1012-1986
Defined in appendix onlyRequired
unit testing(module testing)
testing of a module for typographic,syntactic,and logical errors, for correct implementationofits design, and satisfaction of its requirements
FIPS 101FDA/HIMA (DRAFT)
Defined in glossary, in appd.Mentioned
walkthroughs
evaluation technique in which a designer orprogrammer leads one or more othermembers ofthe development team through a segment ofdesign or code, while the other members askquestions and comment about technique,style,and identify possible errors, violations ofstandards, and other problems
evaluation technique in which developmentpersonnel lead others through a structuredexamination of a product
ANSI/IEEE-ANS-7-4.3.2-19XX, Draft 2IFIP WG 10.4;Guide to the Assessment ofReliability;FIPS 101;ANSI/ANS-10.4-1987;FDA/HIMA (DRAFT);RTCA/DO-178A;MIL-STD-882B;IEC65A(Secretariat)122;SafeIT;AFISC SSH 1-1;ANSI/IEEE Std 1012-1986
Defn. briefly in appendix onlyMentionedDefined brieflyDefined in glossaryDefined in appendix onlyMentionedRecommendedMentionedRecommended and definedRecommendedDefinedOptional, in appendix