Embed Size (px)
Citation preview
U.S. DEPARTMENT OF COMMERCE BUREAU OF ECONOMIC ANALYSIS
Budget Estimates Fiscal Year 2019
As Presented Congress
2/12/2018

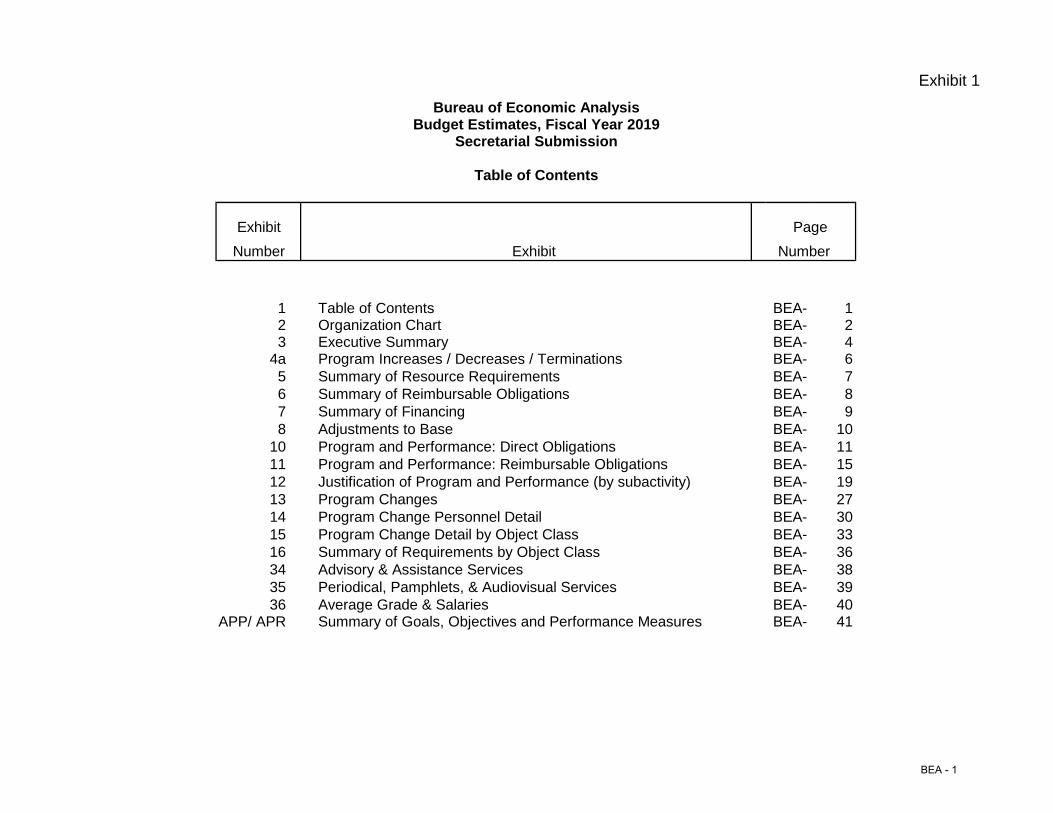
Exhibit 1
Bureau of Economic AnalysisBudget Estimates, Fiscal Year 2019
Secretarial Submission
Table of Contents
Exhibit PageNumber Exhibit Number
1 Table of Contents BEA- 12 Organization Chart BEA- 23 Executive Summary BEA- 4
4a Program Increases / Decreases / Terminations BEA- 65 Summary of Resource Requirements BEA- 76 Summary of Reimbursable Obligations BEA- 87 Summary of Financing BEA- 98 Adjustments to Base BEA- 10
10 Program and Performance: Direct Obligations BEA- 1111 Program and Performance: Reimbursable Obligations BEA- 1512 Justification of Program and Performance (by subactivity) BEA- 1913 Program Changes BEA- 2714 Program Change Personnel Detail BEA- 3015 Program Change Detail by Object Class BEA- 3316 Summary of Requirements by Object Class BEA- 3634 Advisory & Assistance Services BEA- 3835 Periodical, Pamphlets, & Audiovisual Services BEA- 3936 Average Grade & Salaries BEA- 40
APP/ APR Summary of Goals, Objectives and Performance Measures BEA- 41
BEA - 1
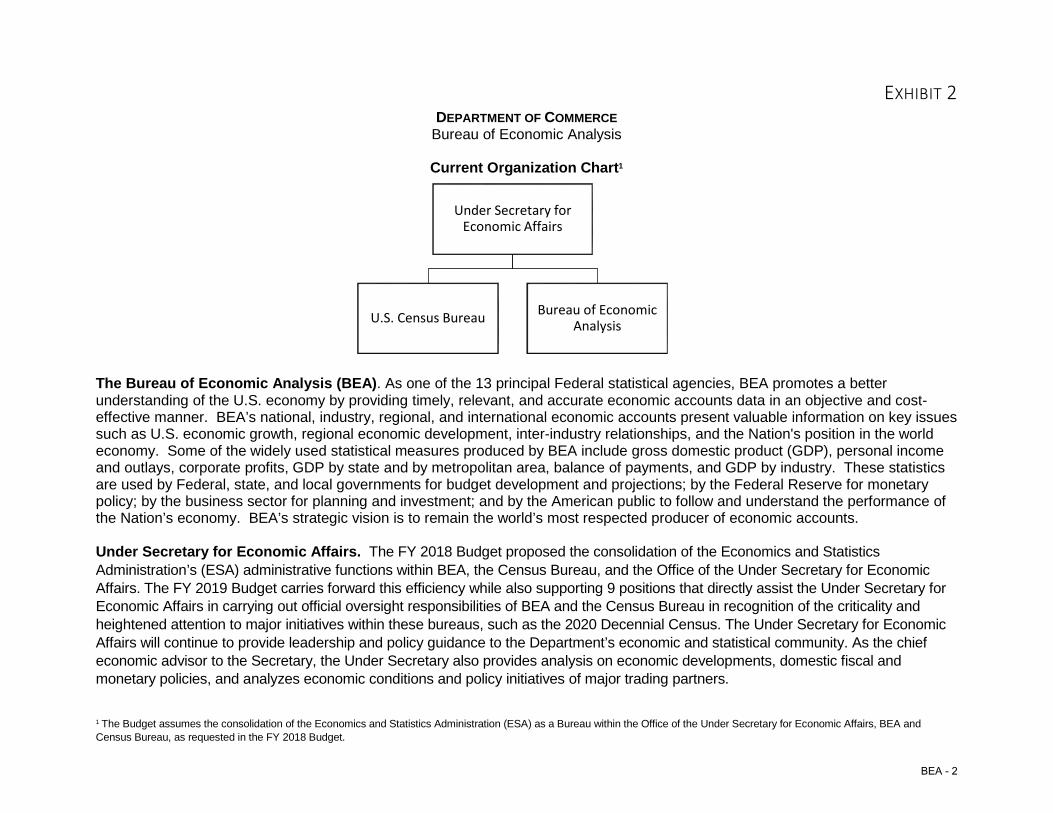
EXHIBIT 2 DEPARTMENT OF COMMERCE
Bureau of Economic Analysis
Current Organization Chart1
The Bureau of Economic Analysis (BEA). As one of the 13 principal Federal statistical agencies, BEA promotes a better understanding of the U.S. economy by providing timely, relevant, and accurate economic accounts data in an objective and cost-effective manner. BEA’s national, industry, regional, and international economic accounts present valuable information on key issues such as U.S. economic growth, regional economic development, inter-industry relationships, and the Nation's position in the world economy. Some of the widely used statistical measures produced by BEA include gross domestic product (GDP), personal income and outlays, corporate profits, GDP by state and by metropolitan area, balance of payments, and GDP by industry. These statistics are used by Federal, state, and local governments for budget development and projections; by the Federal Reserve for monetary policy; by the business sector for planning and investment; and by the American public to follow and understand the performance of the Nation’s economy. BEA’s strategic vision is to remain the world’s most respected producer of economic accounts. Under Secretary for Economic Affairs. The FY 2018 Budget proposed the consolidation of the Economics and Statistics Administration’s (ESA) administrative functions within BEA, the Census Bureau, and the Office of the Under Secretary for Economic Affairs. The FY 2019 Budget carries forward this efficiency while also supporting 9 positions that directly assist the Under Secretary for Economic Affairs in carrying out official oversight responsibilities of BEA and the Census Bureau in recognition of the criticality and heightened attention to major initiatives within these bureaus, such as the 2020 Decennial Census. The Under Secretary for Economic Affairs will continue to provide leadership and policy guidance to the Department’s economic and statistical community. As the chief economic advisor to the Secretary, the Under Secretary also provides analysis on economic developments, domestic fiscal and monetary policies, and analyzes economic conditions and policy initiatives of major trading partners. 1 The Budget assumes the consolidation of the Economics and Statistics Administration (ESA) as a Bureau within the Office of the Under Secretary for Economic Affairs, BEA and Census Bureau, as requested in the FY 2018 Budget.
Under Secretary for Economic Affairs
U.S. Census Bureau Bureau of Economic Analysis
BEA - 2
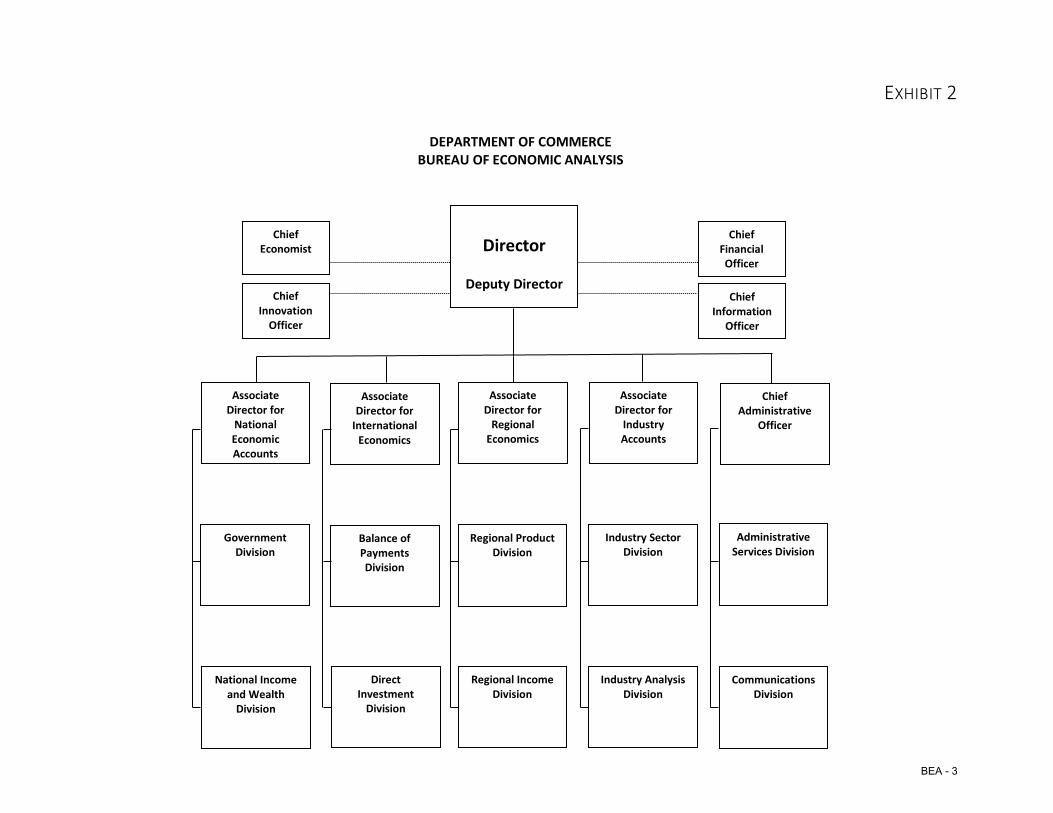
EXHIBIT 2
Director
Deputy Director
Chief Administrative
Officer
Chief Innovation
Officer
Chief Economist
Associate Director for
Industry Accounts
Associate Director for
Regional Economics
Associate Director for
International Economics
Associate Director for
National Economic Accounts
National Income and Wealth
Division
Government Division
Balance of Payments Division
Direct Investment
Division
Regional Product Division
Regional Income Division
Industry Sector Division
Industry Analysis Division
Communications Division
Administrative Services Division
DEPARTMENT OF COMMERCE BUREAU OF ECONOMIC ANALYSIS
Chief Information
Officer
Chief Financial Officer
BEA - 3
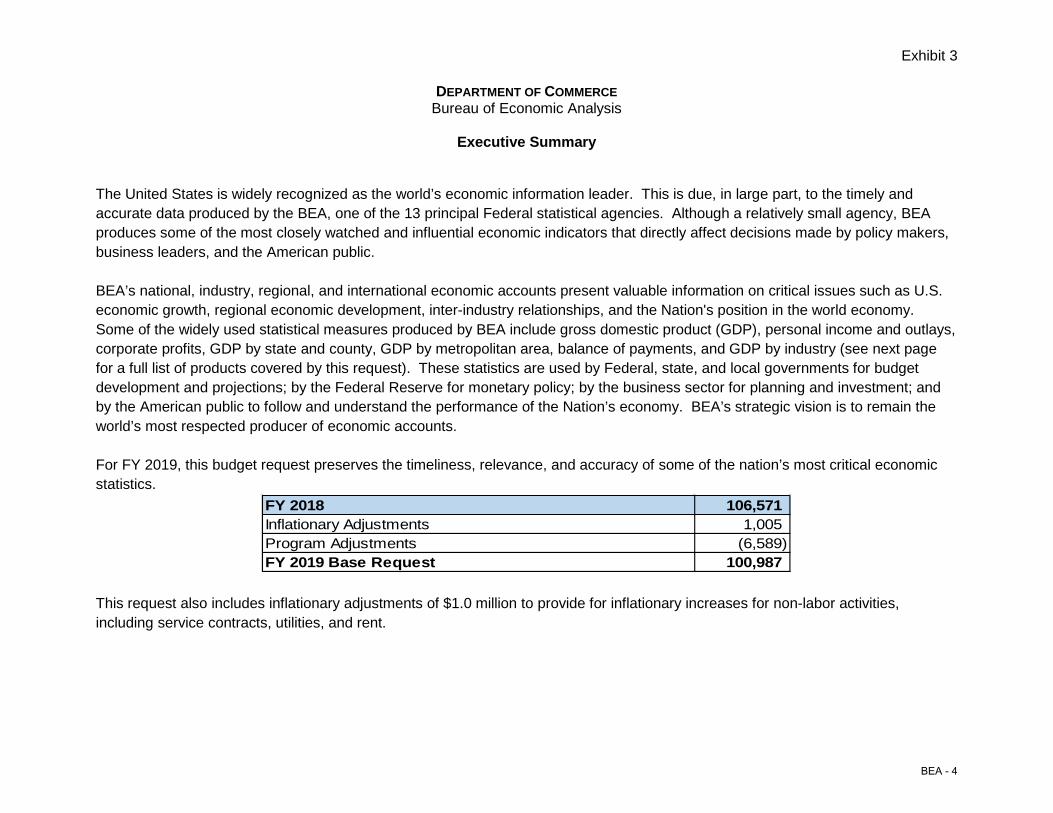
Exhibit 3
DEPARTMENT OF COMMERCE Bureau of Economic Analysis
Executive Summary
The United States is widely recognized as the world’s economic information leader. This is due, in large part, to the timely and accurate data produced by the BEA, one of the 13 principal Federal statistical agencies. Although a relatively small agency, BEA produces some of the most closely watched and influential economic indicators that directly affect decisions made by policy makers, business leaders, and the American public. BEA’s national, industry, regional, and international economic accounts present valuable information on critical issues such as U.S. economic growth, regional economic development, inter-industry relationships, and the Nation's position in the world economy. Some of the widely used statistical measures produced by BEA include gross domestic product (GDP), personal income and outlays, corporate profits, GDP by state and county, GDP by metropolitan area, balance of payments, and GDP by industry (see next page for a full list of products covered by this request). These statistics are used by Federal, state, and local governments for budget development and projections; by the Federal Reserve for monetary policy; by the business sector for planning and investment; and by the American public to follow and understand the performance of the Nation’s economy. BEA’s strategic vision is to remain the world’s most respected producer of economic accounts. For FY 2019, this budget request preserves the timeliness, relevance, and accuracy of some of the nation’s most critical economic statistics.
FY 2018 106,571 Inflationary Adjustments 1,005 Program Adjustments (6,589) FY 2019 Base Request 100,987
This request also includes inflationary adjustments of $1.0 million to provide for inflationary increases for non-labor activities, including service contracts, utilities, and rent.
BEA - 4
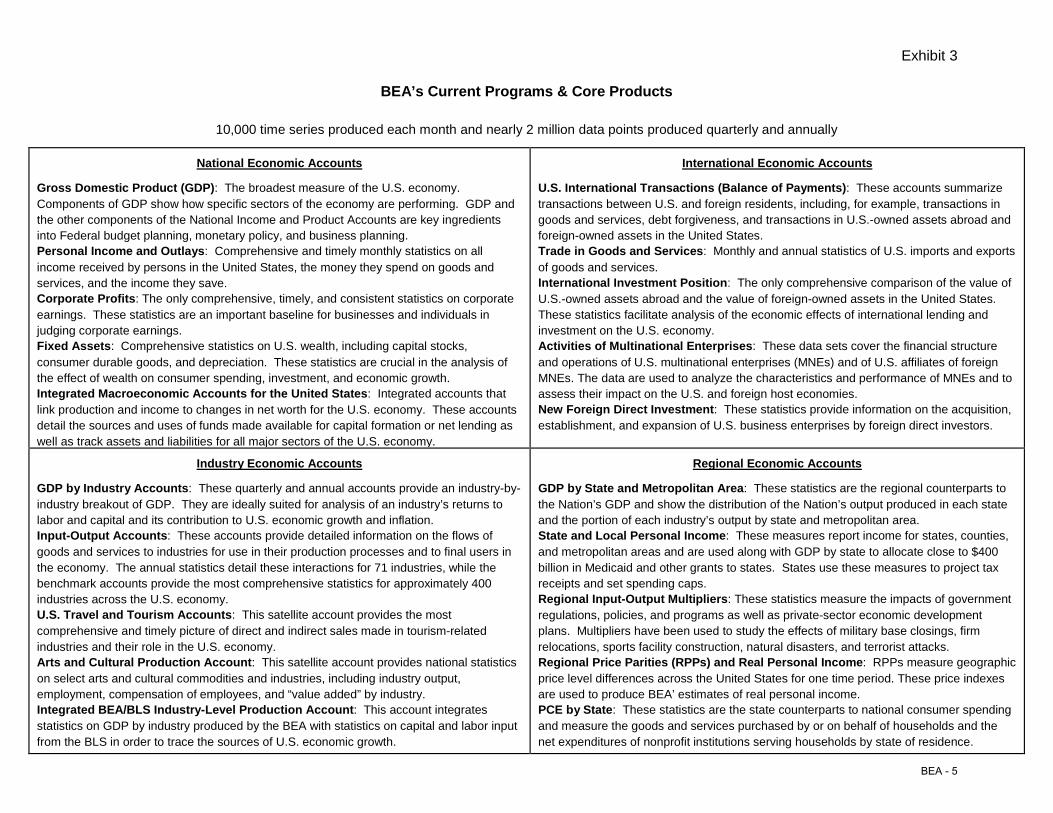
Exhibit 3
BEA’s Current Programs & Core Products
10,000 time series produced each month and nearly 2 million data points produced quarterly and annually
National Economic Accounts
Gross Domestic Product (GDP): The broadest measure of the U.S. economy. Components of GDP show how specific sectors of the economy are performing. GDP and the other components of the National Income and Product Accounts are key ingredients into Federal budget planning, monetary policy, and business planning. Personal Income and Outlays: Comprehensive and timely monthly statistics on all income received by persons in the United States, the money they spend on goods and services, and the income they save. Corporate Profits: The only comprehensive, timely, and consistent statistics on corporate earnings. These statistics are an important baseline for businesses and individuals in judging corporate earnings. Fixed Assets: Comprehensive statistics on U.S. wealth, including capital stocks, consumer durable goods, and depreciation. These statistics are crucial in the analysis of the effect of wealth on consumer spending, investment, and economic growth. Integrated Macroeconomic Accounts for the United States: Integrated accounts that link production and income to changes in net worth for the U.S. economy. These accounts detail the sources and uses of funds made available for capital formation or net lending as well as track assets and liabilities for all major sectors of the U.S. economy.
International Economic Accounts
U.S. International Transactions (Balance of Payments): These accounts summarize transactions between U.S. and foreign residents, including, for example, transactions in goods and services, debt forgiveness, and transactions in U.S.-owned assets abroad and foreign-owned assets in the United States. Trade in Goods and Services: Monthly and annual statistics of U.S. imports and exports of goods and services. International Investment Position: The only comprehensive comparison of the value of U.S.-owned assets abroad and the value of foreign-owned assets in the United States. These statistics facilitate analysis of the economic effects of international lending and investment on the U.S. economy. Activities of Multinational Enterprises: These data sets cover the financial structure and operations of U.S. multinational enterprises (MNEs) and of U.S. affiliates of foreign MNEs. The data are used to analyze the characteristics and performance of MNEs and to assess their impact on the U.S. and foreign host economies. New Foreign Direct Investment: These statistics provide information on the acquisition, establishment, and expansion of U.S. business enterprises by foreign direct investors.
Industry Economic Accounts
GDP by Industry Accounts: These quarterly and annual accounts provide an industry-by-industry breakout of GDP. They are ideally suited for analysis of an industry’s returns to labor and capital and its contribution to U.S. economic growth and inflation. Input-Output Accounts: These accounts provide detailed information on the flows of goods and services to industries for use in their production processes and to final users in the economy. The annual statistics detail these interactions for 71 industries, while the benchmark accounts provide the most comprehensive statistics for approximately 400 industries across the U.S. economy. U.S. Travel and Tourism Accounts: This satellite account provides the most comprehensive and timely picture of direct and indirect sales made in tourism-related industries and their role in the U.S. economy. Arts and Cultural Production Account: This satellite account provides national statistics on select arts and cultural commodities and industries, including industry output, employment, compensation of employees, and “value added” by industry. Integrated BEA/BLS Industry-Level Production Account: This account integrates statistics on GDP by industry produced by the BEA with statistics on capital and labor input from the BLS in order to trace the sources of U.S. economic growth.
Regional Economic Accounts
GDP by State and Metropolitan Area: These statistics are the regional counterparts to the Nation’s GDP and show the distribution of the Nation’s output produced in each state and the portion of each industry’s output by state and metropolitan area. State and Local Personal Income: These measures report income for states, counties, and metropolitan areas and are used along with GDP by state to allocate close to $400 billion in Medicaid and other grants to states. States use these measures to project tax receipts and set spending caps. Regional Input-Output Multipliers: These statistics measure the impacts of government regulations, policies, and programs as well as private-sector economic development plans. Multipliers have been used to study the effects of military base closings, firm relocations, sports facility construction, natural disasters, and terrorist attacks. Regional Price Parities (RPPs) and Real Personal Income: RPPs measure geographic price level differences across the United States for one time period. These price indexes are used to produce BEA’ estimates of real personal income. PCE by State: These statistics are the state counterparts to national consumer spending and measure the goods and services purchased by or on behalf of households and the net expenditures of nonprofit institutions serving households by state of residence.
BEA - 5
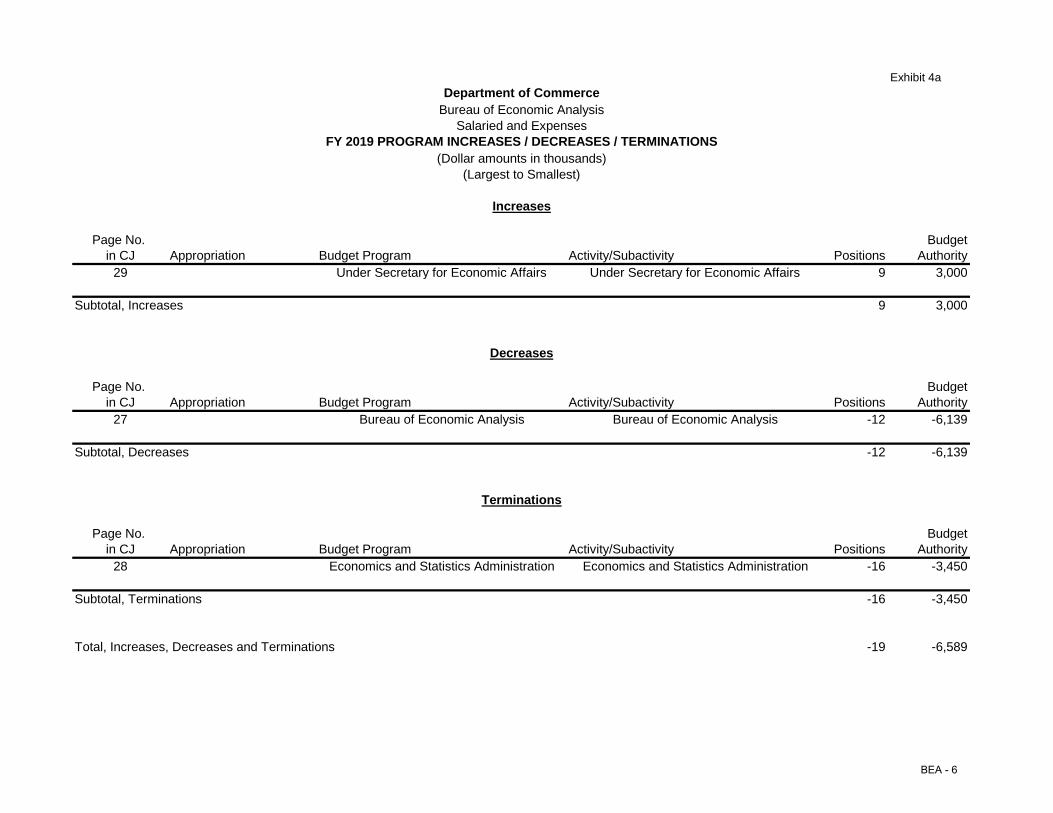
Exhibit 4a
Page No. Budgetin CJ Appropriation Budget Program Activity/Subactivity Positions Authority
29 Under Secretary for Economic Affairs Under Secretary for Economic Affairs 9 3,000
Subtotal, Increases 9 3,000
Page No. Budgetin CJ Appropriation Budget Program Activity/Subactivity Positions Authority
27 Bureau of Economic Analysis Bureau of Economic Analysis -12 -6,139
Subtotal, Decreases -12 -6,139
Page No. Budgetin CJ Appropriation Budget Program Activity/Subactivity Positions Authority
28 Economics and Statistics Administration Economics and Statistics Administration -16 -3,450
Subtotal, Terminations -16 -3,450
Total, Increases, Decreases and Terminations -19 -6,589
Terminations
Increases
Decreases
Department of CommerceBureau of Economic Analysis
FY 2019 PROGRAM INCREASES / DECREASES / TERMINATIONS(Dollar amounts in thousands)
(Largest to Smallest)
Salaried and Expenses
BEA - 6
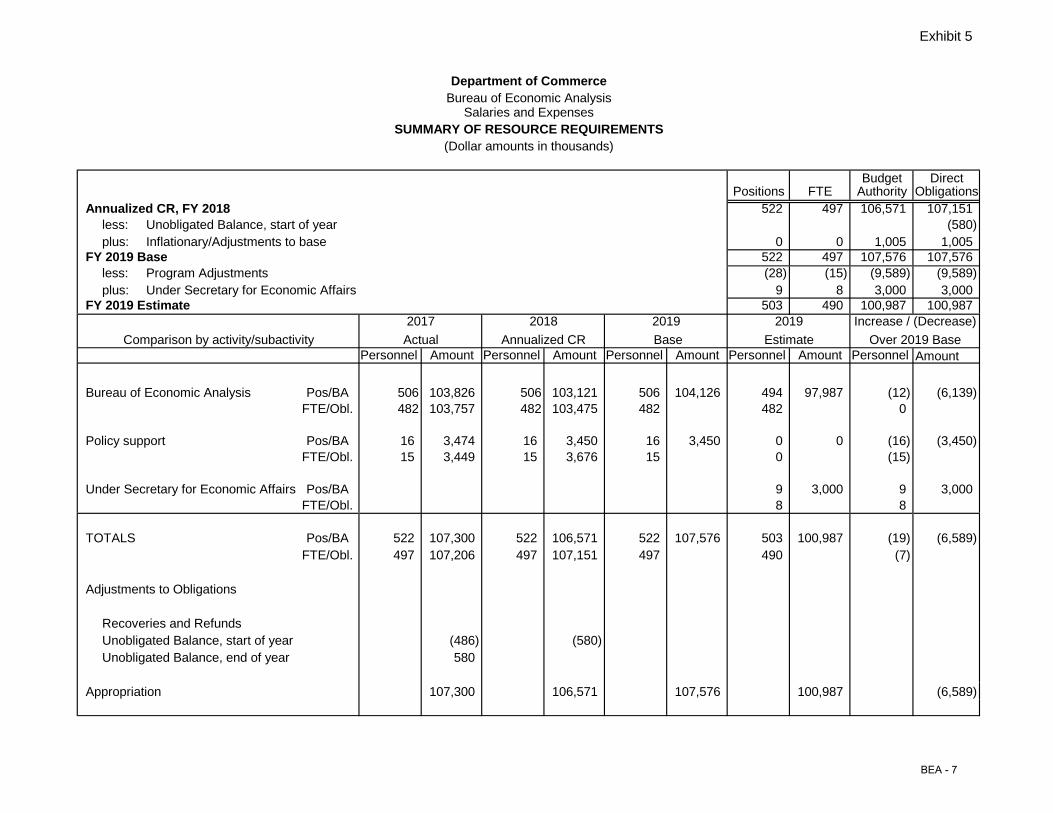
Exhibit 5
Department of CommerceBureau of Economic Analysis
Salaries and ExpensesSUMMARY OF RESOURCE REQUIREMENTS
(Dollar amounts in thousands)
Budget DirectPositions FTE Authority Obligations
Annualized CR, FY 2018 522 497 106,571 107,151less: Unobligated Balance, start of year (580)plus: Inflationary/Adjustments to base 0 0 1,005 1,005
FY 2019 Base 522 497 107,576 107,576less: Program Adjustments (28) (15) (9,589) (9,589)plus: Under Secretary for Economic Affairs 9 8 3,000 3,000
FY 2019 Estimate 503 490 100,987 100,9872017 2019 2019 Increase / (Decrease)
Comparison by activity/subactivityPersonnel Amount Personnel Amount Personnel Amount Personnel Amount Personnel Amount
Bureau of Economic Analysis Pos/BA 506 103,826 506 103,121 506 104,126 494 97,987 (12) (6,139)FTE/Obl. 482 103,757 482 103,475 482 482 0
Policy support Pos/BA 16 3,474 16 3,450 16 3,450 0 0 (16) (3,450)FTE/Obl. 15 3,449 15 3,676 15 0 (15)
Under Secretary for Economic Affairs Pos/BA 9 3,000 9 3,000FTE/Obl. 8 8
TOTALS Pos/BA 522 107,300 522 106,571 522 107,576 503 100,987 (19) (6,589)FTE/Obl. 497 107,206 497 107,151 497 490 (7)
Adjustments to Obligations
Recoveries and RefundsUnobligated Balance, start of year (486) (580) Unobligated Balance, end of year 580
Appropriation 107,300 106,571 107,576 100,987 (6,589)
2018Actual BaseAnnualized CR Estimate Over 2019 Base
BEA - 7
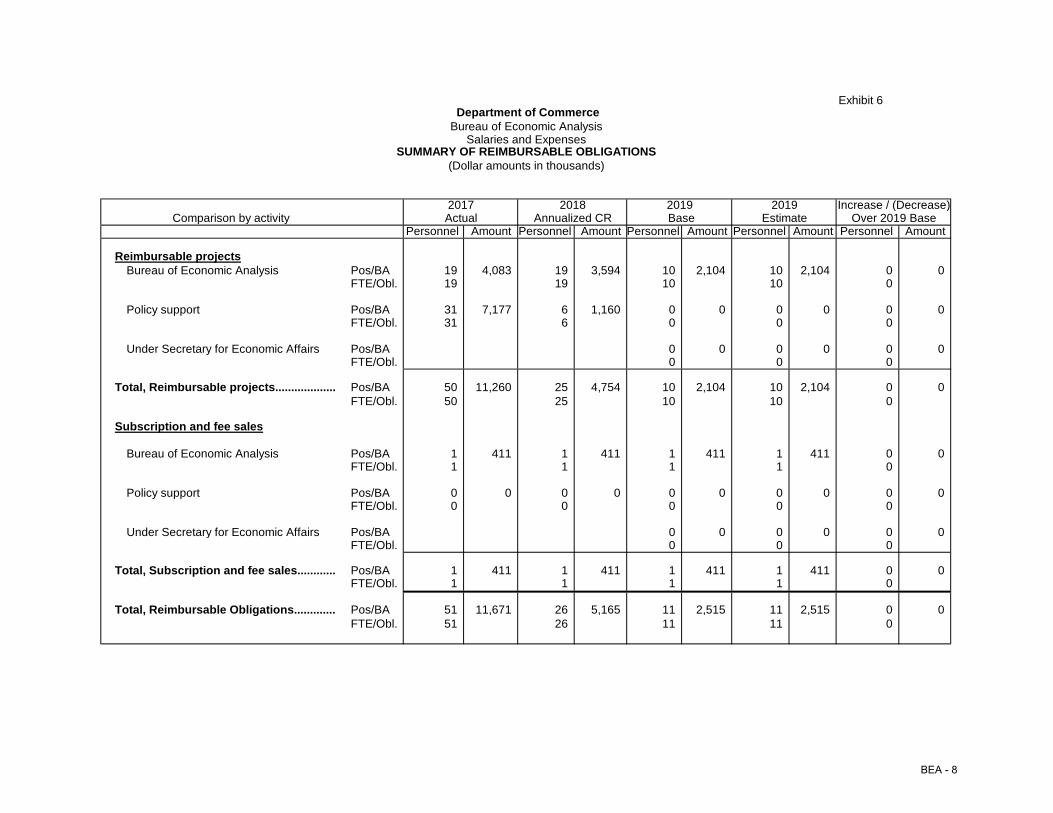
Exhibit 6
Bureau of Economic AnalysisSalaries and Expenses
SUMMARY OF REIMBURSABLE OBLIGATIONS(Dollar amounts in thousands)
2017 2019 2019 Increase / (Decrease)Comparison by activity Over 2019 Base
Personnel Amount Personnel Amount Personnel Amount Personnel Amount Personnel Amount
Reimbursable projectsBureau of Economic Analysis Pos/BA 19 4,083 19 3,594 10 2,104 10 2,104 0 0
FTE/Obl. 19 19 10 10 0
Policy support Pos/BA 31 7,177 6 1,160 0 0 0 0 0 0FTE/Obl. 31 6 0 0 0
Under Secretary for Economic Affairs Pos/BA 0 0 0 0 0 0FTE/Obl. 0 0 0
Total, Reimbursable projects................... Pos/BA 50 11,260 25 4,754 10 2,104 10 2,104 0 0FTE/Obl. 50 25 10 10 0
Subscription and fee sales
Bureau of Economic Analysis Pos/BA 1 411 1 411 1 411 1 411 0 0FTE/Obl. 1 1 1 1 0
Policy support Pos/BA 0 0 0 0 0 0 0 0 0 0FTE/Obl. 0 0 0 0 0
Under Secretary for Economic Affairs Pos/BA 0 0 0 0 0 0FTE/Obl. 0 0 0
Total, Subscription and fee sales............ Pos/BA 1 411 1 411 1 411 1 411 0 0FTE/Obl. 1 1 1 1 0
Total, Reimbursable Obligations............. Pos/BA 51 11,671 26 5,165 11 2,515 11 2,515 0 0FTE/Obl. 51 26 11 11 0
Actual BaseAnnualized CR Estimate
Department of Commerce
2018
BEA - 8
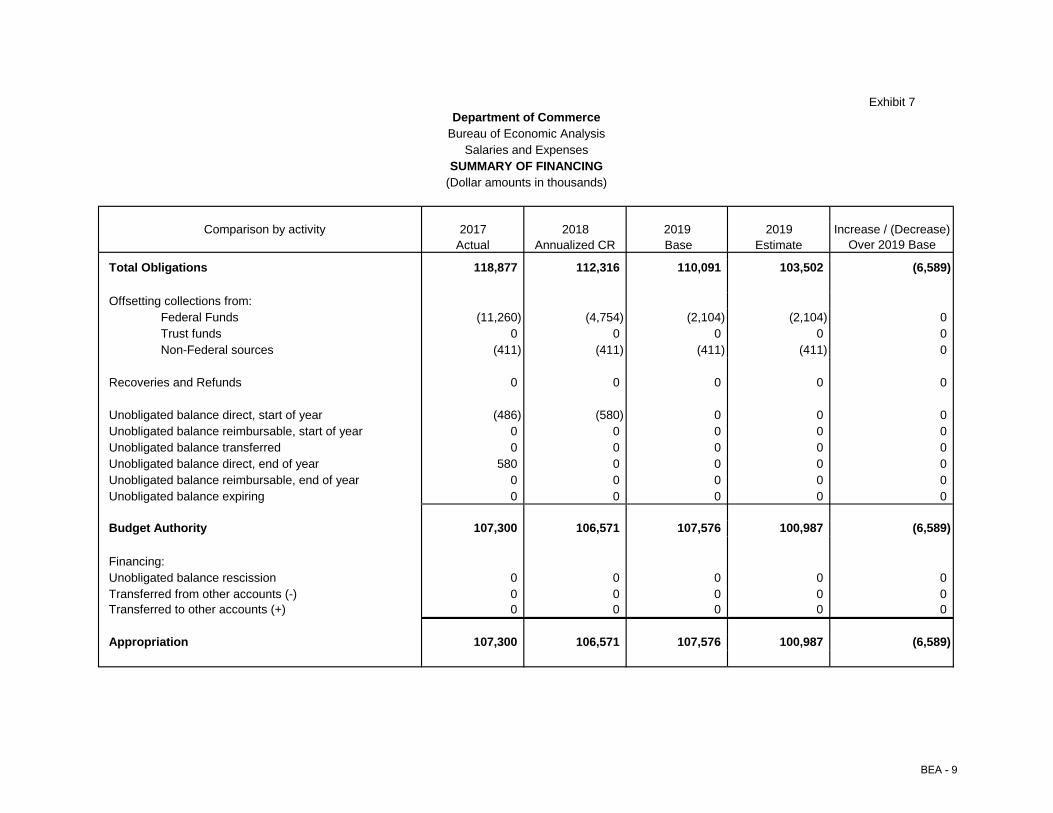
Exhibit 7
Salaries and ExpensesSUMMARY OF FINANCING
(Dollar amounts in thousands)
Comparison by activity 2017 2018 2019 2019 Increase / (Decrease)Actual Annualized CR Base Estimate Over 2019 Base
Total Obligations 118,877 112,316 110,091 103,502 (6,589)
Offsetting collections from:Federal Funds (11,260) (4,754) (2,104) (2,104) 0Trust funds 0 0 0 0 0Non-Federal sources (411) (411) (411) (411) 0
Recoveries and Refunds 0 0 0 0 0
Unobligated balance direct, start of year (486) (580) 0 0 0Unobligated balance reimbursable, start of year 0 0 0 0 0Unobligated balance transferred 0 0 0 0 0Unobligated balance direct, end of year 580 0 0 0 0Unobligated balance reimbursable, end of year 0 0 0 0 0Unobligated balance expiring 0 0 0 0 0
Budget Authority 107,300 106,571 107,576 100,987 (6,589)
Financing:Unobligated balance rescission 0 0 0 0 0Transferred from other accounts (-) 0 0 0 0 0Transferred to other accounts (+) 0 0 0 0 0
Appropriation 107,300 106,571 107,576 100,987 (6,589)
Department of CommerceBureau of Economic Analysis
BEA - 9
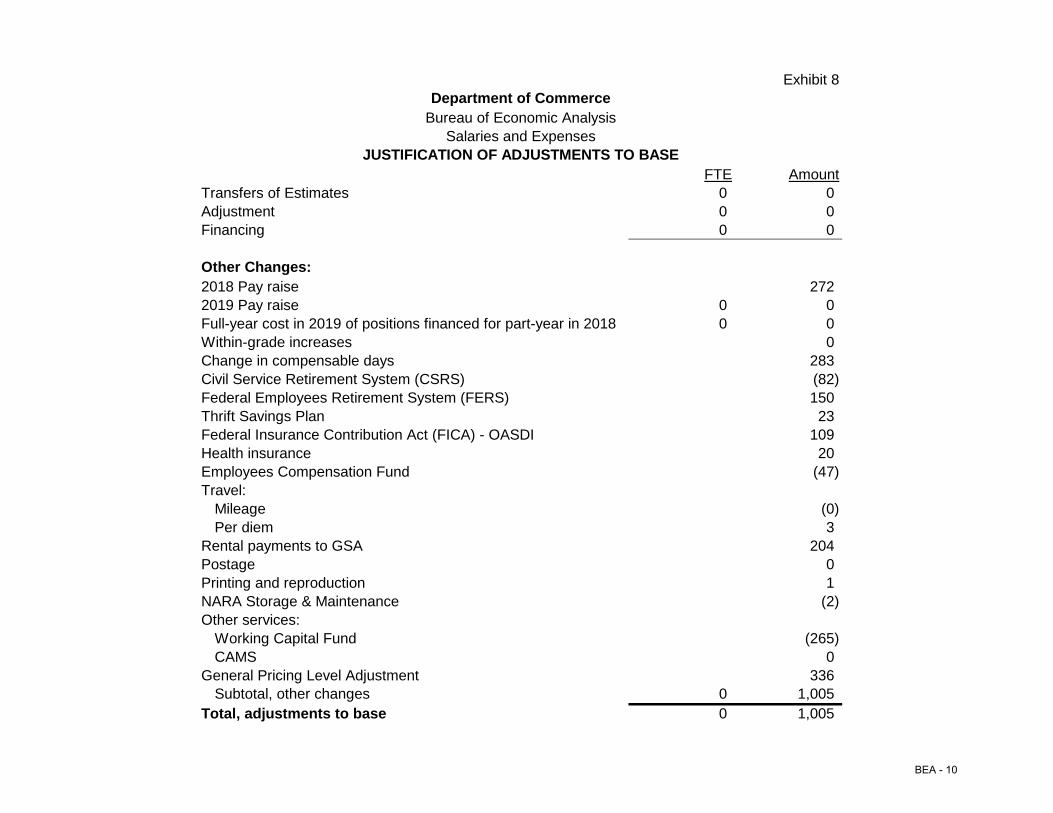
Exhibit 8
FTE AmountTransfers of Estimates 0 0Adjustment 0 0Financing 0 0
Other Changes:2018 Pay raise 2722019 Pay raise 0 0Full-year cost in 2019 of positions financed for part-year in 2018 0 0Within-grade increases 0Change in compensable days 283Civil Service Retirement System (CSRS) (82)Federal Employees Retirement System (FERS) 150Thrift Savings Plan 23Federal Insurance Contribution Act (FICA) - OASDI 109Health insurance 20Employees Compensation Fund (47)Travel:
Mileage (0)Per diem 3
Rental payments to GSA 204Postage 0Printing and reproduction 1NARA Storage & Maintenance (2)Other services:
Working Capital Fund (265)CAMS 0
General Pricing Level Adjustment 336Subtotal, other changes 0 1,005
Total, adjustments to base 0 1,005
Department of CommerceBureau of Economic Analysis
Salaries and ExpensesJUSTIFICATION OF ADJUSTMENTS TO BASE
BEA - 10
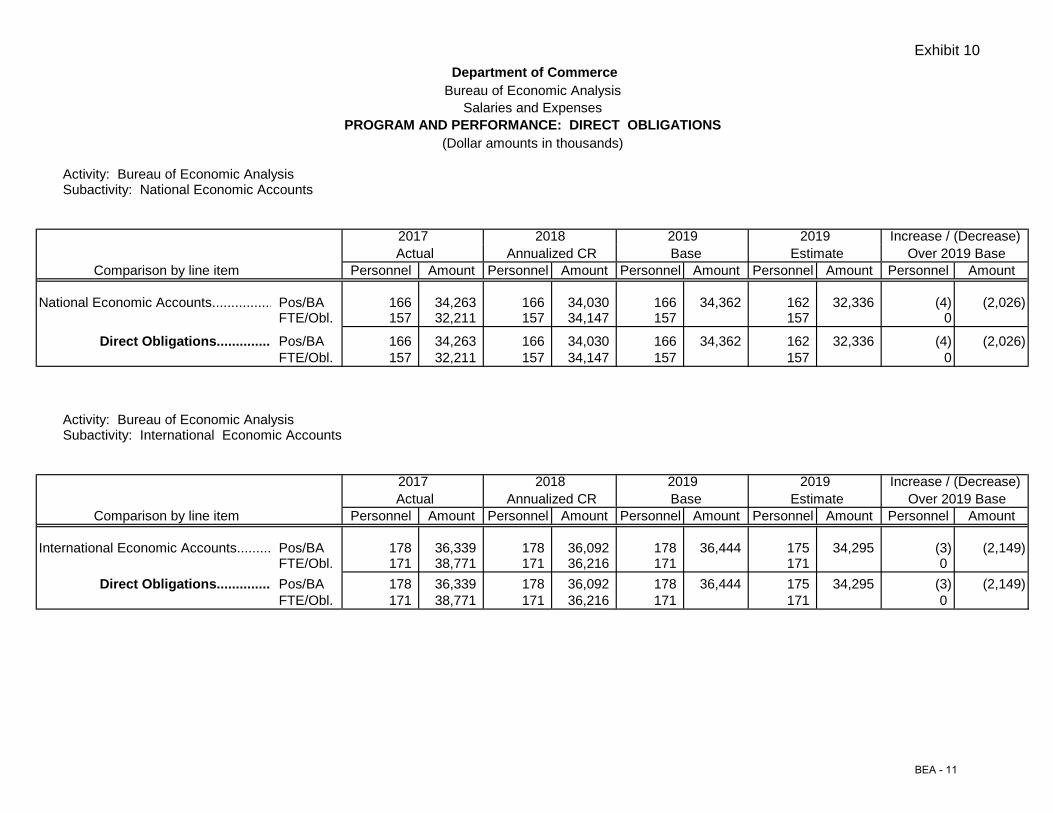
Exhibit 10
Salaries and ExpensesPROGRAM AND PERFORMANCE: DIRECT OBLIGATIONS
(Dollar amounts in thousands)
Activity: Bureau of Economic AnalysisSubactivity: National Economic Accounts
2017 Increase / (Decrease) Actual Estimate
Comparison by line item Personnel Amount Personnel Amount Personnel Amount Personnel Amount Personnel Amount
National Economic Accounts................ Pos/BA 166 34,263 166 34,030 166 34,362 162 32,336 (4) (2,026) FTE/Obl. 157 32,211 157 34,147 157 157 0
Direct Obligations.............. Pos/BA 166 34,263 166 34,030 166 34,362 162 32,336 (4) (2,026) FTE/Obl. 157 32,211 157 34,147 157 157 0
Activity: Bureau of Economic AnalysisSubactivity: International Economic Accounts
2017 Increase / (Decrease) Actual Estimate Over 2019 Base
Comparison by line item Personnel Amount Personnel Amount Personnel Amount Personnel Amount Personnel Amount
International Economic Accounts......... Pos/BA 178 36,339 178 36,092 178 36,444 175 34,295 (3) (2,149)FTE/Obl. 171 38,771 171 36,216 171 171 0
Direct Obligations.............. Pos/BA 178 36,339 178 36,092 178 36,444 175 34,295 (3) (2,149)FTE/Obl. 171 38,771 171 36,216 171 171 0
Over 2019 Base
Base Annualized CR
2018 Base 2019
2019
Annualized CR
2018
Department of CommerceBureau of Economic Analysis
2019
2019
BEA - 11
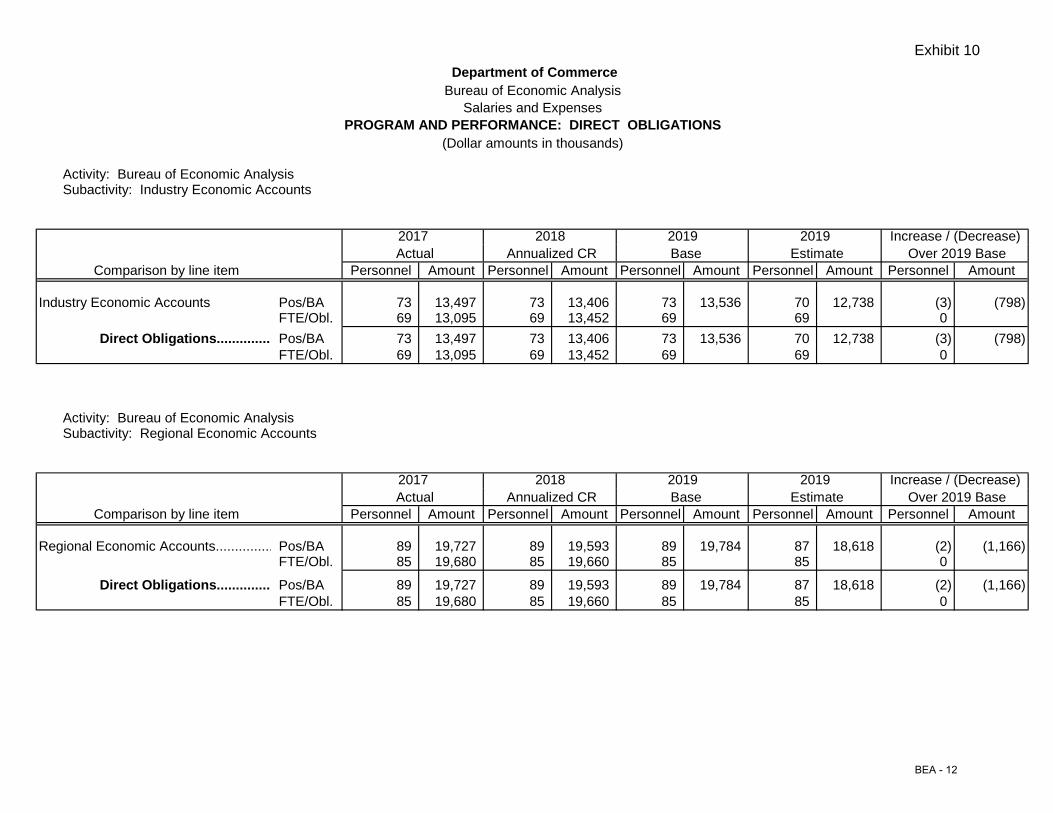
Exhibit 10
Salaries and ExpensesPROGRAM AND PERFORMANCE: DIRECT OBLIGATIONS
(Dollar amounts in thousands)
Department of CommerceBureau of Economic Analysis
Activity: Bureau of Economic AnalysisSubactivity: Industry Economic Accounts
2017 Actual Estimate Over 2019 Base
Comparison by line item Personnel Amount Personnel Amount Personnel Amount Personnel Amount Personnel Amount
Industry Economic Accounts Pos/BA 73 13,497 73 13,406 73 13,536 70 12,738 (3) (798)FTE/Obl. 69 13,095 69 13,452 69 69 0
Direct Obligations.............. Pos/BA 73 13,497 73 13,406 73 13,536 70 12,738 (3) (798)FTE/Obl. 69 13,095 69 13,452 69 69 0
Activity: Bureau of Economic AnalysisSubactivity: Regional Economic Accounts
2017 Actual Estimate Over 2019 Base
Comparison by line item Personnel Amount Personnel Amount Personnel Amount Personnel Amount Personnel Amount
Regional Economic Accounts............... Pos/BA 89 19,727 89 19,593 89 19,784 87 18,618 (2) (1,166)FTE/Obl. 85 19,680 85 19,660 85 85 0
Direct Obligations.............. Pos/BA 89 19,727 89 19,593 89 19,784 87 18,618 (2) (1,166)FTE/Obl. 85 19,680 85 19,660 85 85 0
Base 2018
Annualized CR
2018 2019 Increase / (Decrease)2019 Base Annualized CR
2019 Increase / (Decrease)2019
BEA - 12
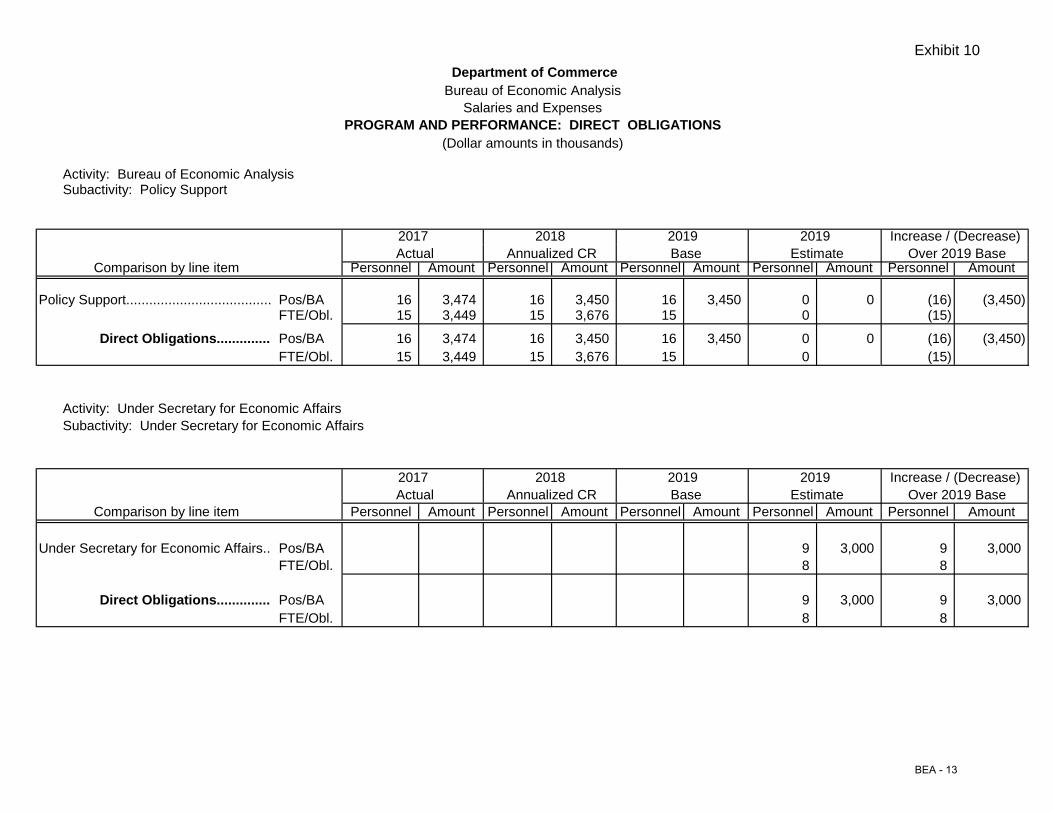
Exhibit 10
Salaries and ExpensesPROGRAM AND PERFORMANCE: DIRECT OBLIGATIONS
(Dollar amounts in thousands)
Department of CommerceBureau of Economic Analysis
Activity: Bureau of Economic AnalysisSubactivity: Policy Support
2017 Actual Estimate Over 2019 Base
Comparison by line item Personnel Amount Personnel Amount Personnel Amount Personnel Amount Personnel Amount
Policy Support...................................... Pos/BA 16 3,474 16 3,450 16 3,450 0 0 (16) (3,450)FTE/Obl. 15 3,449 15 3,676 15 0 (15)
Direct Obligations.............. Pos/BA 16 3,474 16 3,450 16 3,450 0 0 (16) (3,450)FTE/Obl. 15 3,449 15 3,676 15 0 (15)
Activity: Under Secretary for Economic AffairsSubactivity: Under Secretary for Economic Affairs
2017 Actual Estimate Over 2019 Base
Comparison by line item Personnel Amount Personnel Amount Personnel Amount Personnel Amount Personnel Amount
Under Secretary for Economic Affairs.. Pos/BA 9 3,000 9 3,000FTE/Obl. 8 8
Direct Obligations.............. Pos/BA 9 3,000 9 3,000FTE/Obl. 8 8
Annualized CR Base 2018 2019 2019 Increase / (Decrease)
Base 2018 2019
Annualized CR Increase / (Decrease)2019
BEA - 13

This page intentionally left blank.
BEA - 14
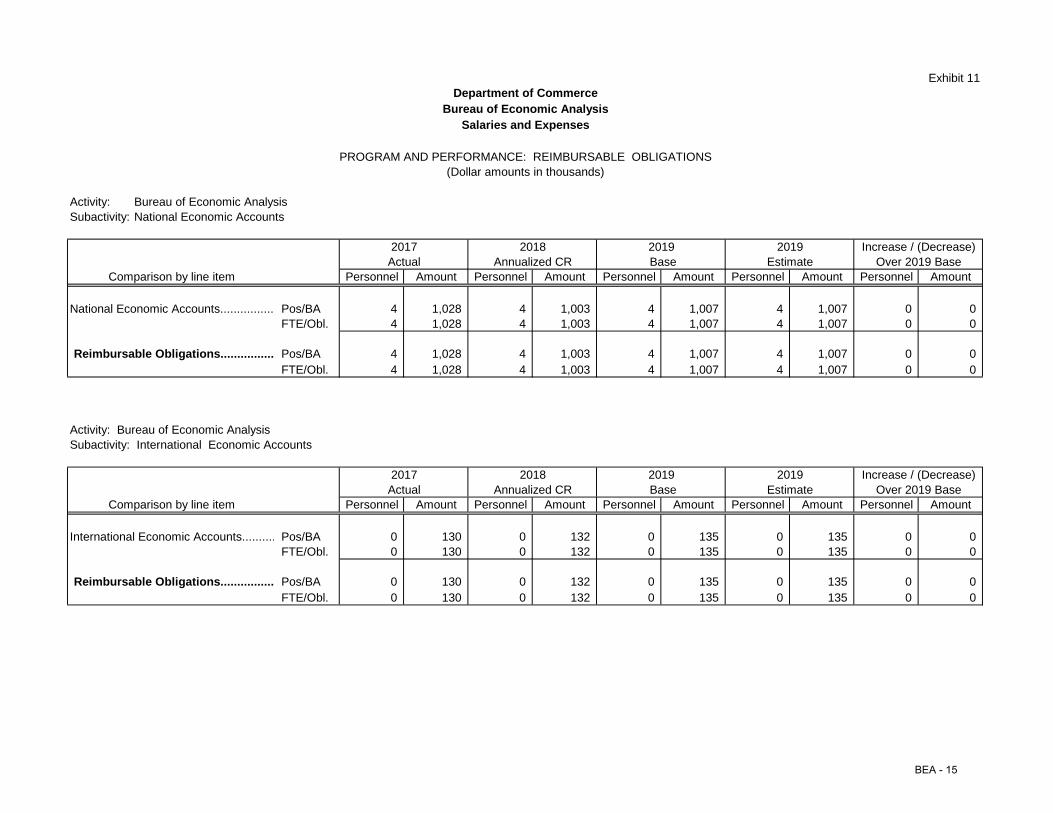
Exhibit 11
Activity: Bureau of Economic AnalysisSubactivity: National Economic Accounts
2017 Increase / (Decrease)Actual Estimate Over 2019 Base
Comparison by line item Personnel Amount Personnel Amount Personnel Amount Personnel Amount Personnel Amount
National Economic Accounts................ Pos/BA 4 1,028 4 1,003 4 1,007 4 1,007 0 0FTE/Obl. 4 1,028 4 1,003 4 1,007 4 1,007 0 0
Reimbursable Obligations................ Pos/BA 4 1,028 4 1,003 4 1,007 4 1,007 0 0FTE/Obl. 4 1,028 4 1,003 4 1,007 4 1,007 0 0
Activity: Bureau of Economic AnalysisSubactivity: International Economic Accounts
2017 Increase / (Decrease)Actual Estimate Over 2019 Base
Comparison by line item Personnel Amount Personnel Amount Personnel Amount Personnel Amount Personnel Amount
International Economic Accounts.......... Pos/BA 0 130 0 132 0 135 0 135 0 0FTE/Obl. 0 130 0 132 0 135 0 135 0 0
Reimbursable Obligations................ Pos/BA 0 130 0 132 0 135 0 135 0 0FTE/Obl. 0 130 0 132 0 135 0 135 0 0
2018 2019 2019Annualized CR Base
2018 2019 2019Annualized CR Base
Department of CommerceBureau of Economic Analysis
Salaries and Expenses
PROGRAM AND PERFORMANCE: REIMBURSABLE OBLIGATIONS(Dollar amounts in thousands)
BEA - 15
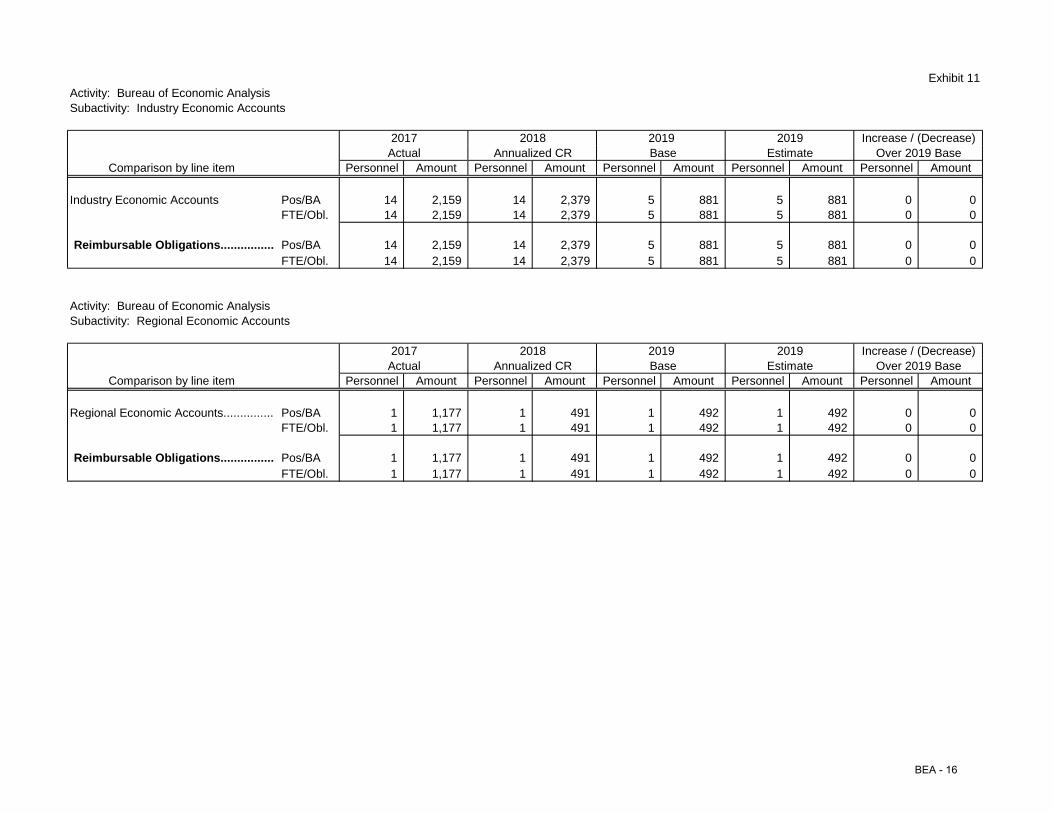
Exhibit 11Activity: Bureau of Economic AnalysisSubactivity: Industry Economic Accounts
2017Actual Estimate Over 2019 Base
Comparison by line item Personnel Amount Personnel Amount Personnel Amount Personnel Amount Personnel Amount
Industry Economic Accounts Pos/BA 14 2,159 14 2,379 5 881 5 881 0 0FTE/Obl. 14 2,159 14 2,379 5 881 5 881 0 0
Reimbursable Obligations................ Pos/BA 14 2,159 14 2,379 5 881 5 881 0 0FTE/Obl. 14 2,159 14 2,379 5 881 5 881 0 0
Activity: Bureau of Economic AnalysisSubactivity: Regional Economic Accounts
2017Actual Estimate Over 2019 Base
Comparison by line item Personnel Amount Personnel Amount Personnel Amount Personnel Amount Personnel Amount
Regional Economic Accounts............... Pos/BA 1 1,177 1 491 1 492 1 492 0 0FTE/Obl. 1 1,177 1 491 1 492 1 492 0 0
Reimbursable Obligations................ Pos/BA 1 1,177 1 491 1 492 1 492 0 0FTE/Obl. 1 1,177 1 491 1 492 1 492 0 0
2018 2019 2019 Increase / (Decrease)
2018 2019 2019 Increase / (Decrease)
Annualized CR Base
Annualized CR Base
BEA - 16
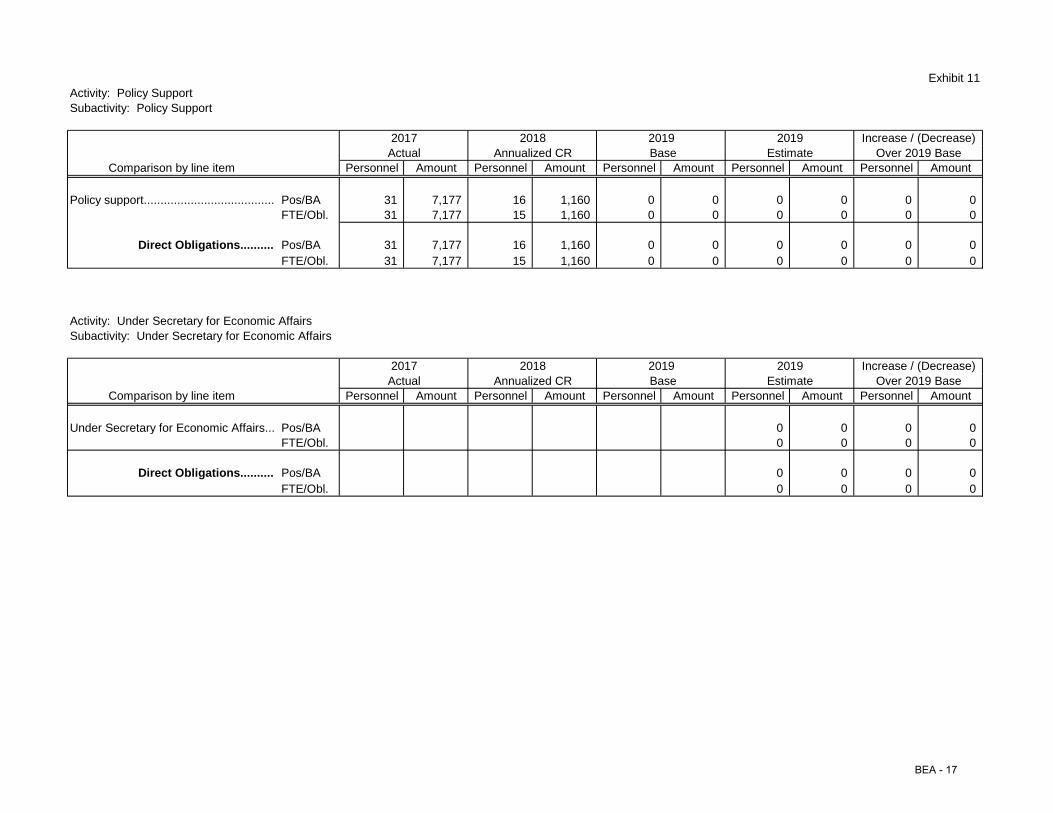
Exhibit 11Activity: Policy SupportSubactivity: Policy Support
2017Actual Estimate Over 2019 Base
Comparison by line item Personnel Amount Personnel Amount Personnel Amount Personnel Amount Personnel Amount
Policy support....................................... Pos/BA 31 7,177 16 1,160 0 0 0 0 0 0FTE/Obl. 31 7,177 15 1,160 0 0 0 0 0 0
Direct Obligations.......... Pos/BA 31 7,177 16 1,160 0 0 0 0 0 0FTE/Obl. 31 7,177 15 1,160 0 0 0 0 0 0
Activity: Under Secretary for Economic AffairsSubactivity: Under Secretary for Economic Affairs
2017Actual Estimate Over 2019 Base
Comparison by line item Personnel Amount Personnel Amount Personnel Amount Personnel Amount Personnel Amount
Under Secretary for Economic Affairs... Pos/BA 0 0 0 0FTE/Obl. 0 0 0 0
Direct Obligations.......... Pos/BA 0 0 0 0FTE/Obl. 0 0 0 0
2018 2019 2019 Increase / (Decrease)Annualized CR Base
Increase / (Decrease)Annualized CR Base
2018 2019 2019
BEA - 17

This page intentionally left blank.
BEA - 18
EXHIBIT 12
Department of Commerce Bureau of Economic Analysis
Salaries and Expenses JUSTIFICATION OF PROGRAM AND PERFORMANCE
Activity: Bureau of Economic Analysis
Subactivity: National Economic Accounts
Goal Statement
The goal of this program is to produce official measures of U.S. domestic production, consumption, and investment; exports and imports; and national and domestic income, including measures of corporate profits and savings.
Base Program
The National Income and Product Accounts, summarized by Gross Domestic Product (GDP), provide a comprehensive, up-to-date picture of U.S. domestic production, consumption, investment, and exports and imports as well as national and personal income and savings. The wealth accounts provide statistics on physical structures, capital equipment and software, and consumer durable goods held by businesses, governments, and others. The government accounts provide statistics on Federal, state, and local government transactions in a national accounts framework.
Statement of Operating Objectives
This program contributes directly to the BEA objective of producing and continuously improving timely and accurate national statistics to track the performance of the U.S. economy. The data produced by BEA include some of the Nation’s most important and closely watched economic statistics, such as GDP, the broadest measure of economic activity. GDP is used by the White House and Congress to prepare the Federal budget, by the Federal Reserve to formulate monetary policy, by Wall Street as an indicator of economic activity, and by the business community to prepare forecasts of economic performance that provide the basis for production, investment, and employment planning.
BEA - 19
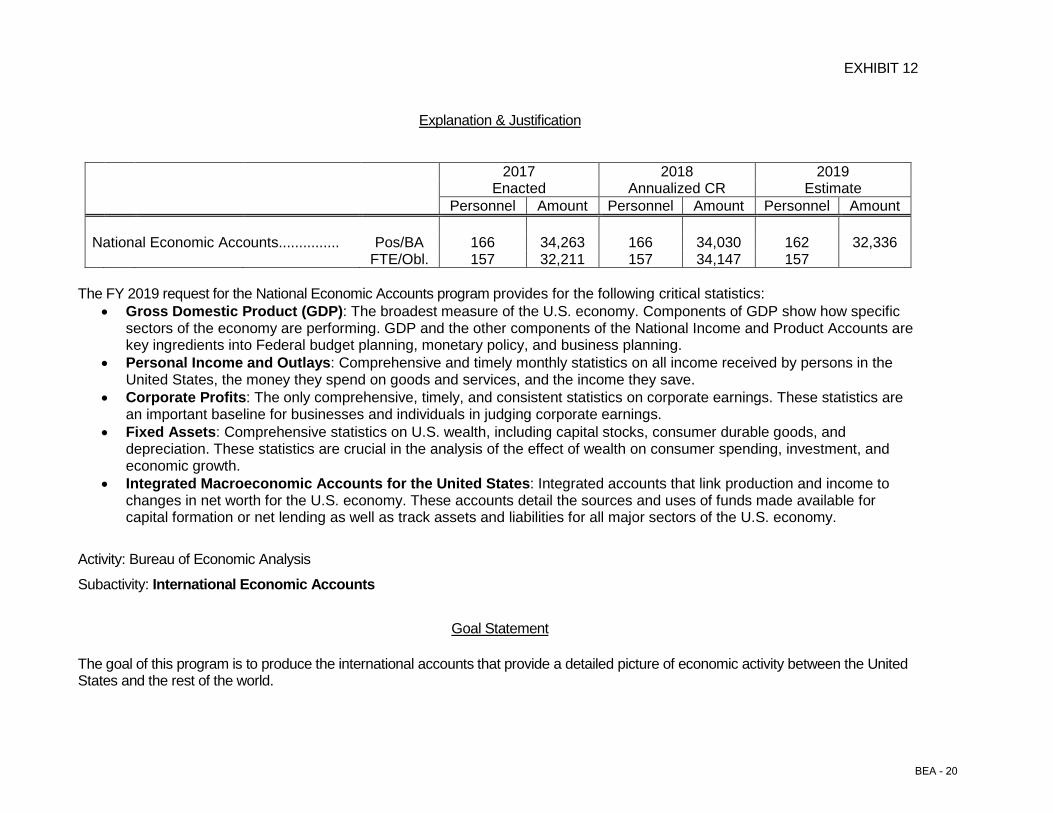
EXHIBIT 12
Explanation & Justification
2017 2018 2019 Enacted Annualized CR Estimate Personnel Amount Personnel Amount Personnel Amount National Economic Accounts............... Pos/BA 166 34,263 166 34,030 162 32,336 FTE/Obl. 157 32,211 157 34,147 157
The FY 2019 request for the National Economic Accounts program provides for the following critical statistics:
• Gross Domestic Product (GDP): The broadest measure of the U.S. economy. Components of GDP show how specific sectors of the economy are performing. GDP and the other components of the National Income and Product Accounts are key ingredients into Federal budget planning, monetary policy, and business planning.
• Personal Income and Outlays: Comprehensive and timely monthly statistics on all income received by persons in the United States, the money they spend on goods and services, and the income they save.
• Corporate Profits: The only comprehensive, timely, and consistent statistics on corporate earnings. These statistics are an important baseline for businesses and individuals in judging corporate earnings.
• Fixed Assets: Comprehensive statistics on U.S. wealth, including capital stocks, consumer durable goods, and depreciation. These statistics are crucial in the analysis of the effect of wealth on consumer spending, investment, and economic growth.
• Integrated Macroeconomic Accounts for the United States: Integrated accounts that link production and income to changes in net worth for the U.S. economy. These accounts detail the sources and uses of funds made available for capital formation or net lending as well as track assets and liabilities for all major sectors of the U.S. economy.
Activity: Bureau of Economic Analysis
Subactivity: International Economic Accounts
Goal Statement
The goal of this program is to produce the international accounts that provide a detailed picture of economic activity between the United States and the rest of the world.
BEA - 20
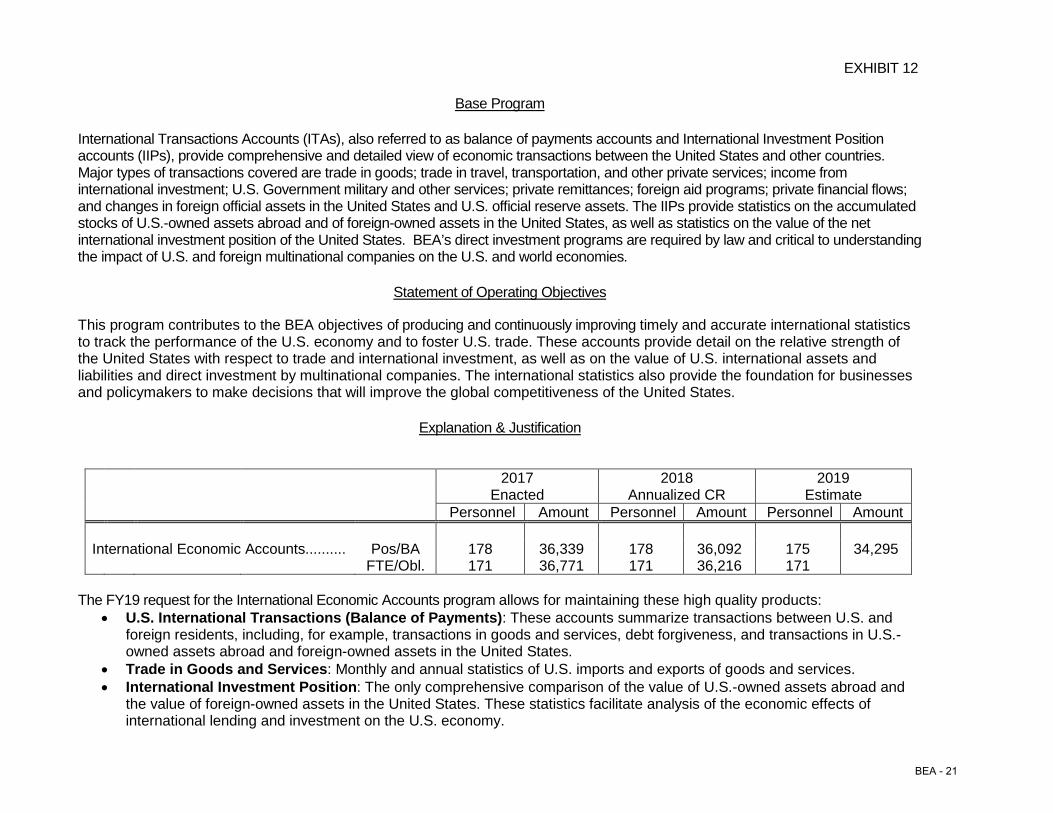
EXHIBIT 12
Base Program
International Transactions Accounts (ITAs), also referred to as balance of payments accounts and International Investment Position accounts (IIPs), provide comprehensive and detailed view of economic transactions between the United States and other countries. Major types of transactions covered are trade in goods; trade in travel, transportation, and other private services; income from international investment; U.S. Government military and other services; private remittances; foreign aid programs; private financial flows; and changes in foreign official assets in the United States and U.S. official reserve assets. The IIPs provide statistics on the accumulated stocks of U.S.-owned assets abroad and of foreign-owned assets in the United States, as well as statistics on the value of the net international investment position of the United States. BEA’s direct investment programs are required by law and critical to understanding the impact of U.S. and foreign multinational companies on the U.S. and world economies.
Statement of Operating Objectives
This program contributes to the BEA objectives of producing and continuously improving timely and accurate international statistics to track the performance of the U.S. economy and to foster U.S. trade. These accounts provide detail on the relative strength of the United States with respect to trade and international investment, as well as on the value of U.S. international assets and liabilities and direct investment by multinational companies. The international statistics also provide the foundation for businesses and policymakers to make decisions that will improve the global competitiveness of the United States.
Explanation & Justification
2017 2018 2019 Enacted Annualized CR Estimate Personnel Amount Personnel Amount Personnel Amount International Economic Accounts.......... Pos/BA 178 36,339 178 36,092 175 34,295 FTE/Obl. 171 36,771 171 36,216 171
The FY19 request for the International Economic Accounts program allows for maintaining these high quality products:
• U.S. International Transactions (Balance of Payments): These accounts summarize transactions between U.S. and foreign residents, including, for example, transactions in goods and services, debt forgiveness, and transactions in U.S.-owned assets abroad and foreign-owned assets in the United States.
• Trade in Goods and Services: Monthly and annual statistics of U.S. imports and exports of goods and services. • International Investment Position: The only comprehensive comparison of the value of U.S.-owned assets abroad and
the value of foreign-owned assets in the United States. These statistics facilitate analysis of the economic effects of international lending and investment on the U.S. economy.
BEA - 21
EXHIBIT 12
• Activities of Multinational Enterprises: These data sets cover the financial structure and operations of U.S. multinational enterprises (MNEs) and of U.S. affiliates of foreign MNEs. The data are used to analyze the characteristics and performance of MNEs and to assess their impact on the U.S. and foreign host economies.
• New Foreign Direct Investment: These statistics provide information on the acquisition, establishment, and expansion of U.S. business enterprises by foreign direct investors.
Activity: Bureau of Economic Analysis
Subactivity: Industry Economic Accounts
Goal Statement
The goal of this program is to produce the input-output accounts that contain detailed information on the flow of goods and services to industries for use in the production process and to final users in the U.S. economy.
Base Program
The Industry Economic Accounts, presented both in an input-output accounting framework and as a time series, provide a detailed view of the interrelationships between U.S. producers and users of goods and services, and the contribution to production across industries. Specifically, the benchmark input-output (I-O) accounts show the flow of goods and services from each industry to other industries and to final users in the economy and the income originating in them, and the annual input-output (I-O) accounts provide a time series of detailed, consistent information on these flows. The GDP-by-industry accounts include estimates of value added by industry-a measure of the contribution of each private industry and of government to the Nation’s GDP. These accounts can be used to examine changes in the structure of the U.S. economy and the importance of an industry and its contribution to GDP.
Statement of Operating Objectives
This program contributes to the BEA objective of preparing and continuously improving timely and accurate industry statistics to track the performance of the U.S. economy. Data from the Industry Economic Accounts form the foundation of the National Income and Product Accounts and many other key government statistics, such as the Bureau of Labor Statistics’ producer price indexes. The Industry Accounts data are also used extensively by policymakers, businesses, and academics to understand industry interactions and the sources and trends of productivity in the United States, as well as the changing structure of the U.S. economy.
BEA - 22
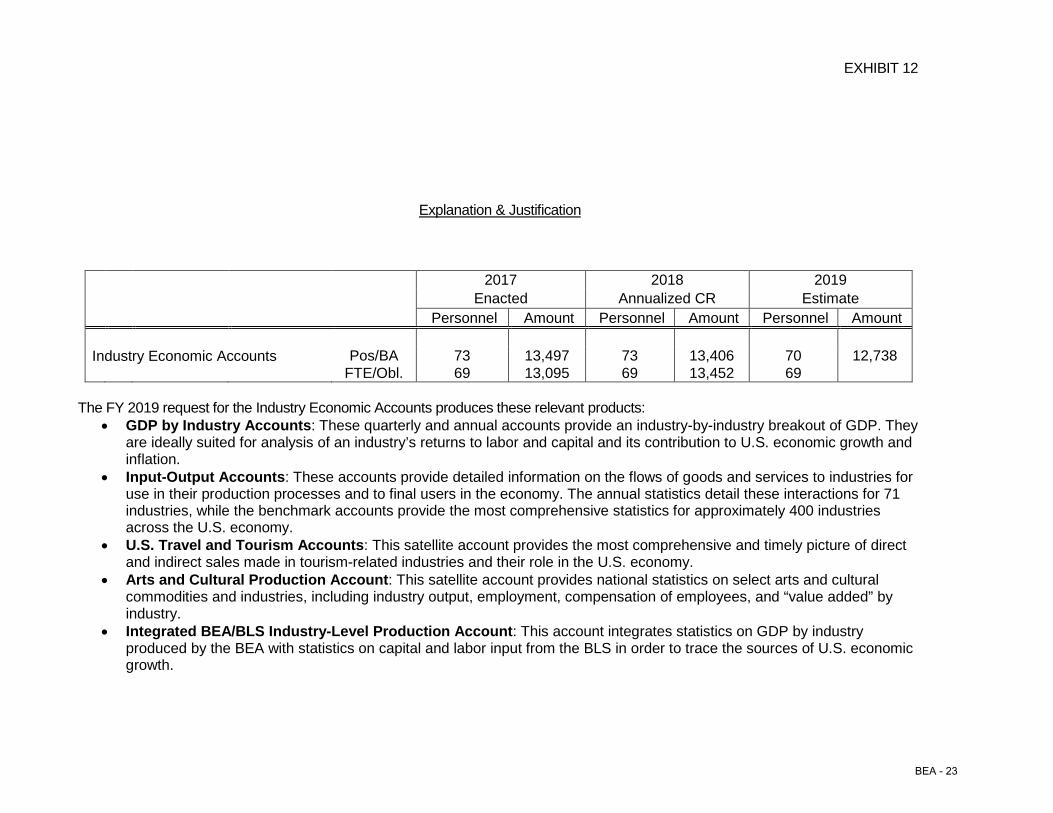
EXHIBIT 12
Explanation & Justification
2017 2018 2019 Enacted Annualized CR Estimate Personnel Amount Personnel Amount Personnel Amount Industry Economic Accounts Pos/BA 73 13,497 73 13,406 70 12,738 FTE/Obl. 69 13,095 69 13,452 69
The FY 2019 request for the Industry Economic Accounts produces these relevant products:
• GDP by Industry Accounts: These quarterly and annual accounts provide an industry-by-industry breakout of GDP. They are ideally suited for analysis of an industry’s returns to labor and capital and its contribution to U.S. economic growth and inflation.
• Input-Output Accounts: These accounts provide detailed information on the flows of goods and services to industries for use in their production processes and to final users in the economy. The annual statistics detail these interactions for 71 industries, while the benchmark accounts provide the most comprehensive statistics for approximately 400 industries across the U.S. economy.
• U.S. Travel and Tourism Accounts: This satellite account provides the most comprehensive and timely picture of direct and indirect sales made in tourism-related industries and their role in the U.S. economy.
• Arts and Cultural Production Account: This satellite account provides national statistics on select arts and cultural commodities and industries, including industry output, employment, compensation of employees, and “value added” by industry.
• Integrated BEA/BLS Industry-Level Production Account: This account integrates statistics on GDP by industry produced by the BEA with statistics on capital and labor input from the BLS in order to trace the sources of U.S. economic growth.
BEA - 23
EXHIBIT 12
Activity: Bureau of Economic Analysis
Subactivity: Regional Economic Accounts
Goal Statement
The goal of this program is to produce measures that show the geographic distribution of the Nation’s output and income and are critical to gauging the economic health of local economies.
Base Program
The Regional Economic Accounts include detail on economic activity by region, state, metropolitan area, and county. The accounts include estimates of gross domestic product (GDP) by state and of personal income by state and local area. These regional statistics are consistent with those statistics in the Bureau’s national economic accounts. BEA also prepares regional economic multipliers for other geographies defined by our users.
Statement of Operating Objectives
This program contributes to the BEA objective of preparing and continuously improving timely and accurate regional statistics to track the performance of the U.S. economy. Regional data are used to allocate close to $400 billion in Federal funds and are the basis for virtually all states’ spending and revenue forecasts. Twenty-six states have set constitutional or statutory limits on state government revenues or spending that are tied to BEA’s state personal income statistics and related components. The statistics on GDP by state, on state and local area personal income, and their accompanying detail provide a consistent framework for analyzing and comparing state and local area economies and meeting these objectives. Additionally, the data are used by academic researchers, business leaders, trade organizations, and labor organizations for area-specific market research.
BEA - 24
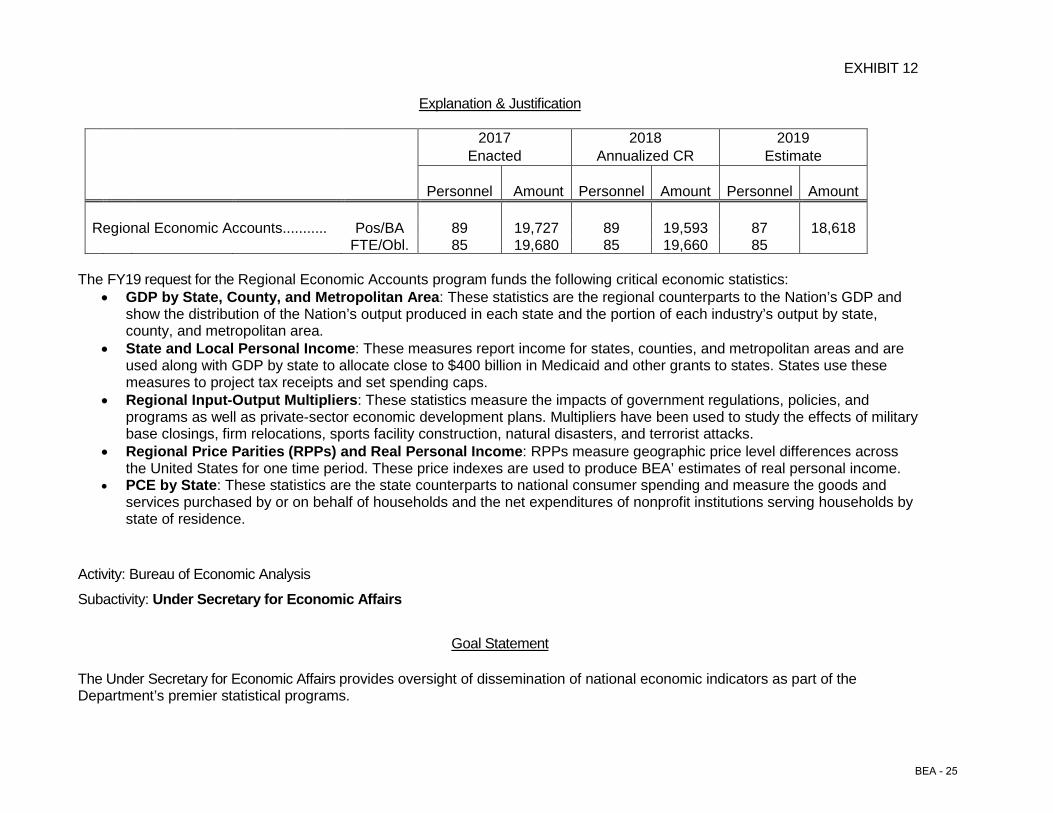
EXHIBIT 12
Explanation & Justification
2017 2018 2019 Enacted Annualized CR Estimate
Personnel Amount
Personnel
Amount
Personnel
Amount Regional Economic Accounts........... Pos/BA 89 19,727 89 19,593 87 18,618 FTE/Obl. 85 19,680 85 19,660 85
The FY19 request for the Regional Economic Accounts program funds the following critical economic statistics:
• GDP by State, County, and Metropolitan Area: These statistics are the regional counterparts to the Nation’s GDP and show the distribution of the Nation’s output produced in each state and the portion of each industry’s output by state, county, and metropolitan area.
• State and Local Personal Income: These measures report income for states, counties, and metropolitan areas and are used along with GDP by state to allocate close to $400 billion in Medicaid and other grants to states. States use these measures to project tax receipts and set spending caps.
• Regional Input-Output Multipliers: These statistics measure the impacts of government regulations, policies, and programs as well as private-sector economic development plans. Multipliers have been used to study the effects of military base closings, firm relocations, sports facility construction, natural disasters, and terrorist attacks.
• Regional Price Parities (RPPs) and Real Personal Income: RPPs measure geographic price level differences across the United States for one time period. These price indexes are used to produce BEA’ estimates of real personal income.
• PCE by State: These statistics are the state counterparts to national consumer spending and measure the goods and services purchased by or on behalf of households and the net expenditures of nonprofit institutions serving households by state of residence.
Activity: Bureau of Economic Analysis
Subactivity: Under Secretary for Economic Affairs
Goal Statement
The Under Secretary for Economic Affairs provides oversight of dissemination of national economic indicators as part of the Department’s premier statistical programs.
BEA - 25
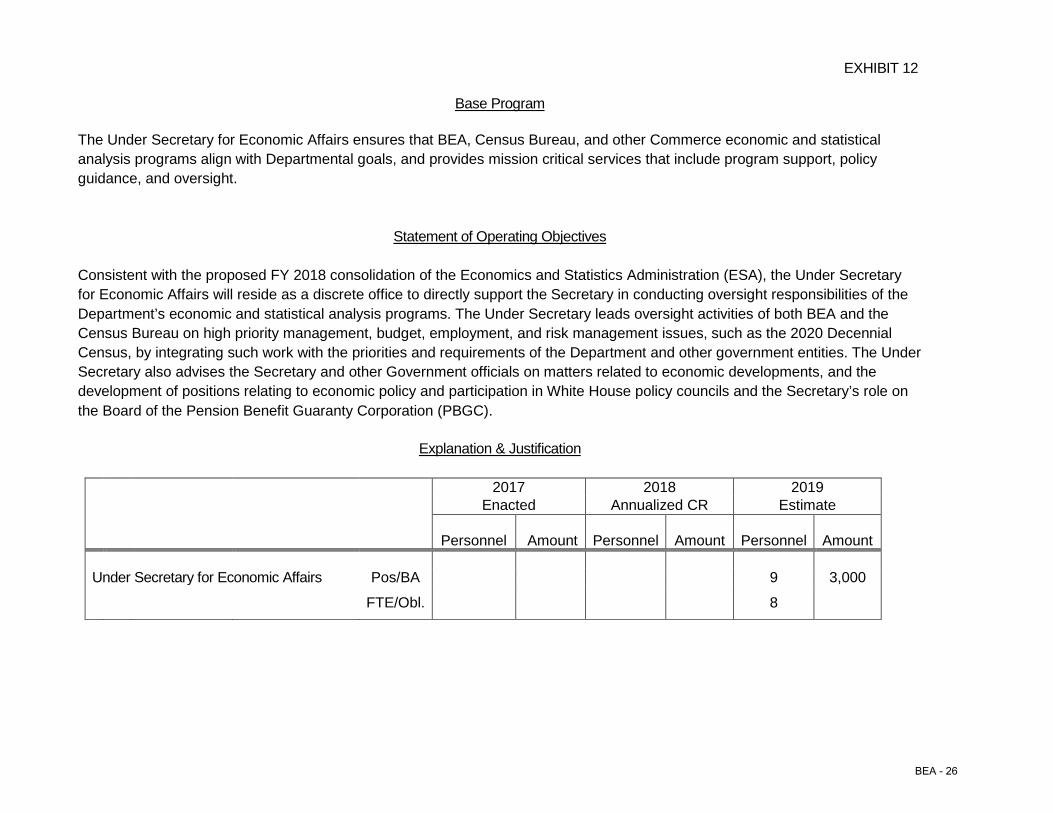
EXHIBIT 12
Base Program The Under Secretary for Economic Affairs ensures that BEA, Census Bureau, and other Commerce economic and statistical analysis programs align with Departmental goals, and provides mission critical services that include program support, policy guidance, and oversight.
Statement of Operating Objectives
Consistent with the proposed FY 2018 consolidation of the Economics and Statistics Administration (ESA), the Under Secretary for Economic Affairs will reside as a discrete office to directly support the Secretary in conducting oversight responsibilities of the Department’s economic and statistical analysis programs. The Under Secretary leads oversight activities of both BEA and the Census Bureau on high priority management, budget, employment, and risk management issues, such as the 2020 Decennial Census, by integrating such work with the priorities and requirements of the Department and other government entities. The Under Secretary also advises the Secretary and other Government officials on matters related to economic developments, and the development of positions relating to economic policy and participation in White House policy councils and the Secretary’s role on the Board of the Pension Benefit Guaranty Corporation (PBGC).
Explanation & Justification
2017 2018 2019 Enacted Annualized CR Estimate
Personnel Amount
Personnel
Amount
Personnel
Amount Under Secretary for Economic Affairs Pos/BA 9 3,000
FTE/Obl. 8
BEA - 26
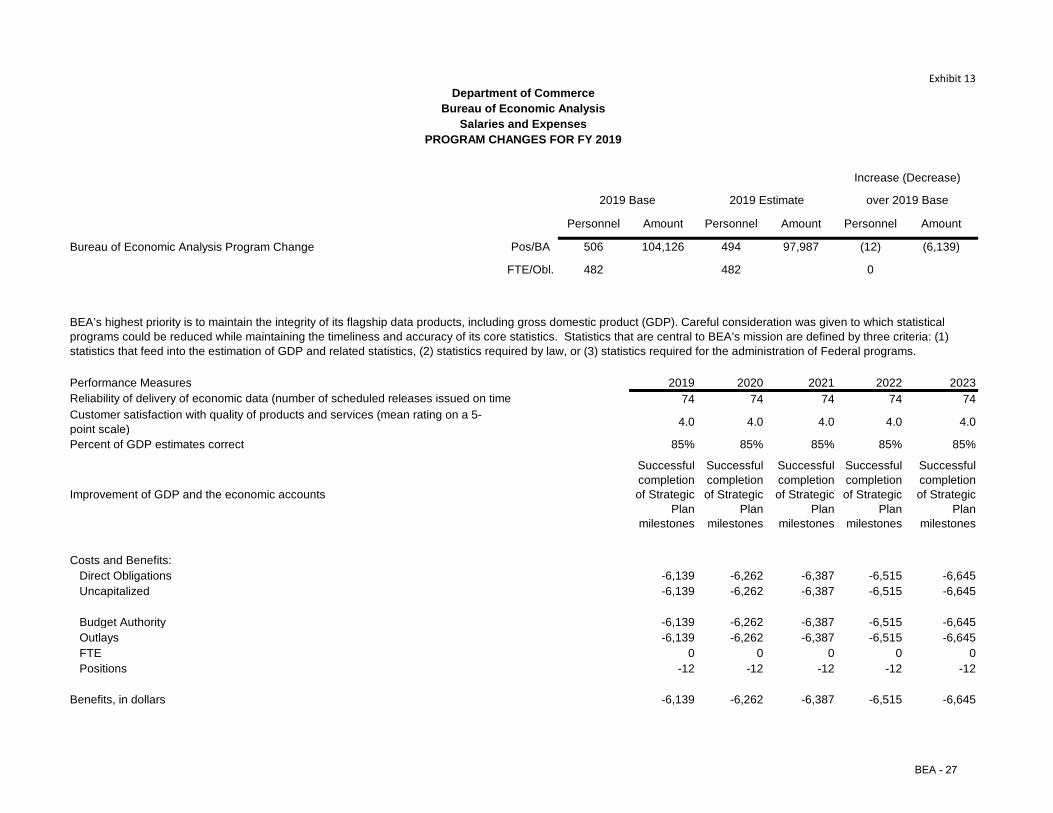
Exhibit 13
Personnel Amount Personnel Amount Personnel Amount
Bureau of Economic Analysis Program Change Pos/BA 506 104,126 494 97,987 (12) (6,139)
FTE/Obl. 482 482 0
Performance Measures 2019 2020 2021 2022 202374 74 74 74 74
Customer satisfaction with quality of products and services (mean rating on a 5-point scale) 4.0 4.0 4.0 4.0 4.0
Percent of GDP estimates correct 85% 85% 85% 85% 85%
Improvement of GDP and the economic accounts
Successful completion of Strategic
Plan milestones
Successful completion of Strategic
Plan milestones
Successful completion of Strategic
Plan milestones
Successful completion of Strategic
Plan milestones
Successful completion of Strategic
Plan milestones
Costs and Benefits: Direct Obligations -6,139 -6,262 -6,387 -6,515 -6,645 Uncapitalized -6,139 -6,262 -6,387 -6,515 -6,645
Budget Authority -6,139 -6,262 -6,387 -6,515 -6,645 Outlays -6,139 -6,262 -6,387 -6,515 -6,645 FTE 0 0 0 0 0 Positions -12 -12 -12 -12 -12
Benefits, in dollars -6,139 -6,262 -6,387 -6,515 -6,645
Reliability of delivery of economic data (number of scheduled releases issued on time
over 2019 Base
Department of CommerceBureau of Economic Analysis
Salaries and ExpensesPROGRAM CHANGES FOR FY 2019
BEA’s highest priority is to maintain the integrity of its flagship data products, including gross domestic product (GDP). Careful consideration was given to which statistical programs could be reduced while maintaining the timeliness and accuracy of its core statistics. Statistics that are central to BEA’s mission are defined by three criteria: (1) statistics that feed into the estimation of GDP and related statistics, (2) statistics required by law, or (3) statistics required for the administration of Federal programs.
2019 Base 2019 Estimate
Increase (Decrease)
BEA - 27
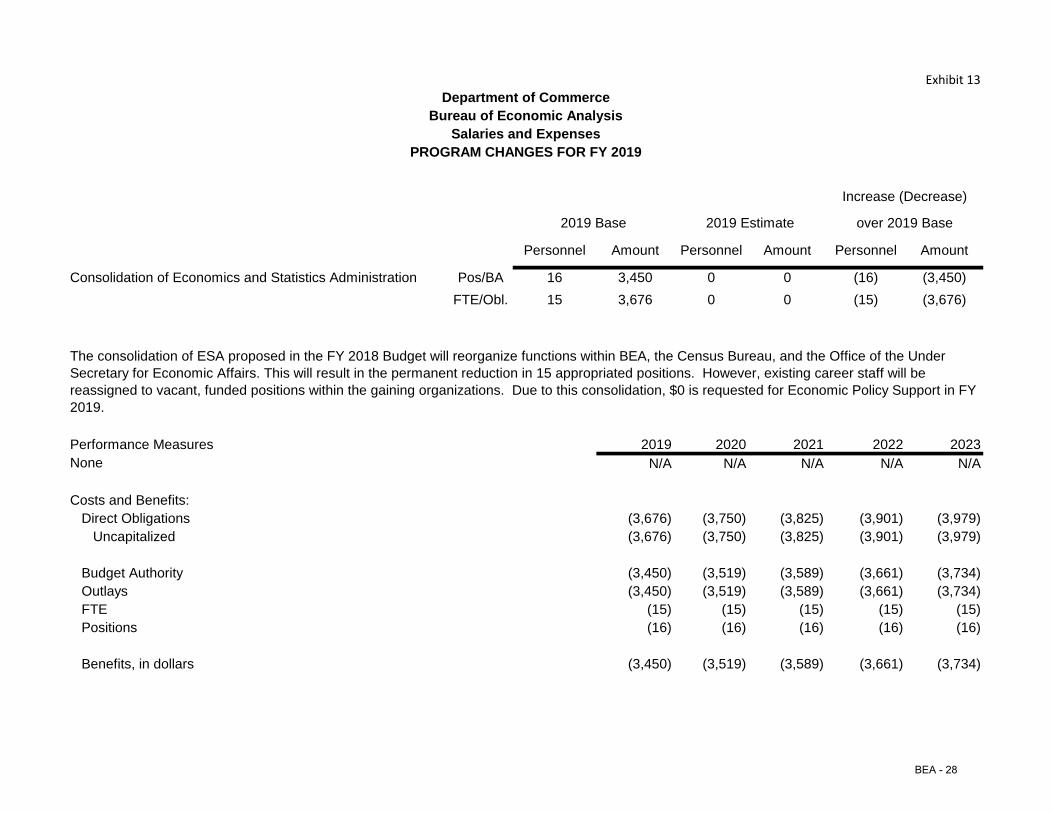
Exhibit 13
Personnel Amount Personnel Amount Personnel Amount
Consolidation of Economics and Statistics Administration Pos/BA 16 3,450 0 0 (16) (3,450)FTE/Obl. 15 3,676 0 0 (15) (3,676)
Performance Measures 2019 2020 2021 2022 2023N/A N/A N/A N/A N/A
Costs and Benefits: Direct Obligations (3,676) (3,750) (3,825) (3,901) (3,979) Uncapitalized (3,676) (3,750) (3,825) (3,901) (3,979)
Budget Authority (3,450) (3,519) (3,589) (3,661) (3,734) Outlays (3,450) (3,519) (3,589) (3,661) (3,734) FTE (15) (15) (15) (15) (15) Positions (16) (16) (16) (16) (16)
Benefits, in dollars (3,450) (3,519) (3,589) (3,661) (3,734)
None
over 2019 Base
Department of CommerceBureau of Economic Analysis
Salaries and ExpensesPROGRAM CHANGES FOR FY 2019
The consolidation of ESA proposed in the FY 2018 Budget will reorganize functions within BEA, the Census Bureau, and the Office of the Under Secretary for Economic Affairs. This will result in the permanent reduction in 15 appropriated positions. However, existing career staff will be reassigned to vacant, funded positions within the gaining organizations. Due to this consolidation, $0 is requested for Economic Policy Support in FY 2019.
2019 Base 2019 Estimate
Increase (Decrease)
BEA - 28
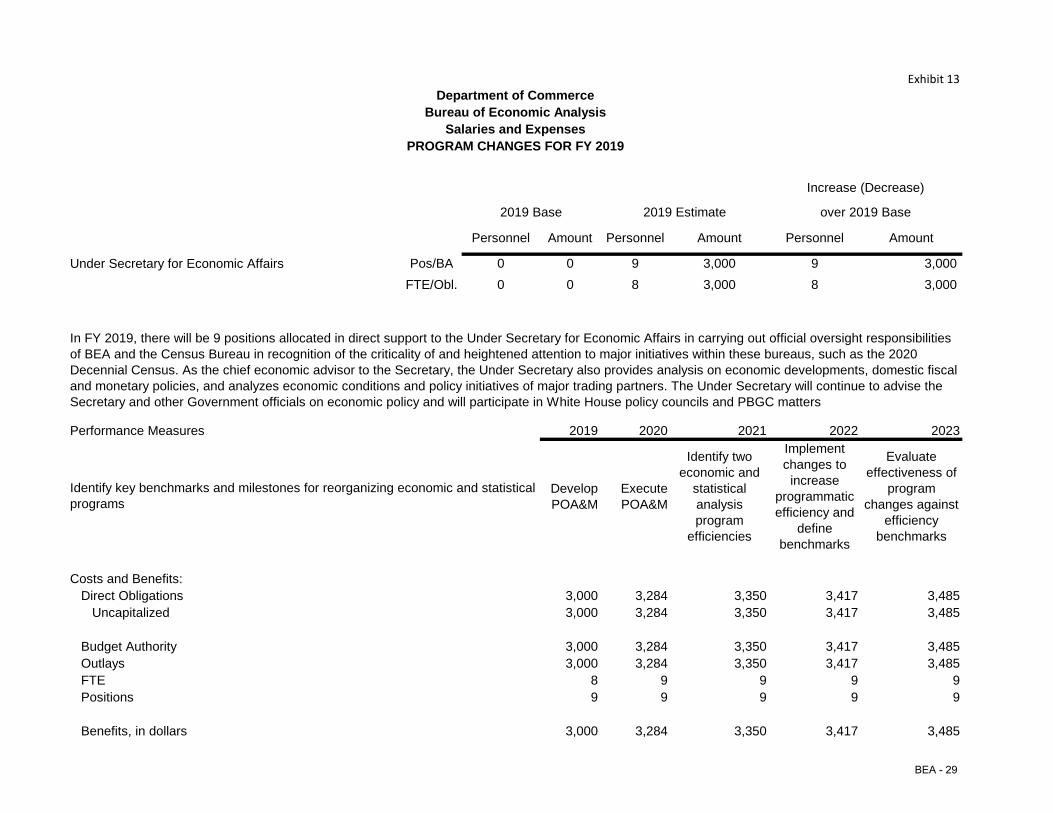
Exhibit 13
Personnel Amount Personnel Amount Personnel Amount
Under Secretary for Economic Affairs Pos/BA 0 0 9 3,000 9 3,000 FTE/Obl. 0 0 8 3,000 8 3,000
Performance Measures 2019 2020 2021 2022 2023
Develop POA&M
Execute POA&M
Identify two economic and
statistical analysis program
efficiencies
Implement changes to
increase programmatic efficiency and
define benchmarks
Evaluate effectiveness of
program changes against
efficiency benchmarks
Costs and Benefits: Direct Obligations 3,000 3,284 3,350 3,417 3,485 Uncapitalized 3,000 3,284 3,350 3,417 3,485
Budget Authority 3,000 3,284 3,350 3,417 3,485 Outlays 3,000 3,284 3,350 3,417 3,485 FTE 8 9 9 9 9 Positions 9 9 9 9 9
Benefits, in dollars 3,000 3,284 3,350 3,417 3,485
Identify key benchmarks and milestones for reorganizing economic and statistical programs
over 2019 Base
Department of CommerceBureau of Economic Analysis
Salaries and ExpensesPROGRAM CHANGES FOR FY 2019
In FY 2019, there will be 9 positions allocated in direct support to the Under Secretary for Economic Affairs in carrying out official oversight responsibilities of BEA and the Census Bureau in recognition of the criticality of and heightened attention to major initiatives within these bureaus, such as the 2020 Decennial Census. As the chief economic advisor to the Secretary, the Under Secretary also provides analysis on economic developments, domestic fiscal and monetary policies, and analyzes economic conditions and policy initiatives of major trading partners. The Under Secretary will continue to advise the Secretary and other Government officials on economic policy and will participate in White House policy councils and PBGC matters
2019 Base 2019 Estimate
Increase (Decrease)
BEA - 29
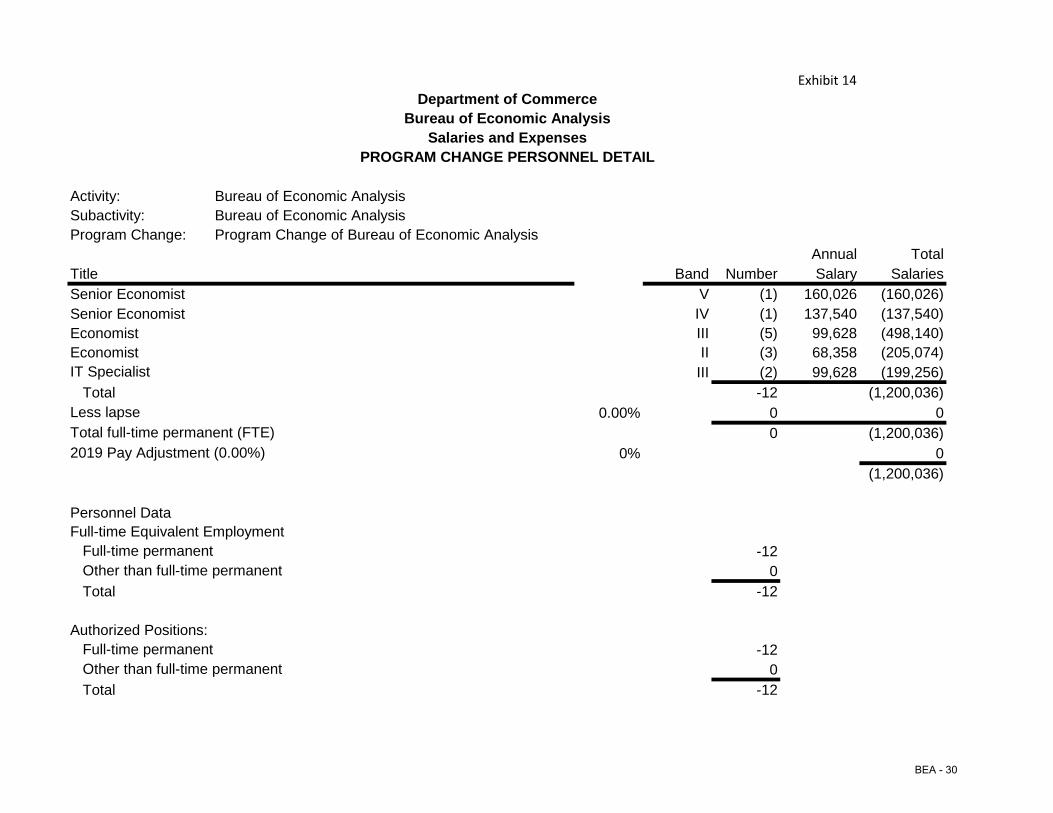
Exhibit 14
Activity: Bureau of Economic AnalysisSubactivity: Bureau of Economic AnalysisProgram Change: Program Change of Bureau of Economic Analysis
Annual TotalTitle Band Number Salary SalariesSenior Economist V (1) 160,026 (160,026)Senior Economist IV (1) 137,540 (137,540)Economist III (5) 99,628 (498,140)Economist II (3) 68,358 (205,074)
III (2) 99,628 (199,256) Total -12 (1,200,036)
0.00% 0 00 (1,200,036)
0% 0(1,200,036)
Personnel Data
-120
Total -12
-120
Total -12
Full-time permanent Other than full-time permanent
Total full-time permanent (FTE)2019 Pay Adjustment (0.00%)
Full-time Equivalent Employment Full-time permanent Other than full-time permanent
Authorized Positions:
Less lapse
Department of CommerceBureau of Economic Analysis
Salaries and ExpensesPROGRAM CHANGE PERSONNEL DETAIL
IT Specialist
BEA - 30
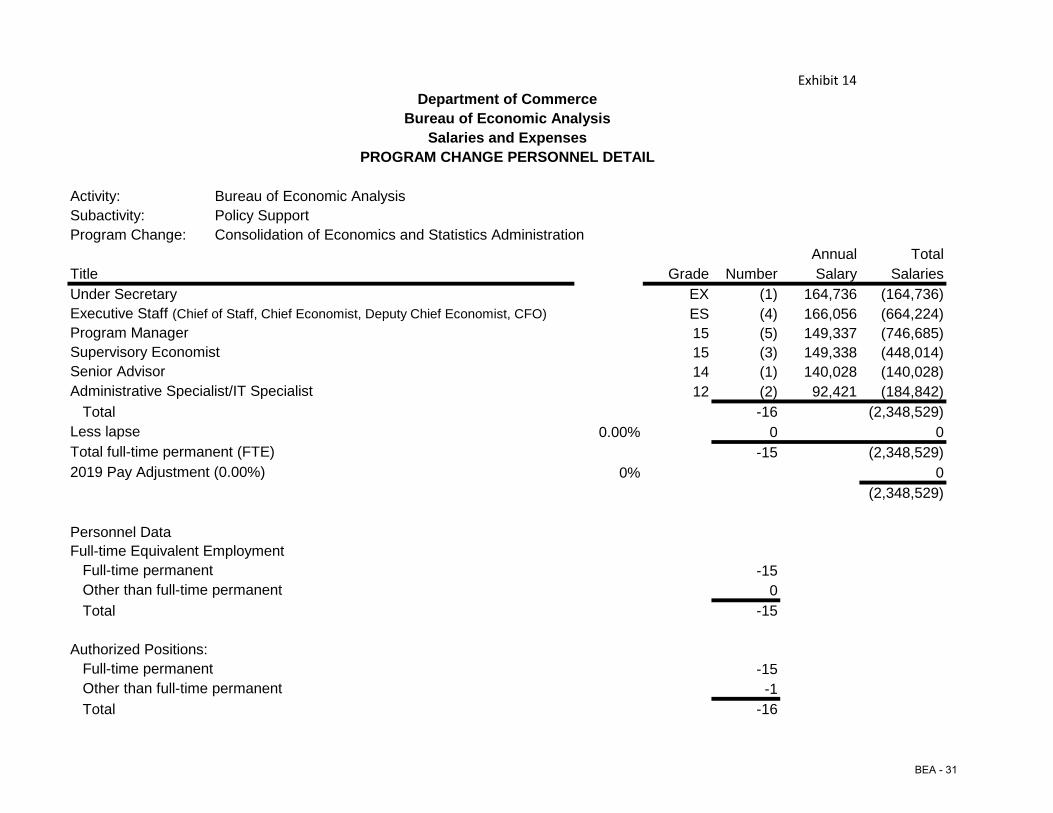
Exhibit 14
Activity: Bureau of Economic AnalysisSubactivity: Policy SupportProgram Change: Consolidation of Economics and Statistics Administration
Annual TotalTitle Grade Number Salary SalariesUnder Secretary EX (1) 164,736 (164,736)
ES (4) 166,056 (664,224)15 (5) 149,337 (746,685)15 (3) 149,338 (448,014)14 (1) 140,028 (140,028)12 (2) 92,421 (184,842)
Total -16 (2,348,529)0.00% 0 0
-15 (2,348,529)0% 0
(2,348,529)
Personnel Data
-150
Total -15
-15-1
Total -16
Full-time permanent Other than full-time permanent
Total full-time permanent (FTE)2019 Pay Adjustment (0.00%)
Full-time Equivalent Employment Full-time permanent Other than full-time permanent
Authorized Positions:
Senior AdvisorAdministrative Specialist/IT Specialist
Less lapse
Department of CommerceBureau of Economic Analysis
Salaries and ExpensesPROGRAM CHANGE PERSONNEL DETAIL
Program ManagerExecutive Staff (Chief of Staff, Chief Economist, Deputy Chief Economist, CFO)
Supervisory Economist
BEA - 31
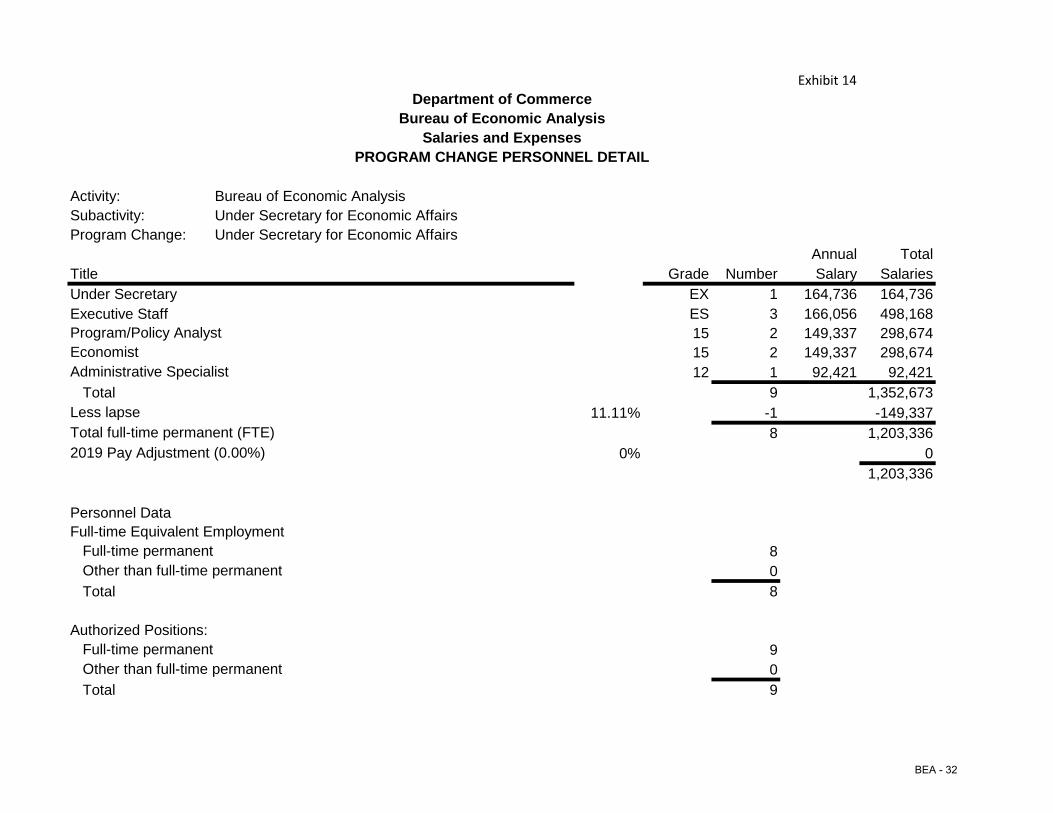
Exhibit 14
Activity: Bureau of Economic AnalysisSubactivity: Under Secretary for Economic AffairsProgram Change: Under Secretary for Economic Affairs
Annual TotalTitle Grade Number Salary SalariesUnder Secretary EX 1 164,736 164,736Executive Staff ES 3 166,056 498,168
15 2 149,337 298,67415 2 149,337 298,67412 1 92,421 92,421
Total 9 1,352,67311.11% -1 -149,337
8 1,203,3360% 0
1,203,336
Personnel Data
80
Total 8
90
Total 9
Full-time permanent Other than full-time permanent
Total full-time permanent (FTE)2019 Pay Adjustment (0.00%)
Full-time Equivalent Employment Full-time permanent Other than full-time permanent
Authorized Positions:
EconomistAdministrative Specialist
Less lapse
Department of CommerceBureau of Economic Analysis
Salaries and ExpensesPROGRAM CHANGE PERSONNEL DETAIL
Program/Policy Analyst
BEA - 32
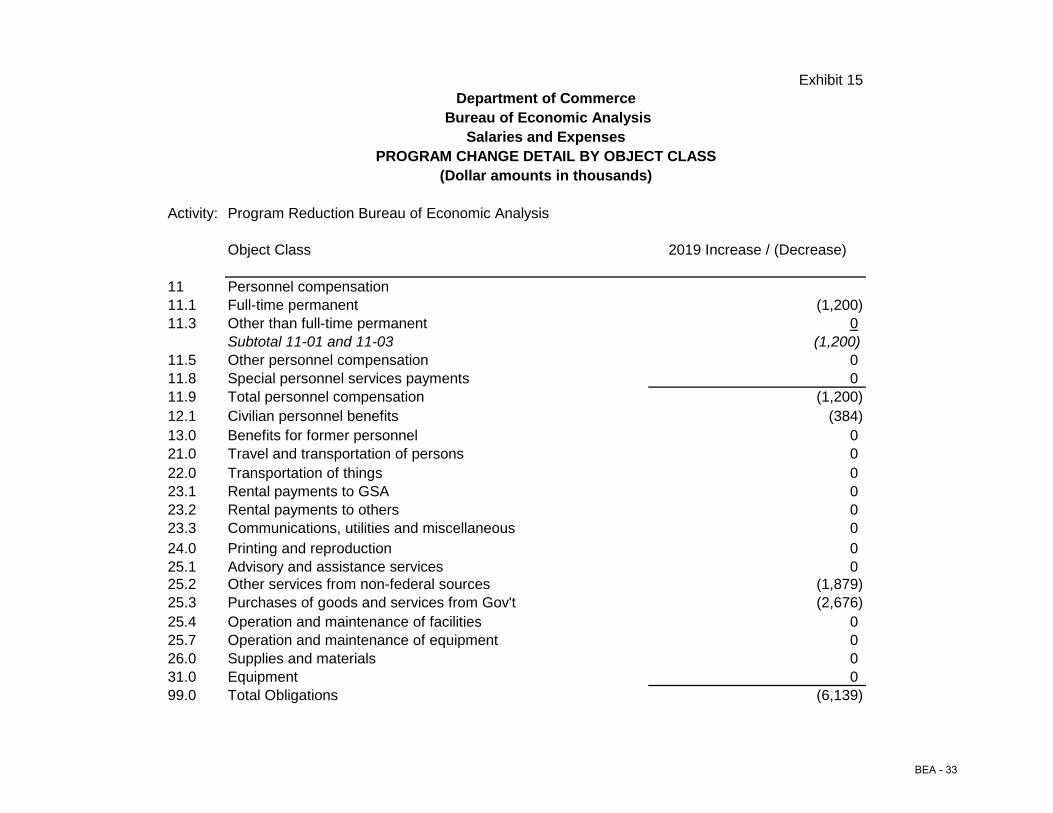
Exhibit 15
Activity: Program Reduction Bureau of Economic Analysis
Object Class 2019 Increase / (Decrease)
11 Personnel compensation11.1 Full-time permanent (1,200)11.3 Other than full-time permanent 0
Subtotal 11-01 and 11-03 (1,200)11.5 Other personnel compensation 011.8 Special personnel services payments 011.9 Total personnel compensation (1,200)12.1 Civilian personnel benefits (384)13.0 Benefits for former personnel 021.0 Travel and transportation of persons 022.0 Transportation of things 023.1 Rental payments to GSA 023.2 Rental payments to others 023.3 Communications, utilities and miscellaneous 024.0 Printing and reproduction 025.1 Advisory and assistance services 025.2 Other services from non-federal sources (1,879)25.3 Purchases of goods and services from Gov't (2,676)25.4 Operation and maintenance of facilities 025.7 Operation and maintenance of equipment 026.0 Supplies and materials 031.0 Equipment 099.0 Total Obligations (6,139)
(Dollar amounts in thousands)
Department of Commerce Bureau of Economic Analysis
Salaries and ExpensesPROGRAM CHANGE DETAIL BY OBJECT CLASS
BEA - 33

Exhibit 15
Activity: Consolidation of Economics and Statistics Administration
Object Class 2019 Increase / (Decrease)
11 Personnel compensation11.1 Full-time permanent (2,349)11.3 Other than full-time permanent -51
Subtotal 11-01 and 11-03 (2,400)11.5 Other personnel compensation (72)11.8 Special personnel services payments 011.9 Total personnel compensation (2,472)12.1 Civilian personnel benefits -60413.0 Benefits for former personnel 021.0 Travel and transportation of persons -3122.0 Transportation of things 023.1 Rental payments to GSA -21723.2 Rental payments to others 023.3 Communications, utilities and miscellaneous 024.0 Printing and reproduction 025.1 Advisory and assistance services -4925.2 Other services from non-federal sources -3625.3 Purchases of goods and services from Gov't -4125.4 Operation and maintenance of facilities 025.7 Operation and maintenance of equipment 026.0 Supplies and materials 031.0 Equipment 099.0 Total Obligations (3,450)
(Dollar amounts in thousands)
Department of Commerce Bureau of Economic Analysis
Salaries and ExpensesPROGRAM CHANGE DETAIL BY OBJECT CLASS
BEA - 34
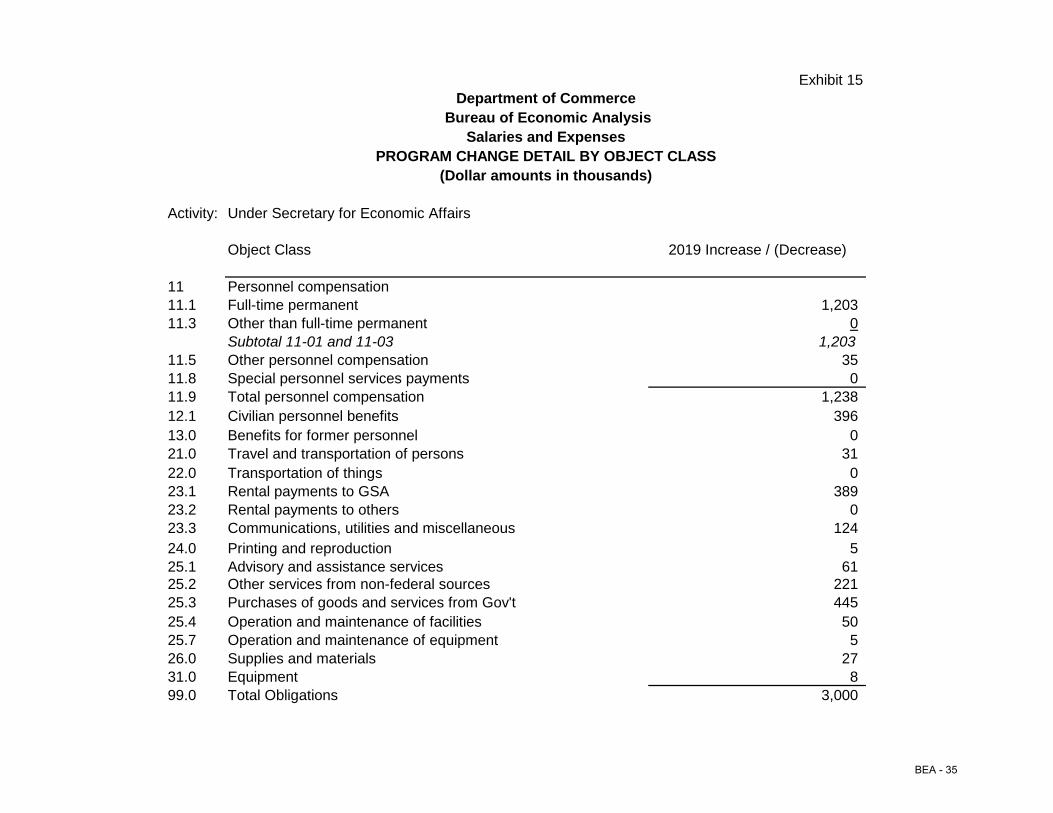
Exhibit 15
Activity: Under Secretary for Economic Affairs
Object Class 2019 Increase / (Decrease)
11 Personnel compensation11.1 Full-time permanent 1,20311.3 Other than full-time permanent 0
Subtotal 11-01 and 11-03 1,20311.5 Other personnel compensation 3511.8 Special personnel services payments 011.9 Total personnel compensation 1,23812.1 Civilian personnel benefits 39613.0 Benefits for former personnel 021.0 Travel and transportation of persons 3122.0 Transportation of things 023.1 Rental payments to GSA 38923.2 Rental payments to others 023.3 Communications, utilities and miscellaneous 12424.0 Printing and reproduction 525.1 Advisory and assistance services 6125.2 Other services from non-federal sources 22125.3 Purchases of goods and services from Gov't 44525.4 Operation and maintenance of facilities 5025.7 Operation and maintenance of equipment 526.0 Supplies and materials 2731.0 Equipment 899.0 Total Obligations 3,000
(Dollar amounts in thousands)
Department of Commerce Bureau of Economic Analysis
Salaries and ExpensesPROGRAM CHANGE DETAIL BY OBJECT CLASS
BEA - 35
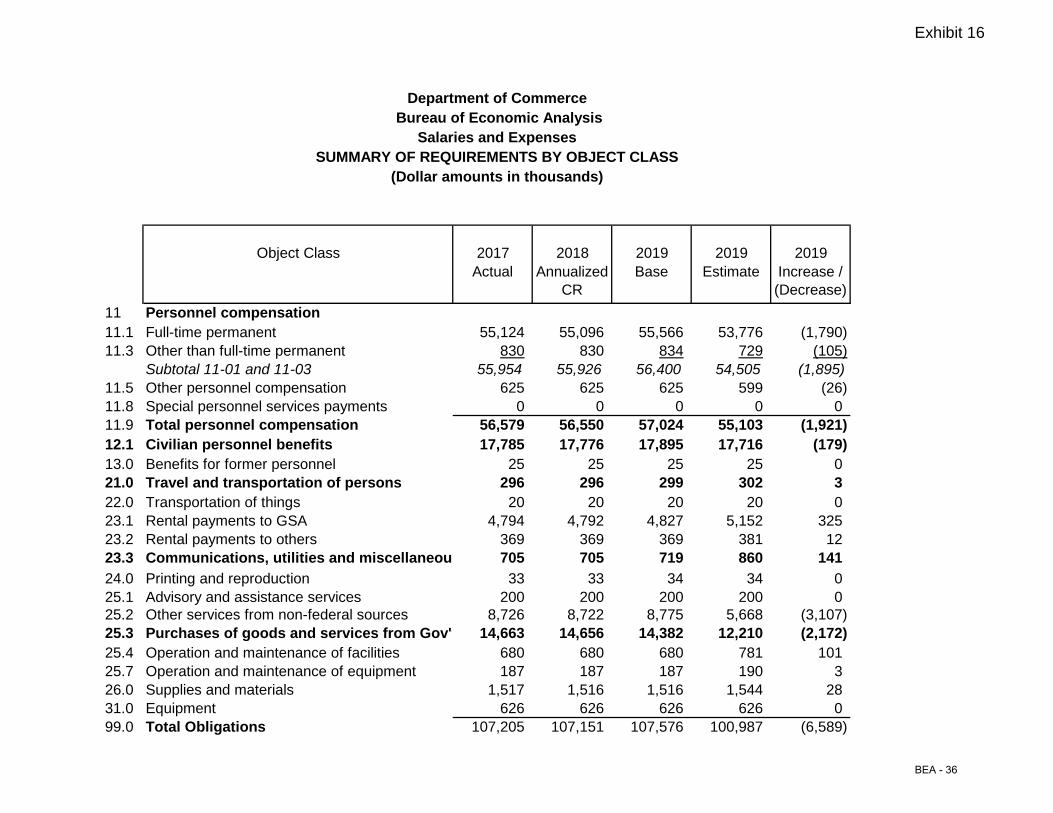
Exhibit 16
Object Class 2017 2018 2019 2019 2019Actual Annualized
CRBase Estimate Increase /
(Decrease)11 Personnel compensation11.1 Full-time permanent 55,124 55,096 55,566 53,776 (1,790)11.3 Other than full-time permanent 830 830 834 729 (105)
Subtotal 11-01 and 11-03 55,954 55,926 56,400 54,505 (1,895)11.5 Other personnel compensation 625 625 625 599 (26)11.8 Special personnel services payments 0 0 0 0 011.9 Total personnel compensation 56,579 56,550 57,024 55,103 (1,921)12.1 Civilian personnel benefits 17,785 17,776 17,895 17,716 (179)13.0 Benefits for former personnel 25 25 25 25 021.0 Travel and transportation of persons 296 296 299 302 322.0 Transportation of things 20 20 20 20 023.1 Rental payments to GSA 4,794 4,792 4,827 5,152 32523.2 Rental payments to others 369 369 369 381 1223.3 Communications, utilities and miscellaneou 705 705 719 860 14124.0 Printing and reproduction 33 33 34 34 025.1 Advisory and assistance services 200 200 200 200 025.2 Other services from non-federal sources 8,726 8,722 8,775 5,668 (3,107)25.3 Purchases of goods and services from Gov't 14,663 14,656 14,382 12,210 (2,172)25.4 Operation and maintenance of facilities 680 680 680 781 10125.7 Operation and maintenance of equipment 187 187 187 190 326.0 Supplies and materials 1,517 1,516 1,516 1,544 2831.0 Equipment 626 626 626 626 099.0 Total Obligations 107,205 107,151 107,576 100,987 (6,589)
(Dollar amounts in thousands)
Department of Commerce Bureau of Economic Analysis
Salaries and ExpensesSUMMARY OF REQUIREMENTS BY OBJECT CLASS
BEA - 36
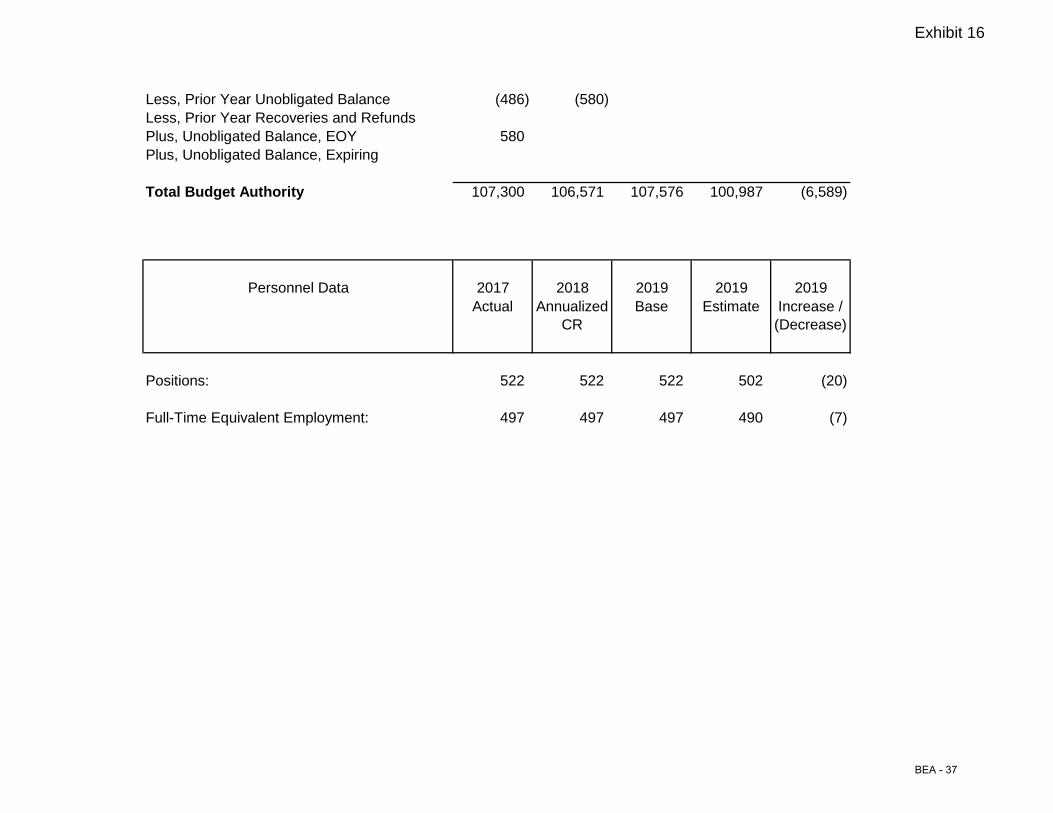
Exhibit 16
Less, Prior Year Unobligated Balance (486) (580)Less, Prior Year Recoveries and RefundsPlus, Unobligated Balance, EOY 580Plus, Unobligated Balance, Expiring
Total Budget Authority 107,300 106,571 107,576 100,987 (6,589)
Personnel Data 2017 2018 2019 2019 2019Actual Annualized
CRBase Estimate Increase /
(Decrease)
Positions: 522 522 522 502 (20)
Full-Time Equivalent Employment: 497 497 497 490 (7)
BEA - 37
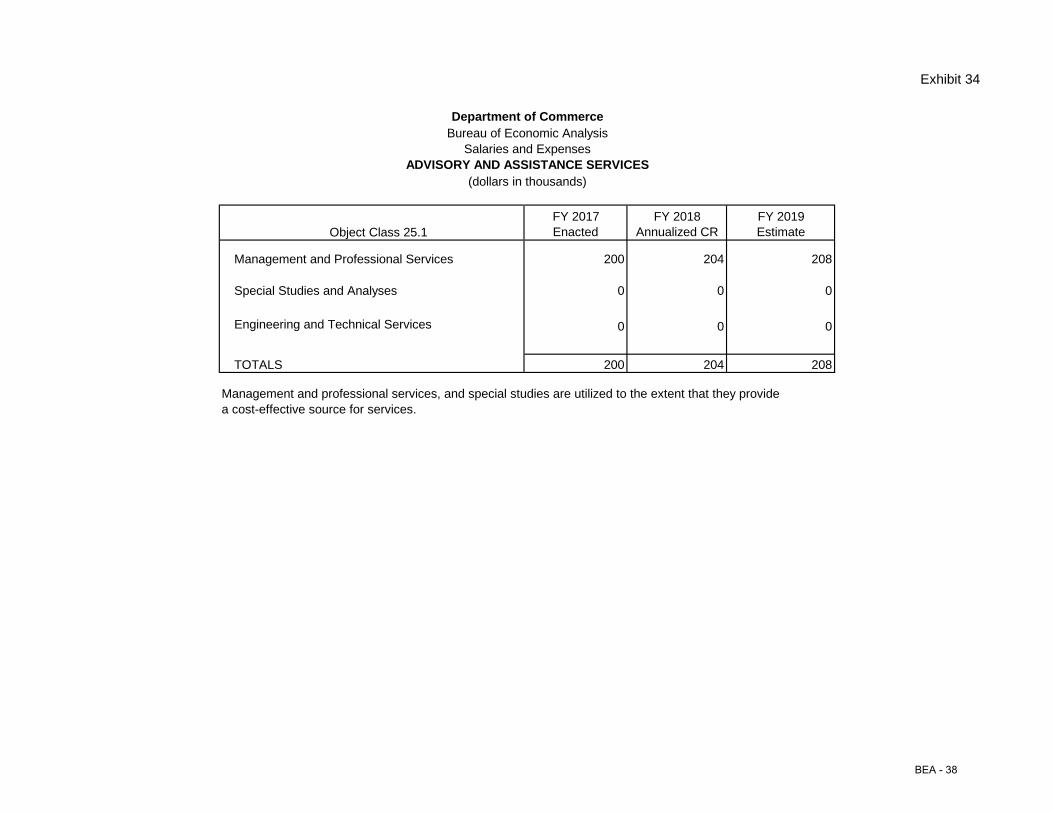
Exhibit 34
FY 2017 FY 2018 FY 2019Object Class 25.1 Enacted Annualized CR Estimate
Management and Professional Services 200 204 208
Special Studies and Analyses 0 0 0
Engineering and Technical Services 0 0 0
TOTALS 200 204 208
Management and professional services, and special studies are utilized to the extent that they provide a cost-effective source for services.
(dollars in thousands)
Department of CommerceBureau of Economic Analysis
Salaries and ExpensesADVISORY AND ASSISTANCE SERVICES
BEA - 38
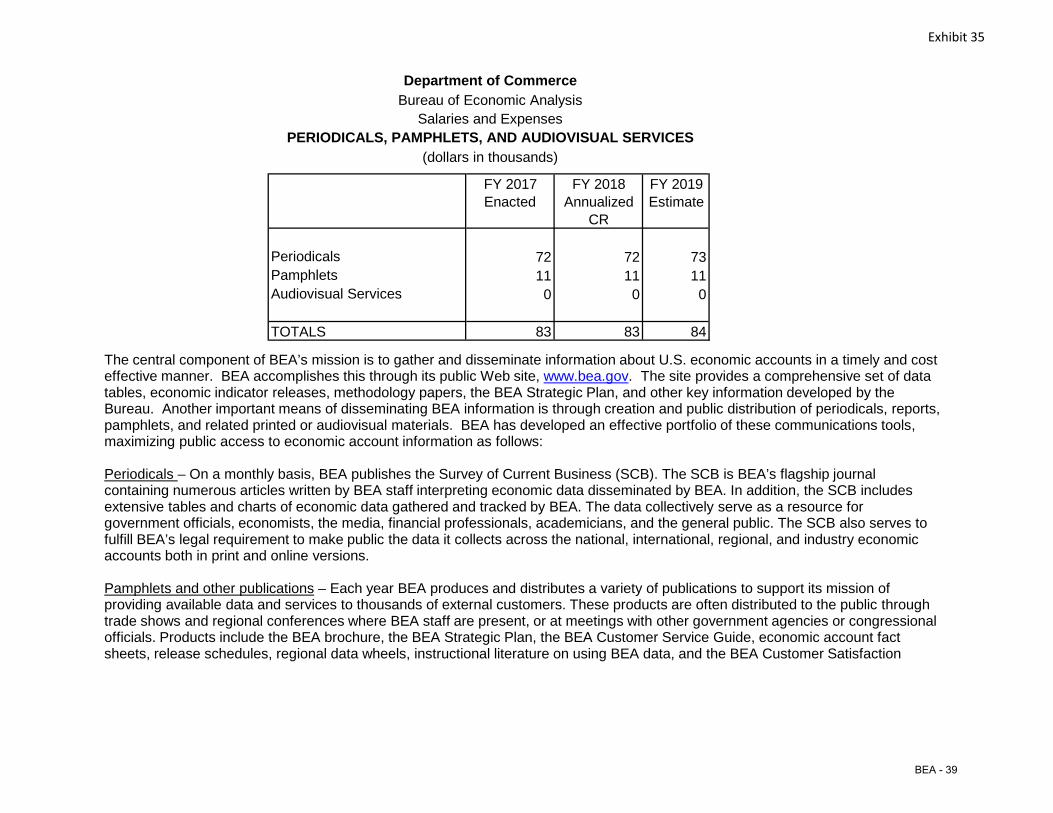
Exhibit 35
FY 2017 FY 2018 FY 2019Enacted Annualized
CREstimate
Periodicals 72 72 73Pamphlets 11 11 11Audiovisual Services 0 0 0
TOTALS 83 83 84
Department of CommerceBureau of Economic Analysis
Salaries and ExpensesPERIODICALS, PAMPHLETS, AND AUDIOVISUAL SERVICES
(dollars in thousands)
The central component of BEA’s mission is to gather and disseminate information about U.S. economic accounts in a timely and cost effective manner. BEA accomplishes this through its public Web site, www.bea.gov. The site provides a comprehensive set of data tables, economic indicator releases, methodology papers, the BEA Strategic Plan, and other key information developed by the Bureau. Another important means of disseminating BEA information is through creation and public distribution of periodicals, reports, pamphlets, and related printed or audiovisual materials. BEA has developed an effective portfolio of these communications tools, maximizing public access to economic account information as follows:
Periodicals – On a monthly basis, BEA publishes the Survey of Current Business (SCB). The SCB is BEA’s flagship journal containing numerous articles written by BEA staff interpreting economic data disseminated by BEA. In addition, the SCB includes extensive tables and charts of economic data gathered and tracked by BEA. The data collectively serve as a resource for government officials, economists, the media, financial professionals, academicians, and the general public. The SCB also serves to fulfill BEA’s legal requirement to make public the data it collects across the national, international, regional, and industry economic accounts both in print and online versions.
Pamphlets and other publications – Each year BEA produces and distributes a variety of publications to support its mission of providing available data and services to thousands of external customers. These products are often distributed to the public through trade shows and regional conferences where BEA staff are present, or at meetings with other government agencies or congressionalofficials. Products include the BEA brochure, the BEA Strategic Plan, the BEA Customer Service Guide, economic account fact sheets, release schedules, regional data wheels, instructional literature on using BEA data, and the BEA Customer Satisfaction
BEA - 39
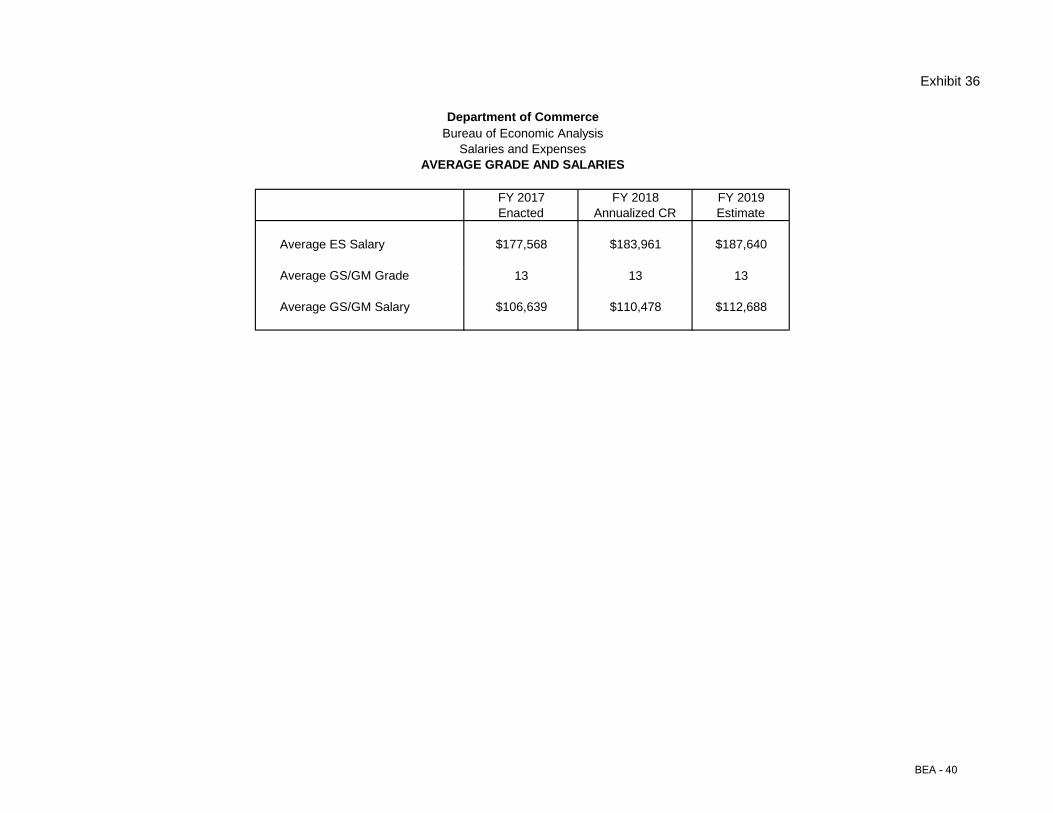
Exhibit 36
FY 2017 FY 2018 FY 2019Enacted Annualized CR Estimate
Average ES Salary $177,568 $183,961 $187,640
Average GS/GM Grade 13 13 13
Average GS/GM Salary $106,639 $110,478 $112,688
Bureau of Economic AnalysisSalaries and Expenses
AVERAGE GRADE AND SALARIES
Department of Commerce
BEA - 40
FY 2019 ANNUAL PERFORMANCE PLAN / FY 2017 ANNUAL PERFORMANCE REPORT Bureau of Economic Analysis
Performance Indicator Information Summary of Indicator Performance
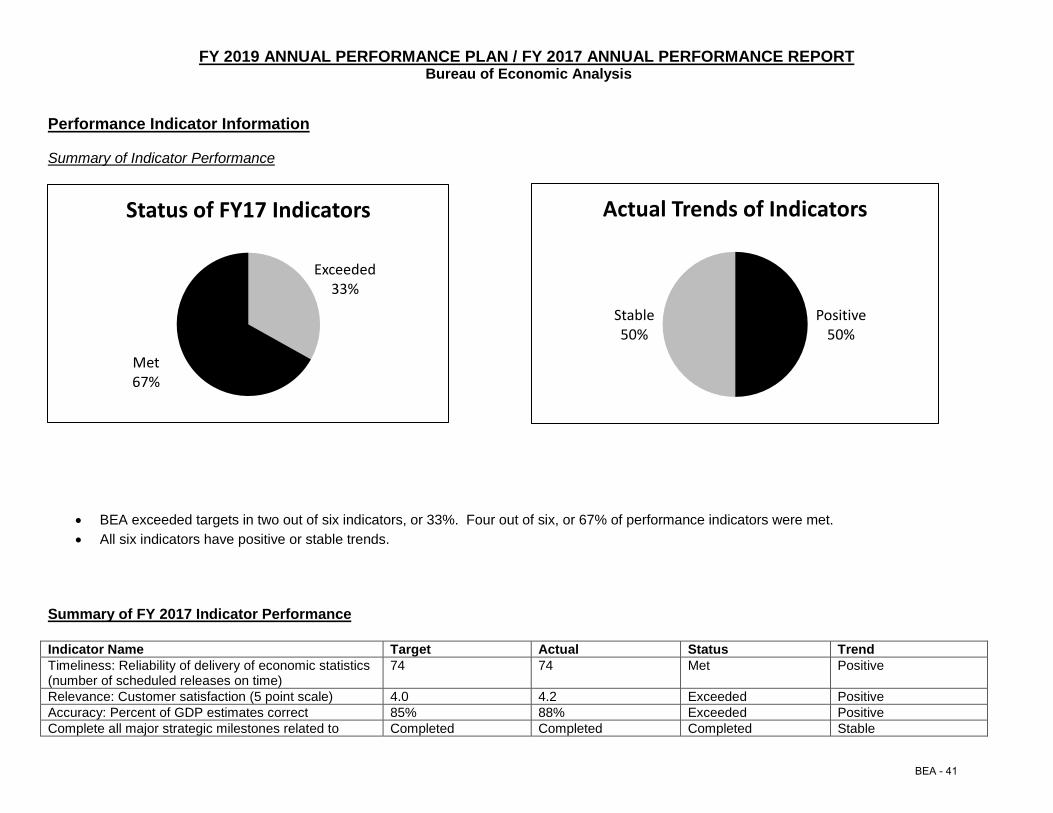
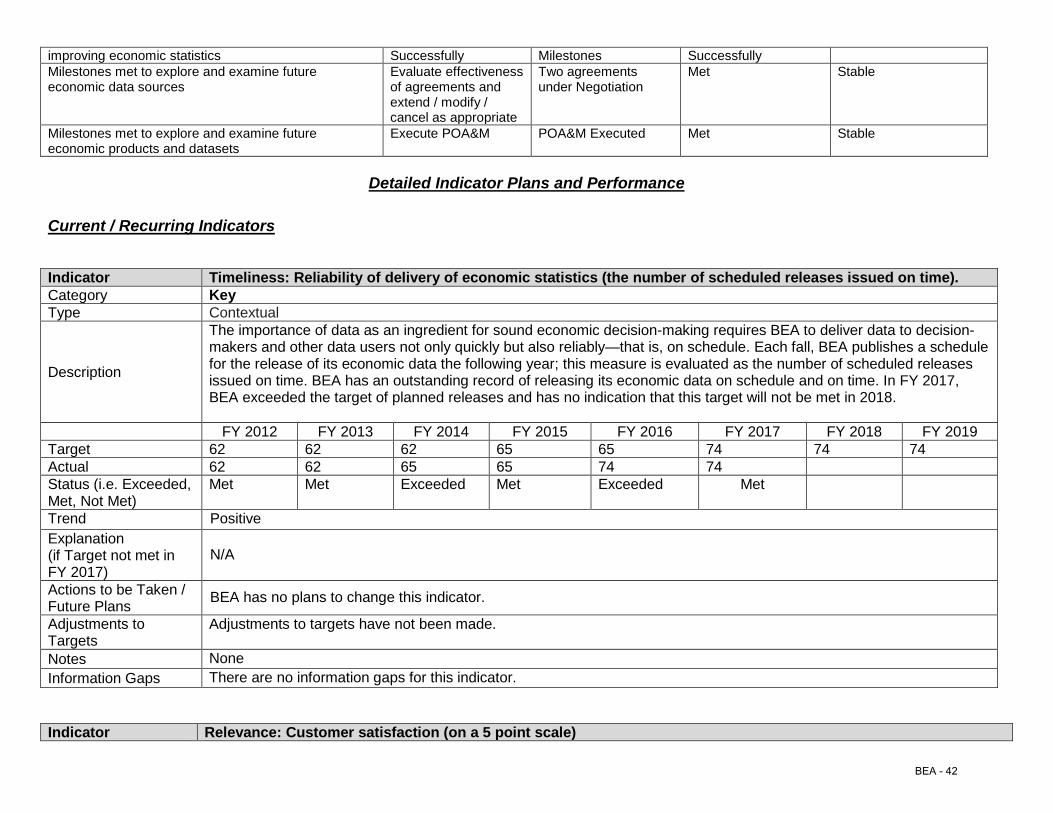
• BEA exceeded targets in two out of six indicators, or 33%. Four out of six, or 67% of performance indicators were met. • All six indicators have positive or stable trends.
Summary of FY 2017 Indicator Performance
Indicator Name Target Actual Status Trend Timeliness: Reliability of delivery of economic statistics (number of scheduled releases on time)
74 74 Met Positive
Relevance: Customer satisfaction (5 point scale) 4.0 4.2 Exceeded Positive Accuracy: Percent of GDP estimates correct 85% 88% Exceeded Positive Complete all major strategic milestones related to Completed Completed Completed Stable
Exceeded33%
Met67%
Status of FY17 Indicators
Positive50%
Stable50%
Actual Trends of Indicators
BEA - 41
improving economic statistics Successfully Milestones Successfully Milestones met to explore and examine future economic data sources
Evaluate effectiveness of agreements and extend / modify / cancel as appropriate
Two agreements under Negotiation
Met Stable
Milestones met to explore and examine future economic products and datasets
Execute POA&M POA&M Executed Met Stable
Detailed Indicator Plans and Performance
Current / Recurring Indicators Indicator Timeliness: Reliability of delivery of economic statistics (the number of scheduled releases issued on time). Category Key Type Contextual
Description
The importance of data as an ingredient for sound economic decision-making requires BEA to deliver data to decision-makers and other data users not only quickly but also reliably—that is, on schedule. Each fall, BEA publishes a schedule for the release of its economic data the following year; this measure is evaluated as the number of scheduled releases issued on time. BEA has an outstanding record of releasing its economic data on schedule and on time. In FY 2017, BEA exceeded the target of planned releases and has no indication that this target will not be met in 2018.
FY 2012 FY 2013 FY 2014 FY 2015 FY 2016 FY 2017 FY 2018 FY 2019 Target 62 62 62 65 65 74 74 74 Actual 62 62 65 65 74 74 Status (i.e. Exceeded, Met, Not Met)
Met Met Exceeded Met Exceeded Met
Trend Positive Explanation (if Target not met in FY 2017)
N/A
Actions to be Taken / Future Plans BEA has no plans to change this indicator.
Adjustments to Targets
Adjustments to targets have not been made.
Notes None Information Gaps There are no information gaps for this indicator.
Indicator Relevance: Customer satisfaction (on a 5 point scale)
BEA - 42
Category Key Type Customer Service
Description Customer satisfaction is a critical measure of BEA’s ability to provide the types of data that are relevant, accurate, and needed by users. BEA measures the level of customer satisfaction through an on-going online survey of users.
FY 2012 FY 2013 FY 2014 FY 2015 FY 2016 FY 2017 FY 2018 FY 2019 Target 4.0 4.0 4.0 4.0 4.0 4.0 4.0 4.0 Actual 4.3 4.1 4.0 4.0 4.0 4.2 Status Exceeded Exceeded Met Met Met Exceeded Trend Positive Actions to be Taken / Future Plans BEA has no plans to change this indicator.
Adjustments to Targets
Adjustments to targets have not been made.
Notes None Information Gaps There are no information gaps for this indicator. Indicator Accuracy: Percent of GDP estimates correct. Category Key Type Contextual
Description This performance measure tracks BEA’s ability to accurately estimate its most important statistic, gross domestic product (GDP). This measure is a composite index of six indicators of accuracy, applied using three-year rolling averages to develop a single measure of the correctness of the GDP statistics.
FY 2012 FY 2013 FY 2014 FY 2015 FY 2016 FY 2017 FY 2018 FY 2019 Target 85% 83% 83% 83% 83% 85% 85% 85% Actual 87% 84% 86% 87% 89% 88% Status (i.e. Exceeded, Met, Not Met)
Exceeded Exceeded Exceeded Exceeded Exceeded Exceeded
Trend Positive Explanation (if Target not met in FY 2017) N/A
Actions to be taken / Future Plans BEA has no plans to change this indicator.
Adjustments to targets Adjustments to targets have not been made. Notes Availability of the accuracy index will always lag fiscal year reporting since it is tied to GDP release timing. Information Gaps There are no information gaps for this indicator.
BEA - 43
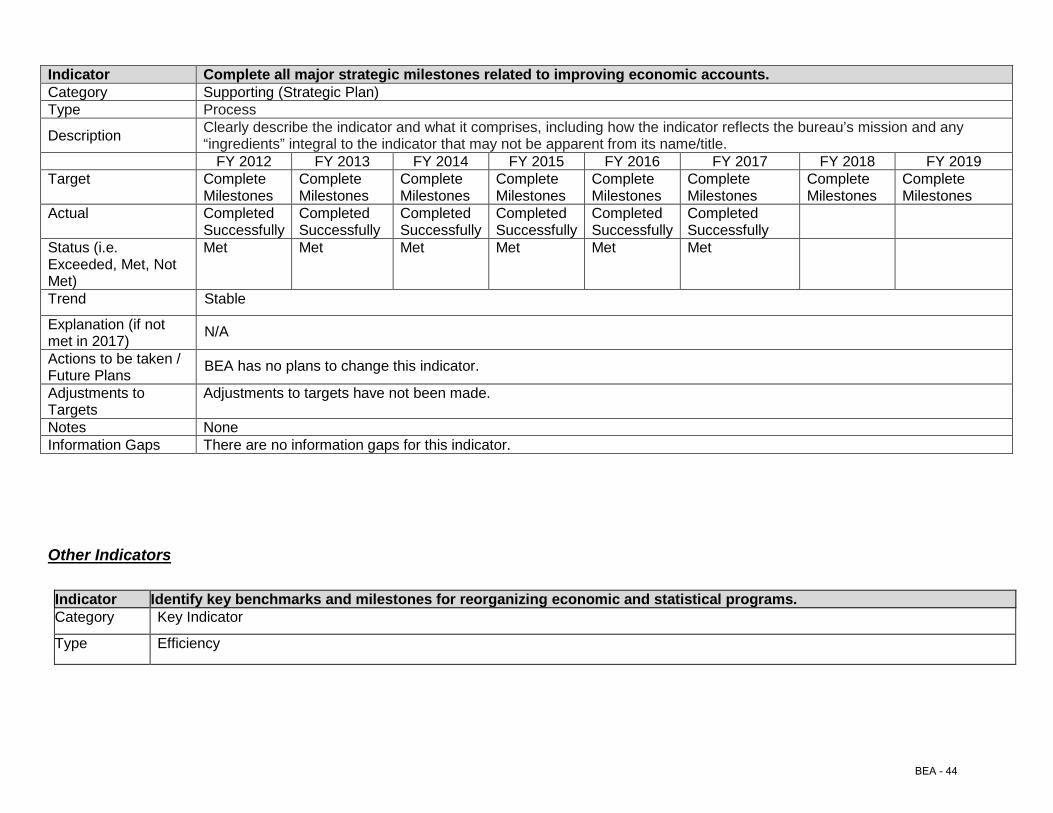
Indicator Complete all major strategic milestones related to improving economic accounts. Category Supporting (Strategic Plan) Type Process
Description Clearly describe the indicator and what it comprises, including how the indicator reflects the bureau’s mission and any “ingredients” integral to the indicator that may not be apparent from its name/title.
FY 2012 FY 2013 FY 2014 FY 2015 FY 2016 FY 2017 FY 2018 FY 2019 Target Complete
Milestones Complete Milestones
Complete Milestones
Complete Milestones
Complete Milestones
Complete Milestones
Complete Milestones
Complete Milestones
Actual Completed Successfully
Completed Successfully
Completed Successfully
Completed Successfully
Completed Successfully
Completed Successfully
Status (i.e. Exceeded, Met, Not Met)
Met Met Met Met Met Met
Trend Stable
Explanation (if not met in 2017) N/A
Actions to be taken / Future Plans BEA has no plans to change this indicator.
Adjustments to Targets
Adjustments to targets have not been made.
Notes None Information Gaps There are no information gaps for this indicator. Other Indicators
Indicator Identify key benchmarks and milestones for reorganizing economic and statistical programs. Category Key Indicator
Type Efficiency
BEA - 44
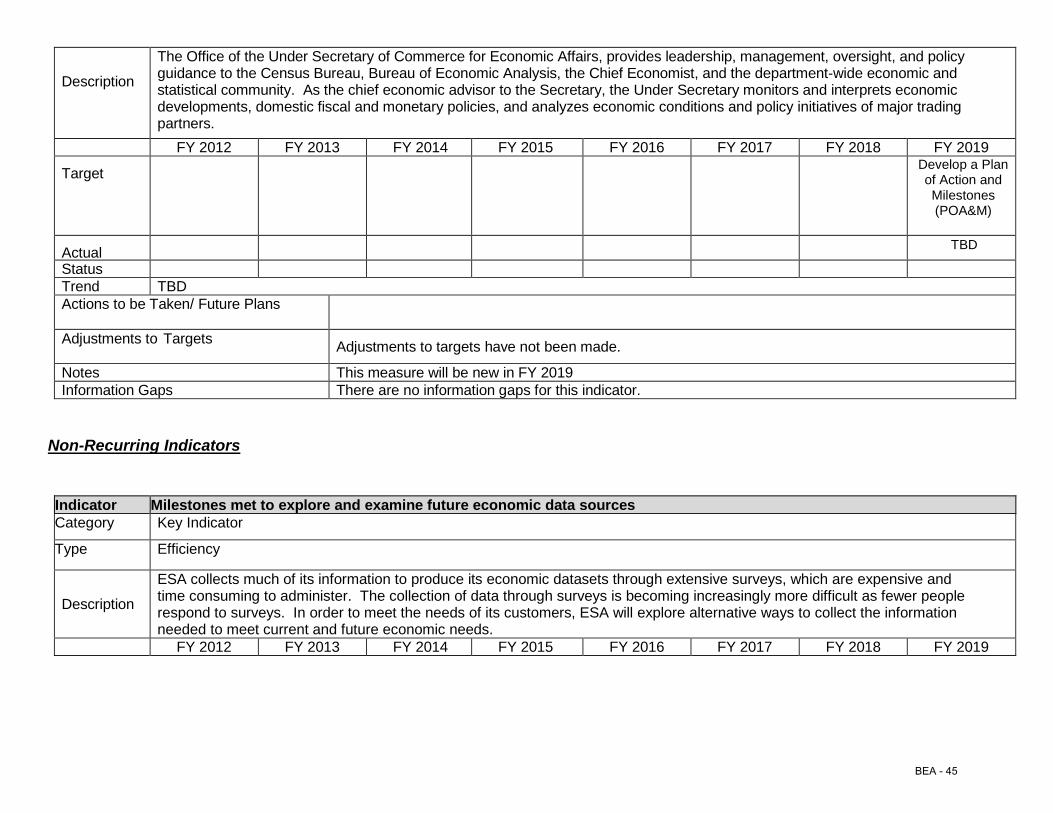
Description
The Office of the Under Secretary of Commerce for Economic Affairs, provides leadership, management, oversight, and policy guidance to the Census Bureau, Bureau of Economic Analysis, the Chief Economist, and the department-wide economic and statistical community. As the chief economic advisor to the Secretary, the Under Secretary monitors and interprets economic developments, domestic fiscal and monetary policies, and analyzes economic conditions and policy initiatives of major trading partners.
FY 2012 FY 2013 FY 2014 FY 2015 FY 2016 FY 2017 FY 2018 FY 2019
Target Develop a Plan of Action and Milestones (POA&M)
Actual TBD
Status Trend TBD Actions to be Taken/ Future Plans
Adjustments to Targets Adjustments to targets have not been made.
Notes This measure will be new in FY 2019 Information Gaps There are no information gaps for this indicator.
Non-Recurring Indicators
Indicator Milestones met to explore and examine future economic data sources Category Key Indicator
Type Efficiency
Description
ESA collects much of its information to produce its economic datasets through extensive surveys, which are expensive and time consuming to administer. The collection of data through surveys is becoming increasingly more difficult as fewer people respond to surveys. In order to meet the needs of its customers, ESA will explore alternative ways to collect the information needed to meet current and future economic needs.
FY 2012 FY 2013 FY 2014 FY 2015 FY 2016 FY 2017 FY 2018 FY 2019
BEA - 45
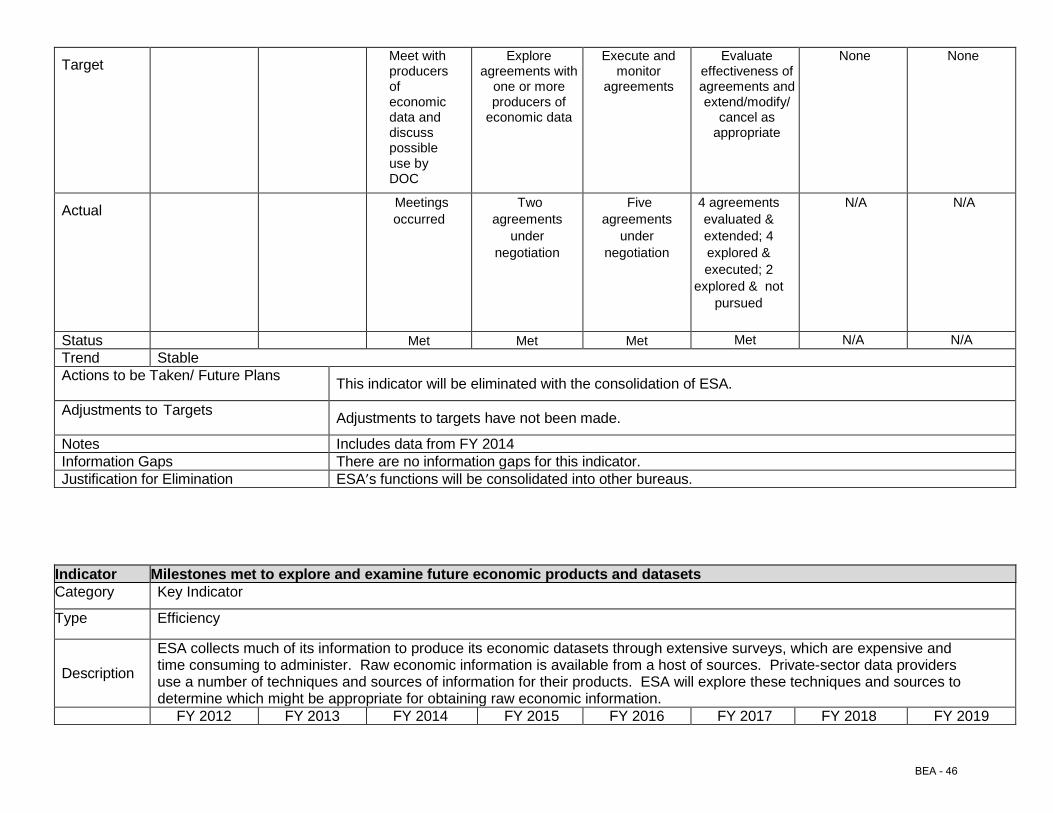
Target Meet with producers of economic data and discuss possible use by DOC
Explore agreements with
one or more producers of
economic data
Execute and monitor
agreements
Evaluate effectiveness of agreements and extend/modify/
cancel as appropriate
None None
Actual Meetings occurred
Two agreements
under negotiation
Five agreements
under negotiation
4 agreements evaluated & extended; 4 explored & executed; 2
explored & not pursued
N/A N/A
Status Met Met Met Met N/A N/A Trend Stable Actions to be Taken/ Future Plans This indicator will be eliminated with the consolidation of ESA.
Adjustments to Targets Adjustments to targets have not been made.
Notes Includes data from FY 2014 Information Gaps There are no information gaps for this indicator. Justification for Elimination ESA’s functions will be consolidated into other bureaus.
Indicator Milestones met to explore and examine future economic products and datasets Category Key Indicator
Type Efficiency
Description
ESA collects much of its information to produce its economic datasets through extensive surveys, which are expensive and time consuming to administer. Raw economic information is available from a host of sources. Private-sector data providers use a number of techniques and sources of information for their products. ESA will explore these techniques and sources to determine which might be appropriate for obtaining raw economic information.
FY 2012 FY 2013 FY 2014 FY 2015 FY 2016 FY 2017 FY 2018
FY 2019
BEA - 46
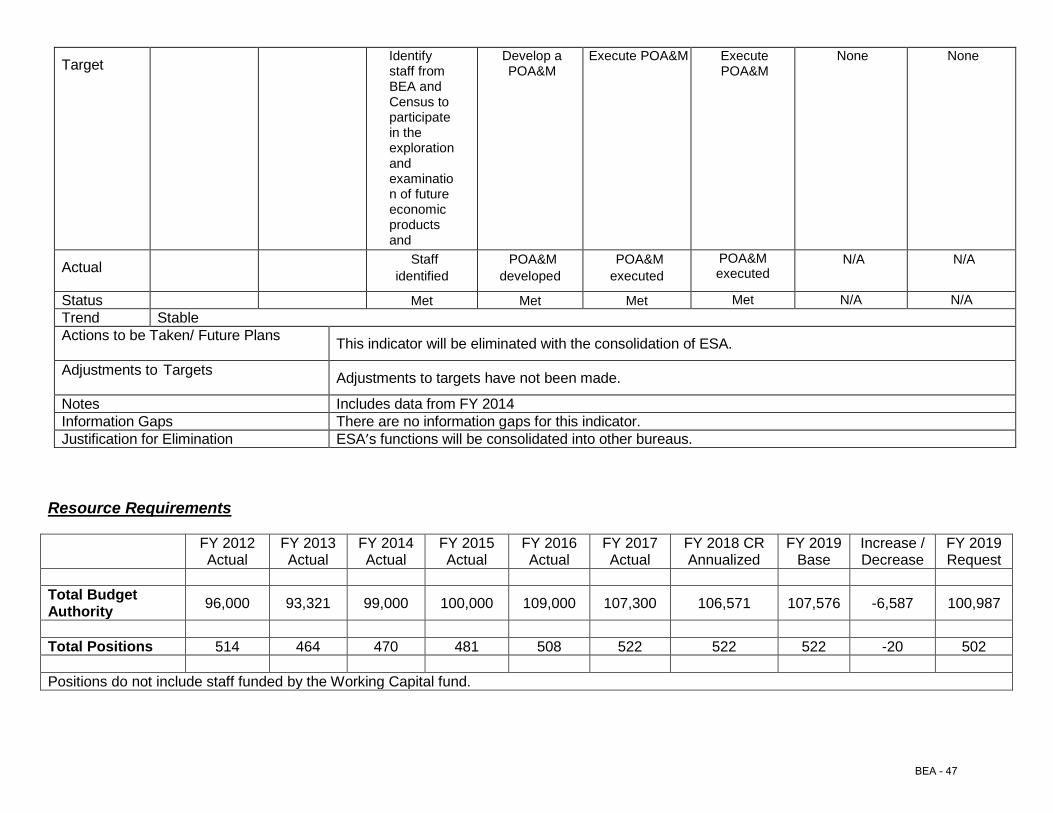
Target Identify staff from BEA and Census to participate in the exploration and examination of future economic products and
Develop a POA&M
Execute POA&M Execute POA&M
None None
Actual Staff identified
POA&M developed
POA&M executed
POA&M executed
N/A N/A
Status Met Met Met Met N/A N/A Trend Stable Actions to be Taken/ Future Plans This indicator will be eliminated with the consolidation of ESA.
Adjustments to Targets Adjustments to targets have not been made.
Notes Includes data from FY 2014 Information Gaps There are no information gaps for this indicator. Justification for Elimination ESA’s functions will be consolidated into other bureaus.
Resource Requirements
FY 2012 Actual
FY 2013 Actual
FY 2014 Actual
FY 2015 Actual
FY 2016 Actual
FY 2017 Actual
FY 2018 CR Annualized
FY 2019 Base
Increase / Decrease
FY 2019 Request
Total Budget Authority 96,000 93,321 99,000 100,000 109,000 107,300 106,571 107,576 -6,587 100,987
Total Positions 514 464 470 481 508 522 522 522 -20 502 Positions do not include staff funded by the Working Capital fund.
BEA - 47

Last Page
BEA - 48