Embed Size (px)
Citation preview
U.S. Delivered Electric Energy Intensity: Are 20-Year Trends Sustainable?
Vanessa Schweizer Department of Engineering & Public Policy
Summer 2008 ORISE Postgraduate Researcher, NETL
[email protected] December 5, 2008
2008 USAEE/IAEE North American Conference
1
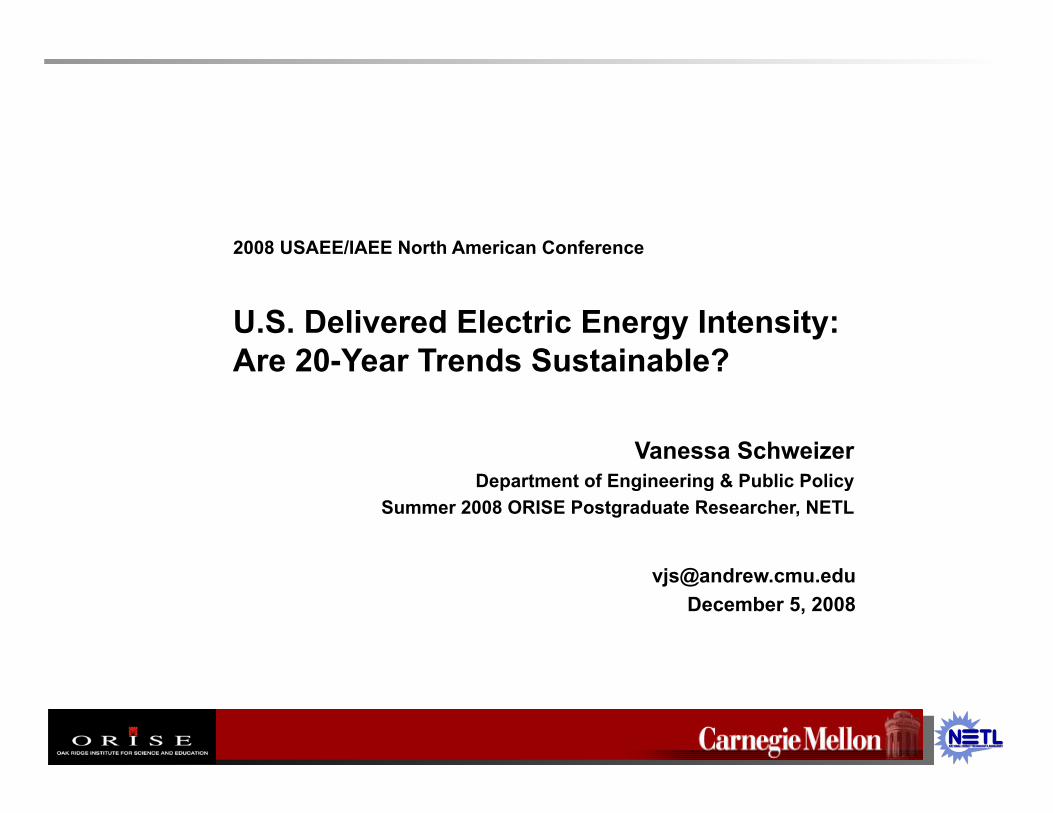
Overview
• Why think beyond aggregate energy intensity?
• U.S. Energy Intensity Indicators, DOE Office of Energy Efficiency and Renewable Energy (EERE)
• Findings for delivered electric energy intensity and implications – Historical ~20-year trends, 1985-2004 – Projected ~20-year trends, 2006-2030
(AEO ‘08 reference case – industrial sector)
2
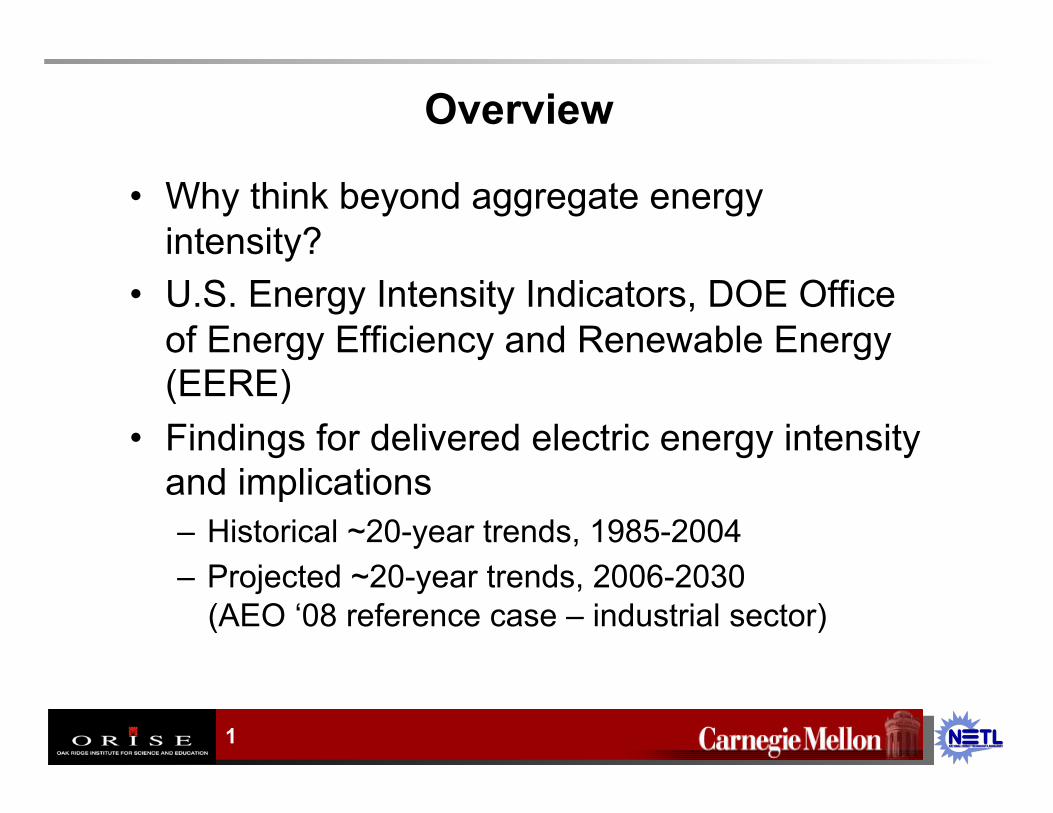
Beyond aggregate intensity
• Improvements to delivered electric energy intensity are about half that of primary energy intensity.
• Trends for delivered electricity consumption differ by sector.
€
BtuTotal$TotalGDP
=BtuResidential + BtuCommercial + BtuIndustrial + BtuTransportation$ResidentialGDP + $CommercialGDP + $IndustrialGDP + $TransportationGDP
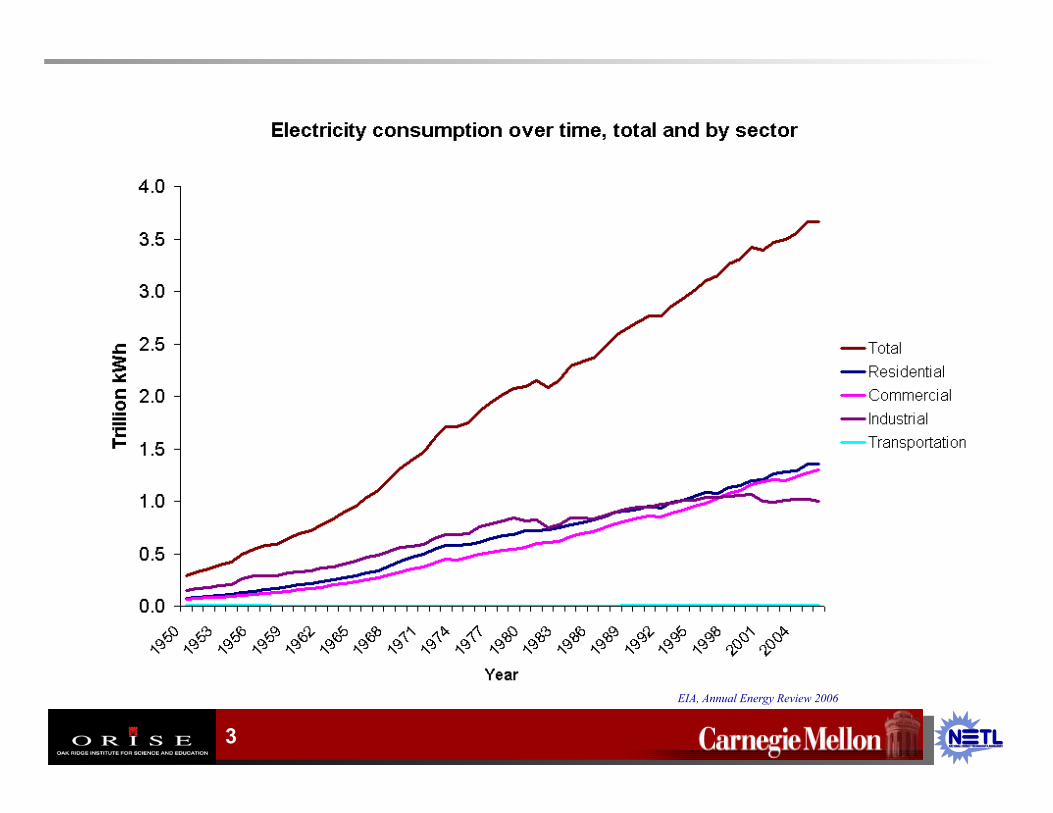
3
EIA, Annual Energy Review 2006
4
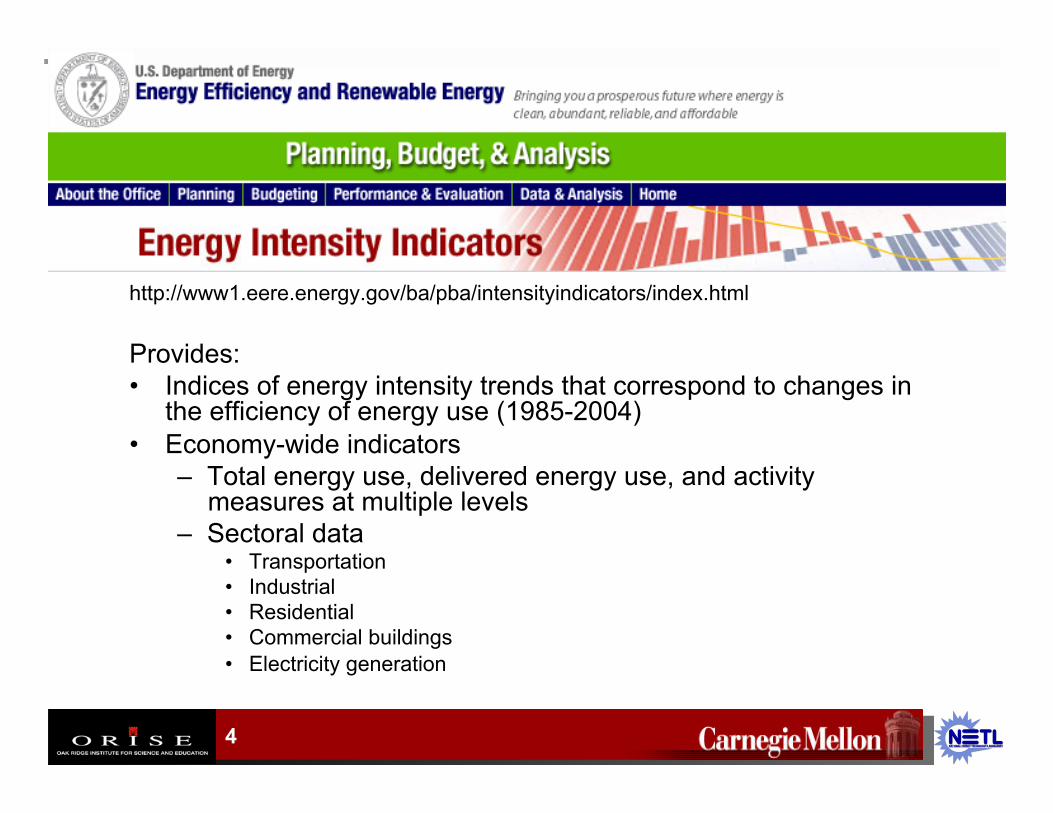
http://www1.eere.energy.gov/ba/pba/intensityindicators/index.html
Provides: • Indices of energy intensity trends that correspond to changes in
the efficiency of energy use (1985-2004) • Economy-wide indicators
– Total energy use, delivered energy use, and activity measures at multiple levels
– Sectoral data • Transportation • Industrial • Residential • Commercial buildings • Electricity generation
5
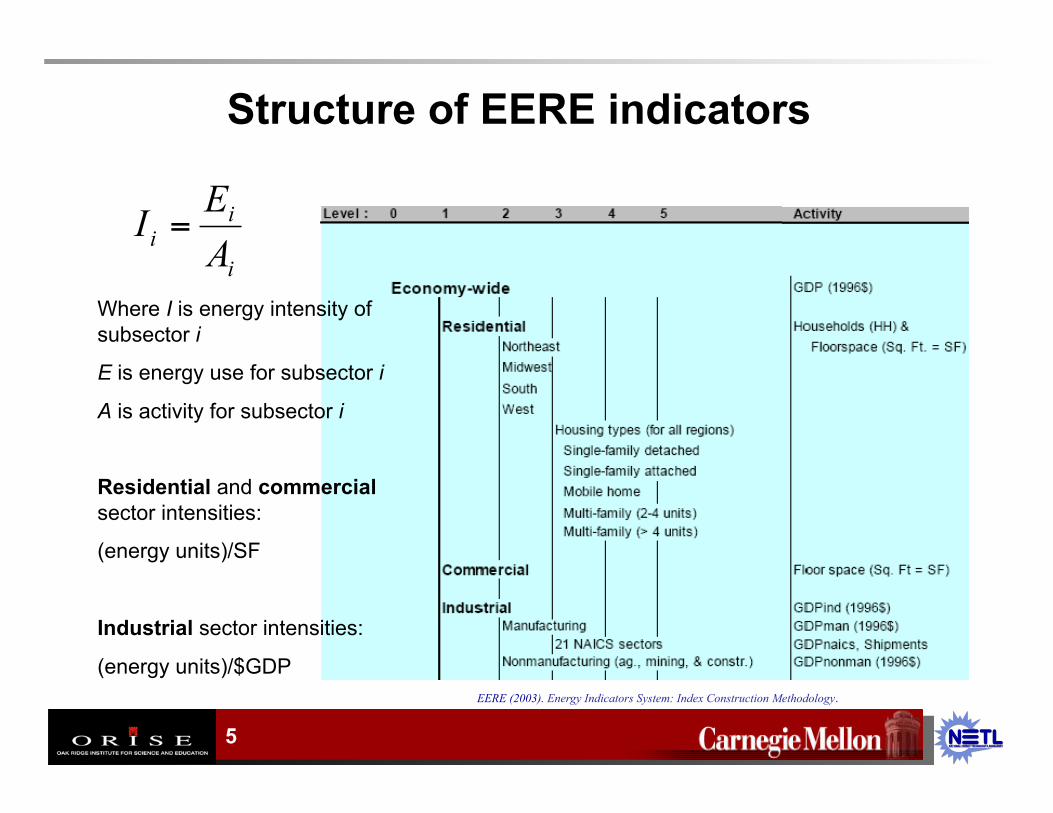
Structure of EERE indicators
Where I is energy intensity of subsector i
E is energy use for subsector i
A is activity for subsector i
Residential and commercial sector intensities:
(energy units)/SF
Industrial sector intensities:
(energy units)/$GDP
i
ii AEI =
EERE (2003). Energy Indicators System: Index Construction Methodology.
6
Why use indices?
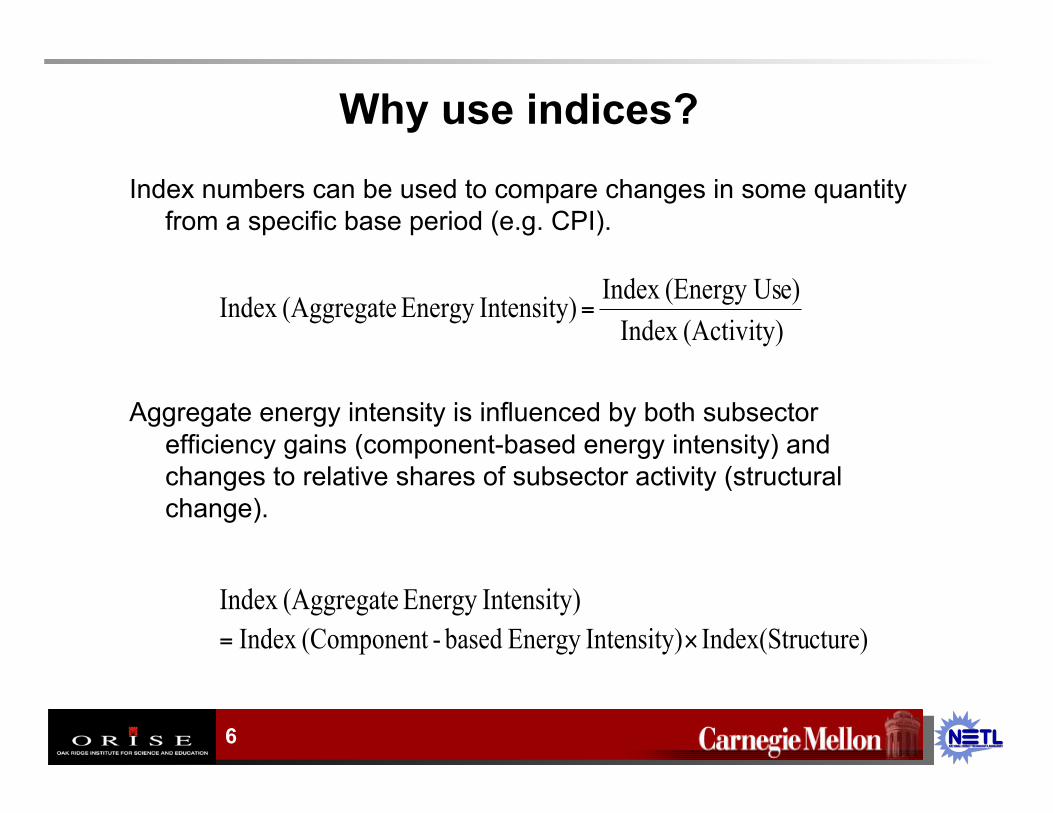
Index numbers can be used to compare changes in some quantity from a specific base period (e.g. CPI).
Aggregate energy intensity is influenced by both subsector efficiency gains (component-based energy intensity) and changes to relative shares of subsector activity (structural change).
(Activity)Index e)(Energy UsIndex Intensity)Energy (AggregateIndex =
cture)Index(StruIntensity)Energy based-(ComponentIndex ×=Intensity)Energy (AggregateIndex
Findings for 20-year trends for delivered electric energy intensity and
their implications
7
8
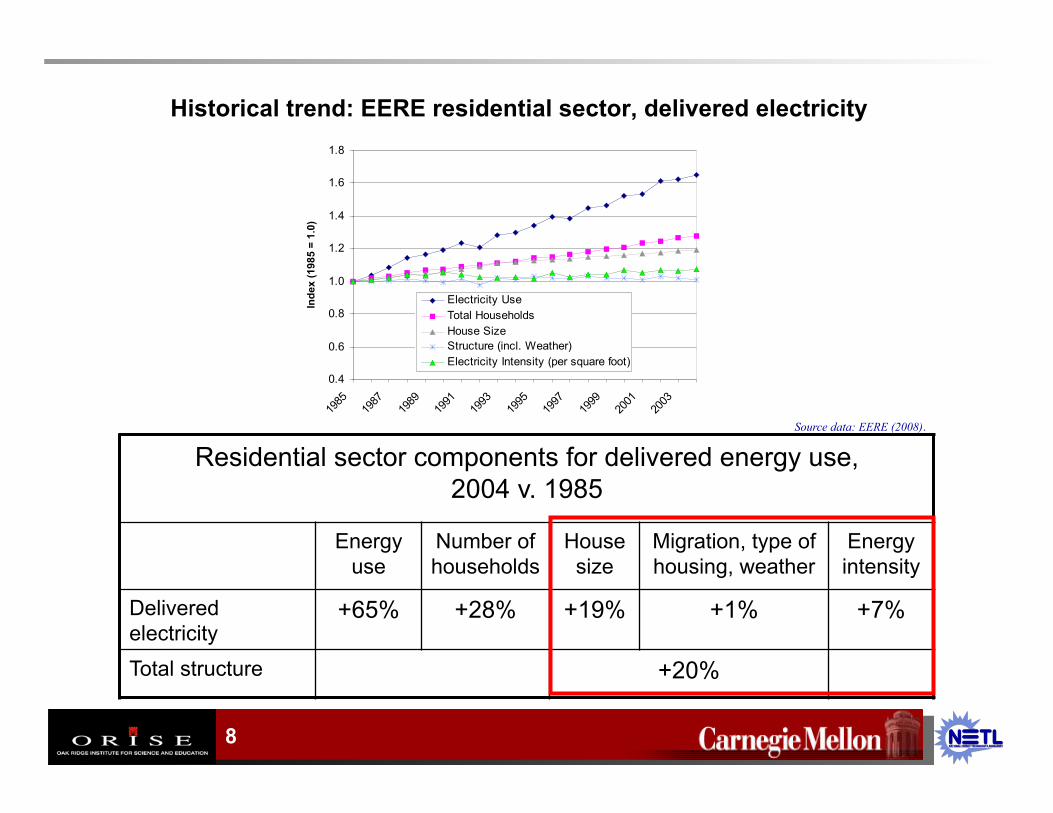
Historical trend: EERE residential sector, delivered electricity
Residential sector components for delivered energy use, 2004 v. 1985
Energy use
Number of households
House size
Migration, type of housing, weather
Energy intensity
Delivered electricity
+65% +28% +19% +1% +7%
Total structure +20%
0.4
0.6
0.8
1.0
1.2
1.4
1.6
1.8
1985
1987
1989
1991
1993
1995
1997
1999
2001
2003
Inde
x (1
985
= 1.
0)Electricity UseTotal HouseholdsHouse SizeStructure (incl. Weather)Electricity Intensity (per square foot)
Source data: EERE (2008).
9
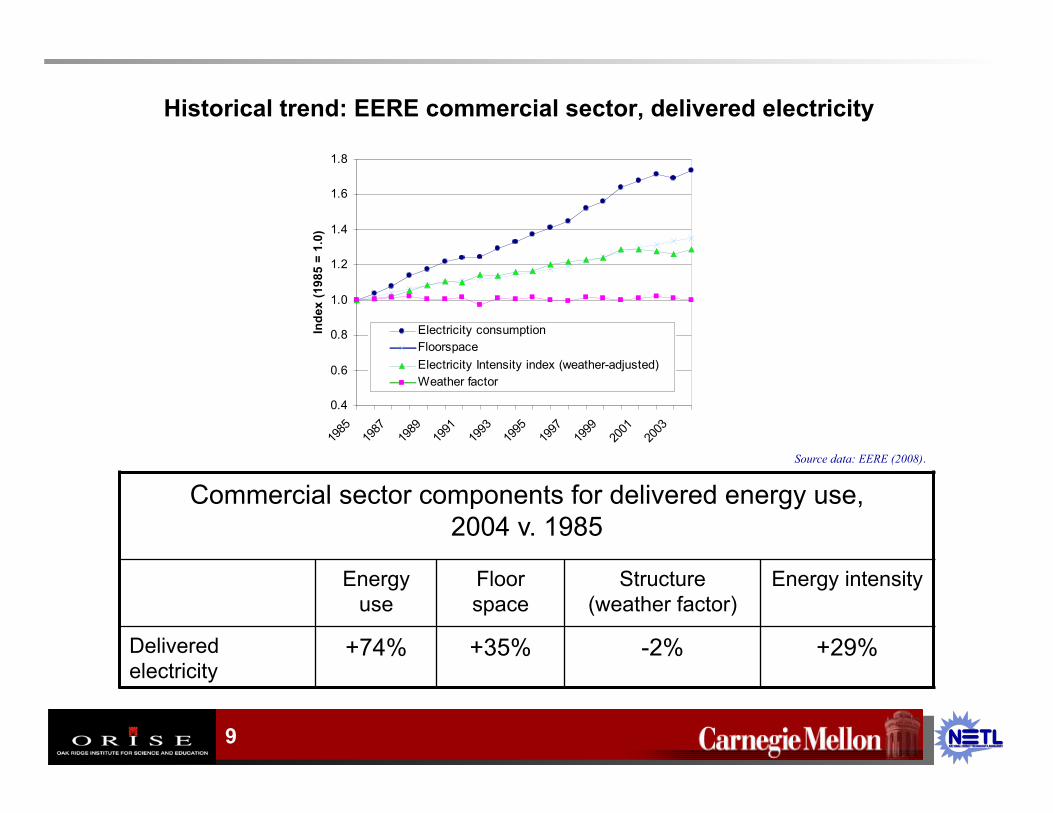
Historical trend: EERE commercial sector, delivered electricity
Commercial sector components for delivered energy use, 2004 v. 1985
Energy use
Floor space
Structure (weather factor)
Energy intensity
Delivered electricity
+74% +35% -2% +29%
0.4
0.6
0.8
1.0
1.2
1.4
1.6
1.8
1985
1987
1989
1991
1993
1995
1997
1999
2001
2003
Inde
x (1
985
= 1.
0)Electricity consumptionFloorspaceElectricity Intensity index (weather-adjusted)Weather factor
Source data: EERE (2008).
10
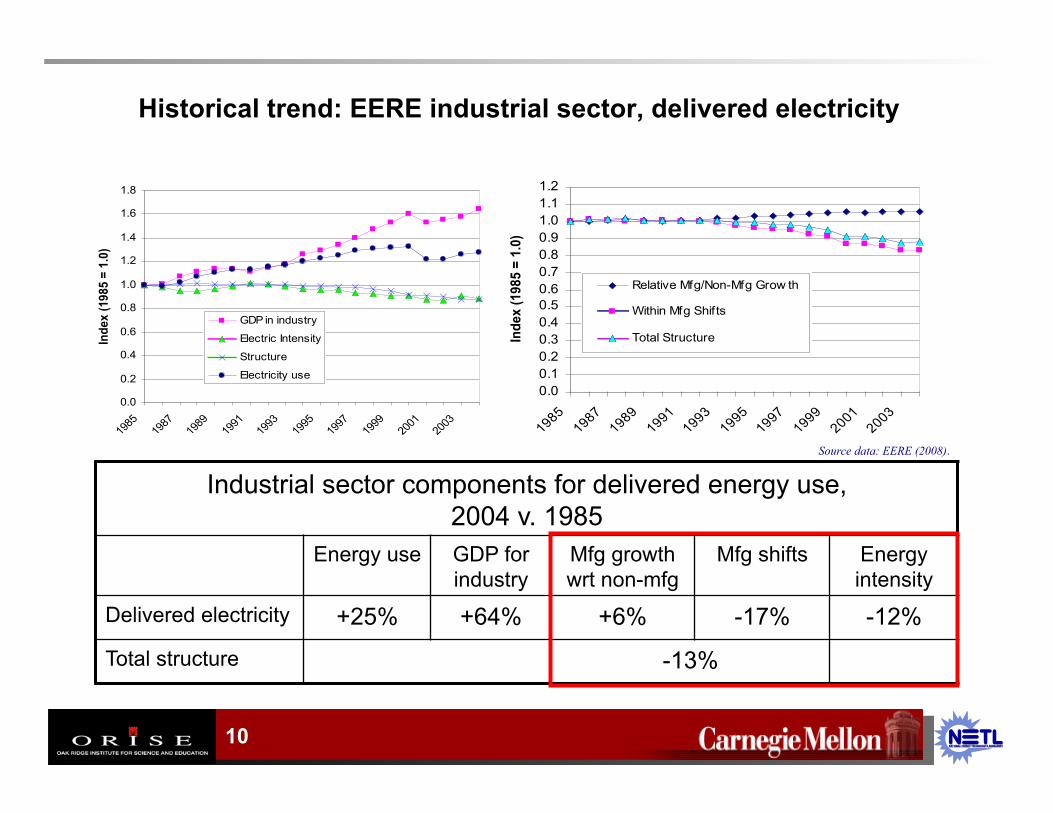
Historical trend: EERE industrial sector, delivered electricity
Industrial sector components for delivered energy use, 2004 v. 1985
Energy use GDP for industry
Mfg growth wrt non-mfg
Mfg shifts Energy intensity
Delivered electricity +25% +64% +6% -17% -12%
Total structure -13%
0.0
0.2
0.4
0.6
0.8
1.0
1.2
1.4
1.6
1.8
1985
1987
1989
1991
1993
1995
1997
1999
2001
2003
Inde
x (1
985
= 1.
0)
GDP in industry
Electric Intensity
Structure
Electricity use0.00.10.20.30.40.50.60.70.80.91.01.11.2
19851987
19891991
19931995
19971999
20012003
Inde
x (1
985
= 1.
0)
Relative Mfg/Non-Mfg Grow th
Within Mfg Shifts
Total Structure
Source data: EERE (2008).
11
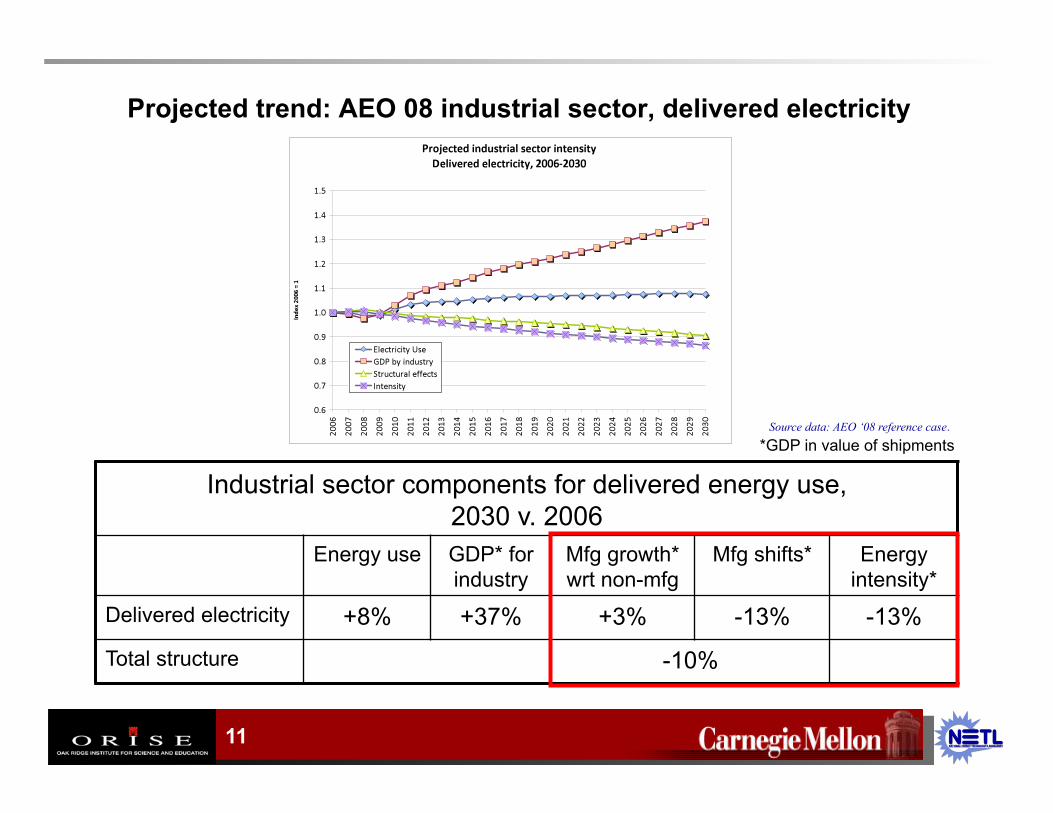
Projected trend: AEO 08 industrial sector, delivered electricity
Industrial sector components for delivered energy use, 2030 v. 2006
Energy use GDP* for industry
Mfg growth* wrt non-mfg
Mfg shifts* Energy intensity*
Delivered electricity +8% +37% +3% -13% -13%
Total structure -10%
*GDP in value of shipments Source data: AEO ‘08 reference case.
12
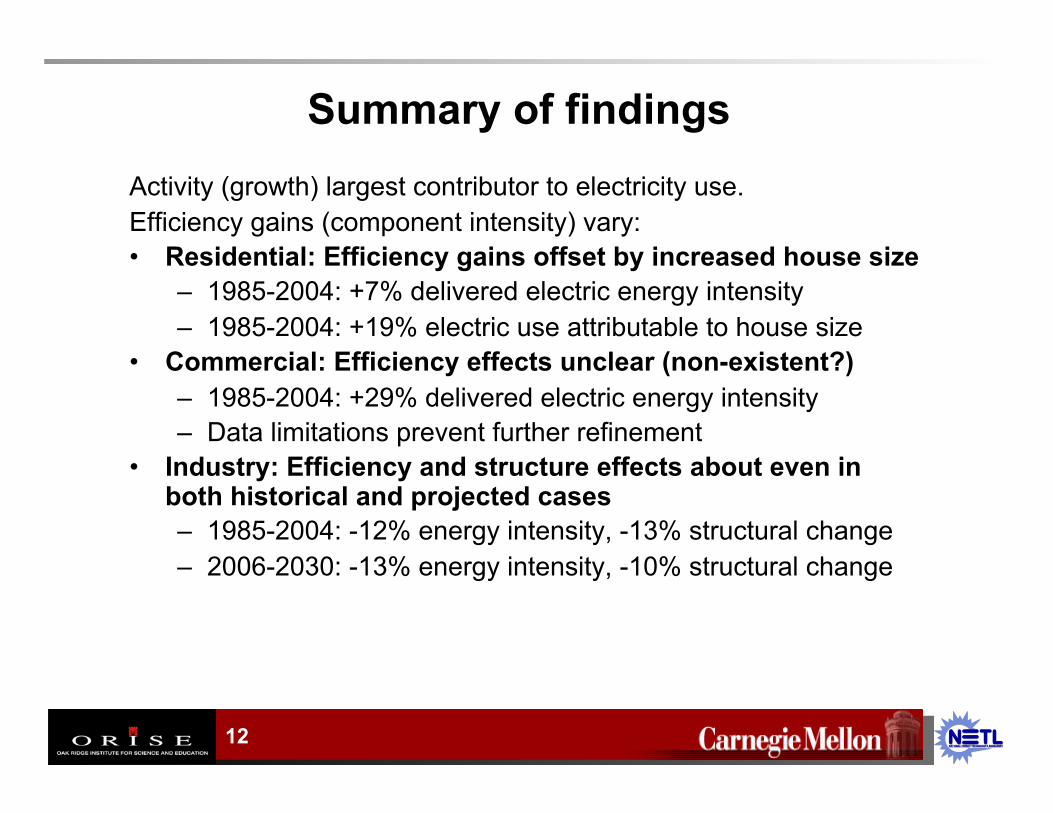
Summary of findings Activity (growth) largest contributor to electricity use. Efficiency gains (component intensity) vary: • Residential: Efficiency gains offset by increased house size
– 1985-2004: +7% delivered electric energy intensity – 1985-2004: +19% electric use attributable to house size
• Commercial: Efficiency effects unclear (non-existent?) – 1985-2004: +29% delivered electric energy intensity – Data limitations prevent further refinement
• Industry: Efficiency and structure effects about even in both historical and projected cases – 1985-2004: -12% energy intensity, -13% structural change – 2006-2030: -13% energy intensity, -10% structural change
Conclusions
• It appears that fewer gains in delivered electric energy efficiency have been achieved in the residential and commercial buildings sectors.
• In the residential sector, this analysis suggests that structural policy interventions with respect to housing size should be considered.
• Indexing methods: An underutilized tool? – Can be applied to projections from detailed models to enable
comparison with historical trends.
13
14
References Ang B.W. & Zhang, F.Q. 2000, A survey of index decomposition analysis in
energy and environmental studies. Energy, 25, 1149-1176. EERE 2008, Energy Intensity Indicators, viewed 30 June 2008. http://
www1.eere.energy.gov/ba/pba/intensityindicators/ EERE 2003, Energy Indicators System: Index Construction Methodolgy,
viewed 30 June 2008. http://www1.eere.energy.gov/ba/pba/intensityindicators/methodology.html
Liu, N & Ang, B.W. 2007, Factors shaping aggregate energy intensity trend for industry: Energy intensity versus product mix. Energy Economics, 29, 609-635.
Roop J.M. et al., January 2002, Indicators of Energy Intensity in the Economy: A Proposed Methodology, paper presented at the conference of experts convened to settle on appropriate methodology for indicators.
15
Backup slides
16
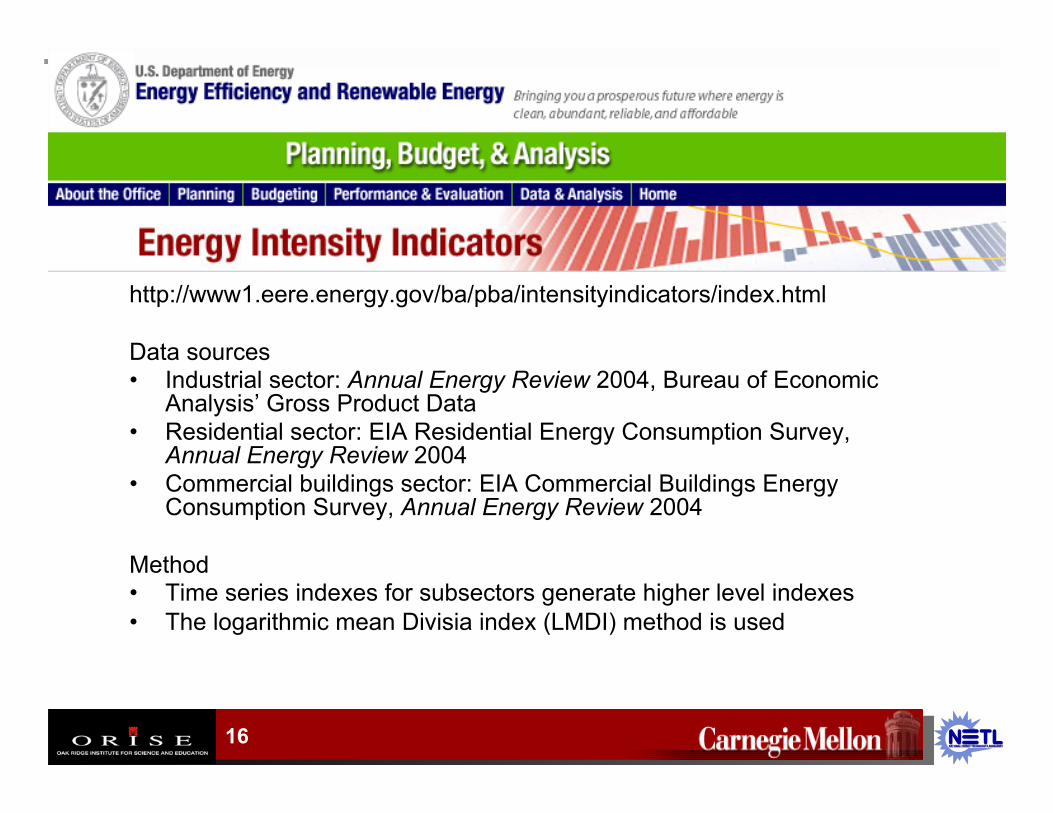
http://www1.eere.energy.gov/ba/pba/intensityindicators/index.html
Data sources • Industrial sector: Annual Energy Review 2004, Bureau of Economic
Analysis’ Gross Product Data • Residential sector: EIA Residential Energy Consumption Survey,
Annual Energy Review 2004 • Commercial buildings sector: EIA Commercial Buildings Energy
Consumption Survey, Annual Energy Review 2004
Method • Time series indexes for subsectors generate higher level indexes • The logarithmic mean Divisia index (LMDI) method is used
17
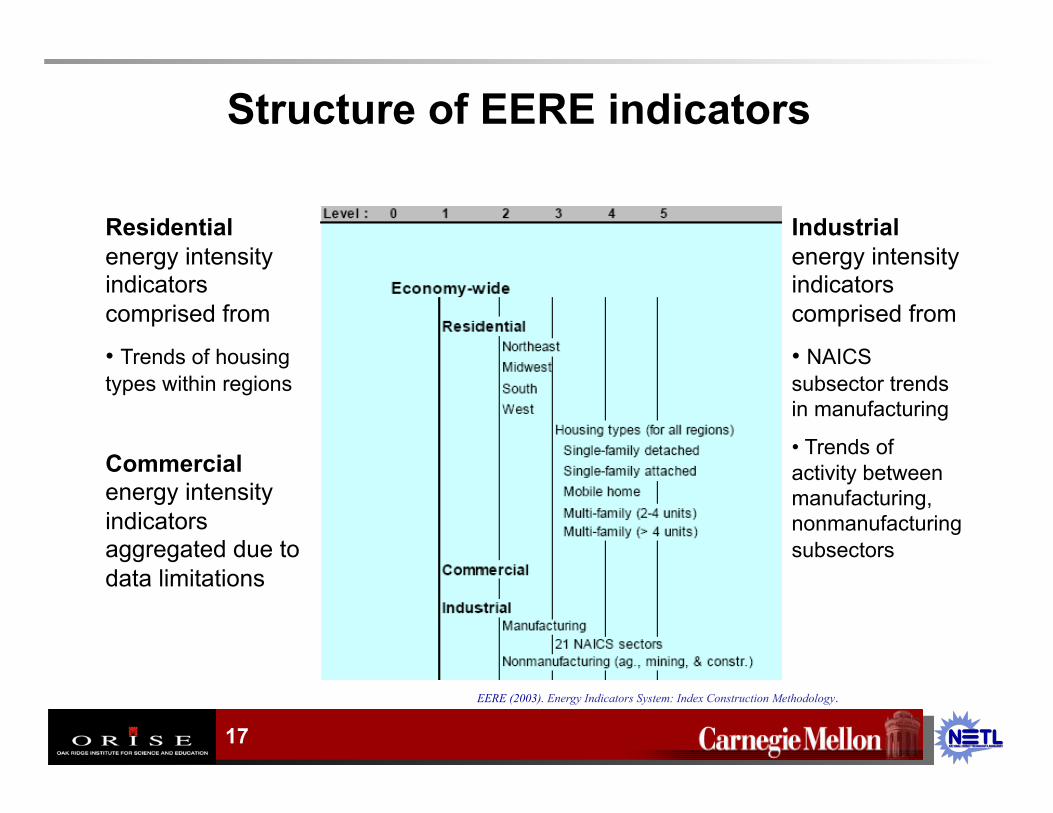
Structure of EERE indicators
Residential energy intensity indicators comprised from
• Trends of housing types within regions
Commercial energy intensity indicators aggregated due to data limitations
Industrial energy intensity indicators comprised from
• NAICS subsector trends in manufacturing
• Trends of activity between manufacturing, nonmanufacturing subsectors
EERE (2003). Energy Indicators System: Index Construction Methodology.
18
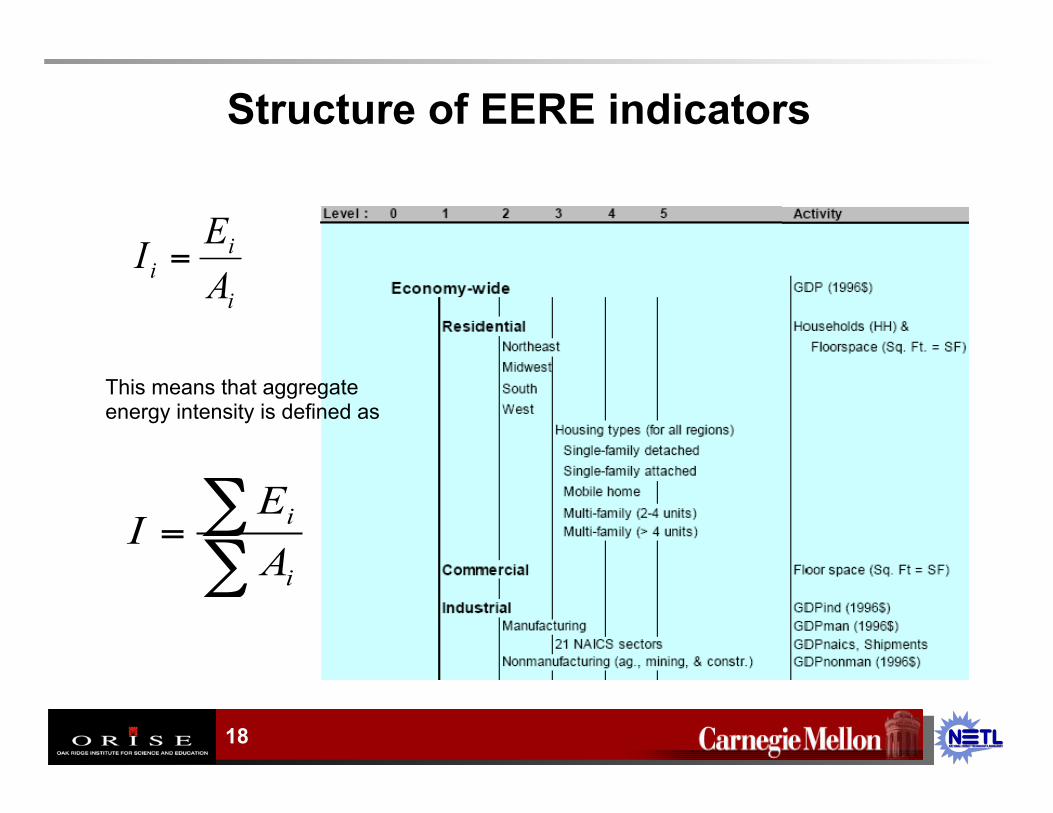
Structure of EERE indicators
This means that aggregate energy intensity is defined as
i
ii AEI =
∑∑=
i
i
AE
I
19
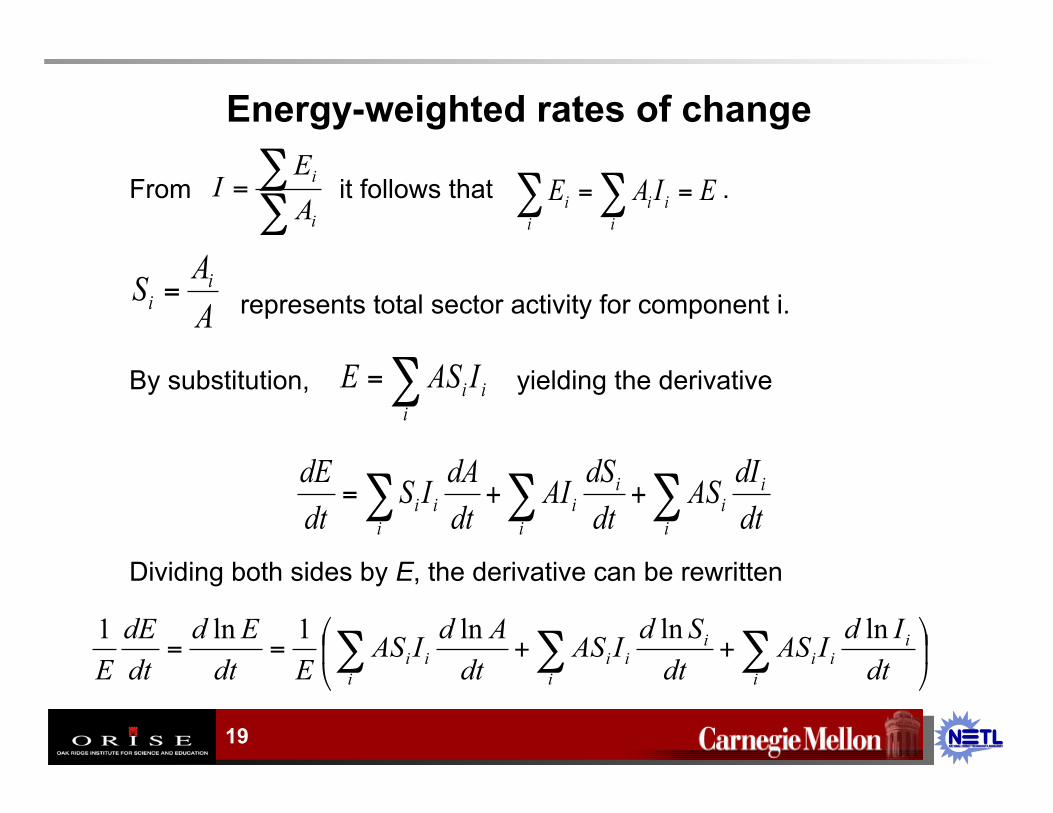
Energy-weighted rates of change
From it follows that .
represents total sector activity for component i.
By substitution, yielding the derivative
Dividing both sides by E, the derivative can be rewritten
∑ ∑ ∑++=i i i
ii
iiii dt
dIASdtdSAI
dtdAIS
dtdE
∑∑=
i
i
AE
I EIAEi i
iii ==∑ ∑
AAS i
i =
∑=i
ii IASE
++== ∑ ∑ ∑
i i i
iii
iiiii dt
IdIASdtSdIAS
dtAdIAS
EdtEd
dtdE
Elnlnln1ln1
20
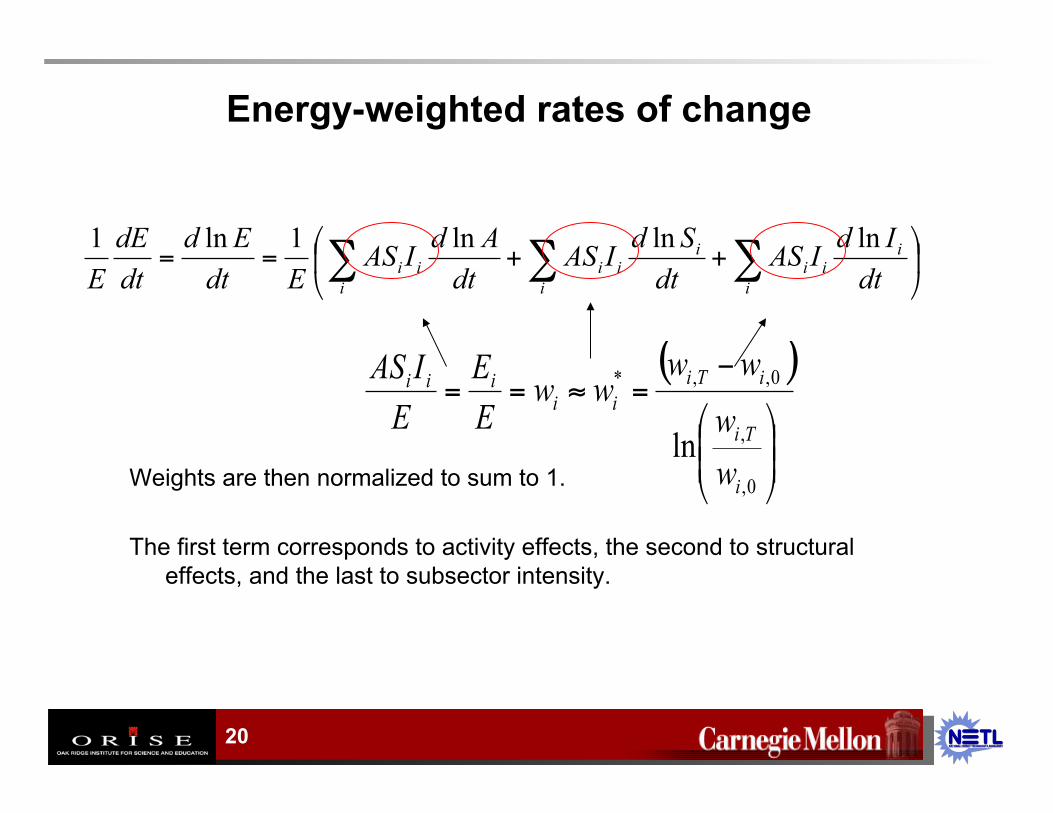
Energy-weighted rates of change
Weights are then normalized to sum to 1.
The first term corresponds to activity effects, the second to structural effects, and the last to subsector intensity.
( )
−=≈==
0,
,
0,,*
lni
Ti
iTiii
iii
wwww
wwEE
EIAS
++== ∑ ∑ ∑
i i i
iii
iiiii dt
IdIASdtSdIAS
dtAdIAS
EdtEd
dtdE
Elnlnln1ln1
21
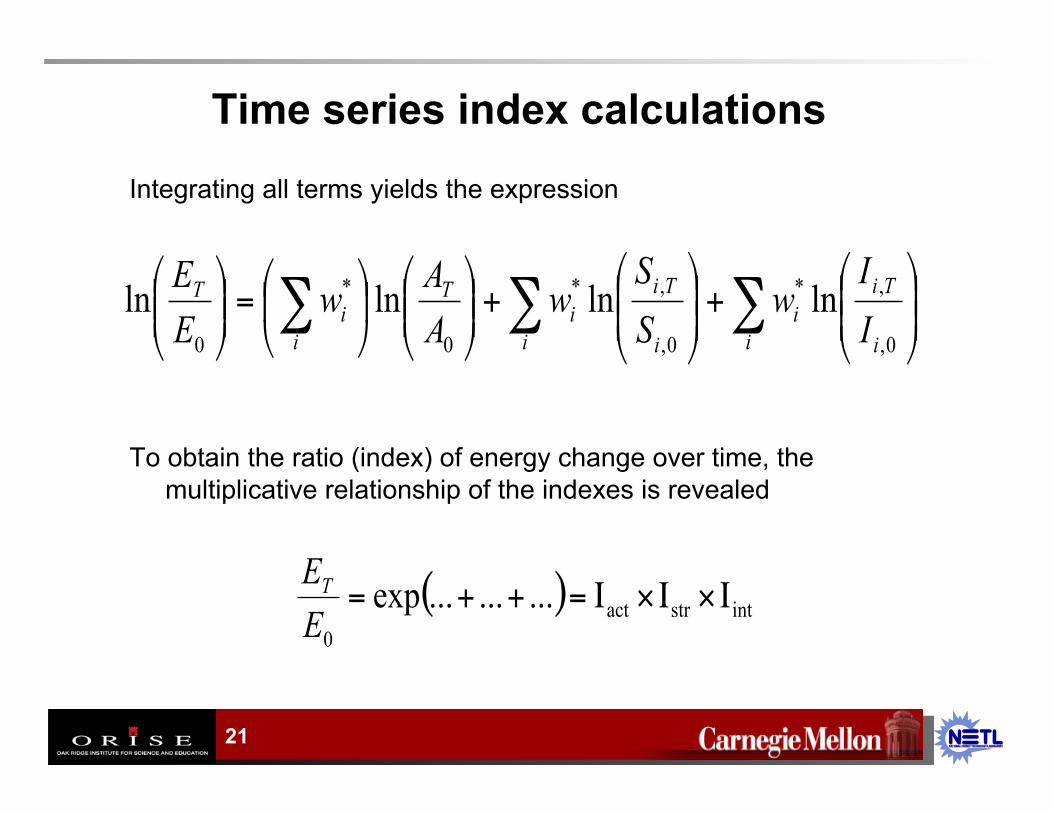
Time series index calculations
Integrating all terms yields the expression
To obtain the ratio (index) of energy change over time, the multiplicative relationship of the indexes is revealed
∑ ∑∑
+
+
=
i i i
Tii
i
Tii
T
ii
T
II
wSS
wAAw
EE
0,
,*
0,
,*
0
*
0
lnlnlnln
( ) intstract0
.........exp Ι×Ι×Ι=++=EET
22
Detail on the LMDI method The Divisia index • Can yield a chain-weighted assessment of changes to aggregate
intensity over time • Assumes that data vary in more or less a continuous fashion when
logarithmic-mean weighting is used • Permits variable weighting over time • Permits multiplicative or additive decomposition of relative growth rates • Does not introduce residual terms (allows perfect decomposition) when
logarithmic-mean weighting is used
23
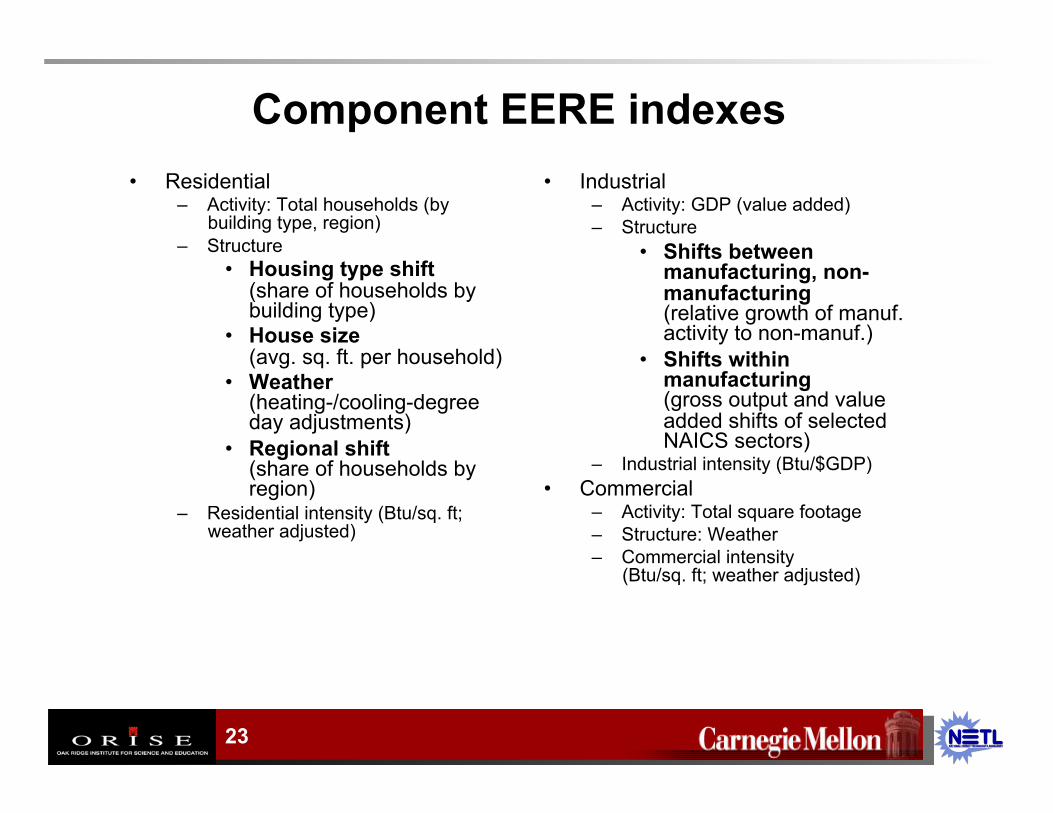
Component EERE indexes • Residential
– Activity: Total households (by building type, region)
– Structure • Housing type shift
(share of households by building type)
• House size (avg. sq. ft. per household)
• Weather (heating-/cooling-degree day adjustments)
• Regional shift (share of households by region)
– Residential intensity (Btu/sq. ft; weather adjusted)
• Industrial – Activity: GDP (value added) – Structure
• Shifts between manufacturing, non-manufacturing (relative growth of manuf. activity to non-manuf.)
• Shifts within manufacturing (gross output and value added shifts of selected NAICS sectors)
– Industrial intensity (Btu/$GDP) • Commercial
– Activity: Total square footage – Structure: Weather – Commercial intensity
(Btu/sq. ft; weather adjusted)
24
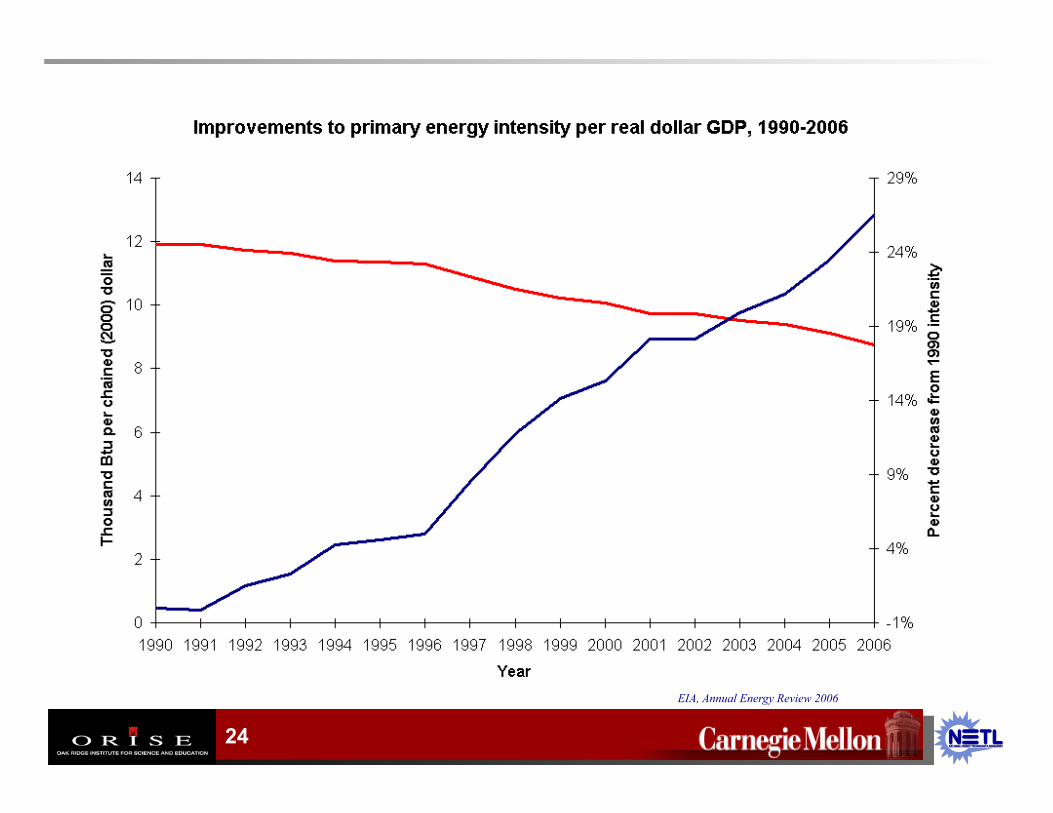
EIA, Annual Energy Review 2006
25
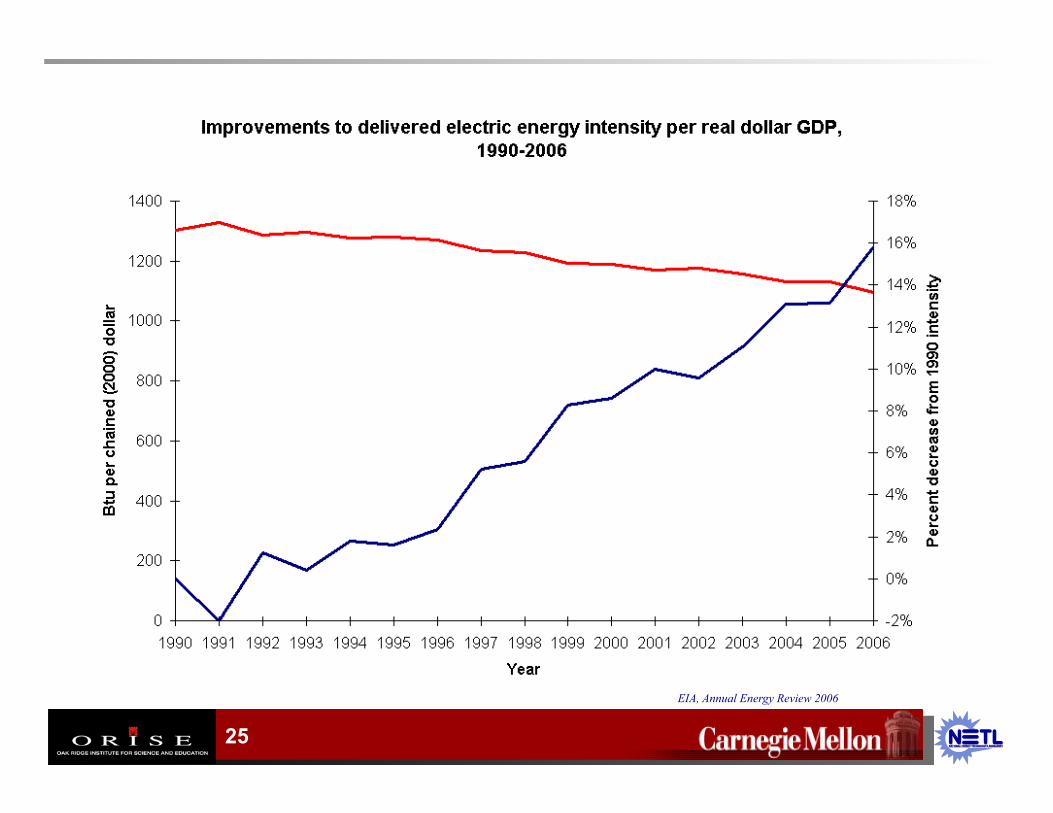
EIA, Annual Energy Review 2006
26
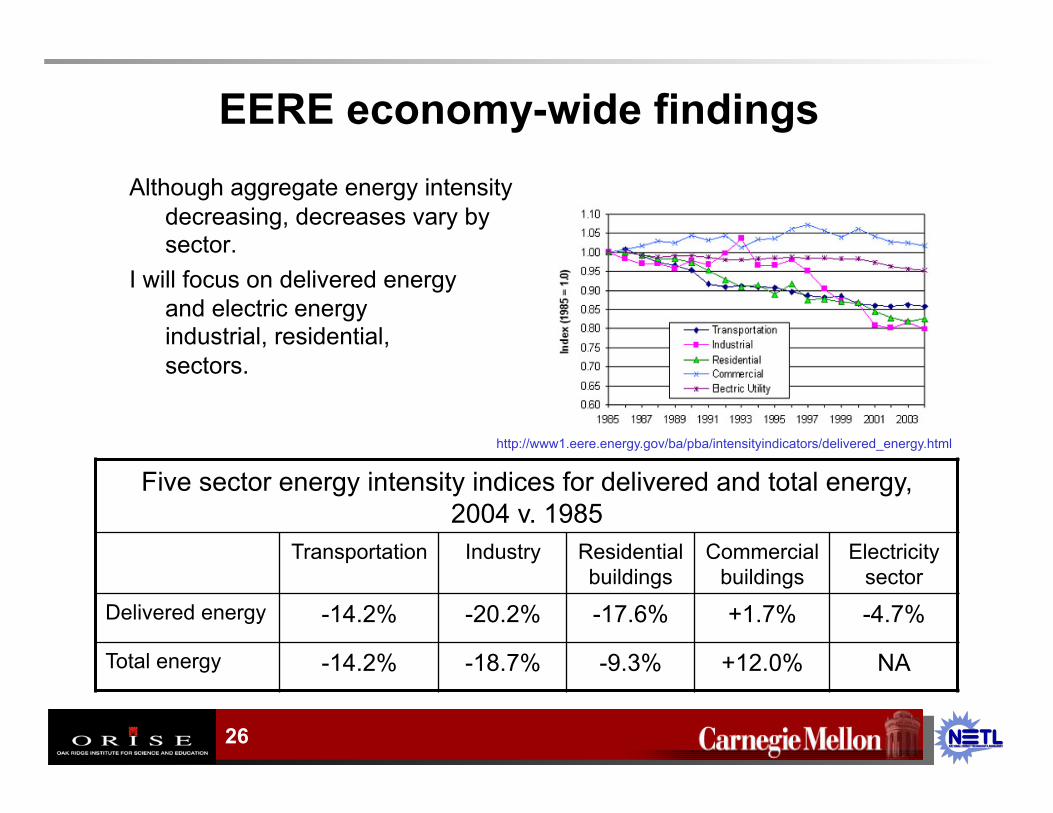
EERE economy-wide findings Although aggregate energy intensity
decreasing, decreases vary by sector.
I will focus on delivered energy intensity and electric energy intensity for industrial, residential, and commercial sectors.
Five sector energy intensity indices for delivered and total energy, 2004 v. 1985
Transportation Industry Residential buildings
Commercial buildings
Electricity sector
Delivered energy -14.2% -20.2% -17.6% +1.7% -4.7%
Total energy -14.2% -18.7% -9.3% +12.0% NA
http://www1.eere.energy.gov/ba/pba/intensityindicators/delivered_energy.html
27
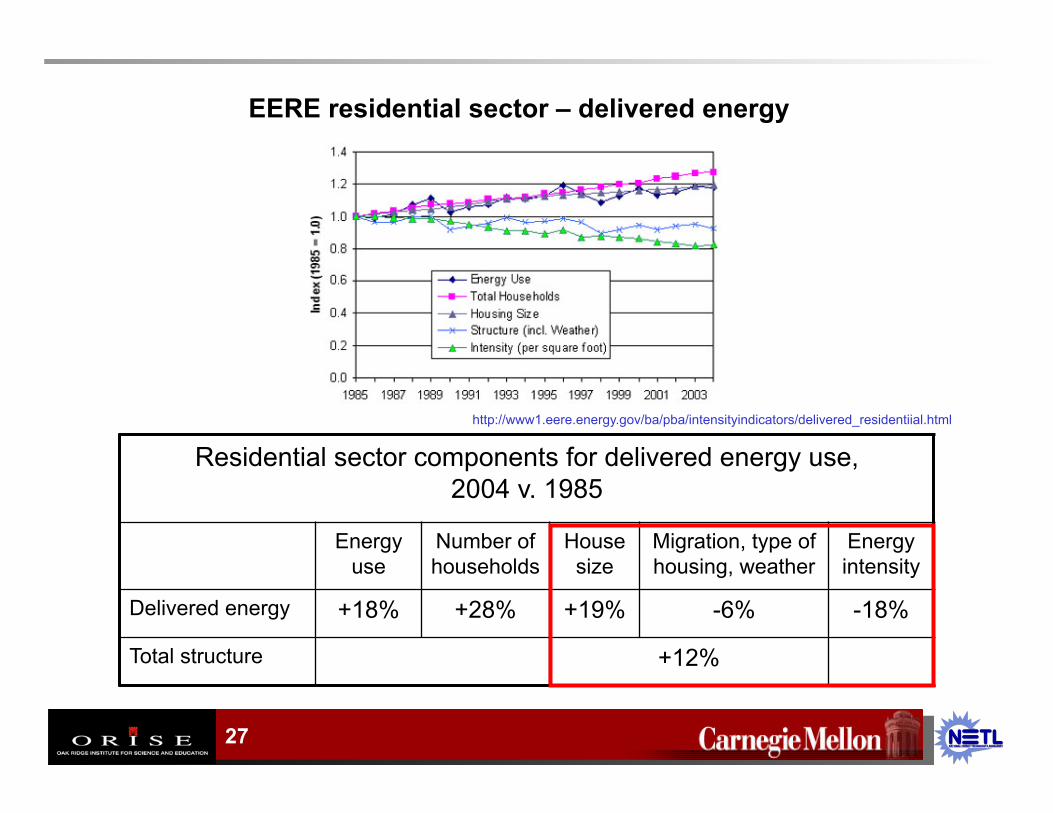
EERE residential sector – delivered energy
Residential sector components for delivered energy use, 2004 v. 1985
Energy use
Number of households
House size
Migration, type of housing, weather
Energy intensity
Delivered energy +18% +28% +19% -6% -18%
Total structure +12%
http://www1.eere.energy.gov/ba/pba/intensityindicators/delivered_residentiial.html
28
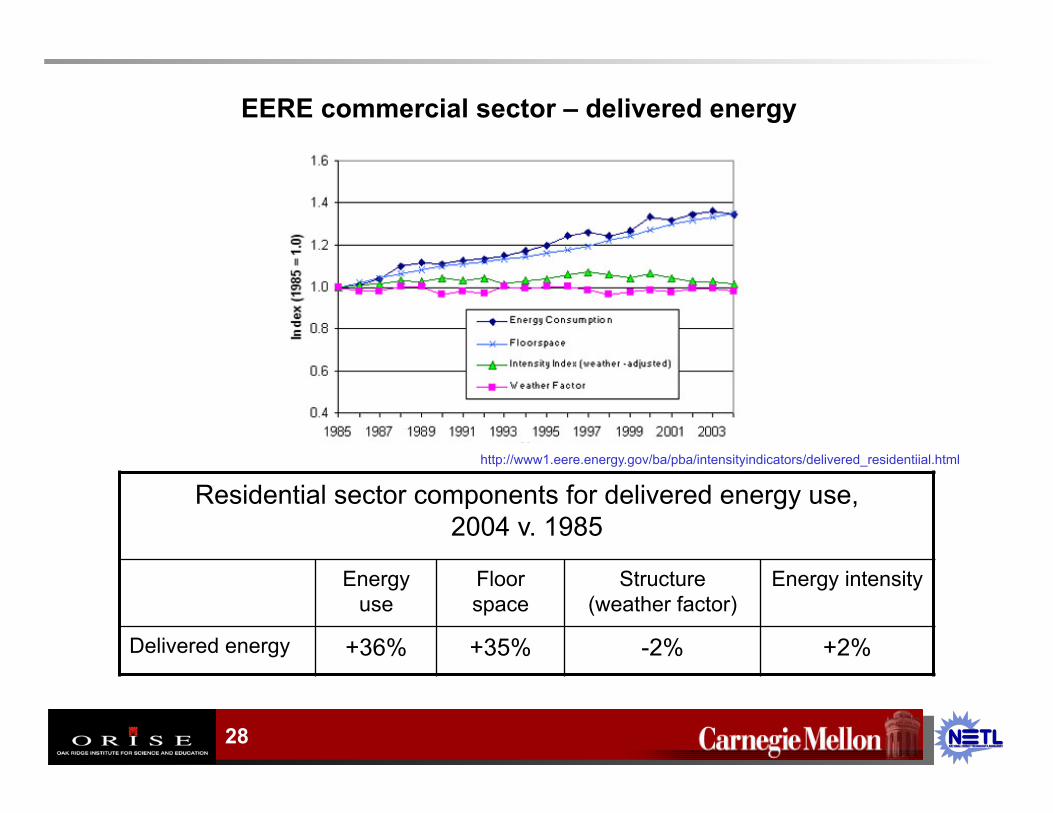
EERE commercial sector – delivered energy
Residential sector components for delivered energy use, 2004 v. 1985
Energy use
Floor space
Structure (weather factor)
Energy intensity
Delivered energy +36% +35% -2% +2%
http://www1.eere.energy.gov/ba/pba/intensityindicators/delivered_residentiial.html
29
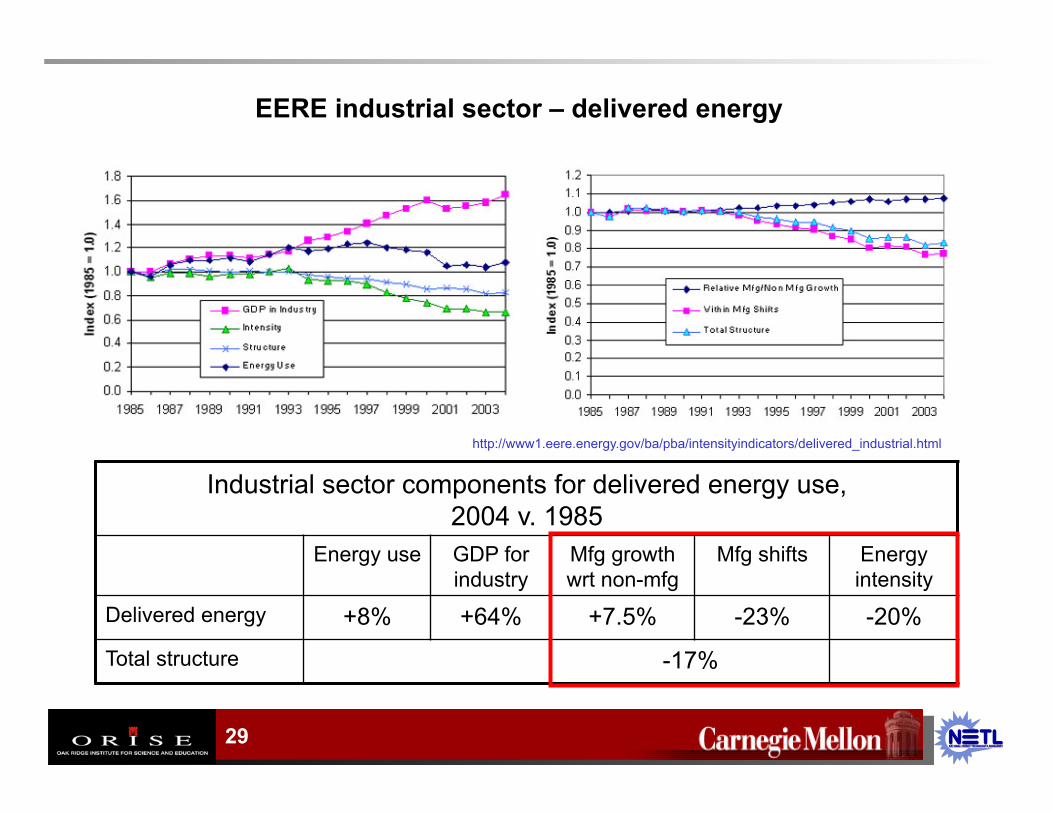
EERE industrial sector – delivered energy
Industrial sector components for delivered energy use, 2004 v. 1985
Energy use GDP for industry
Mfg growth wrt non-mfg
Mfg shifts Energy intensity
Delivered energy +8% +64% +7.5% -23% -20%
Total structure -17%
http://www1.eere.energy.gov/ba/pba/intensityindicators/delivered_industrial.html