Embed Size (px)
Citation preview
U.S. Consumer Staple U.S. Consumer Staple MarketMarket
PresentersPresenters
Industry: Industry: Jim ShiJim ShiTarget: Target: Chris YooChris YooWal-Mart:Wal-Mart: Doug HuxterDoug HuxterCostco:Costco: Wendy ChoiWendy Choi

Consumer StaplesConsumer Staples
Definition:Definition:– Include any company that manufactures and Include any company that manufactures and
sells sells food/beverages, tobacco, prescription food/beverages, tobacco, prescription drugs and household productsdrugs and household products
– Includes following industryIncludes following industry
Food & Drug RetailingFood & Drug Retailing Food & Beverage & TobaccoFood & Beverage & Tobacco Household & Personal ProductsHousehold & Personal Products
– E.g. Proctor & Gamble, Coca Cola, Wal-martE.g. Proctor & Gamble, Coca Cola, Wal-mart
Types of RetailersTypes of Retailers
Department storesDepartment stores– Wide variety of productsWide variety of products– Ex. SearsEx. Sears
DemographicsDemographics– Stores aimed at certain segmentStores aimed at certain segment– Ex. GapEx. Gap
DiscountersDiscounters– Membership club or low priced variety storeMembership club or low priced variety store– Ex. Costco Wal-martEx. Costco Wal-mart
Porter’s 5 ForcesPorter’s 5 Forces
Low Threat of new entrants: Low Threat of new entrants: – Large concentration of retail chain Large concentration of retail chain
storesstores– Decreasing number of independent Decreasing number of independent
retailersretailers– Barriers to entryBarriers to entry
Favorable supply contract: centralized Favorable supply contract: centralized buying powerbuying power
Favorable lease contractFavorable lease contractRequires large amounts of capitalRequires large amounts of capital
Porter’s 5 Forces (cont’)Porter’s 5 Forces (cont’) Suppliers’ power: limited power to negotiate Suppliers’ power: limited power to negotiate
relatively to large retail chain storesrelatively to large retail chain stores
Buyers’ power: Buyers’ power: – Individuals with limited purchasing powerIndividuals with limited purchasing power– collectively, customers can demand high quality collectively, customers can demand high quality
products at a bargain price; products at a bargain price;

Porter’s 5 Forces (cont’)Porter’s 5 Forces (cont’)
Substitute threat: high, products offered in Substitute threat: high, products offered in one retail chain are available in othersone retail chain are available in others
Rivalry: slow market growth leads to fierce Rivalry: slow market growth leads to fierce price competitionprice competition

Historical TrendHistorical Trend
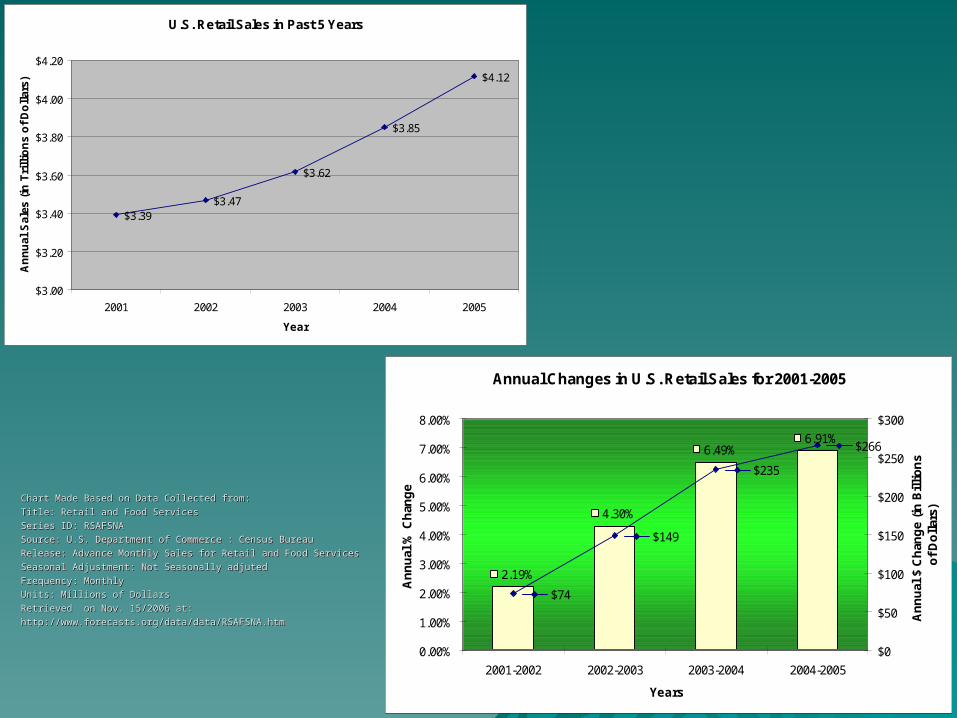
Annual Changes in U.S. Retail Sales for 2001-2005
2.19%
4.30%
6.49%6.91%
$74
$149
$235
$266
0.00%
1.00%
2.00%
3.00%
4.00%
5.00%
6.00%
7.00%
8.00%
2001-2002 2002-2003 2003-2004 2004-2005
Years
An
nu
al %
Ch
ang
e
$0
$50
$100
$150
$200
$250
$300
An
nu
al $
Ch
ang
e (i
n B
illi
on
s o
f D
oll
ars)
Chart Made Based on Data Collected from:Chart Made Based on Data Collected from:
Title: Retail and Food ServicesTitle: Retail and Food Services
Series ID: RSAFSNASeries ID: RSAFSNA
Source: U.S. Department of Commerce : Census BureauSource: U.S. Department of Commerce : Census Bureau
Release: Advance Monthly Sales for Retail and Food ServicesRelease: Advance Monthly Sales for Retail and Food Services
Seasonal Adjustment: Not Seasonally adjutedSeasonal Adjustment: Not Seasonally adjuted
Frequency: MonthlyFrequency: Monthly
Units: Millions of DollarsUnits: Millions of Dollars
Retrieved on Nov. 15/2006 at:Retrieved on Nov. 15/2006 at:
http://www.forecasts.org/data/data/RSAFSNA.htmhttp://www.forecasts.org/data/data/RSAFSNA.htm
U.S. Retail Sales in Past 5 Years
$3.39$3.47
$3.62
$3.85
$4.12
$3.00
$3.20
$3.40
$3.60
$3.80
$4.00
$4.20
2001 2002 2003 2004 2005
Year
An
nu
al S
ales
(in
Tri
llio
ns
of
Do
llar
s)
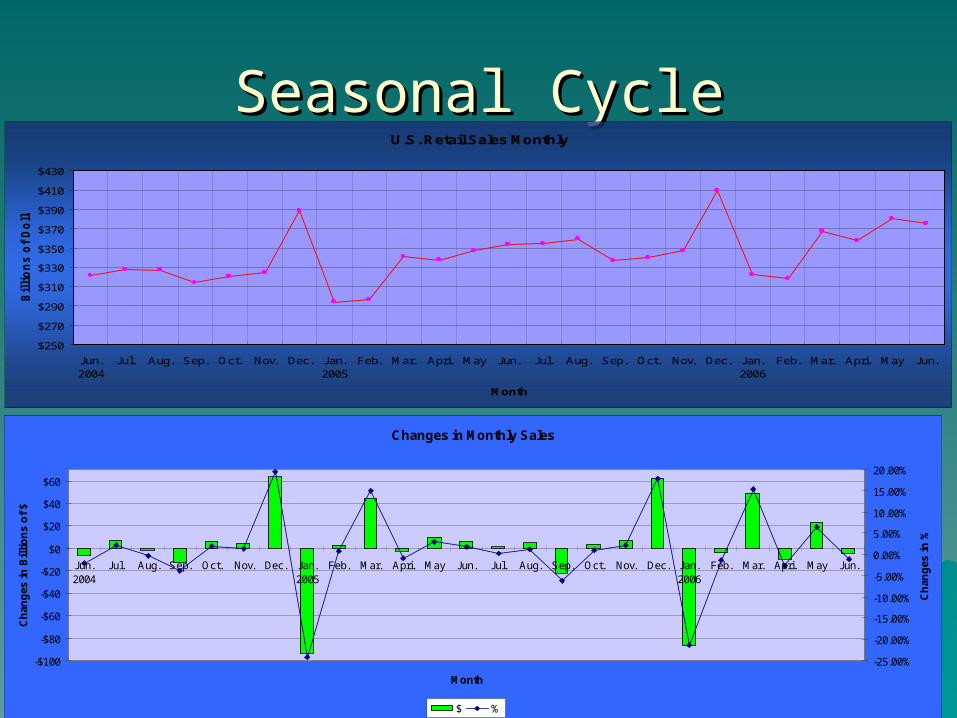
Seasonal CycleSeasonal CycleU.S. Retail Sales Monthly
$250
$270
$290
$310
$330
$350
$370
$390
$410
$430
Jun.2004
Jul. Aug. Sep. Oct. Nov. Dec. Jan.2005
Feb. Mar. Apri. May Jun. Jul. Aug. Sep. Oct. Nov. Dec. Jan.2006
Feb. Mar. Apri. May Jun.
Month
Bil
lio
ns o
f D
oll
ars
Changes in Monthly Sales
-$100
-$80
-$60
-$40
-$20
$0
$20
$40
$60
Jun.2004
Jul. Aug. Sep. Oct. Nov. Dec. Jan.2005
Feb. Mar. Apri. May Jun. Jul. Aug. Sep. Oct. Nov. Dec. Jan.2006
Feb. Mar. Apri. May Jun.
Month
Ch
ang
es i
n B
illi
on
s o
f $
-25.00%
-20.00%
-15.00%
-10.00%
-5.00%
0.00%
5.00%
10.00%
15.00%
20.00%
Ch
ang
es i
n %
$ %

Company Size by RevenuesCompany Size by Revenues
48%
37%
7%8%
Other
Walmart
Target
Costco
Retail MetricsRetail Metrics
Revenues, net income and profit Revenues, net income and profit marginsmargins
Number of storesNumber of stores Same store salesSame store sales Sales per square footSales per square foot Target market Target market
Driving Force OverviewDriving Force Overview
Low priced goodsLow priced goods LocationLocation Product lineProduct line Market cycle (economy), Market cycle (economy),
EmploymentEmployment Consumer confidence levelConsumer confidence level Natural disasterNatural disaster
Low-priced GoodsLow-priced Goods
Efficient distribution networkEfficient distribution network Constant search for low-cost goodsConstant search for low-cost goods
– Import goods from countries with low Import goods from countries with low cost labourcost labour
Large volume discountLarge volume discount Strategically located storesStrategically located stores Flexible workforceFlexible workforce
– Part-timePart-time– Non-unionized vs. unionizedNon-unionized vs. unionized
LocationLocation
Store densityStore density Urban vs. SuburbanUrban vs. Suburban Land value of locationLand value of location

Product LineProduct Line
Price vs. qualityPrice vs. quality– High-end: Urban Fare, NordstromsHigh-end: Urban Fare, Nordstroms– Mixed: the Bay, TargetMixed: the Bay, Target– Low-end: Wal-MartLow-end: Wal-Mart
Variety of goods soldVariety of goods sold– Primarily grocery store (Top Food, Primarily grocery store (Top Food,
Safeway)Safeway)– Primarily hard products (Best Buy, Home Primarily hard products (Best Buy, Home
Depot)Depot)– Primarily soft products (the Bay, the Brick)Primarily soft products (the Bay, the Brick)

US EconomyUS Economy
Indicator slowing economyIndicator slowing economy– Cooling housing market slowing Cooling housing market slowing
economy (housing starts)economy (housing starts)– High energy price High energy price – Stabilized interest rates Stabilized interest rates – Household incomeHousehold income
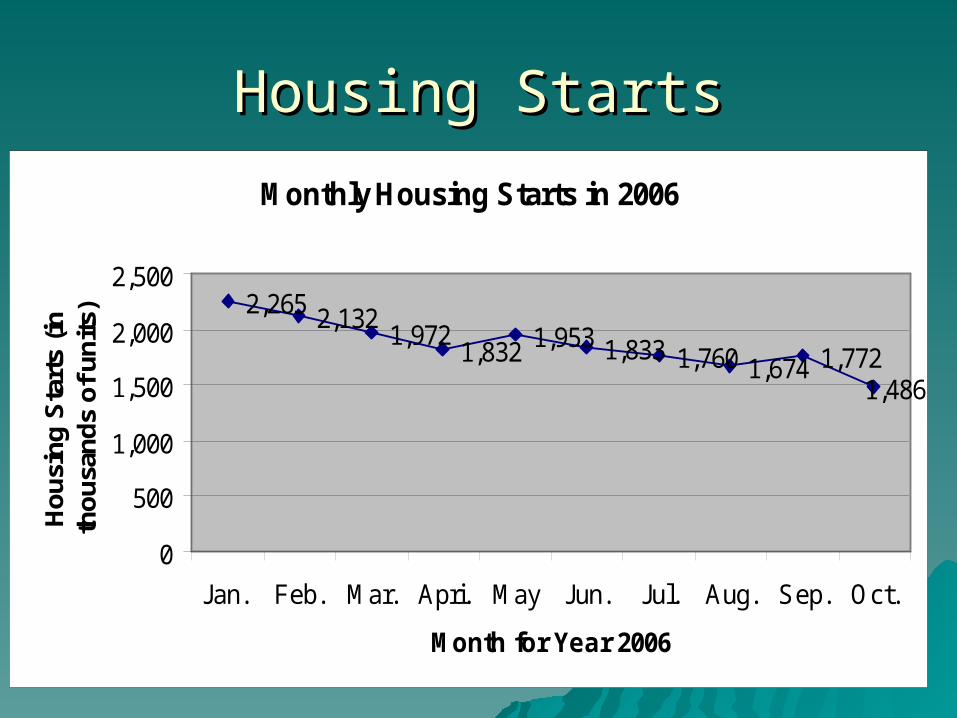
Housing StartsHousing Starts
Monthly Housing Starts in 2006
2,265 2,1321,972
1,832 1,953 1,833 1,760 1,674 1,7721,486
0
500
1,000
1,500
2,000
2,500
Jan. Feb. Mar. Apri. May Jun. Jul. Aug. Sep. Oct.
Month for Year 2006
Ho
usi
ng
Sta
rts
(in
th
ou
san
ds
of
un
its)
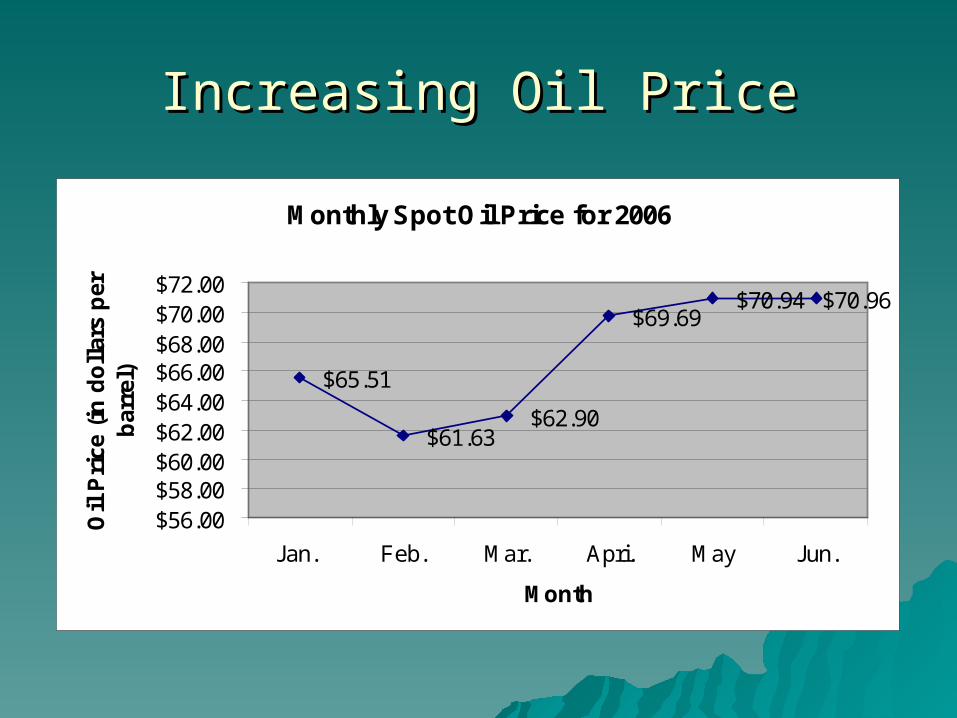
Increasing Oil PriceIncreasing Oil Price
Monthly Spot Oil Price for 2006
$65.51
$61.63$62.90
$69.69$70.94 $70.96
$56.00$58.00$60.00$62.00$64.00$66.00$68.00$70.00$72.00
Jan. Feb. Mar. Apri. May Jun.
Month
Oil
Pri
ce (
in d
oll
ars
per
b
arre
l)
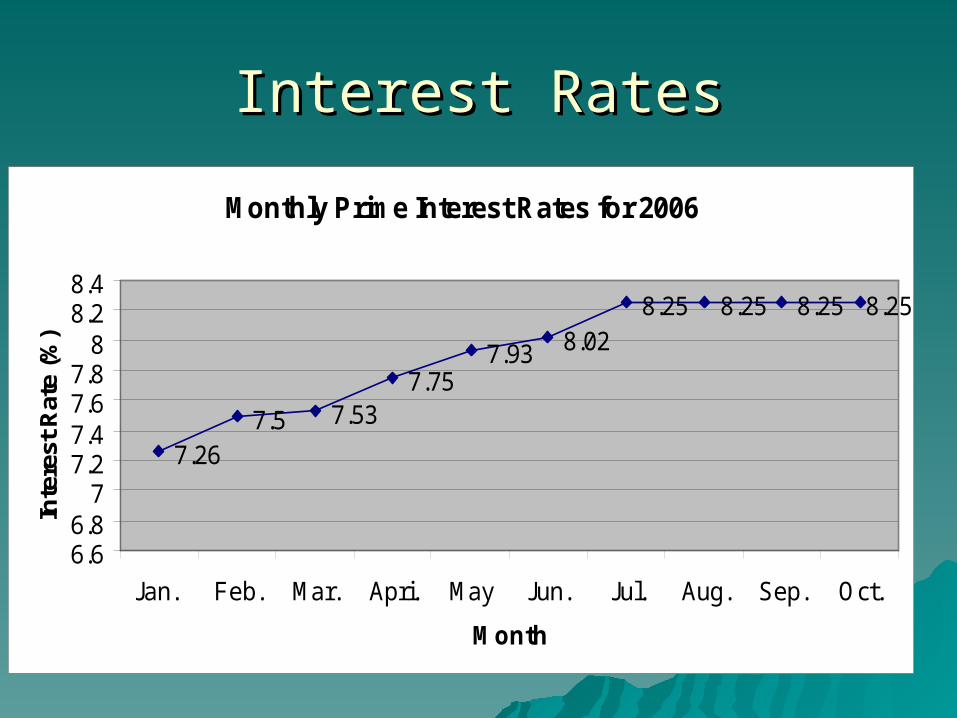
Interest RatesInterest Rates
Monthly Prime Interest Rates for 2006
7.267.5 7.53
7.757.93 8.02
8.25 8.25 8.25 8.25
6.66.8
77.27.47.67.8
88.28.4
Jan. Feb. Mar. Apri. May Jun. Jul. Aug. Sep. Oct.
Month
Inte
rest
Rat
e (%
)
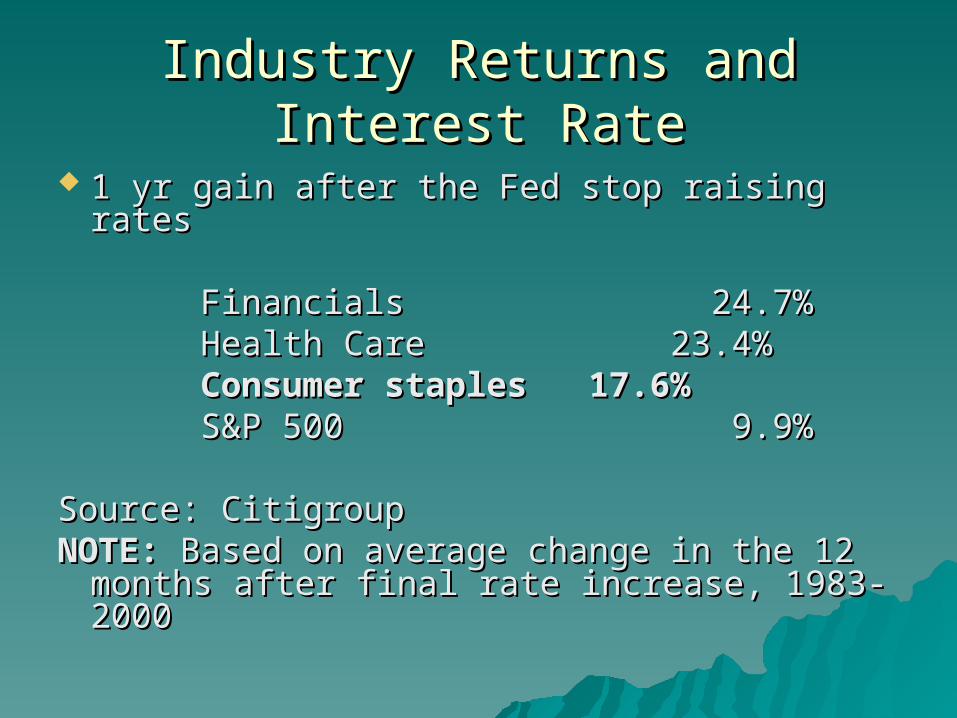
Industry Returns and Interest RateIndustry Returns and Interest Rate
1 yr gain after the Fed stop raising rates1 yr gain after the Fed stop raising rates Financials 24.7%Financials 24.7% Health Care 23.4%Health Care 23.4% Consumer staples 17.6%Consumer staples 17.6% S&P 500 9.9%S&P 500 9.9%
Source: CitigroupSource: CitigroupNOTE: NOTE: Based on average change in the 12 Based on average change in the 12
months after final rate increase, 1983-months after final rate increase, 1983-2000 2000
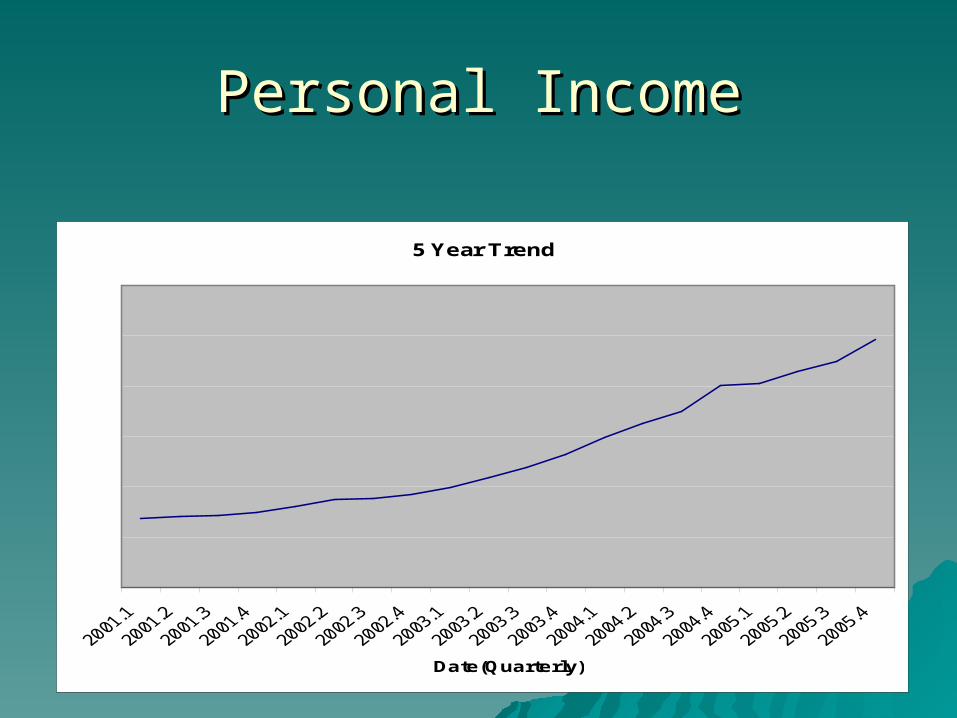
Personal IncomePersonal Income
5 Year Trend
Date(Quarterly)

Unemployment RateUnemployment RateAnnual Arithmatic Average for Unemployment Rate
3.97
4.74
5.786.00
5.525.06
0.00
1.00
2.00
3.00
4.00
5.00
6.00
7.00
2000 2001 2002 2003 2004 2005
Year
Un
emp
loym
ent
Rat
e (%
)
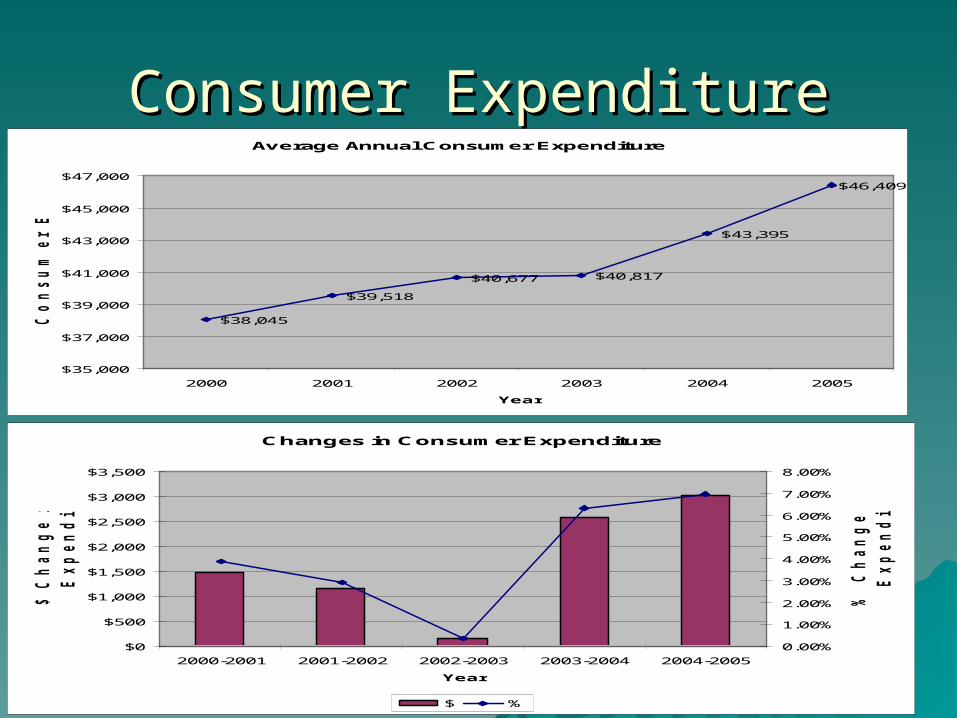
Consumer ExpenditureConsumer ExpenditureAverage Annual Consumer Expenditure
$38,045
$39,518
$40,677 $40,817
$43,395
$46,409
$35,000
$37,000
$39,000
$41,000
$43,000
$45,000
$47,000
2000 2001 2002 2003 2004 2005
Year
Co
nsu
mer E
xp
en
ditu
re
Changes in Consumer Expenditure
$0
$500
$1,000
$1,500
$2,000
$2,500
$3,000
$3,500
2000-2001 2001-2002 2002-2003 2003-2004 2004-2005
Year
$ C
han
ge in
A
nn
ual
Exp
en
ditu
re
0.00%
1.00%
2.00%
3.00%
4.00%
5.00%
6.00%
7.00%
8.00%
% C
han
ge in
A
nn
ual
Exp
en
ditu
re
$ %
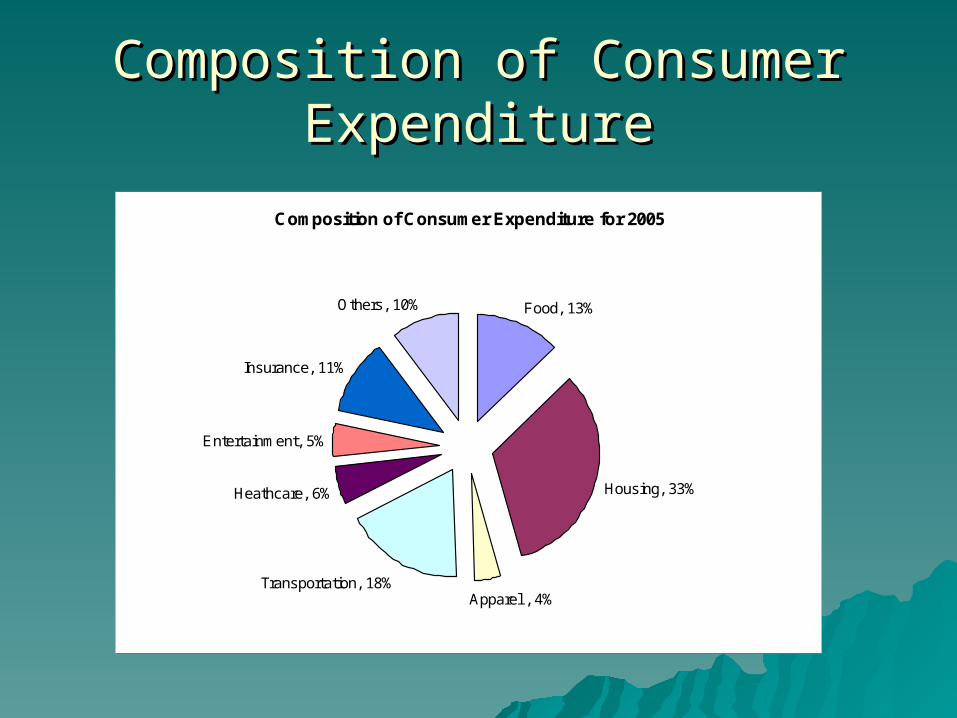
Composition of Consumer Composition of Consumer ExpenditureExpenditure
Composition of Consumer Expenditure for 2005
Food, 13%
Housing, 33%
Apparel , 4%Transportation, 18%
Heathcare, 6%
Entertainment, 5%
Insurance, 11%
Others, 10%
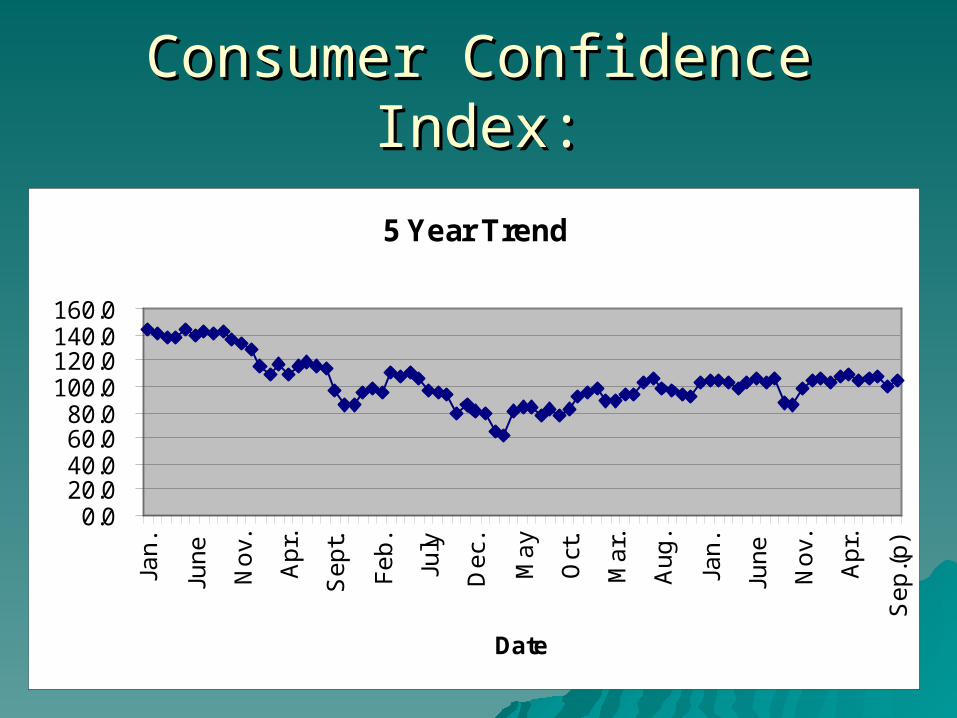
Consumer Confidence Index:Consumer Confidence Index:
5 Year Trend
0.020.040.060.080.0
100.0120.0140.0160.0
Ja
n.
Jun
e
No
v.
Ap
r.
Se
pt.
Fe
b.
July
De
c.
Ma
y
Oct
.
Ma
r.
Au
g.
Jan
.
Jun
e
No
v.
Ap
r.
Se
p.(
p)
Date

Natural DisasterNatural Disaster
HurricanesHurricanes– Ex. 2005 August Hurricane KatrinaEx. 2005 August Hurricane Katrina
EarthquakeEarthquake RainRain
– Ex. Rains increase the amount of Ex. Rains increase the amount of turbidity level of tap water turbidity level of tap water
Target®
Expect More. Pay Less. ®
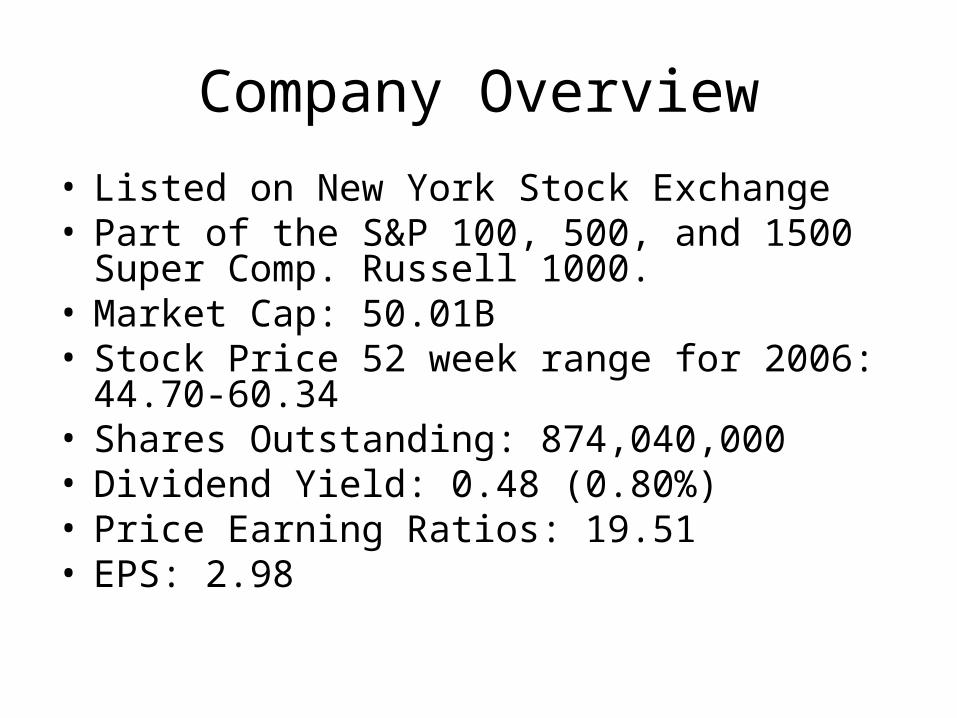
Company Overview
• Listed on New York Stock Exchange• Part of the S&P 100, 500, and 1500 Super
Comp. Russell 1000. • Market Cap: 50.01B• Stock Price 52 week range for 2006: 44.70-
60.34• Shares Outstanding: 874,040,000 • Dividend Yield: 0.48 (0.80%)• Price Earning Ratios: 19.51• EPS: 2.98
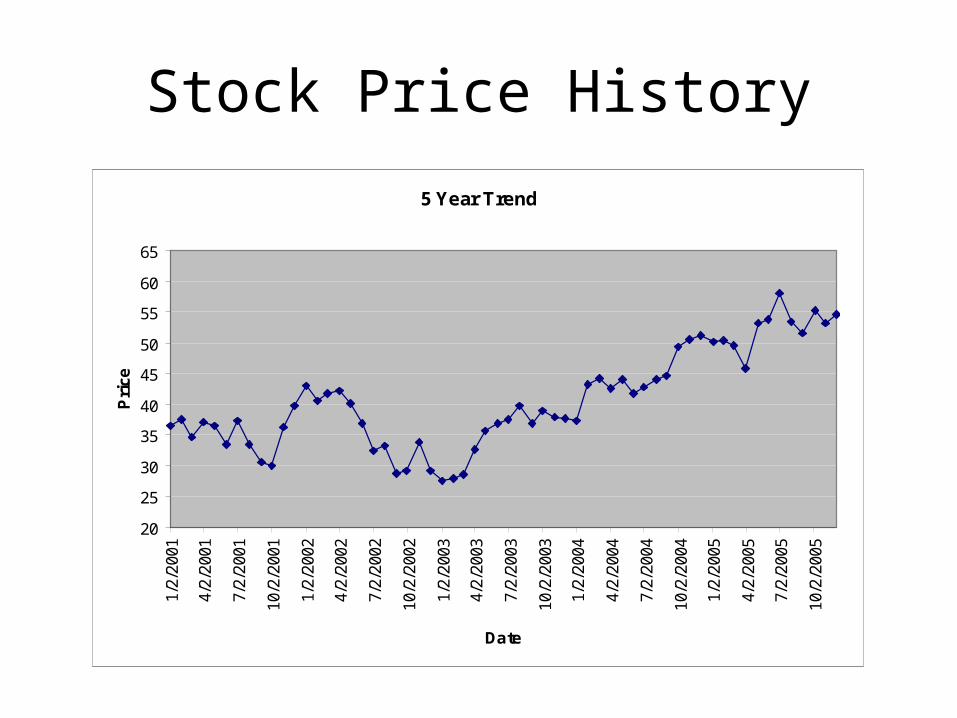
Stock Price History
5 Year Trend
20
25
30
35
40
45
50
55
60
65
1/2/
2001
4/2/
2001
7/2/
2001
10/2
/200
1
1/2/
2002
4/2/
2002
7/2/
2002
10/2
/200
2
1/2/
2003
4/2/
2003
7/2/
2003
10/2
/200
3
1/2/
2004
4/2/
2004
7/2/
2004
10/2
/200
4
1/2/
2005
4/2/
2005
7/2/
2005
10/2
/200
5
Date
Pri
ce
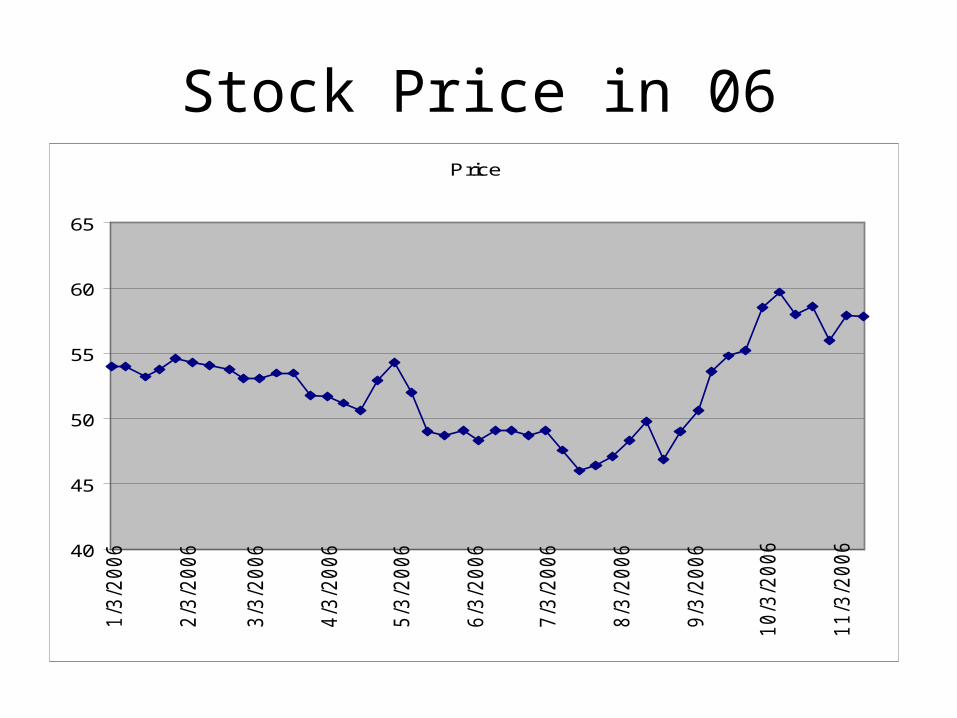
Stock Price in 06Price
40
45
50
55
60
65
1/3
/2006
2/3
/2006
3/3
/2006
4/3
/2006
5/3
/2006
6/3
/2006
7/3
/2006
8/3
/2006
9/3
/2006
10/3
/2006
11/3
/2006

Company M & A’s
• From 1960-80’s– Lechmere, J.L. Hudson Company, Mervyn’s,
Ayr-Way, Fed Mart, Gemco,
• From 1990-00’s– Marshall Field’s, Fedco,
• Most recently:– June 9, 2004
• Announced sale of Marshall Field’s Chain, and several Mervyn’s stores
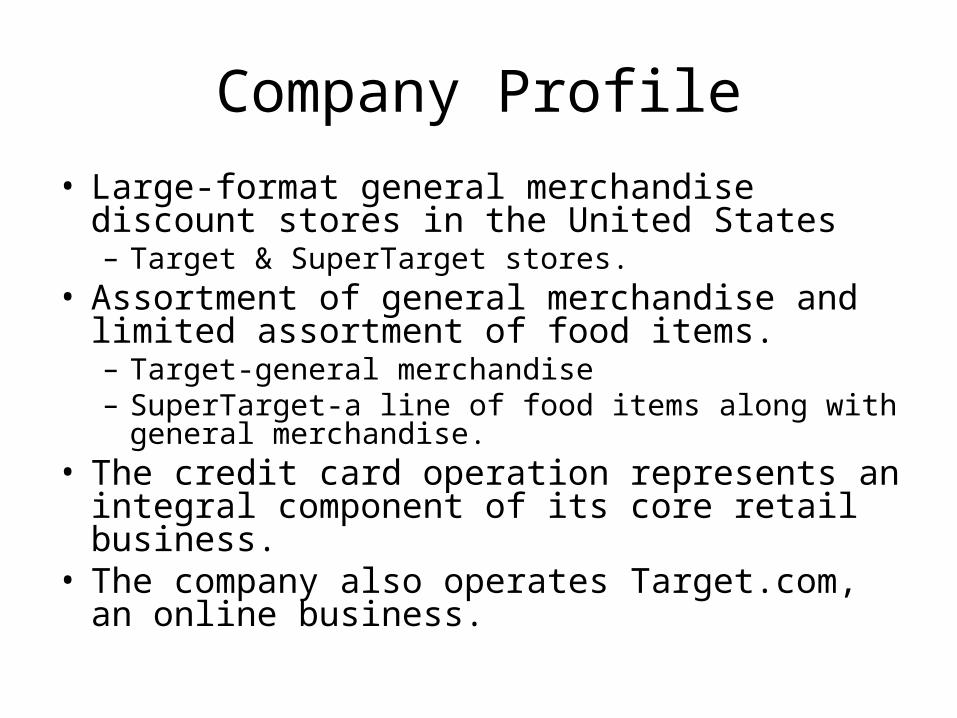
Company Profile
• Large-format general merchandise discount stores in the United States– Target & SuperTarget stores.
• Assortment of general merchandise and limited assortment of food items. – Target-general merchandise– SuperTarget-a line of food items along with general
merchandise. • The credit card operation represents an integral
component of its core retail business. • The company also operates Target.com, an
online business.
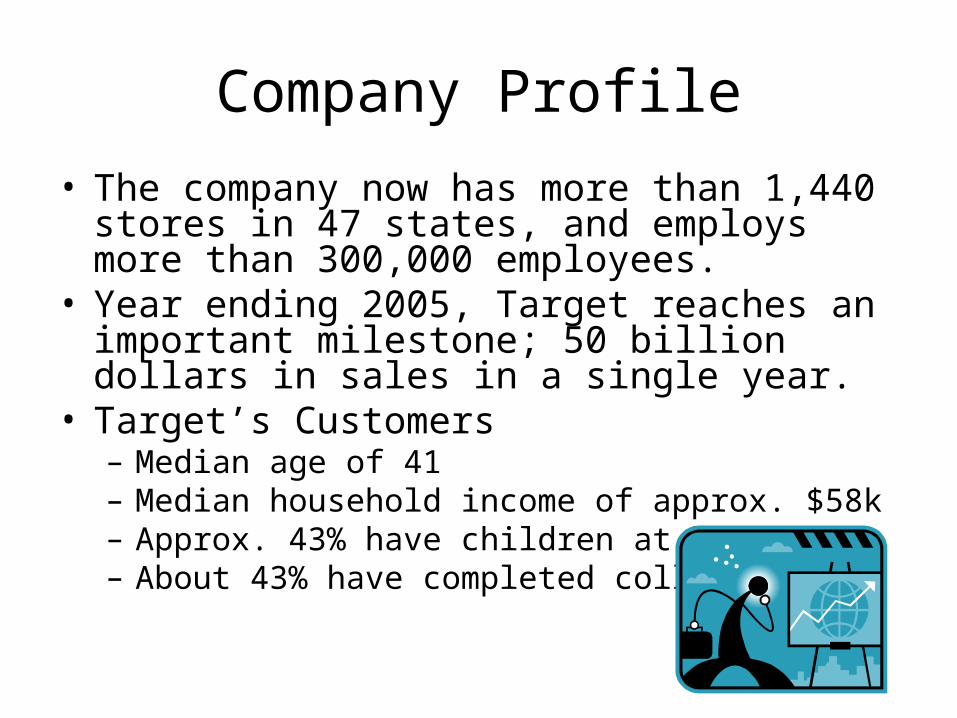
Company Profile
• The company now has more than 1,440 stores in 47 states, and employs more than 300,000 employees.
• Year ending 2005, Target reaches an important milestone; 50 billion dollars in sales in a single year.
• Target’s Customers– Median age of 41– Median household income of approx. $58k– Approx. 43% have children at home– About 43% have completed college
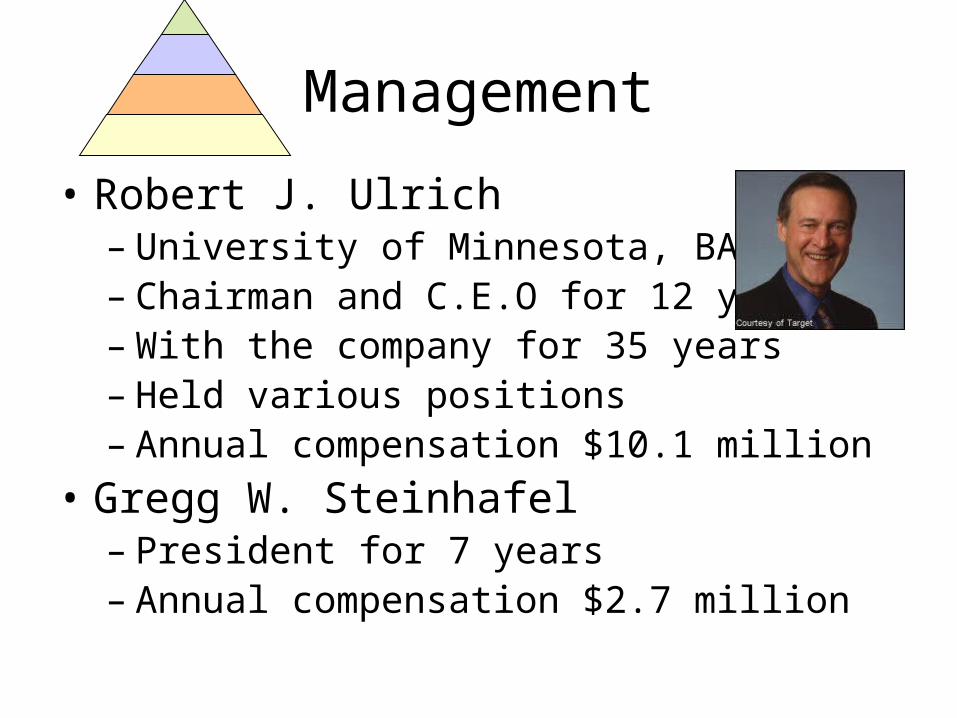
Management
• Robert J. Ulrich – University of Minnesota, BA, 1967– Chairman and C.E.O for 12 years– With the company for 35 years– Held various positions– Annual compensation $10.1 million
• Gregg W. Steinhafel– President for 7 years– Annual compensation $2.7 million
Key Figures
• Same-Store Sales Growth (“Comps”)
• Sales per Square Foot
• Inventory Turnover
• Gross Profit Margin
• Debt/Equity Ratio
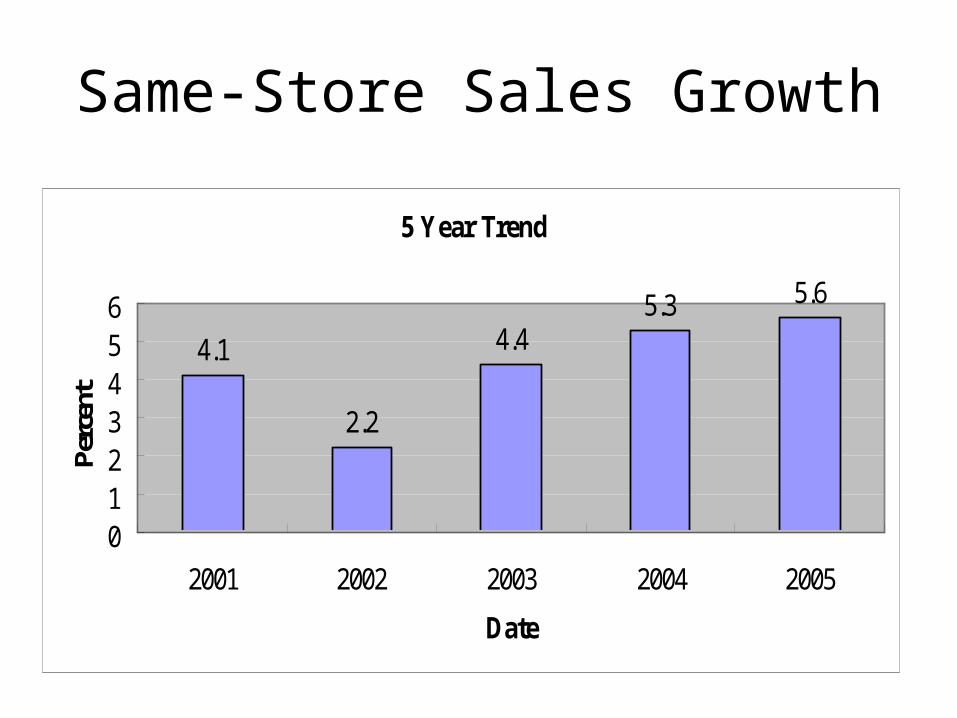
Same-Store Sales Growth
5 Year Trend
4.1
2.2
4.45.3 5.6
0123456
2001 2002 2003 2004 2005
Date
Perc
ent
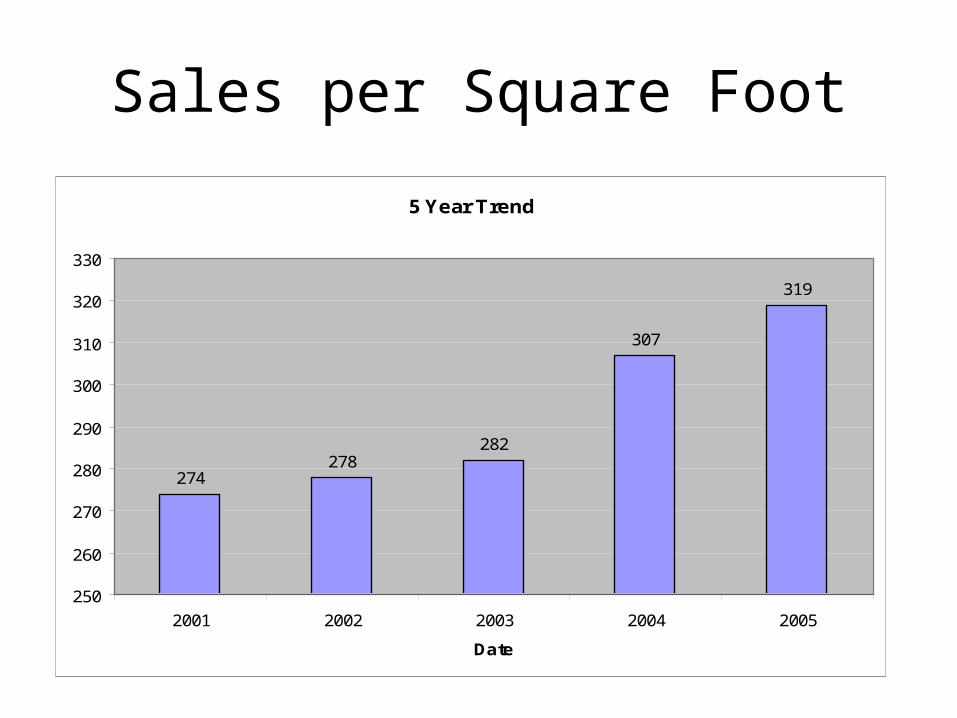
Sales per Square Foot
5 Year Trend
274278
282
307
319
250
260
270
280
290
300
310
320
330
2001 2002 2003 2004 2005
Date
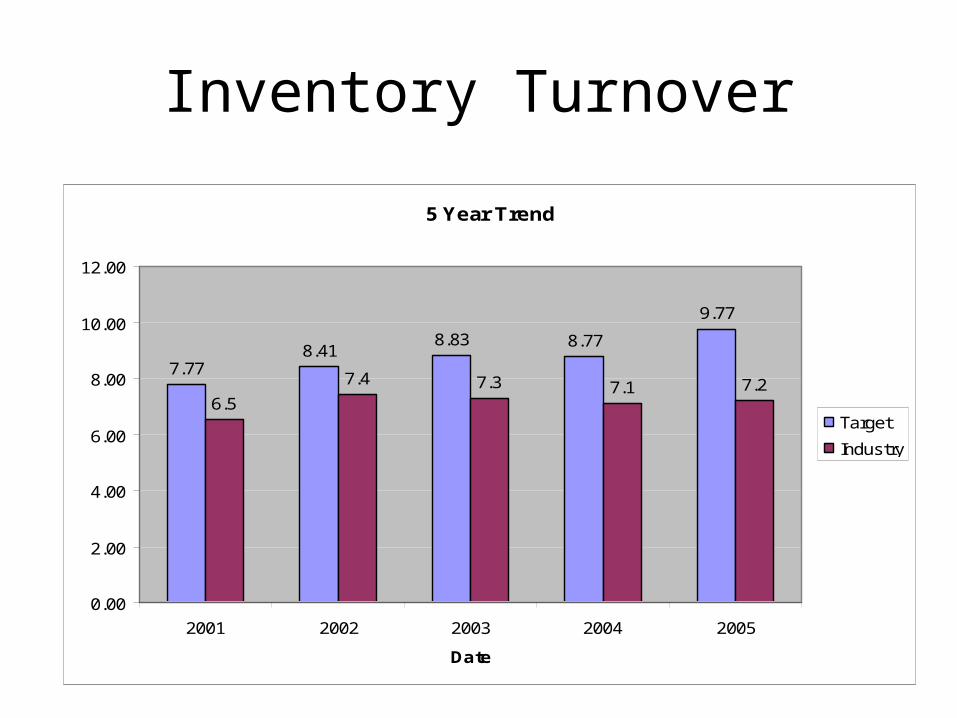
Inventory Turnover
5 Year Trend
7.778.41
8.83 8.77
9.77
6.5
7.4 7.3 7.1 7.2
0.00
2.00
4.00
6.00
8.00
10.00
12.00
2001 2002 2003 2004 2005
Date
Target
Industry
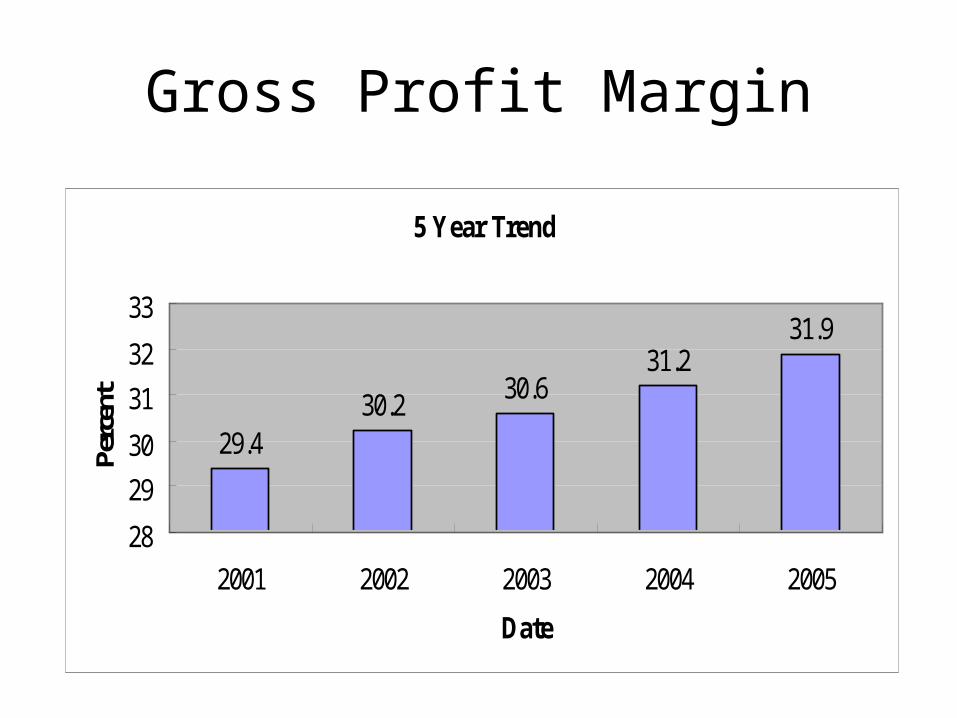
Gross Profit Margin
5 Year Trend
29.430.2
30.631.2
31.9
28
29
30
31
32
33
2001 2002 2003 2004 2005
Date
Perc
ent
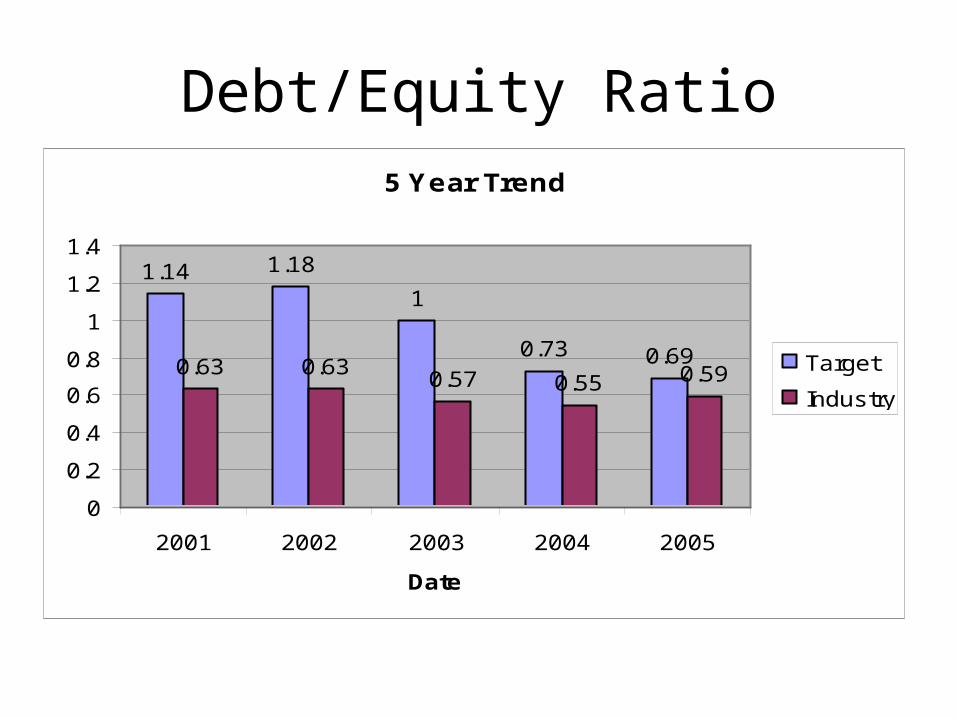
Debt/Equity Ratio5 Year Trend
1.14 1.18
1
0.73 0.690.63 0.630.57 0.55 0.59
0
0.2
0.4
0.6
0.8
1
1.2
1.4
2001 2002 2003 2004 2005
Date
Target
Industry

Driving Factors of Staple Industry
• Low COGS achieved through distribution and supply chain
• Image
• Location
• Product line
Low COGS achieved through distribution and supply chain
• Significant investments in supply chain and in leading-edge technologies.
• Current distribution network includes 23 regional distribution centers and 3 import warehouses.– Plans to add 2 distribution centers and 3 import
warehouses in the next 2 years
• Derive operating efficiencies through 6Sigma@Target and outsourcing a variety of business functions.
Image
• Target’s store are:– Inviting and easy-to-shop,– Clean, bright, safe and accessible, and– Elaborately designed to excite their guests
• Corporate Responsibility
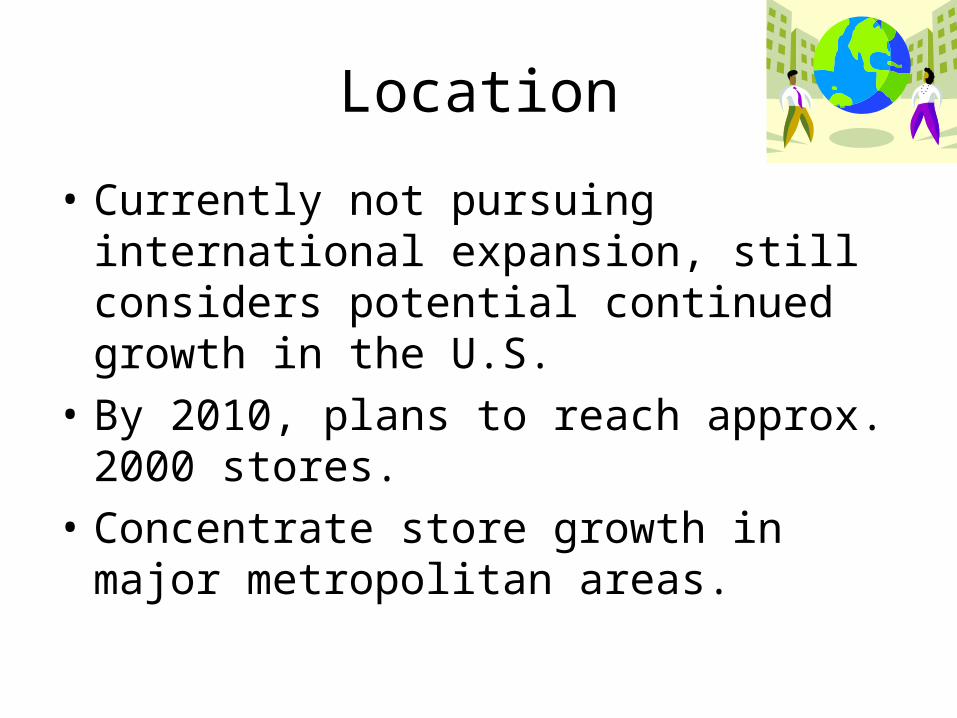
Location
• Currently not pursuing international expansion, still considers potential continued growth in the U.S.
• By 2010, plans to reach approx. 2000 stores.
• Concentrate store growth in major metropolitan areas.
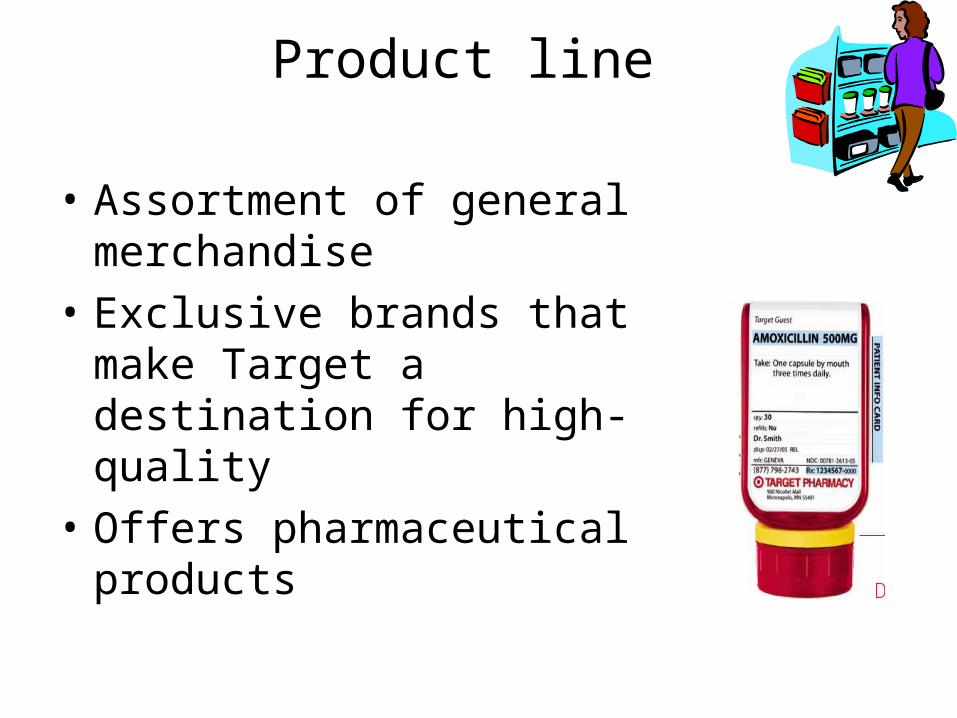
Product line
• Assortment of general merchandise
• Exclusive brands that make Target a destination for high-quality
• Offers pharmaceutical products
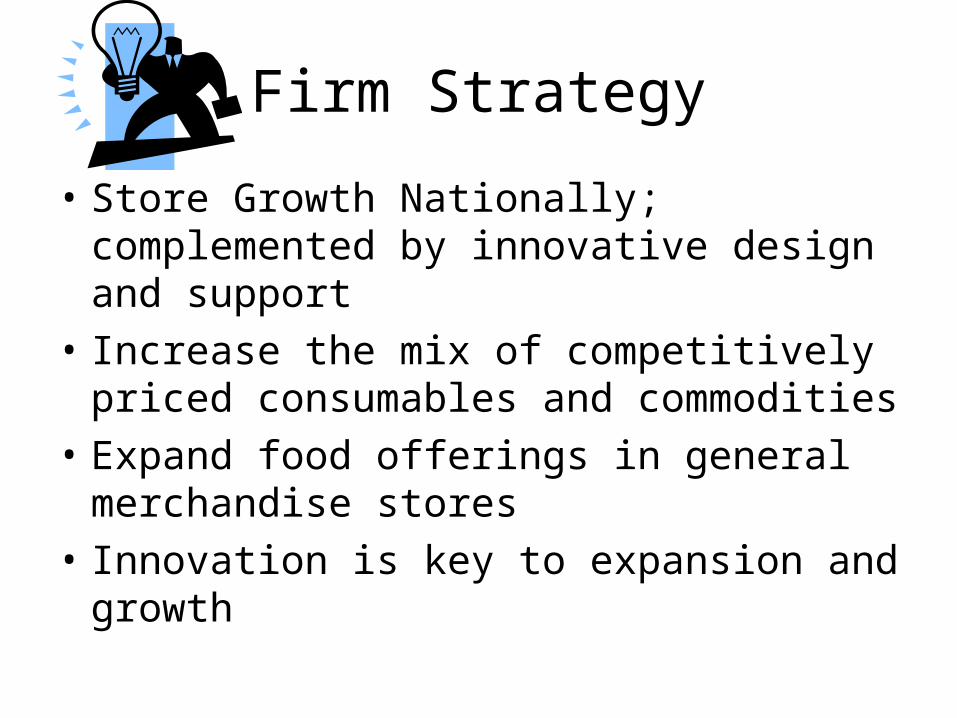
Firm Strategy
• Store Growth Nationally; complemented by innovative design and support
• Increase the mix of competitively priced consumables and commodities
• Expand food offerings in general merchandise stores
• Innovation is key to expansion and growth

Store Growth Pattern
• In 2006, as of Oct 28 they built 75 more Target General Merchandise stores, and 19 more SuperTarget stores, totaling 1494 stores.

Recent Selling of SharesFrom Within
In 2006:• Oct 9th Gregg W. Steinhafel (President)
sells shares totaling $6.2 million.• Oct 17 & 18th Robert Ulrich Jr. (C.E.O)
sells approx 700,000 shares totaling $32.1 million.
• Nov 15th Douglas A. Scovanner (Executive Vice President & C.F.O.) sells shares totaling $2.7 million.

Recent Selling of Shares from Outsiders
• Buffett’s Berkshire Hathaway Inc. owns 745,700 shares of Target, compared with 5.5 million shares in June.

Recommendation
BUILDING SMILES
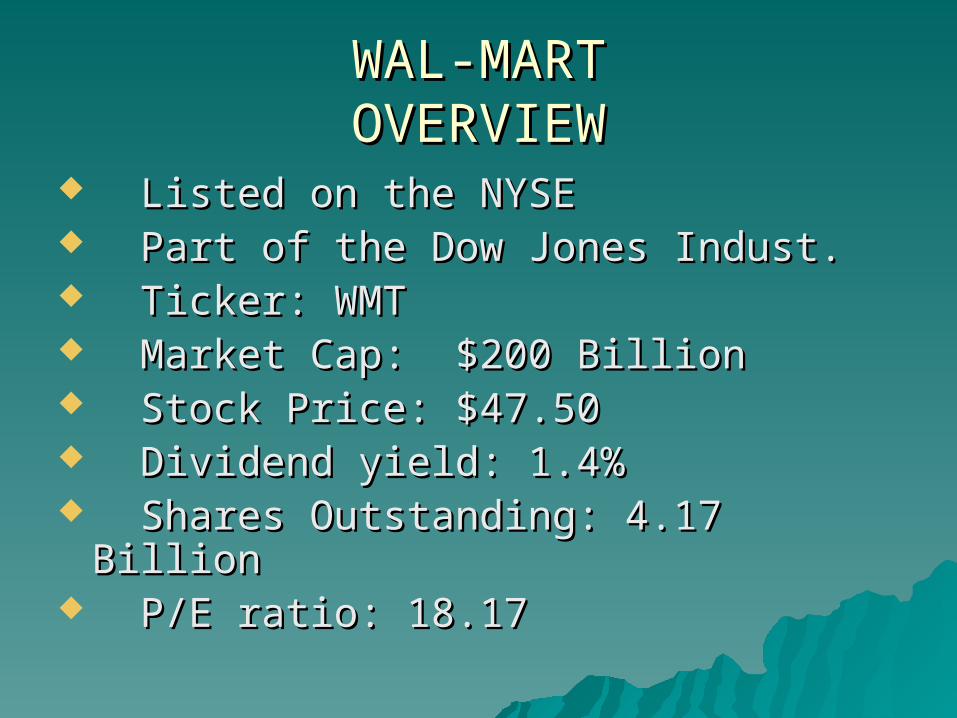
WAL-MARTWAL-MARTOVERVIEWOVERVIEW
Listed on the NYSEListed on the NYSE Part of the Dow Jones Indust.Part of the Dow Jones Indust. Ticker: WMTTicker: WMT Market Cap: $200 BillionMarket Cap: $200 Billion Stock Price: $47.50Stock Price: $47.50 Dividend yield: 1.4%Dividend yield: 1.4% Shares Outstanding: 4.17 BillionShares Outstanding: 4.17 Billion P/E ratio: 18.17P/E ratio: 18.17
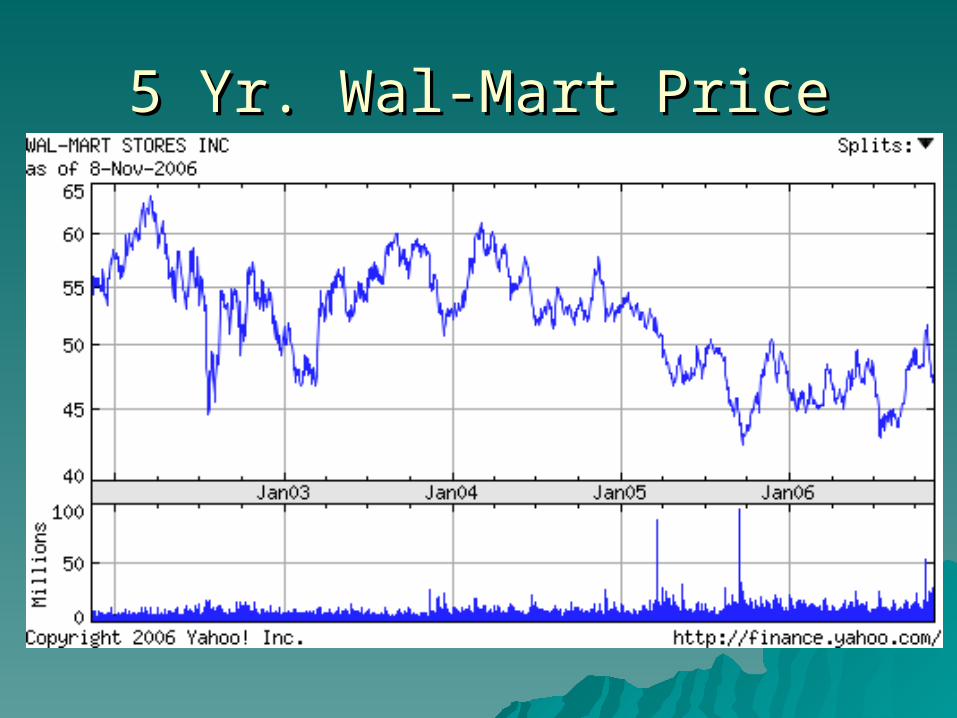
5 Yr. Wal-Mart Price5 Yr. Wal-Mart Price
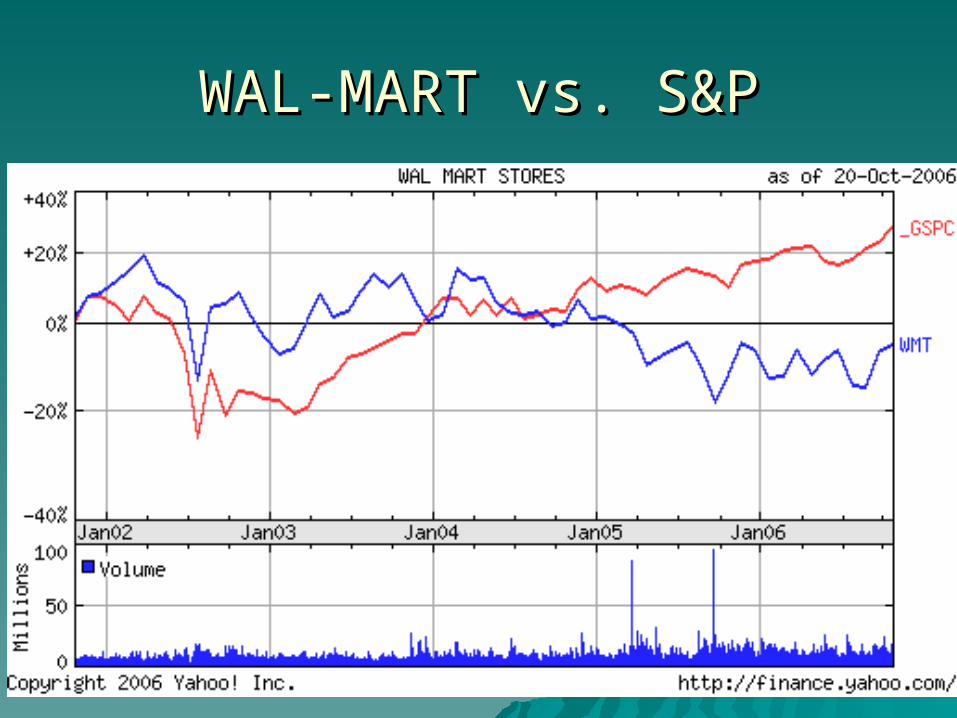
WAL-MART vs. S&PWAL-MART vs. S&P

Number of SharesNumber of Shares
4,0004,0504,1004,1504,2004,2504,3004,3504,4004,4504,500
Number in Millions
2001 2002 2003 2004 2005 2006
Years
Shares Outstanding

Company OverviewCompany Overview Largest Company in the worldLargest Company in the world
Employs over 1.8 million associateEmploys over 1.8 million associate
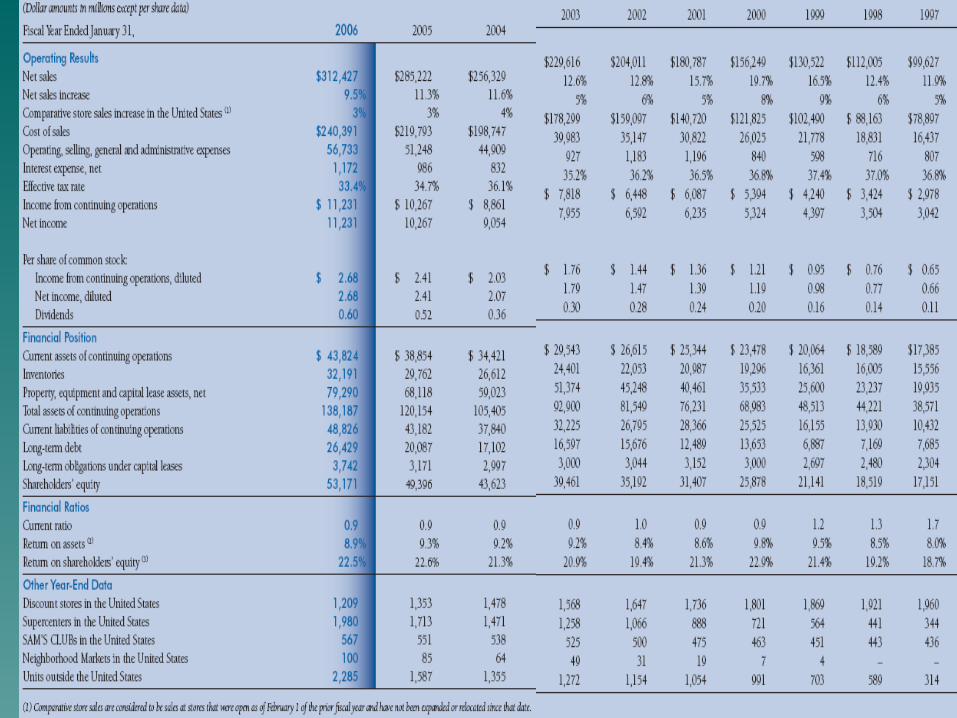
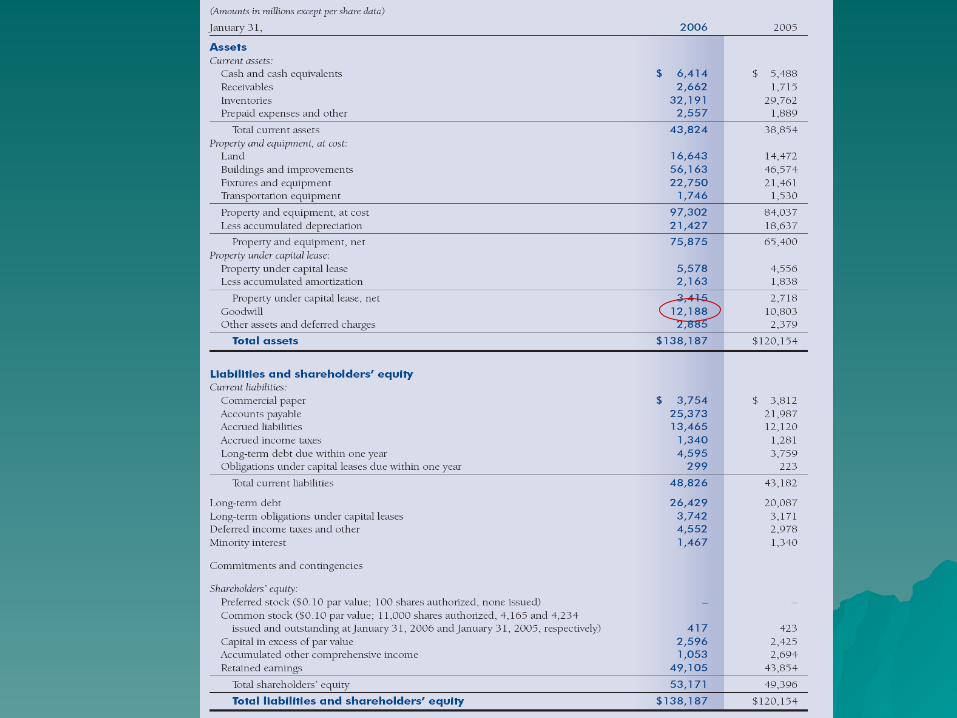
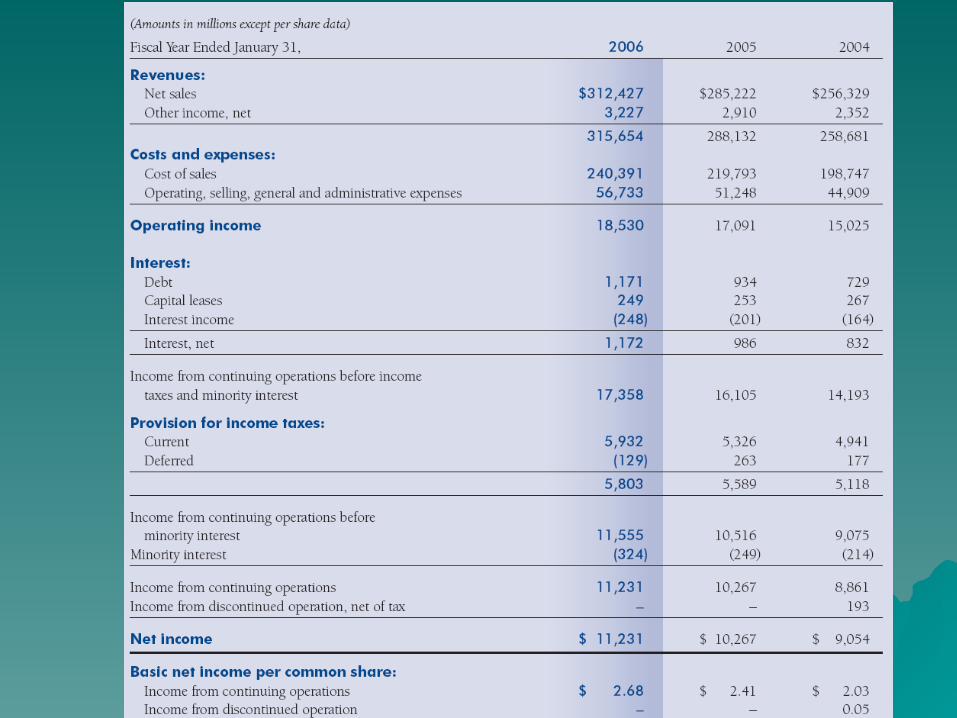
Sales of $312 billion in 2005Sales of $312 billion in 2005
176 Million Shoppers visit Wal-Mart 176 Million Shoppers visit Wal-Mart Every weekEvery week

WAL-MARTWAL-MARTHistoryHistory
Founded in 1962 in Arkansas by Sam Founded in 1962 in Arkansas by Sam WaltonWalton
Wal-Mart went public in 1970Wal-Mart went public in 1970
By the end of the 1980’s WAL-MART had By the end of the 1980’s WAL-MART had over 2,200 locations.over 2,200 locations.
Today WAL-MART has over 6100 storesToday WAL-MART has over 6100 stores– 3856 In the USA3856 In the USA– 2290 International stores2290 International stores

Lee ScottLee Scott
Became CEO in 2000Became CEO in 2000 Has been with Wal-Mart since Has been with Wal-Mart since
19781978 Serves on the board of directorsServes on the board of directors Compensation $5 million in cash Compensation $5 million in cash
and $5 million in stock optionsand $5 million in stock options Degree in Business from Pittsburg Degree in Business from Pittsburg
universityuniversity Share value has dropped 22% Share value has dropped 22%
since he has been running the since he has been running the companycompany
Chairman of the boardChairman of the board
Robert Walton Chairman of the Robert Walton Chairman of the boardboard
Son of the founderSon of the founder Only Walton family member still on Only Walton family member still on
the board of directorsthe board of directors Owns over 2 million shares in the Owns over 2 million shares in the
companycompany Walton Family still has large stake in Walton Family still has large stake in
the companythe company
WAL-MARTSWAL-MARTSSTRATEGYSTRATEGY
Improve company imageImprove company image– Improve relationship with associates and Improve relationship with associates and
surrounding communitiessurrounding communities
– Become a leading company in Become a leading company in sustainabilitysustainability
– Provide a diverse variety of products at Provide a diverse variety of products at a great pricea great price
Improving Company ImageImproving Company Image
Pays below average wages but creates over Pays below average wages but creates over 250,000 new jobs a year250,000 new jobs a year
Low cost health care coverage of $3 per month Low cost health care coverage of $3 per month Created an employment advisory council to Created an employment advisory council to
improve standards for minority groupsimprove standards for minority groups Created job & opportunity zones where the Created job & opportunity zones where the
company provides local business with additional company provides local business with additional trainingtraining
WAL-MARTWAL-MARTstaying ahead of the curvestaying ahead of the curve
To Be Supplied 100% By Renewable To Be Supplied 100% By Renewable Energy Energy
To Create Zero Waste To Create Zero Waste
To Sell Products That Sustain Our To Sell Products That Sustain Our Resources & Environment Resources & Environment
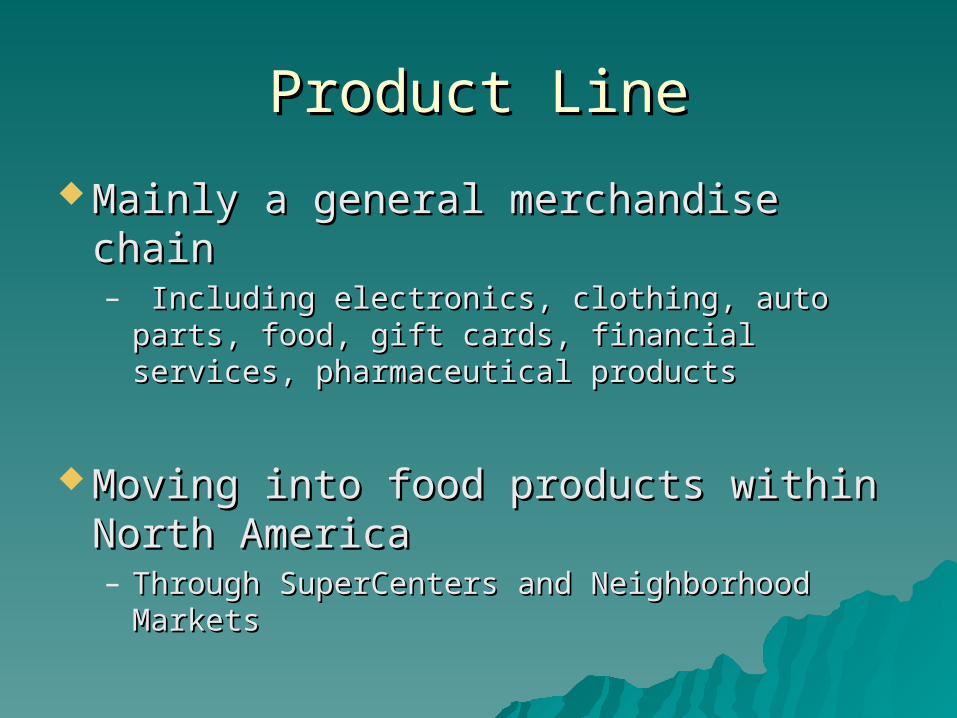
Product LineProduct Line
Mainly a general merchandise chainMainly a general merchandise chain– Including electronics, clothing, auto parts, Including electronics, clothing, auto parts,
food, gift cards, financial services, food, gift cards, financial services, pharmaceutical products pharmaceutical products
Moving into food products within Moving into food products within North AmericaNorth America– Through SuperCenters and Neighborhood Through SuperCenters and Neighborhood
MarketsMarkets

WAL-MART’SWAL-MART’Sgrowth Strategygrowth Strategy
Continue to diversify the product Continue to diversify the product line offered at domestic locationsline offered at domestic locations

Wal-Mart’s DivisionsWal-Mart’s Divisions
Discount centersDiscount centers– Sales general merchandise and food Sales general merchandise and food
productsproducts Sam’s ClubSam’s Club
– A business to business operationA business to business operation International operationsInternational operations
– Focuses is on South America and AsiaFocuses is on South America and Asia
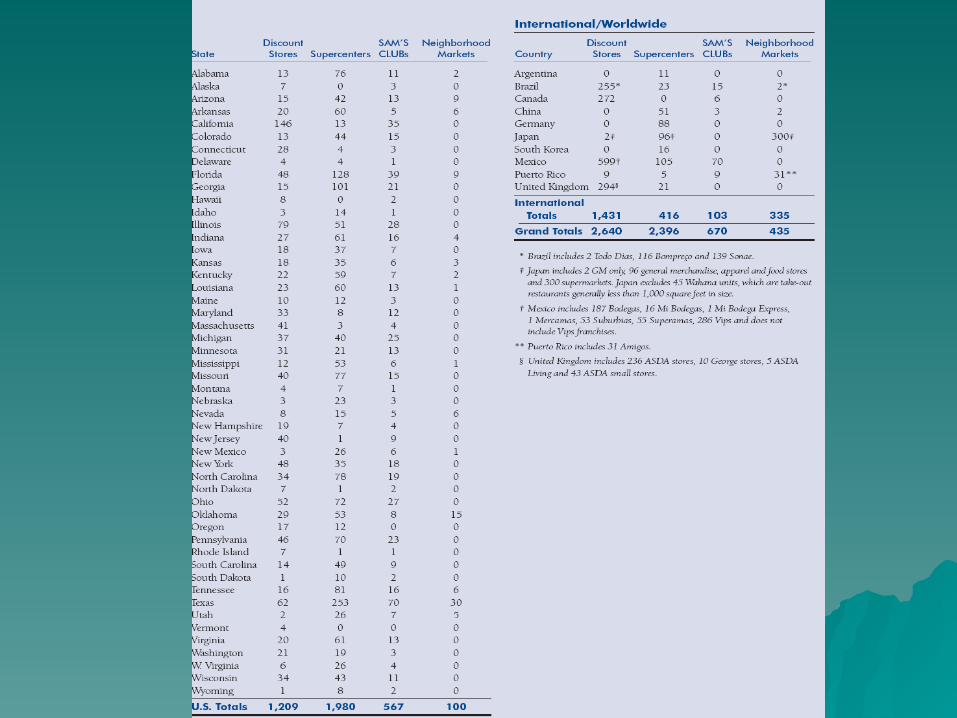

WAL-MARTWAL-MARTDomestic MarketDomestic Market
Four Major Store typesFour Major Store types1.1. Discount stores -1,209Discount stores -1,209
– Sq. ft. 102,000Sq. ft. 102,000
2.2. Supercenters – 1980Supercenters – 1980– Sq. ft. 187,000Sq. ft. 187,000
3.3. Sam’s Club – 567Sam’s Club – 567– Sq. ft. 129,000Sq. ft. 129,000
4.4. Neighborhood Markets – 100Neighborhood Markets – 100sq. ft. 42,000sq. ft. 42,000

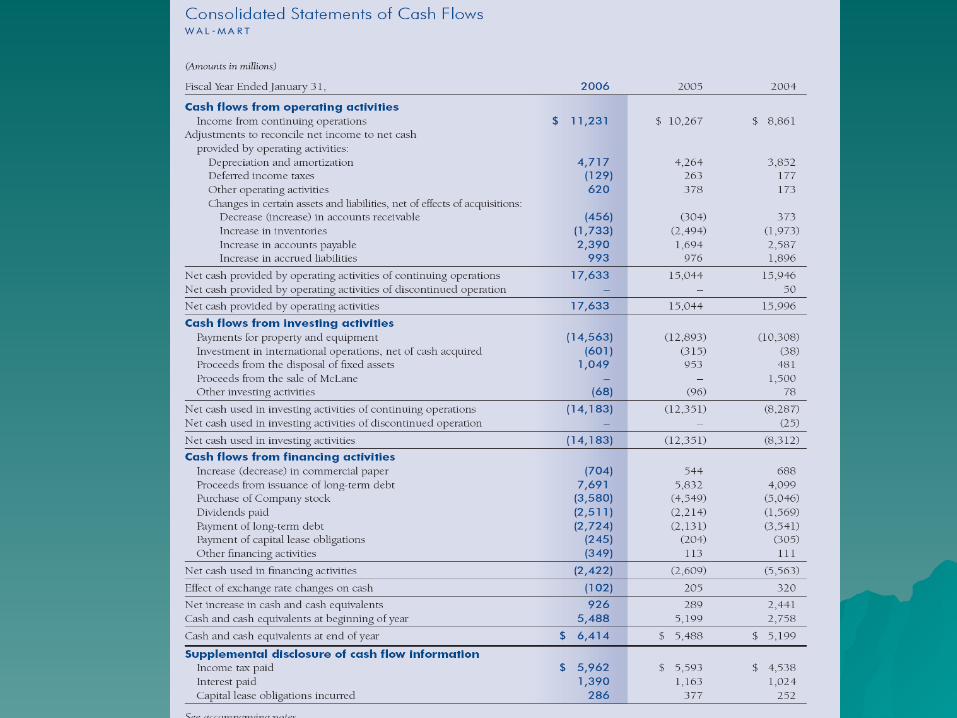
SALES BREAKDOWN
2006 2005 2004
Net Sales
Percent of
totalPercent Increase Net Sales
Percent of total
Percent Increase Net Sales
Percent of total
Wal-Mart Stores $ 209,910 67% 9%
$191,826 67% 10% $174,220 68%
Sam's Club 39,798 13% 7%
37,119 13% 8%
34,537 14%
International 62,719 20% 11%
56,277 20% 18%
47,572 19%
Total $ 312,427 100% 10% $285,222 100% 11% $256,329 100%
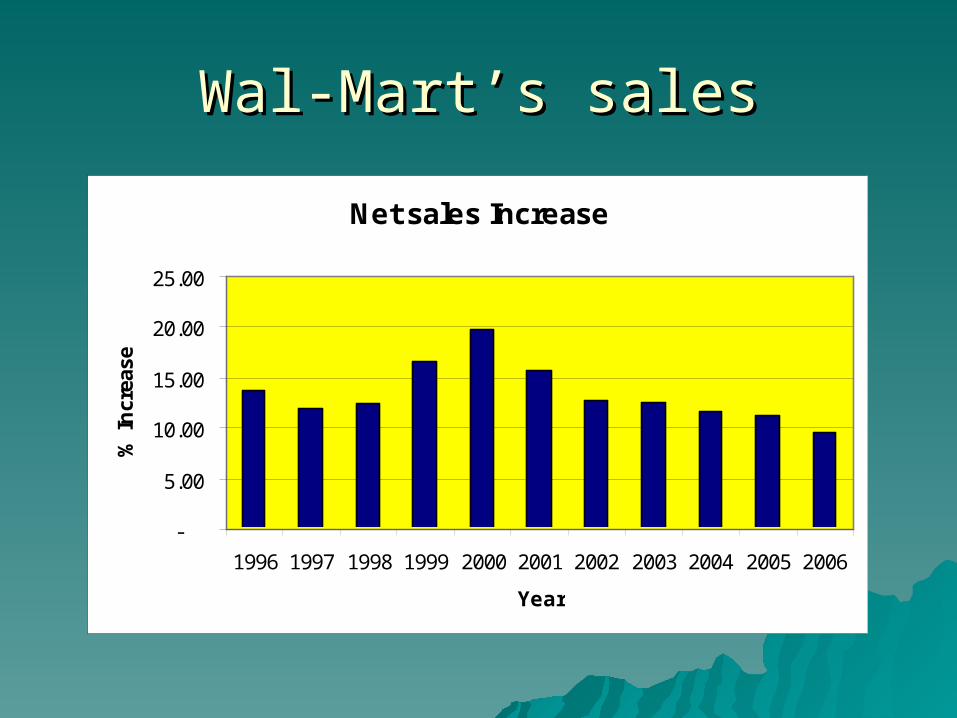
Wal-Mart’s salesWal-Mart’s sales
Net sales Increase
-
5.00
10.00
15.00
20.00
25.00
1996 1997 1998 1999 2000 2001 2002 2003 2004 2005 2006
Year
% I
ncr
ease
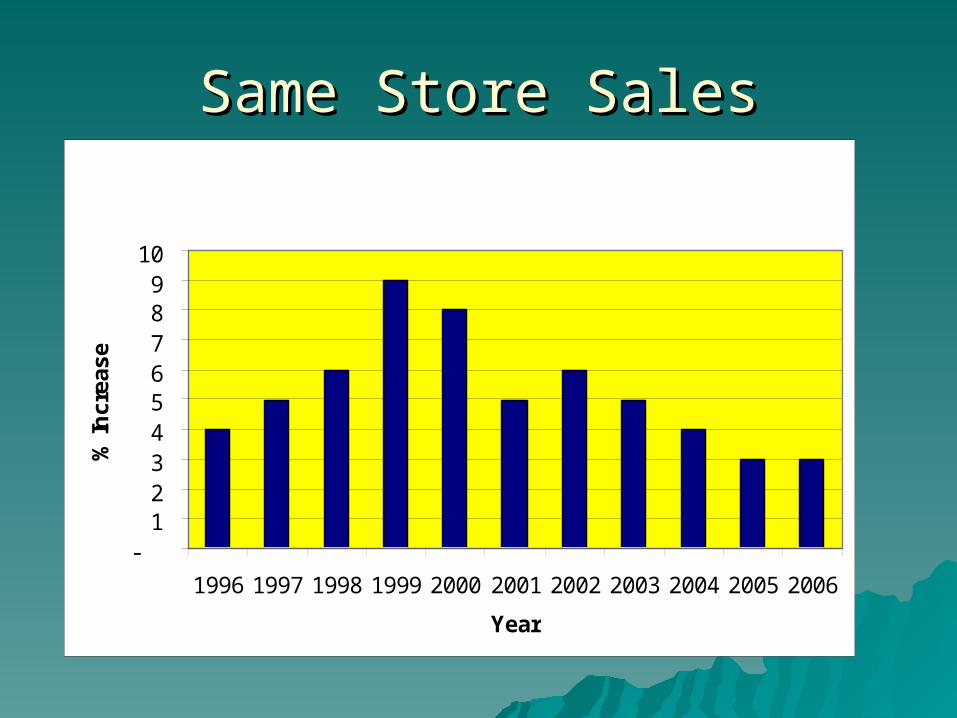
Same Store SalesSame Store Sales
-123456789
10
1996 1997 1998 1999 2000 2001 2002 2003 2004 2005 2006
Year
% In
crea
se

Sales Per Square Feet
273 288 293318 341
369 388 405 423 433 415
0
100
200
300
400
500
1996 1997 1998 1999 2000 2001 2002 2003 2004 2005 2006
Year
$ p
er s
q. f
t.
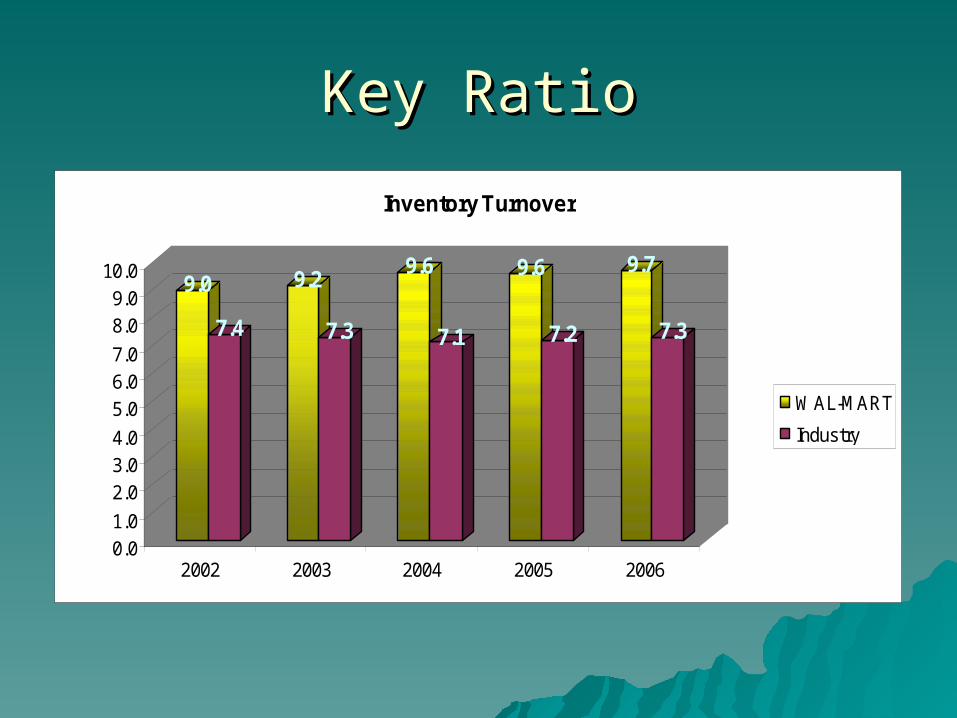
Key RatioKey Ratio
9.0
7.4
9.2
7.3
9.6
7.1
9.6
7.2
9.7
7.3
0.01.0
2.03.04.0
5.06.07.0
8.09.0
10.0
2002 2003 2004 2005 2006
Inventory Turnover
WAL-MART
Industry
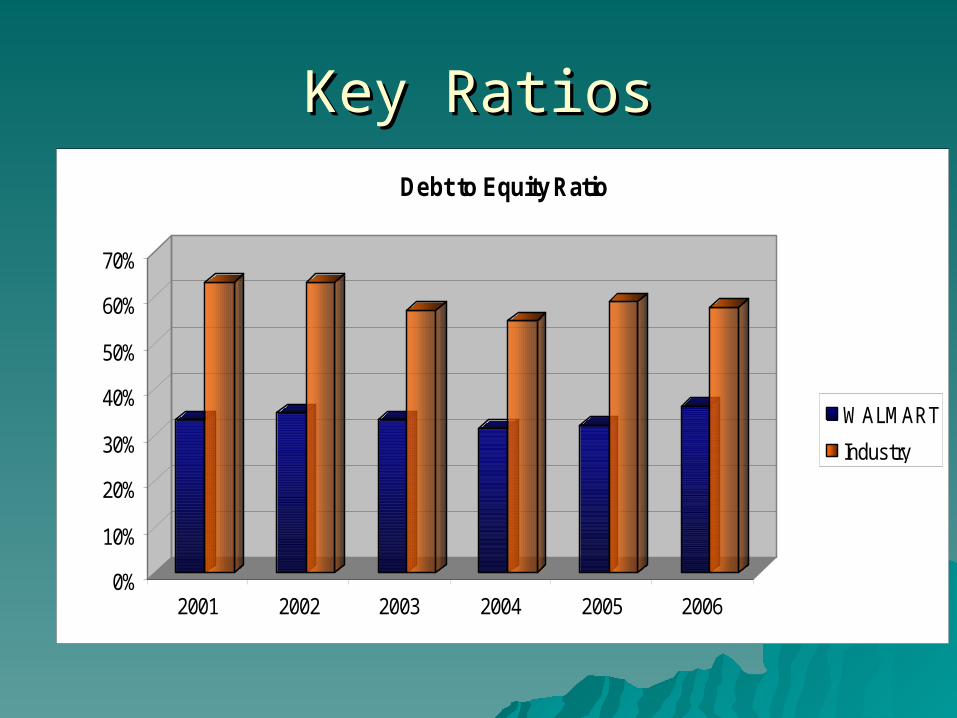
Key RatiosKey Ratios
0%
10%
20%
30%
40%
50%
60%
70%
2001 2002 2003 2004 2005 2006
Debt to Equity Ratio
WALMART
Industry

Key RatiosKey Ratios
-
5.00
10.00
15.00
20.00
25.00
30.00
35.00
40.00
2001 2002 2003 2004 2005 2006
P/E Ratio
P/E WALMART
P/E Industry
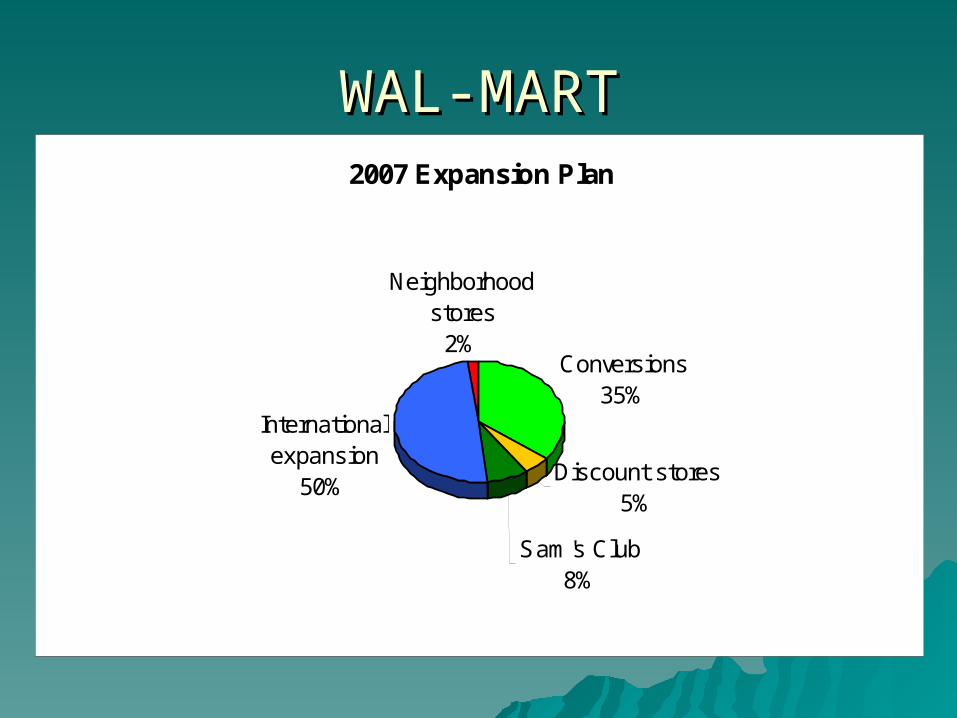
WAL-MARTWAL-MART2007 Expansion Plan
Conversions35%
Discount stores5%
Sam's Club8%
International expansion
50%
Neighborhood stores
2%
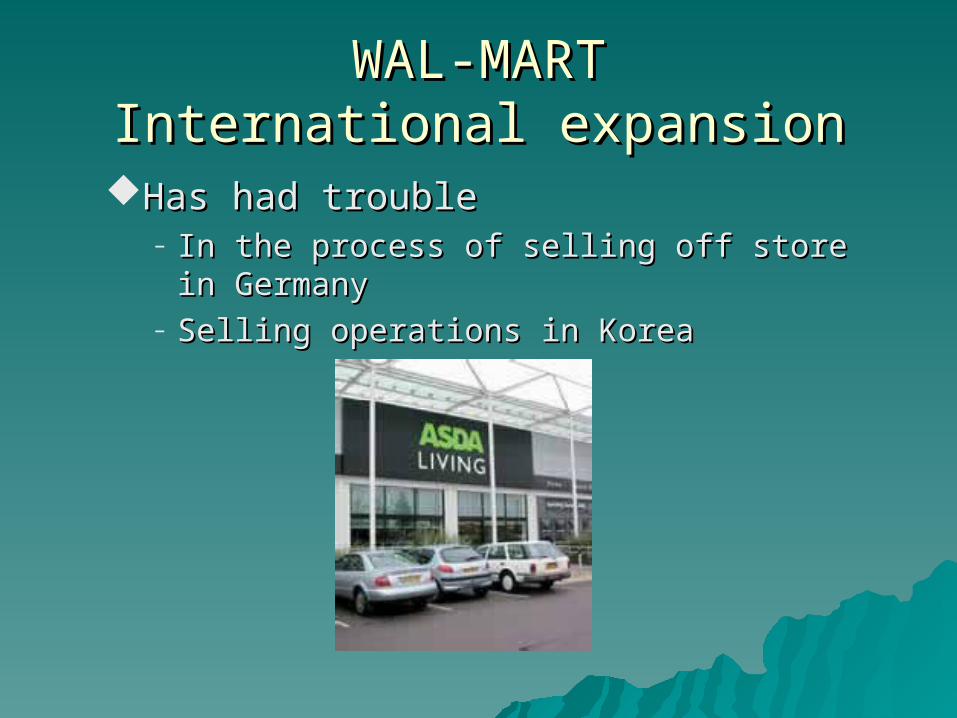
WAL-MARTWAL-MARTInternational expansionInternational expansion
Has had troubleHas had trouble– In the process of selling off store in GermanyIn the process of selling off store in Germany– Selling operations in KoreaSelling operations in Korea
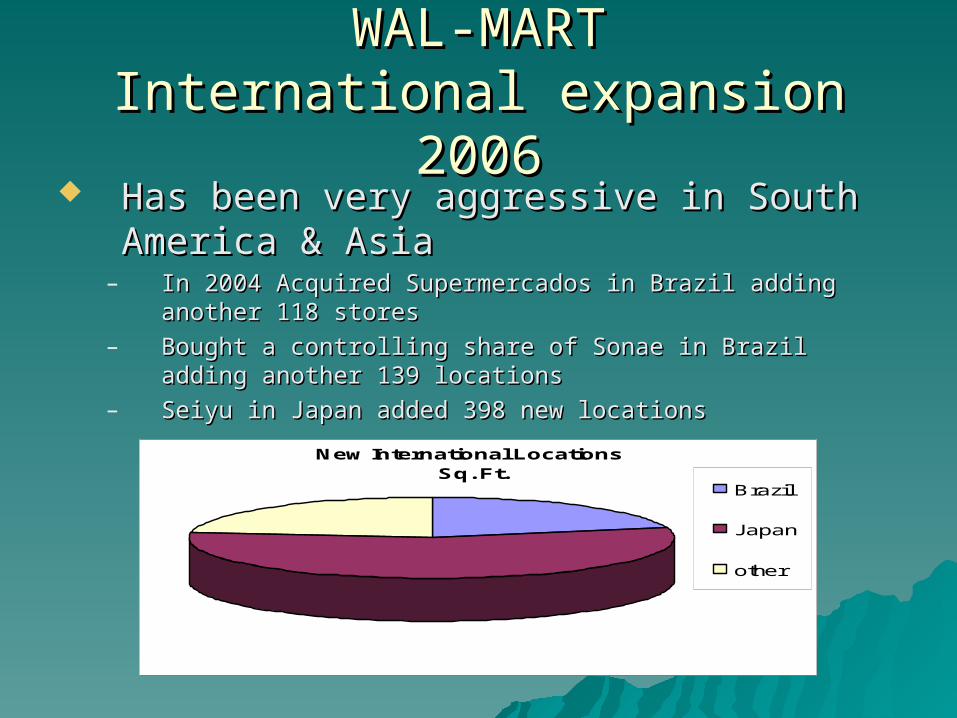
WAL-MARTWAL-MARTInternational expansion 2006International expansion 2006
Has been very aggressive in South Has been very aggressive in South America & AsiaAmerica & Asia
– In 2004 Acquired Supermercados in Brazil adding another In 2004 Acquired Supermercados in Brazil adding another 118 stores118 stores
– Bought a controlling share of Sonae in Brazil adding another Bought a controlling share of Sonae in Brazil adding another 139 locations139 locations
– Seiyu in Japan added 398 new locationsSeiyu in Japan added 398 new locations
New International Locations Sq. Ft.
Brazil
Japan
other
WAL-MARTWAL-MARTDomestic LocationsDomestic Locations
Traditionally located in small towns and in Traditionally located in small towns and in suburban areassuburban areas
Now trying to move into more urban areas Now trying to move into more urban areas and creating larger stores with a greater and creating larger stores with a greater selection of productsselection of products
Experimenting with food only locationsExperimenting with food only locations
WAL-MARTWAL-MARTSupply ChainSupply Chain
Over 60,000 suppliersOver 60,000 suppliers
Shares vital information with suppliersShares vital information with suppliers Owns the worlds largest privately held satellite Owns the worlds largest privately held satellite
system used to track inventory and store sales system used to track inventory and store sales Most advanced distribution centersMost advanced distribution centers
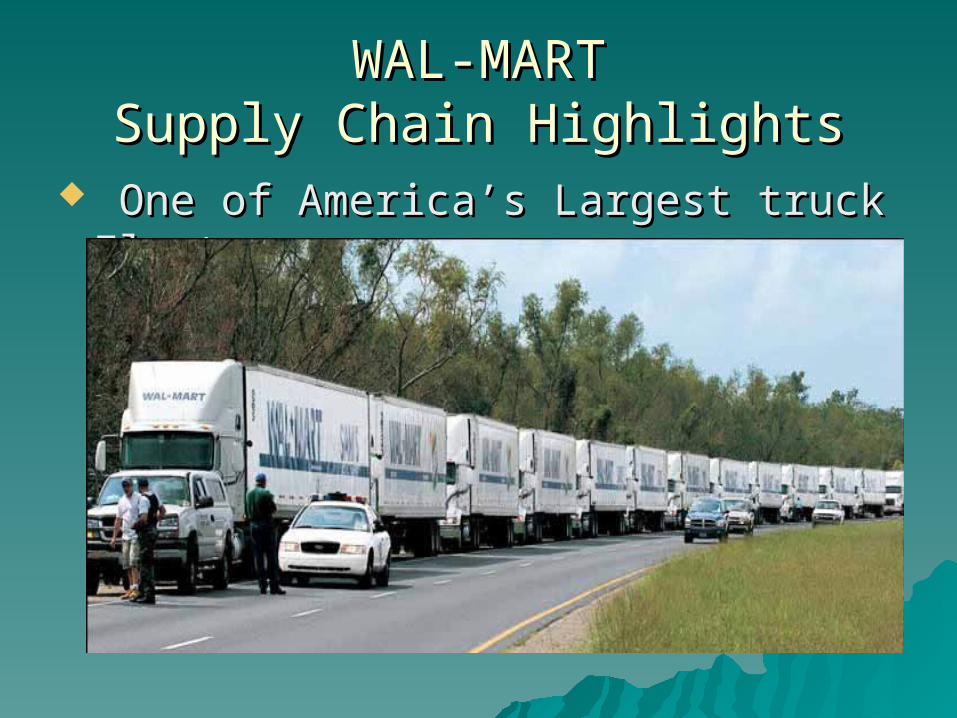
WAL-MARTWAL-MARTSupply Chain HighlightsSupply Chain Highlights
One of America’s Largest truck FleetOne of America’s Largest truck Fleet
SuggestionSuggestion
Hold for long-term slow growthHold for long-term slow growth
Reasons: Solid fundamentalsReasons: Solid fundamentals
Understands what needs to Understands what needs to be changed be changed
Planning for the future by Planning for the future by becoming more sustainable becoming more sustainable
Company OverviewCompany Overview
Listed on NasdaqListed on Nasdaq Part of the S&P Part of the S&P
500, Russell 1000500, Russell 1000 Ticker Symbol: Ticker Symbol:
COSTCOST Industry: Discount Industry: Discount
Variety StoreVariety Store
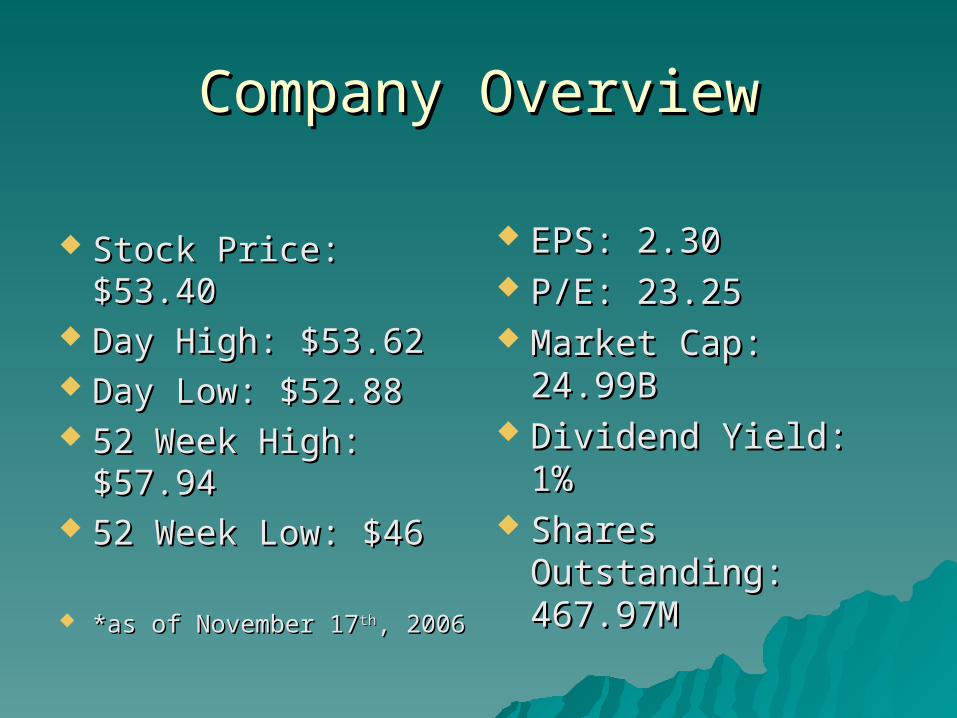
Company OverviewCompany Overview
Stock Price: $53.40 Stock Price: $53.40 Day High: $53.62Day High: $53.62 Day Low: $52.88Day Low: $52.88 52 Week High: $57.9452 Week High: $57.94 52 Week Low: $4652 Week Low: $46
*as of November 17*as of November 17thth, 2006, 2006
EPS: 2.30EPS: 2.30 P/E: 23.25 P/E: 23.25 Market Cap: 24.99B Market Cap: 24.99B Dividend Yield: 1%Dividend Yield: 1% Shares Outstanding: Shares Outstanding:
467.97M 467.97M
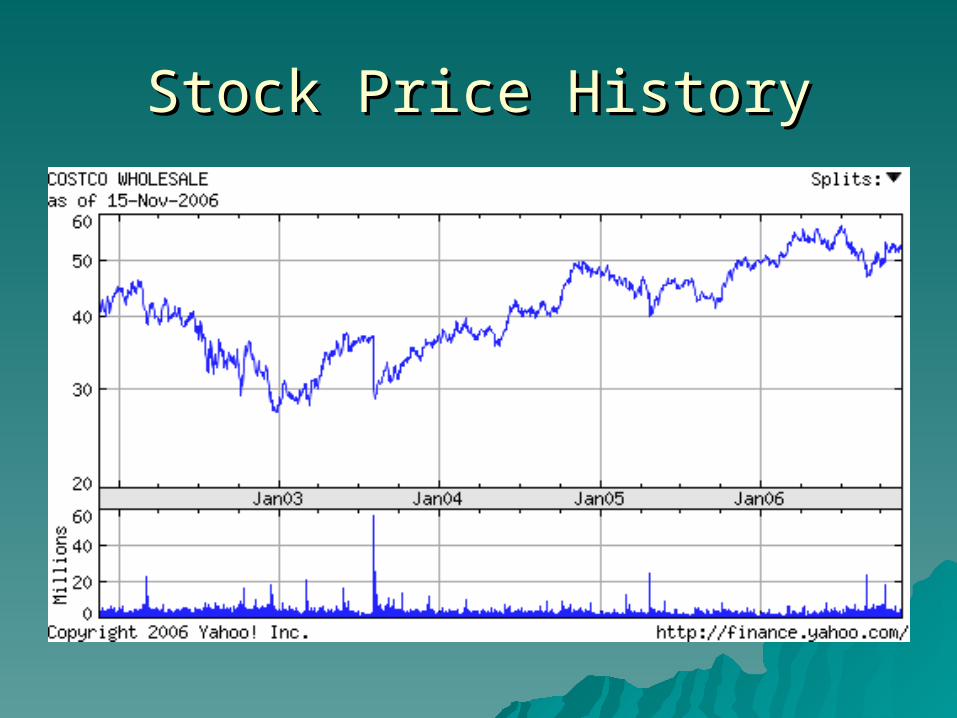
Stock Price HistoryStock Price History

Costco Stock Price vs S&P 500Costco Stock Price vs S&P 500

Company OverviewCompany Overview
No. 28 in Fortune 500No. 28 in Fortune 500 44thth largest retailer in USA largest retailer in USA 77thth largest in the world largest in the world 82 fewer stores than Sam’s Club but 82 fewer stores than Sam’s Club but
generate $20 B more in salesgenerate $20 B more in sales
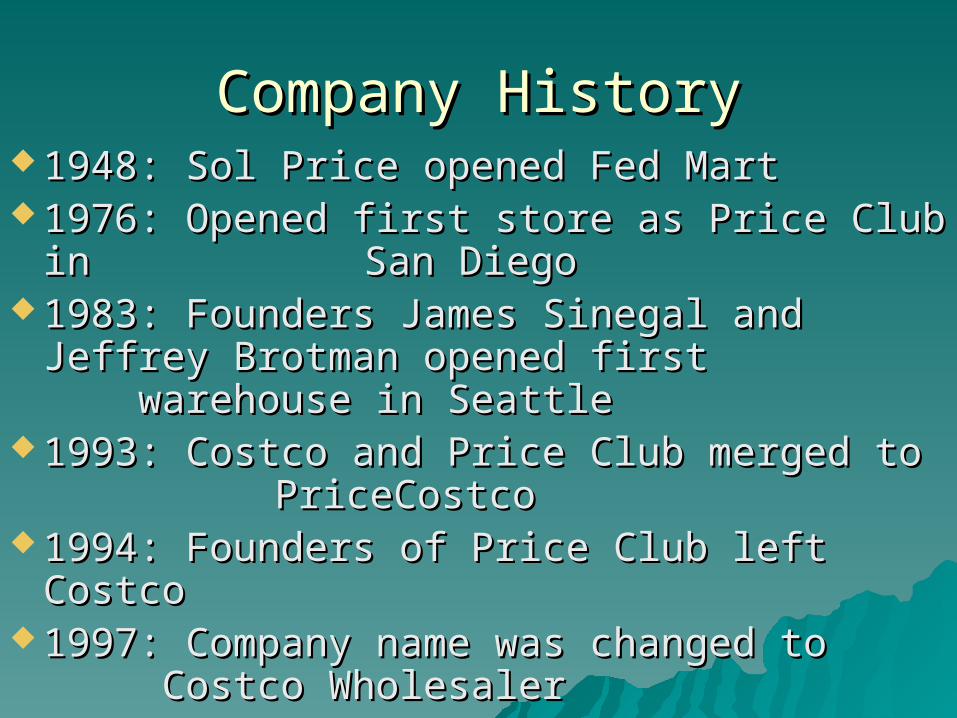
Company HistoryCompany History 1948: Sol Price opened Fed Mart 1948: Sol Price opened Fed Mart 1976: Opened first store as Price Club in 1976: Opened first store as Price Club in
San Diego San Diego 1983: Founders James Sinegal and 1983: Founders James Sinegal and
Jeffrey Brotman opened first Jeffrey Brotman opened first warehouse in Seattlewarehouse in Seattle
1993: Costco and Price Club merged to 1993: Costco and Price Club merged to PriceCostco PriceCostco
1994: Founders of Price Club left Costco1994: Founders of Price Club left Costco 1997: Company name was changed to 1997: Company name was changed to
Costco Wholesaler Costco Wholesaler
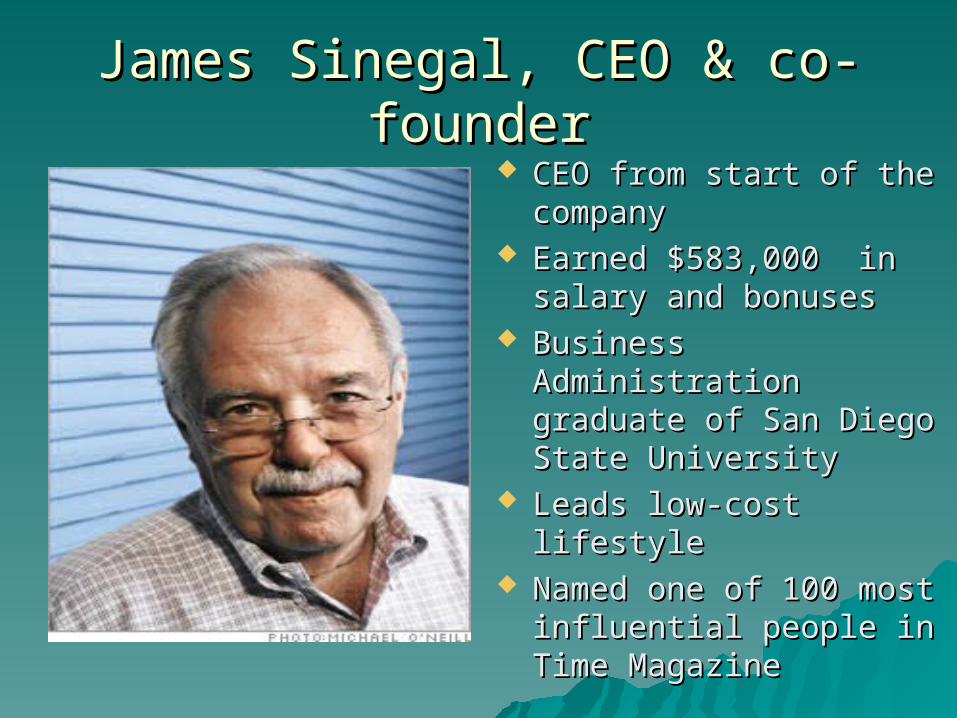
James Sinegal, CEO & co-founderJames Sinegal, CEO & co-founder CEO from start of the CEO from start of the
companycompany Earned $583,000 in Earned $583,000 in
salary and bonusessalary and bonuses Business Administration Business Administration
graduate of San Diego graduate of San Diego State University State University
Leads low-cost lifestyleLeads low-cost lifestyle Named one of 100 most Named one of 100 most
influential people in Time influential people in Time MagazineMagazine
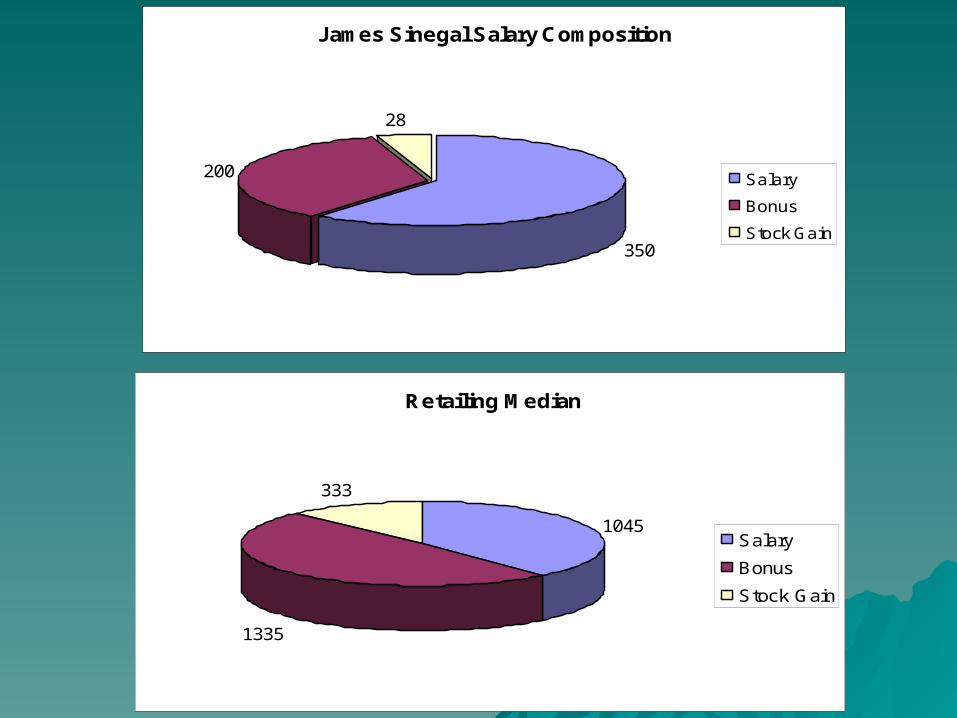
James Sinegal Salary Composition
350
200
28
Salary
Bonus
Stock Gain
Retailing Median
1045
1335
333
Salary
Bonus
Stock Gain
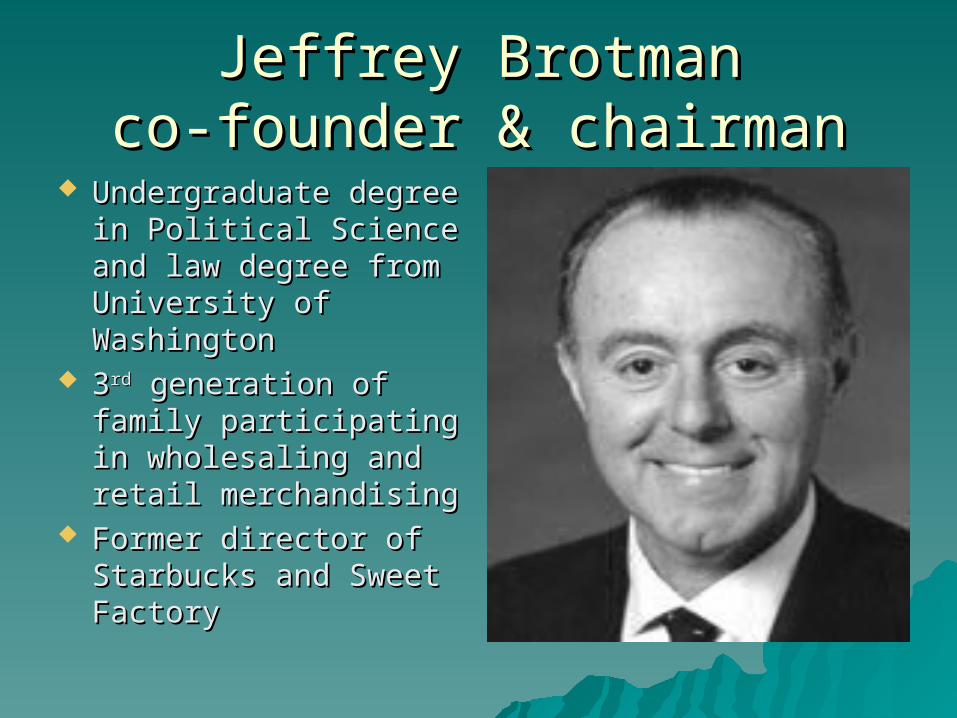
Jeffrey BrotmanJeffrey Brotmanco-founder & chairmanco-founder & chairman
Undergraduate degree Undergraduate degree in Political Science and in Political Science and law degree from law degree from University of University of WashingtonWashington
33rdrd generation of generation of family participating in family participating in wholesaling and retail wholesaling and retail merchandisingmerchandising
Former director of Former director of Starbucks and Sweet Starbucks and Sweet FactoryFactory
Costco TodayCostco Today
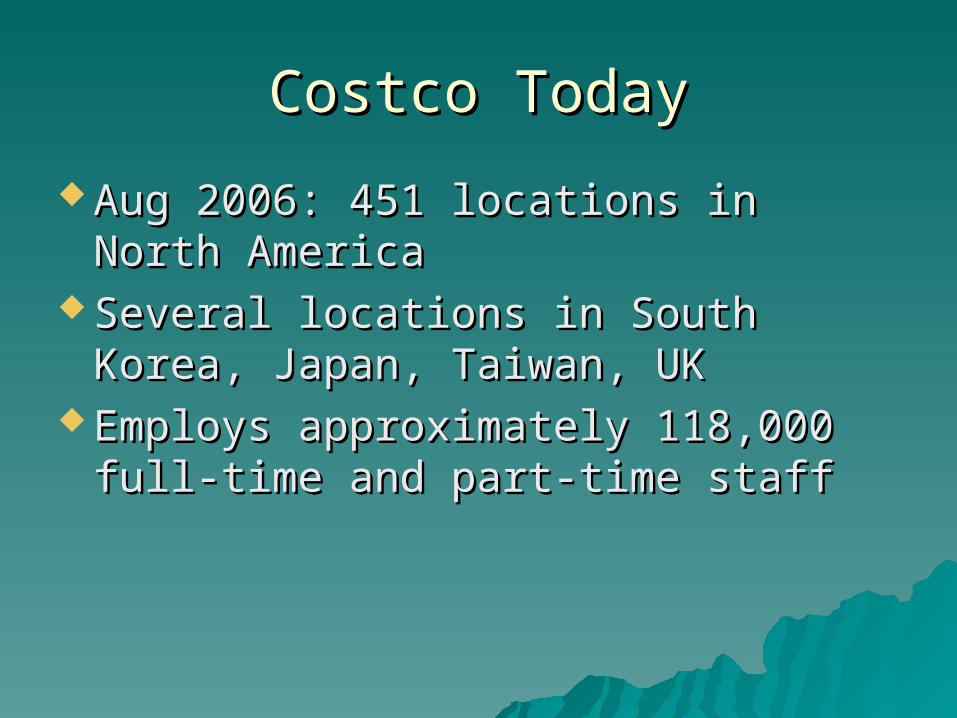
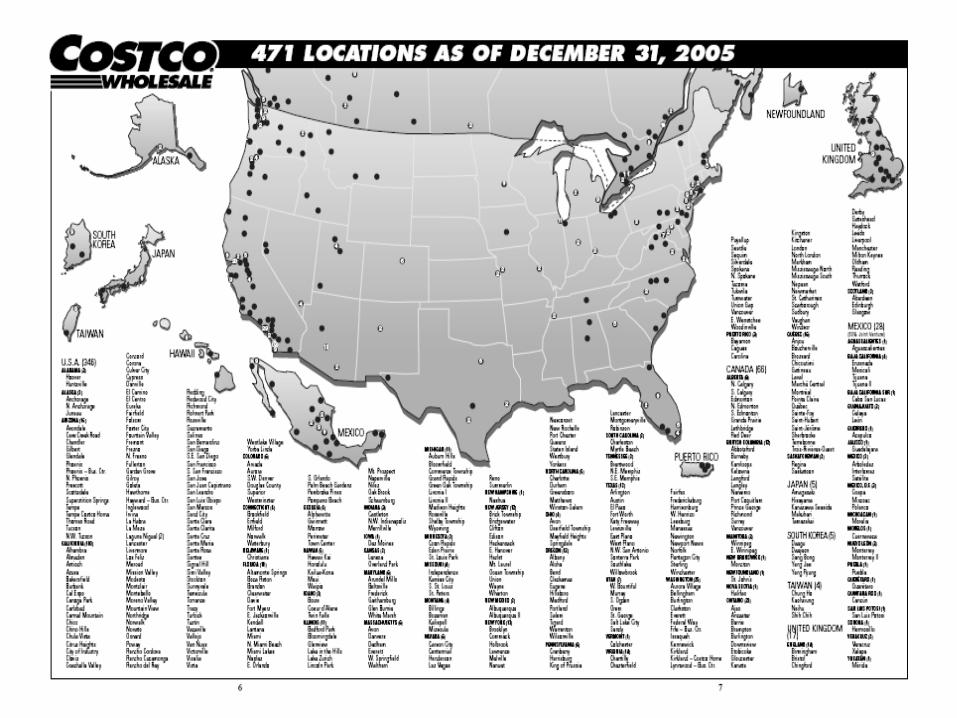
Aug 2006: 451 locations in North Aug 2006: 451 locations in North AmericaAmerica
Several locations in South Korea, Several locations in South Korea, Japan, Taiwan, UKJapan, Taiwan, UK
Employs approximately 118,000 full-Employs approximately 118,000 full-time and part-time stafftime and part-time staff
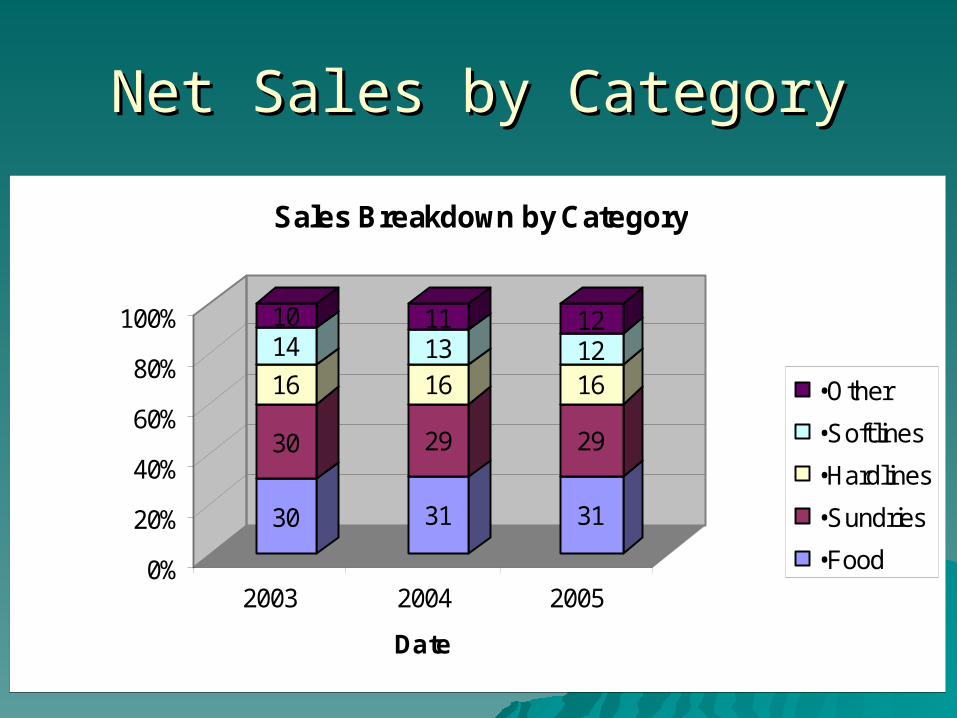
Net Sales by CategoryNet Sales by Category
30
30
16
1410
31
29
161311
31
29
161212
0%
20%
40%
60%
80%
100%
2003 2004 2005
Date
Sales Breakdown by Category
•Other
•Softlines
•Hardlines
•Sundries
•Food
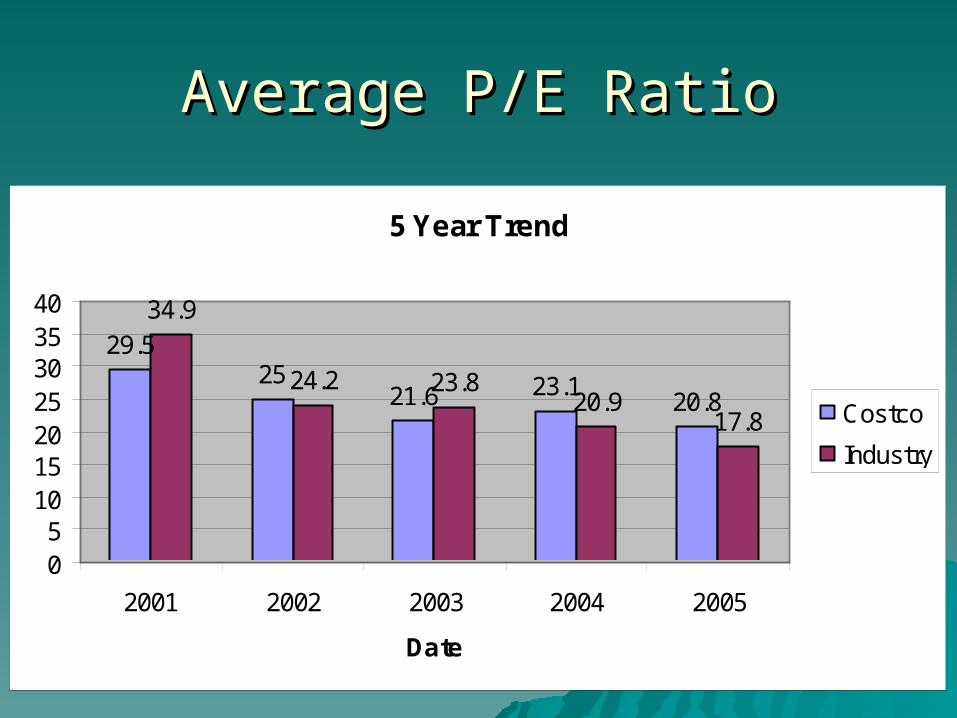
Average P/E RatioAverage P/E Ratio
5 Year Trend
29.525
21.6 23.120.8
34.9
24.2 23.820.9
17.8
05
10152025303540
2001 2002 2003 2004 2005
Date
Costco
Industry

Sales per square foot (Annual)Sales per square foot (Annual)CompanyCompany
TargetTarget $307$307
NordstromNordstrom $369$369
Home DepotHome Depot $377$377
Wal-Mart*Wal-Mart* $438$438
BJ'sBJ's $445$445
Sam's Club*Sam's Club* $552$552
CostcoCostco $918$918
Best BuyBest Buy $941$941
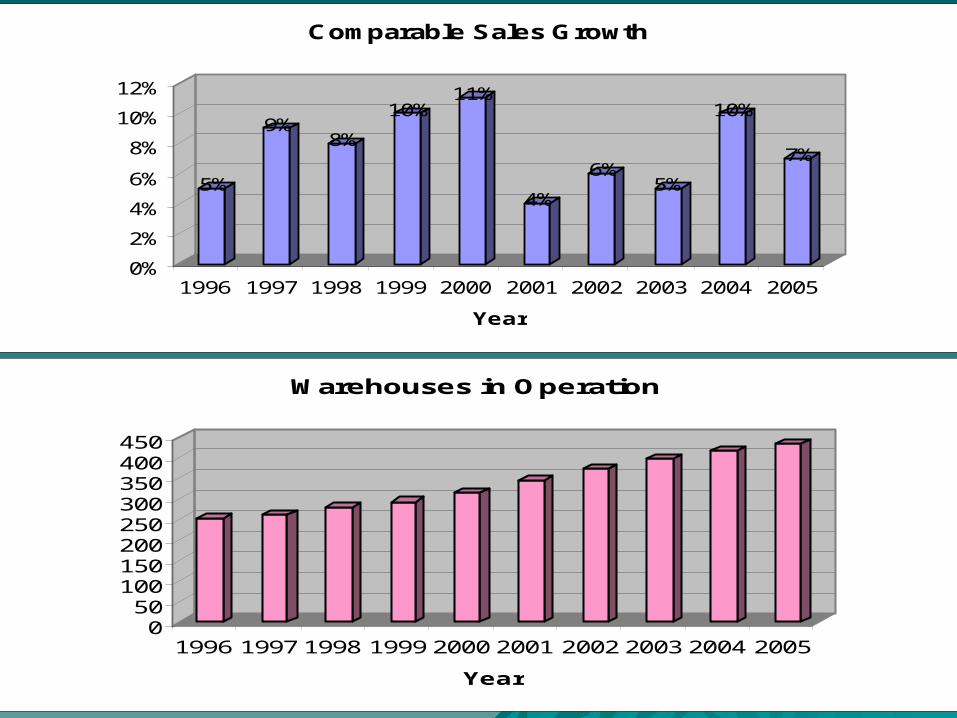
050
100150200250300350400450
1996 1997 1998 1999 2000 2001 2002 2003 2004 2005
Year
Warehouses in Operation
5%
9%8%
10%11%
4%
6%5%
10%
7%
0%
2%
4%
6%
8%
10%
12%
1996 1997 1998 1999 2000 2001 2002 2003 2004 2005
Year
Comparable Sales Growth
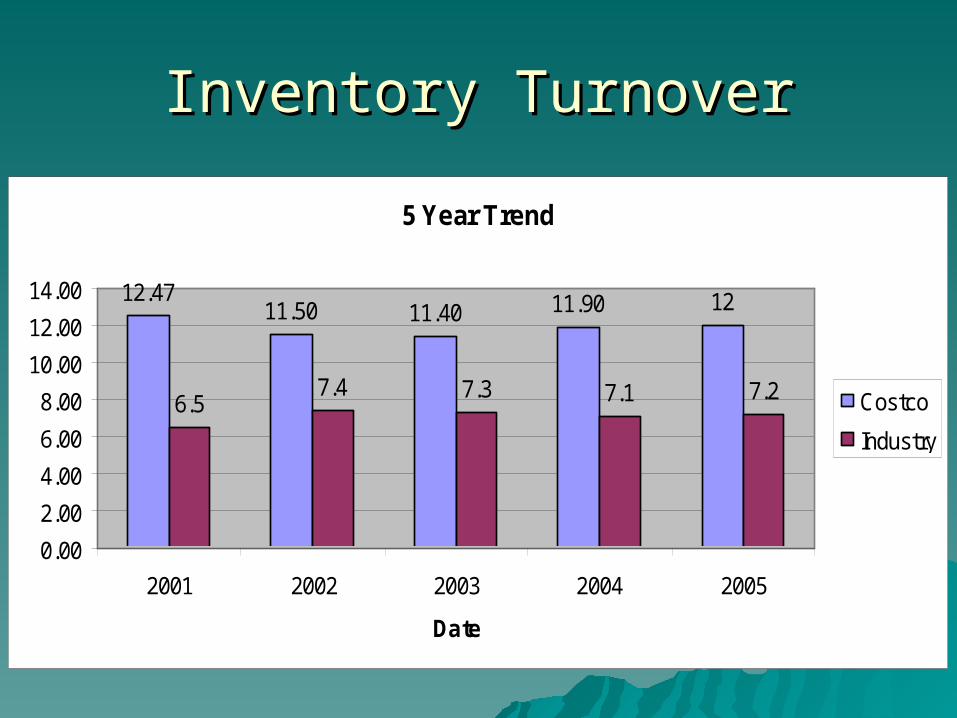
Inventory TurnoverInventory Turnover
5 Year Trend
12.4711.50 11.40 11.90 12
6.57.4 7.3 7.1 7.2
0.00
2.00
4.00
6.00
8.00
10.00
12.00
14.00
2001 2002 2003 2004 2005
Date
Costco
Industry
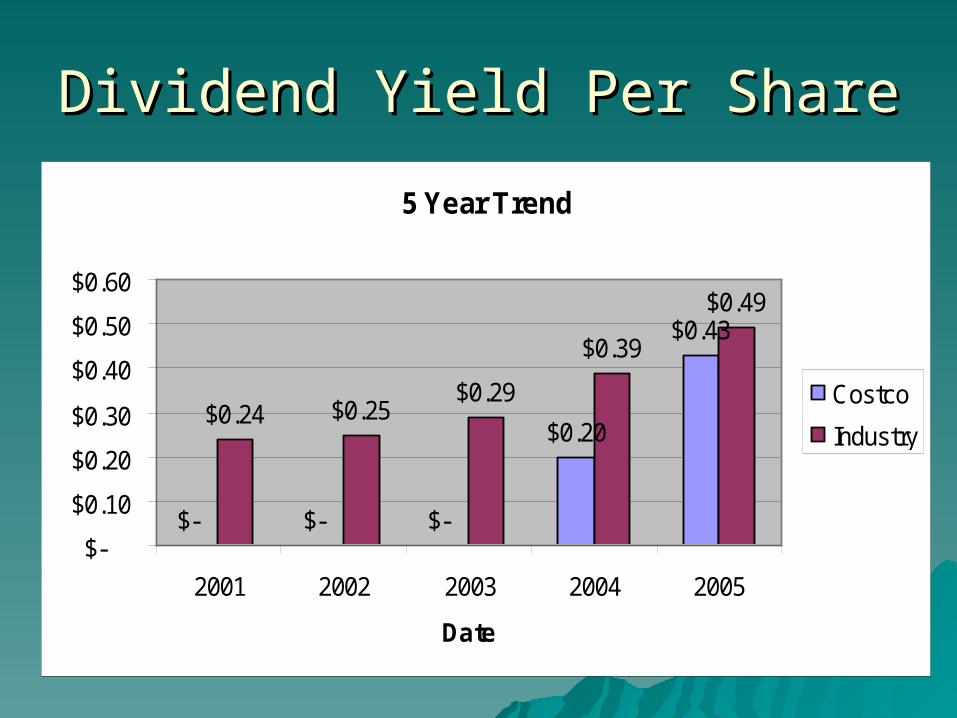
Dividend Yield Per ShareDividend Yield Per Share
5 Year Trend
$- $- $-
$0.20
$0.43
$0.24 $0.25$0.29
$0.39
$0.49
$-
$0.10
$0.20
$0.30
$0.40
$0.50
$0.60
2001 2002 2003 2004 2005
Date
Costco
Industry
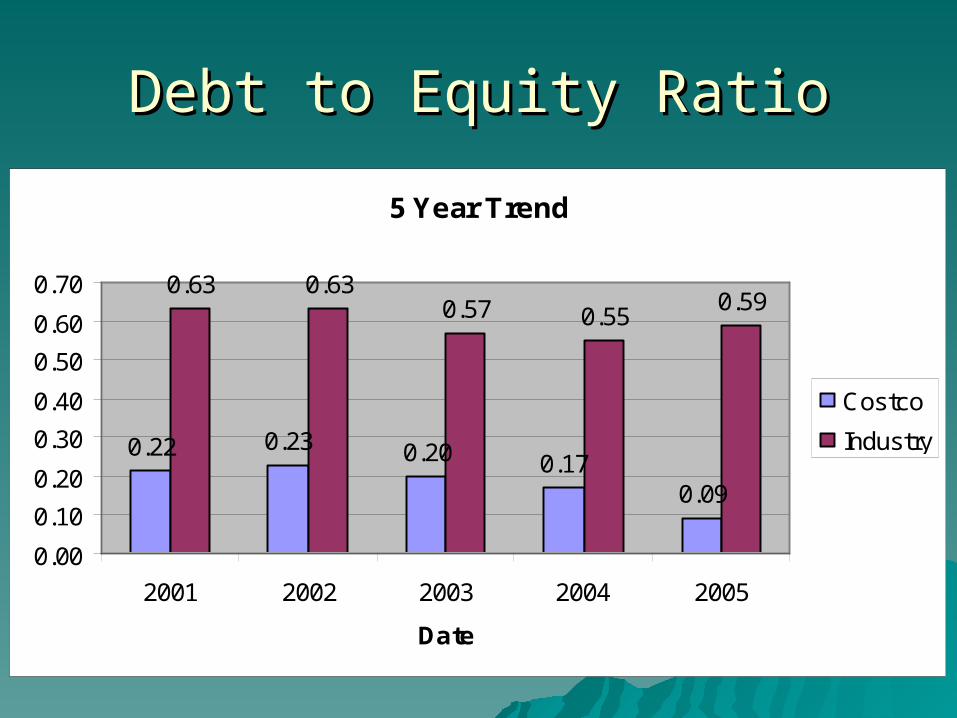
Debt to Equity RatioDebt to Equity Ratio
5 Year Trend
0.22 0.23 0.20 0.170.09
0.63 0.630.57 0.55
0.59
0.00
0.10
0.20
0.30
0.40
0.50
0.60
0.70
2001 2002 2003 2004 2005
Date
Costco
Industry
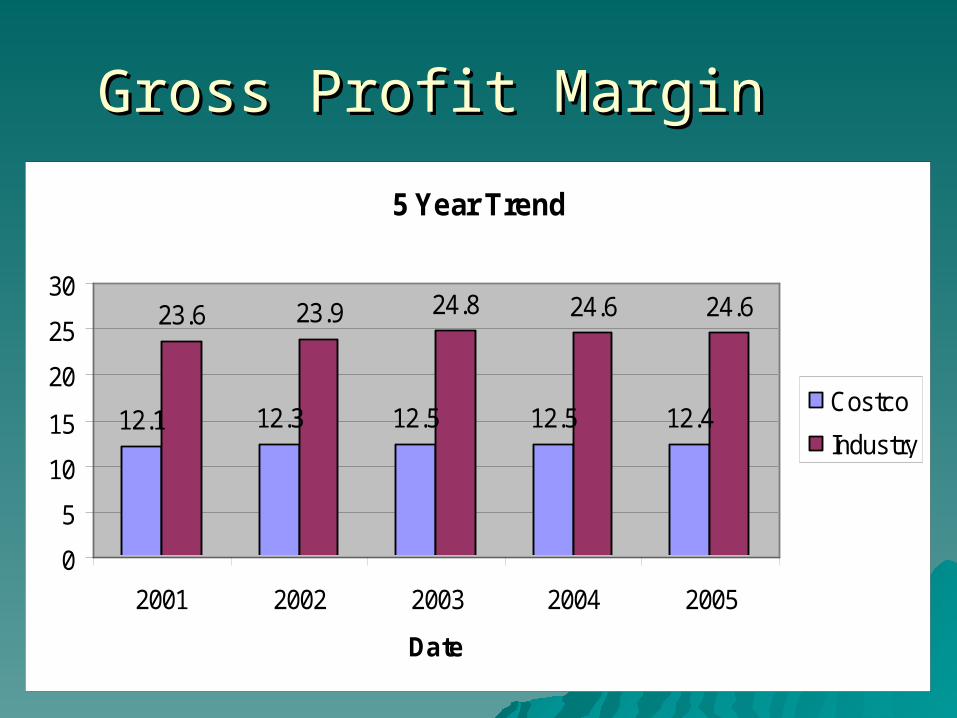
Gross Profit MarginGross Profit Margin
5 Year Trend
12.1 12.3 12.5 12.5 12.4
23.6 23.9 24.8 24.6 24.6
0
5
10
15
20
25
30
2001 2002 2003 2004 2005
Date
Costco
Industry
Driving factorsDriving factors
1) Low cost of goods1) Low cost of goods
achieved throughachieved through
distribution anddistribution and
supply chainsupply chain
2) Image2) Image
3) Location3) Location
4) Product line4) Product line
Low cost of goods achieved through Low cost of goods achieved through distribution and supply chaindistribution and supply chain
Volume purchasing Volume purchasing Purchasing directly from Purchasing directly from
manufacturersmanufacturers Pre-paying vendors to receive Pre-paying vendors to receive
payment discounts payment discounts Minimizing stocking feesMinimizing stocking fees
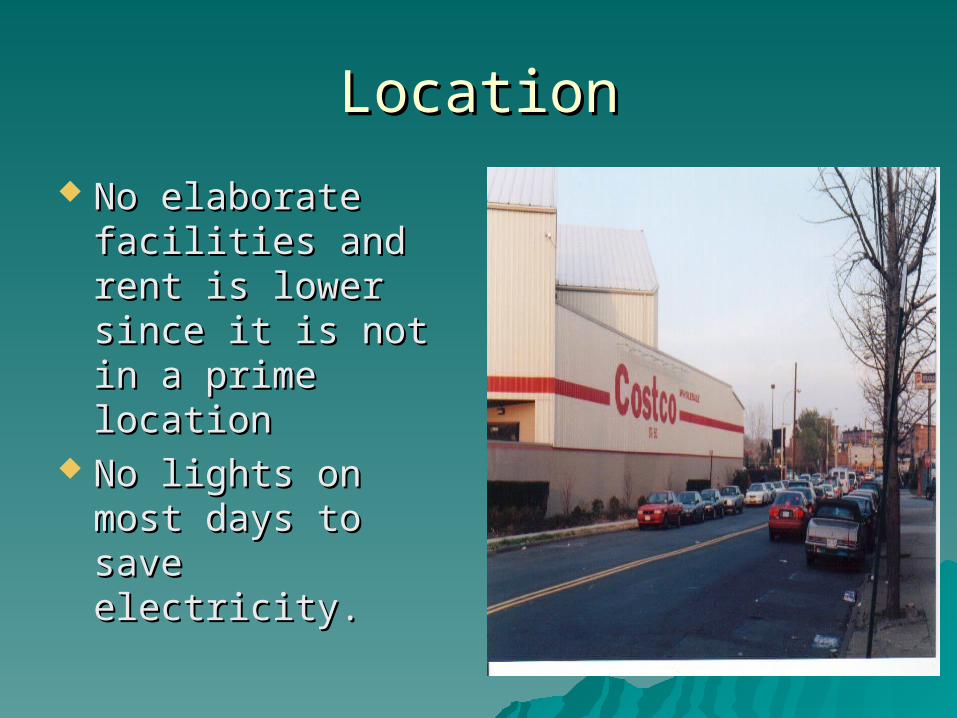
LocationLocation
No elaborate No elaborate facilities and rent is facilities and rent is lower since it is not lower since it is not in a prime locationin a prime location
No lights on most No lights on most days to save days to save electricity. electricity.

ImageImage
Known as the big box retailer that Known as the big box retailer that treats employees welltreats employees well
Return policyReturn policy– No deadlinesNo deadlines

Product lineProduct line
Limiting products to fast selling Limiting products to fast selling models, sizes and colours models, sizes and colours – Carry only 4000 items Carry only 4000 items
Rapid inventory turnoverRapid inventory turnover No-name products can be marked by No-name products can be marked by
more than 14%; private items 15%more than 14%; private items 15%
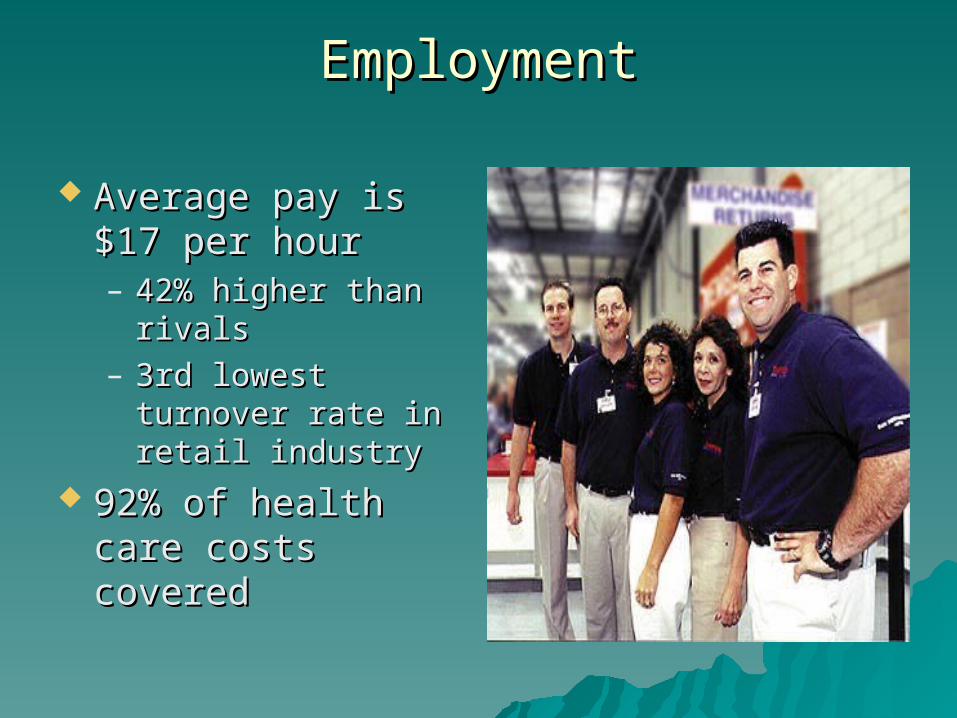
EmploymentEmployment
Average pay is $17 Average pay is $17 per hour per hour – 42% higher than 42% higher than
rivalsrivals– 3rd lowest turnover 3rd lowest turnover
rate in retail rate in retail industryindustry
92% of health care 92% of health care costs covered costs covered
Low ShrinkageLow Shrinkage
(under 0.20% for 2005)(under 0.20% for 2005) Entrances and Exits are controlledEntrances and Exits are controlled Membership format limits theftMembership format limits theft Good relations among employees Good relations among employees
limits internal theftlimits internal theft

Cost Minimizing StrategyCost Minimizing Strategy
Minimal advertising expensesMinimal advertising expenses• Reduces costs by 2% per yearReduces costs by 2% per year• Limited to advertising new warehouse Limited to advertising new warehouse
openingsopenings• direct mail marketing to prospective direct mail marketing to prospective
new membersnew members• direct marketing programs to existing direct marketing programs to existing
members promoting selected members promoting selected merchandisemerchandise
Cost Minimizing StrategyCost Minimizing Strategy
No FrillsNo Frills– No signs saying what's in what aisle. No signs saying what's in what aisle. – No bags. No bags. – No Visas or MasterCards are accepted No Visas or MasterCards are accepted
(avoiding service charges) (avoiding service charges)
Plans for the FuturePlans for the Future
Opening 25-30 more stores across Opening 25-30 more stores across the USA in fiscal 2006the USA in fiscal 2006
Opening 7 more stores in England Opening 7 more stores in England and Mexicoand Mexico
Expanding to several hundred more Expanding to several hundred more Kirkland Signature items in the next Kirkland Signature items in the next 5 years to include diapers, 5 years to include diapers, cosmetics, etc.cosmetics, etc.
Open Costco Home storesOpen Costco Home stores
Current NewsCurrent News
Glass Ceiling for Women?Glass Ceiling for Women?– Suit filed in 2004 claims discrimination Suit filed in 2004 claims discrimination
against womenagainst women– Company discourages women from Company discourages women from
applying for mgmt positions and are not applying for mgmt positions and are not considered for promotionconsidered for promotion
– Nov 15, 2006: class action suit filed to Nov 15, 2006: class action suit filed to represent 700 women.represent 700 women.
RecommendationRecommendation
HoldHold large amounts of cash on handlarge amounts of cash on hand Paying off a large portion of debtPaying off a large portion of debt Dividends being paid outDividends being paid out Shares being repurchased Shares being repurchased