Embed Size (px)
Citation preview

No. 17-6 U.S. Consumer Cash Use, 2012 and 2015: An
Introduction to the Diary of Consumer Payment Choice
Claire Greene, Shaun O’Brien, and Scott Schuh
Abstract: U.S. consumer cash payments averaged 26 percent of all U.S. consumer payments by number (volume share) from 2008 to 2015, according to the Survey of Consumer Payment Choice (SCPC), and were essentially unchanged between 2012 and 2015. New estimates from the Diary of Consumer Payment Choice (DCPC) show that the volume share of consumer cash payments is higher than estimated in the SCPC and suggest that the cash volume share was 8 percentage points lower in 2015 than in 2012. The DCPC most likely does not provide an accurate estimate of the actual change in the cash volume share, however, due to changes in survey methodology. Counterfactual simulations controlling for survey and economic changes suggest the cash volume share declined approximately 2 to 5 percentage points due to changes in consumer preferences between 2012 and 2015.
Keywords: Cash, money, payments, consumer behavior, Diary of Consumer Payment Choice, Survey of Consumer Payment Choice
JEL Classifications: D12, D14, E42 Claire Greene is a payments analyst in the Consumer Payments Research Center in the research department of the Federal Reserve Bank of Boston. Scott Schuh is a senior economist and policy advisor at the Federal Reserve Bank of Boston and director of the Center. Shaun O’Brien is a senior analyst at the Cash Product Office based at the Federal Reserve Bank of San Francisco. Their email addresses are [email protected], [email protected], and [email protected], respectively.
This paper reflects the collaborative work of the Consumer Payments Research Center and the Federal Reserve Banks of San Francisco (Cash Product Office) and Richmond. The authors thank Jason Premo for excellent research assistance; Barbara Bennett, Marcin Hitczenko, Joanna Stavins, and Robert Triest for helpful comments; and Suzanne Lorant for superb editing.
This report, which may be revised, is available on the web site of the Federal Reserve Bank of Boston at www.bostonfed.org/economic/rdr/index.htm.
The views expressed in this paper are those of the authors and do not necessarily reflect the views of the Federal Reserve Bank of Boston, the Federal Reserve Bank of San Francisco, or the Federal Reserve System.
This version: October 25, 2017
2
1. Introduction Cash does not appear to be “dead,” or even “dying,” in the United States despite
widespread diffusion of electronic payment networks and proliferation of consumer payment
instruments in recent decades. Using the Federal Reserve Bank of Boston’s Survey of Consumer
Payment Choice (SCPC), Greene, Schuh, and Stavins (2016) show that the volume share
(number) of U.S. consumer payments that are cash averaged about 26 percent from 2008 to
2015; the cash share was notably higher in 2015 than it was in 2008 and about flat from 2012 to
2015. Using the Diary of Consumer Payment Choice (DCPC), which was co-sponsored by the
Federal Reserve Banks of Boston, Richmond, and San Francisco, Bagnall et al. (2016) reported
that the U.S. cash volume share of payments in 2012 was 41 percent—15 percentage points
higher than the volume share reported in the 2012 SCPC.
This paper provides a more detailed, official introduction to the DCPC, reporting new
results for 2015 to compare with 2012 and focusing on consumer use of cash (or currency, that
is, notes, bills, and coins). The DCPC represents an improvement in the measurement of
consumer payment choices over the SCPC in two ways. The DCPC asks respondents to record
every payment they make each day, whereas the SCPC asks respondents to recall from memory
how many payments they typically make during a longer period of time (week, month, or year).
Thus, the DCPC is expected to produce more accurate estimates of consumer payments. In
addition, the DCPC collects data on not only the number of payments but also the dollar value
of each payment. Accordingly, the DCPC adds a second dimension of payment use—the
value—that enriches understanding of consumer payment decisions.
SCPC and DCPC estimates of the volume of cash use in 2012 and 2015 are quite different
statistically and economically. The SCPC estimates indicate that the cash volume share was
virtually unchanged between the two years (0.3 percentage points higher in 2015). Matheny,
O’Brien, and Wang (2016), however, reported preliminary and unofficial 2015 DCPC estimates
that suggest cash volume was 8.2 percentage points lower than in 2012 (40.7 percent in 2012

3
versus 32.5 percent in 2015).1 Due to substantial changes in survey methodology, the 2012 and
2015 DCPC raw data estimates are unlikely to be an accurate estimate of the actual change in
cash share. Thus the implied change in U.S. consumer cash use, a decline of eight percentage
points in volume, almost surely does not accurately reflect actual changes in consumer
preferences for cash between 2012 and 2015.
Differences in survey methodology and economic conditions between the 2012 and 2015
DCPC likely contributed to differences in the DCPC estimates of consumer payments during
this period. The survey methodology of the 2015 DCPC includes two improvements over 2012:
revisions to the DCPC questionnaire and a switch to a better sampling frame. These
improvements likely affected the measurement of consumer payments; both had some
implementation flaws (described below). Moreover, U.S. economic conditions changed between
2012 and 2015, with falling unemployment and diminishing uncertainty from the financial
crisis. While changes in economic conditions could affect measurement of consumer payments
by the SCPC and DCPC, the latter may be more susceptible to economic fluctuations because it
measures actual daily activity, whereas the former measures typical behavior that presumably
abstracts from high-frequency developments.
The DCPC motivates an enhanced view of consumer payment choices relative to the
SCPC, providing estimates of the dollar value and number (volume) of payments. According to
the DCPC, the consumer value shares of cash payments were similar in 2012 and 2015 (12.4
percent and 11.4 percent, respectively). This 1.0 percentage point difference is modest compared
with the difference of 8.2 percentage points in the cash volume share. Thus, the value shares
suggest little change in consumer cash use, while volume shares point to a potentially large
decline. This apparent discrepancy in the picture of cash volume and value shares over time
implies another intriguing development: the average value of consumer cash payments (the
1 These unofficial estimates use the entire two-month survey period from 2015, October 16 to December 15, as opposed to the comparable 2012–2015 16-day period, October 16 to October 31, used in this report. See below for discussion of survey administration periods.

4
total value of payments divided by the total number) was higher in 2015 than in 2012 ($77
versus $70, respectively).2
Economic intuition suggests that consumers likely choose the value and number of
payments intentionally and simultaneously. Economic theory offers considerable guidance
about the determination of payment values, which represent consumer spending from income
(see Schuh forthcoming). However, neither economic theory nor the economics literature
provides much guidance for understanding how consumers choose the number of payments
they make during a period of time. The economics literature has demonstrated empirically that
the choice of payment instrument correlates with the dollar amount of payment. As first shown
by Klee (2008), consumers tend to use cash more often for small-value payments. Thus,
consumer joint decisions about the value and volume of payments determine the average
payment value. Even without measurement challenges, it is difficult to decompose and
interpret changes in the total value, total volume, and average value of payments without a
rigorous economic model.
Although we do not present such a model in this paper, we conduct two analyses to
assess observed DCPC data. First, we describe how the value, volume, and average value of
consumer payments changed over time at the aggregate U.S. level and for individual
consumers. These data begin to suggest how changes in economic conditions may have
influenced consumer payment choices and how changes in survey methodology may have
influenced the measurement of consumer payment choices. Second, we conduct counterfactual
simulations to quantify a likely range of estimates of the actual change in consumer preferences
for cash between 2012 and 2015. We estimate standard models of consumer choices of payment
instruments that depend on individual payment values, other factors related to economic
conditions (for example, income and employment status), and survey methodology. These
estimated models show very little change between 2012 and 2015 in consumer payments
defined by the probabilities of choosing particular instruments at various payment values. We
2 Throughout the paper, all dollar values are expressed in constant 2015 dollars to adjust for inflation.
5
then simulate the effects of substituting the actual 2012 and 2015 distributions of individual
payment values into the models of consumer payment choices for alternate years (that is, 2012
distributions into the 2015 model and vice versa). We conclude that a reasonable estimate of the
decline in cash volume shares attributable to changes in consumer preferences for cash is
approximately two to five percentage points, a smaller decline than the observed change (−8.2
percentage points) and closer to the SCPC estimate (+0.3 percentage points).3 The remainder of
the observed change in cash volume share is likely attributable to changes in survey
methodology, changes in economic conditions, or both, but we do not estimate these influences
separately.
The remainder of this paper is organized as follows. Section 2 introduces the DCPC in
greater detail and describes its relationship to the SCPC. Section 3 presents aggregate time
series data on the number and value of payments and the average payment value from the
SCPC and DCPC. Section 4 reports the microeconomic distributions of these same payments
data for individual consumers, cumulated over each consumer’s three diary days. Section 5
describes the estimated models of consumer choice of payment instruments in 2012 and 2015
and reports the results of the counterfactual simulations. Section 6 concludes, and an appendix
contains the technical details.
2. Diary of Consumer Payment Choice This section briefly introduces the DCPC and provides a high-level comparison with the
SCPC. The purpose is not to provide an exhaustive description of the DCPC or a comprehensive
report of all DCPC data in 2012 and 2015.4 Instead, the goal is to summarize key similarities and
3 Although we estimate the aggregate change to be modest, changes for individual payees could differ from the aggregate. For example, Wang and Wolman (2016) report a 2.5-percentage-point-per-year decline in the volume shares of cash at a discount retailer between 2010 and 2013. For the same time period, 2010 to 2013, the SCPC finds a smaller 0.75-percentage-point-per-year decline in aggregate cash use (volume). 4 More publications doing so will come later. Previous research using the 2010, 2011, and 2012 DCPC includes Bagnall et al. (2016), Briglevics and Schuh (2016), Briglevics and Shy (2012), Fulford, Greene, and Murdock (2015), Greene and Schuh (2014), Shy (2014), Shy (2013), and Shy and Stavins (2013).
6
differences between the DCPC and SCPC and between the 2012 and 2015 DCPC, focusing on
estimates of consumer cash use.
2.1 Brief History Since 2008, the Federal Reserve Bank of Boston has conducted the annual Survey of
Consumer Payment Choice (SCPC) to provide reliable and representative time-series data on
U.S. consumer response to the transformation of payments from paper to electronic. The SCPC
was designed to measure the adoption and use of traditional and emerging payment
instruments by U.S. consumers. A key contribution of the SCPC is the inclusion of currency or
cash (notes, bills, and coins), which had not been tracked for U.S. consumers since the mid-
1980s (Avery et al. 1987). By including cash with all noncash payment instruments, the SCPC
provides comprehensive data about consumer payment choices.
Despite providing time-series data that offers a unique measure of U.S. consumer
payment trends, the SCPC has two potential shortcomings. The SCPC questionnaire asks
respondents to recall from memory their payment choices in a typical week, month, or year
rather than relying on recordkeeping or the use of electronic transaction files. Thus, the SCPC is
potentially vulnerable to measurement error stemming from poor respondent recall, rounding
of numbers, and related difficulties. The SCPC also collects only the number of payments made
by consumers and not the dollar values of those payments. The latter is particularly limiting for
research and projection of trends because of the empirical correlation between payment value
and consumer choice of payment instruments.
In 2010, the Federal Reserve (hereafter, the Fed) Banks of Boston, San Francisco, and
Richmond began fielding pilot versions of the Diary of Consumer Payment Choice (DCPC) that
complement and enhance the measurement of consumer payments in the SCPC. Based on early
success, the Fed Banks decided to field an official version of the DCPC in 2012. In contrast to
recall-based surveys, payment diaries ask respondents to record their daily payment choices

7
and cash withdrawals, so bank researchers are likely to obtain better measurement of consumer
payments.5
The primary motivation for the DCPC was to test the SCPC’s ability to accurately
measure the number of consumer payments. Results of the 2012 DCPC, which revealed a much
higher estimate of the cash volume share than in the 2012 SCPC (41 percent versus 27 percent,
respectively) appeared to support the presumption that the DCPC provides better estimates of
payments than the SCPC, especially for small-dollar-value cash payments. A preliminary
analysis by Hitczenko (2013) found that the optimal period of recall for cash is less than one
week, which is the highest frequency recall period in the SCPC; thus, daily diaries likely give
better estimates of cash use.
The 2012 DCPC cash volume estimate seemed to receive further support from the
estimate of the value share of cash payments. At 12.4 percent, the estimated cash volume share
revealed that the average value of cash payments is relatively small ($21) and thus perhaps
more likely to be overlooked in a recall-based survey. In addition, Schuh (forthcoming)
demonstrated that the aggregate value of payments in the 2012 DCPC approximately matched
the estimate of personal income from the National Income and Product Accounts and generated
more accurate estimates of consumer expenditures than the Consumer Expenditure Survey.
Based on this relative success of the 2012 DCPC, and armed with a better understanding of the
character and merits of payment diaries, the Fed Banks fielded the DCPC again in 2015 and
2016, enabling a quantitative comparison of changes in cash use over time with the SCPC
estimates.
2.2 Comparison of SCPC and DCPC The SCPC and the DCPC are complementary data collection tools that aim to measure
consumer use of payment instruments (Table 1 and Figure 1). The SCPC and DCPC both
estimate the number of consumer payments, the number of cash deposits and withdrawals, and
5 See Bagnall et al. (2016) for an introduction to payment diaries in seven industrial countries, most of which were sponsored by central banks.
8
the value of cash holdings. Beginning in 2016, the DCPC also collected other account balances
(checking, PayPal, GPR prepaid card). Both SCPC and DCPC distinguish between bills, online
and offline purchases, and person-to-person payments.
Important differences between the SCPC and DCPC, however, could lead the two
instruments to produce different estimates of the total number of payments and of cash use.
These differences include recall versus reporting (described above), payment information that is
collected, survey mode, and survey administration period. The SCPC and DCPC also have
different reporting periods for measuring payments. The SCPC asks respondents to estimate
numbers of payments in typical time periods—for example, a typical month—and estimates the
total number of payments made by U.S. consumers in a typical month. The DCPC asks
respondents to report every payment they make over an assigned three-day-period and reports
an estimate of the total number and value of payments made by U.S. consumers during the
survey administration periods:, October 2012 and October 16 to December 15, 2015. In contrast
to the SCPC, and as noted above, the DCPC asks respondents to report information about
specific payments, including dollar values. Consumers also report the payment date and time,
payee, and whether or not a device such as a mobile phone or laptop was used.
The SCPC and DCPC also differ in survey methodology. The SCPC is an online survey;
respondents are asked to take the SCPC and DCPC but receive no instructions about the SCPC
before they begin. The DCPC is mixed-mode, with respondents receiving various supporting
documents and information. Before the DCPC begins, consumers receive an introductory email
describing its multi-day structure, are sent written and video instructions for reporting
payments, and receive two types of paper memory aids (large format including instructions and
pocket-sized) as well as a pouch for collecting receipts. These additional supports are expected
to lead to more precise reporting of consumers’ actual activities. Respondents take the SCPC in
one sitting; DCPC respondents go online over the course of three or four days to record
payment activity, cash holdings, income receipt, deposits and withdrawals, etc. The DCPC
9
builds its monthly estimate of payments from three-day waves of respondents randomly
distributed throughout the month.
2.3 Improvements to DCPC Survey Methodology The 2012 and 2015 DCPC estimates could differ due to several improvements in survey
methodology between the two periods: revisions to the survey questionnaire (Figure 1) and a
switch to a better sampling frame (Table 2). In addition, some of the questionnaire
improvements had practical flaws, and the sampling frame was so new that the 2015 sample
was limited to a smaller size than desired. Furthermore, the changes in survey methodology
make it difficult to identify economic changes that could be affecting consumer expenditures
and changes in consumer preferences for payment choice over the three years. Therefore,
readers should not treat the difference between the 2012 and 2015 DCPC estimates as an
unbiased estimate of the actual change during this period. This warning applies to the total
number of payments, the numbers and shares of payments by payment instrument, and
potentially other estimates from the DCPC for 2012 and 2015.
2.3.1 Questionnaire Revisions
Changes to the 2015 DCPC questionnaire include new questions and improvements to
existing questions. New questions were added to collect additional information about
consumers’ assets and income available for making payments, to capture information about
noncash deposits and withdrawals, and to expand understanding of consumers’ payment
preferences. Improvements were designed to refine classification of consumer expenditures and
to improve recall and reporting of bill payments. New questions likely did not play a role in the
measurement of the main consumer payment choice variables (volume, total value, and average
value) for 2015 relative to 2012. Improvements, while important for the DCPC in the long run,
may have reduced comparability of the 2015 and 2012 DCPC data. Important additions and
improvements are described below and summarized in Figure 1.
There are four important additions. First, a 10-minute night-before survey was added to
ensure accurate reporting of cash holdings and other financial assets before consumers began

10
reporting payments. In 2012, consumers were asked to report cash in their pockets, purses, or
wallets but not cash they stored elsewhere or their balances of other financial assets. The 2015
night-before reporting makes it possible for researchers to maintain a running tally of cash,
checking account balances, GPR prepaid card balances, and PayPal balances as consumers make
payments during the three-day reporting period; the night-before reporting also enables
researchers to cross-check that tally against consumers’ reported holdings and balances. This is
valuable for error-checking and for understanding consumers’ payment choices in the context
of their available financial resources and flows into and out of their accounts.
Second, in 2015 consumers provide more detailed information about their sources of
income and directly report the timing of income receipt. Like the improved reporting of
financial assets, this change makes it possible to examine payment instrument choices in the
context of current and expected financial resources. In 2012, consumers reported their primary
sources of income, their last receipt of primary income, and their next expected receipt of
primary income. In 2015, this category of questions was expanded to include all sources of
income and the frequency with which consumers received them. In addition, consumers were
asked to report the dollar value of any income received on the date of their night-before surveys
and also on each of their three diary days. In 2012, consumers did not report dollar values for
income received.
Third, the scope of the DCPC was expanded to include more information about deposits
and withdrawals. In 2014, the reporting of such transactions was limited to cash deposits and
withdrawals. In 2015, consumers also reported transactions that affect noncash balances,
including the dollar values of transfers from one account to another, the receipt of income by
noncash payment methods, and noncash withdrawals.
Fourth, in 2015 questions about consumers’ preferred payment method(s) were
expanded to put preferences in the context of specific payment situations and dollar amounts.
In 2012, consumers reported the payment method they most prefer to use. In 2015, as part of the
night-before survey, consumers answered four sets of questions about their preferred payment

11
methods for bills, purchases, online payments, and in-person purchases conditional on dollar
value (arranged in four groups by dollar value). Then, as consumers reported each payment
over the next three days in 2015, they answered follow-up questions about their reasons for
using (or not using) their stated preferred payment instrument(s), given the transaction type
(bill or non-bill).
Two changes to methods of asking about payees and bills in the DCPC questionnaire
could have affected measurement in 2015 and comparability to 2012. First, the change to the
payee classification method made it possible to add follow-up questions dependent upon payee
type (for example, medical or financial services) in order to more clearly distinguish among
different types of consumer expenditures.6 In 2012, respondents were asked to report what
person or entity was paid in 44 categories according to North American Industry Classification
System (NAICS) codes.7 In 2015, nine filter categories were used for the initial identification of
payee type and respondents received additional entry screens to further classify the payee type.
Follow-up questions were conditional on which of the nine filter categories was selected.
Second, a new ten-minute module was added to 2015 DCPC reporting day three, where
respondents were offered reminders about 42 types of bills in six categories.8 Results of the
2012 DCPC compared to the 2012 SCPC suggested that the DCPC may have been
undercounting bill payments9; this new module addressed that concern. Prior research in
survey methodology predicted that these reminders would result in a larger number of bills 6 Analysis of the 2012 DCPC found that it accurately estimated consumption expenditures and disposable personal income (Schuh forthcoming). In 2015, follow-up questions conditional on payee classification were used to identify consumption spending, purchases of durable goods, and the need to make a payment in response to an emergency. 8 The Boston Fed conducted two experimental surveys in 2014, where consumers were offered lists of bill types as reminders (Zhang 2016), implemented as a module within the Financial Crisis Surveys described in Hurd and Rohwedder (2010). As a result of these experiments, reminders of the following categories of bills were added to the 2015 DCPC: household or utility payments; phone, cable, or internet payments; credit card or loan payments; insurance payments; other types of payments, including tuition and medical bills; and tax payments. 9 Bill payments include bills paid automatically, bills paid electronically, and bills paid by mail, in person, or by phone.
12
being reported compared to the number reported in response to a more general question
(Menon 1993; Winter 2004; Comerford, Delaney, and Harmon 2009; Jagger et al. 2012; Hitczenko
and Tai 2014).
2.3.2 New Sampling Frame
The sampling frame for the DCPC was the RAND Survey Research Group American
Life Panel (ALP) in 2012. Beginning in 2014, the Boston Fed began to implement the SCPC, and
eventually the DCPC, with the University of Southern California’s Understanding America
Study (UAS) panel. The main reasons for the switch were to take advantage of UAS
improvements in panel recruitment (hence representativeness) and to avoid some limitations in
the ALP. While this panel change is expected to provide more representative results, the
transition necessitated a different sample period and smaller sample size in 2015, both of which
reduced comparability with 2012.
The UAS panel is being drawn with improved sampling methods, so it is expected to
provide more representative results.10 The ALP, used from 2008 to 2014 for the SCPC as well as
for the 2012 DCPC, was recruited using a combination of 80 percent convenience (volunteers
from existing panels), snowball (referrals to friends and relatives), and address-based sampling.
In contrast, 100 percent of the UAS panel has been recruited using the address-based sampling
method of Dillman (2014), which is expected to lead to a more representative group of
respondents, including respondents who are not particularly interested in personal finance,
who do not necessarily take surveys, and who may be English language learners.
Indeed, evidence from the 2014 SCPC suggests that differences between the ALP sample
in 2012 and the UAS sample in 2015 could be affecting DCPC estimates. The 2014 SCPC was
administered to samples of both the ALP and the UAS. The two questionnaires were identical,
but some 2014 survey estimates are markedly different between the two samples. In particular,
the UAS sample found greater shares of consumers adopting prepaid cards, money orders,
10 For details about the discrepancies between estimates from the 2014 ALP and 2014 UAS, see Angrisani, Foster, and Hitczenko (forthcoming).

13
bank account number payment (BANP), and debit cards.11 These differences in adoption rates
were statistically significant and are not explained by observable demographic differences.12 On
the other hand, the 2014 SCPC estimates of payment instrument shares from the ALP and UAS
are more similar.
In 2012, the DCPC was in the field from September 29 through November 2. In 2015, the
DCPC was implemented later (October 14 to December 17) due to the transition from ALP to
UAS and extended to study payment instrument choice during the holiday shopping period.
This extended implementation period has some advantages, but it makes it more difficult to
compare estimates for the two years. For purposes of this report, we look at the two 16-day
periods of October 16 through October 31 to minimize discrepancies between the estimates due
to seasonal effects from non-overlapping time periods.
One limitation of drawing a sample from the UAS panel in 2015 was that the available
sample size was smaller than desired. The UAS panel only began in 2014, so it was still small
and in the formative stages. By October 2015, the UAS contained fewer than 2,000 total
panelists. Consequently, there were only 1,392 unique UAS respondents included in the 2015
SCPC and DCPC, although some DCPC respondents agreed to complete the diary twice to
increase the number of responses. By contrast, there were 2,468 unique DCPC respondents in
2012. Thus, for the comparable time periods (October 16–31), there were 1,398 respondents in
the 2012 DCPC and 390 respondents in the 2015 DCPC (see Table 2).
Table 3 describes the demographic composition of the two panels for the comparable
periods. There are no statistically significant differences between the two years for the
following observed variables: household income, age, race, education, and gender. While not
11 Bank account number payment is defined as “a payment made by providing your bank account number to a person, organization, or business, such as an insurance or utility company. You can give your number on websites, paper forms, etc.” 12 Additional research is needed to understand the effects of panel differences. One possibility is survey experience. In 2014, ALP respondents had been taking surveys for seven years and the UAS panel was new.

14
statistically significant, the percentage of people employed was 3.5 percentage points higher in
2015, 60.4 percent. The panels differ, however, in the percentage of respondents who report
making no payments during their diary days. In 2012, 7.8 percent unweighted (10.0 percent
weighted) of respondents reported making no payments, compared to 12.6 percent unweighted
(12.0 percent weighted) in 2015. This difference affects the number of payments and possibly
their composition.
To evaluate the effect of a change in the share of the number of respondents with zero
payments, we conduct the following exercise. Assuming that the 2015 sample is more
representative of consumers with zero payments, we can adjust the share of consumers making
zero payments in 2012 to equal the share making no payments in 2015, that is, 12.0 percent.13
The simulated increase in the 2012 share of zero-payment consumers causes a decrease in the
2012 average number of transactions per month (to 56.7) and the 2012 average number of cash
transactions per month (to 22.8). Under this simulation, the 2012 share of cash transactions
would have been 40.3 percent instead of 40.7 percent (Table 4) and the percentage point decline
from 2012 to 2015 would have been 7.8 percentage points instead of 8.2.14
2.4 Changes in Economic Conditions In addition to changes in survey methodology, the U.S. economic expansion matured
from 2012 to 2015, so consumers faced different economic conditions in which to make their
payment choices. Without a structural economic model of consumer choice regarding the
number of payments, it is not possible to identify exactly how these economic changes affected
the DCPC estimates. However, some general economic conditions reported in the DCPC can be
used to control for the economic changes in an approximate, reduced-form manner when
estimating models of consumer payment choices.
13 These percentages are weighted for the 2012 and 2015 diary, respectively. This simulation was also conducted for the 2015 diary, but the magnitudes of the results were similar. 14 A detailed description of how the simulation was conducted is in the appendix.

15
Perhaps the clearest and most easily measured change was the decline in the
unemployment rate of nearly 3 percentage points (from 7.8 percent in October 2012 to 5.0
percent in October 2015). Evidence suggests that consumers are less likely to have bank
accounts and credit cards when unemployed (Cole 2016). Therefore, an increase in employment
likely would lead to increased access to additional payment instruments (credit cards and the
payment instruments linked to a bank account [paper checks, debit cards, BANP, and online
banking bill payment]). Consumers with more choices are less likely to choose any individual
option for a given payment. That is, consumers with only two or three choices of payment
instrument are that much more likely to choose cash in any given situation. Lower
unemployment could thus be related to a decline in the share of payments made in cash.
A second potential influence of economic activity is that economic expansion and
growth change the opportunity cost of time for consumers. In theory, if it takes a substantial
amount of time for consumers to shop and make payments, then shopping time competes with
consumers’ time at work earning wages and with their leisure time. If the value of work or
leisure rises, consumers might be more inclined to spend less time shopping, which could
manifest itself in the form of fewer shopping trips (and fewer payments) with larger average
payment values and possibly different payment instrument choices. It is unclear, however, how
large an effect the opportunity cost might have on the number and average value of payments.
Other types of economic changes may also have influenced the 2012 and 2015 DCPC
estimates in ways that are harder to identify and explain. As economic growth stabilized and
utilization of resources increased, risk likely declined and distress (bankruptcy, foreclosure, etc.)
also likely eased. But it also became more evident that trend productivity growth was lower,
which may have affected expectations of future income. Both risk and trend growth could affect
savings and credit decisions, which may influence payment choices in complex ways. Finally,
innovations in payment services almost surely are affecting payment choices.

16
2.5 Implications for Measurement of Payment Choices Taken together, some of these changes in survey methodology and economic conditions
could have affected the measurement of payment behavior in 2015. Table 5 provides qualitative
assessments of the possible effects of these measurement changes. Many of the questionnaire
improvements in 2015 were related to collecting deeper information about accounts and
preferences. These changes were unrelated to the reporting of the total number of payments,
small-dollar-value payments, shares of bill payments, and shares of payments by payee
category. Two changes, a new way of collecting the payee type and new bill payment module,
could have affected some of the measures listed in Table 5—in particular, the number and
percentage share of bill payments and the change in the distribution of payee types.
As noted above, requiring consumers to indicate whether or not they had paid any of 42
types of bills would be expected to result in a larger number of bills being reported compared to
the number reported in 2012. If the number of non-bills reported remained constant, this would
increase the share of bill payments and, presumably, decrease the share of cash payments
(because a relatively small share of bills is paid with cash).
As a result of the changes to the payee classification method, some popular categories of
retail purchases were less prominently displayed in the online questionnaire. These included
fast food, grocery stores, pharmacies, liquor stores, restaurants, bars, and gas stations—payees
where cash is often used. Therefore, it is possible that these changes, while enabling other
innovations, could have depressed the number of cash transactions reported. Compared to
2012, the 2015 DCPC finds fewer transactions in these cash-popular categories.
The change in the sampling frame appears likely to have been more influential. A more
representative sample—composed of larger shares of respondents who are not necessarily
interested in personal finance or regular survey-takers—could result in a different estimate of
the total number of payments, share of respondents with zero payments, number and share of
bill payments, number of small-dollar-value payments, total value of payments, and

17
distribution of payee types. In addition, changes in economic conditions also could affect many
of these measures.
There are reasons to suspect that changes in survey methodology and economic
conditions affected the comparability of the 2012 and 2015 DCPC estimates. However, precise
identification of these effects is difficult and would require considerably more research and
modeling of consumer payment behavior. Furthermore, the relative imprecision of the 2015
estimates due to smaller sample sizes makes it difficult to identify statistically significant
differences from 2012.
3. Aggregate Time Series Data This section compares and contrasts aggregate data from the SCPC and DCPC over
time.15 We focus on estimates of the number of payments per consumer and total value of
payments per consumer (both per month, the latter in constant 2015 dollars). For each measure,
we also present shares of payment instrument use by number (volume shares) and value (value
shares). Finally, we examine the average dollar value of payments, which equals the value of all
payments divided by the total number of payments. The analysis focuses on total payments and
cash payments, but debit and credit cards are included in some comparisons.
3.1 Number of Payments Time series estimates of the number of payments per consumer are plotted in Figure 2.
Solid lines indicate the DCPC estimates; dashed lines represent the SCPC estimates. As
indicated by the vertical line, data through 2014 are estimated from the ALP, and data from
2015 and 2016 are from the UAS panel. Tables 6 and 7 provide detailed estimates of the number,
value, and average value of payments for 2012 and 2015 during their common sample period
15 The Fed Banks also conducted pilot studies of the DCPC in 2010 and 2011, but we do not include that data here. Although the basic focus on the number and value of payments by instrument was the same, the 2010 and 2011 questionnaires were earlier, less complete versions of the 2012 questionnaire. Although the sample was administered to the ALP, the sample sizes were much smaller (less than 400) and much less representative than 2012.

18
(October 16–31), converted to a monthly rate. These tables include all of the estimates in
Figures 1 through 5 for total and cash payments, as well as estimates for all other payment
instruments.
DCPC estimates of the number of total payments per consumer are notably lower than
the SCPC estimates. From 2008 to 2016, the estimated SCPC number of payments fluctuated in
the range of 66 to 71 payments per month without any apparent major trend. In 2012, the DCPC
estimate (57.8) was about 11 payments per month lower than the SCPC estimate. In 2015, the
DCPC estimate (51.4) was about 18 payments per month lower than the SCPC. The relative
magnitudes of the DCPC and SCPC estimates are surprising given that daily recording of
payments in the DCPC is expected to provide a more accurate estimate than the SCPC’s recall
method of reporting. One possible explanation of these results is that the SCPC data cleaning
procedure may not be handling unusually large numbers of payments properly.16
In contrast, the DCPC and SCPC estimates of the number of cash payments are more
similar. Following a large increase in 2009, the SCPC estimate of cash payments was relatively
steady at 18 to 20 payments per month. The 2012 DCPC estimate (23.5) was above the SCPC,
and the 2015 DCPC estimate (16.7) was below. These results imply that the gap between SCPC
and DCPC estimates of the number of total payments occurred primarily in the estimates for all
noncash payments.
Comparing 2012 to 2015, Figure 2 shows a discrepancy between the data sources over
time. In contrast to the DCPC, the SCPC estimates of total payments were about the same in
2012 and 2015 (68.9). The difference between the 2012 and 2015 DCPC estimates of the number
of payments is larger than any three-year difference observed in the SCPC time series. This
discrepancy remains when we look at the number of cash payments. The number of cash
payments in the 2015 DCPC was 28.9 percent lower than the 2012 DCPC estimate (23.5 versus
16.7), while the 2012 and 2015 SCPC estimates were the same (18.6). Once again, the difference
16 For details of the SCPC data cleaning procedure, see Angrisani, Foster, and Hitczenko (forthcoming).
19
between 2012 and 2015 DCPC cash estimates was larger than any difference between the SCPC
estimates over any three-year period. Perhaps the SCPC’s measurement of typical payments
smooths higher frequency fluctuations that could be affecting consumer payments in the DCPC.
However, the fact that the SCPC estimates of total payments did not decline in 2015 relative to
2012 raises doubts that the change in sampling frame or economic conditions can explain the
DCPC result, since both types of changes occurred equally for the SCPC and DCPC.
The volume shares of payments provide a complementary perspective on the number of
payments (Figure 3). The SCPC data indicate that U.S. consumers made three-fourths or more
of their payments from 2008–2015 using three instruments: debit cards, cash, and credit cards.17
The most notable fluctuation in the SCPC shares occurred after the financial crisis, when the
cash share increased and the credit card share decreased. As the economy recovered, these
shares have moved back toward pre-crisis levels, although the cash share in 2016 remains above
the share in 2008. The DCPC estimates of volume share indicate that the same three
instruments—debit cards, cash, and credit cards—account for most consumer payments. The
cash share is considerably higher in the DCPC than in the SCPC, however, and the debit and
credit card shares are lower. Perhaps these higher estimates of cash volume shares reflect better
measurement because respondents recorded smaller cash payments in the DCPC, rather than
relying on recall, as in the SCPC. In any case, the implied changes in cash estimates from 2012
to 2015 are quite different: the 2015 DCPC cash share is 8.2 percentage points lower than in 2012
(40.7 versus 32.5 percent), and the 2015 SCPC cash share is 0.3 percentage points higher than in
2012 (26.8 versus 27.1 percent).
3.2 Value of Payments Estimates of the real (inflation-adjusted) value of payments per consumer from the
DCPC for 2010–2015 are plotted in Figure 4 (constant 2015 dollars); as noted above, the SCPC
does not collect payment values. In 2012 and 2015, the average real value of total payments was
approximately $4,000 per consumer per month, which implies average annual household
17 For more details, see Greene, Schuh and Stavins (2016) and its predecessor reports cited therein.

20
spending of roughly $96,000.18 This estimate is roughly comparable to average household
income from the Survey of Consumer Finances and is close to estimates of personal disposable
income from the National Income and Product Accounts after proper adjustments (see Schuh
forthcoming). The estimated 2015 real value of total payments was 2.2 percent lower than it
was in 2012, however, while real disposable income increased 6.2 percent during this same
period.19 The real value of cash payments is about one-eighth as large ($450–$500 per month) as
the value of total payments and fluctuates similarly to total payments: The 2015 real value of
cash payments was 10.0 percent lower than in 2012.
The value shares of payments for cash, debit, and credit are similar in magnitude, as
seen in Figure 5, but lower than their corresponding volume shares. The three value shares
range from about 11 percent to 20 percent in 2012 and 2015 and are relatively stable throughout
time. In contrast to the corresponding volume shares, where these three instruments accounted
for the vast majority of payments by number, their value shares sum to less than half of the total
value of consumer payments. The cash value share in 2015 was 11.4 percent, only 1.0
percentage point less than in 2012, which is not surprising given the stability and correlation of
the real values of total and cash payments. The credit card share also was moderately lower in
2015, while the debit share was about five percentage points higher—more than accounting for
the lower shares of cash and credit.
3.3 Average Payment Values Estimates of the average payment value (the total value of payments divided by the total
number of payments) for 2010–2015 are plotted in Figure 6. Given that the number of total
payments was lower in 2015 than in 2012 and that the value of total consumer payments was
about the same in both years, it is not surprising that the average payment value was higher in
18 This calculation assumes October is an average month in terms of seasonal factors and that there are approximately 2.01 consumers per household in the United States. 19 The payments and income measures have not been adjusted for comparability yet, and the DCPC payments estimate does not include a portion of the personal savings part of income. Consequently, moderate deviations in the growth rates of these two estimates do not necessarily indicate error but do warrant further analysis.
21
2015. The average value of all payments in 2015 was $77, 13.2 percent higher than in 2012 ($70).
Similarly, the average value of cash payments in 2015 was $27, 28.6 percent higher than in 2012
($21). In contrast, the average value of credit card payments was lower in 2015 ($55) than in
2012 ($59).
4. Individual Consumer Data This section reports and analyzes the underlying payment choices of individual
consumers in 2012 and 2015. As noted earlier, the aggregate results may be influenced by
changes in survey methodology (questionnaires or sampling frames), changes in the U.S.
economy between 2012 and 2015 that influenced consumer economic behavior, or both.
4.1 Diary-Period Observations To evaluate changes in individual consumer payment behavior, we constructed the total
number of payments made by each respondent (consumer) during the respective three-day
diary period and the sum of the dollar values of those payments, as well as the three-day
average payment for each respondent (three-day value divided by three-day number). These
individual diary-period observations are unique to the consumer for whom they are
constructed and therefore summarize the behavior of one consumer over three days.
Consumers’’ three-day observed behavior is not necessarily representative of their behavior
during the remaining days of the month.20 Nevertheless, random sampling of diary respondents
based on demographic characteristics throughout the month should produce estimates that
reflect the average behavior of consumers for the entire month properly, as explained in Schuh
(forthcoming).
20 For at least two reasons, three days may not be representative of the month. Seasonal effects during a respondent’s three-day period may influence payment behavior, and these seasonal effects may vary across consumers. Also, infrequent events—such as cash deposits (rare among consumers) or buying a new car (large-value purchases)—lead to small samples that do not reveal the full extent of consumer behavior.

22
Another reason for examining three-day behavior is to isolate and highlight important
differences across consumers. For each individual payment, dollar values may range from one
cent ($0.01) to an extremely large value (say $25,000 for a new car, $200,000 to pay off a
mortgage, or even larger amounts). In contrast, the number of transactions for each individual
payment is one. With wide cross-section variation in the value of individual payments but no
variation in the number, adding all payments by an individual consumer over three days
generates meaningful cross-section heterogeneity in the number of payments. At the same time,
adding the values of all payments by an individual over three days actually reduces cross-
section heterogeneity by combining large- and small-value payments to smooth out individual
spending in a meaningful way. For example, consumers with very high income and very low
income both make small-value payments, for example, a $2 cup of coffee, but their incomes may
have little bearing on that particular payment choice. High-income consumers, however, are
more likely to make payments with a higher total value over a three-day period.
The average consumer made between five and six payments during a three-day period
(5.6 in 2012 and 5.0 in 2015), or slightly fewer than two payments per day (1.9 versus 1.7) (see
Tables 6 and 7). It is difficult to assess the economic plausibility of these estimates; the number
of payments is not included in basic economic theories about consumer expenditures, and the
economics literature has little research addressing this topic.
4.2 Number of Payments Distributions of the estimated three-day number of payments for individual consumers
from the SCPC and DCPC in 2012 and 2015 are plotted in Figure 7. Comparing the SCPC and
DCPC estimates of the number of payments serves two purposes here. First, consistent with the
aggregate results in Figure 2, Figure 7 shows that the distributions of estimated payments in the
SCPC (bottom panel) are shifted to the right of the distributions in the DCPC (top panel); thus,
SCPC estimates are higher than DCPC estimates for reasons that are hard to explain. Second,
Figure 7 shows that the distributions of estimated payments in 2015 relative to their analogous
distributions in 2012 differ significantly between the SCPC and DCPC. The SCPC distributions

23
in 2012 and 2015 (bottom panel) are quite similar in mean and variance. Conversely, the DCPC
distribution in 2015 is shifted to the left of the 2012 distribution, reflecting a lower number of
payments—even conditional on omitting the zero-payment respondents. The 2015 DCPC
distribution also reflects a greater proportion of lower-value payments (higher peak at low
values) in addition to the reduction (leftward shift) in the number of payments.
The disparity between the 2015 SCPC and DCPC relative estimates of the number of
payments and the 2012 relative estimates suggests that the change in the 2015 sampling frame
may have a greater impact on the DCPC, since (as noted in Section 2) respondents may smooth
higher frequency fluctuations that are not affecting payments reported in the SCPC. Although
changes in economic conditions could have led consumers to reduce their number of payments,
one might have expected this reduction in both the DCPC and the SCPC. This expectation relies
on the assumption that the SCPC and DCPC measure the number of payments equally well.
This assumption may not be true for several reasons, including differences between the recall
and recording methods of reporting payments (see Section 2.2).
4.3 Value of Payments Distributions of the estimated three-day value of payments for individual consumers
from the DCPC in 2012 and 2015 are plotted in Figure 8. Unlike the DCPC distributions of
number of payments, the distributions of three-day payment total values did not shift between
2012 and 2015, once again conditional on omitting the zero-payment respondents. This finding
is consistent with the fact that the total value of payments over the comparable 16-day periods
(October 16–October 31) increased only 0.8 percent between 2012 and 2015. However, the 2015
distribution of three-day payment values differs from 2012 in the frequencies of low- and high-
value payments. In 2015, the share of consumers making total payments of less than about $500
during their three-day periods was higher than in 2012, especially for exceptionally low values
($100 or less). Conversely, the share of consumers making total payments of more than $500
was lower in 2015 than in 2012, especially in the range of about $500 to $1,500.
24
To summarize, Figure 8 indicates that while the estimated total value of payments was
virtually unchanged between 2012 and 2015, the composition of payment values across
consumers shifted. This change in composition may also be explained by the change in the 2015
sampling frame and sample. Again, if the UAS panel is more representative of U.S. consumers,
it may reflect a larger proportion of consumers who spend less during three-day periods. It is
much harder to imagine how the changes in the 2015 DCPC questionnaire might have produced
this kind of shift in the composition of payment values across consumers. Likewise, no obvious
economic model or even insight exists that might explain this mean-preserving distributional
shift; similarly there is no obvious economic development that might suggest such a shift.
4.4 Average Payment Values The distribution of average payment values shifted to the right (increased) in 2015, as
seen in Figure 9, consistent with the increase in aggregate average payment value from $70 to
$77. Generally speaking, this aggregate average increase resulted from fewer consumers
making average payments less than $25 and more consumers making average payments greater
than $25. However, the changes are not monotonic; more consumers made average payments
between $25 and $75, but fewer made average payments between $75 and $150. It is difficult to
provide further economic interpretation of these changes without a model and better
identification of the effects of changes in survey methodology.
5. Individual Payment Data This section deepens our analysis of the DCPC data by moving from the three-day
estimates for each diarist (Figures 7–9) to the level of each individual payment. The literature
provides empirical analyses of individual payments culled from various sources, such as
merchants’ checkout scanner data, that give some guidance about how to analyze payment
choices of different types and values. Using similar econometric models to characterize
consumer payment preferences from the DCPC data, we quantify the change in the number of

25
payments and the effects of changes in the distribution of individual payment dollar values on
the volume share of cash between 2012 and 2015.21
5.1 Correlation between Payment Instrument and Amount Recent studies have documented unconditional correlations between the values of
individual payments and consumer choice of the payment instrument(s) for each value. Using
scanner data from grocery stores, Klee (2008) showed that the probability of choosing cash was
negatively correlated with payment value, and the probability of choosing debit and credit
cards was positively correlated with payment value. This result was replicated by Briglevics
and Schuh (2016) using 2012 DCPC data and by Wang and Wolman (2016) using scanner data
from a non-grocery discount retailer. Cohen and Rysman (2013) used combined scanner and
survey data for a longitudinal panel of consumers and showed that negative correlation
between cash probability and payment value remained even with fixed effects. Using 2012
DCPC data, O’Brien (2014) and Stavins (2017) find the same relationship across all transaction
types, even when individuals are sorted into self-identified payment preferences.
Similar unconditional correlations between payment values and instruments appear in
the 2012 and 2015 DCPC, as shown in Figure 10.22 The figure depicts the three most frequently
used payment instruments—cash, debit cards, and credit cards—and a summary category for
all other instruments covered by the SCPC and DCPC.23 The probability of using cash for very
small-value payments is high in both years (about 0.7 to 0.8), and it declines sharply up to about
$50, where it settles at less than 0.2. Conversely, the probabilities of using debit cards and credit
cards are well below 0.2 for small-value payments (less than $10) and rise notably up to about
21 In principle, one could also conduct analogous simulations of the effects of changes in the actual distribution of the number of payments on the value share of payments. This exercise would require more models and estimation, which we leave for future research. 22 Figure 10 is restricted to payment values of $150 or less because the local kernel-weighted polynomial smoothing function is not effective with the relatively small number of payment observations for values greater than $150. 23 The “all other instruments” category includes prepaid cards, checks, money orders, travelers’ checks, online banking bill payments [OBBP], bank account number payments [BANP]), and text message payments. See Greene, Schuh, and Stavins (2016) for detailed definitions of the instruments.

26
$25, while the probabilities of using other payment instruments (mostly for bills) starts near
zero for the smallest values and rises steadily up to about $100 where it flattens near 0.4. These
results are qualitatively similar to prior results from grocery and other retail scanner data but
are not quantitatively the same because they include bill payments, in-person payments, and
online payments to a wide variety of retail locations and service businesses as well as payments
to other people. Comparing the 2012 and 2015 empirical probabilities, 2015 is qualitatively
similar to 2012 but the probabilities of cash use observed in the data are lower in 2015 by about
0.1 in the smaller values (up to about $50) and less different for larger values. Naturally, the
debit and credit probabilities are higher in 2015.
5.2 Modeling Payment Instrument Choice Following prior empirical studies, we use limited dependent variable models to estimate
the probabilities of consumer choice of payment instrument(s). Although relatively simple,
these reduced-form models are sufficient for predicting probabilities of the use of cash and
noncash instruments needed to conduct our counterfactual simulations. Also, our models
generally are much simpler analogues of more sophisticated recent models of consumer
payment choice, such as Koulayev et al (2016) and Wakamori and Welte (2017). As noted
above, we focus on econometric models with four payment instruments: cash, credit, debit, and
other payment instruments.24
The general functional form of our regression models is written as the probability Pr(. )
of choosing payment instrument 𝑃𝑃𝑗𝑗𝑗𝑗:
Pr�𝑃𝑃𝑗𝑗𝑗𝑗 = 1|𝑋𝑋𝑗𝑗� = 𝑓𝑓𝑚𝑚�𝑋𝑋𝑗𝑗;𝛽𝛽𝑗𝑗𝑗𝑗� , (1)
where subscript 𝑗𝑗 = {1,2,3,4} represents the four payment options, subscript 𝑡𝑡 = {12,15}
represents each of the two calendar years, 𝑋𝑋𝑗𝑗 denotes the set of independent explanatory
variables for consumer payment choices, including the log of the dollar value for each payment,
24 Qualitatively, the results of our econometric analysis are essentially the same for models with six instruments (dividing “other” into three parts: checks, OBBP+BANP, and all other instruments), especially with respect to cash choices, and quite similar quantitatively as well.

27
𝛽𝛽𝑗𝑗𝑗𝑗 denotes the coefficients corresponding to each explanatory variable, and subscript 𝑚𝑚 =
{1,2,3} indexes the three types of models (which are described below). In addition to payment
value, 𝑋𝑋 includes variables that control for economic conditions and, to the degree possible,
survey characteristics that might reflect the influence of changes in methodology, as described
in Section 2. Economic variables include a comprehensive suite of demographic variables plus
employment status, whether debit or credit cards were carried, and whether the person carried
enough cash to make the purchase. Variables potentially related to changes in survey
methodology include payee- and transaction-specific variables, such as bill payments.25
A common model used to estimate payment choice probabilities is the multinomial logit.
One key assumption inherent in the multinomial logit (𝑚𝑚 = 1) is the independence of irrelevant
alternatives (IIA), which means that the relative probabilities of choosing between any two
outcomes (odds ratio) is independent of the existence other potential choices. In the context of
payment instrument choice, the multinomial logit model is valid only if the presence of a
payment instrument does not affect the relative probabilities (odds ratio) of two other payment
instruments being selected. For example, in a multinomial logit model with cash, credit cards,
and debit cards, the estimated odds ratio for credit and debit cards is assumed to be the same,
regardless of whether cash is included in the model. Whether this criterion holds depends on
the nature of substitutability between cash, debit, and credit in consumer demand for payment
instruments.
By and large, prior studies of payment choice using multinomial logit models have not
examined or discussed the IIA assumption explicitly. However, given the proliferation of
payment instruments and their complex similarities and differences, it is reasonable to question 25 See the appendix for a detailed description of each model’s specifications, the complete list of explanatory variables, and the estimated marginal effects of using cash from the main econometric model. Payees are grouped into three categories. Merchant (payee) category 1 contains food and personal care supply stores. Merchant category 2 contains auto and vehicle-related stores; general merchandise stores; entertainment and transportation businesses; medical, education, and personal service businesses; government and non-profits; and people. Merchant category 3 contains housing-related, financial, and professional services businesses and miscellaneous service businesses as well as payments labeled “other.”

28
whether IIA holds and to test whether violations adversely affect the counterfactual
simulations. The null hypothesis of IIA is evaluated with the Hausman test (Hausman and
McFadden 1984) for differences in the estimated coefficients from the full model (four payment
instruments) and the restricted model (omitting one instrument at a time). The null hypothesis
of IIA is not rejected for the multinomial logit in 2015, but the null is rejected in almost every
case in the 2012 model (typically at well less than a five percent level).
For this reason, we instead estimate a multinomial probit model (𝑚𝑚 = 2), which does not
embody the IIA assumption, and primarily emphasize these estimates of payment choice
probabilities for the counterfactual simulations. For robustness, we also estimate a univariate
logit model (𝑚𝑚 = 3) of cash choice. The estimated marginal effects of all three types of models
are qualitatively and quantitatively similar, as are the results of the counterfactual simulations
described later.26
Overall, the econometric models fit the payments data reasonably well on average. This
success can be seen by comparing the fitted (denoted by a caret, ^) probabilities of cash
payments (𝑗𝑗 = 1), from the econometric models
Pr�(𝑃𝑃1𝑗𝑗 = 1|𝑋𝑋𝑗𝑗) = 𝑓𝑓𝑚𝑚�𝑋𝑋𝑗𝑗; �̂�𝛽1𝑗𝑗� (2)
to the smoothed probabilities in the actual data (Figure 11). The regression fitted values are
especially close to the actual data for small-value payments (under $25), which account for a
large number of cash transactions, but the differences between the model and data are larger for
high-value payments. The model generally fits the 2012 data slightly better than it fits the 2015
data, which wiggle around more as the payment value increases and there are fewer
observations. Nevertheless, the fit of the model is not terribly different between years.
Qualitatively, the estimated marginal effects on cash in 2012 and 2015 are quite similar,
though there are quantitative differences. In addition, the statistical significance is not always
26 Estimates of all three models, as well as the Hausman tests of the multinomial logit model, are available upon request from the authors.

29
consistent across years. (See Appendix Tables A.1 and A.2 for the estimated marginal effects for
cash.) In general, the marginal effects on the economic variables in the model tended to be
statistically unchanged from 2012 to 2015, although there are exceptions. For example, the
average marginal effect on the (log) payment value for cash is less negative in 2015 (−0.064
compared to −0.091), indicating that the correlation of cash with payment value weakened (after
controlling for economic and survey conditions). In addition, the marginal effect of whether an
individual carried enough cash to make the observed payment increased (from 0.196 to 0.346),
while the marginal effect on whether an individual carried his or her debit card went from
significantly negative to essentially zero (–0.157 to –0.023). The marginal effect on merchant
(payee) groups also changed significantly, lending some support to the notion that the
questionnaire revisions to classification of the payee in 2015 may have had an effect. Most of
the marginal effects on demographic characteristics did not change significantly except for age,
where there is some evidence of greater propensity of consumers ages 65 and older to choose
cash in 2015.
These econometric results provide one way of characterizing changes in consumer
preferences for cash. Although not a structural economic model that incorporates optimizing
consumer choice, the probability estimates from these reduced-form models implicitly take into
account the economic conditions and survey methodology specifications that might have
influenced the DCPC estimates of the volume and value shares of cash. Therefore, we interpret
the relative stability of the estimated marginal effects as an approximate indication that
underlying consumer preferences for payment instruments were relatively stable between 2012
and 2015.
However, the explanatory variables (𝑋𝑋𝑗𝑗) did change notably between 2012 and 2015;
these changes would influence the estimated probabilities of cash use even if the marginal
effects (preferences) did not change. In particular, the change in the distribution of individual
payment values from 2012 to 2015 likely played a central role in the observed changes in the
probabilities of cash use given their relative importance among all of the marginal effects. Next,
we characterize the changes in payment values between 2012 and 2015, and then perform
counterfactual simulations using these values.
5.3 Distributions of Individual Payment Values
The distribution of individual payment values shifted considerably between 2012 and
2015, as shown in Figure 12. The most striking feature of these distributions is a large decline in
small-value (less than $25) payments in 2015 relative to 2012. Since the probability of cash use is
much higher for small-value payments, so a decline in the number of small-value payments
implies a decline in the volume share of cash payments. Indeed, more disaggregated data (not
presented) shows that the decline in small-value payments was concentrated in cash payments.
It is difficult to identify all of the reasons for the shift in payment values from 2012 to
2015. A comprehensive economic model is required to explain why consumers might change
the volume and value and thus average value of their payments, in the absence of more specific
identification of the possible results of changes in survey methodology. Nevertheless, it is
certainly plausible that changes to survey methodology or the economic conditions discussed
previously could have contributed to the observed change in the distribution, over and above
any changes in consumer preferences estimated by the econometric model.
To quantify the effects of the change in the distribution of payment values on observed
consumer payment choices, we use the estimated econometric models (section 5.1) and
observed distributions of payment values (section 5.2) in 2012 and 2015 to conduct two
counterfactual simulations. These simulations provide alternative estimates of the actual change
in cash use attributable to likely changes in consumer payment preferences separated from the
effects of changes in economic conditions and survey methodology.
5.4 Counterfactual Simulations
The counterfactual simulations involve two calculations with model estimates of the
probabilities of payment instrument choice. For each model we calculate the counterfactual
30

31
probabilities of payment use each year (𝐶𝐶𝐶𝐶𝑗𝑗,𝑗𝑗) using the estimated coefficients (consumer
preferences) from the other year:
𝐶𝐶𝐶𝐶𝑚𝑚𝑗𝑗12 = Pr��𝑃𝑃𝑗𝑗12 = 1|𝑋𝑋𝑡𝑡� = 𝑓𝑓𝑚𝑚�𝑋𝑋12; �̂�𝛽𝑗𝑗15� (3)
𝐶𝐶𝐶𝐶𝑚𝑚𝑗𝑗15 = Pr��𝑃𝑃𝑗𝑗15 = 1|𝑋𝑋𝑡𝑡� = 𝑓𝑓𝑚𝑚�𝑋𝑋15; �̂�𝛽𝑗𝑗12� (4)
where a caret (^) indicates econometric estimates and a tilde (~) denotes a counterfactual
probability.27 These counterfactual probabilities represent likely payment choices in a
hypothetical year where consumer preferences from another year were in place instead of the
preferences that prevailed in the observed year.
In the second step, for each model we calculate for 2015 the difference (∆𝐶𝐶𝐶𝐶𝑗𝑗𝑗𝑗) between
the counterfactual probabilities and fitted (actual) probabilities for the 2012 and 2015 data,
respectively:
∆𝐶𝐶𝐶𝐶𝑚𝑚𝑗𝑗12 = 𝑓𝑓𝑚𝑚�𝑋𝑋12; �̂�𝛽𝑗𝑗15� − 𝑓𝑓𝑚𝑚�𝑋𝑋12; �̂�𝛽𝑗𝑗12� (5)
∆𝐶𝐶𝐶𝐶𝑚𝑚𝑗𝑗15 = 𝑓𝑓𝑚𝑚�𝑋𝑋15; �̂�𝛽𝑗𝑗15� − 𝑓𝑓𝑚𝑚�𝑋𝑋15; �̂�𝛽𝑗𝑗12� (6)
Taking the averages of ∆𝐶𝐶𝐶𝐶𝑚𝑚𝑗𝑗12 and ∆𝐶𝐶𝐶𝐶𝑚𝑚𝑗𝑗15, respectively, yields the aggregate difference. By
holding the actual data constant for a year, these calculations represent estimates of the change
in the volume share of cash payments (𝑗𝑗 = 1) that are mostly likely attributable to changes in
consumer payment preferences, rather than changes in economic conditions or survey
methodology.
The fitted and counterfactual probability estimates for cash use in 2012 and 2015 are
reasonably similar for all three models (Figure 13). This intuition is confirmed by the results in
Table 8, which reports the actual, fitted, and simulated cash shares (and changes) for the data
and for each model. The fitted models capture essentially all of the 8.2-percentage-point decline
in cash share observed between the two years (model estimates are between -7.8 and -8.5
27 See the appendix for the technical details of these counterfactual calculations.

32
percentage points). The simulated counterfactual differences for the 2015 data (in the 2012
models) range from −1.8 to −2.6 percentage points and for the 2012 data (in the 2015 models)
range from −4.9 to −5.5 percentage points. We conclude that the most likely estimate of the
change in U.S. consumer preferences for cash use between 2012 and 2015 is a decline of
approximately two to five percentage points in the volume share, or roughly half of the
measured decline of 8.2 percentage points.28
The simulations suggest that most of the actual change in cash share measured by the
2012 and 2015 DCPC can be attributed to changes in economic conditions and survey
methodology rather than changes in underlying consumer preferences for cash. While these
counterfactual simulations do not provide an exact measure of the true change in the share of
cash payments, they do provide guidance on how consumer preferences for cash use likely
changed, conditional on demographic and transaction-specific characteristics. Because they only
account for the change in consumer preferences, not for economic changes that could include
cyclical and trend forces relevant for understanding consumer demand for cash, the simulated
changes in the shares of cash payments are conservative. However, the consistent level of the
value share of cash from 2012 to 2015, together with the results of the counterfactual
simulations, suggest that cash use may have remained more stable than a direct comparison of
raw estimates from the DCPC would initially indicate.
6. Conclusion Results in this paper demonstrate that reports of the death of cash in the United States
are exaggerated. Data from the 2012 and 2015 DCPC, and from the 2008–2015 SCPC, show clear
evidence that cash is still one of the three most common means of payment by U.S. consumers
by volume. Consumer cash payments have a small dollar value on average, however, so the
total value of cash payments is low despite consumers using cash to make a large number of
28 In principle, we could conduct counterfactual simulations for the value shares of cash as well. However, this exercise would require more modeling and joint treatment of volume and value, which we leave for future research.
33
payments. The value share of cash estimated in the DCPC also shows no evidence of a decline
in cash share from 2012 to 2015, but the DCPC raw data suggest that cash use as a share of the
number of consumer payments was much lower in 2015.
Unfortunately, evaluating the change in U.S. consumer cash use between 2012 and 2015
is more difficult because of changes in survey methodology and economic conditions that
affected the DCPC implementation in these two years. We cannot identify and explain all of the
specific economic forces underlying the differences in the number, value, and average value of
consumer payments because the literature does not offer an adequate model of consumer choice
of these payment variables. However, DCPC data confirm prior evidence that consumer choice
of payment instrument(s) correlates with individual payment values, with cash used most often
for small-value payments; these data do not show evidence of large changes in consumer
preferences for cash. Nevertheless, changes in observed consumer payment behavior resulting
from changes in survey methodology and economic conditions manifest themselves through
changes in the distributions of individual payment values. Counterfactual simulations suggest
that the best estimate of the decline in cash volume shares from 2012 to 2015 that is attributable
to changes in consumer preferences for cash use is approximately two to five percentage points.
This estimate is reasonably close to the estimate from the SCPC (+0.3 percentage points) over
the same period.
Estimates of consumer payment choice(s) from the DCPC for 2016 and beyond should
be more comparable with the 2015 DCPC estimates because of fewer changes in survey
methodology (same sampling frame). Two factors, however, will remain a challenge for
interpreting DCPC data until satisfactory structural models of consumer payment choices are
developed. It will be more difficult to identify separate cyclical and long-run trend components
from the DCPC data than from the SCPC data; the latter is likely to produce smaller year-to-
year changes due to its measurement approach (recall based on typical periods). There is also
insufficient guidance about how to jointly interpret consumer choice(s) of the number and value
of payments, so divergence in volume and value shares for an instrument will be puzzling.

34
In light of these challenges, it seems prudent to continue collecting data on consumer
payment use from the SCPC and DCPC for now. The SCPC has a longer time series and may
give greater clarity on trends in payment use until more data are available to rely on DCPC
estimates. On the other hand, DCPC estimates provide potentially more accurate measurement
of consumer payment choice, and the DCPC has the significant advantage of collecting data on
payment values in addition to numbers. More effort is needed to develop structural models of
consumer payment choices that can be estimated with the SCPC and DCPC data.
References Angrisani, Marco, Kevin Foster, and Marcin Hitczenko. Forthcoming. “The 2015 Survey of
Consumer Payment Choice: Technical Appendix.” Federal Reserve Bank of Boston Research Data Report.
Avery, Robert B., Gregory E. Elliehausen, Arthur B. Kennickell, and Paul A. Spindt. March 1987. “Changes in the Use of Transaction Accounts and Cash from 1984 to 1986.” Federal Reserve Bulletin.
Bagnall, John, David Bounie, Kim P. Huynh, Anneke Kosse, Tobias Schmidt, Scott Schuh, and Helmut Stix. 2016. “Consumer Cash Usage: A Cross-Country Comparison with Payment Diary Survey Data.” International Journal of Central Banking 12(4): 1–62.
Briglevics, Tamás, and Scott Schuh. 2014, revised 2016. “This Is What's in Your Wallet ... and Here's How You Use It.” Federal Reserve Bank of Boston Working Paper 14-5.
Briglevics, Tamás, and Oz Shy. 2012. “Why Don't Most Merchants Use Price Discounts to Steer Consumer Payment Choice?” Federal Reserve Bank of Boston Public Policy Discussion Paper 12-9.
Cameron, A. Colin, and Pravin K. Trivedi. 2005. Microeconometrics: Methods and Applications. Cambridge, UK: Cambridge University Press.
Cohen, Michael, and Marc Rysman. 2013. “Payment Choice with Consumer Panel Data.” Federal Reserve Bank of Boston Working Paper 13-6.
Cole, Allison. 2016. “Do Consumers Rely More Heavily on Credit Cards While Unemployed?” Federal Reserve Bank of Boston Research Data Report 16-6.
Comerford, David, Liam Delaney, and Colm Harmon. 2009. “Experimental Tests of Survey Responses to Expenditure Questions.” Fiscal Studies 30: 419–433.

35
Dillman, D. A., J.D. Smyth, and L. M. Christian. 2014. Internet, Phone, Mail, and Mixed-Mode Surveys: The Tailored Design Method. Hoboken, NJ: John Wiley & Sons.
Fulford, Scott, Claire Greene, and William Murdock III. 2015. “U.S. Consumer Holdings and Use of $1 Bills.” Federal Reserve Bank of Boston Research Data Report 15-1.
Greene, William H. 2003. Econometric Analysis. NJ: Upper Saddle River.
Greene, Claire, and Scott Schuh. 2014. “U.S. Consumers' Holdings and Use of $100 Bills.” Federal Reserve Bank of Boston Research Data Report 14-3.
Greene, Claire, Scott Schuh, and Joanna Stavins. 2016. “The 2014 Survey of Consumer Payment Choice: Summary Results.” Federal Reserve Bank of Boston Research Data Report 16-3.
Hausman, Jerry, and Daniel McFadden. 1984. “Specification Tests for the Multinomial Logit Model.” Econometrica: Journal of the Econometric Society: 1219–1240.
Hitczenko, Marcin. 2013. “Optimal Recall Period Length in Consumer Payment Surveys.” Federal Reserve Bank of Boston Working Paper 13-16.
Hitczenko, Marcin, and Mingzhu Tai. 2014. “Measuring Unfamiliar Economic Concepts: The Case of Prepaid Card Adoption.” Federal Reserve Bank of Boston Working Paper 14-9.
Hurd, M., and S. Rohwedder. 2010. “Effects of the Financial Crisis and Great Recession on American Households.” Working Paper 16407. Cambridge, MA: National Bureau of Economic Research.
Jagger, Pamela, Marty K. Luckert, Abwoli Banana, and Joseph Bahati. 2012. “Asking Questions to Understand Rural Livelihoods: Comparing Disaggregated vs. Aggregated Approaches to Household Livelihood Questionnaires.” World Development 40 (9): 1810–1823.
Klee, Elizabeth. 2008. “How People Pay: Evidence from Grocery Store Data.” Journal of Monetary Economics 55(3): 526–541.
Koulayev, Sergei, Marc Rysman, Scott Schuh, and Joanna Stavins. 2016. “Explaining Consumer Adoption and Use of Payment Instruments.” The RAND Journal of Economics 47(2): 293–325.
Matheny, Wendy, Shaun O’Brien, and Claire Wang. 2016. “The State of Cash: Preliminary Findings from the 2015 Diary of Consumer Payment Choice.” FedNotes, Federal Reserve Bank of San Francisco.
36
Menon, Geeta. 1993. “The Effects of Accessibility of Information in Memory on Judgments of Behavioral Frequencies.” Journal of Consumer Research 20(3): 431–440.
O’Brien, Shaun. 2014. “Consumer Preferences and the Use of Cash: Evidence from the Diary of Consumer Payment Choice.” Federal Reserve Bank of San Francisco Working Paper.
Schuh, Scott. Forthcoming. Published ahead of print, August 11, 2017. “Measuring Consumer Expenditures with Payment Diaries.” Economic Inquiry. http://dx.doi.org/10.1111/ecin. 12485.
Shy, Oz. 2014. "Measuring Some Effects of the 2011 Debit Card Interchange Fee Reform." Contemporary Economic Policy 32 (4): 769-83.
Shy, Oz. 2013. “How Many Cards Do You Use?” Federal Reserve Bank of Boston Working Paper 13-13.
Shy, Oz, and Joanna Stavins. 2013. “Merchant Steering of Consumer Payment Choice: Lessons Learned From Consumer Surveys.” Federal Reserve Bank of Boston Research Data Report 13-1.
Stavins, Joanna. 2017. “How Do Consumers Make Their Payment Choices?” Federal Reserve Bank of Boston Research Data Report 17-1.
Wakamori, Naoki, and Angelika Welte. 2017. “Why Do Shoppers Use Cash? Evidence from Shopping Diary Data.” Journal of Money, Credit, and Banking, 47(1):
Wang, Zhu, and Alexander L. Wolman. 2016. “Payment Choice and Currency Use: Insights from Two Billion Retail Transactions.” Journal of Monetary Economics 84, 94–115.
Winter, Joachim. 2004. “Response Bias in Survey-Based Measure of Household Consumption.” Economic Bulletin 3: 1–12.
Wooldridge, Jeffrey M. 2010. Econometric Analysis of Cross cection and Panel Data. Cambridge, MA: MIT Press.
Zhang, David. 2016. “How Do People Pay Rent?” Federal Reserve Bank of Boston Research Data Report 16-2.
37
Appendix
Counterfactual Estimates The functional form of the model used to conduct the counterfactual simulations is
included in the body of the paper. A more detailed explanation of how the regression models
𝑚𝑚 = {1,2,3}—which correspond to logit, multinomial logit, and multinomial probit models,
respectively—are used to construct the counterfactual estimates is included here. Let 𝑗𝑗 =
{1, … , 𝐽𝐽} be an index of payment instruments where 𝐽𝐽 > 0 is the total number of payment
options included in each model. Let N equal the total number of payments for all respondents
and days and K represent the number of explanatory variables in the model. For all three
models, the explanatory variables are represented by the N × K matrix, 𝑋𝑋𝑗𝑗 , which contains the
transaction amount, payment-specific variables, and demographic variables for each year 𝑡𝑡 in
which the diary took place. The K × 1 coefficient matrix, 𝛽𝛽𝑗𝑗𝑗𝑗, contains the estimated coefficients
for each respective payment instrument included in the regression.
Logit and Multinomial Logit This section describes how the counterfactual estimates are calculated using both the
logit and multinomial logit regression models.29 For the multinomial logit, the total number of
payment options on the left hand side of the regression is 𝐽𝐽 = 4 (cash, credit, debit, and other)
with the reference category for both the multinomial logit and multinomial probit defined as
other payment instruments. This normalizes the set of coefficients �̂�𝛽4𝑗𝑗 = 0 so the remaining
𝐽𝐽 − 1 sets of coefficients �̂�𝛽1𝑗𝑗, �̂�𝛽2𝑗𝑗 , and �̂�𝛽3𝑗𝑗, are estimated in the model.
The explanation here focuses on the multinomial logit model since the logit model is a
special case of the multinomial logit where the number of choices is 𝐽𝐽 = 2(cash or non-cash).
The logit model uses the non-cash payment option 𝑗𝑗 = 2 as the reference category so the model
estimates the coefficients of cash use �̂�𝛽1𝑗𝑗, and normalizes the non-cash coefficient �̂�𝛽2𝑗𝑗 = 0. The
multinomial logit uses a logistic function to form a link between the response variable and the
explanatory variables: 29 See Greene (2003) for a detailed description of the multinomial logit.
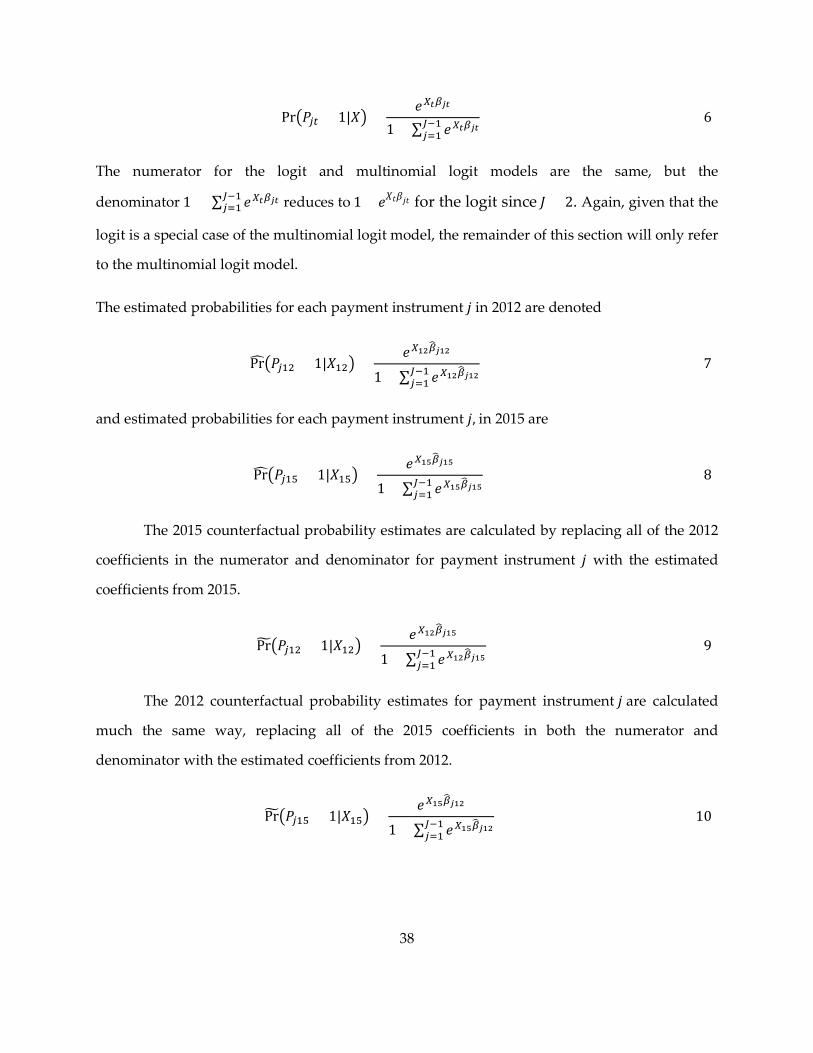
38
Pr�𝑃𝑃𝑗𝑗𝑗𝑗 = 1|𝑋𝑋� =𝑒𝑒𝑋𝑋𝑡𝑡𝛽𝛽𝑗𝑗𝑡𝑡
1 + ∑ 𝑒𝑒𝑋𝑋𝑡𝑡𝛽𝛽𝑗𝑗𝑡𝑡𝐽𝐽−1𝑗𝑗=1
(6)
The numerator for the logit and multinomial logit models are the same, but the
denominator 1 + ∑ 𝑒𝑒𝑋𝑋𝑡𝑡𝛽𝛽𝑗𝑗𝑡𝑡𝐽𝐽−1𝑗𝑗=1 reduces to 1 + 𝑒𝑒𝑋𝑋𝑡𝑡𝛽𝛽𝑗𝑗𝑡𝑡 for the logit since 𝐽𝐽 = 2. Again, given that the
logit is a special case of the multinomial logit model, the remainder of this section will only refer
to the multinomial logit model.
The estimated probabilities for each payment instrument 𝑗𝑗 in 2012 are denoted
Pr��𝑃𝑃𝑗𝑗12 = 1|𝑋𝑋12� =𝑒𝑒𝑋𝑋12𝛽𝛽�𝑗𝑗12
1 + ∑ 𝑒𝑒𝑋𝑋12𝛽𝛽�𝑗𝑗12𝐽𝐽−1𝑗𝑗=1
(7)
and estimated probabilities for each payment instrument 𝑗𝑗, in 2015 are
Pr��𝑃𝑃𝑗𝑗15 = 1|𝑋𝑋15� =𝑒𝑒𝑋𝑋15𝛽𝛽�𝑗𝑗15
1 +∑ 𝑒𝑒𝑋𝑋15𝛽𝛽�𝑗𝑗15𝐽𝐽−1𝑗𝑗=1
(8)
The 2015 counterfactual probability estimates are calculated by replacing all of the 2012
coefficients in the numerator and denominator for payment instrument 𝑗𝑗 with the estimated
coefficients from 2015.
Pr��𝑃𝑃𝑗𝑗12 = 1|𝑋𝑋12� =𝑒𝑒𝑋𝑋12𝛽𝛽�𝑗𝑗15
1 + ∑ 𝑒𝑒𝑋𝑋12𝛽𝛽�𝑗𝑗15𝐽𝐽−1𝑗𝑗=1
(9)
The 2012 counterfactual probability estimates for payment instrument 𝑗𝑗 are calculated
much the same way, replacing all of the 2015 coefficients in both the numerator and
denominator with the estimated coefficients from 2012.
Pr��𝑃𝑃𝑗𝑗15 = 1|𝑋𝑋15� =𝑒𝑒𝑋𝑋15𝛽𝛽�𝑗𝑗12
1 + ∑ 𝑒𝑒𝑋𝑋15𝛽𝛽�𝑗𝑗12𝐽𝐽−1𝑗𝑗=1
(10)

39
Multinomial Probit The multinomial probit model is based on a utility function 𝑈𝑈𝑖𝑖𝑗𝑗 in which choosing
payment instrument 𝑗𝑗 gives random utility to respondent 𝑖𝑖:
𝑈𝑈𝑖𝑖𝑗𝑗 = 𝑋𝑋𝑖𝑖𝑗𝑗𝛽𝛽𝑗𝑗 + 𝜀𝜀𝑖𝑖𝑗𝑗 (11)
where 𝑋𝑋𝑖𝑖𝑗𝑗 is a 1 × 𝐾𝐾 vector of the characteristics of respondent 𝑖𝑖 and 𝜀𝜀𝑗𝑗 is the stochastic error
term. We assume that the 𝐽𝐽 × 1 vector of error terms 𝜀𝜀 = �𝜀𝜀1, … , 𝜀𝜀𝐽𝐽� is jointly normally
distributed, 𝜀𝜀~𝑁𝑁(0,Σ). We define a general class of models defined by input parameters 𝛽𝛽,
and 𝑋𝑋𝑗𝑗. For sample 𝑋𝑋𝑗𝑗 with parameters 𝛽𝛽 = {𝛽𝛽𝑗𝑗}, a 𝑁𝑁 × 1 vector of probabilities is given by:
Pr�𝑃𝑃𝑗𝑗𝑗𝑗 = 1|𝑋𝑋𝑗𝑗� = Pr�𝑈𝑈𝑗𝑗𝑗𝑗 ≥ 𝑈𝑈𝑘𝑘𝑗𝑗 |𝑋𝑋𝑗𝑗�, 𝑓𝑓𝑓𝑓𝑓𝑓 𝑎𝑎𝑎𝑎𝑎𝑎 𝑘𝑘 ≠ 𝑗𝑗 (12)
= Pr�𝑈𝑈𝑘𝑘𝑗𝑗 − 𝑈𝑈𝑗𝑗𝑗𝑗 ≤ 0|𝑋𝑋𝑗𝑗�
= Pr�𝜀𝜀𝑘𝑘𝑗𝑗 − 𝜀𝜀𝑗𝑗𝑗𝑗 ≤ 𝑋𝑋𝑗𝑗𝛽𝛽𝑗𝑗 − 𝑋𝑋𝑗𝑗𝛽𝛽𝑘𝑘|𝑋𝑋𝑗𝑗�
= Pr�𝜀𝜀�̃�𝑗𝑗𝑗𝑘𝑘 ≤ 𝑋𝑋𝑗𝑗𝛽𝛽𝑗𝑗 − 𝑋𝑋𝑗𝑗𝛽𝛽𝑘𝑘|𝑋𝑋𝑗𝑗�
In this example, the tilde symbol denotes the difference between the error terms of choosing
payment instrument 𝑘𝑘 over payment instrument 𝑗𝑗.
Both the probit and multinomial probit use the standard (univariate or multivariate)
normal distribution as a link function. Thus, for the probit, the link function takes the form
Pr(𝑃𝑃𝑗𝑗𝑗𝑗 = 1|𝑋𝑋𝑗𝑗) = � 𝜑𝜑(𝜀𝜀𝑗𝑗)𝑋𝑋𝑡𝑡𝛽𝛽𝑗𝑗
−∞𝑑𝑑𝜀𝜀𝑗𝑗 (13)
where 𝜑𝜑(𝜀𝜀𝑗𝑗) is the standard normal p.d.f. Expanding the probit model from a two-choice model
( 𝐽𝐽 = 2) to a four-choice model ( 𝐽𝐽 = 4) means the equation to estimate the probability of using
payment instrument j in year 𝑡𝑡 is:
Pr�𝑃𝑃𝑗𝑗𝑗𝑗 = 1;𝛽𝛽� =
� � � 𝑔𝑔ℎ𝑡𝑡𝑗𝑗𝑘𝑘′′(𝛽𝛽)
−∞
ℎ𝑡𝑡𝑗𝑗𝑘𝑘′(𝛽𝛽)
−∞
ℎ𝑡𝑡𝑗𝑗𝑘𝑘(𝛽𝛽)
−∞�𝜀𝜀�̃�𝑗𝑗𝑗𝑘𝑘, 𝜀𝜀�̃�𝑗𝑗𝑗𝑘𝑘′ , 𝜀𝜀�̃�𝑗𝑗𝑗𝑘𝑘′′�𝑑𝑑𝜀𝜀𝑗𝑗𝑗𝑗𝑘𝑘𝜀𝜀𝑗𝑗𝑗𝑗𝑘𝑘′𝜀𝜀𝑗𝑗𝑗𝑗𝑘𝑘′′ , 𝑓𝑓𝑓𝑓𝑓𝑓 𝑘𝑘,𝑘𝑘′,𝑘𝑘′′ ≠ 𝑗𝑗 (14)

40
where
ℎ𝑗𝑗𝑗𝑗𝑘𝑘(𝛽𝛽) = 𝑋𝑋𝑗𝑗𝛽𝛽𝑗𝑗 − 𝑋𝑋𝑗𝑗𝛽𝛽𝑘𝑘
and the function 𝑔𝑔(∙) is the trivariate standard normal p.d.f.30 We calculate the estimated
probabilities as:
𝑃𝑃𝑓𝑓��𝑃𝑃𝑗𝑗𝑗𝑗 = 1|𝑋𝑋𝑗𝑗� = Pr�𝑃𝑃𝑗𝑗𝑗𝑗 = 1; �̂�𝛽𝑗𝑗𝑗𝑗|𝑋𝑋𝑗𝑗� (15)
and the estimated counterfactual probabilities as:
Pr��𝑃𝑃𝑗𝑗𝑗𝑗 = 1|𝑋𝑋𝑗𝑗� = Pr�𝑃𝑃𝑗𝑗𝑗𝑗 = 1; �̂�𝛽𝑗𝑗𝑗𝑗′|𝑋𝑋𝑗𝑗� , 𝑡𝑡′ ≠ 𝑡𝑡 (16)
Simulation of Respondents with Zero Payments in 2012 The simulation aims to re-estimate the number of payments reported in 2012 assuming
that more respondents in 2012 would have made no payments over the three-day reporting
period if the 2012 sample completely matched the 2015 sample.
The following are the steps in the simulation:
(1) Divide the 2012 sample into two groups, those who made at least one payment over
their three reporting days and those who made none.
(2) Divide each of these groups into six categories, three categories by income and two
by age (Table A.3).
(3) For the group that made at least one payment, calculate the average number of
transactions per month and the average number of cash transactions per month for each of the
six income/age combinations (Table A.4). Individuals were chosen to be removed from the
group that made at least one payment over the three reporting days based on an effort to closely
match the population from the group that made no payments (columns 3 and 4 of Table A.4).
For example, 41 percent of the individuals who were moved from the group who made at least
30 See Cameron and Trivedi (2005) for a detailed description of the multinomial probit.
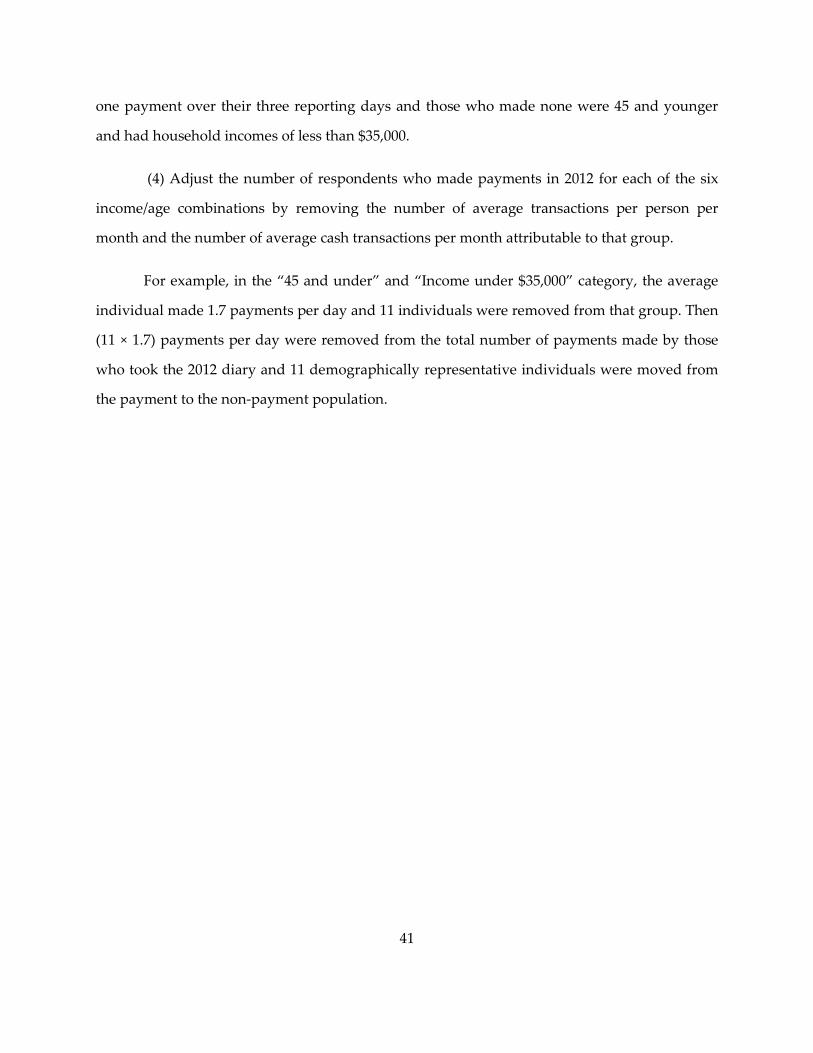
41
one payment over their three reporting days and those who made none were 45 and younger
and had household incomes of less than $35,000.
(4) Adjust the number of respondents who made payments in 2012 for each of the six
income/age combinations by removing the number of average transactions per person per
month and the number of average cash transactions per month attributable to that group.
For example, in the “45 and under” and “Income under $35,000” category, the average
individual made 1.7 payments per day and 11 individuals were removed from that group. Then
(11 × 1.7) payments per day were removed from the total number of payments made by those
who took the 2012 diary and 11 demographically representative individuals were moved from
the payment to the non-payment population.

SCPC DCPC Owner (co-sponsors)
FR Bank of Boston FR Bank of Boston
(FR Banks of SF, Richmond) Frequency Annual Irregular History 2008–present 2010–2012, 2015–2016 Reporting period September–December October (except 2015) Questionnaires Observation unit(s) Consumers, households Consumers
Mode(s) Online (internet, unaided)
Mixed—paper/online (Instructions, memory aids &
internet, unaided)
Data collection Recall (typical period: day, month, year)
Recording and recall (day)
Time burden 30 minutes Up to 20 minutes/day, 3–4 days
Incentive $20 $60–70 Summary of contents
Instruments, ratings of traits Adoption of accounts
Account balances Adoption of instruments
Cash balances Cash withdrawals
Use of instruments (#)
Instruments, preferences Account balances
Instruments carried/available Cash balances
Cash deposits & withdrawals Use of instruments (#,$)
Instruments, choice reasons
Measurement period Typical period
(week/month/year)
Daily (three consecutive, randomly
assigned) Source: Federal Reserve Bank of Boston.
Table 1: Overview of the Survey of Consumer Payment Choice (SCPC) and Diary of Consumer Payment Choice (DCPC)
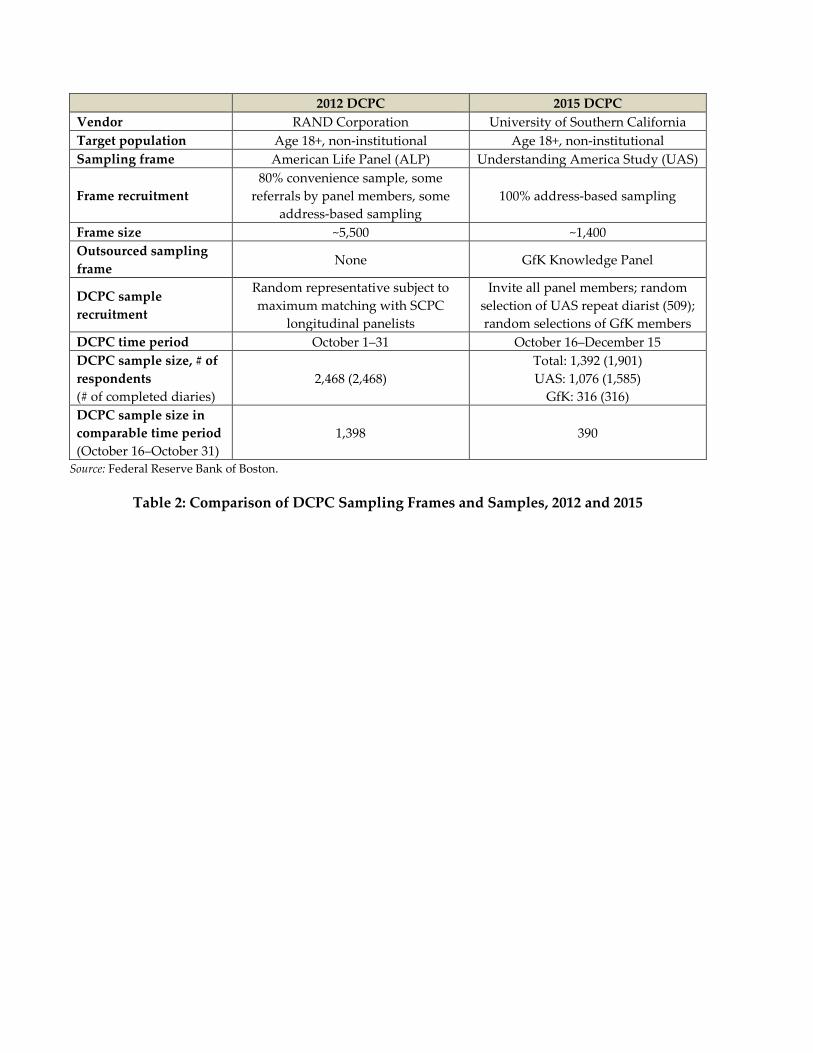
2012 DCPC 2015 DCPC Vendor RAND Corporation University of Southern California Target population Age 18+, non-institutional Age 18+, non-institutional Sampling frame American Life Panel (ALP) Understanding America Study (UAS)
Frame recruitment 80% convenience sample, some
referrals by panel members, some address-based sampling
100% address-based sampling
Frame size ~5,500 ~1,400 Outsourced sampling frame
None GfK Knowledge Panel
DCPC sample recruitment
Random representative subject to maximum matching with SCPC
longitudinal panelists
Invite all panel members; random selection of UAS repeat diarist (509); random selections of GfK members
DCPC time period October 1–31 October 16–December 15 DCPC sample size, # of respondents (# of completed diaries)
2,468 (2,468) Total: 1,392 (1,901) UAS: 1,076 (1,585)
GfK: 316 (316) DCPC sample size in comparable time period (October 16–October 31)
1,398 390
Source: Federal Reserve Bank of Boston.
Table 2: Comparison of DCPC Sampling Frames and Samples, 2012 and 2015

Full Sample Did not make a payment
2012 2015 Difference 2012 2015 Difference
Income
Less than $25,000 22.3 23.5 1.3 49.9 47.5 −2.4
$25,000–$49,999 25.4 25.2 −0.2 27.0 16.0 −11.0
$50,000–$74,999 17.8 16.6 −1.2 8.0 12.4 4.4
$75,000– $99,999 13.1 12.5 −0.6 10.1 10.2 0.2
$100,000– $124,999 9.6 8.5 −1.1 3.3 3.6 0.3
More than $125,000 11.7 13.5 1.8 1.7 10.2 8.5
Age
Under 25 7.9 6.6 −1.4 15.1 8.6 −6.5 25–34 21.0 23.1 2.1 27.3 18.0 −9.3 35–44 16.6 16.7 0.2 15.3 15.1 −0.2 45–54 19.2 17.5 −1.7 15.8 21.3 5.4 55–64 16.9 17.2 0.3 10.2 19.5 9.3 Over 65 18.4 18.9 0.5 16.2 17.5 1.3
Education
High school or less 41.8 40.9 −0.9 70.0 48.2 −21.9 *
Some college 28.8 28.5 −0.3 20.9 32.6 11.7
Bachelor’s degree 17.3 18.0 0.6 5.0 5.9 1.0
Graduate degree 12.1 12.6 0.6 4.1 13.3 9.2 *
Race Black 12.6 13.7 1.0 19.3 27.6 8.3 Other Race 10.8 8.1 −2.7 11.0 11.4 0.4 White 76.5 78.0 1.4 69.8 61.1 −8.7
Gender Female 51.5 52.5 1.0 54.4 55.9 1.5 Male 48.5 47.5 −1.0 45.6 44.1 −1.5
Employment Status
Employed 56.9 60.4 3.5 35.3 39.6 4.3 Unemployed 7.7 7.7 0.0 20.9 21.1 0.3
Out of Labor Force
35.4 31.9 −3.5 43.8 39.3 −4.5
Source: Federal Reserve Bank of Boston. Notes: All values above are percentages. Values may not add to 100 due to rounding. For year-to-year comparability and to avoid holiday effects, the data for this comparison is restricted to respondents participating between October 16 and October 31 in each year. * Statistically significant at the 10 percent level.
Table 3: Demographic Composition of DCPC Samples, 2012 and 2015
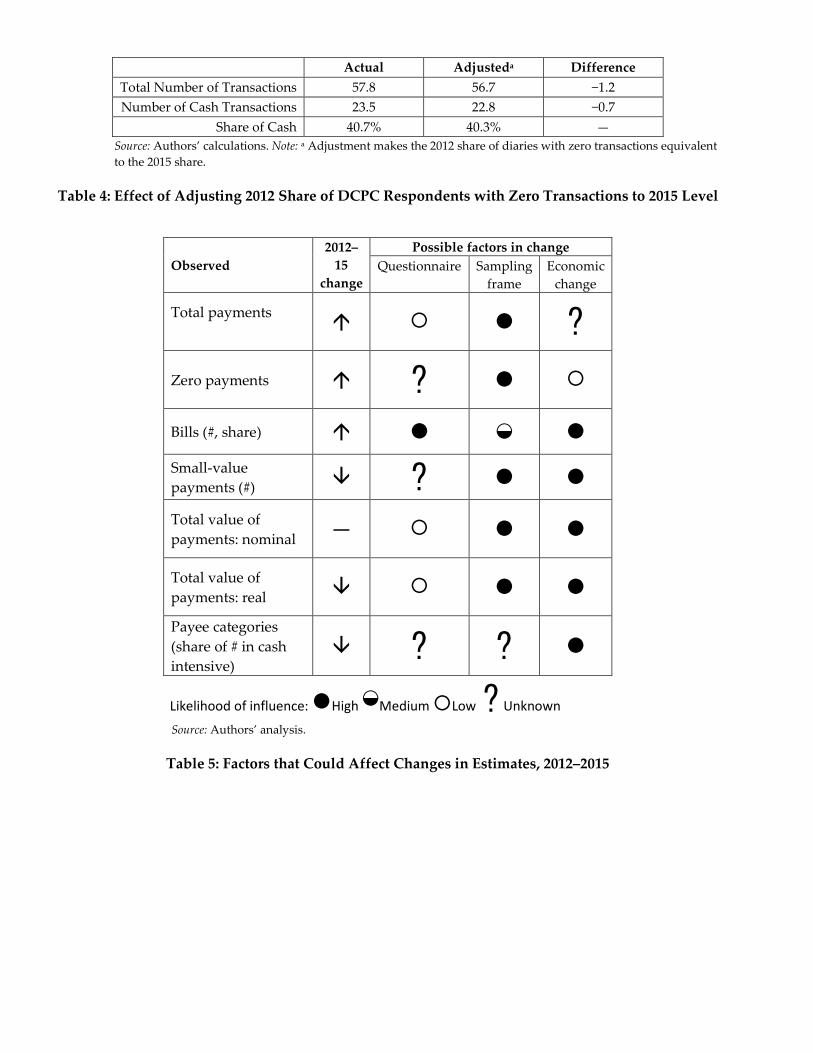
Actual Adjusteda Difference Total Number of Transactions 57.8 56.7 −1.2 Number of Cash Transactions 23.5 22.8 −0.7
Share of Cash 40.7% 40.3% — Source: Authors’ calculations. Note: a Adjustment makes the 2012 share of diaries with zero transactions equivalent to the 2015 share.
Table 4: Effect of Adjusting 2012 Share of DCPC Respondents with Zero Transactions to 2015 Level
Observed 2012–
15 change
Possible factors in change Questionnaire Sampling
frame Economic
change
Total payments ?
Zero payments ?
Bills (#, share) ◒ Small-value payments (#) ?
Total value of payments: nominal —
Total value of payments: real Payee categories (share of # in cash intensive)
? ?
Likelihood of influence: High ◒Medium Low ? Unknown Source: Authors’ analysis.
Table 5: Factors that Could Affect Changes in Estimates, 2012–2015
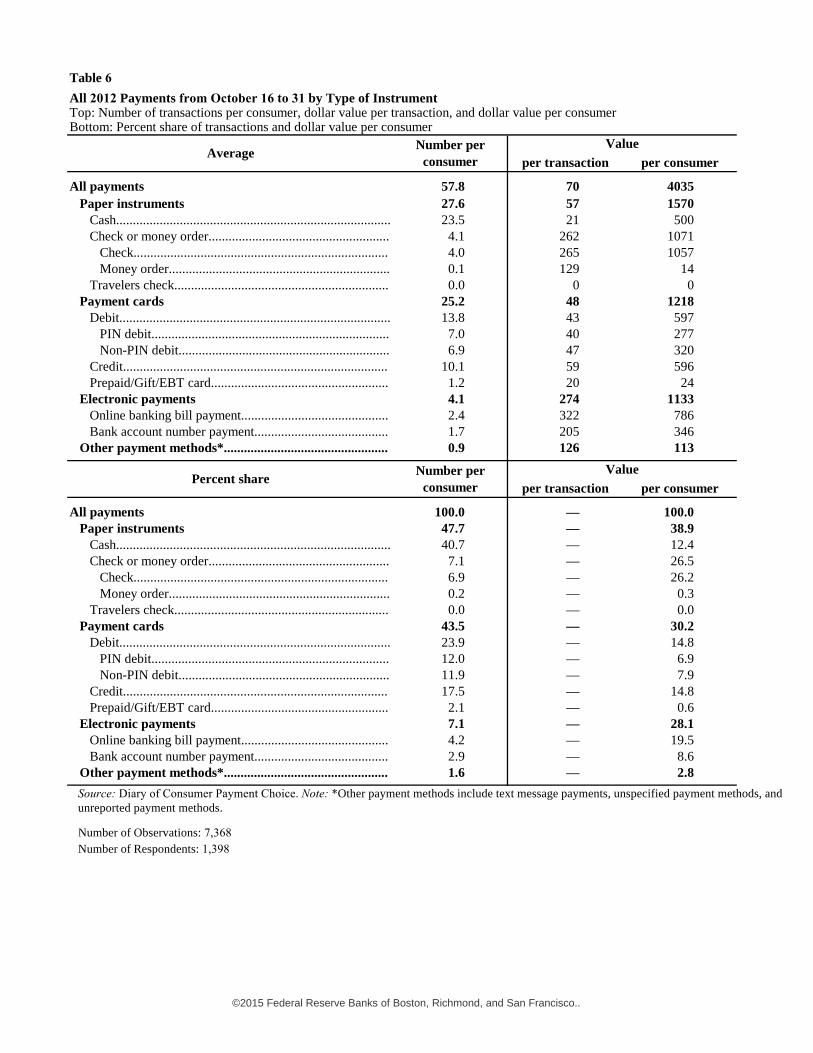
©2015 Federal Reserve Banks of Boston, Richmond, and San Francisco..
Table 6All 2012 Payments from October 16 to 31 by Type of InstrumentTop: Number of transactions per consumer, dollar value per transaction, and dollar value per consumer Bottom: Percent share of transactions and dollar value per consumer
per transaction per consumer
All payments 57.8 70 4035Paper instruments 27.6 57 1570
Cash.................................................................................. 23.5 21 500Check or money order...................................................... 4.1 262 1071
Check............................................................................ 4.0 265 1057Money order.................................................................. 0.1 129 14
Travelers check................................................................ 0.0 0 0Payment cards 25.2 48 1218
Debit................................................................................. 13.8 43 597PIN debit....................................................................... 7.0 40 277Non-PIN debit............................................................... 6.9 47 320
Credit............................................................................... 10.1 59 596Prepaid/Gift/EBT card..................................................... 1.2 20 24
Electronic payments 4.1 274 1133Online banking bill payment............................................ 2.4 322 786Bank account number payment........................................ 1.7 205 346
Other payment methods*................................................. 0.9 126 113
per transaction per consumer
All payments 100.0 — 100.0Paper instruments 47.7 — 38.9
Cash.................................................................................. 40.7 — 12.4Check or money order...................................................... 7.1 — 26.5
Check............................................................................ 6.9 — 26.2Money order.................................................................. 0.2 — 0.3
Travelers check................................................................ 0.0 — 0.0Payment cards 43.5 — 30.2
Debit................................................................................. 23.9 — 14.8PIN debit....................................................................... 12.0 — 6.9Non-PIN debit............................................................... 11.9 — 7.9
Credit............................................................................... 17.5 — 14.8Prepaid/Gift/EBT card..................................................... 2.1 — 0.6
Electronic payments 7.1 — 28.1Online banking bill payment............................................ 4.2 — 19.5Bank account number payment........................................ 2.9 — 8.6
Other payment methods*................................................. 1.6 — 2.8
Number of Observations: 7,368 Number of Respondents: 1,398
Source: Diary of Consumer Payment Choice. Note: *Other payment methods include text message payments, unspecified payment methods, and unreported payment methods.
Average Number per consumer
Value
Percent share Number per consumer
Value
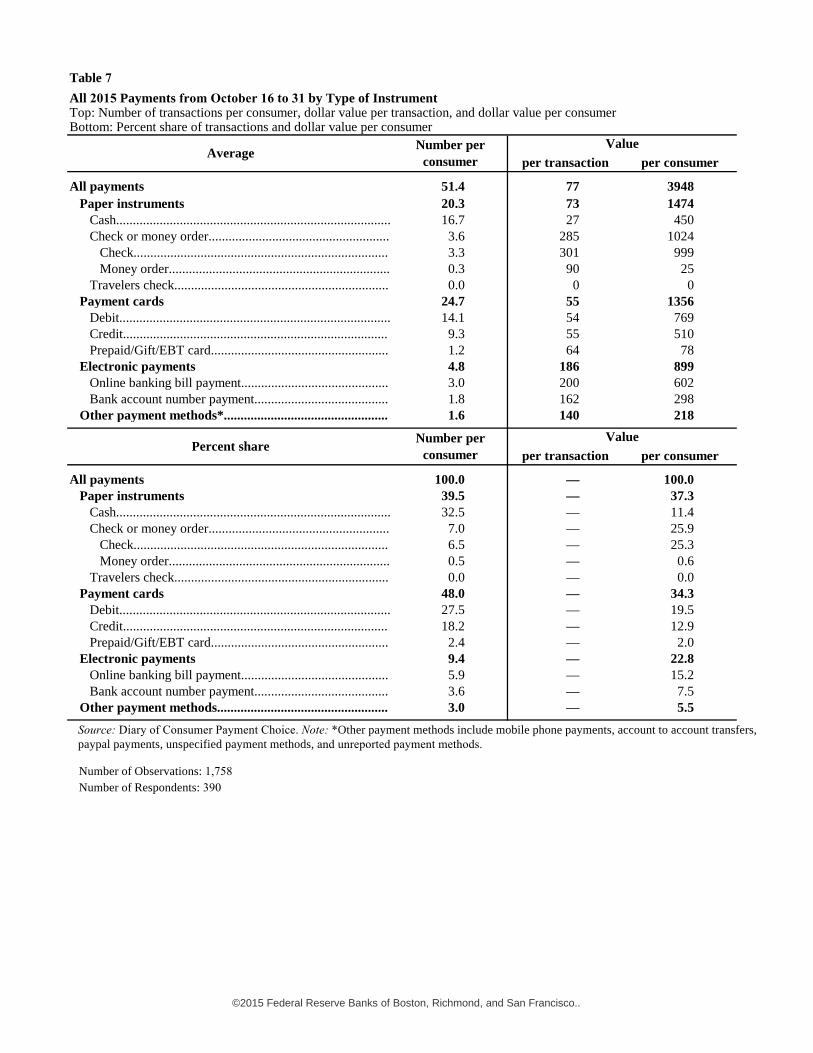
©2015 Federal Reserve Banks of Boston, Richmond, and San Francisco..
Table 7All 2015 Payments from October 16 to 31 by Type of InstrumentTop: Number of transactions per consumer, dollar value per transaction, and dollar value per consumer Bottom: Percent share of transactions and dollar value per consumer
per transaction per consumer
All payments 51.4 77 3948Paper instruments 20.3 73 1474
Cash.................................................................................. 16.7 27 450Check or money order...................................................... 3.6 285 1024
Check............................................................................ 3.3 301 999Money order.................................................................. 0.3 90 25
Travelers check................................................................ 0.0 0 0Payment cards 24.7 55 1356
Debit................................................................................. 14.1 54 769Credit............................................................................... 9.3 55 510Prepaid/Gift/EBT card..................................................... 1.2 64 78
Electronic payments 4.8 186 899Online banking bill payment............................................ 3.0 200 602Bank account number payment........................................ 1.8 162 298
Other payment methods*................................................. 1.6 140 218
per transaction per consumer
All payments 100.0 — 100.0Paper instruments 39.5 — 37.3
Cash.................................................................................. 32.5 — 11.4Check or money order...................................................... 7.0 — 25.9
Check............................................................................ 6.5 — 25.3Money order.................................................................. 0.5 — 0.6
Travelers check................................................................ 0.0 — 0.0Payment cards 48.0 — 34.3
Debit................................................................................. 27.5 — 19.5Credit............................................................................... 18.2 — 12.9Prepaid/Gift/EBT card..................................................... 2.4 — 2.0
Electronic payments 9.4 — 22.8Online banking bill payment............................................ 5.9 — 15.2Bank account number payment........................................ 3.6 — 7.5
Other payment methods................................................... 3.0 — 5.5
Number of Observations: 1,758 Number of Respondents: 390
Source: Diary of Consumer Payment Choice. Note: *Other payment methods include mobile phone payments, account to account transfers, paypal payments, unspecified payment methods, and unreported payment methods.
Average Number per consumer
Value
Percent share Number per consumer
Value
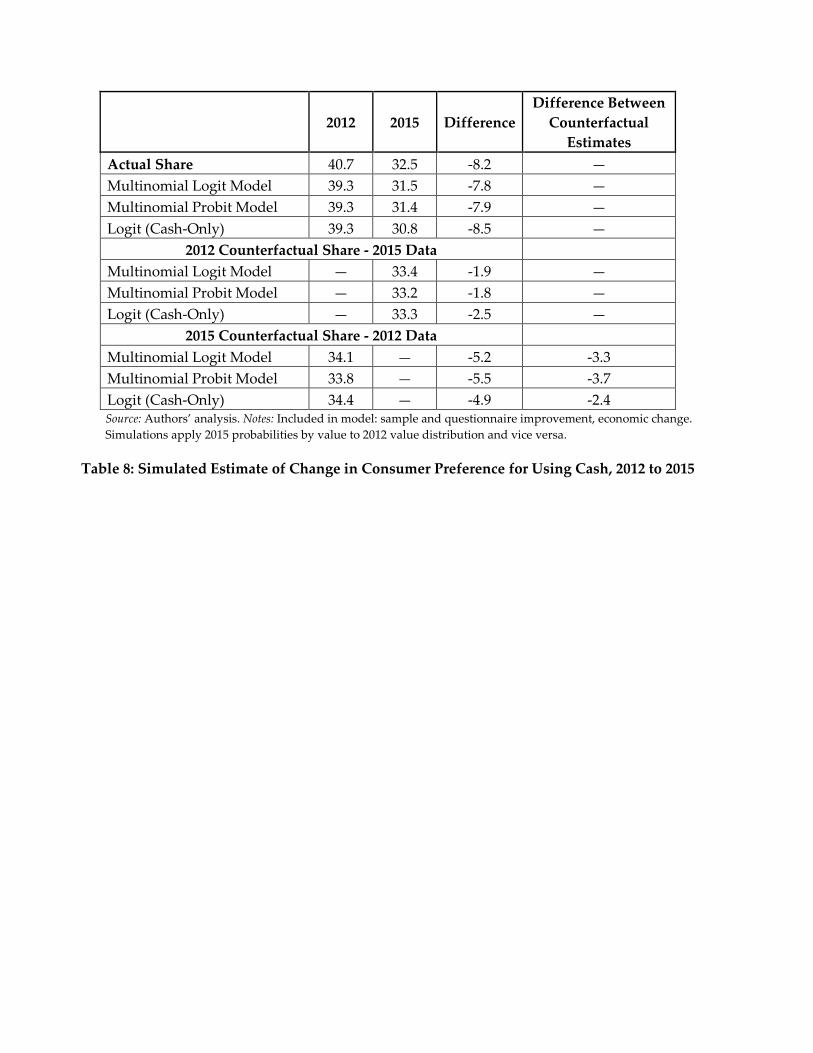
2012 2015 Difference Difference Between
Counterfactual Estimates
Actual Share 40.7 32.5 -8.2 — Multinomial Logit Model 39.3 31.5 -7.8 — Multinomial Probit Model 39.3 31.4 -7.9 — Logit (Cash-Only) 39.3 30.8 -8.5 —
2012 Counterfactual Share - 2015 Data Multinomial Logit Model — 33.4 -1.9 — Multinomial Probit Model — 33.2 -1.8 — Logit (Cash-Only) — 33.3 -2.5 —
2015 Counterfactual Share - 2012 Data Multinomial Logit Model 34.1 — -5.2 -3.3 Multinomial Probit Model 33.8 — -5.5 -3.7 Logit (Cash-Only) 34.4 — -4.9 -2.4 Source: Authors’ analysis. Notes: Included in model: sample and questionnaire improvement, economic change. Simulations apply 2015 probabilities by value to 2012 value distribution and vice versa.
Table 8: Simulated Estimate of Change in Consumer Preference for Using Cash, 2012 to 2015

Source: Federal Reserve Bank of Boston. Note: 2015 additions and enhancements in bold.
Figure 1: SCPC and DCPC structure, including DCPC evolution, 2012 and 2015

Source: Federal Reserve Bank of Boston.
Figure 2: Mean Number of Payments Per Consumer Per Month

Source: Federal Reserve Bank of Boston.
Figure 3: Share of Consumer Payments Per Month (Number) by Type of Payment Instrument
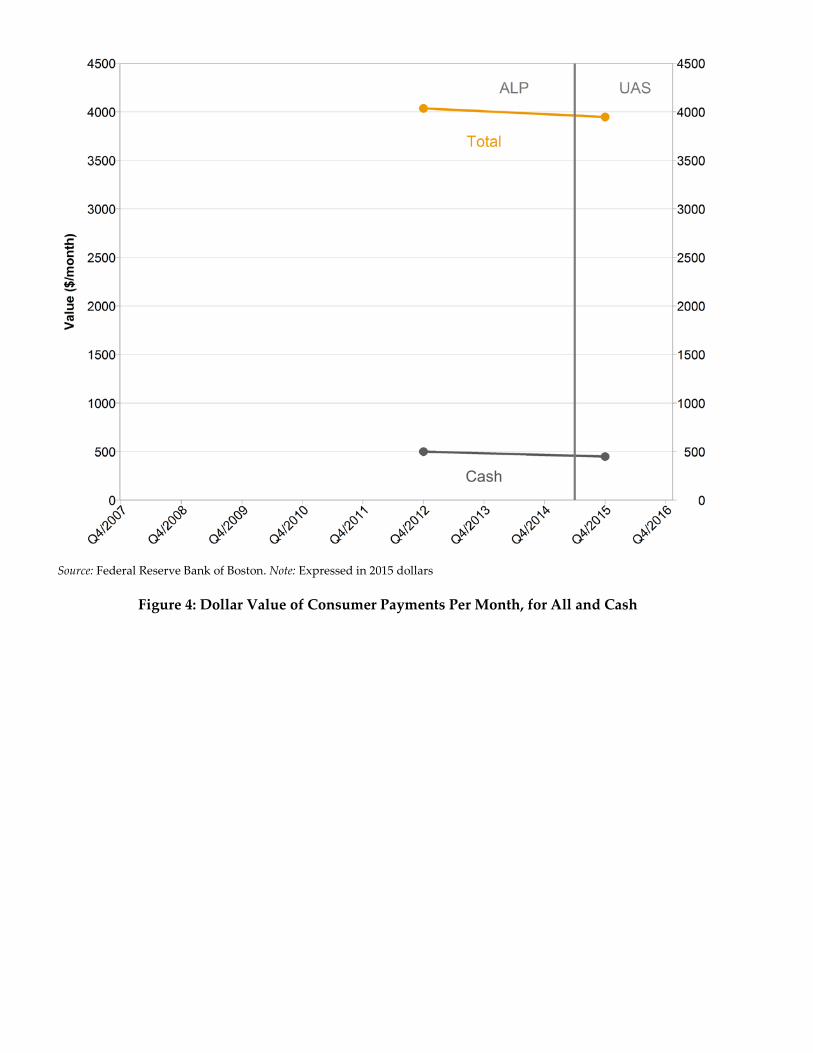
Source: Federal Reserve Bank of Boston. Note: Expressed in 2015 dollars
Figure 4: Dollar Value of Consumer Payments Per Month, for All and Cash
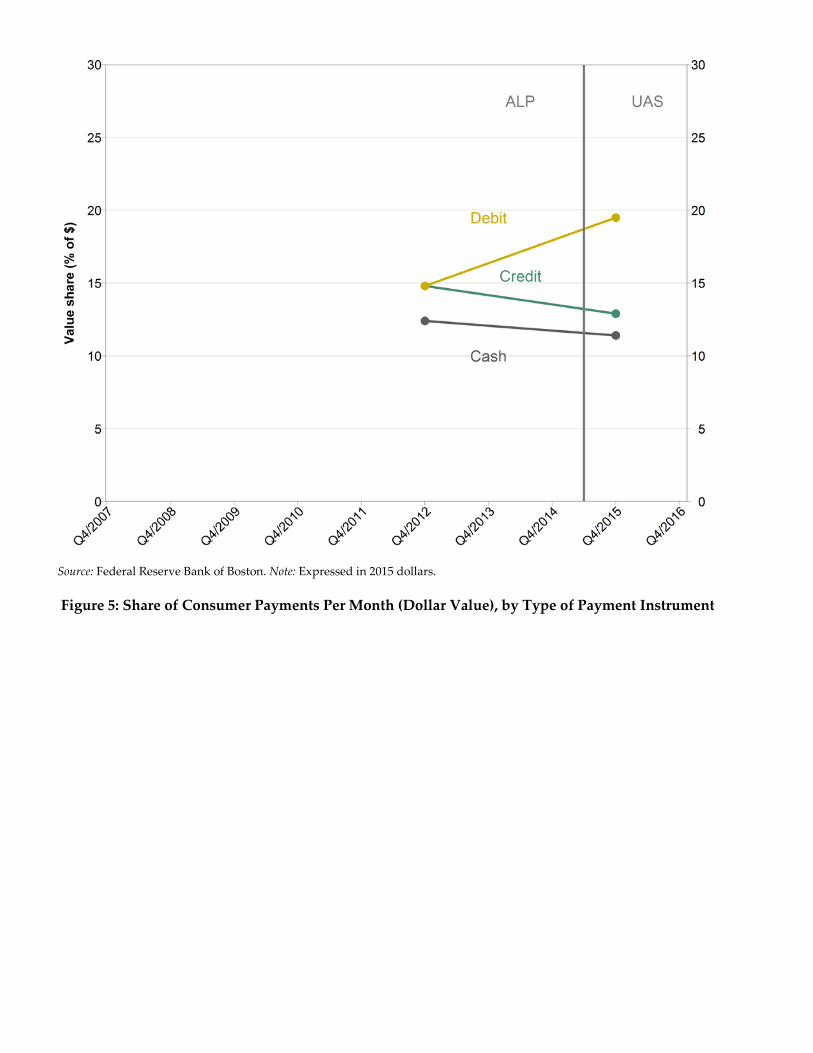
Source: Federal Reserve Bank of Boston. Note: Expressed in 2015 dollars.
Figure 5: Share of Consumer Payments Per Month (Dollar Value), by Type of Payment Instrument
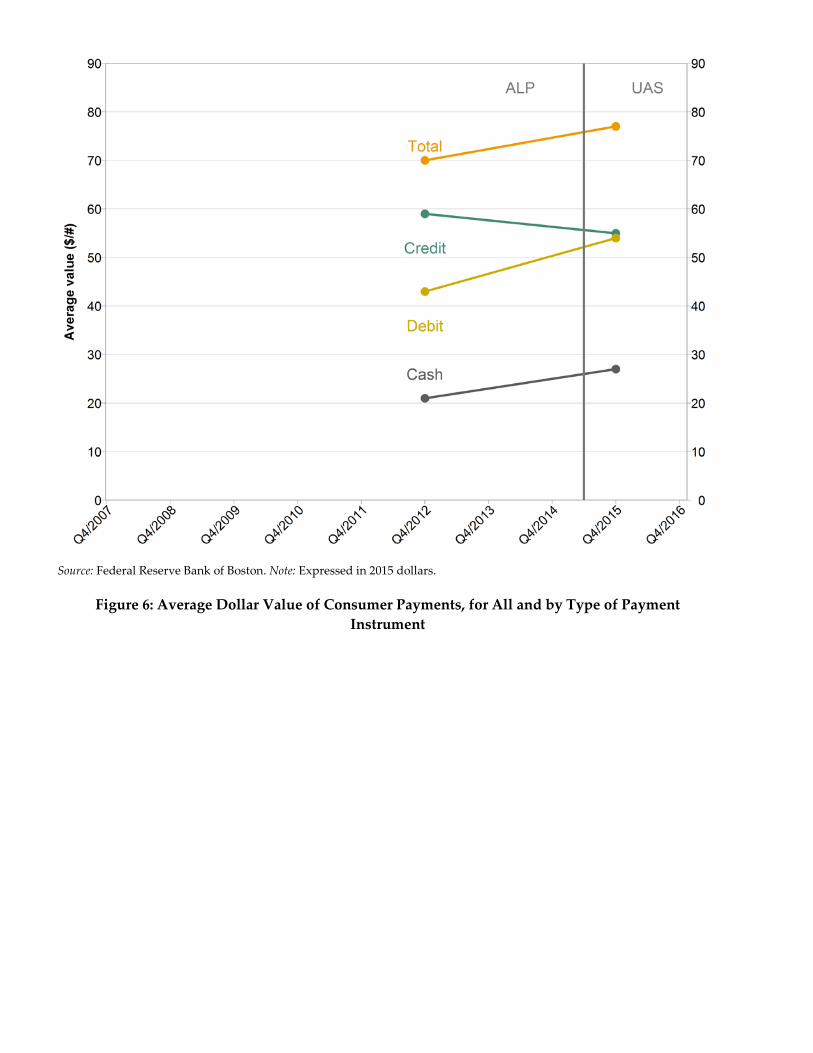
Source: Federal Reserve Bank of Boston. Note: Expressed in 2015 dollars.
Figure 6: Average Dollar Value of Consumer Payments, for All and by Type of Payment Instrument
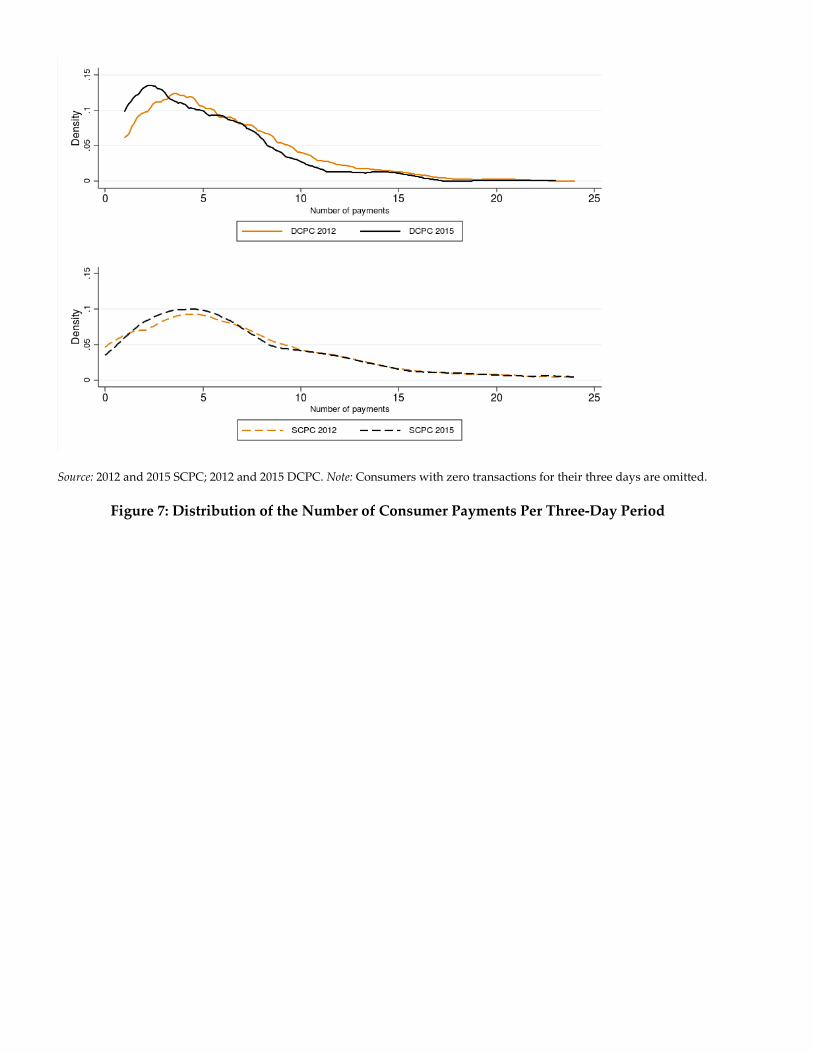
Source: 2012 and 2015 SCPC; 2012 and 2015 DCPC. Note: Consumers with zero transactions for their three days are omitted.
Figure 7: Distribution of the Number of Consumer Payments Per Three-Day Period

Source: 2012 and 2015 DCPC. Notes: Expressed in 2015 dollars. Consumers with zero transactions for their three days are omitted.
Figure 8: Distribution of the Three-Day Dollar Value of Consumer Payments

Source: 2012 and 2015 DCPC. Notes: Expressed in 2015 dollars. Consumers with zero transactions for their three days are omitted.
Figure 9: Distribution of Average Dollar Value Per Payment Per Consumer Three-Day Period
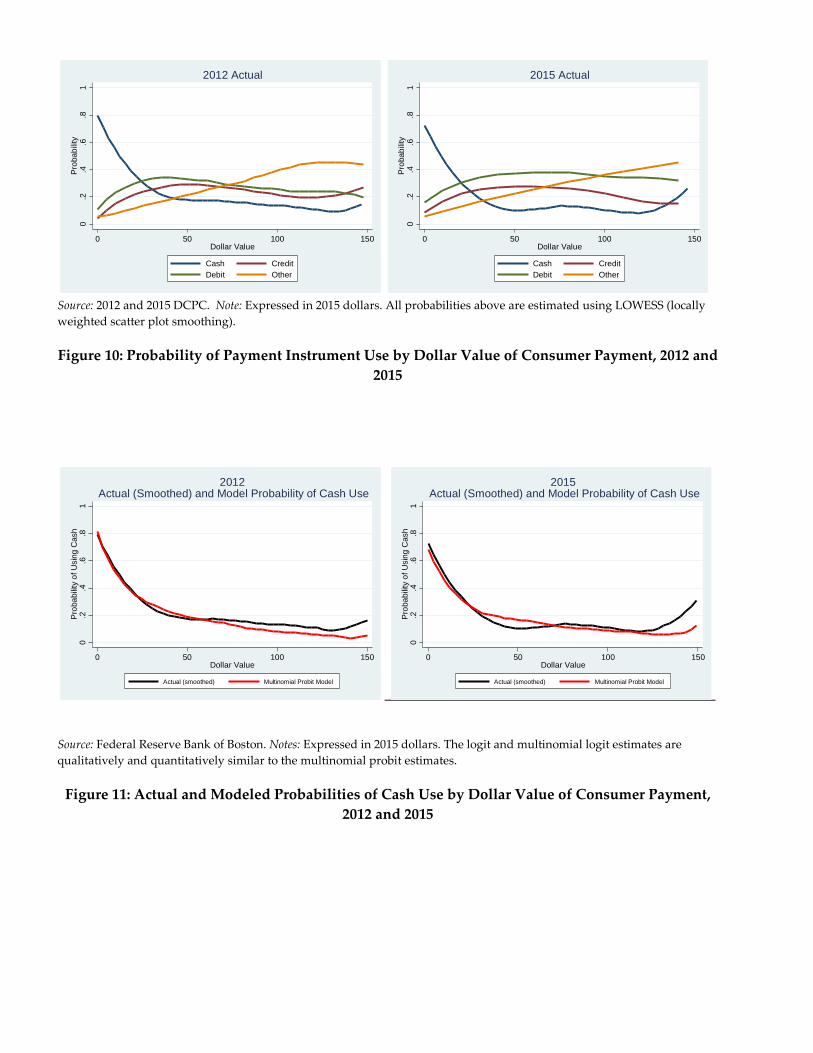
Source: 2012 and 2015 DCPC. Note: Expressed in 2015 dollars. All probabilities above are estimated using LOWESS (locally weighted scatter plot smoothing).
Figure 10: Probability of Payment Instrument Use by Dollar Value of Consumer Payment, 2012 and 2015
Source: Federal Reserve Bank of Boston. Notes: Expressed in 2015 dollars. The logit and multinomial logit estimates are qualitatively and quantitatively similar to the multinomial probit estimates.
Figure 11: Actual and Modeled Probabilities of Cash Use by Dollar Value of Consumer Payment, 2012 and 2015
0.2
.4.6
.81
Pro
babi
lity
0 50 100 150Dollar Value
Cash CreditDebit Other
2012 Actual
0.2
.4.6
.81
Pro
babi
lity
0 50 100 150Dollar Value
Cash CreditDebit Other
2015 Actual0
.2.4
.6.8
1P
roba
bilit
y of
Usi
ng C
ash
0 50 100 150Dollar Value
Actual (smoothed) Multinomial Probit Model
2012Actual (Smoothed) and Model Probability of Cash Use
0.2
.4.6
.81
Pro
babi
lity
of U
sing
Cas
h
0 50 100 150Dollar Value
Actual (smoothed) Multinomial Probit Model
2015Actual (Smoothed) and Model Probability of Cash Use

Source: Federal Reserve Bank of Boston, authors’ calculations. Note: Expressed in 2015 dollars.
Figure 12: Distribution of the Dollar Values of Payments
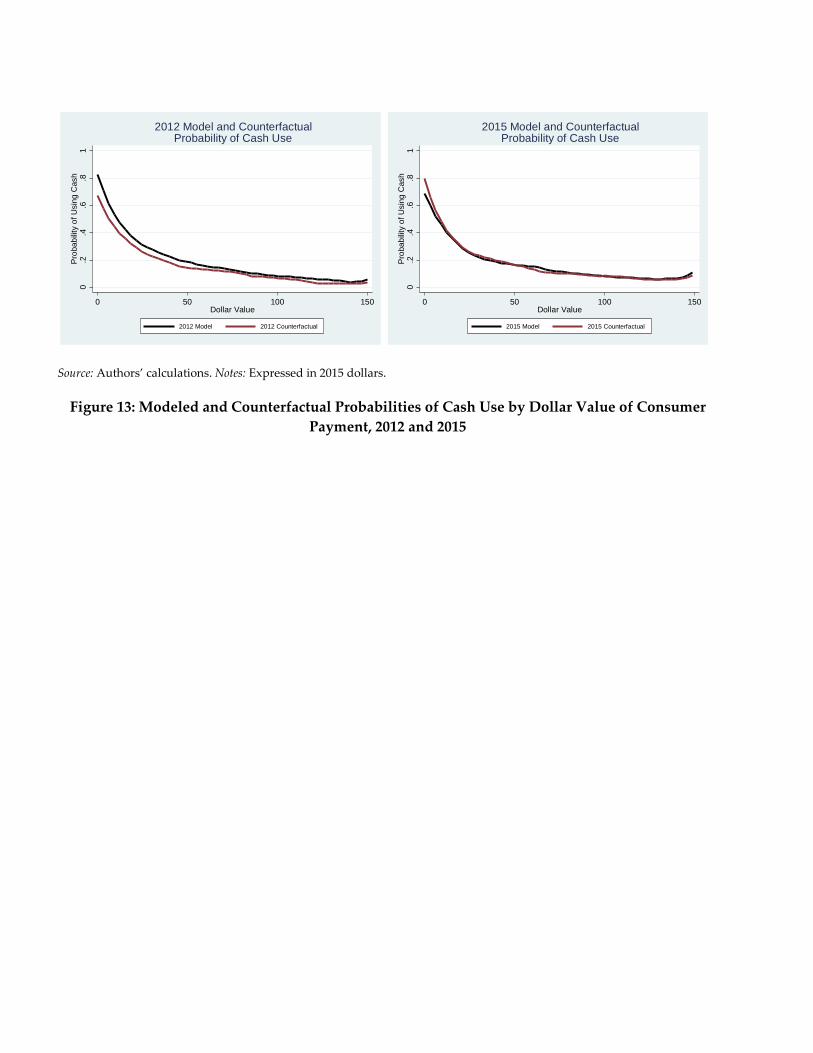
Source: Authors’ calculations. Notes: Expressed in 2015 dollars.
Figure 13: Modeled and Counterfactual Probabilities of Cash Use by Dollar Value of Consumer Payment, 2012 and 2015
0.2
.4.6
.81
Pro
babi
lity
of U
sing
Cas
h
0 50 100 150Dollar Value
2012 Model 2012 Counterfactual
2012 Model and CounterfactualProbability of Cash Use
0.2
.4.6
.81
Pro
babi
lity
of U
sing
Cas
h
0 50 100 150Dollar Value
2015 Model 2015 Counterfactual
2015 Model and CounterfactualProbability of Cash Use
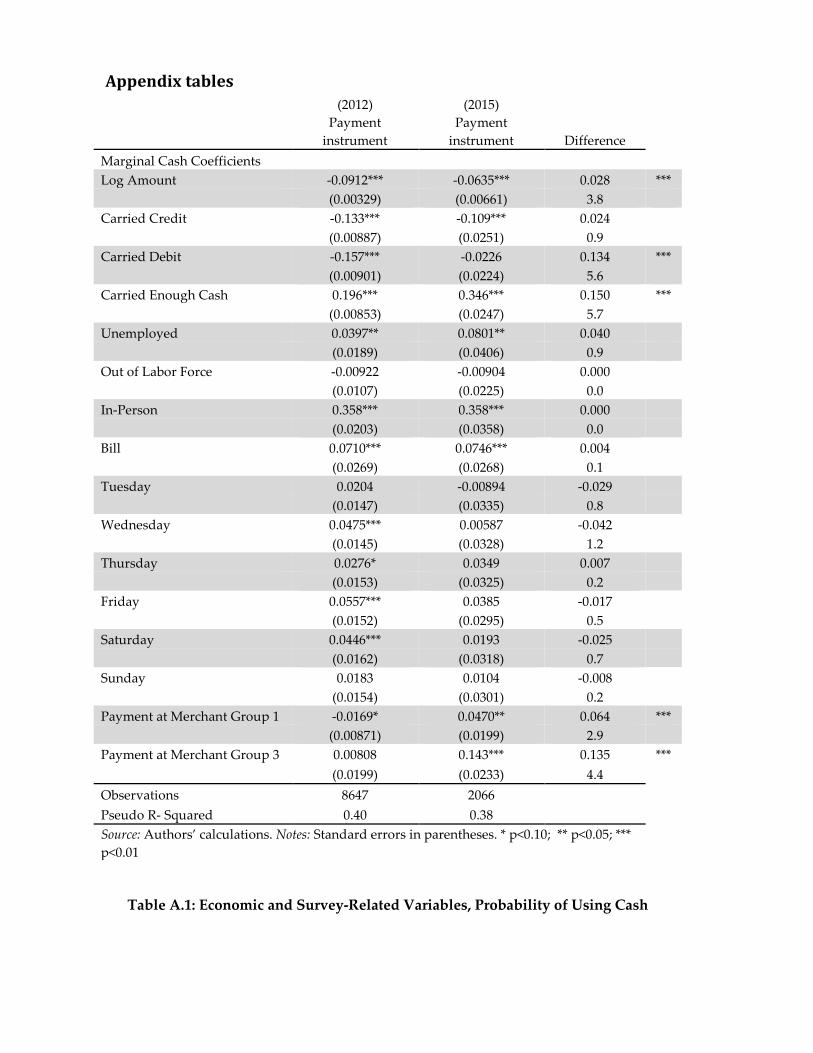
Appendix tables
(2012) (2015)
Payment instrument
Payment instrument Difference
Marginal Cash Coefficients Log Amount -0.0912*** -0.0635*** 0.028 ***
(0.00329) (0.00661) 3.8
Carried Credit -0.133*** -0.109*** 0.024
(0.00887) (0.0251) 0.9
Carried Debit -0.157*** -0.0226 0.134 ***
(0.00901) (0.0224) 5.6
Carried Enough Cash 0.196*** 0.346*** 0.150 ***
(0.00853) (0.0247) 5.7
Unemployed 0.0397** 0.0801** 0.040
(0.0189) (0.0406) 0.9
Out of Labor Force -0.00922 -0.00904 0.000
(0.0107) (0.0225) 0.0
In-Person 0.358*** 0.358*** 0.000
(0.0203) (0.0358) 0.0
Bill 0.0710*** 0.0746*** 0.004
(0.0269) (0.0268) 0.1
Tuesday 0.0204 -0.00894 -0.029
(0.0147) (0.0335) 0.8
Wednesday 0.0475*** 0.00587 -0.042
(0.0145) (0.0328) 1.2
Thursday 0.0276* 0.0349 0.007
(0.0153) (0.0325) 0.2
Friday 0.0557*** 0.0385 -0.017
(0.0152) (0.0295) 0.5
Saturday 0.0446*** 0.0193 -0.025
(0.0162) (0.0318) 0.7
Sunday 0.0183 0.0104 -0.008
(0.0154) (0.0301) 0.2
Payment at Merchant Group 1 -0.0169* 0.0470** 0.064 ***
(0.00871) (0.0199) 2.9
Payment at Merchant Group 3 0.00808 0.143*** 0.135 *** (0.0199) (0.0233) 4.4
Observations 8647 2066 Pseudo R- Squared 0.40 0.38
Source: Authors’ calculations. Notes: Standard errors in parentheses. * p<0.10; ** p<0.05; *** p<0.01
Table A.1: Economic and Survey-Related Variables, Probability of Using Cash
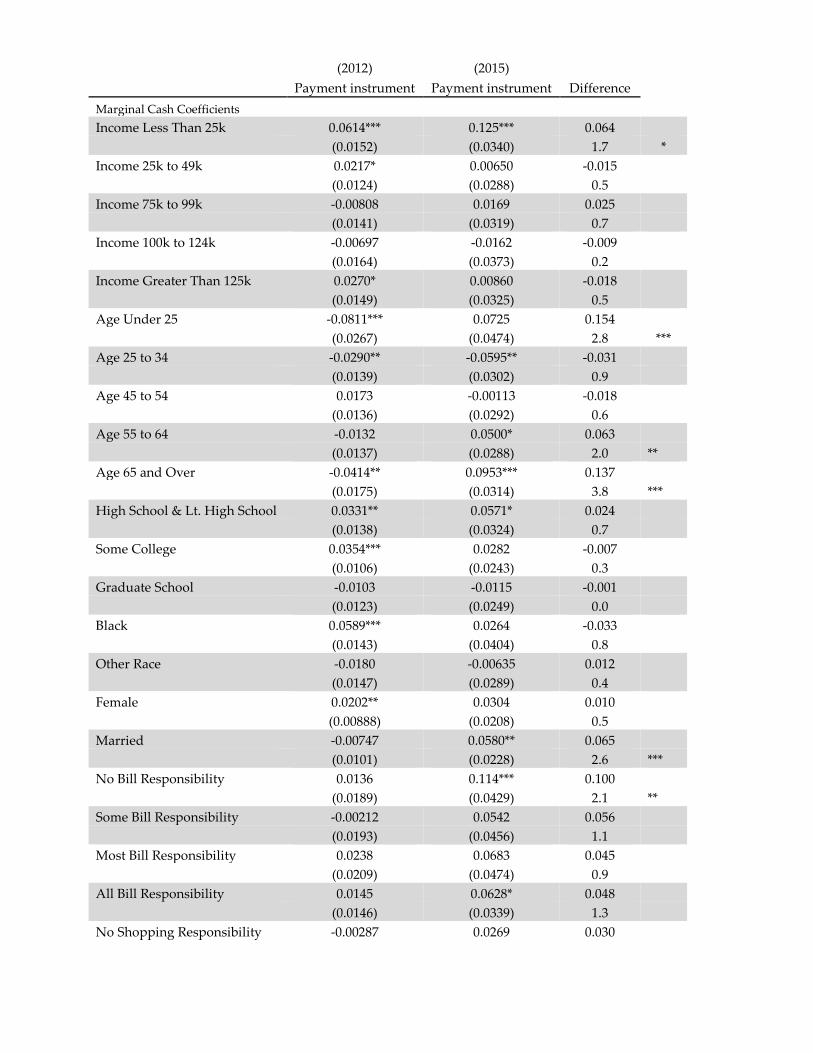
(2012) (2015)
Payment instrument Payment instrument Difference Marginal Cash Coefficients
Income Less Than 25k 0.0614*** 0.125*** 0.064
(0.0152) (0.0340) 1.7 *
Income 25k to 49k 0.0217* 0.00650 -0.015
(0.0124) (0.0288) 0.5
Income 75k to 99k -0.00808 0.0169 0.025
(0.0141) (0.0319) 0.7
Income 100k to 124k -0.00697 -0.0162 -0.009
(0.0164) (0.0373) 0.2
Income Greater Than 125k 0.0270* 0.00860 -0.018
(0.0149) (0.0325) 0.5
Age Under 25 -0.0811*** 0.0725 0.154
(0.0267) (0.0474) 2.8 ***
Age 25 to 34 -0.0290** -0.0595** -0.031
(0.0139) (0.0302) 0.9
Age 45 to 54 0.0173 -0.00113 -0.018
(0.0136) (0.0292) 0.6
Age 55 to 64 -0.0132 0.0500* 0.063
(0.0137) (0.0288) 2.0 **
Age 65 and Over -0.0414** 0.0953*** 0.137
(0.0175) (0.0314) 3.8 ***
High School & Lt. High School 0.0331** 0.0571* 0.024
(0.0138) (0.0324) 0.7
Some College 0.0354*** 0.0282 -0.007
(0.0106) (0.0243) 0.3
Graduate School -0.0103 -0.0115 -0.001
(0.0123) (0.0249) 0.0
Black 0.0589*** 0.0264 -0.033
(0.0143) (0.0404) 0.8
Other Race -0.0180 -0.00635 0.012
(0.0147) (0.0289) 0.4
Female 0.0202** 0.0304 0.010
(0.00888) (0.0208) 0.5
Married -0.00747 0.0580** 0.065
(0.0101) (0.0228) 2.6 ***
No Bill Responsibility 0.0136 0.114*** 0.100
(0.0189) (0.0429) 2.1 **
Some Bill Responsibility -0.00212 0.0542 0.056
(0.0193) (0.0456) 1.1
Most Bill Responsibility 0.0238 0.0683 0.045
(0.0209) (0.0474) 0.9
All Bill Responsibility 0.0145 0.0628* 0.048
(0.0146) (0.0339) 1.3
No Shopping Responsibility -0.00287 0.0269 0.030
(0.0220) (0.0450) 0.6
Some Shopping Responsibility -0.00297 0.00686 0.010
(0.0154) (0.0341) 0.3
Most Shopping Responsibility -0.00551 -0.0208 -0.015
(0.0146) (0.0344) 0.4
All Shopping Responsibility -0.0137 0.0163 0.030 (0.0133) (0.0279) 1.0 Observations 8647 2066
Pseudo R-squared 0.40 0.38 Source: Authors’ calculations. Notes: Standard errors in parentheses. * p<0.10; ** p<0.05; *** p<0.01
Table A.2: Demographic Variables, Probability of Using Cash
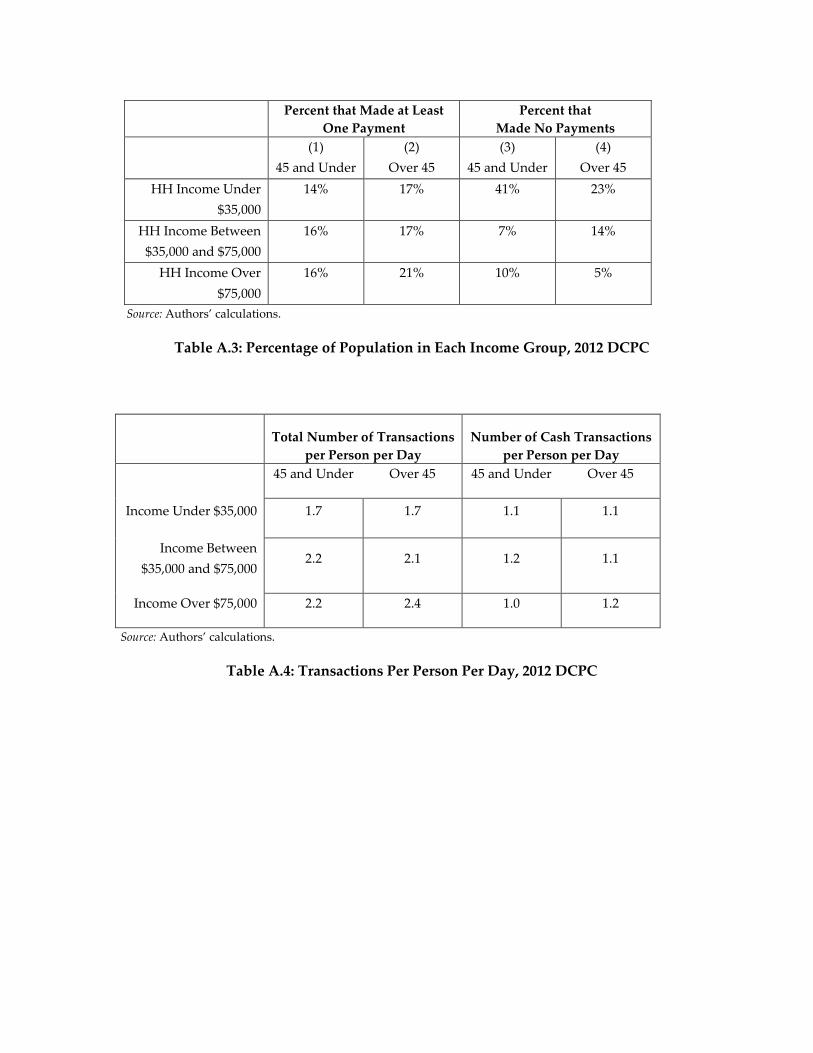
Percent that Made at Least One Payment
Percent that Made No Payments
(1) 45 and Under
(2) Over 45
(3) 45 and Under
(4) Over 45
HH Income Under $35,000
14% 17% 41% 23%
HH Income Between $35,000 and $75,000
16% 17% 7% 14%
HH Income Over $75,000
16% 21% 10% 5%
Source: Authors’ calculations.
Table A.3: Percentage of Population in Each Income Group, 2012 DCPC
Total Number of Transactions per Person per Day
Number of Cash Transactions per Person per Day
45 and Under Over 45 45 and Under Over 45
Income Under $35,000 1.7 1.7 1.1 1.1
Income Between $35,000 and $75,000
2.2 2.1 1.2 1.1
Income Over $75,000 2.2 2.4 1.0 1.2
Source: Authors’ calculations.
Table A.4: Transactions Per Person Per Day, 2012 DCPC


![CONSUMER PROTECTION ACT...Consumer Protection No. 46 of 2012 Consumer Protection LAWS OF KENYA CONSUMER PROTECTION ACT No. 46 of 2012 Revised Edition 2013 [2012] Published by the National](https://img.pdfslide.us/doc/110x75/5f7020d22f22254ef61ea25a/consumer-protection-act-consumer-protection-no-46-of-2012-consumer-protection.jpg)