Embed Size (px)
Citation preview
March 2011
US Baseline
Briefing Book
Projections for agricultural and biofuel markets
FAPRI‐MU Report #02‐11
Providing objective analysis for over 25 years

Published by the Food and Agricultural Policy Research Institute at the University of Missouri–
Columbia, 101 Park DeVille Suite E; Columbia, MO 65203 in March 2011. FAPRI is part of the College of
Agriculture, Food and Natural Resources.
http://www.fapri.missouri.edu
Material in this publication is based upon work supported by the National Institute of Food and
Agriculture, Research, Education and Economics; US Department of Agriculture, under Agreement No.
2010‐34149‐20711. Contact authors for FAPRI‐MU Report #02‐11 are Pat Westhoff ([email protected]) and Scott
Brown ([email protected]).
Any opinion, findings, conclusions, or recommendations expressed in this publication are those of the
authors and do not necessarily reflect the view of the US Department of Agriculture.
Permission is granted to reproduce this information with appropriate attribution to the author(s) and the
Food and Agricultural Policy Research Institute.
The University of Missouri–Columbia does not discriminate on the basis of race, color, religion, national origin, sex,
sexual orientation, age, disability or status as a qualified protected veteran. For more information, call Human
Resource Services at 573‐882‐4256 or the US Department of Education, Office of Civil Rights.

March 2011
US Baseline
Briefing Book
Projections for agricultural and biofuel markets
FAPRI‐MU Report #02‐11
Providing objective analysis for over 25 years
Table of contents
Foreword ........................................................................................................................................1
Summary ........................................................................................................................................2
Policy assumptions .......................................................................................................................6
Macroeconomic assumptions and farm prices paid ................................................................8
Corn ...............................................................................................................................................10
Corn processing ...........................................................................................................................12
Corn products ..............................................................................................................................14
Sorghum and barley ...................................................................................................................16
Oats and hay ................................................................................................................................18
Wheat ............................................................................................................................................20
Rice ................................................................................................................................................22
Soybeans .......................................................................................................................................24
Soybean products ........................................................................................................................26
Peanuts .........................................................................................................................................28
Other oilseeds ..............................................................................................................................30
Upland cotton ..............................................................................................................................32
Sugar .............................................................................................................................................34
Land use .......................................................................................................................................36
Ethanol ..........................................................................................................................................38
Biodiesel and cellulosic ethanol ................................................................................................40
Beef ................................................................................................................................................42
Pork ...............................................................................................................................................44
Poultry ..........................................................................................................................................46
Dairy prices ..................................................................................................................................48
Milk production ..........................................................................................................................50
Dairy products .............................................................................................................................52
Food prices and expenditures ...................................................................................................54
Government costs .......................................................................................................................56
Payments and crop insurance ...................................................................................................58
Farm receipts and expenses .......................................................................................................60
Farm income ................................................................................................................................62
Ranges from the 500 alternative futures ..................................................................................64

FAPRI-MU Report #02-11 - 2011 US Baseline Briefing Book - Page 1
ForewordThe Food and Agricultural Policy Research Institute at the University of Missouri (FAPRI-MU) provides analysis of markets and policies for Congress and other decision makers. This report presents a summary of ten-year baseline projections for US agricultural and biofuel markets.
Process and assumptionsIn November 2010, FAPRI analysts prepared a preliminary set of projections that were reviewed at a workshop in Washington, DC in December 2010. Reviewer comments and other new information were incorporated into this final baseline prepared in January and February 2011.
The baseline is not a forecast of what will happen, but rather a projection of what could happen if current policies remain in place. The analysis incorporates provisions of the Food, Conservation and Energy Act (FCEA, the 2008 farm bill) and the Energy Independence and Security Act (EISA, the 2007 energy bill). In contrast to past FAPRI-MU baselines, we assume that biofuel tax and tariff provisions will expire on schedule and not be extended.
Assumptions about the wider economy rely on January 2011 forecasts by IHS Global Insight.
Things to look for this yearMany indicators of the farm economy have recovered after the sharp downturn tied to the recession.
•Net farm income may near $100 billion in 2011 as higher commodity prices outpace increases in production expenses. Near-term prospects are particularly bright for corn, wheat, soybean and cotton producers.
•Although crop prices are likely to fall back from the levels prevailing in early 2011, strong international demand for food and fiber and domestic demand for biofuels may keep prices well above pre-2007 levels.
• Livestock producers face high feed costs, limiting growth in supplies of meat, milk and eggs. Livestock sector prices are also supported by increasing export demand for animal products.
•Crop insurance may account for a substantially larger share of total public support to the farm sector than in the past. High prices reduce the likelihood of large expenditures on some traditional farm programs.
•After two years of very subdued US food price inflation, food prices may increase by more than 4 percent in 2011. Projected food price inflation drops back to levels consistent with the overall rate of inflation after 2012.
The extreme price volatility of recent years may continue, as many of the factors that caused recent price swings remain in flux. FAPRI-MU recognizes this uncertainty and considers 500 alternative outcomes for the future based on different assumptions about the weather, the price of petroleum and other factors that will affect the supply and demand for agricultural commodities. The tables which follow generally report the averages of the 500 alternative outcomes, but it is important to recognize that actual market results may vary greatly from the reported averages.
Acknowledgments and special noteThe US Baseline Briefing Book for 2011 was prepared by FAPRI-MU, a part of the College of Agriculture, Food and Natural Resources (CAFNR) at the University of Missouri. The FAPRI team at Iowa State University (ISU) and colleagues at the University of Arkansas and Texas Tech University developed preliminary estimates for international agricultural markets, and these were reviewed at our December workshop. Finally, the team at the Agricultural and Food Policy Center (Texas A&M) translated these national results into estimates of effects for representative farms around the country.
Because of budget constraints, we did not develop a joint 2011 baseline with our colleagues at ISU and other institutions. As a result, FAPRI-MU is solely responsible for the projections in this report, including those related to US trade.
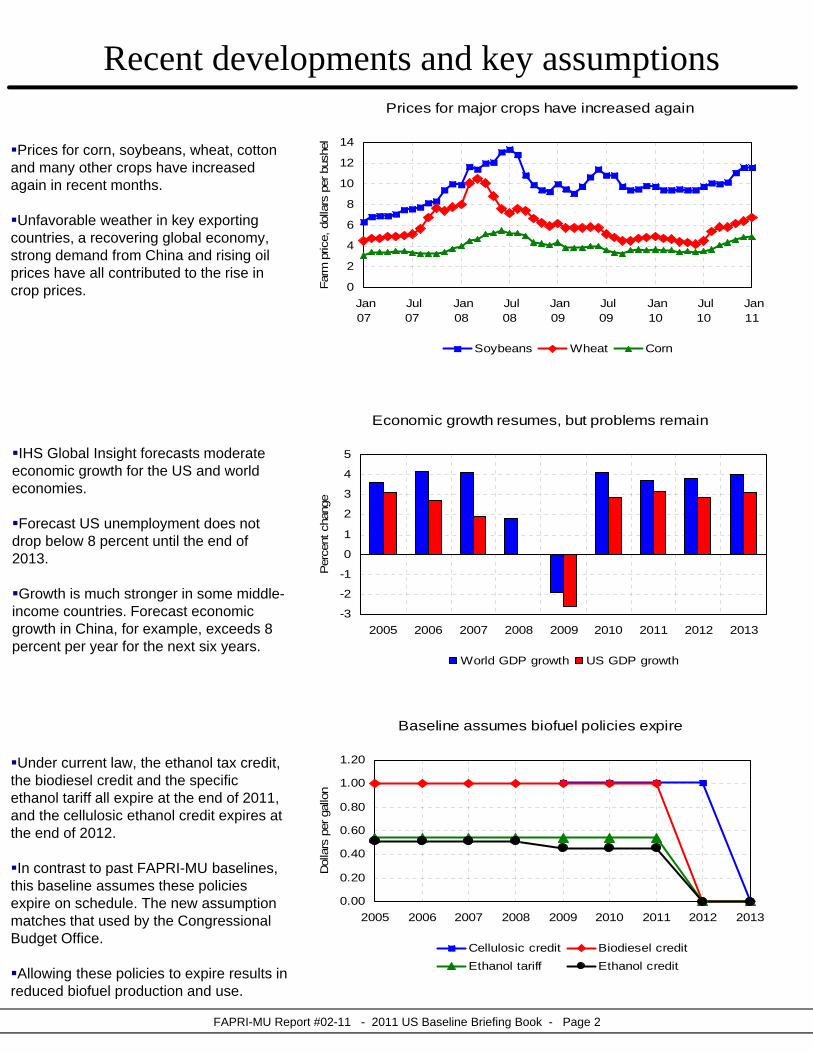
Prices for corn, soybeans, wheat, cotton and many other crops have increased again in recent months.
Unfavorable weather in key exporting countries, a recovering global economy, strong demand from China and rising oil prices have all contributed to the rise in crop prices.
IHS Global Insight forecasts moderate economic growth for the US and world economies.
Forecast US unemployment does not drop below 8 percent until the end of 2013.
Growth is much stronger in some middle-income countries. Forecast economic growth in China, for example, exceeds 8 percent per year for the next six years.
Under current law, the ethanol tax credit, the biodiesel credit and the specific ethanol tariff all expire at the end of 2011, and the cellulosic ethanol credit expires at the end of 2012.
In contrast to past FAPRI-MU baselines, this baseline assumes these policies expire on schedule. The new assumption matches that used by the Congressional Budget Office.
Allowing these policies to expire results in reduced biofuel production and use.
Recent developments and key assumptions
Economic growth resumes, but problems remain
-3
-2
-1
0
1
2
3
4
5
2005 2006 2007 2008 2009 2010 2011 2012 2013
Per
cent
cha
nge
World GDP growth US GDP growth
Prices for major crops have increased again
0
2
4
6
8
10
12
14
Jan07
Jul07
Jan08
Jul08
Jan09
Jul09
Jan10
Jul10
Jan11
Far
m p
rice,
dol
lars
per
bus
hel
Soybeans Wheat Corn
Baseline assumes biofuel policies expire
0.00
0.20
0.40
0.60
0.80
1.00
1.20
2005 2006 2007 2008 2009 2010 2011 2012 2013
Dol
lars
per
gal
lon
Cellulosic credit Biodiesel credit
Ethanol tariff Ethanol credit
FAPRI-MU Report #02-11 - 2011 US Baseline Briefing Book - Page 2

US stocks of corn, soybeans and cotton are very low relative to use in 2010/11.
These tight supplies have contributed to higher prices.
US wheat stocks are not as low, but wheat prices are supported by corn prices and strong export demand.
Projected corn and cotton stocks rebuild in 2011/12 and 2012/13 but remain low enough that prices continue to be very sensitive to supply or demand shocks.
After peaking in 2008, the total acreage planted to 13 major crops dropped in 2009 and 2010.
Strong returns for many crops, a rebound in double cropping and a slight reduction in hay area all contribute to an 8 million acre increase in the area devoted to 13 crops in 2011.
This increase in total area could allow corn, wheat, cotton and soybean area to all increase in 2011.
Domestic ethanol use has grown rapidly, but dips slightly in 2011/12, assuming the tax credit expires as scheduled at the end of 2011.
The baseline assumes regulations allowing 15 percent ethanol blends in vehicles built in 2001 and later years.
This allows ethanol use eventually to exceed 10 percent of gasoline use, even with limited projected use of E-85 and other higher-level blends.
Factors affecting the crops outlook
Stocks are low for most major crops
0%
10%
20%
30%
40%
50%
60%
2004/05 2006/07 2008/09 2010/11 2012/13S
tock
s-to
-use
rat
io
Wheat Cotton Corn Soybeans
Strong returns increase 2011 plantings
240242
244246
248250
252254
256258
260
2004 2005 2006 2007 2008 2009 2010 2011 2012
Mill
ion
acre
s
13 crops
Ethanol use dips with end of tax credit, then grows
0
5
10
15
20
25
04/05 06/07 08/09 10/11 12/13 14/15 16/17 18/19 20/21
Bill
ion
gallo
ns
Domestic ethanol use 10% of gasoline use
FAPRI-MU Report #02-11 - 2011 US Baseline Briefing Book - Page 3

The combination of lower output prices caused by the recession and higher input costs have severely hindered meat production growth.
While most meat producers are expected to see higher output prices in 2011, many costs are sharply increasing as well.
Margins are expected to improve in the next year or two, but it will take some time for these to induce higher output, especially in the case of beef.
Tight supplies and improved demand allowed for some livestock price recovery in 2010.
Prices will strengthen in the next couple of years, with record prices expected for fed steers, feeder steers and hogs.
These higher farm prices will lead to much higher costs for meat and dairy products at the consumer level.
International demand for US meat and dairy products has remained strong, even as domestic prices have risen.
The US dollar is expected to remain weak in the next decade, aiding the competitiveness of US products overseas.
Constrained production growth, a growing share of exports as a percent of production and population growth are combining to limit the availability of meat and dairy products for domestic consumers.
Factors affecting the livestock and dairy outlook
Meat production growth has slowed
65
70
75
80
85
90
95
100
105
1996 1998 2000 2002 2004 2006 2008 2010 2012In
dex,
200
8 = 1
00
Beef Pork Chicken
Prices are on the rise for livestock products
60
70
80
90
100
110
120
130
140
1996 1998 2000 2002 2004 2006 2008 2010 2012
Inde
x, 2
008
= 1
00
Fed Steer Hog Milk
Meat and dairy exports strong despite higher prices
0
2
4
6
8
10
12
14
16
18
1996 1998 2000 2002 2004 2006 2008 2010 2012
Per
cent
of pr
oduc
tion
expo
rted
Meat Butter + cheese + nonfat dry milk
FAPRI-MU Report #02-11 - 2011 US Baseline Briefing Book - Page 4

Crop and livestock receipts are likely to increase sharply in 2011 in response to higher prices, more than offsetting a large increase in production expenses.
Net farm income in 2011 could near $100 billion, the highest ever in nominal terms.
Projected receipts and costs grow at about the same rate over the next decade, leaving net farm income fairly steady.
Actual net farm income is likely to be quite variable because of volatile prices, production and expenses.
The recession, lower farm commodity prices, lower energy prices and other factors sharply reduced food price inflation in 2009 and 2010.
Higher prices for many farm commodities and higher petroleum prices are expected to result in a 4.2 percent increase in food prices in 2011.
After 2012, projected food price inflation drops to a little over 2 percent per year, similar to the general rate of inflation.
Farm program costs, farm income and food prices
Net outlays by the Commodity Credit Corporation (CCC) total $93 billion over the next ten years.
CCC outlays include spending on major farm programs, the conservation reserve and several other programs.
Over the next ten years, net outlays by the Federal Crop Insurance Corporation total $70 billion.
Higher crop prices increase crop insurance premium subsidies.
Net farm income may near $100 billion in 2011
0
20
40
60
80
100
120
2004 2006 2008 2010 2012 2014 2016 2018 2020
Calendar year
Bill
ion
dolla
rs
Nominal 2009 dollars
Food price inflation rebounds in 2011
0
1
2
3
4
5
6
2004 2006 2008 2010 2012 2014 2016 2018 2020
Calendar year
Per
cent
cha
nge
CPI for food
Crop insurance accounts for growing share of support
0
5
10
15
20
25
2004 2006 2008 2010 2012 2014 2016 2018 2020
Fiscal yearB
illio
n do
llars
CCC net outlays Crop insurance net outlays
FAPRI-MU Report #02-11 - 2011 US Baseline Briefing Book - Page 5

Farm bill provisions set to expire under current law are assumed to continue throughout the baseline.
For several commodities, target prices and loan rates adjusted in 2010.
The percentage of base area eligible for direct payments was reduced in 2009 and is increased again in 2012.
The baseline incorporates EISA, the 2007 energy bill, which mandates minimum levels of biofuel use under the Renewable Fuel Standard (RFS2).
The baseline assumes that authority to waive the statutory cellulosic mandate is utilized. It also assumes total and advanced mandates are reduced by the same quantity.
Under the RFS2, no more than 15 billion gallons of corn starch-based ethanol can count toward the overall mandate in 2015 and subsequent years.
The 2008 farm bill limits the size of the conservation reserve to no more than 32 million acres beginning in 2010/11.
The baseline assumes actual enrollment is maintained near this limit.
Millions of acres of contracts will expire each year. To maintain conservation reserve area near the limit, re-enrollments and new enrollments must match the pace of expirations. This is less likely to occur when crop prices and returns are high.
Policy assumptions2008 farm bill provisions are continued
0
1
2
3
4
5
6
7
04/05 06/07 08/09 10/11 12/13 14/15 16/17 18/19 20/21
Marketing yearD
olla
rs p
er b
ushe
l
Soybean target price Loan rate Direct payment rate
Energy bill mandates biofuel use
0
5
10
15
20
25
30
35
2006 2008 2010 2012 2014 2016 2018 2020
Calendar year
Bill
ion
gallo
ns
Other Advanced biofuels
Conservation reserve area maintained near limit
05
1015202530354045
04/05 06/07 08/09 10/11 12/13 14/15 16/17 18/19 20/21
Marketing year
Mill
ion
acre
s
CRP limit Enrolled acres
FAPRI-MU Report #02-11 - 2011 US Baseline Briefing Book - Page 6

FAPRI-MU Report #02-11 - 2011 US Baseline Briefing Book - Page 7
Crop program provisions
Direct Target Loan Base area eligible for: Planted eligible for: Base
payment price rate DPs DPs CCPs ACRE ACRE area
2010‐20 2010‐20 2010‐20 2010‐11 2012‐20 2010‐20 2010‐11 2012‐20 2011
‐‐‐‐‐Dollars per bushel‐‐‐‐‐ ‐‐‐‐‐‐‐‐‐‐‐‐‐‐‐‐‐‐‐‐‐‐‐‐‐‐‐‐‐‐‐Percent‐‐‐‐‐‐‐‐‐‐‐‐‐‐‐‐‐‐‐‐‐‐‐‐‐‐‐‐‐‐‐‐‐‐‐ mil. a.
Corn 0.28 2.63 1.95 83.3 85.0 85.0 83.3 85.0 83.53
Sorghum 0.35 2.63 1.95 83.3 85.0 85.0 83.3 85.0 11.53
Barley 0.24 2.63 1.95 83.3 85.0 85.0 83.3 85.0 8.27
Oats 0.02 1.79 1.39 83.3 85.0 85.0 83.3 85.0 2.95
Wheat 0.52 4.17 2.94 83.3 85.0 85.0 83.3 85.0 72.22
Soybeans 0.44 6.00 5.00 83.3 85.0 85.0 83.3 85.0 49.98
‐‐‐‐‐‐‐Dollars per cwt‐‐‐‐‐‐‐
Rice (all types) 2.35 10.50 6.50 83.3 85.0 85.0 83.3 85.0 4.27
‐‐‐‐‐‐Cents per pound‐‐‐‐‐‐‐
Sunflower seed 0.80 12.68 10.09 83.3 85.0 85.0 83.3 85.0 1.71
Canola 0.80 12.68 10.09 83.3 85.0 85.0 83.3 85.0 0.70
Peanuts 1.80 24.75 17.75 83.3 85.0 85.0 83.3 85.0 1.44
Upland cotton 6.67 71.25 52.00 83.3 85.0 85.0 83.3 85.0 17.66
Other program provisions
2010 2011 2012 2013 2014 2015 2016 2017 2018 2019 2020
Sugar (Cents per pound)
Raw cane sugar loan rate 18.50 18.75 18.75 18.75 18.75 18.75 18.75 18.75 18.75 18.75 18.75
Refined beet sugar loan rate 23.77 24.09 24.09 24.09 24.09 24.09 24.09 24.09 24.09 24.09 24.09
Dairy (Dollars per pound)
Block cheese support price 1.13 1.13 1.13 1.13 1.13 1.13 1.13 1.13 1.13 1.13 1.13
Butter support price 1.05 1.05 1.05 1.05 1.05 1.05 1.05 1.05 1.05 1.05 1.05
Nonfat dry milk support 0.80 0.80 0.80 0.80 0.80 0.80 0.80 0.80 0.80 0.80 0.80
(Dollars per hundredweight)
Unadjusted MILC trigger 16.94 16.94 16.94 16.94 16.94 16.94 16.94 16.94 16.94 16.94 16.94
(Million acres)
Conservation reserve limit 32.00 32.00 32.00 32.00 32.00 32.00 32.00 32.00 32.00 32.00 32.00
(Million gallons)
Renewable fuel standard 12,950 13,950 15,200 16,550 18,150 20,500 22,250 24,000 26,000 28,000 30,000
Advanced biofuels 950 1,350 2,000 2,750 3,750 5,500 7,250 9,000 11,000 13,000 15,000
Cellulosic ethanol (waived) 100 250 500 1,000 1,750 3,000 4,250 5,500 7,000 8,500 10,500
Biodiesel 650 800 1,000 1,000 1,000 1,000 1,000 1,000 1,000 1,000 1,000
Biofuel taxes and tariffs (Dollars per gallon)
Ethanol tax credit 0.45 0.45 0.00 0.00 0.00 0.00 0.00 0.00 0.00 0.00 0.00
Biodiesel tax credit 1.00 1.00 0.00 0.00 0.00 0.00 0.00 0.00 0.00 0.00 0.00
Ethanol specific tariff 0.54 0.54 0.00 0.00 0.00 0.00 0.00 0.00 0.00 0.00 0.00
Cellulosic producers credit 1.01 1.01 1.01 0.00 0.00 0.00 0.00 0.00 0.00 0.00 0.00
(Percent)
Ethanol ad valorem tariff 2.5 2.5 2.5 2.5 2.5 2.5 2.5 2.5 2.5 2.5 2.5

Although the economic recovery has led to resumed GDP growth, high unemployment rates are expected to persist for many more years.
It will be difficult to return to pre-recession levels of meat and dairy product demand as long as the jobless rate is high.
Projected inflation rates remain very mild, typically around 2 percent.
Even though the 2010 annual average fertilizer cost index was below the 2009 level, fertilizer prices began to increase during the last few months of the year.
Costs for producing everything from row crops to meat products are poised to jump in both 2011 and 2012.
Input cost inflation is expected to slow after 2012, in part because of slower growth in energy prices.
Macroeconomic assumptions and farm prices paidHigher saving rate slows consumer spending growth
-3
-2
-1
0
1
2
3
4
2004 2006 2008 2010 2012 2014 2016 2018 2020P
erce
nt c
hang
e (rea
l ter
ms)
GDP Consumer expenditures
Real GDP growth is expected to continue at around 3 percent per year.
Consumer expenditures are expected to grow more slowly than GDP as consumers are more cautious with their spending.
The higher savings rate will have negative impacts on commodity prices, particularly for higher valued products such as meat and dairy.
Unemployment declines slowly, inflation mild
-2
0
2
4
6
8
10
12
2004 2006 2008 2010 2012 2014 2016 2018 2020
Per
cent
Unemployment rate CPI inflation rate
Input costs will rise again
100
150
200
250
300
350
400
450
2004 2006 2008 2010 2012 2014 2016 2018 2020
Inde
x, 1
990-
92=10
0
Fuels Fertilizer All production items
FAPRI-MU Report #02-11 - 2011 US Baseline Briefing Book - Page 8
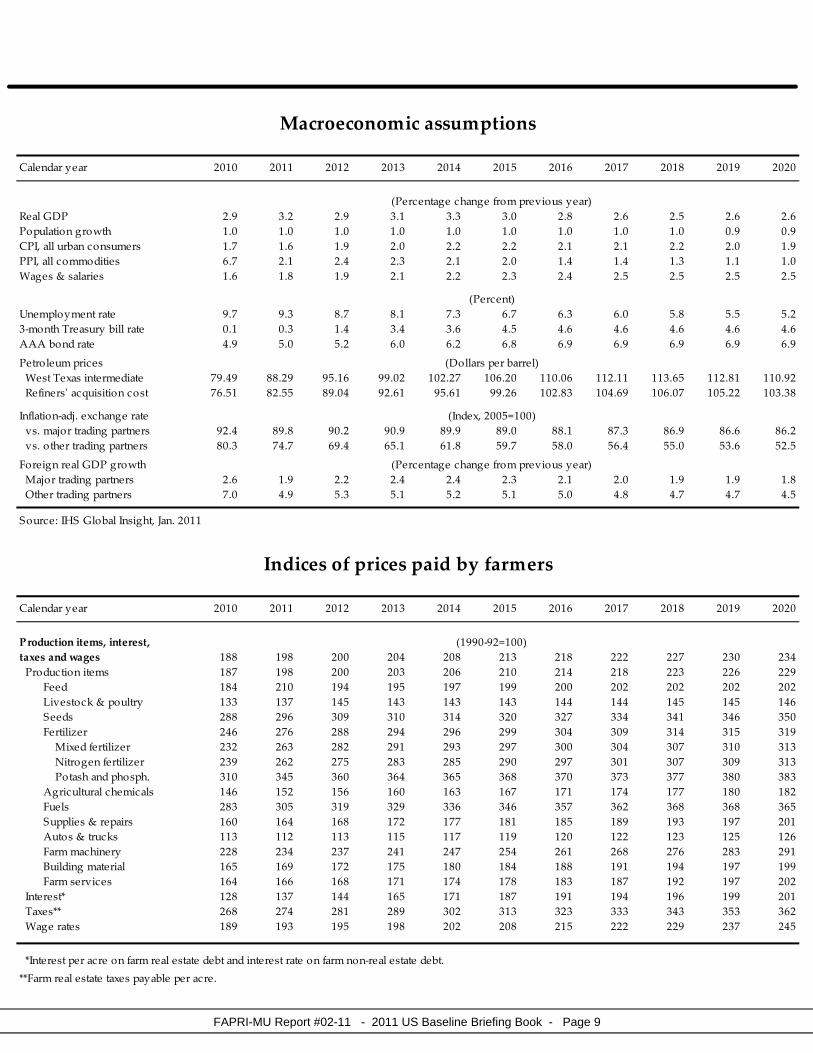
Macroeconomic assumptions
Calendar year 2010 2011 2012 2013 2014 2015 2016 2017 2018 2019 2020
(Percentage change from previous year)
Real GDP 2.9 3.2 2.9 3.1 3.3 3.0 2.8 2.6 2.5 2.6 2.6
Population growth 1.0 1.0 1.0 1.0 1.0 1.0 1.0 1.0 1.0 0.9 0.9
CPI, all urban consumers 1.7 1.6 1.9 2.0 2.2 2.2 2.1 2.1 2.2 2.0 1.9
PPI, all commodities 6.7 2.1 2.4 2.3 2.1 2.0 1.4 1.4 1.3 1.1 1.0
Wages & salaries 1.6 1.8 1.9 2.1 2.2 2.3 2.4 2.5 2.5 2.5 2.5
(Percent)
Unemployment rate 9.7 9.3 8.7 8.1 7.3 6.7 6.3 6.0 5.8 5.5 5.2
3‐month Treasury bill rate 0.1 0.3 1.4 3.4 3.6 4.5 4.6 4.6 4.6 4.6 4.6
AAA bond rate 4.9 5.0 5.2 6.0 6.2 6.8 6.9 6.9 6.9 6.9 6.9
Petroleum prices (Dollars per barrel)
West Texas intermediate 79.49 88.29 95.16 99.02 102.27 106.20 110.06 112.11 113.65 112.81 110.92
Refinersʹ acquisition cost 76.51 82.55 89.04 92.61 95.61 99.26 102.83 104.69 106.07 105.22 103.38
Inflation‐adj. exchange rate (Index, 2005=100)
vs. major trading partners 92.4 89.8 90.2 90.9 89.9 89.0 88.1 87.3 86.9 86.6 86.2
vs. other trading partners 80.3 74.7 69.4 65.1 61.8 59.7 58.0 56.4 55.0 53.6 52.5
Foreign real GDP growth (Percentage change from previous year)
Major trading partners 2.6 1.9 2.2 2.4 2.4 2.3 2.1 2.0 1.9 1.9 1.8
Other trading partners 7.0 4.9 5.3 5.1 5.2 5.1 5.0 4.8 4.7 4.7 4.5
Source: IHS Global Insight, Jan. 2011
Indices of prices paid by farmers
Calendar year 2010 2011 2012 2013 2014 2015 2016 2017 2018 2019 2020
Production items, interest, (1990‐92=100)
taxes and wages 188 198 200 204 208 213 218 222 227 230 234
Production items 187 198 200 203 206 210 214 218 223 226 229
Feed 184 210 194 195 197 199 200 202 202 202 202
Livestock & poultry 133 137 145 143 143 143 144 144 145 145 146
Seeds 288 296 309 310 314 320 327 334 341 346 350
Fertilizer 246 276 288 294 296 299 304 309 314 315 319
Mixed fertilizer 232 263 282 291 293 297 300 304 307 310 313
Nitrogen fertilizer 239 262 275 283 285 290 297 301 307 309 313
Potash and phosph. 310 345 360 364 365 368 370 373 377 380 383
Agricultural chemicals 146 152 156 160 163 167 171 174 177 180 182
Fuels 283 305 319 329 336 346 357 362 368 368 365
Supplies & repairs 160 164 168 172 177 181 185 189 193 197 201
Autos & trucks 113 112 113 115 117 119 120 122 123 125 126
Farm machinery 228 234 237 241 247 254 261 268 276 283 291
Building material 165 169 172 175 180 184 188 191 194 197 199
Farm services 164 166 168 171 174 178 183 187 192 197 202
Interest* 128 137 144 165 171 187 191 194 196 199 201
Taxes** 268 274 281 289 302 313 323 333 343 353 362
Wage rates 189 193 195 198 202 208 215 222 229 237 245
*Interest per acre on farm real estate debt and interest rate on farm non‐real estate debt.
**Farm real estate taxes payable per acre.
FAPRI-MU Report #02-11 - 2011 US Baseline Briefing Book - Page 9

Ethanol production could dip in 2011/12 if the blender’s tax credit expires on schedule at the end of 2011.
RFS2 mandates encourage modest renewed growth in ethanol use of corn from 2012 to 2015. Any further expansion will occur only if corn-based ethanol is competitive as a fuel.
High prices and limited supplies could restrict US corn exports in 2011/12, but rising world feed demand results in moderate export growth in later years.
The unexpected drop in US corn yields in 2010 is a major reason for higher world grain prices.
With stocks limited, 2011 corn yields will be critical to world markets.
Yield uncertainty means that corn production and prices this fall could vary widely from the averages reported in the table.
Higher corn prices in 2010/11 more than offset the effect of lower yields, resulting in record per-acre market receipts.
Although variable expenses are expected to increase, net returns to corn producers remain high by historical standards, and this supports corn acreage.
Projected farm program payments are very small relative to corn market receipts.
Corn
Corn returns per acre jump in 2010/11
0
200
400
600
800
1,000
04/05 06/07 08/09 10/11 12/13 14/15 16/17 18/19 20/21
September-August marketing year
Dol
lars
per
acr
e
Market Loan benefits + ACRE
Other payments Variable expenses
Growth in ethanol use of corn slows from recent pace
0
1
2
3
4
5
6
7
04/05 06/07 08/09 10/11 12/13 14/15 16/17 18/19 20/21
September-August marketing yearB
illio
n bu
shel
s
Feed use Exports Ethanol use
2011 corn yields will be critical
100
120
140
160
180
200
220
2000 2002 2004 2006 2008 2010 2012 2014 2016 2018 2020
Year
Bus
hels
per
acr
e
90th percentile Average 10th percentile
FAPRI-MU Report #02-11 - 2011 US Baseline Briefing Book - Page 10

Corn supply and use
September‐August year 10/11 11/12 12/13 13/14 14/15 15/16 16/17 17/18 18/19 19/20 20/21
Area (Million acres)
Planted area 88.2 91.0 89.3 88.5 88.6 89.1 89.1 89.2 89.4 89.0 89.0
Harvested area 81.4 83.8 82.2 81.5 81.6 82.1 82.1 82.2 82.3 82.0 82.0
(Bushels per harvested acre)
Yield 152.8 162.6 165.1 167.5 169.9 172.6 175.0 177.4 179.5 181.9 184.5
(Million bushels)
Supply 14,175 14,395 14,838 15,128 15,354 15,656 15,886 16,096 16,298 16,467 16,694
Beginning stocks 1,708 745 1,247 1,447 1,472 1,471 1,494 1,497 1,495 1,528 1,542
Production 12,447 13,630 13,571 13,661 13,862 14,164 14,372 14,578 14,783 14,919 15,131
Imports 20 20 20 20 20 20 20 20 20 20 20
Domestic use 11,480 11,318 11,526 11,755 11,928 12,139 12,269 12,401 12,478 12,546 12,639
Feed and residual 5,198 5,283 5,297 5,291 5,290 5,340 5,353 5,397 5,474 5,521 5,589
Fuel alcohol 4,902 4,635 4,818 5,039 5,202 5,354 5,462 5,543 5,534 5,546 5,563
HFCS 515 525 526 533 537 540 542 543 545 547 549
Seed 23 23 22 22 23 23 23 23 23 23 22
Food and other 842 853 862 870 876 883 889 895 902 909 916
Exports 1,950 1,831 1,865 1,901 1,955 2,023 2,120 2,200 2,292 2,379 2,469
Total use 13,430 13,149 13,391 13,656 13,884 14,162 14,389 14,601 14,769 14,925 15,109
Ending stocks 745 1,247 1,447 1,472 1,471 1,494 1,497 1,495 1,528 1,542 1,585
CCC inventory 0 0 0 0 0 0 0 0 0 0 0
Under loan 125 115 151 154 157 160 158 156 163 167 172
Other stocks 620 1,132 1,296 1,317 1,314 1,334 1,339 1,339 1,366 1,375 1,413
Prices, program provisions (Dollars per bushel)
Farm price 5.32 5.03 4.70 4.66 4.71 4.71 4.74 4.77 4.75 4.74 4.68
Loan rate 1.95 1.95 1.95 1.95 1.95 1.95 1.95 1.95 1.95 1.95 1.95
Target price 2.63 2.63 2.63 2.63 2.63 2.63 2.63 2.63 2.63 2.63 2.63
Direct payment rate 0.28 0.28 0.28 0.28 0.28 0.28 0.28 0.28 0.28 0.28 0.28
(Million acres)
Base area 83.5 83.5 83.5 83.5 83.5 83.5 83.5 83.5 83.5 83.5 83.6
(Bushels per acre)
Direct payment yield 102.5 102.5 102.5 102.5 102.5 102.5 102.5 102.5 102.5 102.5 102.5
CCP yield 114.5 114.5 114.5 114.5 114.5 114.5 114.5 114.5 114.5 114.5 114.5
(Percent)
ACRE participation rate 16.5 17.3 18.1 18.1 18.1 18.1 18.1 18.1 18.1 18.1 18.1
Returns and payments (Dollars)
Gross market revenue/a. 812.84 812.18 769.71 776.16 794.67 808.17 823.71 842.53 845.68 856.27 857.61
Variable expenses/a. 283.14 297.09 309.71 319.77 323.40 328.79 335.38 341.19 347.08 350.39 353.12
Market net return/a. 529.70 515.09 460.00 456.38 471.27 479.38 488.33 501.35 498.60 505.88 504.50
Marketing loan benefits/a.* 0.00 0.00 0.00 0.00 0.00 0.01 0.00 0.00 0.00 0.00 0.00
ACRE payment/a.* 0.00 0.06 1.25 2.29 2.86 2.70 2.80 2.65 2.93 3.33 3.57
CCP payment/base a.* 0.00 0.00 0.00 0.00 0.00 0.02 0.00 0.00 0.00 0.00 0.00
Direct payment/base a.* 23.12 23.08 23.51 23.51 23.51 23.51 23.51 23.51 23.51 23.51 23.51
*Figures reported are averages across ACRE participants and nonparticipants. All table figures are averages across 500 outcomes.
FAPRI-MU Report #02-11 - 2011 US Baseline Briefing Book - Page 11

Ethanol use has accounted for most of the recent dramatic growth in corn food and industrial use.
Ethanol use of corn could decline slightly in 2011/12 if tax credits expire, and projected growth in later years is modest compared to recent history.
High-fructose corn syrup (HFCS) and other food and industrial uses of corn grow more slowly than population.
Lower ethanol prices severely squeezed ethanol plant margins in 2008/09, but lower corn prices improved profitability at dry mill ethanol plants in 2009/10.
In 2010/11, prices of both ethanol and corn have increased sharply, resulting in continued small net returns over operating costs for ethanol plants.
From 2011-2020, net returns over operating costs average about $0.30 per gallon. Operating costs exclude capital costs; net profits are lower.
HFCS production increased in 2009/10 as a large increase in exports to Mexico more than offset a decline in domestic use.
High sugar prices contribute to further increases in HFCS exports and slow the projected decline in domestic HFCS use.
HFCS and other industrial uses of corn remain very small relative to ethanol use.
Corn processing
Dry mill net returns up slightly after sharp decline
0.00
0.50
1.00
1.50
2.00
2.50
3.00
3.50
04/05 06/07 08/09 10/11 12/13 14/15 16/17 18/19 20/21
September-August marketing year
Dol
lars
per
gal
lon
Ethanol + DDGS sales Operating costs
Returns over operating costs
Ethanol use dominates corn processing
0
1
2
3
4
5
6
7
8
04/05 06/07 08/09 10/11 12/13 14/15 16/17 18/19 20/21
September-August marketing yearB
illio
n bu
shel
s
Fuel ethanol HFCS Other
Growing exports offset weak domestic HFCS use
0
2
4
6
8
10
12
04/05 06/07 08/09 10/11 12/13 14/15 16/17 18/19 20/21
October-September marketing year
Mill
ion
tons
Production Domestic use Net exports
FAPRI-MU Report #02-11 - 2011 US Baseline Briefing Book - Page 12

FAPRI-MU Report #02-11 - 2011 US Baseline Briefing Book - Page 13
Corn processing
September‐August year 10/11 11/12 12/13 13/14 14/15 15/16 16/17 17/18 18/19 19/20 20/21
Corn food and industrial use (Million bushels)
Fuel alcohol 4,902 4,635 4,818 5,039 5,202 5,354 5,462 5,543 5,534 5,546 5,563
HFCS 515 525 526 533 537 540 542 543 545 547 549
Glucose and dextrose 260 261 260 262 263 264 265 265 266 267 268
Starch 250 254 259 262 264 266 269 271 274 276 279
Beverage alcohol 135 137 140 141 142 143 144 146 147 148 150
Cereals and other 197 200 204 206 208 209 211 213 215 217 219
Total 6,259 6,012 6,206 6,442 6,616 6,776 6,893 6,981 6,981 7,002 7,028
Corn dry milling
Corn dry milled for ethanol 4,356 4,087 4,270 4,489 4,653 4,802 4,914 4,998 5,000 5,023 5,052
(Share de‐oiling DDGS) 4.9% 7.7% 10.7% 13.6% 16.2% 18.7% 21.1% 23.6% 25.9% 28.3% 30.5%
Yields per bushel of corn (Units per bushel)
Ethanol (gallons) 2.74 2.75 2.77 2.78 2.80 2.81 2.83 2.84 2.86 2.87 2.89
Distillers grains (pounds) 17.01 16.93 16.85 16.78 16.71 16.65 16.59 16.52 16.46 16.41 16.35
Costs and returns * (Dollars per gallon)
Ethanol value 2.23 2.08 2.04 2.08 2.15 2.16 2.13 2.09 2.05 2.04 2.02
Distillers grains value 0.50 0.49 0.45 0.45 0.45 0.44 0.45 0.45 0.45 0.45 0.44
Corn cost ‐1.94 ‐1.83 ‐1.70 ‐1.68 ‐1.68 ‐1.68 ‐1.68 ‐1.68 ‐1.66 ‐1.65 ‐1.62
Fuel and electricity cost ‐0.18 ‐0.19 ‐0.21 ‐0.21 ‐0.21 ‐0.21 ‐0.21 ‐0.21 ‐0.21 ‐0.22 ‐0.22
Other operating costs ‐0.33 ‐0.33 ‐0.33 ‐0.34 ‐0.34 ‐0.34 ‐0.34 ‐0.35 ‐0.35 ‐0.35 ‐0.36
Net operating return 0.29 0.23 0.25 0.30 0.36 0.38 0.35 0.30 0.27 0.26 0.25
Corn wet milling (Million bushels)
Corn wet milled for ethanol 546 549 548 550 549 551 548 545 534 524 511
Other corn wet milling 1,025 1,040 1,045 1,057 1,064 1,070 1,075 1,080 1,085 1,090 1,096
Total corn wet milling 1,571 1,588 1,593 1,607 1,613 1,621 1,623 1,625 1,619 1,614 1,607
Yields per bushel of corn (Units per bushel)
Ethanol (gallons) 2.69 2.70 2.71 2.71 2.72 2.73 2.74 2.74 2.75 2.76 2.77
Gluten feed (pounds) 11.40 11.40 11.40 11.40 11.40 11.40 11.40 11.40 11.40 11.40 11.40
Gluten meal (pounds) 3.00 3.00 3.00 3.00 3.00 3.00 3.00 3.00 3.00 3.00 3.00
Corn oil (pounds) 1.58 1.58 1.58 1.58 1.58 1.58 1.58 1.58 1.58 1.58 1.58
Costs and returns (Dollars per gallon)
Ethanol value 2.23 2.08 2.04 2.08 2.15 2.16 2.13 2.09 2.05 2.04 2.02
Gluten feed value 0.22 0.21 0.19 0.19 0.19 0.19 0.19 0.19 0.19 0.19 0.19
Gluten meal value 0.29 0.29 0.27 0.27 0.27 0.27 0.27 0.27 0.27 0.27 0.27
Corn oil value 0.31 0.34 0.32 0.32 0.31 0.31 0.31 0.31 0.31 0.31 0.31
Corn cost ‐1.98 ‐1.86 ‐1.74 ‐1.72 ‐1.73 ‐1.73 ‐1.73 ‐1.74 ‐1.73 ‐1.72 ‐1.69
Fuel and electricity cost ‐0.14 ‐0.15 ‐0.17 ‐0.16 ‐0.17 ‐0.17 ‐0.17 ‐0.17 ‐0.17 ‐0.17 ‐0.18
Other operating costs ‐0.52 ‐0.52 ‐0.53 ‐0.53 ‐0.54 ‐0.54 ‐0.55 ‐0.55 ‐0.56 ‐0.56 ‐0.57
Net operating return 0.42 0.38 0.40 0.44 0.48 0.49 0.46 0.40 0.38 0.36 0.35
* Dry mill costs and returns for a plant that does not use a de‐oiling process to extract corn oil from distillers grains.

Distillers grains production and use expanded rapidly with the dry mill ethanol industry.
Rapid growth in domestic use of distillers grains has come to an end because of slower growth in ethanol production and continued growth in distillers grain exports.
Figures in the tables are on a dry-equivalent basis.
Over the long run, prices of distillers dried grains with solubles (DDGS) and corn gluten feed generally move with corn prices.
Since 2008, DDGS prices have declined relative to corn prices as increasing supplies were made available to livestock producers.
As the market matures, DDGS prices slowly recover relative to corn prices over the baseline.
Corn oil production from wet mill plants has not grown in recent years. Wet mill plants produce ethanol, HFCS, and other products.
The baseline projects an increase in the share of dry mill ethanol plants that remove oil from distillers grains.
The oil removed in dry mill plants is used in biodiesel production.
Corn productsRapid growth in distillers grains use ends
05
1015202530354045
04/05 06/07 08/09 10/11 12/13 14/15 16/17 18/19 20/21
September-August marketing yearM
illio
n to
ns
Distillers & brewers grain production Domestic use Net exports
Distillers grain prices generally follow corn prices
020406080
100120140160180200
04/05 06/07 08/09 10/11 12/13 14/15 16/17 18/19 20/21
September-August marketing year
Dol
lars
per
ton
Corn DDGS Corn gluten feed
Corn oil production from dry mill plants increases
0.00.51.01.52.02.53.03.54.04.5
04/05 06/07 08/09 10/11 12/13 14/15 16/17 18/19 20/21
September-August marketing year
Bill
ion
poun
ds
Wet mill ethanol plants Other wet mill plants Dry mill ethanol plants
FAPRI-MU Report #02-11 - 2011 US Baseline Briefing Book - Page 14

FAPRI-MU Report #02-11 - 2011 US Baseline Briefing Book - Page 15
Corn product supply and use
Marketing year 10/11 11/12 12/13 13/14 14/15 15/16 16/17 17/18 18/19 19/20 20/21
High‐fructose corn syrup (Thousand tons, Oct.‐Sep. year)
Production 9,038 9,224 9,260 9,415 9,502 9,567 9,618 9,673 9,724 9,776 9,827
Domestic use 7,707 7,692 7,539 7,560 7,572 7,590 7,593 7,598 7,602 7,607 7,610
Net exports 1,330 1,531 1,721 1,855 1,931 1,977 2,025 2,075 2,122 2,169 2,217
(Cents per pound, Oct.‐Sep. year)
Price, 42% Midwest 25.27 24.91 24.18 24.78 25.13 25.17 25.06 24.94 24.74 24.71 24.58
HFCS price/ref. sugar price 45% 48% 54% 55% 55% 55% 55% 56% 56% 56% 57%
Distillers, brewers grains (Thousand tons, Sep.‐Aug. year)
Production (dry equiv.) 38,168 35,721 37,098 38,784 40,013 41,104 41,879 42,422 42,291 42,329 42,428
Domestic use 28,127 24,836 25,668 26,921 27,778 28,650 29,129 29,344 29,033 28,704 28,565
Net exports 10,041 10,885 11,430 11,863 12,236 12,454 12,750 13,077 13,258 13,625 13,863
(Dollars per ton, Sep.‐Aug. year)
Price, Lawrenceburg, IN 162.00 159.49 148.77 148.46 149.65 150.21 152.23 154.09 155.24 156.24 155.76
DDGS price/corn price 85% 89% 89% 89% 89% 89% 90% 90% 92% 92% 93%
Corn gluten feed (Thousand tons, Sep.‐Aug. year)
Production 8,955 9,054 9,079 9,159 9,192 9,242 9,251 9,262 9,227 9,202 9,162
Domestic use 7,979 8,106 8,138 8,237 8,301 8,376 8,417 8,459 8,454 8,461 8,449
Net exports 976 948 941 922 891 866 834 804 772 741 713
(Dollars per ton, Sep.‐Aug. year)
Price, 21%, IL points 103.24 98.96 91.49 90.90 91.37 91.38 92.26 93.12 93.31 93.53 92.83
CGF price/corn price 54% 55% 55% 55% 54% 54% 54% 55% 55% 55% 56%
Corn gluten meal (Thousand tons, Sep.‐Aug. year)
Production 2,357 2,383 2,389 2,410 2,419 2,432 2,434 2,437 2,428 2,421 2,411
Domestic use 1,537 1,550 1,537 1,548 1,544 1,546 1,539 1,532 1,513 1,496 1,476
Net exports 819 832 852 862 875 886 896 906 915 925 935
(Dollars per ton, Sep.‐Aug. year)
Price, 60%, IL points 523.62 513.29 481.40 485.69 480.64 482.38 486.27 489.83 495.12 496.51 497.50
CGM price/soymeal price 155% 156% 159% 158% 159% 159% 158% 158% 158% 157% 158%
Corn oil (Million pounds, Oct.‐Sep. year)
Production 2,689 2,816 2,967 3,141 3,294 3,452 3,596 3,738 3,848 3,965 4,075
Domestic use 2,035 2,147 2,267 2,437 2,586 2,748 2,892 3,033 3,144 3,258 3,367
Biodiesel 214 313 458 609 753 897 1,039 1,178 1,298 1,421 1,543
Net exports 693 678 685 690 695 696 697 697 698 699 701
Ending stocks 161 153 168 181 193 201 209 216 222 229 236
(Cents per pound, Oct.‐Sep. year)
Chicago price 53.09 57.50 55.41 54.37 53.40 53.69 53.96 54.25 54.36 54.38 54.13
Corn oil price/soyoil price 105% 105% 105% 105% 105% 105% 105% 105% 105% 105% 105%

Food and industrial use of sorghum has increased because of expanded ethanol production.
Reduced sorghum supplies have led to reduced use of sorghum in domestic feed rations. Sorghum exports now exceed domestic feed use.
Sorghum prices generally move with corn prices, but the ratio of sorghum prices to corn prices can change from one year to the next depending on available supplies and other factors.
The combination of slightly higher yields and sharply higher prices results in a large increase in sorghum net returns over variable expenses in 2010/11.
In 2011/12, sorghum net returns will decline if yields return to trend and sorghum prices fall back as projected.
Over the next ten years, projected sorghum net returns remain strong enough to slow the long-term decline in sorghum area.
After two years of exceptionally strong barley prices and net returns, barley prices have declined sharply in 2010/11.
Projected average barley returns decline slightly in 2011/12 and then hold fairly steady. This helps hold barley acreage near the 2010 level over the baseline.
Feed use accounts for less than 20 percent of projected domestic barley use beginning in 2011/12. Prices and returns can be very different for feed and malting barley.
Sorghum and barley
Sorghum net returns increase in 2010/11, then fall
0
100
200
300
400
500
04/05 06/07 08/09 10/11 12/13 14/15 16/17 18/19 20/21
September-August marketing year
Dol
lars
per
acr
e
Market Loan benefits + ACRE
Other payments Variable expenses
Barley net returns decline in 2010/11
050
100150200250300350400
04/05 06/07 08/09 10/11 12/13 14/15 16/17 18/19 20/21
June-May marketing year
Dol
lars
per
acr
e
Market Loan benefits + ACRE
Other payments Variable expenses
Sorghum for ethanol increases, feed use declines
0
100
200
300
400
500
600
04/05 06/07 08/09 10/11 12/13 14/15 16/17 18/19 20/21
September-August marketing yearM
illio
n bu
shel
s
Feed, residual Ethanol, food, industrial Exports
FAPRI-MU Report #02-11 - 2011 US Baseline Briefing Book - Page 16

Sorghum supply and use
September‐August year 10/11 11/12 12/13 13/14 14/15 15/16 16/17 17/18 18/19 19/20 20/21
Area (Million acres)
Planted area 5.40 5.73 5.39 5.48 5.47 5.45 5.41 5.36 5.32 5.26 5.23
Harvested area 4.81 4.98 4.69 4.75 4.74 4.72 4.68 4.63 4.60 4.54 4.51
(Bushels per harvested acre)
Yield 71.8 65.4 65.7 65.9 66.1 66.4 66.7 66.9 67.0 67.2 67.4
Supply and use (Million bushels)
Production 345 326 309 314 315 315 313 311 309 306 305
Imports 0 0 0 0 0 0 0 0 0 0 0
Domestic use 200 188 179 180 183 181 177 173 167 162 157
Exports 150 132 131 132 131 133 137 138 142 144 147
Ending stocks 37 43 42 44 45 46 45 45 46 46 47
Prices, returns and payments (Dollars)
Farm price/bu. 5.43 4.48 4.37 4.33 4.36 4.39 4.43 4.47 4.46 4.46 4.43
Gross market revenue/a. 389.86 290.32 284.85 283.46 285.77 289.14 292.99 296.81 295.97 297.47 296.79
Variable expenses/a. 146.38 155.42 160.41 164.49 166.97 170.39 174.05 176.80 179.64 181.01 181.93
Market net return/a. 243.48 134.90 124.44 118.98 118.80 118.76 118.95 120.01 116.33 116.46 114.86
Marketing loan benefits/a.* 0.00 0.00 0.00 0.00 0.00 0.02 0.00 0.00 0.00 0.01 0.00
ACRE payment/a.* 0.04 0.08 0.21 0.36 0.46 0.42 0.38 0.34 0.36 0.36 0.39
CCP payment/base a.* 0.00 0.00 0.00 0.00 0.00 0.03 0.01 0.01 0.00 0.02 0.00
Direct payment/base a.* 16.22 16.19 16.50 16.50 16.50 16.50 16.50 16.50 16.50 16.50 16.50
Barley supply and use
June‐May year 10/11 11/12 12/13 13/14 14/15 15/16 16/17 17/18 18/19 19/20 20/21
Area (Million acres)
Planted area 2.87 2.90 2.99 3.05 3.01 2.98 2.94 2.90 2.86 2.83 2.81
Harvested area 2.47 2.52 2.59 2.65 2.62 2.59 2.55 2.52 2.48 2.45 2.43
(Bushels per harvested acre)
Yield 73.1 67.1 68.0 68.7 69.3 69.9 70.6 71.3 71.9 72.4 72.9
Supply and use (Million bushels)
Production 180 169 177 182 182 181 180 179 179 177 178
Imports 10 19 24 23 23 23 24 24 24 25 25
Domestic use 206 196 193 196 196 196 196 195 195 194 195
Exports 10 9 8 8 8 8 8 8 8 7 7
Ending stocks 90 74 74 76 77 77 77 77 78 78 79
Prices, returns and payments (Dollars)
All barley farm price/bu. 3.90 4.14 4.20 4.13 4.15 4.14 4.17 4.19 4.20 4.23 4.21
Feed barley price/bu. 3.08 3.28 3.16 3.11 3.14 3.14 3.17 3.19 3.18 3.18 3.15
Gross market revenue/a. 285.46 276.89 284.73 282.28 286.34 288.31 293.32 297.89 300.63 304.73 306.05
Variable expenses/a. 132.16 138.86 144.84 149.08 151.42 154.33 157.33 159.89 162.52 164.00 165.39
Market net return/a. 153.29 138.03 139.89 133.19 134.91 133.98 135.99 138.00 138.11 140.73 140.66
Marketing loan benefits/a.* 0.00 0.15 0.60 0.62 1.20 1.15 0.71 0.70 0.64 1.11 0.83
ACRE payment/a.* 1.37 1.05 0.97 1.27 1.42 1.14 0.99 0.85 0.96 0.89 0.92
CCP payment/base a.* 0.00 0.32 0.87 0.97 1.24 1.11 0.92 0.90 0.87 1.15 0.98
Direct payment/base a.* 9.19 9.18 9.35 9.35 9.35 9.35 9.35 9.35 9.35 9.35 9.35
*Figures reported are averages across ACRE participants and nonparticipants. All table figures are averages across 500 outcomes.
FAPRI-MU Report #02-11 - 2011 US Baseline Briefing Book - Page 17

After declining sharply from the 2008/09 peak, projected oat prices and returns increase in 2010/11 and 2011/12.
Imports account for more than half of domestic oat supplies after 2010/11.
Projected oat acreage declines in 2011/12 because of strong competition from other crops. Far less oats is planted and harvested today than 20 years ago.
Lower yields reduced hay production in 2010, and a projected decline in acreage results in another slight reduction in hay production in 2011.
Hay use also declines in 2010/11, but use exceeds production, resulting in a drawdown in hay stocks.
Average projected hay production and disappearance are almost the same after 2011/12. Deviations from average weather and other factors will result in variability not reflected in these average projections.
Hay prices have retreated from the 2008/09 peak, but some recovery is expected in 2011/12 in response to tighter supplies.
Projected reductions in cattle numbers between now and 2013 limit upward pressure on hay prices.
Hay markets are more fragmented than markets for most other agricultural commodities, so trends in national average prices may not reflect local conditions.
Oats and hay
Hay production declines in 2010 and 2011
130
135
140
145
150
155
160
04/05 06/07 08/09 10/11 12/13 14/15 16/17 18/19 20/21
May-April marketing year
Mill
ion
tons
Production Disappearance
Hay prices remain below 2008/09 record
50
70
90
110
130
150
170
2004 2006 2008 2010 2012 2014 2016 2018 2020
Year
Dol
lars
per
ton
All hay (May-April marketing year) Alfalfa (calendar year)
Oat prices and returns recover, but stay below peak
0
50
100
150
200
250
04/05 06/07 08/09 10/11 12/13 14/15 16/17 18/19 20/21
June-May marketing year
Dol
lars
per
acr
eMarket Loan benefits + ACRE
Other payments Variable expenses
FAPRI-MU Report #02-11 - 2011 US Baseline Briefing Book - Page 18

Oats supply and use
June‐May year 10/11 11/12 12/13 13/14 14/15 15/16 16/17 17/18 18/19 19/20 20/21
Area (Million acres)
Planted area 3.14 2.87 3.08 3.18 3.17 3.14 3.11 3.07 3.05 3.02 3.00
Harvested area 1.26 1.17 1.26 1.31 1.30 1.29 1.28 1.27 1.26 1.25 1.24
(Bushels per harvested acre)
Yield 64.3 63.9 64.2 64.7 65.1 65.6 66.3 66.7 67.3 67.8 68.4
Supply and use (Million bushels)
Production 81 75 81 85 85 85 85 85 85 85 85
Imports 80 100 99 98 98 97 97 97 97 97 97
Domestic use 190 178 176 178 178 178 178 178 178 178 178
Exports 3 3 3 3 3 3 3 3 3 3 3
Ending stocks 48 41 42 43 45 46 46 47 48 49 50
Prices, returns and payments (Dollars)
Farm price/bu. 2.35 2.61 2.63 2.59 2.60 2.59 2.58 2.61 2.59 2.59 2.57
Gross market revenue/a. 151.27 166.25 168.13 167.21 168.59 169.17 170.43 173.50 173.29 175.02 175.63
Variable expenses/a. 97.59 102.50 106.85 109.85 111.35 113.29 115.33 117.05 118.86 119.75 120.69
Market net return/a. 53.68 63.75 61.28 57.36 57.24 55.88 55.11 56.45 54.43 55.27 54.94
Marketing loan benefits/a.* 0.00 0.01 0.13 0.09 0.13 0.15 0.21 0.15 0.21 0.17 0.15
ACRE payment/a.* 0.09 0.07 0.10 0.13 0.13 0.13 0.13 0.13 0.12 0.13 0.13
CCP payment/base a.* 0.00 0.05 0.29 0.31 0.39 0.39 0.47 0.39 0.36 0.34 0.35
Direct payment/base a.* 0.95 0.95 0.97 0.97 0.97 0.97 0.97 0.97 0.97 0.97 0.97
*Figures reported are averages across ACRE participants and nonparticipants. All table figures are averages across 500 outcomes.
Hay supply and use
May‐April year 10/11 11/12 12/13 13/14 14/15 15/16 16/17 17/18 18/19 19/20 20/21
(Million acres)
Harvested area 59.9 58.7 58.8 58.9 58.9 58.9 58.8 58.8 58.7 58.7 58.7
(Tons per acre)
Yield 2.43 2.47 2.48 2.48 2.48 2.49 2.49 2.50 2.50 2.51 2.52
Supply and use (Million tons)
Production 145.6 144.9 145.5 146.1 146.3 146.5 146.7 146.9 147.0 147.3 147.7
Disappearance 147.8 145.4 145.0 145.5 146.1 146.6 146.9 147.1 147.2 147.3 147.6
Ending stocks 18.7 18.2 18.7 19.3 19.6 19.5 19.4 19.2 19.0 19.0 19.1
Prices (Dollars per ton)
All hay (crop year) 113.64 121.48 118.62 116.41 116.46 118.52 120.30 122.59 124.55 126.36 126.51
Alfalfa (calendar year) 116.00 124.93 126.66 123.66 122.63 124.15 126.44 128.97 131.51 133.77 134.76
FAPRI-MU Report #02-11 - 2011 US Baseline Briefing Book - Page 19

After two years when US wheat production exceeded use, stronger export demand results in lower US wheat stocks in 2010/11 and 2011/12.
Projected wheat production in 2011 is only slightly greater than in 2010. Area increases, but yields decline from the 2010 record.
In spite of the projected decline, wheat stocks remain above the levels that prevailed between 2004/05 and 2007/08.
Poor wheat crops in Russia and Ukraine contributed to a sharp increase in US wheat exports in 2010/11.
Foreign wheat supplies are expected to remain tight in 2011/12 allowing for a second straight year of strong US wheat exports.
US wheat exports could dip in 2012/13 if two years of high wheat prices result in a replenishment of world wheat supplies.
Only modest growth is projected in domestic wheat consumption.
After peaking in 2008/09, season-average wheat prices and net returns declined sharply in 2009/10.
Higher prices and record yields cause wheat net returns to rebound in 2010/11.
Projected net returns to wheat producers remain strong enough to maintain wheat acreage above the 2010 level.
USDA projections released after this baseline was completed suggest even higher US wheat prices in 2011/12.
Wheat
Wheat exports jump in 2010/11
0.50.60.70.80.91.01.11.21.31.4
04/05 06/07 08/09 10/11 12/13 14/15 16/17 18/19 20/21
June-May marketing year
Bill
ion
bush
els
Domestic use Exports
Strong demand draws down wheat stocks
0.0
0.5
1.0
1.5
2.0
2.5
3.0
04/05 06/07 08/09 10/11 12/13 14/15 16/17 18/19 20/21
June-May marketing yearB
illio
n bu
shel
s
Production Total use Ending stocks
Wheat net returns rebound in 2010/11, stay strong
0
50
100
150
200
250
300
350
04/05 06/07 08/09 10/11 12/13 14/15 16/17 18/19 20/21
June-May marketing year
Dol
lars
per
acr
e
Market Loan benefits + ACRE
Other payments Variable expenses
FAPRI-MU Report #02-11 - 2011 US Baseline Briefing Book - Page 20

Wheat supply and use
June‐May year 10/11 11/12 12/13 13/14 14/15 15/16 16/17 17/18 18/19 19/20 20/21
Area (Million acres)
Planted area 53.6 56.9 56.1 56.0 55.2 55.2 55.1 55.1 55.3 55.5 55.6
Harvested area 47.6 49.6 48.8 48.7 48.0 48.0 48.0 47.9 48.1 48.4 48.4
(Bushels per harvested acre)
Yield 46.4 44.7 45.1 45.5 45.8 46.2 46.6 47.0 47.2 47.6 48.0
(Million bushels)
Supply 3,294 3,151 2,995 2,991 2,986 3,005 3,026 3,039 3,062 3,086 3,113
Beginning stocks 976 815 679 661 672 674 675 671 669 665 666
Production 2,208 2,220 2,202 2,218 2,202 2,218 2,238 2,254 2,277 2,304 2,329
Imports 110 116 114 112 112 112 113 114 116 117 117
Domestic use 1,179 1,218 1,218 1,238 1,254 1,262 1,268 1,269 1,268 1,269 1,273
Feed and residual 171 200 188 197 203 202 199 192 182 174 168
Seed 76 75 75 75 75 75 75 76 76 77 77
Food and other 932 942 955 967 976 985 993 1,002 1,010 1,019 1,028
Exports 1,300 1,254 1,115 1,081 1,057 1,068 1,087 1,101 1,128 1,151 1,168
Total use 2,479 2,472 2,334 2,319 2,312 2,330 2,355 2,370 2,396 2,420 2,441
Ending stocks 815 679 661 672 674 675 671 669 665 666 672
CCC inventory 0 0 0 0 0 0 0 0 0 0 0
Under loan 18 20 23 25 26 26 25 24 24 24 24
Other stocks 797 659 639 647 648 649 646 644 641 642 648
Prices, program provisions (Dollars per bushel)
Farm price 5.70 5.91 5.62 5.40 5.39 5.41 5.46 5.57 5.65 5.69 5.70
Loan rate 2.94 2.94 2.94 2.94 2.94 2.94 2.94 2.94 2.94 2.94 2.94
Target price 4.17 4.17 4.17 4.17 4.17 4.17 4.17 4.17 4.17 4.17 4.17
Direct payment rate 0.52 0.52 0.52 0.52 0.52 0.52 0.52 0.52 0.52 0.52 0.52
(Million acres)
Base area 72.2 72.2 72.2 72.2 72.2 72.2 72.2 72.2 72.3 72.3 72.3
(Bushels per acre)
Direct payment yield 34.4 34.4 34.4 34.4 34.4 34.4 34.4 34.4 34.4 34.4 34.4
CCP yield 36.0 36.0 36.0 36.0 36.0 36.0 36.0 36.0 36.0 36.0 36.0
(Percent)
ACRE participation rate 13.3 14.0 14.7 14.7 14.7 14.7 14.7 14.7 14.7 14.7 14.7
Returns and payments (Dollars)
Gross market revenue/a. 264.14 263.16 252.56 244.51 246.03 248.78 253.28 260.64 265.76 269.30 272.46
Variable expenses/a. 113.35 121.96 126.56 129.52 131.12 133.27 135.73 137.92 140.17 141.35 142.24
Market net return/a. 150.79 141.20 125.99 114.99 114.92 115.51 117.54 122.72 125.59 127.95 130.23
Marketing loan benefits/a.* 1.89 0.01 0.14 0.24 0.33 0.40 0.24 0.21 0.27 0.34 0.20
ACRE payment/a.* 0.89 0.81 1.88 2.68 2.69 2.39 2.26 1.99 1.96 2.05 2.09
CCP payment/base a.* 0.00 0.06 0.26 0.41 0.59 0.61 0.47 0.42 0.30 0.52 0.33
Direct payment/base a.* 14.50 14.48 14.76 14.76 14.76 14.76 14.76 14.76 14.76 14.76 14.76
*Figures reported are averages across ACRE participants and nonparticipants. All table figures are averages across 500 outcomes.
FAPRI-MU Report #02-11 - 2011 US Baseline Briefing Book - Page 21

The US harvested a record rice crop in 2010 as a large increase in area more than offset the impact of below-trend yields.
Quality problems with the 2010 crop also make it more difficult to market the large supplies.
Large projected carry-in stocks and an assumed return to normal yields mean that total projected rice supplies only drop slightly in 2011/12, in spite of a sharp reduction in rice area.
Large US supplies and quality concerns put downward pressure on 2010/11 US rice prices, in spite of some recovery in world rice markets.
Projected US rice prices rise slightly in 2011/12 with reduced US supplies.
All-rice farm prices drop to around $12 per hundredweight in 2012/13, and then slowly increase in later years in line with projected changes in world market prices.
Short and medium grain rice continues to sell at a strong premium to long grain rice.
Lower projected rice prices sharply reduce net returns to rice producers in 2009/10 and 2010/11.
Market net returns increase slowly after 2012/13, contributing to a modest increase in rice acreage.
Projected prices are high enough that marketing loan benefits and countercyclical payments only occur when prices are far below the reported averages.
Rice
US rice prices fall again in 2010/11
02468
1012141618
04/05 06/07 08/09 10/11 12/13 14/15 16/17 18/19 20/21
August-July marketing year
Dol
lars
per
cw
t
Farm price Loan rate AWP
Rice returns fall with lower prices
0
200
400
600
800
1,000
1,200
1,400
04/05 06/07 08/09 10/11 12/13 14/15 16/17 18/19 20/21
August-July marketing year
Dol
lars
per
acr
e
Market Loan benefits + ACRE
Other payments Variable expenses
Large 2010 crop results in record rice supplies
0
50
100
150
200
250
300
350
04/05 06/07 08/09 10/11 12/13 14/15 16/17 18/19 20/21
August-July marketing yearM
illio
n cw
t
Production Beginning stocks Imports
FAPRI-MU Report #02-11 - 2011 US Baseline Briefing Book - Page 22

Rice supply and use
August‐July year 10/11 11/12 12/13 13/14 14/15 15/16 16/17 17/18 18/19 19/20 20/21
Area (Million acres)
Planted area 3.64 3.05 3.10 3.09 3.14 3.19 3.26 3.27 3.27 3.30 3.33
Harvested area 3.62 3.03 3.08 3.07 3.12 3.17 3.23 3.24 3.24 3.27 3.30
(Pounds per harvested acre)
Yield 6,725 7,206 7,271 7,341 7,397 7,472 7,545 7,619 7,683 7,741 7,810
(Million hundredweight)
Supply 297.9 289.5 289.6 288.3 291.1 296.5 304.0 308.6 311.9 316.9 322.8
Beginning stocks 36.7 51.6 45.5 42.4 39.7 38.3 38.2 39.0 39.5 39.8 40.6
Production 243.1 218.3 224.1 225.4 230.5 236.9 243.9 247.2 249.4 253.6 258.1
Imports 18.1 19.6 20.0 20.5 20.9 21.3 21.9 22.4 22.9 23.5 24.2
Domestic use 129.4 125.7 128.5 130.0 131.6 132.9 134.5 136.2 137.8 139.6 141.7
Exports 117.0 118.4 118.6 118.6 121.2 125.4 130.5 132.9 134.3 136.7 139.6
Total use 246.3 244.0 247.2 248.7 252.8 258.3 265.0 269.1 272.1 276.4 281.3
Ending stocks 51.6 45.5 42.4 39.7 38.3 38.2 39.0 39.5 39.8 40.6 41.5
CCC inventory 0.0 0.0 0.0 0.0 0.0 0.0 0.0 0.0 0.0 0.0 0.0
Other stocks 51.6 45.5 42.4 39.7 38.3 38.2 39.0 39.5 39.8 40.6 41.5
Prices, program provisions (Dollars per hundredweight)
Farm price 12.41 12.72 11.98 12.29 12.50 12.98 13.19 13.36 13.57 13.71 13.74
Adjusted world price 12.95 11.33 10.78 11.25 11.80 12.52 12.86 13.10 13.36 13.58 13.66
Loan rate 6.50 6.50 6.50 6.50 6.50 6.50 6.50 6.50 6.50 6.50 6.50
Target price 10.50 10.50 10.50 10.50 10.50 10.50 10.50 10.50 10.50 10.50 10.50
Direct payment rate 2.35 2.35 2.35 2.35 2.35 2.35 2.35 2.35 2.35 2.35 2.35
(Million acres)
Base area 4.27 4.27 4.27 4.27 4.27 4.27 4.27 4.27 4.27 4.27 4.27
(Pounds per acre)
Direct payment yield 4,818 4,818 4,818 4,818 4,818 4,818 4,818 4,818 4,818 4,818 4,818
CCP yield 5,131 5,131 5,131 5,131 5,131 5,131 5,131 5,131 5,131 5,131 5,131
(Percent)
ACRE participation rate 0.0 0.0 0.0 0.0 0.0 0.0 0.0 0.0 0.0 0.0 0.0
Returns and payments (Dollars)
Gross market revenue/a. 834.41 916.55 869.97 901.99 923.76 968.29 993.50 1017.12 1041.65 1060.13 1071.58
Variable expenses/a. 480.22 504.91 523.27 539.25 548.08 560.43 573.53 583.41 593.58 599.04 602.64
Market net return/a. 354.19 411.65 346.71 362.74 375.68 407.86 419.97 433.71 448.07 461.08 468.94
Marketing loan benefits/a.* 0.00 3.60 5.55 4.81 3.80 2.23 1.64 1.06 1.24 0.70 0.09
ACRE payment/a.* 0.01 0.00 0.00 0.00 0.00 0.00 0.00 0.00 0.00 0.00 0.00
CCP payment/base a.* 0.00 0.63 2.70 2.55 3.19 2.58 2.61 2.88 2.02 2.51 2.05
Direct payment/base a.* 94.32 94.32 96.24 96.24 96.24 96.24 96.24 96.24 96.24 96.24 96.24
*Figures reported are averages across ACRE participants and nonparticipants. All table figures are averages across 500 outcomes.
FAPRI-MU Report #02-11 - 2011 US Baseline Briefing Book - Page 23

Rapid growth in Chinese soybean imports has been a driving force in world soybean markets.
Until 2005/06, Chinese soybean imports grew at about the same pace as Brazilian soybean exports. Since then, Chinese imports have grown much more rapidly.
The result has been stronger export demand for US soybeans and higher world soybean prices.
The projected rate of growth in US soybean exports slows as foreign producers and consumers respond to continued high soybean prices.
Competition from other crops also plays a role, limiting the growth in US soybean supplies.
Domestic soybean crush increases with rising use of US soybean meal and soybean oil.
Rising prices result in record soybean net returns over variable expenses in 2010/11, and returns could increase again in 2011/12.
Soybean prices and returns remain high throughout the baseline.
Soybean returns must remain strong for soybeans to maintain competitiveness with corn production.
Soybeans
Soybean exports and crush both grow
0.0
0.5
1.0
1.5
2.0
2.5
04/05 06/07 08/09 10/11 12/13 14/15 16/17 18/19 20/21
September-August marketing year
Bill
ion
bush
els
Crush Exports
Soybean net returns reach record level
0
100
200
300
400
500
600
700
04/05 06/07 08/09 10/11 12/13 14/15 16/17 18/19 20/21
September-August marketing year
Dol
lars
per
acr
e
Market Loan benefits + ACRE
Other payments Variable expenses
Chinese imports drive world soybean markets
0.0
0.5
1.0
1.5
2.0
2.5
00/01 02/03 04/05 06/07 08/09 10/11
Marketing year B
illio
n bu
shel
s
US net exports China net imports Brazil net exports
FAPRI-MU Report #02-11 - 2011 US Baseline Briefing Book - Page 24

Soybean supply and use
September‐August year 10/11 11/12 12/13 13/14 14/15 15/16 16/17 17/18 18/19 19/20 20/21
Area (Million acres)
Planted area 77.4 78.0 79.3 78.5 78.7 78.2 78.0 77.9 77.8 78.1 78.0
Harvested area 76.6 77.0 78.3 77.5 77.7 77.2 77.0 77.0 76.9 77.1 77.0
(Bushels per harvested acre)
Yield 43.5 43.5 44.1 44.6 45.1 45.7 46.3 46.8 47.2 47.8 48.3
(Million bushels)
Supply 3,495 3,504 3,609 3,635 3,690 3,712 3,742 3,786 3,816 3,863 3,901
Beginning stocks 151 140 141 159 165 170 165 166 169 165 169
Production 3,329 3,350 3,453 3,461 3,510 3,527 3,562 3,605 3,633 3,683 3,718
Imports 15 15 15 15 15 15 15 15 15 15 15
Domestic use 1,766 1,797 1,847 1,871 1,901 1,920 1,942 1,966 1,990 2,018 2,043
Crush 1,655 1,688 1,728 1,750 1,777 1,795 1,816 1,839 1,861 1,887 1,910
Seed and residual 111 109 118 121 124 125 126 127 130 131 134
Exports 1,590 1,566 1,603 1,599 1,619 1,627 1,635 1,651 1,660 1,677 1,690
Total use 3,356 3,363 3,449 3,470 3,520 3,547 3,576 3,617 3,651 3,695 3,733
Ending stocks 140 141 159 165 170 165 166 169 165 169 168
CCC inventory 0 0 0 0 0 0 0 0 0 0 0
Under loan 4 5 8 9 10 9 9 10 10 11 10
Other stocks 136 136 151 157 160 156 156 158 155 158 158
Prices, program provisions (Dollars per bushel)
Farm price 11.70 12.53 11.57 11.57 11.35 11.43 11.54 11.65 11.75 11.75 11.73
Illinois processor price 12.71 12.83 11.90 11.90 11.68 11.76 11.87 11.97 12.07 12.08 12.06
Loan rate 5.00 5.00 5.00 5.00 5.00 5.00 5.00 5.00 5.00 5.00 5.00
Target price 6.00 6.00 6.00 6.00 6.00 6.00 6.00 6.00 6.00 6.00 6.00
Direct payment rate 0.44 0.44 0.44 0.44 0.44 0.44 0.44 0.44 0.44 0.44 0.44
(Million acres)
Base area 50.0 50.0 50.0 50.0 50.0 50.0 50.0 50.0 50.0 50.0 50.0
(Bushels per acre)
Direct payment yield 30.9 30.9 30.9 30.9 30.9 30.9 30.9 30.9 30.9 30.9 30.9
CCP yield 34.2 34.2 34.2 34.2 34.2 34.2 34.2 34.2 34.2 34.2 34.2
(Percent)
ACRE participation rate 16.3 17.1 17.9 17.9 17.9 17.9 17.9 17.9 17.9 17.9 17.9
Returns and payments (Dollars)
Gross market revenue/a. 508.42 540.82 505.70 512.48 508.14 518.70 529.96 540.77 551.68 557.86 562.54
Variable expenses/a. 135.43 138.84 144.79 149.92 151.93 155.17 158.46 161.33 164.17 166.08 167.68
Market net return/a. 372.99 401.98 360.90 362.56 356.21 363.53 371.51 379.44 387.50 391.78 394.86
Marketing loan benefits/a.* 0.00 0.00 0.00 0.11 0.10 0.15 0.10 0.11 0.14 0.13 0.11
ACRE payment/a.* 0.00 0.51 2.43 3.30 3.88 3.35 3.11 3.28 3.23 3.40 3.16
CCP payment/base a.* 0.00 0.00 0.00 0.09 0.07 0.11 0.08 0.10 0.08 0.07 0.06
Direct payment/base a.* 10.96 10.94 11.14 11.14 11.14 11.14 11.14 11.14 11.14 11.14 11.14
Product prices, crush margin
48% meal price/ton 338.31 329.84 303.11 306.81 302.56 304.04 307.19 310.08 314.28 315.25 315.85
Oil price/cwt. 50.37 54.81 52.65 51.67 50.71 51.04 51.32 51.62 51.70 51.70 51.41
Bioediesel rack/gallon 4.66 5.06 4.88 4.79 4.72 4.74 4.77 4.80 4.82 4.83 4.82
Crush margin/bu. 1.16 1.34 1.39 1.36 1.37 1.36 1.36 1.36 1.37 1.39 1.39
*Figures reported are averages across ACRE participants and nonparticipants. All table figures are averages across 500 outcomes.
FAPRI-MU Report #02-11 - 2011 US Baseline Briefing Book - Page 25

After years of sharp decline, food use of soybean oil has leveled off. Projected food use increases with population growth.
Biodiesel use of soybean oil was cut almost in half between 2007/08 and 2009/10.
Biodiesel use expands in 2010/11 with rising use mandates and restoration of the biodiesel tax credit for 2011.
Future growth in soybean oil biodiesel use also depends on growth in biodiesel production from other feedstocks.
Reduced livestock and poultry production and competition from distillers grains have limited domestic use of soybean meal in recent years.
Projected growth in soybean meal use results from resumed growth in poultry production, relatively stable meal prices and little or no growth in distillers grain use.
Soybean meal exports increase only slowly because of continued competition from foreign suppliers.
Soybean meal prices exceed $300 per ton for the fourth straight year in 2010/11.
Soybean oil prices rebound sharply in 2010/11 because of strong global demand for vegetable oil and higher domestic production of biodiesel.
As a result, oil accounts for a larger share of the value of a bushel of soybeans in 2010/11 than in the previous two years.
Average crushing margins remain fairly stable after 2011/12.
Soybean products
Oil share of crush value increases again in 2010/11
0
2
4
6
8
10
12
14
16
04/05 06/07 08/09 10/11 12/13 14/15 16/17 18/19 20/21
October-September marketing year
Dol
lars
per
bus
hel o
f be
ans
Meal value Oil value IL soybean processor price
Slide in domestic use of soybean oil ends in 2010/11
02468
1012141618
04/05 06/07 08/09 10/11 12/13 14/15 16/17 18/19 20/21
October-September marketing yearB
illio
n po
unds
Domestic food use Biodiesel use Exports
Soybean meal use recovers from recent lows
0
5
10
15
20
25
30
35
40
04/05 06/07 08/09 10/11 12/13 14/15 16/17 18/19 20/21
October-September marketing year
Mill
ion
tons
Domestic use Exports
FAPRI-MU Report #02-11 - 2011 US Baseline Briefing Book - Page 26

Soybean oil supply and use
October‐September year 10/11 11/12 12/13 13/14 14/15 15/16 16/17 17/18 18/19 19/20 20/21
(Million pounds)
Supply 22,469 22,148 22,433 22,828 23,259 23,561 23,853 24,139 24,429 24,752 25,046
Beginning stocks 3,358 2,656 2,476 2,621 2,748 2,838 2,891 2,913 2,950 2,979 3,009
Production 18,996 19,377 19,843 20,093 20,396 20,608 20,847 21,111 21,364 21,659 21,922
Imports 115 115 115 115 115 115 115 115 115 115 115
Domestic use 17,112 17,200 17,410 17,587 17,802 17,839 17,943 18,026 18,070 18,228 18,255
Biodiesel 2,924 3,422 3,291 3,215 3,222 3,152 3,148 3,100 3,005 3,036 2,916
Food and other 14,189 13,777 14,119 14,372 14,581 14,687 14,795 14,927 15,064 15,193 15,339
Exports 2,700 2,472 2,402 2,493 2,619 2,831 2,996 3,162 3,380 3,515 3,734
Total use 19,812 19,672 19,812 20,080 20,421 20,670 20,939 21,189 21,450 21,743 21,989
Ending stocks 2,656 2,476 2,621 2,748 2,838 2,891 2,913 2,950 2,979 3,009 3,057
Price (Cents per pound)
Decatur 50.37 54.81 52.65 51.67 50.71 51.04 51.32 51.62 51.70 51.70 51.41
Soybean meal supply and use
October‐September year 10/11 11/12 12/13 13/14 14/15 15/16 16/17 17/18 18/19 19/20 20/21
(Thousand tons)
Supply 39,991 40,784 41,762 42,300 42,934 43,380 43,879 44,428 44,956 45,569 46,118
Beginning stocks 302 302 311 329 331 336 338 338 339 339 340
Production 39,524 40,317 41,286 41,806 42,439 42,879 43,376 43,925 44,452 45,065 45,613
Imports 165 165 165 165 165 165 165 165 165 165 165
Domestic use 30,498 31,009 31,986 32,383 33,015 33,289 33,675 34,069 34,503 35,043 35,479
Exports 9,191 9,463 9,448 9,586 9,584 9,753 9,866 10,020 10,114 10,186 10,298
Total use 39,689 40,473 41,434 41,969 42,599 43,042 43,541 44,089 44,617 45,229 45,777
Ending stocks 302 311 329 331 336 338 338 339 339 340 341
Price (Dollars per ton)
Decatur, 48% protein 338.31 329.84 303.11 306.81 302.56 304.04 307.19 310.08 314.28 315.25 315.85
FAPRI-MU Report #02-11 - 2011 US Baseline Briefing Book - Page 27
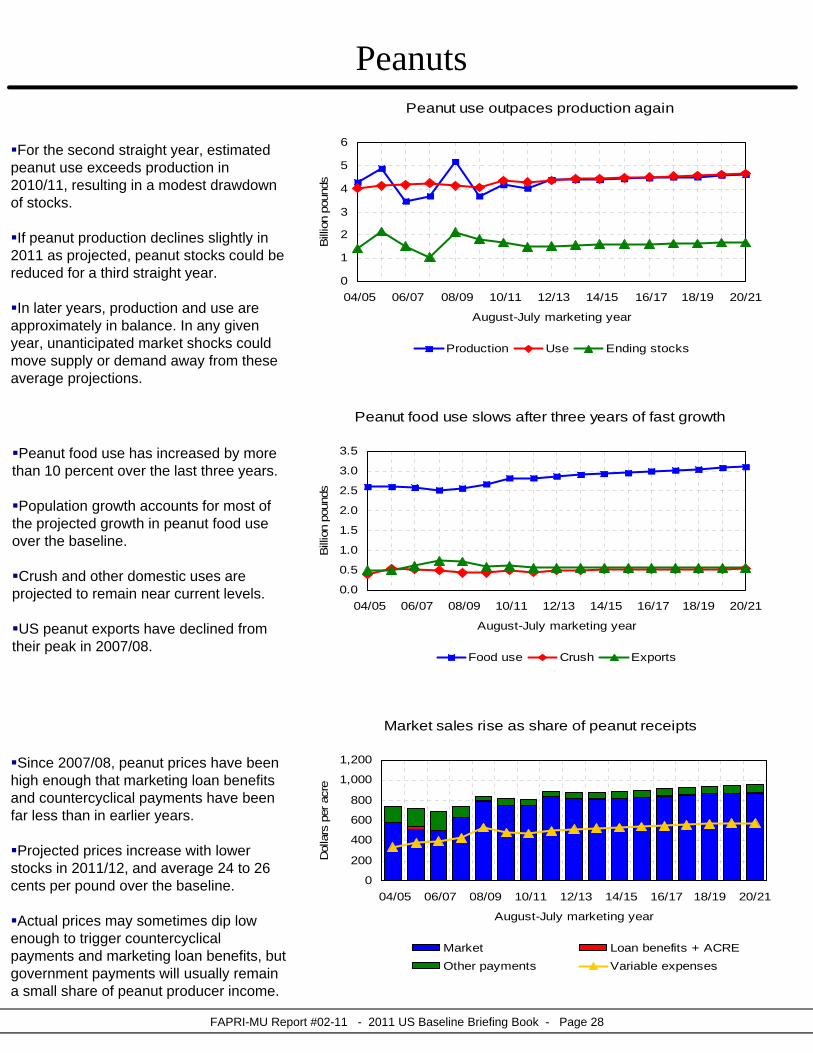
For the second straight year, estimated peanut use exceeds production in 2010/11, resulting in a modest drawdown of stocks.
If peanut production declines slightly in 2011 as projected, peanut stocks could be reduced for a third straight year.
In later years, production and use are approximately in balance. In any given year, unanticipated market shocks could move supply or demand away from these average projections.
Peanut food use has increased by more than 10 percent over the last three years.
Population growth accounts for most of the projected growth in peanut food use over the baseline.
Crush and other domestic uses are projected to remain near current levels.
US peanut exports have declined from their peak in 2007/08.
Since 2007/08, peanut prices have been high enough that marketing loan benefits and countercyclical payments have been far less than in earlier years.
Projected prices increase with lower stocks in 2011/12, and average 24 to 26 cents per pound over the baseline.
Actual prices may sometimes dip low enough to trigger countercyclical payments and marketing loan benefits, but government payments will usually remain a small share of peanut producer income.
Peanuts
Peanut food use slows after three years of fast growth
0.0
0.5
1.0
1.5
2.0
2.5
3.0
3.5
04/05 06/07 08/09 10/11 12/13 14/15 16/17 18/19 20/21
August-July marketing year
Bill
ion
poun
ds
Food use Crush Exports
Peanut use outpaces production again
0
1
2
3
4
5
6
04/05 06/07 08/09 10/11 12/13 14/15 16/17 18/19 20/21
August-July marketing yearB
illio
n po
unds
Production Use Ending stocks
Market sales rise as share of peanut receipts
0
200
400
600
800
1,000
1,200
04/05 06/07 08/09 10/11 12/13 14/15 16/17 18/19 20/21
August-July marketing year
Dol
lars
per
acr
e
Market Loan benefits + ACRE
Other payments Variable expenses
FAPRI-MU Report #02-11 - 2011 US Baseline Briefing Book - Page 28

Peanut supply and use
August‐July year 10/11 11/12 12/13 13/14 14/15 15/16 16/17 17/18 18/19 19/20 20/21
Area (Million acres)
Planted area 1.29 1.26 1.36 1.35 1.33 1.32 1.32 1.31 1.30 1.31 1.31
Harvested area 1.26 1.23 1.32 1.31 1.30 1.29 1.28 1.28 1.27 1.27 1.27
(Pounds per harvested acre)
Yield 3,311 3,271 3,313 3,355 3,395 3,436 3,481 3,524 3,569 3,615 3,657
(Million pounds)
Supply 6,044 5,750 5,918 6,000 6,043 6,068 6,123 6,173 6,210 6,296 6,362
Beginning stocks 1,829 1,680 1,479 1,542 1,576 1,591 1,595 1,610 1,627 1,635 1,667
Production 4,156 4,010 4,379 4,397 4,406 4,417 4,467 4,503 4,524 4,601 4,636
Imports 60 60 60 60 60 60 60 60 60 60 60
Domestic use 3,762 3,709 3,813 3,852 3,879 3,905 3,945 3,979 4,011 4,057 4,098
Food 2,829 2,820 2,878 2,909 2,932 2,956 2,989 3,016 3,046 3,079 3,111
Crush 500 467 506 510 512 512 516 521 521 531 536
Seed, feed, & residual 433 422 429 433 435 437 439 442 445 448 451
Exports 602 562 564 572 572 567 567 567 564 572 573
Total use 4,364 4,271 4,376 4,423 4,452 4,473 4,512 4,546 4,576 4,629 4,672
Ending stocks 1,680 1,479 1,542 1,576 1,591 1,595 1,610 1,627 1,635 1,667 1,691
Prices, program provisions (Dollars per pound)
Farm price 0.225 0.258 0.248 0.242 0.242 0.243 0.243 0.243 0.244 0.241 0.240
Loan rate 0.178 0.178 0.178 0.178 0.178 0.178 0.178 0.178 0.178 0.178 0.178
Target price 0.248 0.248 0.248 0.248 0.248 0.248 0.248 0.248 0.248 0.248 0.248
Direct payment rate 0.018 0.018 0.018 0.018 0.018 0.018 0.018 0.018 0.018 0.018 0.018
(Million acres)
Base area 1.44 1.44 1.44 1.44 1.44 1.44 1.44 1.44 1.44 1.44 1.44
(Pounds per acre)
Program yield 2,998 2,998 2,998 2,998 2,998 2,998 2,998 2,998 2,998 2,998 2,998
(Percent)
ACRE participation rate 0.0 0.0 0.0 0.0 0.0 0.0 0.0 0.0 0.0 0.0 0.0
Returns and payments (Dollars)
Gross market revenue/a. 746.51 838.98 814.00 806.72 813.35 829.60 839.73 847.86 865.63 864.84 870.54
Variable expenses/a. 473.16 496.78 511.89 523.18 530.49 540.48 550.24 558.65 566.89 571.86 575.66
Market net return/a. 273.36 342.20 302.12 283.54 282.86 289.12 289.49 289.20 298.75 292.98 294.88
Marketing loan benefits/a.* 0.00 0.22 5.03 4.37 6.46 5.67 7.71 8.55 8.61 12.83 13.26
ACRE payment/a.* 0.00 0.00 0.00 0.00 0.01 0.00 0.00 0.00 0.00 0.01 0.01
CCP payment/base a.* 10.32 5.80 19.06 21.71 23.75 22.19 24.48 24.93 26.67 28.19 29.09
Direct payment/base a.* 44.95 44.95 45.87 45.87 45.87 45.87 45.87 45.87 45.87 45.87 45.87
*Figures reported are averages across ACRE participants and nonparticipants. All table figures are averages across 500 outcomes.
FAPRI-MU Report #02-11 - 2011 US Baseline Briefing Book - Page 29
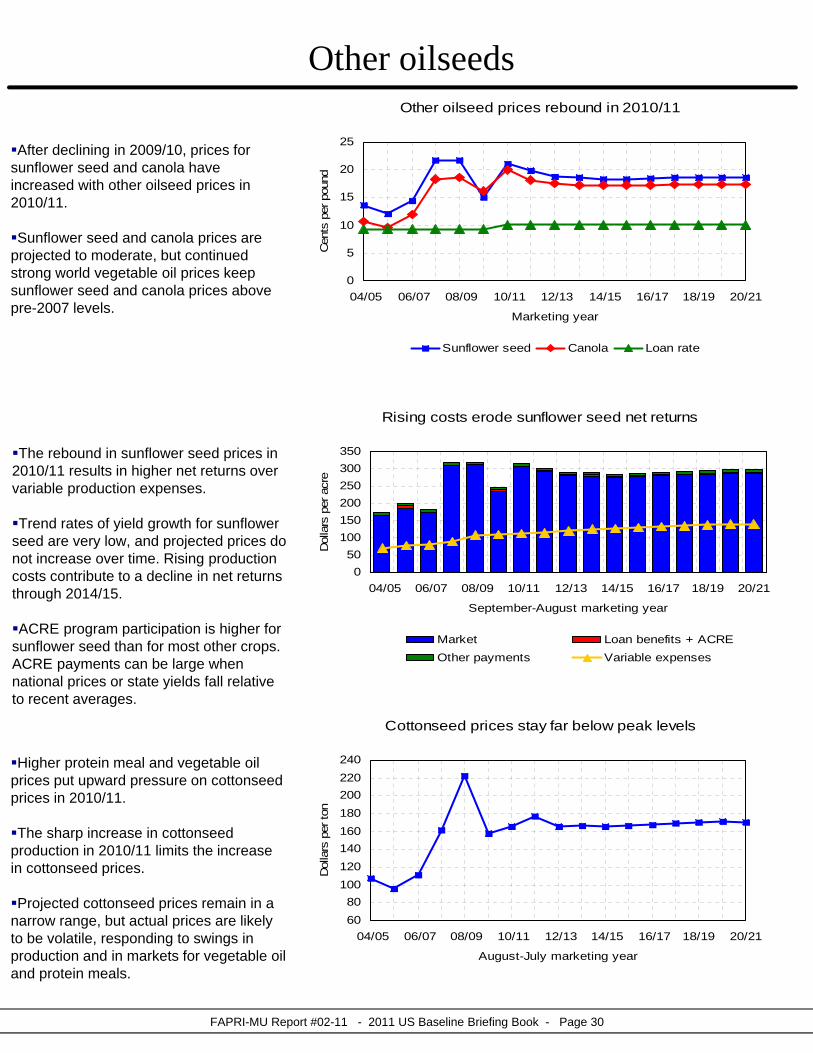
After declining in 2009/10, prices for sunflower seed and canola have increased with other oilseed prices in 2010/11.
Sunflower seed and canola prices are projected to moderate, but continued strong world vegetable oil prices keep sunflower seed and canola prices above pre-2007 levels.
The rebound in sunflower seed prices in 2010/11 results in higher net returns over variable production expenses.
Trend rates of yield growth for sunflower seed are very low, and projected prices do not increase over time. Rising production costs contribute to a decline in net returns through 2014/15.
ACRE program participation is higher for sunflower seed than for most other crops. ACRE payments can be large when national prices or state yields fall relative to recent averages.
Higher protein meal and vegetable oil prices put upward pressure on cottonseed prices in 2010/11.
The sharp increase in cottonseed production in 2010/11 limits the increase in cottonseed prices.
Projected cottonseed prices remain in a narrow range, but actual prices are likely to be volatile, responding to swings in production and in markets for vegetable oil and protein meals.
Other oilseedsOther oilseed prices rebound in 2010/11
0
5
10
15
20
25
04/05 06/07 08/09 10/11 12/13 14/15 16/17 18/19 20/21
Marketing yearC
ents
per
pou
nd
Sunflower seed Canola Loan rate
Cottonseed prices stay far below peak levels
60
80
100
120
140
160
180
200
220
240
04/05 06/07 08/09 10/11 12/13 14/15 16/17 18/19 20/21
August-July marketing year
Dol
lars
per
ton
Rising costs erode sunflower seed net returns
0
50
100
150
200
250
300
350
04/05 06/07 08/09 10/11 12/13 14/15 16/17 18/19 20/21
September-August marketing year
Dol
lars
per
acr
e
Market Loan benefits + ACRE
Other payments Variable expenses
FAPRI-MU Report #02-11 - 2011 US Baseline Briefing Book - Page 30

Sunflower seed supply and use
September‐August year 10/11 11/12 12/13 13/14 14/15 15/16 16/17 17/18 18/19 19/20 20/21
Area (Million acres)
Planted area 1.95 2.07 1.99 1.97 1.96 1.93 1.90 1.88 1.85 1.84 1.82
Harvested area 1.87 1.99 1.91 1.89 1.88 1.85 1.82 1.80 1.78 1.76 1.75
(Pounds per harvested acre)
Yield 1,460 1,490 1,497 1,505 1,514 1,520 1,527 1,535 1,537 1,543 1,552
Supply and use (Million pounds)
Production 2,736 2,969 2,864 2,855 2,854 2,816 2,788 2,777 2,736 2,720 2,715
Imports 161 161 161 161 161 161 161 161 161 161 161
Domestic use 2,599 2,639 2,586 2,561 2,549 2,517 2,497 2,494 2,471 2,470 2,472
Exports 444 424 429 444 458 459 454 445 429 413 404
Ending stocks 244 312 323 334 342 343 341 340 337 336 337
Prices, returns and payments (Dollars)
Farm price/lb. 0.211 0.198 0.189 0.186 0.183 0.184 0.185 0.186 0.187 0.187 0.186
Gross market revenue/a. 307.85 293.50 280.45 278.33 274.69 277.20 280.56 283.63 286.06 287.16 287.75
Variable expenses/a. 113.25 116.10 121.08 125.36 127.05 129.76 132.50 134.90 137.28 138.88 140.21
Market net return/a. 194.60 177.40 159.38 152.97 147.65 147.44 148.05 148.73 148.77 148.28 147.54
Marketing loan benefits/a.* 0.00 0.03 0.20 0.23 0.24 0.18 0.18 0.21 0.07 0.22 0.15
ACRE payment/a.* 0.27 0.84 2.54 3.17 3.32 2.78 2.73 2.26 2.40 2.55 2.58
CCP payment/base a.* 0.00 0.03 0.13 0.18 0.16 0.14 0.16 0.14 0.07 0.13 0.14
Direct payment/base a.* 6.84 6.81 6.92 6.92 6.92 6.92 6.92 6.92 6.92 6.92 6.92
*Figures reported are averages across ACRE participants and nonparticipants. All table figures are averages across 500 outcomes.
Other oilseeds
Marketing Year 10/11 11/12 12/13 13/14 14/15 15/16 16/17 17/18 18/19 19/20 20/21
Production (Thousand tons, Aug.‐Jul. year)
Cottonseed 6,191 6,680 6,507 6,148 6,050 5,970 6,000 6,028 6,008 6,001 6,014
(Million pounds, Jul.‐Jun. year)
Canola 2,451 2,222 1,991 1,947 1,929 1,898 1,881 1,865 1,848 1,834 1,831
Prices (Dollars per ton, Aug.‐Jul. year)
Cottonseed 165.85 176.61 165.18 166.85 165.10 166.68 167.88 169.02 170.62 170.95 170.43
(Cents per pound, Jul.‐Jun. year)
Canola 20.04 18.14 17.49 17.22 17.17 17.22 17.28 17.34 17.42 17.44 17.44
FAPRI-MU Report #02-11 - 2011 US Baseline Briefing Book - Page 31

US upland cotton production increased sharply in 2010/11, but ending stocks are expected to fall for the third straight year because of very strong foreign demand.
A projected modest increase in production in 2011/12 could allow stocks to start to rebuild, but cotton supplies are likely to remain tight for at least another year.
Lower stock levels make the cotton market very sensitive to any shifts in supply and demand.
World cotton demand has bounced back from the recession.
As a result, US exports have increased dramatically in 2010/11 and cotton prices have surged higher.
The long-running decline in domestic mill use of cotton appears to have come to an end.
Sharply higher 2010/11 cotton prices have increased net returns and eliminated benefits from the marketing loan and countercyclical payment programs.
Projected cotton prices decline after 2011/12, but remain above pre-2010 levels.
USDA recently released projections indicating much higher cotton prices in 2011/12 than reported here.
Upland cottonCotton stocks tighten due to strong demand
0
5
10
15
20
25
04/05 06/07 08/09 10/11 12/13 14/15 16/17 18/19 20/21
August-July marketing yearM
illio
n ba
les
Production Use Ending stocks
Cotton exports increase sharply in 2010/11
02468
1012141618
04/05 06/07 08/09 10/11 12/13 14/15 16/17 18/19 20/21
August-July marketing year
Mill
ion
bale
s
Exports Domestic use
Cotton market receipts also jump in 2010/11
0100200300400500600700800900
04/05 06/07 08/09 10/11 12/13 14/15 16/17 18/19 20/21
August-July marketing year
Dol
lars
per
acr
e
Market Loan benefits + ACRE
Other payments Variable expenses
FAPRI-MU Report #02-11 - 2011 US Baseline Briefing Book - Page 32

Upland cotton supply and use
August‐July year 10/11 11/12 12/13 13/14 14/15 15/16 16/17 17/18 18/19 19/20 20/21
Area (Million acres)
Planted area 10.77 12.35 11.93 11.21 10.95 10.72 10.69 10.63 10.51 10.43 10.37
Harvested area 10.51 11.10 10.74 10.07 9.84 9.64 9.61 9.57 9.46 9.38 9.33
(Pounds per harvested acre)
Yield 814 820 828 837 845 853 862 871 880 888 898
(Million bales)
Supply 20.75 20.86 21.84 22.01 22.03 21.99 22.19 22.33 22.40 22.43 22.54
Beginning stocks 2.93 1.87 3.29 4.41 4.67 4.83 4.91 4.93 5.02 5.03 5.07
Production 17.82 18.99 18.56 17.60 17.36 17.16 17.28 17.40 17.38 17.39 17.48
Imports 0.00 0.00 0.00 0.00 0.00 0.00 0.00 0.00 0.00 0.00 0.00
Domestic mill use 3.57 3.56 3.58 3.63 3.65 3.67 3.66 3.64 3.61 3.58 3.55
Exports 15.31 14.01 13.85 13.72 13.55 13.42 13.59 13.67 13.76 13.78 13.82
Total use 18.87 17.58 17.43 17.34 17.20 17.09 17.25 17.31 17.37 17.36 17.38
Ending stocks 1.87 3.29 4.41 4.67 4.83 4.91 4.93 5.02 5.03 5.07 5.16
CCC inventory 0.00 0.00 0.00 0.00 0.00 0.00 0.00 0.00 0.00 0.00 0.00
Other stocks 1.87 3.29 4.41 4.67 4.83 4.91 4.93 5.02 5.03 5.07 5.16
Prices, program provisions (Cents per pound)
Farm price 84.1 81.2 76.4 74.0 73.3 73.4 73.8 74.3 74.8 75.2 75.1
Adjusted world price 121.6 81.2 75.6 71.1 69.4 69.1 69.9 70.9 71.7 72.4 72.2
Loan rate 52.0 52.0 52.0 52.0 52.0 52.0 52.0 52.0 52.0 52.0 52.0
Target price 71.3 71.3 71.3 71.3 71.3 71.3 71.3 71.3 71.3 71.3 71.3
Direct payment rate 6.7 6.7 6.7 6.7 6.7 6.7 6.7 6.7 6.7 6.7 6.7
(Million acres)
Base area 17.65 17.66 17.66 17.66 17.66 17.66 17.66 17.66 17.66 17.66 17.66
(Pounds per acre)
Direct payment yield 595 595 595 595 595 595 595 595 595 595 595
CCP yield 631 631 631 631 631 631 631 631 631 631 631
(Percent)
ACRE participation rate 0.2 0.2 0.2 0.2 0.2 0.2 0.2 0.2 0.2 0.2 0.2
Returns and payments (Dollars)
Gross market revenue/a. 782.16 768.45 729.61 718.90 718.16 725.89 738.07 750.08 762.84 773.82 781.22
Variable expenses/a. 452.87 464.14 477.75 491.70 498.39 508.24 518.48 527.78 537.66 545.11 552.40
Market net return/a. 329.29 304.31 251.87 227.20 219.77 217.65 219.59 222.30 225.18 228.71 228.82
Marketing loan benefits/a.* 0.00 5.13 10.85 12.65 14.19 18.40 17.09 16.30 12.85 10.70 12.58
ACRE payment/a.* 0.00 0.00 0.00 0.01 0.01 0.01 0.01 0.01 0.01 0.00 0.01
CCP payment/base a.* 0.00 2.46 5.77 6.33 7.09 8.02 7.62 7.67 6.21 5.45 6.20
Direct payment/base a.* 33.06 33.06 33.73 33.73 33.73 33.73 33.73 33.73 33.73 33.73 33.73
*Figures reported are averages across ACRE participants and nonparticipants. All table figures are averages across 500 outcomes.
FAPRI-MU Report #02-11 - 2011 US Baseline Briefing Book - Page 33

In spite of two straight years of high prices, total sugar supplies have not increased in 2010/11.
Uncertainty about the ability to plant genetically modified sugar beets could limit supply response to these high prices again in 2011/12.
The baseline assumes this uncertainty is resolved, allowing a larger increase in sugar production in 2012/13, which in turn helps to moderate prices.
High-fructose corn syrup (HFCS) consumption has been declining, in part because of reduced consumption of caloric soft drinks.
Per capita sugar consumption increased in 2009/10, but current high prices cause a slight dip in 2010/11.
Sugar per capita consumption holds fairly steady in the baseline, while HFCS consumption declines at a moderate pace.
Sugar prices jumped in 2009/10 and have risen even higher in 2010/11.
Limited supply response in 2011/12 helps keep prices high.
Projected prices for 2012/13 and beyond remain above pre-2009 levels. Weaker demand growth or greater imports could result in lower prices, but another supply disruption could push prices higher again.
Sugar
Sugar gains larger share of total sweetener use
30354045505560657075
04/05 06/07 08/09 10/11 12/13 14/15 16/17 18/19 20/21
October-September marketing year
Pou
nds
per ca
pita
Sugar HFCS
Average sugar prices hit record highs in 2010/11
1015202530354045505560
04/05 06/07 08/09 10/11 12/13 14/15 16/17 18/19 20/21
October-September marketing year
Cen
ts p
er p
ound
Refined beet sugar Raw sugar price Cane sugar loan rate
Sugar supplies remain tight in 2010/11 and 2011/12
0
2
4
6
8
10
12
14
16
04/05 06/07 08/09 10/11 12/13 14/15 16/17 18/19 20/21
October-September marketing yearM
illio
n to
ns
Production Imports Beginning stocks Disappearance
FAPRI-MU Report #02-11 - 2011 US Baseline Briefing Book - Page 34

Sugar supply and use
October‐September year 10/11 11/12 12/13 13/14 14/15 15/16 16/17 17/18 18/19 19/20 20/21
Area (Million acres)
Sugar cane harvested 0.829 0.856 0.846 0.819 0.811 0.807 0.803 0.800 0.796 0.794 0.792
Sugar beet planted 1.171 1.166 1.258 1.195 1.221 1.228 1.225 1.221 1.218 1.215 1.213
Sugar beet harvested 1.156 1.117 1.206 1.146 1.171 1.177 1.174 1.171 1.168 1.165 1.163
Yield (Tons per harvested acre)
Cane sugar 3.99 4.26 4.28 4.30 4.32 4.34 4.37 4.39 4.42 4.44 4.47
Beet sugar 4.15 4.07 4.16 4.23 4.31 4.39 4.48 4.56 4.64 4.72 4.81
(Thousand tons)
Supply 12,623 12,757 13,285 13,354 13,505 13,639 13,742 13,857 13,989 14,128 14,271
Beginning stocks 1,503 1,386 1,443 1,668 1,632 1,653 1,675 1,693 1,714 1,739 1,762
Production 8,110 8,197 8,639 8,368 8,549 8,680 8,770 8,848 8,937 9,032 9,135
Cane sugar 3,310 3,651 3,624 3,520 3,503 3,506 3,511 3,512 3,517 3,528 3,539
Beet sugar 4,800 4,546 5,016 4,849 5,046 5,174 5,259 5,337 5,420 5,504 5,596
Imports 3,010 3,174 3,202 3,317 3,323 3,305 3,297 3,316 3,338 3,358 3,374
Total use 11,237 11,314 11,616 11,722 11,851 11,964 12,049 12,143 12,250 12,366 12,485
Domestic deliveries 11,089 11,132 11,432 11,539 11,668 11,780 11,865 11,959 12,065 12,182 12,301
Exports 148 182 184 182 183 184 184 184 185 185 185
Ethanol program 0 0 0 0 0 0 0 0 0 0 0
Residual 0 0 0 0 0 0 0 0 0 0 0
Ending stocks 1,386 1,443 1,668 1,632 1,653 1,675 1,693 1,714 1,739 1,762 1,785
CCC inventory 0 0 0 0 0 0 0 0 0 0 0
Other stocks 1,386 1,443 1,668 1,632 1,653 1,675 1,693 1,714 1,739 1,762 1,785
Prices (Cents per pound)
N.Y. spot raw sugar 38.43 36.56 31.49 32.20 32.51 32.47 32.27 32.04 31.73 31.45 31.16
Refined beet sugar 56.06 52.12 44.39 45.31 45.68 45.57 45.23 44.84 44.36 43.90 43.45
Cane loan rate 18.50 18.75 18.75 18.75 18.75 18.75 18.75 18.75 18.75 18.75 18.75
Beet loan rate 23.77 24.09 24.09 24.09 24.09 24.09 24.09 24.09 24.09 24.09 24.09
FAPRI-MU Report #02-11 - 2011 US Baseline Briefing Book - Page 35

Land useCorn, soybean and wheat area all increase in 2011
50556065707580859095
100
2004 2006 2008 2010 2012 2014 2016 2018 2020
Year crops harvested M
illio
n ac
res
Corn Soybeans Wheat
Cotton acreage also increases in 2011
0
2
4
6
8
10
12
14
16
2004 2006 2008 2010 2012 2014 2016 2018 2020
Year crops harvested
Mill
ion
acre
s
Upland cotton Sorghum Rice
Projected corn area planted increases by almost 3 million acres in 2011 in response to high corn prices. As prices moderate, corn acreage declines slightly in 2012.
Wheat area rebounds in 2011 from the weather-reduced level of 2010.
Soybean area increases slightly in 2011 as high soybean prices and increased double cropping slightly outweigh the effect of high prices for competing crops.
Sharply higher cotton prices and net returns result in another increase in upland cotton acreage in 2011.
After two straight years of decline, sorghum acreage increases slightly in 2011.
Lower rice prices and returns contribute to a sharp reduction in rice acreage in 2011.
The total area planted to 13 major crops decreased by almost 9 million acres between 2008 and 2010.
In response to strong returns for most major crops, 13-crop total area planted increases by almost 8 million acres in 2011, to near the 2008 level.
Correcting for hay, conservation reserve area and double crop soybean acreage, total area dropped by about 7 million acres between 2008 and 2010 and increases by a little over 4 million acres in 2011.
13-crop planted area in 2011 nears the 2008 level
220
240
260
280
300
320
340
360
2004 2006 2008 2010 2012 2014 2016 2018 2020
Year crops harvested
Mill
ion
acre
s
13 crops 13 crops + hay + CRP - double-crop
FAPRI-MU Report #02-11 - 2011 US Baseline Briefing Book - Page 36

FAPRI-MU Report #02-11 - 2011 US Baseline Briefing Book - Page 37
Land use for major crops and the conservation reserve
Marketing year 10/11 11/12 12/13 13/14 14/15 15/16 16/17 17/18 18/19 19/20 20/21
Planted area (Million acres)
Corn 88.19 90.99 89.30 88.48 88.59 89.08 89.14 89.22 89.39 89.04 89.02
Soybeans 77.40 77.96 79.32 78.48 78.72 78.18 77.97 77.94 77.85 78.08 78.02
Wheat 53.60 56.90 56.09 56.01 55.22 55.18 55.14 55.06 55.26 55.53 55.64
Upland cotton 10.77 12.35 11.93 11.21 10.95 10.72 10.69 10.63 10.51 10.43 10.37
Sorghum 5.40 5.73 5.39 5.48 5.47 5.45 5.41 5.36 5.32 5.26 5.23
Barley 2.87 2.90 2.99 3.05 3.01 2.98 2.94 2.90 2.86 2.83 2.81
Oats 3.14 2.87 3.08 3.18 3.17 3.14 3.11 3.07 3.05 3.02 3.00
Rice 3.64 3.05 3.10 3.09 3.14 3.19 3.26 3.27 3.27 3.30 3.33
Sunflowers 1.95 2.07 1.99 1.97 1.96 1.93 1.90 1.88 1.85 1.84 1.82
Peanuts 1.29 1.26 1.36 1.35 1.33 1.32 1.32 1.31 1.30 1.31 1.31
Sugar beets 1.17 1.17 1.26 1.20 1.22 1.23 1.22 1.22 1.22 1.22 1.21
Sugar cane (harvested) 0.88 0.91 0.90 0.87 0.86 0.86 0.85 0.85 0.85 0.84 0.84
Switchgrass (harvested) 0.00 0.00 0.00 0.11 0.42 0.92 1.56 2.21 2.73 3.15 3.54
13 crop planted area 250.31 258.17 256.71 254.49 254.07 254.18 254.50 254.92 255.47 255.85 256.14
Hay harvested area 59.86 58.71 58.78 58.95 58.92 58.87 58.82 58.75 58.71 58.69 58.66
13 crops + hay 310.17 316.88 315.49 313.43 312.99 313.05 313.32 313.67 314.18 314.54 314.80
Conservation reserve 31.30 31.13 30.96 31.05 30.95 30.85 30.74 30.63 30.48 30.35 30.23
13 crops + hay + CRP 341.47 348.01 346.46 344.48 343.94 343.90 344.05 344.30 344.66 344.88 345.03
Double crop soybeans 2.47 4.72 4.59 4.45 4.39 4.34 4.32 4.32 4.32 4.34 4.33
13 crops + hay + CRP 339.00 343.29 341.87 340.03 339.55 339.56 339.73 339.98 340.33 340.54 340.69
‐ double crop soybeans

After years of rapid growth, ethanol production dips in 2011/12 because of the assumed expiration of the blender’s credit.
Imports of sugar-based ethanol rise to satisfy most of the RFS2 for advanced biofuels not met by cellulosic biofuels or biodiesel.
Future cellulosic ethanol production growth is very uncertain. Projected supplies are well below the levels envisioned in the EISA.
The baseline incorporates the EPA decision to allow 15 percent ethanol blends (E-15) in vehicles built since 2001.
Use of E-15 will depend on its availability at pumps, and this may develop slowly.
The availability of E-15 means more ethanol can be consumed in conventional vehicles, delaying the need to expand use of higher level blends such as E-85.
US exports of ethanol increased in 2010 and could grow again when US ethanol is priced competitively with Brazilian ethanol.
Because of EISA, different types of ethanol can command different prices.
Producer prices for advanced ethanol can exceed prices for conventional ethanol to generate the supplies required. Cellulosic biofuel prices are effectively capped when EISA targets are not met.
When the RFS2 is binding, Renewable Identification Numbers (RINs) take on value. RINs reflect the price biofuel blenders would be willing to pay not to use the required quantities of biofuel.
EthanolEthanol production dips in 2011/12 as credit expires
0
5
10
15
20
25
04/05 06/07 08/09 10/11 12/13 14/15 16/17 18/19 20/21
September-August marketing yearB
illio
n ga
llons
Corn-based production Other ethanol production Imports
E-15 allows more ethanol use in conventional cars
0
5
10
15
20
25
04/05 06/07 08/09 10/11 12/13 14/15 16/17 18/19 20/21
September-August marketing year
Bill
ion
gallo
ns
In 15% and lower blends In higher level blends Exports
Because of EISA, prices differ across ethanol types
0.00
0.50
1.00
1.50
2.00
2.50
3.00
3.50
4.00
04/05 06/07 08/09 10/11 12/13 14/15 16/17 18/19 20/21
Rack prices, September-August marketing year
Dol
lars
per
gal
lon
Conventional ethanol Cellulosic Other advanced
FAPRI-MU Report #02-11 - 2011 US Baseline Briefing Book - Page 38

Ethanol supply and use
September‐August year 10/11 11/12 12/13 13/14 14/15 15/16 16/17 17/18 18/19 19/20 20/21
Petroleum fuel prices (Dollars per barrel)
Petroleum, W. Texas interm. 86.40 92.97 96.76 99.92 102.41 105.40 109.45 111.15 110.29 109.58 108.59
Petroleum, refiners acquis. 82.05 86.97 90.44 93.35 95.56 98.26 102.09 103.62 102.71 102.02 101.05
(Dollars per gallon)
Unl. gasoline, FOB Omaha 2.43 2.56 2.64 2.71 2.77 2.84 2.92 2.96 2.95 2.93 2.93
Unleaded gasoline, retail 3.06 3.19 3.28 3.36 3.43 3.50 3.60 3.64 3.64 3.62 3.63
Ethanol supply and use (Million gallons)
Production 13,605 12,964 13,572 14,319 14,967 15,663 16,322 16,973 17,410 17,930 18,472
From corn 13,387 12,723 13,293 13,975 14,504 15,004 15,386 15,694 15,747 15,865 15,994
Other conventional 216 217 221 231 247 259 260 255 247 242 237
Cellulosic 2 24 58 112 215 401 676 1,025 1,416 1,824 2,241
Imports (ethyl alcohol) 134 149 342 685 1,176 1,520 1,875 2,296 2,794 2,958 2,981
Domestic disappearance 13,294 12,696 13,448 14,579 15,731 16,755 17,717 18,700 19,537 20,193 20,799
In 15% and lower blends 13,131 12,498 13,177 14,149 15,136 16,028 16,670 17,294 17,774 18,134 18,569
In higher level blends 163 198 272 430 596 726 1,047 1,406 1,763 2,060 2,230
Exports (ethyl alcohol) 403 437 431 387 381 392 443 532 640 665 624
Ending stocks 771 751 786 824 854 890 928 965 992 1,021 1,051
Ethanol prices (Dollars per gallon)
Conventional rack, Omaha 2.23 2.08 2.04 2.08 2.15 2.16 2.13 2.09 2.05 2.04 2.02
AMS spot plant price, Iowa 2.02 1.88 1.85 1.88 1.94 1.95 1.93 1.89 1.85 1.84 1.82
Cellulosic rack n.a. 3.62 3.12 2.89 2.98 3.02 3.09 3.16 3.23 3.32 3.32
Other advanced rack 2.24 2.08 2.10 2.18 2.27 2.32 2.38 2.43 2.47 2.47 2.45
Effective retail 2.39 2.44 2.46 2.46 2.50 2.52 2.52 2.51 2.49 2.49 2.49
Ethanol/gasoline retail 78% 77% 75% 73% 73% 72% 70% 69% 68% 69% 69%
RIN values
Conventional ethanol 0.02 0.12 0.22 0.27 0.31 0.31 0.29 0.26 0.25 0.25 0.22
Advanced ethanol 0.02 0.12 0.28 0.37 0.43 0.46 0.53 0.61 0.68 0.68 0.65
Cellulosic ethanol 0.65 0.79 0.96 1.08 1.14 1.16 1.24 1.33 1.43 1.53 1.52
Biofuel policies
Calendar year 2010 2011 2012 2013 2014 2015 2016 2017 2018 2019 2020
(Million gallons)
Renewable Fuel Standard 12,950 13,950 15,200 16,550 18,150 20,500 22,250 24,000 26,000 28,000 30,000
Advanced biofuels 950 1,350 2,000 2,750 3,750 5,500 7,250 9,000 11,000 13,000 15,000
Cellulosic ethanol 100 250 500 1,000 1,750 3,000 4,250 5,500 7,000 8,500 10,500
Biodiesel 650 800 1,000 1,000 1,000 1,000 1,000 1,000 1,000 1,000 1,000
Tax credits and tariffs (Dollars per gallon)
Conventional ethanol credit 0.45 0.45 0.00 0.00 0.00 0.00 0.00 0.00 0.00 0.00 0.00
Biodiesel credit 1.00 1.00 0.00 0.00 0.00 0.00 0.00 0.00 0.00 0.00 0.00
Ethanol specific tariff 0.54 0.54 0.00 0.00 0.00 0.00 0.00 0.00 0.00 0.00 0.00
Cellulosic producers credit 1.01 1.01 1.01 0.00 0.00 0.00 0.00 0.00 0.00 0.00 0.00
(Percent)
Ethanol ad‐valorem tariff 2.5 2.5 2.5 2.5 2.5 2.5 2.5 2.5 2.5 2.5 2.5
FAPRI-MU Report #02-11 - 2011 US Baseline Briefing Book - Page 39

The suspension of the biodiesel credit, high vegetable oil prices and reduced export demand cut biodiesel production in 2009/10.
Projected production increases to satisfy the biodiesel mandate under RFS2, which is why production does not decline when the $1 per gallon credit is assumed to expire on schedule at the end of 2011.
Corn oil extracted from distillers grains at dry mill ethanol plants increases its share of biodiesel production.
US biodiesel exports have declined in response to EU tariffs and new sustainability rules.
US biodiesel imports could increase in response to strong domestic prices.
Domestic use generally expands with the biodiesel RFS2.
Under some market conditions, biodiesel is consumed in excess of the biodiesel mandate to help satisfy the advanced biofuel mandate.
The baseline assumes that the EPA will continue to waive the cellulosic biofuel mandate because of insufficient capacity to reach the EISA targets.
There is great uncertainty regarding the future of cellulosic biofuels, including not just ethanol but also biodiesel and other “drop-in” fuels.
The projections are highly dependent on assumptions made about the cost structures for both feedstock and biofuel production.
Biodiesel and cellulosic ethanolBiodiesel production expands in response to RFS2
0.0
0.2
0.4
0.6
0.8
1.0
1.2
04/05 06/07 08/09 10/11 12/13 14/15 16/17 18/19 20/21
October-September marketing year B
illio
n ga
llons
From soybean oil From corn oil From other fats and oils
Domestic biodiesel use expands, net exports fall
-0.2
0.0
0.2
0.4
0.6
0.8
1.0
1.2
04/05 06/07 08/09 10/11 12/13 14/15 16/17 18/19 20/21
October-September marketing year
Bill
ion
gallo
ns
Domestic use Net exports
Cellulosic ethanol supplies increase
0.0
0.5
1.0
1.5
2.0
2.5
10/11 12/13 14/15 16/17 18/19 20/21
Marketing year
Bill
ion
gallo
ns
Corn stover Switchgrass All other
FAPRI-MU Report #02-11 - 2011 US Baseline Briefing Book - Page 40

FAPRI-MU Report #02-11 - 2011 US Baseline Briefing Book - Page 41
Biodiesel sector
October‐September year 10/11 11/12 12/13 13/14 14/15 15/16 16/17 17/18 18/19 19/20 20/21
Biodiesel supply and use (Million gallons)
Production 820 968 962 956 962 962 974 979 972 987 976
From soybean oil 380 444 427 417 418 409 409 403 390 394 379
From corn oil 28 41 59 79 98 117 135 153 169 185 200
From other fats and oils 413 483 475 459 446 436 430 423 413 408 397
Net imports 46 19 40 51 50 52 53 54 57 59 60
Domestic disappearance 866 987 1,002 1,007 1,012 1,014 1,026 1,033 1,029 1,047 1,035
Fuel prices and tax credit (Dollars per gallon)
Biodiesel, rack 4.66 5.06 4.88 4.79 4.72 4.74 4.77 4.80 4.82 4.83 4.82
#2 Diesel, refiner sales 2.35 2.51 2.58 2.65 2.72 2.79 2.87 2.91 2.90 2.88 2.88
#2 Diesel, retail 3.15 3.32 3.39 3.46 3.52 3.59 3.68 3.73 3.72 3.70 3.70
Biodiesel tax credit 1.00 0.25 0.00 0.00 0.00 0.00 0.00 0.00 0.00 0.00 0.00
RIN values
Per RIN gallon 0.84 1.53 1.53 1.43 1.34 1.31 1.28 1.27 1.28 1.32 1.30
Per phyiscal gallon 1.25 2.30 2.30 2.15 2.01 1.97 1.92 1.91 1.92 1.98 1.94
Costs and returns
Biodiesel value 4.66 5.06 4.88 4.79 4.72 4.74 4.77 4.80 4.82 4.83 4.82
Glycerin value 0.03 0.03 0.03 0.03 0.03 0.03 0.03 0.03 0.03 0.03 0.03
Soyoil cost ‐3.88 ‐4.22 ‐4.05 ‐3.98 ‐3.90 ‐3.93 ‐3.95 ‐3.97 ‐3.98 ‐3.98 ‐3.96
Other operating costs ‐0.55 ‐0.56 ‐0.56 ‐0.57 ‐0.57 ‐0.58 ‐0.58 ‐0.59 ‐0.59 ‐0.60 ‐0.60
Net operating return 0.26 0.31 0.29 0.28 0.28 0.27 0.27 0.27 0.27 0.29 0.29
Cellulosic biofuel feedstocks
Marketing year 10/11 11/12 12/13 13/14 14/15 15/16 16/17 17/18 18/19 19/20 20/21
(Million gallons)
Cellulosic ethanol product. 2 24 58 112 215 401 676 1,025 1,416 1,824 2,241
From corn stover 1 8 12 15 13 14 15 19 36 73 143
From switchgrass 0 0 0 14 68 193 399 666 951 1,221 1,464
All other 1 16 45 84 134 194 262 340 429 530 634
Corn stover (Tons per acre)
Available stover per acre 4.47 4.65 4.62 4.77 4.75 4.78 4.90 5.03 5.07 5.00 5.08
Proportion harvested 0.0% 0.0% 0.0% 0.1% 0.0% 0.0% 0.0% 0.1% 0.1% 0.2% 0.5%
(Million tons)
Production 0.01 0.01 0.16 0.21 0.17 0.18 0.19 0.25 0.50 1.02 1.99
Switchgrass (Million acres)
Area harvested 0.00 0.00 0.00 0.11 0.42 0.92 1.56 2.21 2.73 3.15 3.54
(Tons per acre)
Yield per harvested acre n.a. n.a. n.a. 1.80 2.29 2.88 3.45 3.99 4.54 4.96 5.22
(Million tons)
Production 0.00 0.00 0.00 0.20 0.96 2.66 5.38 8.82 12.38 15.64 18.50

Beef production will be at its lowest level this year since 2005.
Beef exports are nearly 1.5 billion pounds higher than five years ago. The combination of more international demand for US beef and less beef production has curtailed the amount of beef available for domestic consumers.
Recent beef cow herd data suggests that it will likely take quite a few years for the production declines to come to an end.
Cow-calf net returns increased to the long-run average level in 2010, after posting their worst level since 1996 in 2009.
While fed steer prices will experience strong growth this year, expensive corn will limit the amount that feedlots are willing to pay for feeder animals, holding 2011 returns to a level similar to last year.
The profitability outlook is bright beginning in 2012, as economic recovery continues to propel beef demand.
Beef exports during the last quarter of 2010 were at their highest fourth quarter level since 1999.
Shipments to Japan and Korea grew by 51 percent in 2010. However, this is only 42 percent of the pre-BSE export level of 2003.
As beef prices grow in the next few years, beef export growth will likely slow. Domestic consumers will be bidding against those in other countries for limited supplies of US beef.
Beef
Cow-calf producers will see strong profitability soon
-80
-40
0
40
80
120
160
2004 2006 2008 2010 2012 2014 2016 2018 2020
Dol
lars
per
cow
Cow-calf net returns Average from 1990-2010
Beef production will be limited for many years
90
92
94
96
98
100
102
104
2004 2006 2008 2010 2012 2014 2016 2018 2020In
dex,
200
0-03
ave
rage
= 1
00
Beef exports continue to gain momentum
0.0
0.5
1.0
1.5
2.0
2.5
3.0
2004 2006 2008 2010 2012 2014 2016 2018 2020
Bill
ion
poun
ds
Japan + Korea Mexico + Canada All other Total
FAPRI-MU Report #02-11 - 2011 US Baseline Briefing Book - Page 42

Cattle sector
Calendar year 2010 2011 2012 2013 2014 2015 2016 2017 2018 2019 2020
(Million head)
Beef cows (Jan. 1) 31.4 30.9 30.5 30.3 30.6 31.0 31.5 31.8 31.9 32.0 31.9
Dairy cows (Jan. 1) 9.1 9.1 9.1 9.1 9.1 9.0 9.0 9.0 9.0 9.0 9.0
Cattle and calves (Jan. 1) 93.9 92.6 91.6 91.2 91.2 91.6 92.0 92.3 92.6 92.6 92.4
Calf crop 35.7 35.2 34.9 35.0 35.4 35.9 36.3 36.6 36.7 36.6 36.6
Calf death loss 2.3 2.2 2.2 2.2 2.2 2.2 2.3 2.3 2.3 2.3 2.2
Calf slaughter 0.9 0.9 0.9 0.9 0.9 0.9 0.9 0.9 0.9 0.9 0.9
Beef cow slaughter 3.7 3.5 3.1 2.9 2.8 3.1 3.2 3.4 3.4 3.5 3.5
Dairy cow slaughter 2.9 2.7 2.7 2.7 2.7 2.7 2.7 2.7 2.7 2.7 2.7
Bull slaughter 0.6 0.6 0.6 0.6 0.6 0.6 0.6 0.6 0.6 0.6 0.6
Steer and heifer slaughter 27.2 26.6 26.2 26.1 26.1 26.5 26.7 26.9 27.1 27.3 27.2
Total slaughter 35.3 34.4 33.6 33.2 33.3 33.8 34.2 34.5 34.7 35.0 34.9
Cattle imports 2.3 2.3 2.3 2.4 2.4 2.4 2.4 2.4 2.4 2.4 2.4
Cattle exports 0.1 0.1 0.1 0.1 0.1 0.1 0.1 0.1 0.1 0.2 0.2
Cattle death loss 2.3 2.3 2.3 2.3 2.3 2.3 2.3 2.3 2.3 2.3 2.3
Residual 0.7 0.5 0.5 0.5 0.5 0.5 0.5 0.5 0.5 0.5 0.5
Cattle and calves (Dec. 31) 92.6 91.6 91.2 91.2 91.6 92.0 92.3 92.6 92.6 92.4 92.2
Cattle on feed (Jan. 1) 13.6 14.0 13.8 13.9 14.1 14.3 14.3 14.4 14.4 14.3 14.2
Supply (Million pounds)
Beginning stocks 565 575 547 538 539 545 562 572 581 590 599
Imports 2,331 2,411 2,660 2,834 2,940 2,912 2,889 2,869 2,859 2,827 2,831
Production 26,413 25,727 25,286 25,125 25,224 25,736 26,124 26,470 26,798 27,096 27,159
Total 29,309 28,713 28,493 28,496 28,703 29,193 29,574 29,911 30,238 30,512 30,590
Disappearance
Domestic use 26,431 25,819 25,544 25,455 25,569 26,013 26,292 26,549 26,830 27,136 27,223
Exports 2,303 2,346 2,412 2,502 2,589 2,618 2,711 2,781 2,818 2,777 2,766
Total 28,734 28,165 27,955 27,957 28,158 28,631 29,002 29,330 29,648 29,913 29,989
Ending stocks 575 547 538 539 545 562 572 581 590 599 601
Per capita consumption (Pounds)
Carcass weight 85.1 82.4 80.7 79.7 79.2 79.9 79.9 80.0 80.0 80.2 79.7
Retail weight 59.6 57.7 56.5 55.8 55.5 55.9 56.0 56.0 56.0 56.1 55.8
Change ‐2.5% ‐3.3% ‐2.0% ‐1.3% ‐0.5% 0.8% 0.1% 0.0% 0.1% 0.2% ‐0.6%
Prices
Total All Grades, (Dollars per hundredweight)
5‐Area Direct Steers 95.38 105.67 109.93 110.06 110.54 108.40 106.94 105.68 105.04 104.57 105.73
600 ‐ 650 #, Oklahoma City
Feeder steers 115.11 119.18 130.36 133.37 135.24 131.90 129.19 127.03 125.96 125.35 127.62
Utility cows, Sioux Falls 56.89 64.88 68.16 69.56 70.64 67.75 64.85 62.49 61.59 60.67 61.16
Boxed beef cutout 156.91 172.76 180.30 180.55 181.08 178.48 177.38 176.37 176.11 175.69 178.08
(Dollars per pound)
Beef retail 4.39 4.71 4.91 5.02 5.08 5.05 5.04 5.03 5.04 5.03 5.10
Change 3.2% 7.3% 4.1% 2.2% 1.2% ‐0.5% ‐0.1% ‐0.2% 0.0% ‐0.1% 1.3%
Cow‐calf returns (Dollars per cow)
Receipts 596.25 628.48 680.66 696.11 706.34 688.64 673.57 661.49 655.84 652.11 662.27
Feed expenses 146.97 157.55 153.49 149.87 149.90 151.92 154.24 156.64 160.00 162.20 163.09
Non‐feed expenses 413.30 431.41 443.43 459.15 466.90 479.68 487.39 494.49 502.64 510.00 517.69
Net returns 35.99 39.52 83.74 87.08 89.54 57.03 31.94 10.36 ‐6.79 ‐20.09 ‐18.50
FAPRI-MU Report #02-11 - 2011 US Baseline Briefing Book - Page 43

The highest annual average hog price since 1996 led to a moderately profitable 2010 for farrow-finish hog producers.
Even though hog prices are expected to continue to grow this year, growth in feed expenses will drop returns back towards the breakeven level.
2012 and 2013 are expected to be profitable years for the hog industry, as reduced supply of all meats allows hog prices to remain relatively strong.
Pork production declined for the second consecutive year in 2010, as the dreadful financial situation in 2008 and 2009 continued to result in sow herd liquidation.
Sow inventories have now been below year-ago levels for eleven consecutive quarters. However, sow inventory levels should begin to stabilize this year.
The productivity of the US sow herd will continue to grow strongly. Though 2010 ended with nearly eight percent fewer sows than ten years ago, 2010 pork production was nearly 19 percent greater than in 2000.
Despite strong production growth, the amount of pork available for the 2010 domestic market was only 2.5 percent greater than in 2000. When accounting for population growth, pork per person fell 7 percent during the past decade.
Though pork export growth is not expected to repeat the 172 percent increase from 2003-08, growth will be positive in the next decade.
The FMD outbreak in South Korea will be a positive factor for US pork exports.
PorkFarrow-finish returns struggle with feed costs
0
10
20
30
40
50
60
70
2004 2006 2008 2010 2012 2014 2016 2018 2020D
olla
rs p
er c
wt
Feed costs Non-feed costs Receipts
Hog slaughter continues to grow with fewer sows
90
95
100
105
110
115
120
125
130
2004 2006 2008 2010 2012 2014 2016 2018 2020
Inde
x, 2
000-
03 a
vera
ge =
100
Average sows Barrow and gilt slaughter
Most growth in pork production serves export markets
95
100
105
110
115
120
125
130
135
140
2004 2006 2008 2010 2012 2014 2016 2018 2020
Inde
x, 2
000-
03 a
vera
ge =
100
Pork production Pork domestic consumption
FAPRI-MU Report #02-11 - 2011 US Baseline Briefing Book - Page 44

Swine sector
Calendar year 2010 2011 2012 2013 2014 2015 2016 2017 2018 2019 2020
(Million head)
Breeding herd (Dec. 1*) 5.85 5.78 5.79 5.83 5.90 5.88 5.82 5.76 5.72 5.74 5.77
Gilts added 2.98 3.09 3.13 3.25 3.22 3.12 3.04 3.02 3.07 3.11 3.12
Sow slaughter 2.99 3.03 3.03 3.13 3.17 3.12 3.04 3.00 2.99 3.03 3.05
Sows farrowed 11.56 11.57 11.71 11.89 12.03 12.03 11.98 11.96 12.02 12.15 12.27
Pigs per litter (head) 9.78 9.83 9.90 9.97 10.02 10.08 10.14 10.20 10.26 10.31 10.37
Market hogs (Dec. 1*) 59.0 58.5 58.8 59.7 60.6 61.3 61.9 62.1 62.4 63.1 63.7
Pig crop 113.0 113.8 115.9 118.5 120.5 121.3 121.5 122.0 123.4 125.3 127.3
Barrow and gilt slaughter 106.9 107.0 108.2 110.5 112.7 113.5 114.2 114.5 115.3 117.2 119.0
Hog imports 5.8 6.0 5.9 5.9 5.9 6.1 6.1 6.1 6.2 6.2 6.2
Hog exports 0.0 0.0 0.0 0.0 0.0 0.0 0.0 0.0 0.0 0.0 0.0
Death loss/residual 12.4 12.5 12.7 12.9 13.1 13.2 13.3 13.3 13.5 13.6 13.8
Market hogs (Nov.30) 58.5 58.8 59.7 60.6 61.3 61.9 62.1 62.4 63.1 63.7 64.3
Supply (Million pounds)
Beginning stocks 525 535 485 491 514 532 538 540 539 543 558
Imports 880 900 937 929 918 926 944 967 980 967 959
Production 22,466 22,562 22,942 23,532 24,058 24,322 24,545 24,716 24,983 25,472 25,940
Total 23,871 23,997 24,364 24,952 25,490 25,780 26,027 26,223 26,503 26,982 27,457
Disappearance
Domestic use 19,106 18,908 19,018 19,364 19,647 19,733 19,795 19,821 19,944 20,226 20,518
Exports 4,230 4,603 4,856 5,074 5,311 5,508 5,692 5,863 6,016 6,198 6,368
Total 23,336 23,512 23,874 24,438 24,958 25,242 25,487 25,683 25,960 26,425 26,885
Ending stocks 535 485 491 514 532 538 540 539 543 558 572
Per capita consumption (Pounds)
Carcass weight 61.5 60.3 60.1 60.6 60.9 60.6 60.2 59.7 59.5 59.8 60.1
Retail weight 47.8 46.8 46.6 47.0 47.3 47.0 46.7 46.3 46.2 46.4 46.6
Change ‐4.8% ‐2.0% ‐0.4% 0.8% 0.5% ‐0.5% ‐0.6% ‐0.8% ‐0.3% 0.5% 0.5%
Prices
Natl. base 51‐52% lean equiv. (Dollars per hundredweight)
Barrows & gilts 55.06 61.77 62.49 58.71 55.78 56.39 58.97 61.17 62.20 59.93 58.68
IA‐S. Minn. #1‐2, 300‐400 #
Sows 51.85 55.56 56.41 51.46 48.09 48.76 50.91 52.85 53.77 52.35 51.74
Pork cutout value 81.25 88.92 90.59 86.24 82.92 82.55 84.37 87.30 90.15 89.21 89.14
(Dollars per pound)
Pork retail 3.11 3.45 3.50 3.46 3.40 3.42 3.51 3.63 3.73 3.71 3.68
Change 6.6% 10.7% 1.7% ‐1.3% ‐1.7% 0.6% 2.7% 3.3% 2.7% ‐0.5% ‐0.6%
Farrow‐finish returns (Dollars per hundredweight)
Receipts 56.87 63.43 64.29 60.38 57.43 58.16 60.84 63.15 64.29 62.18 61.08
Feed expenses 32.02 40.47 37.73 35.00 35.03 35.11 35.16 35.50 35.93 35.81 35.84
Non‐feed expenses 21.24 21.68 21.74 22.16 22.32 22.80 23.11 23.37 23.67 23.93 24.17
Net returns 3.60 1.29 4.82 3.22 0.08 0.24 2.57 4.28 4.69 2.44 1.08
* Preceding year
FAPRI-MU Report #02-11 - 2011 US Baseline Briefing Book - Page 45

The amount of chicken available for the domestic market grew by nearly five percent in 2010.
Despite this growth, per capita supplies were still at a lower level than in 2004.
The chicken industry will have an opportunity to gain market share due to tight beef and pork supplies during the next few years, but high feed costs will limit the ability to expand.
Wholesale chicken prices increased by 7 percent in 2010, a rate of growth well below that of most other meat commodities.
Just as chicken prices did not suffer as much as other meats due to the economic weakness in 2009, they are not expected to benefit as much from economic recovery as higher cost beef and pork.
Wholesale turkey prices in 2010 were at their third largest premium to chicken prices since 1986. Prices are expected to remain strong since producers have kept flock expansion in check to this point.
Chicken production growth in the next decade will average just over 1.6 percent. It will be difficult to sharply increase exports due to strong competition from Brazil and a shrinking Russian TRQ.
The turkey industry is not expected to return to its 2008 production level anytime soon.
The salmonella outbreak which affected the egg industry last summer appears to have caused no long term damage to egg demand and prices.
PoultryChicken domestic consumption will slowly recover
90
92
94
96
98
100
102
104
2004 2006 2008 2010 2012 2014 2016 2018 2020P
ound
s pe
r pe
rson
Wholesale poultry prices continue to trend higher
60
70
80
90
100
110
2004 2006 2008 2010 2012 2014 2016 2018 2020
Cen
ts p
er p
ound
Chicken Turkey
Poultry production growth slowed through 2012
90
100
110
120
130
140
2004 2006 2008 2010 2012 2014 2016 2018 2020
Inde
x, 2
000-
03 a
vera
ge =
100
Chicken Turkey Egg
FAPRI-MU Report #02-11 - 2011 US Baseline Briefing Book - Page 46

Poultry supply and use
Calendar year 2010 2011 2012 2013 2014 2015 2016 2017 2018 2019 2020
Broiler (Million pounds)
Production 36,457 36,831 37,517 38,526 39,321 39,997 40,581 41,155 41,708 42,292 42,935
Domestic use 29,899 30,402 30,882 31,724 32,399 32,938 33,397 33,857 34,301 34,762 35,281
Exports 6,519 6,592 6,724 6,874 7,006 7,151 7,283 7,402 7,514 7,639 7,764
Ending stocks 750 682 692 722 743 759 771 781 791 802 815
Turkey
Production 5,564 5,559 5,585 5,673 5,773 5,864 5,938 5,989 6,022 6,047 6,067
Domestic use 5,090 5,006 5,022 5,107 5,208 5,290 5,355 5,398 5,423 5,439 5,451
Exports 554 550 559 568 579 589 599 609 620 630 640
Ending stocks 200 219 240 255 261 266 271 274 276 277 278
Eggs (Million dozens)
Production 7,593 7,587 7,641 7,710 7,775 7,840 7,906 7,966 8,024 8,087 8,153
Domestic use 6,362 6,369 6,412 6,464 6,516 6,571 6,630 6,684 6,735 6,791 6,850
Hatching egg 982 984 990 1,005 1,013 1,019 1,023 1,026 1,029 1,033 1,037
Exports 262 247 251 254 258 262 266 270 274 277 280
Ending stocks 18 18 18 18 18 18 18 18 18 18 18
Prices (Cents per pound)
12 city wholesale broiler 82.92 85.25 89.85 90.30 91.24 92.49 93.81 95.49 96.75 97.86 99.07
Broiler retail 175.28 184.43 194.11 199.71 202.02 205.49 209.00 213.02 216.89 220.07 223.38
East. region wholesale turkey 94.17 97.57 100.83 101.93 102.86 103.85 104.11 104.81 105.56 106.05 106.90
Turkey retail 147.67 159.33 163.41 167.12 169.31 171.90 173.77 175.26 177.27 178.81 180.47
(Cents per dozen)
NY grade A large egg 106.24 117.76 121.85 121.44 121.85 122.98 124.03 125.26 126.65 127.71 128.77
Shell egg retail 165.97 182.52 189.69 191.91 194.13 197.30 200.47 203.54 206.90 209.72 212.39
Per capita consumption (Pounds)
Broiler 96.3 97.0 97.6 99.3 100.4 101.1 101.5 102.0 102.3 102.7 103.3
Turkey 16.4 16.0 15.9 16.0 16.1 16.2 16.3 16.3 16.2 16.1 16.0
(Eggs)
Eggs 245.9 243.8 243.1 242.7 242.3 242.1 241.9 241.5 241.1 240.8 240.6
Feed‐price ratios (Ratio)
Broiler 4.5 4.1 4.7 4.8 4.8 4.8 4.8 4.9 4.9 4.9 5.0 Turkey 6.1 5.4 5.9 6.2 6.2 6.2 6.1 6.0 6.0 6.0 6.0 Eggs 7.5 7.3 8.1 8.2 8.2 8.1 8.1 8.1 8.2 8.2 8.2
FAPRI-MU Report #02-11 - 2011 US Baseline Briefing Book - Page 47

2010 farm-level milk prices recovered from the extremely low levels experienced in 2009.
All milk prices are expected to increase in 2011 to near $18 per cwt. The increase in 2011 prices is driven in part by international demand.
In any given year there is a large range in the price outcomes suggesting more volatility is expected in the years ahead.
The recovery of world dairy prices in 2010 allowed US milk and dairy prices to rise.
Prices for all world dairy products remain well above the low levels experienced in 2009.
The US is expected to be a larger player in world markets in the baseline due to growing US commercial dairy product exports.
The level of Milk Income Loss Contract (MILC) payments increased substantially in 2009 due to low milk prices and high feed costs.
MILC payments are on average at minimal levels in the baseline. However, some of the 500 outcomes trigger large payments.
Dairy pricesAll milk price continues to rise in 2011
8
10
12
14
16
18
20
22
2004 2006 2008 2010 2012 2014 2016 2018 2020
Dol
lars
per
cw
t
World dairy prices support US dairy exports
0.60
0.80
1.00
1.20
1.40
1.60
1.80
2.00
2.20
2004 2006 2008 2010 2012 2014 2016 2018 2020
Dol
lars
per
pou
nd
Cheese Butter Nonfat dry milk
MILC payments expected to be small
0.00
0.20
0.40
0.60
0.80
1.00
1.20
2004 2006 2008 2010 2012 2014 2016 2018 2020
Dol
lars
per
cw
t
FAPRI-MU Report #02-11 - 2011 US Baseline Briefing Book - Page 48

Dairy sector
Calendar year 2010 2011 2012 2013 2014 2015 2016 2017 2018 2019 2020
US milk supply
Dairy cows (thou. head) 9,113 9,106 9,096 9,073 9,051 9,032 9,011 8,995 8,981 8,970 8,965
Milk yield (lbs. per cow) 21,148 21,471 21,791 22,087 22,345 22,615 22,885 23,129 23,378 23,614 23,857
Milk production (bil. lbs.) 192.7 195.5 198.2 200.4 202.2 204.3 206.2 208.0 210.0 211.8 213.9
Min. FMMO class prices
Class I mover 15.35 17.39 17.86 17.93 18.03 18.25 18.50 18.63 18.89 19.09 19.28
Class II 16.02 16.82 17.09 17.21 17.32 17.45 17.71 17.85 18.01 18.19 18.26
Class III 14.41 15.69 16.31 16.37 16.47 16.68 16.95 17.11 17.29 17.48 17.66
Class IV 15.09 16.12 16.39 16.51 16.62 16.75 17.01 17.15 17.31 17.49 17.56
All milk price 16.31 17.79 18.27 18.35 18.45 18.63 18.89 19.03 19.21 19.40 19.54
MILC payment rate 0.15 0.06 0.08 0.01 0.01 0.00 0.00 0.00 0.00 0.00 0.00
MILC trigger 18.40 18.49 17.06 17.04 17.04 17.04 17.07 17.10 17.10 17.11 17.08
Wholesale prices (Dollars per pound)
Butter, CME 1.73 1.81 1.80 1.74 1.72 1.72 1.72 1.71 1.70 1.71 1.70
Cheese, Amer., 40#, CME 1.50 1.62 1.68 1.68 1.70 1.72 1.74 1.76 1.77 1.79 1.81
Nonfat dry milk, AA 1.25 1.33 1.37 1.41 1.43 1.44 1.48 1.50 1.52 1.54 1.55
Evaporated milk 1.72 1.77 1.78 1.79 1.81 1.82 1.83 1.84 1.86 1.86 1.87
Dairy product production (Million pounds)
American cheese 4,289 4,427 4,558 4,633 4,694 4,757 4,823 4,887 4,952 5,013 5,081
Other cheese 6,179 6,313 6,405 6,527 6,625 6,735 6,833 6,931 7,035 7,135 7,248
Butter 1,562 1,576 1,596 1,613 1,622 1,633 1,643 1,652 1,663 1,671 1,680
Nonfat dry milk 1,750 1,811 1,860 1,885 1,885 1,894 1,904 1,912 1,918 1,917 1,925
(Dollars per hundredweight)
FAPRI-MU Report #02-11 - 2011 US Baseline Briefing Book - Page 49

The cost of producing milk has increased rapidly due to high costs for feed and energy-related inputs.
Low milk prices coupled with historically high production costs resulted in the dairy industry experiencing one of the worst years on record in 2009.
Milk production costs have declined from their 2008 peak. However, they remain well above the historical average.
Dairy cow inventories declined substantially in 2009 as a result of the negative returns faced by the industry. Further contraction is expected to continue as returns remain historically low.
Milk yield growth accelerated in 2010 due to the heavy culling of lower-producing dairy cows that occurred in 2009.
New technologies such as sexed semen could accelerate the growth in milk yields in the future.
Milk production grew by 3.4 billion pounds in 2010.
Milk production is projected to grow by 1.0 percent annually on average.
Higher feed and transportation costs appear to be pushing regional milk production closer to feed and other input sources.
Milk productionMilk returns remain historically low
0
5
10
15
20
25
2004 2006 2008 2010 2012 2014 2016 2018 2020D
olla
rs p
er c
wt
Feed costs Non-feed costs Receipts
Modest dairy cow herd contraction continues
-2
-1
0
1
2
3
4
2004 2006 2008 2010 2012 2014 2016 2018 2020
Per
cent
cha
nge
Cows Milk production per cow
Milk production grows as dairy exports expand
160
170
180
190
200
210
220
2004 2006 2008 2010 2012 2014 2016 2018 2020
Bill
ion
poun
ds
FAPRI-MU Report #02-11 - 2011 US Baseline Briefing Book - Page 50

State level dairy cows
Calendar year 2010 2011 2012 2013 2014 2015 2016 2017 2018 2019 2020
(Thousand head)
Alabama 11 11 11 11 10 10 10 9 9 8 7
Alaska 1 1 1 1 1 1 1 1 1 1 1
Arizona 177 179 180 181 182 183 183 183 183 182 182
Arkansas 12 11 11 10 10 9 9 9 9 9 10
California 1,751 1,743 1,740 1,738 1,740 1,746 1,755 1,766 1,780 1,797 1,817
Colorado 119 118 117 117 116 116 116 115 115 115 114
Connecticut 19 19 19 19 19 19 19 19 19 19 19
Delaware 5 5 4 4 3 3 3 3 3 2 2
Florida 114 114 114 114 114 114 113 112 112 111 110
Georgia 78 78 78 79 79 79 79 79 79 79 78
Hawaii 2 2 2 3 3 3 3 3 3 3 3
Idaho 564 582 599 615 628 640 651 662 672 681 689
Illinois 100 99 98 97 96 95 94 94 93 92 91
Indiana 169 171 173 175 177 178 179 180 180 181 181
Iowa 209 205 202 198 195 192 189 186 184 181 179
Kansas 119 121 122 123 124 124 124 124 124 123 123
Kentucky 78 73 69 66 63 61 58 57 55 54 53
Louisiana 20 18 15 13 12 11 9 8 7 7 6
Maine 32 31 31 30 29 29 29 28 28 28 28
Maryland 54 53 52 50 49 47 46 45 45 44 44
Massachusetts 14 14 14 14 14 14 14 15 15 15 15
Michigan 358 363 367 369 372 374 375 377 378 379 380
Minnesota 470 471 470 467 463 458 453 447 441 434 428
Mississippi 17 16 16 15 14 14 13 13 13 12 12
Missouri 99 93 89 85 81 78 75 72 69 67 64
Montana 14 13 13 12 12 11 11 11 11 11 11
Nebraska 58 56 54 52 51 49 48 47 47 46 46
Nevada 28 28 28 28 29 29 29 29 29 29 29
New Hampshire 15 15 15 15 15 15 15 15 15 15 15
New Jersey 8 7 6 6 5 4 4 3 3 2 2
New Mexico 321 322 323 323 323 324 325 326 326 327 327
New York 611 607 603 598 593 589 583 578 573 568 564
North Carolina 44 43 42 41 40 38 36 35 33 31 29
North Dakota 21 19 18 17 16 15 14 13 13 12 12
Ohio 270 267 265 263 261 259 257 255 253 251 249
Oklahoma 56 54 52 50 49 48 46 45 44 43 43
Oregon 117 120 122 123 124 124 124 124 124 123 123
Pennsylvania 541 540 539 538 536 534 531 529 526 524 523
Rhode Island 1 1 1 1 1 1 1 1 1 1 1
South Carolina 16 15 15 14 13 13 12 12 12 11 11
South Dakota 92 91 89 88 87 86 85 84 84 83 82
Tennessee 52 49 46 43 40 37 35 32 30 27 25
Texas 413 409 405 402 398 396 393 391 389 387 386
Utah 85 86 86 86 86 85 85 85 85 85 85
Vermont 137 138 138 137 135 135 134 133 133 133 133
Virginia 95 95 95 95 94 94 94 93 93 92 92
Washington 251 255 258 260 262 263 264 266 267 268 268
West Virginia 10 9 9 8 8 7 7 7 7 7 7
Wisconsin 1,262 1,271 1,277 1,277 1,276 1,274 1,272 1,270 1,268 1,265 1,263
Wyoming 6 7 7 7 7 7 7 7 7 7 6
United States 9,113 9,106 9,096 9,073 9,051 9,032 9,011 8,995 8,981 8,970 8,965
FAPRI-MU Report #02-11 - 2011 US Baseline Briefing Book - Page 51

Fluid milk consumption continues on a long-term decline, albeit at a reasonably small rate.
Fluid milk consumption changes are having less effects on producer milk prices as a smaller percentage of milk production is used for fluid purposes.
Total cheese per capita consumption grew in 2010 by about 0.5 pounds, following two years of declining or flat consumption levels.
Per capita cheese consumption growth remains important to the overall dairy outlook.
Total per capita cheese consumption reaches 35.7 pounds by 2020, an increase of 1.6 pounds from the 2011 level.
Exports of dairy products fell in 2009 as many global economies contracted.
Economic recovery and strong international markets allowed US dairy exports to recover in 2010.
US exports of nonfat dry milk remain a large proportion of domestic production. Exports remain a smaller share of domestic production of cheese and butter.
Dairy products
Fluid milk consumption declines
190
192
194
196
198
200
202
204
206
2004 2006 2008 2010 2012 2014 2016 2018 2020
Pou
nds
per pe
rson
Cheese consumption growth slows
29
30
31
32
33
34
35
36
37
2004 2006 2008 2010 2012 2014 2016 2018 2020
Pou
nds
per pe
rson
Dairy product exports recovered in 2010
0
200
400
600
800
1,000
2004 2006 2008 2010 2012 2014 2016 2018 2020
Mill
ion
poun
ds
Butter Cheese Nonfat dry milk
FAPRI-MU Report #02-11 - 2011 US Baseline Briefing Book - Page 52

Dairy product supply and use
Calendar year 2010 2011 2012 2013 2014 2015 2016 2017 2018 2019 2020
Butter (Million pounds)
Production 1,562 1,576 1,596 1,613 1,622 1,633 1,643 1,652 1,663 1,671 1,680
Imports 31 31 31 31 31 31 31 31 31 34 37
Domestic use 1,526 1,492 1,502 1,514 1,520 1,528 1,538 1,542 1,547 1,554 1,559
Total foreign use 117 115 123 127 131 134 136 139 145 150 157
Ending stocks 82 82 84 86 88 90 91 92 94 94 95
CCC net rem. inc DEIP 0 2 1 1 1 1 ‐1 1 0 0 ‐1
American cheese
Production 4,289 4,427 4,558 4,633 4,694 4,757 4,823 4,887 4,952 5,013 5,081
Imports 29 29 29 29 29 29 29 29 29 29 29
Domestic use 4,137 4,301 4,426 4,495 4,550 4,607 4,664 4,720 4,777 4,832 4,891
Total foreign use 134 139 145 153 162 169 177 185 192 200 207
Ending stocks 632 649 664 678 690 701 712 723 734 745 757
CCC net rem. inc DEIP 0 0 ‐1 0 0 0 0 0 0 0 0
Other cheese
Production 6,179 6,313 6,405 6,527 6,625 6,735 6,833 6,931 7,035 7,135 7,248
Imports 270 283 286 288 291 294 297 300 303 306 309
Domestic use 6,236 6,386 6,544 6,599 6,693 6,801 6,900 6,996 7,100 7,200 7,312
Total foreign use 201 202 210 214 218 222 225 229 233 236 239
Ending stocks 394 401 338 341 346 352 358 363 369 375 381
Nonfat dry milk
Production 1,750 1,811 1,860 1,885 1,885 1,894 1,904 1,912 1,918 1,917 1,925
Imports 0 0 0 0 0 0 0 0 0 0 0
Domestic use 1,032 1,033 1,020 1,022 1,031 1,039 1,048 1,051 1,071 1,081 1,095
Total foreign use 775 773 839 861 854 854 855 860 847 836 830
Ending stocks 136 142 143 145 145 146 146 147 148 148 149
Government 0 3 1 1 0 0 0 0 0 0 0
Commercial 136 139 142 144 145 146 146 147 148 148 149
CCC net rem. inc DEIP 10 13 ‐2 0 0 0 0 0 0 0 0
Evap. and condensed milk
Production 686 681 681 680 681 683 684 685 685 686 688
Imports 11 11 11 11 11 11 11 11 11 11 11
Domestic use 627 626 625 624 624 626 627 628 629 629 631
Total foreign use 68 68 68 68 68 68 68 68 68 68 68
Ending stocks 47 47 47 47 47 48 48 49 49 49 50
Per capita consumption (Pounds)
Butter 4.9 4.8 4.7 4.7 4.7 4.7 4.7 4.6 4.6 4.6 4.6
Nonfat dry milk 3.3 3.3 3.2 3.2 3.2 3.2 3.2 3.2 3.2 3.2 3.2
Total cheese 33.4 34.1 34.7 34.7 34.8 35.0 35.2 35.3 35.4 35.6 35.7
American 13.3 13.7 14.0 14.1 14.1 14.1 14.2 14.2 14.3 14.3 14.3
Other 20.1 20.4 20.7 20.7 20.7 20.9 21.0 21.1 21.2 21.3 21.4
Total fluid milk 201.1 199.9 199.2 198.4 197.9 197.4 197.1 196.5 195.9 195.6 195.2
Ice cream 22.9 22.9 22.9 22.8 22.7 22.6 22.6 22.5 22.4 22.3 22.2
Retail prices (Dollars per unit)
Cheese, cheddar (pound) 4.71 4.90 5.03 5.16 5.27 5.40 5.52 5.62 5.72 5.81 5.89
Milk, whole (gallon) 3.26 3.72 3.79 3.80 3.81 3.84 3.88 3.90 3.93 3.96 3.98
Ice cream (half gallon) 4.46 4.54 4.48 4.49 4.54 4.60 4.67 4.72 4.78 4.84 4.89
FAPRI-MU Report #02-11 - 2011 US Baseline Briefing Book - Page 53

Growth in the CPI for food in 2010 was at its lowest level since 1962.
The situation is expected to be quite different in the next couple of years, as food prices rise due to increases in commodity and other costs, such as energy.
Growth in the CPI for food away from home is not as volatile as that for food at home. Both indices are expected to grow in the range of 2 to 3 percent annually after 2012.
There is a strong correlation between the cost of food and the cost of transforming raw farm products into consumer-ready foods, regardless of farm commodity price levels.
Commodity costs will take much of the blame for expected higher food prices in 2011 and 2012, but the farm value of food accounts for only about 15 to 20 percent of the finished product in the US.
The largest category of costs associated with final food prices is labor. Energy and packaging costs are also very important.
Food prices and expenditures
Higher meat prices will likely be the most notable factor for food price inflation during the next couple of years.
Since the percentage of corn and many other feed grains consumed directly is small, higher corn prices mostly affect consumers when it comes to buying meat and dairy products.
Longer term food inflation is expected to approximate that of the general consumer price index, leaving real expenditures for food roughly unchanged.
Most food cost is independent of commodity prices
0
1
2
3
4
5
6
7
8
2004 2006 2008 2010 2012 2014 2016 2018 2020
Per
cent
cha
nge
CPI for food Marketing cost index
Inflation for food at home near 5 percent in 2011
0
1
2
3
4
5
6
7
2004 2006 2008 2010 2012 2014 2016 2018 2020P
erce
nt c
hang
e
Food at home Food away from home
Consumer prices for meat move sharply higher
0
1
2
3
4
5
6
1991-95 1996-00 2001-05 2006-10 2011-12 2013-15 2016-20
Ave
rage
per
cent
cha
nge
CPI for food CPI for meat
FAPRI-MU Report #02-11 - 2011 US Baseline Briefing Book - Page 54

Consumer price indices for food
Calendar year 2010 2011 2012 2013 2014 2015 2016 2017 2018 2019 2020
(1982‐84=100)
Total food 219.6 228.9 236.0 240.7 245.6 251.3 257.5 263.7 269.8 275.8 281.7
(Inflation rate) 0.8% 4.2% 3.1% 2.0% 2.0% 2.3% 2.5% 2.4% 2.3% 2.2% 2.1%
Food at home 215.8 226.3 233.0 237.4 242.1 247.6 253.6 259.7 265.6 271.3 276.9
Cereal and bakery 250.4 264.6 271.1 275.4 281.0 287.6 294.7 301.8 308.9 315.8 322.2
Meat 207.7 220.6 229.0 233.8 238.2 242.8 248.2 253.9 259.4 264.4 269.7
Dairy 199.2 208.3 213.5 217.8 222.3 227.3 232.9 238.2 243.4 248.4 253.3
Fruit and vegetables 273.5 285.2 290.6 296.7 304.3 313.2 322.7 332.1 341.3 350.4 359.3
Other food at home 191.1 197.8 204.6 207.9 211.0 215.1 219.6 224.0 228.4 232.8 236.9
Sugar and sweets 201.2 211.0 216.2 217.2 219.6 224.3 228.8 232.8 236.7 240.5 244.1
Fats and oils 200.6 209.6 216.0 219.6 222.8 226.7 231.1 235.7 240.2 244.5 248.5
Other prepared items 204.6 209.6 218.1 222.2 225.6 229.8 234.6 239.7 244.8 249.8 254.6
Non‐alc . beverages 161.6 169.0 173.8 176.1 179.0 182.6 186.3 189.6 192.8 195.9 198.9
Food away from home 226.1 233.9 241.5 246.6 251.8 257.6 264.1 270.5 276.9 283.2 289.4
Consumer expenditures for food
Calendar year 2010 2011 2012 2013 2014 2015 2016 2017 2018 2019 2020
(Dollars per person)
Total food per capita 3,711 3,889 4,002 4,074 4,155 4,249 4,353 4,453 4,549 4,643 4,734
Food at home 1,918 2,004 2,057 2,090 2,127 2,170 2,219 2,267 2,314 2,360 2,404
Food away from home 1,793 1,885 1,945 1,984 2,028 2,079 2,134 2,186 2,235 2,283 2,331
Multiply by population for: (Billion dollars)
Total US food expenditures 1,152 1,219 1,266 1,302 1,341 1,384 1,432 1,479 1,525 1,571 1,617
FAPRI-MU Report #02-11 - 2011 US Baseline Briefing Book - Page 55

Government costs
Reduced dairy program spending contributed to a decline in net CCC outlays in FY 2010.
Projected spending averages about $9 billion per year.
The first payments under the ACRE program occurred in October 2010, which is part of FY 2011.
The last tobacco trust fund payments are made in FY 2014.
Mandatory government outlays under the crop insurance program, the supplemental revenue (SURE) program and certain conservation programs are not included in the CCC account.
Crop insurance outlays vary with the weather and crop prices.
Crop insurance outlays are reduced in FY 2012 by mandated changes regarding when producers pay premiums and providers are reimbursed for expenses.
CRP spending reflects changes in CRP area under contract and increased rental rates when new contracts are signed.
For other mandatory conservation programs, projected expenditures are based on preliminary estimates from the Congressional Budget Office (CBO).
Provisions of the 2008 farm bill lead to increased spending on the Conservation Stewardship Program, the Environmental Quality Incentive Program and other conservation programs.
Net CCC outlays total $93 billion over FY 2011-2020
0
5
10
15
20
25
2004 2006 2008 2010 2012 2014 2016 2018 2020
Fiscal yearB
illio
n do
llars
Grains, oilseeds & cotton Conservation All other
Crop insurance share of program spending increases
0
5
10
15
20
25
30
2004 2006 2008 2010 2012 2014 2016 2018 2020
Fiscal year
Bill
ion
dolla
rs
Net CCC Crop insurance Non-CCC conservation SURE
Conservation outlays rise due to farm bill changes
0
1
2
3
4
5
6
7
8
2004 2006 2008 2010 2012 2014 2016 2018 2020
Fiscal year
Bill
ion
dolla
rs
Conservation reserve Other mandatory conservation programs
FAPRI-MU Report #02-11 - 2011 US Baseline Briefing Book - Page 56
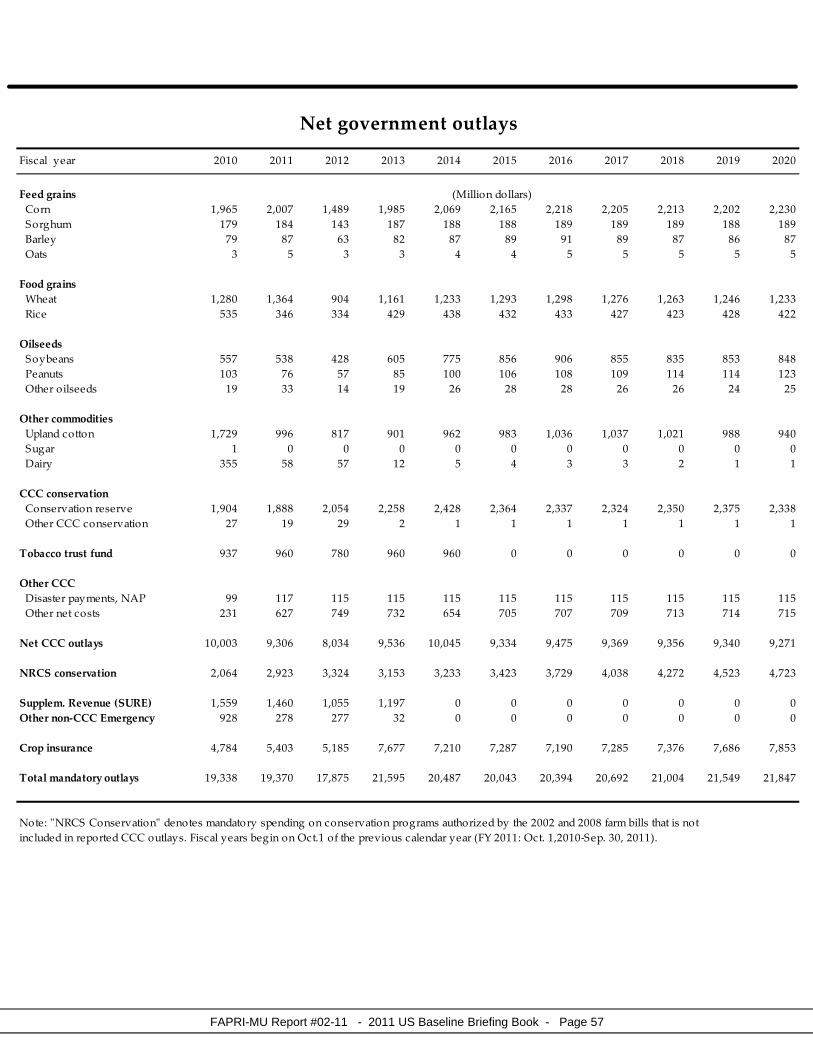
Net government outlays
Fiscal year 2010 2011 2012 2013 2014 2015 2016 2017 2018 2019 2020
Feed grains (Million dollars)
Corn 1,965 2,007 1,489 1,985 2,069 2,165 2,218 2,205 2,213 2,202 2,230
Sorghum 179 184 143 187 188 188 189 189 189 188 189
Barley 79 87 63 82 87 89 91 89 87 86 87
Oats 3 5 3 3 4 4 5 5 5 5 5
Food grains
Wheat 1,280 1,364 904 1,161 1,233 1,293 1,298 1,276 1,263 1,246 1,233
Rice 535 346 334 429 438 432 433 427 423 428 422
Oilseeds
Soybeans 557 538 428 605 775 856 906 855 835 853 848
Peanuts 103 76 57 85 100 106 108 109 114 114 123
Other oilseeds 19 33 14 19 26 28 28 26 26 24 25
Other commodities
Upland cotton 1,729 996 817 901 962 983 1,036 1,037 1,021 988 940
Sugar 1 0 0 0 0 0 0 0 0 0 0
Dairy 355 58 57 12 5 4 3 3 2 1 1
CCC conservation
Conservation reserve 1,904 1,888 2,054 2,258 2,428 2,364 2,337 2,324 2,350 2,375 2,338
Other CCC conservation 27 19 29 2 1 1 1 1 1 1 1
Tobacco trust fund 937 960 780 960 960 0 0 0 0 0 0
Other CCC
Disaster payments, NAP 99 117 115 115 115 115 115 115 115 115 115
Other net costs 231 627 749 732 654 705 707 709 713 714 715
Net CCC outlays 10,003 9,306 8,034 9,536 10,045 9,334 9,475 9,369 9,356 9,340 9,271
NRCS conservation 2,064 2,923 3,324 3,153 3,233 3,423 3,729 4,038 4,272 4,523 4,723
Supplem. Revenue (SURE) 1,559 1,460 1,055 1,197 0 0 0 0 0 0 0
Other non‐CCC Emergency 928 278 277 32 0 0 0 0 0 0 0
Crop insurance 4,784 5,403 5,185 7,677 7,210 7,287 7,190 7,285 7,376 7,686 7,853
Total mandatory outlays 19,338 19,370 17,875 21,595 20,487 20,043 20,394 20,692 21,004 21,549 21,847
Note: ʺNRCS Conservationʺ denotes mandatory spending on conservation programs authorized by the 2002 and 2008 farm bills that is not
included in reported CCC outlays. Fiscal years begin on Oct.1 of the previous calendar year (FY 2011: Oct. 1,2010‐Sep. 30, 2011).
FAPRI-MU Report #02-11 - 2011 US Baseline Briefing Book - Page 57
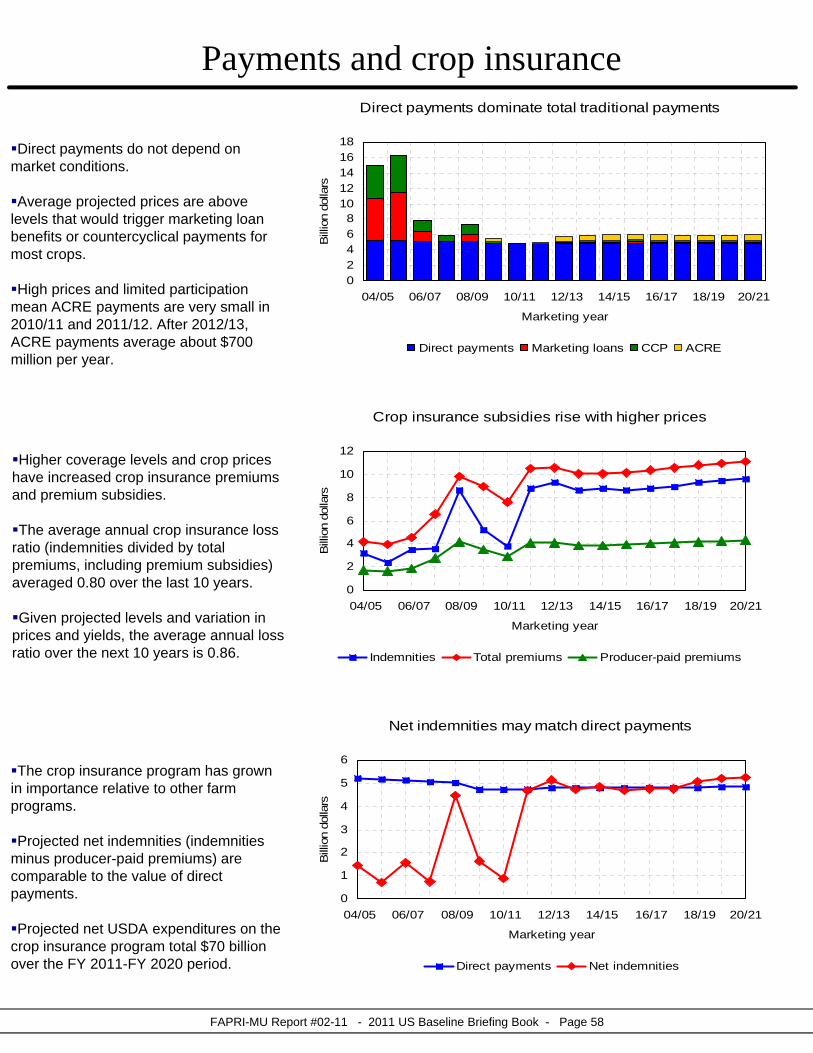
Payments and crop insurance
Direct payments do not depend on market conditions.
Average projected prices are above levels that would trigger marketing loan benefits or countercyclical payments for most crops.
High prices and limited participation mean ACRE payments are very small in 2010/11 and 2011/12. After 2012/13, ACRE payments average about $700 million per year.
Higher coverage levels and crop prices have increased crop insurance premiums and premium subsidies.
The average annual crop insurance loss ratio (indemnities divided by total premiums, including premium subsidies) averaged 0.80 over the last 10 years.
Given projected levels and variation in prices and yields, the average annual loss ratio over the next 10 years is 0.86.
The crop insurance program has grown in importance relative to other farm programs.
Projected net indemnities (indemnities minus producer-paid premiums) are comparable to the value of direct payments.
Projected net USDA expenditures on the crop insurance program total $70 billion over the FY 2011-FY 2020 period.
Direct payments dominate total traditional payments
02468
1012141618
04/05 06/07 08/09 10/11 12/13 14/15 16/17 18/19 20/21
Marketing yearB
illio
n do
llars
Direct payments Marketing loans CCP ACRE
Crop insurance subsidies rise with higher prices
0
2
4
6
8
10
12
04/05 06/07 08/09 10/11 12/13 14/15 16/17 18/19 20/21
Marketing year
Bill
ion
dolla
rs
Indemnities Total premiums Producer-paid premiums
Net indemnities may match direct payments
0
1
2
3
4
5
6
04/05 06/07 08/09 10/11 12/13 14/15 16/17 18/19 20/21
Marketing year
Bill
ion
dolla
rs
Direct payments Net indemnities
FAPRI-MU Report #02-11 - 2011 US Baseline Briefing Book - Page 58

FAPRI-MU Report #02-11 - 2011 US Baseline Briefing Book - Page 59
Selected direct government payments
Marketing year 10/11 11/12 12/13 13/14 14/15 15/16 16/17 17/18 18/19 19/20 20/21
(Million dollars)
Direct payments 4,789 4,783 4,875 4,875 4,875 4,875 4,875 4,876 4,876 4,876 4,876
Marketing loans 90 72 158 179 196 241 211 202 172 158 166
Countercyclical payments 15 60 163 192 225 240 223 222 186 195 191
ACRE payments 55 104 454 678 787 703 682 662 686 740 749
Total 4,949 5,019 5,649 5,924 6,083 6,060 5,991 5,961 5,920 5,969 5,982
Note: Includes selected payments for feed grains, food grains, oilseeds, and upland cotton.
Crop insurance
Year 2010 2011 2012 2013 2014 2015 2016 2017 2018 2019 2020
(Million dollars, crop year)
Total premiums 7,581 10,515 10,564 10,029 10,053 10,141 10,326 10,551 10,807 10,972 11,127
Producer‐paid premiums 2,878 4,068 4,089 3,881 3,890 3,923 3,994 4,081 4,180 4,244 4,303
Premium subsidies 4,702 6,446 6,475 6,148 6,163 6,218 6,332 6,470 6,627 6,728 6,824
Total indemnities 3,816 8,807 9,295 8,675 8,780 8,679 8,812 8,920 9,290 9,496 9,614
Loss ratio 0.50 0.84 0.88 0.87 0.87 0.86 0.85 0.85 0.86 0.87 0.86
(Million dollars, crop year)
Net indemnities 937 4,738 5,206 4,794 4,890 4,755 4,818 4,838 5,110 5,253 5,311
Corn 475 1,803 1,862 1,630 1,704 1,702 1,857 1,865 1,968 2,020 2,013
Soybeans 14 725 815 662 835 707 704 695 765 778 814
Wheat 121 779 1,108 1,196 1,055 1,046 948 941 1,006 1,058 1,055
All other 328 1,431 1,421 1,306 1,295 1,300 1,310 1,338 1,371 1,397 1,430
(Million dollars, fiscal year)
Net outlays 4,784 5,403 5,185 7,677 7,210 7,287 7,190 7,285 7,376 7,686 7,853

Farm receipts and expenses
Cash receipts from sales of program crops (grains, oilseeds, cotton and sugar) have more than doubled since 2005.
Sharply higher prices for most major crops cause the large increase in program crop receipts in 2011.
Receipts for other crops (including vegetables, fruits, nursery crops and hay) dipped slightly with the recession but generally grow at a modest pace.
Lower prices resulted in lower cash receipts for every major livestock category in 2009, with dairy experiencing the largest decline.
Dairy and livestock receipts increase in 2010 and later years, as the assumed recovery in the US and global economies leads to increased demand for animal products.
Farm production expenses increased sharply between 2002 and 2008, primarily because of large increases in spending on fertilizer, fuel and feed.
Lower prices for these key inputs resulted in lower farm expenditures in 2009.
Rising prices for energy and other inputs result in resumed growth in production expenses. Feed expenses increase sharply in 2011 with higher grain prices.
Program crop receipts increase sharply in 2011
0
20
40
60
80
100
120
140
160
2004 2006 2008 2010 2012 2014 2016 2018 2020
Calendar year B
illio
n do
llars
Program crops Other crops
Dairy and livestock receipts grow after 2009 decline
0
10
20
30
40
50
60
2004 2006 2008 2010 2012 2014 2016 2018 2020
Calendar year
Bill
ion
dolla
rs
Cattle Poultry & eggs Dairy Hogs & other
Production costs also increase after 2009 decline
0
10
20
30
40
50
60
2004 2006 2008 2010 2012 2014 2016 2018 2020
Calendar year
Bill
ion
dolla
rs
Feed Fertilizer & chemicals Fuel & electricity
FAPRI-MU Report #02-11 - 2011 US Baseline Briefing Book - Page 60
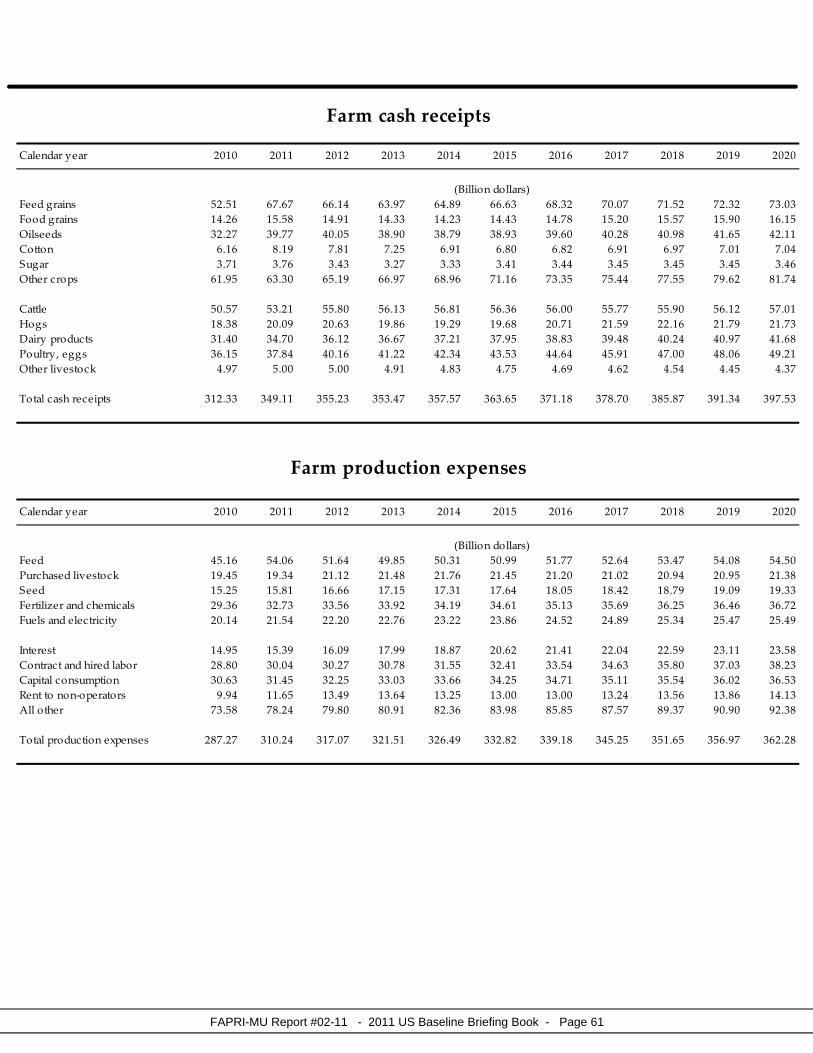
Farm cash receipts
Calendar year 2010 2011 2012 2013 2014 2015 2016 2017 2018 2019 2020
(Billion dollars)
Feed grains 52.51 67.67 66.14 63.97 64.89 66.63 68.32 70.07 71.52 72.32 73.03
Food grains 14.26 15.58 14.91 14.33 14.23 14.43 14.78 15.20 15.57 15.90 16.15
Oilseeds 32.27 39.77 40.05 38.90 38.79 38.93 39.60 40.28 40.98 41.65 42.11
Cotton 6.16 8.19 7.81 7.25 6.91 6.80 6.82 6.91 6.97 7.01 7.04
Sugar 3.71 3.76 3.43 3.27 3.33 3.41 3.44 3.45 3.45 3.45 3.46
Other crops 61.95 63.30 65.19 66.97 68.96 71.16 73.35 75.44 77.55 79.62 81.74
Cattle 50.57 53.21 55.80 56.13 56.81 56.36 56.00 55.77 55.90 56.12 57.01
Hogs 18.38 20.09 20.63 19.86 19.29 19.68 20.71 21.59 22.16 21.79 21.73
Dairy products 31.40 34.70 36.12 36.67 37.21 37.95 38.83 39.48 40.24 40.97 41.68
Poultry, eggs 36.15 37.84 40.16 41.22 42.34 43.53 44.64 45.91 47.00 48.06 49.21
Other livestock 4.97 5.00 5.00 4.91 4.83 4.75 4.69 4.62 4.54 4.45 4.37
Total cash receipts 312.33 349.11 355.23 353.47 357.57 363.65 371.18 378.70 385.87 391.34 397.53
Farm production expenses
Calendar year 2010 2011 2012 2013 2014 2015 2016 2017 2018 2019 2020
(Billion dollars)
Feed 45.16 54.06 51.64 49.85 50.31 50.99 51.77 52.64 53.47 54.08 54.50
Purchased livestock 19.45 19.34 21.12 21.48 21.76 21.45 21.20 21.02 20.94 20.95 21.38
Seed 15.25 15.81 16.66 17.15 17.31 17.64 18.05 18.42 18.79 19.09 19.33
Fertilizer and chemicals 29.36 32.73 33.56 33.92 34.19 34.61 35.13 35.69 36.25 36.46 36.72
Fuels and electricity 20.14 21.54 22.20 22.76 23.22 23.86 24.52 24.89 25.34 25.47 25.49
Interest 14.95 15.39 16.09 17.99 18.87 20.62 21.41 22.04 22.59 23.11 23.58
Contract and hired labor 28.80 30.04 30.27 30.78 31.55 32.41 33.54 34.63 35.80 37.03 38.23
Capital consumption 30.63 31.45 32.25 33.03 33.66 34.25 34.71 35.11 35.54 36.02 36.53
Rent to non‐operators 9.94 11.65 13.49 13.64 13.25 13.00 13.00 13.24 13.56 13.86 14.13
All other 73.58 78.24 79.80 80.91 82.36 83.98 85.85 87.57 89.37 90.90 92.38
Total production expenses 287.27 310.24 317.07 321.51 326.49 332.82 339.18 345.25 351.65 356.97 362.28
FAPRI-MU Report #02-11 - 2011 US Baseline Briefing Book - Page 61

Farm incomeCash income and expenses resume growth in 2010
100
150
200
250
300
350
400
450
500
2004 2006 2008 2010 2012 2014 2016 2018 2020
Calendar year B
illio
n do
llars
Gross cash income Cash expenses
Gross cash income (sales receipts and government payments) recovered in 2010 and increases again in 2011.
Cash expenses also increase in 2011, but by less than cash income.
Gross cash income and expenses increase at a similar pace after 2011.
Both crop and livestock sales receipts declined in 2009, in part because of the recession.
Livestock receipts resumed their increase in 2010, and projected crop receipts increase by more than $27 billion in 2011.
Government payments are a modest share of gross farm income.
Net cash income exceeds $100 billion for the first time in 2011, and net farm income also reaches its highest level ever in nominal terms.
Both measures of farm income remain at elevated levels after 2011.
Even after adjusting for inflation, real net farm income in 2011 is at the highest level since 2004.
Net cash and net farm income set records in 2011
0
20
40
60
80
100
120
2004 2006 2008 2010 2012 2014 2016 2018 2020
Calendar year
Bill
ion
dolla
rs
Net cash income Net farm income
Crop and livestock receipts both increase in 2011
050
100150200250300350400450
2004 2006 2008 2010 2012 2014 2016 2018 2020
Calendar year
Bill
ion
dolla
rs
Crop receipts Livestock receipts Government payments
FAPRI-MU Report #02-11 - 2011 US Baseline Briefing Book - Page 62

Farm income statistics
Calendar year 2010 2011 2012 2013 2014 2015 2016 2017 2018 2019 2020
(Billion dollars)
1. Farm receipts 333.40 372.38 380.02 378.08 382.42 388.74 396.67 404.59 412.39 418.40 425.03
Crops 170.86 198.26 197.52 194.69 197.10 201.37 206.31 211.34 216.04 219.95 223.53
Livestock 141.48 150.84 157.71 158.78 160.47 162.27 164.87 167.36 169.84 171.39 174.00
Farm‐related 21.07 23.27 24.79 24.61 24.85 25.09 25.48 25.89 26.52 27.06 27.50
2. Government payments 12.18 11.22 11.47 12.08 11.21 10.58 10.68 10.81 10.94 11.08 11.22
3. Gross cash income 345.58 383.60 391.48 390.16 393.63 399.32 407.35 415.40 423.33 429.48 436.25
(1 + 2)
4. Nonmoney income 21.69 22.66 23.77 24.61 25.23 25.83 26.30 26.68 27.10 27.51 27.98
5. Value of inventory
Change ‐0.99 2.83 0.02 ‐0.37 0.14 0.42 0.17 0.14 ‐0.13 ‐0.14 0.05
6. Gross farm income 366.28 409.09 415.28 414.40 419.00 425.57 433.81 442.23 450.31 456.84 464.28
(3 + 4 + 5)
7. Cash expenses 254.24 276.24 282.11 285.62 289.86 295.47 301.27 306.85 312.71 317.47 322.15
8. Total expenses 287.27 310.24 317.07 321.51 326.49 332.82 339.18 345.25 351.65 356.97 362.28
9. Net cash income 91.34 107.36 109.38 104.54 103.78 103.85 106.08 108.55 110.62 112.01 114.11
(3 ‐ 7)
10. Realized net farm inc 79.99 96.02 98.19 93.26 92.37 92.34 94.47 96.83 98.79 100.01 101.96
(3 + 4 ‐ 8)
11. Net farm income 79.00 98.85 98.21 92.89 92.51 92.75 94.64 96.97 98.66 99.87 102.00
(6 ‐ 8)
Deflated (2009 $) 78.28 96.85 95.04 88.52 86.54 85.15 85.32 85.84 85.71 85.21 85.46
FAPRI-MU Report #02-11 - 2011 US Baseline Briefing Book - Page 63

IHS Global Insight expects the refiners’ acquisition price for petroleum to increase to $100 per barrel by 2016.
To examine alternative futures for biofuel and agricultural markets, we explored a range of possible oil prices approximately centered on the IHS Global Insight forecast.
This process is repeated for hundreds of other variables to generate the stochastic baseline.
Corn prices depend on petroleum prices, crop yields, global economic growth, the value of the dollar and many other uncertain factors.
Average corn prices are projected to decline slightly from the 2010/11 record but remain above earlier levels.
In most of the outcomes, corn prices are between $3.50 and $6.00 per bushel.
Volatility in commodity yields and prices creates uncertainty for outlays for the crop insurance program.
Higher crop prices, production and coverage levels increase crop insurance premiums and premium subsidies.
In any given year, outlays will depend on yields, prices and resulting indemnities.
There are certain to be risks not captured in these 500 alternative futures.
Ranges from the 500 alternative futuresOil price uncertainty is great
020406080
100120140160180
04/05 06/07 08/09 10/11 12/13 14/15 16/16 18/19 20/21
Refiners' acquisition price, September-August yearD
olla
rs p
er b
arre
l
90th percentile Average of 500 outcomes 10th percentile
Crop insurance net outlays are also uncertain
0
2
4
6
8
10
12
14
2004 2006 2008 2010 2012 2014 2016 2018 2020
FCIC net outlays, fiscal year
Bill
ion
dolla
rs
90th percentile Average of 500 outcomes 10th percentile
Corn prices depend on oil prices, yields and more
1
2
3
4
5
6
7
04/05 06/07 08/09 10/11 12/13 14/15 16/16 18/19 20/21
September-August year
Dol
lars
per
bus
hel
90th percentile Average of 500 outcomes 10th percentile
FAPRI-MU Report #02-11 - 2011 US Baseline Briefing Book - Page 64