Embed Size (px)
Citation preview
ARL-TN-0711 ● NOV 2015
US Army Research Laboratory
US Army Research Laboratory Directed Energy Internship Program 2014 Final Report
by Jeffrey O White Approved for public release; distribution is unlimited.

NOTICES
Disclaimers The findings in this report are not to be construed as an official Department of the Army position unless so designated by other authorized documents.
Citation of manufacturer’s or trade names does not constitute an official endorsement or approval of the use thereof.
Destroy this report when it is no longer needed. Do not return it to the originator.
ARL-TN-0711 ● NOV 2015
US Army Research Laboratory
US Army Research Laboratory Directed Energy Internship Program 2014 Final Report
by Jeffrey O White Sensors and Electron Devices Directorate, ARL Approved for public release; distribution is unlimited.

ii
REPORT DOCUMENTATION PAGE Form Approved OMB No. 0704-0188
Public reporting burden for this collection of information is estimated to average 1 hour per response, including the time for reviewing instructions, searching existing data sources, gathering and maintaining the data needed, and completing and reviewing the collection information. Send comments regarding this burden estimate or any other aspect of this collection of information, including suggestions for reducing the burden, to Department of Defense, Washington Headquarters Services, Directorate for Information Operations and Reports (0704-0188), 1215 Jefferson Davis Highway, Suite 1204, Arlington, VA 22202-4302. Respondents should be aware that notwithstanding any other provision of law, no person shall be subject to any penalty for failing to comply with a collection of information if it does not display a currently valid OMB control number. PLEASE DO NOT RETURN YOUR FORM TO THE ABOVE ADDRESS.
1. REPORT DATE (DD-MM-YYYY)
November 2015 2. REPORT TYPE
Final 3. DATES COVERED (From - To)
01/2014–12/2014 4. TITLE AND SUBTITLE
US Army Research Laboratory Directed Energy Internship Program 2014 Final Report
5a. CONTRACT NUMBER
5b. GRANT NUMBER
5c. PROGRAM ELEMENT NUMBER
6. AUTHOR(S)
Jeffrey O White 5d. PROJECT NUMBER
5e. TASK NUMBER
5f. WORK UNIT NUMBER
7. PERFORMING ORGANIZATION NAME(S) AND ADDRESS(ES)
US Army Research Laboratory ATTN: RDRL-SEE-E 2800 Powder Mill Road Adelphi, MD 20783-1138
8. PERFORMING ORGANIZATION REPORT NUMBER
ARL-TN-0711
9. SPONSORING/MONITORING AGENCY NAME(S) AND ADDRESS(ES)
High Energy Laser Joint Technology Office 801 University Blvd. SE, Suite 209, Albuquerque, NM 87106
10. SPONSOR/MONITOR'S ACRONYM(S)
11. SPONSOR/MONITOR'S REPORT NUMBER(S)
12. DISTRIBUTION/AVAILABILITY STATEMENT
Approved for public release; distribution is unlimited. 13. SUPPLEMENTARY NOTES Directed Energy Professional Society 7770 Jefferson Street NE, Suite 440, Albuquerque, New Mexico 87109
14. ABSTRACT
This technical note is the final report for the 2014 Directed Energy Internship program at the US Army Research Laboratory. Six interns were mentored by 4 government employees. The projects included 1) a comparison of traditional erbium (Er):silica (SiO2) optical fiber to designs using Er: alumina (Al2O3) nanoparticles, 2) chirped seed amplification in a 1.6-kW ytterbium (Yb) fiber amplifier, 3) custom components for a 100-W Er amplifier, and 4) performance of coherent beam combining and power usage in fiber laser arrays with high fill-factor output. Three reports written by the interns are included as Appendices A through C. A report on the third project was published separately as ARL-TN-0672.
15. SUBJECT TERMS
High power lasers, internship
16. SECURITY CLASSIFICATION OF: 17. LIMITATION OF ABSTRACT
UU
18. NUMBER OF PAGES
38
19a. NAME OF RESPONSIBLE PERSON
Jeffrey O White a. REPORT
Unclassified b. ABSTRACT
Unclassified c. THIS PAGE
Unclassified 19b. TELEPHONE NUMBER (Include area code)
301-394-0069 Standard Form 298 (Rev. 8/98) Prescribed by ANSI Std. Z39.18

iii
Contents
List of Figures v
List of Tables v
1. Introduction 1
2. Recruitment of Participants 1
3. Selection of Participants 1
4. Reporting of Student Research 2
5. Conclusion 2
6. References 3
Appendix A. A Comparison of Traditional Erbium (Er):Silica (SiO2) Optical Fiber to Designs Using Er:Alumina (Al2O3) Nanoparticles, by Scott Melis 5
A-1 Abstract 6
A-2 Acknowledgments 6
A-3 Student Bio 6
A-4 Background 6
A-5 Experiment 7
A-6 Results and Discussion 9
A-7 Conclusion 12
A-8 Related Work 12
Appendix B. Chirped Seed Amplification in a 1.6-kW Ytterbium (Yb) Fiber, by Zhi Yi Yang 15
B-1 Abstract 16
B-2 Introduction 16
B-3 Background 16

iv
B-4 Experiment 17
B-5 Measurement\Results 17
B-6 Conclusion 18
Appendix C. Performance of Coherent Beam Combining and Power Usage in Fiber Laser Arrays with a High Fill-Factor Output, by Brian Kwon, Jeffrey Volz, and Patrick Marple 19
C-1 Abstract 20
C-2 Acknowledgments 20
C-3 Student Bios 20
C-4 Introduction/Background 20
C-5 Experiment/Calculations 21
C-6 Results and Discussion 22
C-7 Summary and Conclusions 25
List of Symbols, Abbreviations, and Acronyms 27
Distribution List 28

v
List of Figures
Fig. A-1 A graph of the normalized fluorescence intensity of the Er-SD and Er-NP samples .....................................................................................10
Fig. A-2 Cross-section spectra of the Er-NP (left) and Er-SD (right) fiber preforms showing both stimulated emission (in blue) and absorption (in red). The spectra are very similar. ..................................................11
Fig. A-3 Near-IR upconversion fluorescence for both the Er-NP and the Er-SD samples .................................................................................................12
Fig. B-1 Data (points) and simulation (solid lines) showing a chirp rate of 1×10¹⁷ Hz/s needed to reach a 1-kW output power at the SBS threshold (dashed line) .........................................................................18
Fig. B-2 Backward power vs. forward power for various chirp rates ................18
Fig. C-1 Current array (left) vs. experimental array (right) ...............................21
Fig. C-2 Diagram of experimental setup ............................................................21
Fig. C-3 Experimental mask shapes for a new aperture .....................................22
Fig. C-4 Experimental results of truncated power vs. mask diameter ...............23
Fig. C-5 3D rendering of parts in Makerbot software next to printed pieces ....24
Fig. C-6 In-progress bimorph actuators next to the fiber positioner base ..........25
List of Tables
Table A-1 Radiative fluorescence lifetimes of both the Er-NP and the Er-SD samples; their close agreement further shows the similarity of the samples .................................................................................................10

vi
INTENTIONALLY LEFT BLANK.
1
1. Introduction
The US Army Research Laboratory (ARL) operated its 11th annual Directed Energy (DE) Visiting Scholars program in summer 2014, funded by the High Energy Lasers Joint Technology Office (HEL-JTO) and coordinated by the Directed Energy Professional Society (DEPS). This report summarizes the activities including recruitment, selection among applicants, and research areas pursued. Three technical reports written by the participants are included as Appendices A through C, and a third is available as ARL-TN-0672.1
2. Recruitment of Participants
Applicants to the summer program were recruited using several methods. A web page describing the program and our team’s research topics was posted on ARL’s Internet site and linked from the DEPS site. We also published a free ad in the Physics Today online classifieds, and asked the physics and electronic engineering (EE) departments at the University of Maryland (College Park and Baltimore County) and the University of Illinois to post advertisements or circulate via email to their students. Twenty-seven students applied; one-third had credentials of sufficient quality and relevance to warrant serious consideration. Two returning students were accepted along with 4 new students.
3. Selection of Participants
Based on their transcripts and letters of recommendation, 6 students were offered summer scholar positions; they all accepted.
Kevin Landsman had completed his 1st year of graduate school in the EE department of the University of Maryland at College Park. He was a good fit for Jeff White’s project on making an interlock circuit for a fiber amplifier. Construction of the amplifier was part of HEL-JTO contract 13-S&A-0509. He worked 3 days per week, spending the rest of the week studying for the exams to qualify for the PhD program.
Returning student, Zhi Yi Yang, had completed his Master’s degree in physics at Hunter College. Due to his previous experience at ARL as a DEPS Scholar in 2013, he was the best candidate to work with Jeff White on building a 100-W erbium (Er) fiber amplifier using chirped seed amplification (CSA). This project was part of HEL-JTO contract 13-S&A-0509.
2
Scott Melis is a returning student who graduated in May 2014 from Loyola, Maryland University with a BS degree in physics. He was a good fit for Larry Merkle’s project on comparing a traditional Er:silica (SiO2) optical fiber to designs using Er:alumina (Al2O3) nanoparticles. He participated in ARL’s College-Qualified Leaders (CQL) program in summer 2013. In fall 2014, he began a doctorate program in physics at Georgetown University where he hopes to continue research in materials and optics.
Three new students were selected by Jony Liu and Leonid Beresnev to study the performance of coherent beam combining and power usage in fiber laser arrays with high fill-factor output. Brian Kwon is a graduate of The University of Delaware with a computer engineering degree. Jeffrey Volz is a junior attending The University of Delaware and majoring in computer engineering. Patrick Marple is a junior at University of Maryland Baltimore County (UMBC) majoring in systems engineering.
4. Reporting of Student Research
Scott Melis presented a poster at the Sensors and Electron Devices Directorate (SEDD)-Computational and Information Sciences Directorate (CISD) student poster session. Brian Kwon, Jeffrey Volz, and Patrick Marple presented a second poster. Final reports were written by Scott Melis, Zhi Yi Yang, and Kevin Landsman. Brian Kwon, Jeffrey Volz, and Patrick Marple wrote a joint report. The full text of 3 reports is included as Appendices A through C. Kevin Landsman’s report was turned into an ARL Technical Note: ARL-TN-0672.1
This year, no students attended the Directed Energy Education Workshop in March 2015, either they were unable to attend because of school or their work wasn’t complete by the end of the summer.
5. Conclusion
We were pleased with the quality of all 6 DE scholars this year. They were well worth the stipend provided by the HEL-JTO. One student, Kevin Landsman, applied for and was awarded a Graduate Directed Energy Fellowship in High Energy Lasers. We continue to believe in the importance of training the future Department of Defense workforce and believe that the Directed Energy Visiting Scholars program provides students with an excellent, much-needed, close to real-life learning opportunity.

3
6. References
1. Landsman KA, White JO, Harrison AC. Custom Components for a 100-W Erbium Fiber Amplifier. Adelphi (MD): Army Research Laboratory (US); May 2015. Report No.: ARL-TN-0672.

4
INTENTIONALLY LEFT BLANK.

5
Appendix A. A Comparison of Traditional Erbium (Er):Silica (SiO2) Optical Fiber to Designs Using Er:Alumina (Al2O3) Nanoparticles, by Scott Melis
6
A-1 Abstract
A comparison is made between traditional erbium (Er)-doped fiber (EDF) preforms made by solution-doping (SD), and new preforms made using Er-doped alumina (Al2O3) based nanoparticles (NPs) that are melted into a glass (Er-NP) in order to better control the separation between Er atoms in a fiber. Better separation is important because of laser performance degradation due to energy transfer in clusters of Er atoms from processes like upconversion. In the traditional method, Er atoms are often co-doped with aluminum (Al) atoms, but clustering still occurs. The new Al2O3 NP technique is believed to alleviate this by creating a cage of Al and oxygen (O) ions to surround the Er ion and reduce ion-ion interactions. A study of the absorption and stimulated emission cross sections is performed on samples of both materials. Overall, the Er-NP fiber preforms appear to produce similar cross-section spectra to the traditional counterparts. In addition, measurements of the upconversion-induced fluorescence of each sample have shown that the rate of upconversion has fallen by a significant factor. Because of this, the new Er-NP material shows significant potential for improving fiber lasers by allowing for higher Er concentrations while maintaining good efficiency.
A-2 Acknowledgments
I wish to acknowledge the mentorship and guidance of Dr Larry Merkle. In addition, special thanks are extended to Dr Mark Dubinskii, US Army Research Laboratory (ARL), for his collaboration and insight, as well as Dr Joseph Friebele, US Naval Research Laboratory (NRL), for his collaboration and creation of the EDF preforms analyzed here.
A-3 Student Bio
Scott Melis graduated from Loyola University Maryland in spring 2014 with a BS degree in physics and minors in mathematics and engineering sciences. He has participated previously in ARL’s College-Qualified Leaders (CQL) program in the summer of 2013. In fall 2014, he began a doctorate program in physics at Georgetown University where he hopes to further study aspects of materials and optics research.
A-4 Background
EDFs are important because of the wavelength at which they lase, which falls within the region of infrared (IR) wavelengths that exhibit high atmospheric transmission while simultaneously matching the “eye safer” region of
7
1400–1800 nm. However, when making EDFs, the solubility of Er in traditional silica (SiO2)-based glass is low and the ions that successfully bond with the glass tend to form clusters. This is an undesirable scenario due to the ease with which Er ions experience upconversion when they are in close proximity. The energy gap between several energy levels of Er is fairly similar, which allows for an excited ion in a particular energy state to transfer its energy to a similarly excited ion that is positioned nearby. When this upconversion process occurs for a given pair of excited ions, one ion returns to the ground state without emitting a fluorescence photon. The other is excited to a much higher energy level where it can either fluoresce immediately and give off a photon of a shorter wavelength than desired or fall back to its initial excited state and fluoresce from there. Thus, either half or all of the energy in a pair of excited ions could be wasted.
In traditional SiO2-based Er-doped glass (Er-SD), Er is co-doped with a significantly higher concentration of Al ions in the fiber core using a technique called solution-doping. The goal is to use Al ions as buffers to separate the Er ions and impede energy transfer; however, the placement of the ions is a random effect. It does not provide a direct mechanism for controlling the atomic environment of the Er ions and clustering still does occur. As an idea to counteract the degrading effects of upconversion, Er-doped SiO2 NPs (Er-NP) are doped into the glass core of a fiber. This process is thought to create a cage of Al and O ions around each Er ion, thereby significantly reducing ion-ion energy transfer in the glass. Fiber preforms of this new NP-doped glass are compared in this study to traditional SD preforms in order to see whether they produce comparable fluorescence spectra, lifetimes, and cross-section spectra while also reducing upconversion in the near-IR region. If they do this, then the new NP-doping technique will improve the current state of EDFs.
A-5 Experiment
Experiments were carried out to compare the fluorescence spectra, fluorescence lifetimes, and cross-section spectra of fiber preforms that were made using both techniques of interest. A 0.254-mm-thick sample of Er-NP fiber preform and a 0.474-mm-thick sample of Er-SD fiber preform were made by Dr Joseph Friebele of NRL. Both samples were roughly 12.3 mm in diameter with nominally 1-mm-diameter Er-doped cores. It is estimated that the Er-NP sample has roughly twice the concentration as the Er-SD sample.
For collecting fluorescence data on each sample, a Spectra-Physics continuous wave (CW) titanium sapphire (Ti:sapph) laser was used that was pumped with a frequency doubled Spectra-Physics neodymium-doped yttrium vanadate laser. The
8
Ti:sapph laser was chopped at 100 Hz with a 50% duty cycle and was used to excite both samples at around 979 nm. The samples were excited in a Horiba Fluorolog 3 fluorescence spectrometer that uses a laptop with Horiba’s Origin-based FluorEssence software to collect data. Two Thorlabs FGL1000s filters were used to protect the system from scattered laser light. The spectrometer also used a 1.5-µm blazed grating and a nominally 2.6-µm liquid nitrogen-cooled indium gallium arsenide (InGaAs) detector whose signal was sent into a Stanford Research Systems SR830 lock-in amplifier before being analyzed by the Fluorolog.
For measurements of the radiative fluorescence lifetime, the Ti:sapph laser was again used at 979 nm. However, it was now chopped at 10 Hz with a roughly 20% duty cycle. The samples were not in the Fluorolog system but instead were positioned so that their fluorescence could be focused using a 25-mm lens directly onto the InGaAs detector with a Thorlabs FEL1100 and Spectrogon LP1200 filter for protection. The output of the detector was measured directly using a Tektronix TDS7104 digital phosphor oscilloscope and the data were exported to Microsoft Excel so that a fit to an exponential decay could be implemented for determining the lifetime value.
With a value for the lifetime, the fluorescence data could be converted into a stimulated emission cross section using the Füchtbauer–Ladenburg (F-L) equation.1 The F-L equation allows for the conversion of a fluorescence intensity spectrum to a stimulated emission cross section given the radiative lifetime (τrad) and the index of refraction of the sample (n), which we assume to be approximately the value for fused SiO2, 1.44. The F-L equation is given by
𝛔𝛔𝐬𝐬𝐬𝐬𝐬𝐬𝐬𝐬.𝐞𝐞𝐬𝐬.(𝛌𝛌) = 𝛌𝛌𝟓𝟓
𝟖𝟖 𝛑𝛑 𝐜𝐜 𝐧𝐧𝟐𝟐 𝛕𝛕𝐫𝐫𝐫𝐫𝐫𝐫 𝐈𝐈(𝛌𝛌)∫ 𝐈𝐈(𝛌𝛌) 𝛌𝛌 𝐫𝐫𝛌𝛌
(A-1)
From the stimulated emission cross section, an absorption cross section can then be generated using the theory of reciprocity. Reciprocity insists that if the ratio of the partition functions of the upper and lower energy states of a transition (Zup/Zlow) and the zero-phonon line energy (E0) are known, then a stimulated emission cross section can be converted into an absorption cross section and vice versa. In a high temperature condition, or in a glass as is our case, the possible energies of each state smear together and the ratio of the partition functions of each level is simply the ratio of the degeneracies. For this case, where we desire fluorescence in the region of 1450–1750 nm, the Er ions transition from the 4I13/2 to the 4I15/2 state. This means Zup/Zlow is given by 14/16, where the degeneracy is equal to 2j+1. Similarly, the zero-phonon line energy is taken to be the energy associated with the
1Aull BF, Jenssen HP. IEEE J. Quantum Electronics. 1982;QE-18:925–30.
9
fluorescence peak seen at 1532 nm. Thus, E0 is 1.298 x 10⁻¹⁹ J. With these values in mind, one can apply the reciprocity equation given by2
𝛔𝛔𝐫𝐫𝐚𝐚𝐬𝐬.(𝛌𝛌) = 𝛔𝛔𝐬𝐬𝐬𝐬𝐬𝐬𝐬𝐬.𝐞𝐞𝐬𝐬.(𝛌𝛌) 𝐙𝐙𝐮𝐮𝐮𝐮𝐙𝐙𝐥𝐥𝐥𝐥𝐥𝐥
𝐞𝐞𝐞𝐞𝐮𝐮 �𝐡𝐡 𝐜𝐜𝛌𝛌 −𝐄𝐄𝟎𝟎𝐤𝐤 𝐓𝐓
� (A-2)
Creating spectra for these parameters will allow for a determination of whether or not the Er-NP method creates a material that behaves similarly to the Er-SD method. What remains is to observe whether or not the upconversion is reduced. For this experiment, both samples are again excited in similar positions with a 979-nm CW beam that is chopped at 100 Hz; green and near-IR wavelengths corresponding to transitions from higher energy states are explored using a Hamamatsu R2658P photomultiplier tube (PMT) with the Fluorolog spectrometer to scan the region. The output of the PMT is sent through the lock-in amplifier before analysis with the FluorEssence software due to the small signal level detected. The “area under the curve” of each sample’s upconversion spectrum is scaled by the “area under the curve” of the corresponding fluorescence from 1450–1700 nm. This is done to hopefully correct small errors in sample positioning and excitation power. These scaled area values are then compared to see if the Er-NP sample shows lower amounts of upconversion than the Er-SD sample.
A-6 Results and Discussion
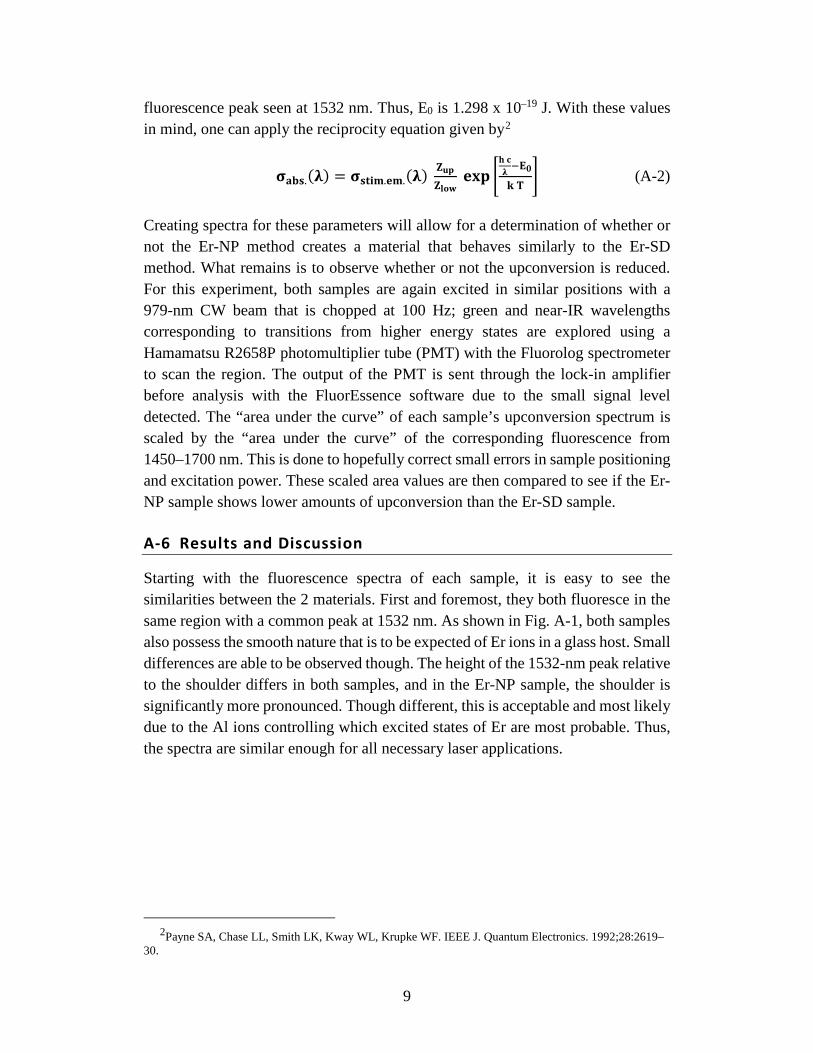
Starting with the fluorescence spectra of each sample, it is easy to see the similarities between the 2 materials. First and foremost, they both fluoresce in the same region with a common peak at 1532 nm. As shown in Fig. A-1, both samples also possess the smooth nature that is to be expected of Er ions in a glass host. Small differences are able to be observed though. The height of the 1532-nm peak relative to the shoulder differs in both samples, and in the Er-NP sample, the shoulder is significantly more pronounced. Though different, this is acceptable and most likely due to the Al ions controlling which excited states of Er are most probable. Thus, the spectra are similar enough for all necessary laser applications.
2Payne SA, Chase LL, Smith LK, Kway WL, Krupke WF. IEEE J. Quantum Electronics. 1992;28:2619–
30.
10
Fig. A-1 A graph of the normalized fluorescence intensity of the Er-SD and Er-NP samples
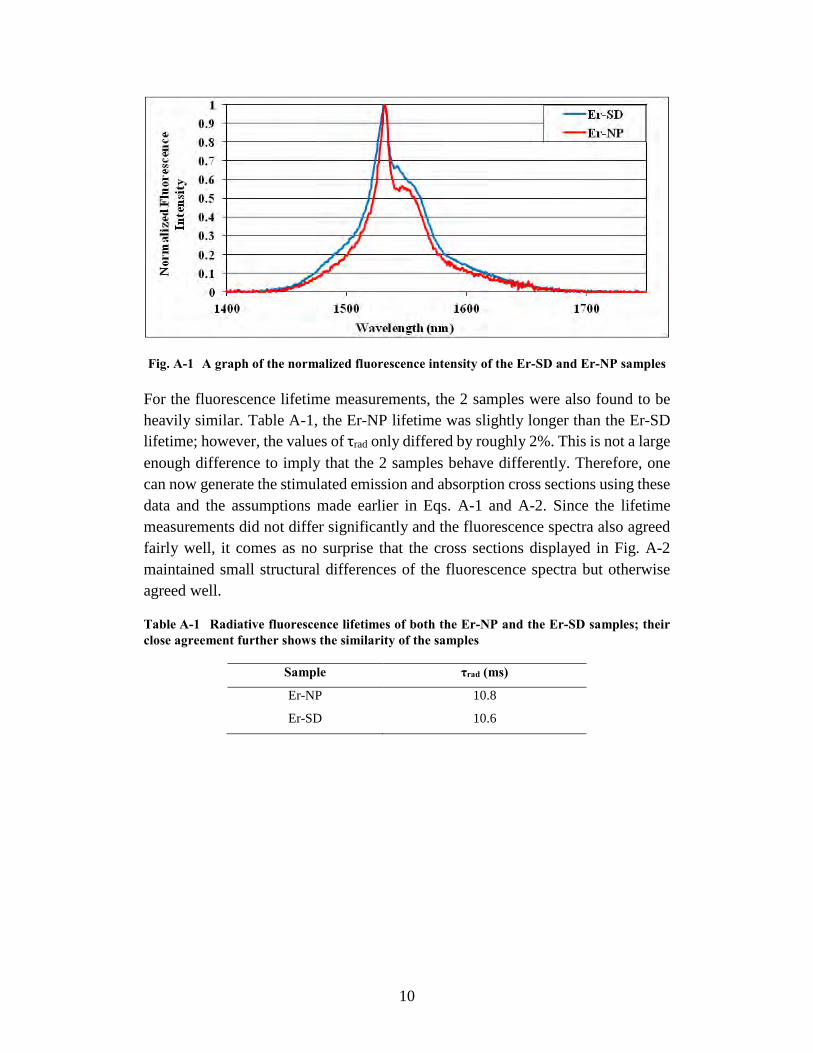
For the fluorescence lifetime measurements, the 2 samples were also found to be heavily similar. Table A-1, the Er-NP lifetime was slightly longer than the Er-SD lifetime; however, the values of τrad only differed by roughly 2%. This is not a large enough difference to imply that the 2 samples behave differently. Therefore, one can now generate the stimulated emission and absorption cross sections using these data and the assumptions made earlier in Eqs. A-1 and A-2. Since the lifetime measurements did not differ significantly and the fluorescence spectra also agreed fairly well, it comes as no surprise that the cross sections displayed in Fig. A-2 maintained small structural differences of the fluorescence spectra but otherwise agreed well.
Table A-1 Radiative fluorescence lifetimes of both the Er-NP and the Er-SD samples; their close agreement further shows the similarity of the samples
Sample τrad (ms)
Er-NP 10.8
Er-SD 10.6
11
Fig. A-2 Cross-section spectra of the Er-NP (left) and Er-SD (right) fiber preforms showing both stimulated emission (in blue) and absorption (in red). The spectra are very similar.
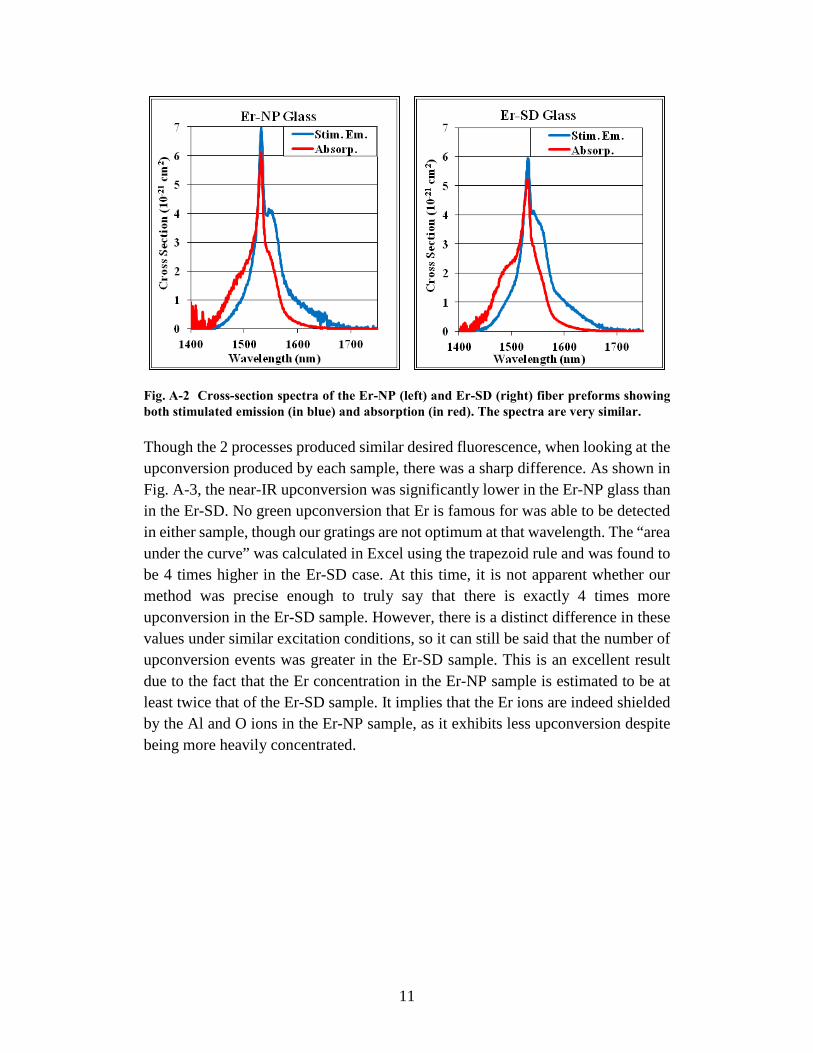
Though the 2 processes produced similar desired fluorescence, when looking at the upconversion produced by each sample, there was a sharp difference. As shown in Fig. A-3, the near-IR upconversion was significantly lower in the Er-NP glass than in the Er-SD. No green upconversion that Er is famous for was able to be detected in either sample, though our gratings are not optimum at that wavelength. The “area under the curve” was calculated in Excel using the trapezoid rule and was found to be 4 times higher in the Er-SD case. At this time, it is not apparent whether our method was precise enough to truly say that there is exactly 4 times more upconversion in the Er-SD sample. However, there is a distinct difference in these values under similar excitation conditions, so it can still be said that the number of upconversion events was greater in the Er-SD sample. This is an excellent result due to the fact that the Er concentration in the Er-NP sample is estimated to be at least twice that of the Er-SD sample. It implies that the Er ions are indeed shielded by the Al and O ions in the Er-NP sample, as it exhibits less upconversion despite being more heavily concentrated.
12
Fig. A-3 Near-IR upconversion fluorescence for both the Er-NP and the Er-SD samples
A-7 Conclusion
Overall, it is clear that the new NP-doping approach successfully creates a material that behaves as well as the traditional SD method. It is also shown that the NP approach reduces near-IR upconversion significantly. Because it did this while having a higher concentration, it seems apparent that the Er-NP approach is doing a better job at separating the Er atoms in the glass host. If the Er-NP material were used for the creation of a fiber laser, there should be a good increase in output due to both the reduction in energy losses and the increase in fluorescence. The fiber could have more Er ions per unit volume for lasing than an Er-SD counterpart as the current preform samples appear to reduce upconversion even at twice the concentration. Thus, future work hopes to look into optimizing the NP approach in order to find the best production method and the best concentration of Er ions. In addition, further tests hope to look into better quantifying the upconversion process of both Er-NP and Er-SD materials in order to confirm the significant decrease seen here.
A-8 Related Work
Other projects were explored this summer, outside of the comparison between fiber preforms that is described in this report. They are briefly mentioned here for better describing the work done this summer.
13
First, a calorimetric determination of a bulk sample’s quantum efficiency was explored. The process attempted involved gluing a thermocouple to a sample and exciting the sample with a laser at a wavelength that it absorbs. The heating and cooling was monitored using a LabVIEW program in order to determine the heating rate of the sample. The incident laser power was also checked with a laser power meter. Then, the experiment was repeated with the same sample coated in black optical grease in order to determine a “calibration” factor using a scenario of essentially 0% quantum efficiency. If we know how much power is incident on the optical grease and how much heat our thermocouple detects, we can create a scale factor to multiply the heating rate of the uncoated sample by. Doing that should allow us to determine quantum efficiency using the following equation if the sample’s quantum defect is known.
𝑄𝑄𝑄𝑄 = 1 − �𝐶𝐶𝐶𝐶𝐶𝐶𝐶𝐶𝐶𝐶𝐶𝐶𝐶𝐶𝐶𝐶𝐶𝐶 𝑃𝑃 ℎ𝐶𝐶𝑒𝑒𝐶𝐶𝑒𝑒𝑒𝑒𝑒𝑒
𝑃𝑃 𝑒𝑒𝑎𝑎𝑎𝑎𝐶𝐶𝐶𝐶𝑎𝑎𝐶𝐶𝐶𝐶 �
1 − 𝑄𝑄𝑄𝑄𝑄𝑄𝑄𝑄𝑄𝑄𝑄𝑄𝑄𝑄 𝐷𝐷𝐷𝐷𝐷𝐷𝐷𝐷𝐷𝐷𝑄𝑄 (A-3)
Unfortunately, this result has yet to confirm the well-known quantum efficiency of several neodymium (Nd):yttrium aluminum garnet (YAG) samples of different concentrations and therefore, the technique will continue to be explored by Dr Larry Merkle. So far, a more precise laser power meter has been obtained to better remove error in power measurements and an exploration of the validity of the assumption that the cooling behaves as a single exponential is underway.
In addition, a sample of 4H-silicon carbide (SiC) was studied to see if there was evidence of fluorescence. Near-IR light, which peaked at around 1000 nm and spanned from 850–1400 nm, was observed when the sample was excited in the range of 740–1000 nm. It is believed that the sample absorbs at wavelengths shorter than 740 nm, but due to the limits of the Ti-sapph laser used, it was impossible to explore much past this point. At this time, it is not known what defect or property caused these emissions but they were found to be horribly inefficient when compared to a 0.09% Nd:YAG ceramic sample. Both samples were excited at points where they absorbed similar amounts and yet the 4H-SiC sample fluoresced with roughly 1–2% the photon flux of the Nd:YAG sample. Therefore, we conclude that whatever this property is, it is very inefficient, and though it is interesting, it shows little use at this time.

14
INTENTIONALLY LEFT BLANK.

15
Appendix B. Chirped Seed Amplification in a 1.6-kW Ytterbium (Yb) Fiber, by Zhi Yi Yang
16
B-1 Abstract
As lasers are scaled to higher powers, nonlinear effects become increasingly prominent. This is especially pronounced in fiber lasers because of their ability to confine high optical power into a small area and over a long interaction length. For narrow linewidth lasers, the first nonlinear effect that is encountered is stimulated Brillouin scattering (SBS). By rapidly chirping the frequency of the seed laser, SBS is suppressed with a more efficient use of bandwidth than by white noise phase modulation. In this experiment, a chirped diode laser seeds a kilowatt fiber amplifier and we were able to suppress SBS enough to reach 1.6 kW of output power while chirping at 5.2×10¹⁷ Hz/s.
B-2 Introduction
One reason fiber lasers are attractive is because of their large surface-to-volume ratio, which facilitates cooling. At the same time, because of a fiber laser’s small core size and long length, nonlinear effects occur more readily than in a rod or slab laser, for example. A well-known nonlinear effect that limits the power in fibers is SBS. The conventional method used to suppress SBS, white noise phase modulation, does not use the bandwidth in an efficient manner and in addition complicates phase sensitive applications such as coherent beam combining. Phase modulation also becomes a less effective means to suppress SBS in fiber as the delivery fiber increases in length. Chirping the frequency in a linear manner lends itself to phase sensitive applications because the phase varies in time in a very simple and deterministic way. In addition, at high chirp rates the SBS threshold becomes independent of the length of the delivery fiber.
B-3 Background
SBS builds from spontaneous Brillouin scattering of a laser photon from a thermal acoustic phonon in the fiber. This is an inelastic interaction, meaning there is an energy transfer that shifts the scattered photon up or down in energy by the acoustic frequency. Some of the spontaneously scattered photons will be guided in the forward or backward direction. At high enough forward laser power, the backward scattering process builds up to become stimulated. As the scattered photons propagate backward, they interact with the forward propagating beam, creating an interference pattern moving at the sound velocity. Through the phenomenon of electrostriction, the longitudinal intensity variation due to interference alters the density of the fiber. This causes a periodic modulation of the index that can scatter more of the forward propagating beam. As this cycle repeats, it will build up the intensity of the backward beam, which can become intense enough to damage the
17
laser source and limit the forward laser power. The scattered photons propagating in the forward direction do not see this amplification due to a lack of phase matching between the acoustic, laser, and Stokes waves. Our laser suppresses SBS by sweeping the laser frequency, this changes the resonant Brillouin frequency along the fiber for the backward propagating beam, preventing it from efficiently generating acoustic waves that can scatter more light. This is similar to having a broad linewidth laser that reduces the phase matching, thereby increasing the threshold for SBS. Our linear chirp occupies less bandwidth for the same threshold and can maintain a long effective coherence length because the very simple and deterministic frequency versus time relationship lends itself to coherent combining.
B-4 Experiment
Our chirped diode laser was developed jointly by Telaris and the group of Prof Amnon Yariv at Caltech. The vertical cavity surface emitting laser (VCSEL) at the heart of it was developed by Praevium, Inc. It can lase from 1000–1100 nm, depending on the position of an electronically controlled external mirror bonded to the laser. We make use of a 20-nm (5-THz) part of the spectrum that overlaps the gain in an ytterbium (Yb)-doped fiber. The laser diode frequency follows a triangle waveform in a highly linear fashion but must slow down as the chirp direction changes. A Mach-Zehnder interferometer is used to monitor the linearity of the chirp. The interferometer outputs a sinusoid with a single frequency, which signifies a linear chirp but during turning points this is not true. At these points, where the chirp rate can reach zero, SBS can build up to a point of tripping the laser’s interlock used to prevent any damages to the laser system. In the previous generation of chirped seed laser, we showed that this problem can be avoided by using a dual source to produce a seed that is constantly chirping. In our current setup, a broadband source is injected at the turning points via an electro-optic switch that alternates between the broadband source and the chirped diode laser. This setup then seeds a kilowatt fiber amplifier in a testbed at Nufern. The output beam is monitored by an optical power meter. A backward tap before the final stage is used to monitor all backward propagating power including SBS.
B-5 Measurement\Results
From previous experiments and simulation done by Eliot Petersen, it was shown that a chirp of 1×10¹⁷ Hz/s would be needed to reach 1 kW of output power (Fig. B-1). This chirp was obtained by placing the Praevium micro-electromechanical system (MEMS)-VCSEL in an opto-electronic feedback loop developed by Telaris.
18
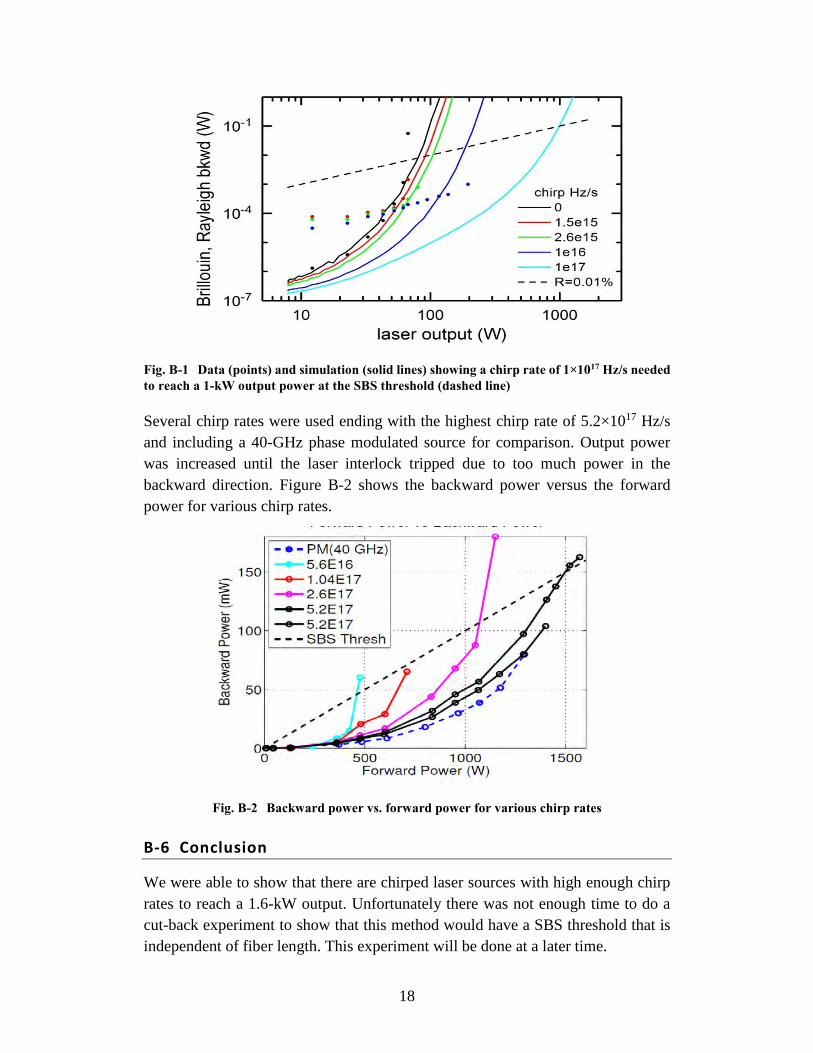
Fig. B-1 Data (points) and simulation (solid lines) showing a chirp rate of 1×10¹⁷ Hz/s needed to reach a 1-kW output power at the SBS threshold (dashed line)
Several chirp rates were used ending with the highest chirp rate of 5.2×10¹⁷ Hz/s and including a 40-GHz phase modulated source for comparison. Output power was increased until the laser interlock tripped due to too much power in the backward direction. Figure B-2 shows the backward power versus the forward power for various chirp rates.
Fig. B-2 Backward power vs. forward power for various chirp rates
B-6 Conclusion
We were able to show that there are chirped laser sources with high enough chirp rates to reach a 1.6-kW output. Unfortunately there was not enough time to do a cut-back experiment to show that this method would have a SBS threshold that is independent of fiber length. This experiment will be done at a later time.

19
Appendix C. Performance of Coherent Beam Combining and Power Usage in Fiber Laser Arrays with a High Fill-Factor Output,
by Brian Kwon, Jeffrey Volz, and Patrick Marple
20
C-1 Abstract
A study on the operation of a coherently combined fiber laser array in the far-field with respect to the near-field fill factor was performed. The experimental measurements for power output were performed for arrays with a variable number of beamlets and densely packed lenses with variable size and shape. A representative set of data was created using a single fiber laser and a single lens with interchangeable masks. By measuring the energy of the legs of the Gaussian beam and the total energy of the beam, we were able to deduct the percentage of energy truncated with each shape design and size. By analyzing the trends in output data resulting from variations in size and shape, a much more efficient cluster of lenses can be designed. It was found that the truncated power could be reduced together with an increase of radiation in the far-field. The results allow us to design high energy laser (HEL) transmitter arrays with a decrease in size and complexity and a reduction in truncated power inside the array.
C-2 Acknowledgments
We wish to acknowledge the mentorship of Dr Leonid A Beresnev and Dr Jony Jiang Liu. This work is supported by the High Energy Lasers Joint Technology Office (HEL-JTO) student program and the US Army Research Laboratory (ARL) summer internship program.
C-3 Student Bios
Brian Kwon is a graduate of The University of Delaware; Jeffrey Volz is a junior attending The University of Delaware, and Patrick Marple is a junior at the University of Maryland Baltimore County (UMBC). Kwon and Volz are computer engineering majors and Marple is an economics major. None have formal previous research experience. Kwon is to work for a cybersecurity company in New York City, Volz is working to finish his computer engineering degree, and Marple is working toward a systems engineering degree.
C-4 Introduction/Background
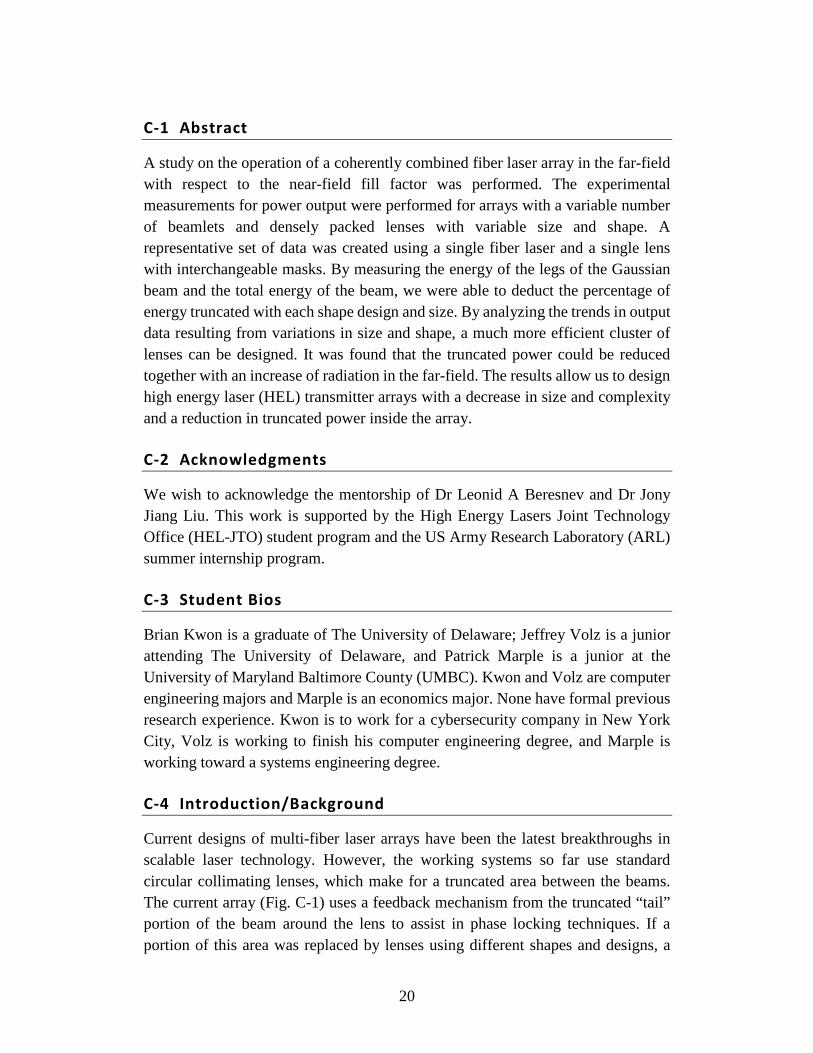
Current designs of multi-fiber laser arrays have been the latest breakthroughs in scalable laser technology. However, the working systems so far use standard circular collimating lenses, which make for a truncated area between the beams. The current array (Fig. C-1) uses a feedback mechanism from the truncated “tail” portion of the beam around the lens to assist in phase locking techniques. If a portion of this area was replaced by lenses using different shapes and designs, a
21
decrease in retained system power and overall increase in throughput of the system could be observed.
Fig. C-1 Current array (left) vs. experimental array (right)
Another problem presented is keeping the fiber stable so that it could be used on a moving vehicle. However, prototyping costs are high for small aluminum parts, thus a plastic 3-dimensional (3D) printer can be used for the creation of parts at a low cost and timely fashion.
C-5 Experiment/Calculations
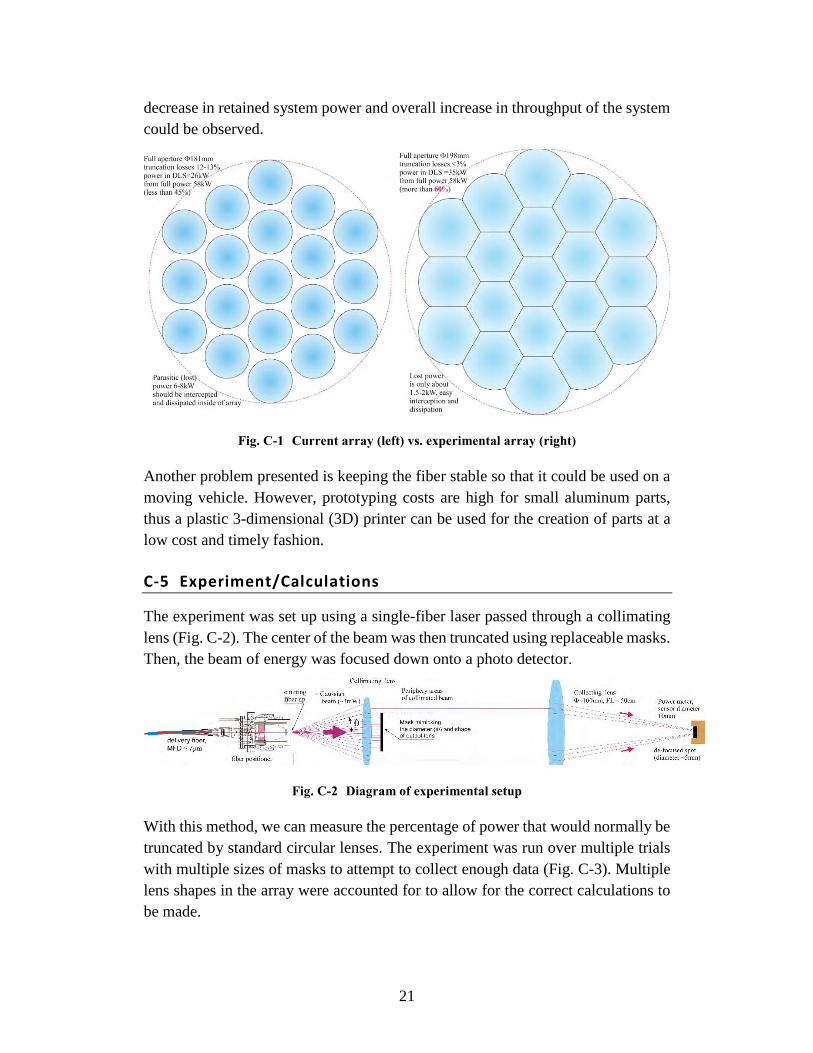
The experiment was set up using a single-fiber laser passed through a collimating lens (Fig. C-2). The center of the beam was then truncated using replaceable masks. Then, the beam of energy was focused down onto a photo detector.
Fig. C-2 Diagram of experimental setup
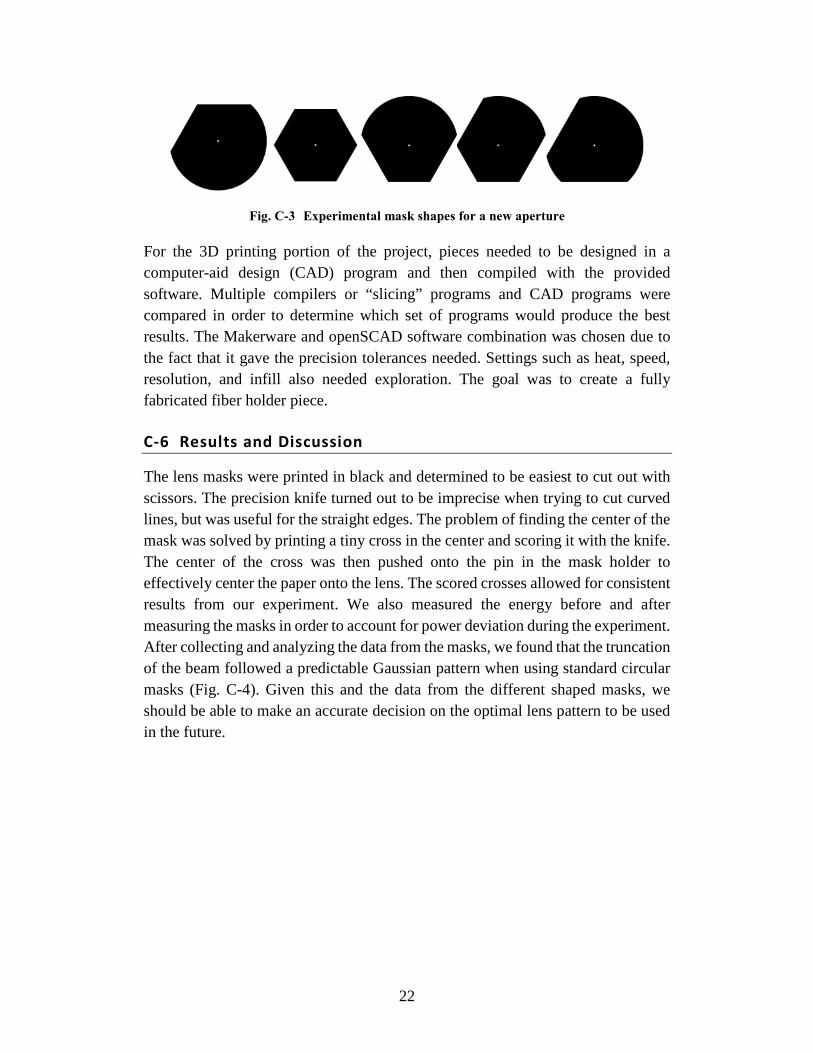
With this method, we can measure the percentage of power that would normally be truncated by standard circular lenses. The experiment was run over multiple trials with multiple sizes of masks to attempt to collect enough data (Fig. C-3). Multiple lens shapes in the array were accounted for to allow for the correct calculations to be made.
22
Fig. C-3 Experimental mask shapes for a new aperture
For the 3D printing portion of the project, pieces needed to be designed in a computer-aid design (CAD) program and then compiled with the provided software. Multiple compilers or “slicing” programs and CAD programs were compared in order to determine which set of programs would produce the best results. The Makerware and openSCAD software combination was chosen due to the fact that it gave the precision tolerances needed. Settings such as heat, speed, resolution, and infill also needed exploration. The goal was to create a fully fabricated fiber holder piece.
C-6 Results and Discussion
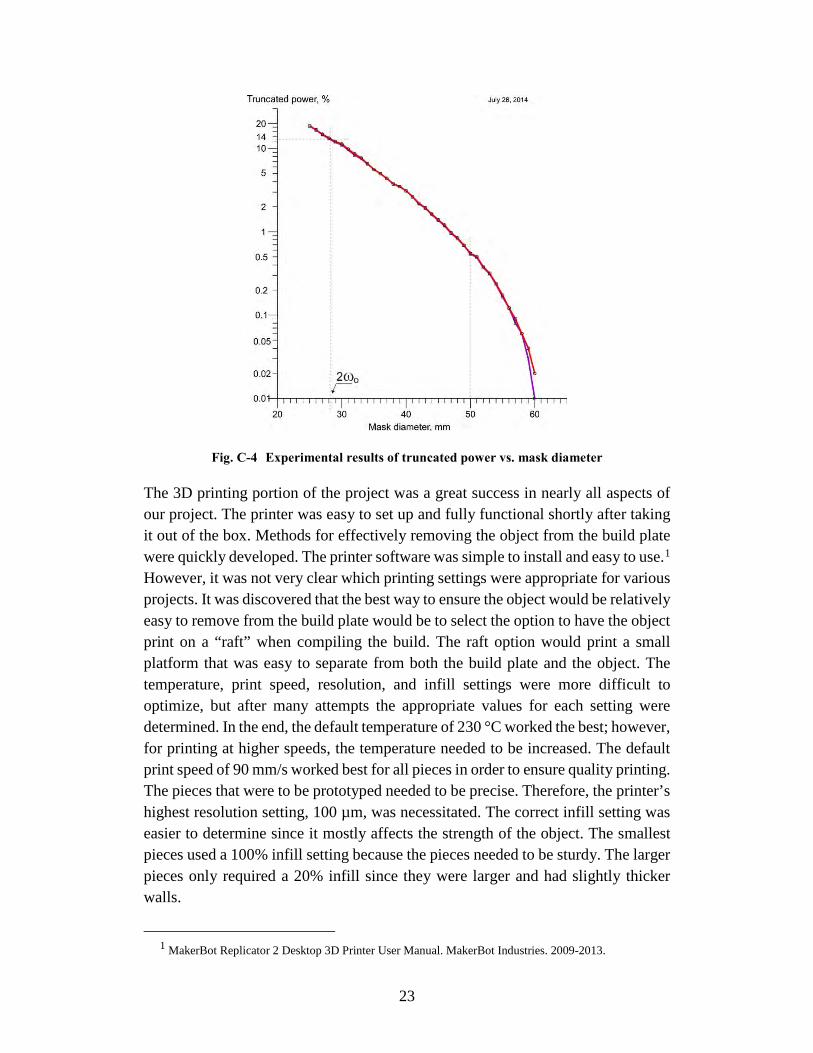
The lens masks were printed in black and determined to be easiest to cut out with scissors. The precision knife turned out to be imprecise when trying to cut curved lines, but was useful for the straight edges. The problem of finding the center of the mask was solved by printing a tiny cross in the center and scoring it with the knife. The center of the cross was then pushed onto the pin in the mask holder to effectively center the paper onto the lens. The scored crosses allowed for consistent results from our experiment. We also measured the energy before and after measuring the masks in order to account for power deviation during the experiment. After collecting and analyzing the data from the masks, we found that the truncation of the beam followed a predictable Gaussian pattern when using standard circular masks (Fig. C-4). Given this and the data from the different shaped masks, we should be able to make an accurate decision on the optimal lens pattern to be used in the future.
23
Fig. C-4 Experimental results of truncated power vs. mask diameter
The 3D printing portion of the project was a great success in nearly all aspects of our project. The printer was easy to set up and fully functional shortly after taking it out of the box. Methods for effectively removing the object from the build plate were quickly developed. The printer software was simple to install and easy to use.1 However, it was not very clear which printing settings were appropriate for various projects. It was discovered that the best way to ensure the object would be relatively easy to remove from the build plate would be to select the option to have the object print on a “raft” when compiling the build. The raft option would print a small platform that was easy to separate from both the build plate and the object. The temperature, print speed, resolution, and infill settings were more difficult to optimize, but after many attempts the appropriate values for each setting were determined. In the end, the default temperature of 230 °C worked the best; however, for printing at higher speeds, the temperature needed to be increased. The default print speed of 90 mm/s worked best for all pieces in order to ensure quality printing. The pieces that were to be prototyped needed to be precise. Therefore, the printer’s highest resolution setting, 100 µm, was necessitated. The correct infill setting was easier to determine since it mostly affects the strength of the object. The smallest pieces used a 100% infill setting because the pieces needed to be sturdy. The larger pieces only required a 20% infill since they were larger and had slightly thicker walls.
1 MakerBot Replicator 2 Desktop 3D Printer User Manual. MakerBot Industries. 2009-2013.
24
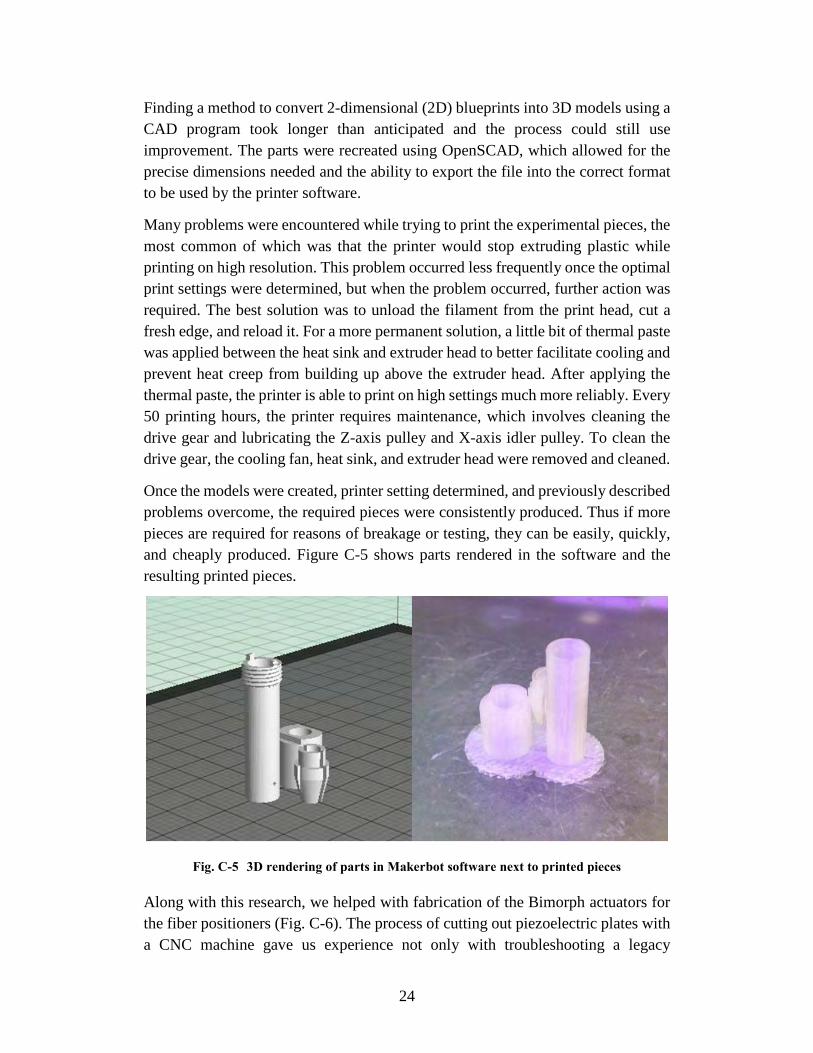
Finding a method to convert 2-dimensional (2D) blueprints into 3D models using a CAD program took longer than anticipated and the process could still use improvement. The parts were recreated using OpenSCAD, which allowed for the precise dimensions needed and the ability to export the file into the correct format to be used by the printer software.
Many problems were encountered while trying to print the experimental pieces, the most common of which was that the printer would stop extruding plastic while printing on high resolution. This problem occurred less frequently once the optimal print settings were determined, but when the problem occurred, further action was required. The best solution was to unload the filament from the print head, cut a fresh edge, and reload it. For a more permanent solution, a little bit of thermal paste was applied between the heat sink and extruder head to better facilitate cooling and prevent heat creep from building up above the extruder head. After applying the thermal paste, the printer is able to print on high settings much more reliably. Every 50 printing hours, the printer requires maintenance, which involves cleaning the drive gear and lubricating the Z-axis pulley and X-axis idler pulley. To clean the drive gear, the cooling fan, heat sink, and extruder head were removed and cleaned.
Once the models were created, printer setting determined, and previously described problems overcome, the required pieces were consistently produced. Thus if more pieces are required for reasons of breakage or testing, they can be easily, quickly, and cheaply produced. Figure C-5 shows parts rendered in the software and the resulting printed pieces.
Fig. C-5 3D rendering of parts in Makerbot software next to printed pieces
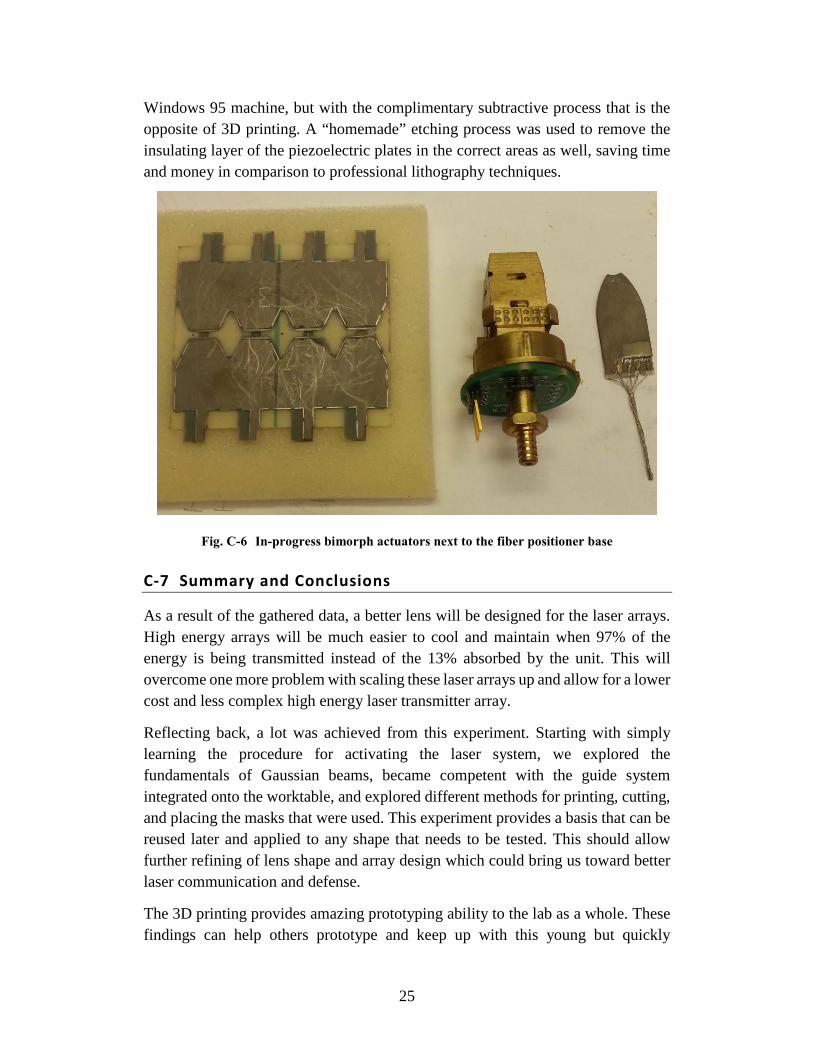
Along with this research, we helped with fabrication of the Bimorph actuators for the fiber positioners (Fig. C-6). The process of cutting out piezoelectric plates with a CNC machine gave us experience not only with troubleshooting a legacy
25
Windows 95 machine, but with the complimentary subtractive process that is the opposite of 3D printing. A “homemade” etching process was used to remove the insulating layer of the piezoelectric plates in the correct areas as well, saving time and money in comparison to professional lithography techniques.
Fig. C-6 In-progress bimorph actuators next to the fiber positioner base
C-7 Summary and Conclusions
As a result of the gathered data, a better lens will be designed for the laser arrays. High energy arrays will be much easier to cool and maintain when 97% of the energy is being transmitted instead of the 13% absorbed by the unit. This will overcome one more problem with scaling these laser arrays up and allow for a lower cost and less complex high energy laser transmitter array.
Reflecting back, a lot was achieved from this experiment. Starting with simply learning the procedure for activating the laser system, we explored the fundamentals of Gaussian beams, became competent with the guide system integrated onto the worktable, and explored different methods for printing, cutting, and placing the masks that were used. This experiment provides a basis that can be reused later and applied to any shape that needs to be tested. This should allow further refining of lens shape and array design which could bring us toward better laser communication and defense.
The 3D printing provides amazing prototyping ability to the lab as a whole. These findings can help others prototype and keep up with this young but quickly

26
developing technology. From here, we will work on detailed documentation to allow for easy use of the printer by staff. Further work could also involve experiments on the effectiveness of 3D printing on a 3D printer. This could significantly lower acquisition time and cost and allow for better pipelining of multi-part designs. Finally, one of the last things that could be accomplished is making the schematic to CAD process easier. This is probably the most challenging step with a new user, as hard coding the CAD models is necessary for precision. If a user-friendly interface could be made, we could have prewritten libraries and models with quick drag, drop, select, and modify options for specifying different tolerances and designs.

27
List of Symbols, Abbreviations, and Acronyms
2D 2-dimensional
3D 3-dimensional
Al aluminum
Al2O3 alumina
ARL US Army Research Laboratory
CAD computer-aid design
CISD Computational and Information Sciences Directorate
CQL College-Qualified Leaders
CSA chirped seed amplification
CW continuous wave
DE directed energy
DEPS Directed Energy Professional Society
EE electronic engineering
Er erbium
F-L Füchtbauer–Ladenburg
HEL-JTO High Energy Lasers Joint Technology Office
InGaAs indium gallium arsenide
IR infrared
MEMS microelectromechanical system
Nd neodymium
NPs nanoparticles
NRL US Naval Research Laboratory
O oxygen
PMT photomultiplier tube
SBS stimulated Brillouin scattering
SD solution-doping

28
SEDD Sensors and Electron Device Directorate
SiC silicon carbide
SiO2 silica
Ti:sapph titanium sapphire
UMBC University of Maryland Baltimore County
VCSEL vertical cavity surface emitting laser
YAG yttrium aluminum garnet
Yb ytterbium

29
1 DEFENSE TECHNICAL (PDF) INFORMATION CTR DTIC OCA 2 DIRECTOR (PDF) US ARMY RESEARCH LAB RDRL CIO LL IMAL HRA MAIL & RECORDS MGMT 1 GOVT PRINTG OFC (PDF) A MALHOTRA 1 DIRECTOR (PDF) US ARMY RESEARCH LAB RDRL SEE E J WHITE RDRL CIE S JONY JIANG LIU 1 HIGH ENERGY LASER JOINT TECHNOLOGY OFFICE (HEL-JTO) (PDF) H ACKERMANN

30
INTENTIONALLY LEFT BLANK.