Embed Size (px)
Citation preview
U.S. Algebra 1
Running head: U.S. ALGEBRA TEACHING AND LEARNING
U.S. Algebra Teaching and Learning Viewed Internationally
Jeremy Kilpatrick
University of Georgia
Vilma Mesa
University of Michigan
Finbarr Sloane
Arizona State University
U.S. Algebra 2
Abstract
We use data from Trends in International Mathematics and Science Study (TIMSS)
mathematics items to examine performance in elementary algebra in the United States from an
international perspective. U.S. eighth graders perform at about the same level in algebra as they
do across all domains of mathematics, but their average performance masks considerable
variation. Because of extensive tracking, some U.S. eighth graders are taking a full year of
algebra, and others are still studying arithmetic. Other countries appear to introduce ideas of
algebra somewhat earlier than the United States does, and they may be treating functions earlier
and more intensively as well. Using item data from TIMSS 1995, 1999, and 2003, we attempt to
uncover variations in performance and to interpret the variations in light of curricular and other
contextual information.
U.S. Algebra 3
U.S. Algebra Teaching and Learning Viewed Internationally
The college-preparatory high school curriculum in the United States is virtually unique in
devoting two or three yearlong courses to algebra, with geometry given a separate year of its
own. In other countries, students study algebra and geometry (and other areas of mathematics)
simultaneously, in either integrated mathematics courses or parallel strands.1
Better US mathematics students during high school years take separate courses in
geometry, pre-calculus, etc. In most TIMSS [Trends in Mathematics and Science
Study] countries, students take a course in mathematics—a course which may
include studying parts of advanced algebra, geometry, finite mathematics, and
calculus at the same time. They may take such courses for several years.2
In international curricula, therefore, mathematics is seen more as an integrated whole than as
subject matter that can be parsed by topic area without overt integration. This curricular parsing
is the same for weak and strong students in the United States. The integration is left up to the
student, a task many find difficult or fail to complete on their own.
Another distinguishing feature of the U.S. curriculum is that, until recently, school
algebra and geometry courses were seen as reserved for the elite—those heading for college—
and another set of courses, labeled with such terms as “general mathematics,” in which there was
almost no attention to algebra or geometry, was offered to everyone else. Consequently, algebra
has typically been seen by Americans as a subject beyond the capacity of the average high school
student.
1 Reys (2001, p. 255). 2 William H. Schmidt, “Are There Surprises in the TIMSS Twelfth Grade Results?” Press Statement by
William H. Schmidt, U.S. TIMSS National Research Coordinator, Michigan State University (http://ustimss.msu.edu/12gradepr.htm [February 1998]).
U.S. Algebra 4
In this paper, after a brief examination of sources of the nature and structure of the U.S.
algebra curriculum, we describe U.S. students’ performance in algebra through an analysis of
TIMSS items on which they did well and did poorly, first in absolute terms and then in
comparison with students in other countries. This description, which takes into account several
dimensions of the tasks, provides a picture of those aspects of algebra in which U.S. students, as
a whole, are strong or weak, and how their performance compares with that of students in other
countries. This knowledge, by revealing patterns of performance, can suggest areas that might
be the focus of curricular and instructional attention.
History of U.S. Algebra Courses
The layered course arrangement with tracking is a product of the history of college-
entrance requirements in the United States and has remained in place owing, in part, to the
absence of a national curriculum authority that might have mandated a different arrangement.
Arithmetic and geometry entered the Harvard curriculum during the 17th century and by the late
18th century had become lower-division (freshman or sophomore) courses, whereas algebra, a
relative newcomer, was being offered in the senior year.3 In 1787, Harvard reorganized its
curriculum to put arithmetic in the freshman year and “algebra and other branches of
mathematics”4 in the sophomore year. U.S. universities started requiring arithmetic for
admission, and some time before 1820, Harvard began to require algebra. Other universities
soon followed suit. Not until after the Civil War, however, was geometry required for entrance.
The order in which these mathematical subjects were first required for college entrance shaped,
and continues to shape, the college-preparatory courses offered in secondary school, with each
3 The U.S. undergraduate curriculum is a four-year curriculum: freshman, sophomore, junior, and senior. For a fuller account of the formation of the U.S. secondary school mathematics curriculum, see Stanic and Kilpatrick (1992).
4 Cajori (1890, p. 57).
U.S. Algebra 5
new requirement acting like a geological stratum laid down by natural forces and pressing the
courses required earlier into lower grades.
Despite repeated efforts to combine algebra, geometry, and other mathematics topics into
integrated mathematics courses, the U.S. first course in algebra—like the yearlong course in
geometry—has kept its title and much of its form.5 Positioned for more than a century in the
ninth grade, Algebra I recently began to move into the eighth grade,6 partly as a consequence of
research showing that other countries were offering more algebra earlier than the United States
was.
Nonetheless, it is still the case that although algebra and geometry are important elements
of the middle school curriculum in other TIMSS countries, U.S. middle schools tend to offer
these topics to relatively few students. “Compared to many other countries, the content taught at
grade 8 in the United States is similar to the content taught at grade 7 elsewhere, and the
performance expectations are lower in the United States.”7 The proportion of eighth graders
taking the National Assessment of Educational Progress (NAEP) mathematics assessment who
reported taking algebra rose from 20 percent in 1992 to 25 percent in 1996.8 In 2000, 31 percent
of eighth graders reported taking prealgebra, and 26 percent reported taking algebra.9
Although the number of students taking advanced high school mathematics courses
remains a minority, enrollments in such courses have grown rapidly. From 1982 to 1998, the
proportion of students taking mathematics courses beyond Geometry and Algebra II increased
5 Kilpatrick (1997). 6 Steen (1999) 7 Silver (1998, p. 3); see also Schmidt, Wang, and McKnight (2005). 8 U.S. Department of Education (1997, p. 17). 9 National Assessment Governing Board (2004, p. 10).
U.S. Algebra 6
from 26 percent of all high school graduates to 41 percent.10 By 2000, it was 45 percent.11 Such
growth suggests that the number of students beginning the study of algebra in eighth grade is
likely to continue to increase.
History of U.S. Approaches to School Algebra
School algebra in the United States has taken on a variety of forms even as it has
remained enshrined in separate yearlong courses. When it entered the high school curriculum,
algebra was largely an extension and generalization of school arithmetic. It was built up by
induction on a base of numerical quantities and operations on them. As the 19th century drew to
a close, school algebra, like other subjects, came under the influence of so-called faculty
psychology, which saw the mind as comprising separate faculties or powers. To exercise those
powers, students needed to drill and practice their algebraic skills, and teachers and textbook
writers were happy to provide ample opportunity for such activity. School algebra came to be
seen as a purely mathematical discipline, with little or no practical value.
Meanwhile, other countries, especially those in Europe, were being influenced by
developments in mathematics, and particularly by the proposal of the German mathematician
Felix Klein to use the function concept as a basis for developing not simply algebra but the entire
secondary mathematics curriculum. The function concept had some advocates in the United
States, but it was very much a minor influence. Algebra as generalized arithmetic was the
mainstream approach until the new math movement began to influence the U.S. curriculum in
the early 1960s. Algebra was only then recast as a more abstract subject, with functions playing
a central role and using definitions based on set theory.
10 Wirt and others (2002, p. 85). 11 Wirt and others (2004, p. 70).

U.S. Algebra 7
Recent developments in the U.S. school mathematics curriculum suggest that an
approach to algebra as the study and use of functions rather than as simply equation solving and
manipulation of expressions may be gaining ground.12 The approach, however, is different from
the set-theoretical approach taken during the new math era. Functions are introduced as rules for
connecting one number to another, with equations used to model sets of data for the purpose of
solving problems. This new approach makes heavy use of technology, especially to capitalize on
its ability to manipulate linked tabular, symbolic, and graphical representations of functions.
Students can work with complicated equations that would be difficult, if not impossible, to
represent or solve using paper and pencil alone. This modeling approach to algebra, although
growing, is still very much a minor theme in U.S. school mathematics.
U.S. Students’ Performance in Algebra
Evidence from a variety of national and international assessments suggests that, in
general, U.S. students perform at about the same level in algebra as they do in other domains of
mathematics. The evidence from TIMSS 1995, 1999, and 2003 suggests as well that their
performance in algebra (on items classified as algebra or at fourth grade as patterns, functions,
and relations) is about average compared with that of students in other countries. Their
performance in algebra contrasts with their performance in geometry and measurement, which
has tended to be weaker than that of students in other countries, and in probability and statistics,
which has tended to be stronger.13 From 1999 to 2003, U.S. eighth graders gained significantly,
12 See, for example, Star, Herbel-Eisenmann, and Smith (2000). 13 This claim is based on analyses by Mary M. Lindquist and Jeremy Kilpatrick for the National Council of
Teachers of Mathematics that were posted anonymously on the NCTM Web site immediately after each release of TIMSS data from the 1995, 1999, and 2003 assessments (e.g., see http://www.nctm.org/news/releases/1996/timss_eighth_grade.htm). See also Bybee and others (2005) and Ginsburg and others (2005).
U.S. Algebra 8
on average, in their performance on TIMSS items classified as dealing with algebra and with
data.14
U.S. students’ average level of performance, however, masks considerable variation, in
large part because of the extensive tracking already noted. Some U.S. eighth graders, for
example, are taking a full year of algebra, whereas others are still studying arithmetic.15 Below
we report the results of analyses of TIMSS data that attempt to uncover and disentangle some
facets of U.S. students’ performance in algebra.
Item Characteristics
Most of our discussion is based on item data, which requires that we identify TIMSS
items that appear to be related to algebra and algebraic thinking. We have also attempted to
characterize the thinking those items entail.
Content and Representation Classification
In selecting TIMSS items for analysis, we attended to two dimensions: the algebra-
related content knowledge that the item seemed to demand and the representations used in
presenting the item and solving the problem. To determine the content, we examined the items
classified by TIMSS as either “algebra” or “patterns, relations, and functions.” To make a finer
classification, we used a scheme developed for National Assessment of Educational Progress
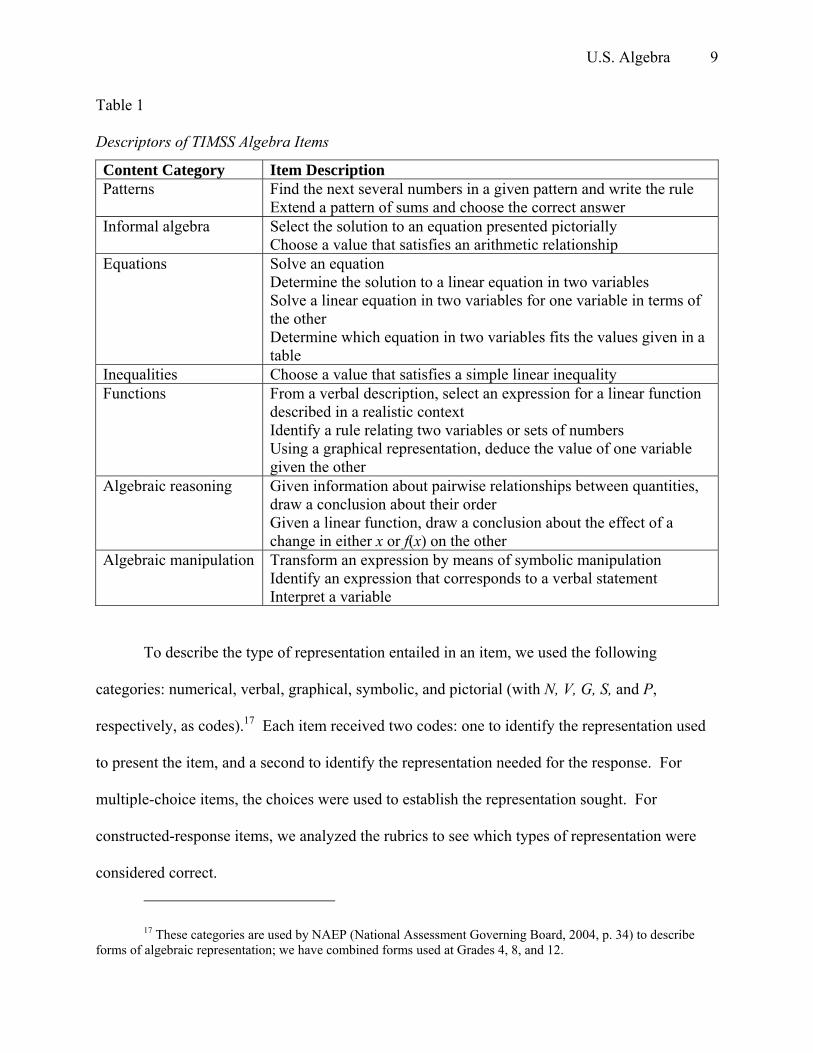
(NAEP)16 items and added the category “algebraic manipulation” (see Table 1 for a description).
_________________________________________________________________
Insert Table 1 about here
_________________________________________________________________
14 Gonzales and others (2004, p. 10). 15 Kilpatrick, Swafford, and Findell (2001, p. 280). 16 See Kilpatrick and Gieger (2000). The classification was created for an analysis of items from a special
NAEP study of eighth graders who were taking or had taken algebra.
U.S. Algebra 9
Table 1
Descriptors of TIMSS Algebra Items
Content Category Item Description Patterns Find the next several numbers in a given pattern and write the rule
Extend a pattern of sums and choose the correct answer Informal algebra Select the solution to an equation presented pictorially
Choose a value that satisfies an arithmetic relationship Equations Solve an equation
Determine the solution to a linear equation in two variables Solve a linear equation in two variables for one variable in terms of the other Determine which equation in two variables fits the values given in a table
Inequalities Choose a value that satisfies a simple linear inequality Functions From a verbal description, select an expression for a linear function
described in a realistic context Identify a rule relating two variables or sets of numbers Using a graphical representation, deduce the value of one variable given the other
Algebraic reasoning Given information about pairwise relationships between quantities, draw a conclusion about their order Given a linear function, draw a conclusion about the effect of a change in either x or f(x) on the other
Algebraic manipulation Transform an expression by means of symbolic manipulation Identify an expression that corresponds to a verbal statement Interpret a variable
To describe the type of representation entailed in an item, we used the following
categories: numerical, verbal, graphical, symbolic, and pictorial (with N, V, G, S, and P,
respectively, as codes).17 Each item received two codes: one to identify the representation used
to present the item, and a second to identify the representation needed for the response. For
multiple-choice items, the choices were used to establish the representation sought. For
constructed-response items, we analyzed the rubrics to see which types of representation were
considered correct.
17 These categories are used by NAEP (National Assessment Governing Board, 2004, p. 34) to describe forms of algebraic representation; we have combined forms used at Grades 4, 8, and 12.
U.S. Algebra 10
Cognitive Demand
In addition to using content and representation characteristics, we classified items in
terms of cognitive demand using the notion of content-process space.18 Originally designed to
classify assessment items in science, this framework attempts to describe knowledge that is
meaningfully organized—that is, knowledge that employs four cognitive activities: problem
representation (using underlying principles and relevant concepts), strategy use (efficient,
informative, and goal oriented), self-monitoring (ongoing and flexible), and explanation
(principled and coherent).19 Although every task in an assessment does not necessarily have all
four characteristics, an examination of the affordances (action possibilities) of each task allows
one to determine how demanding it is in terms of the quality of the content addressed and the
type of processes required.
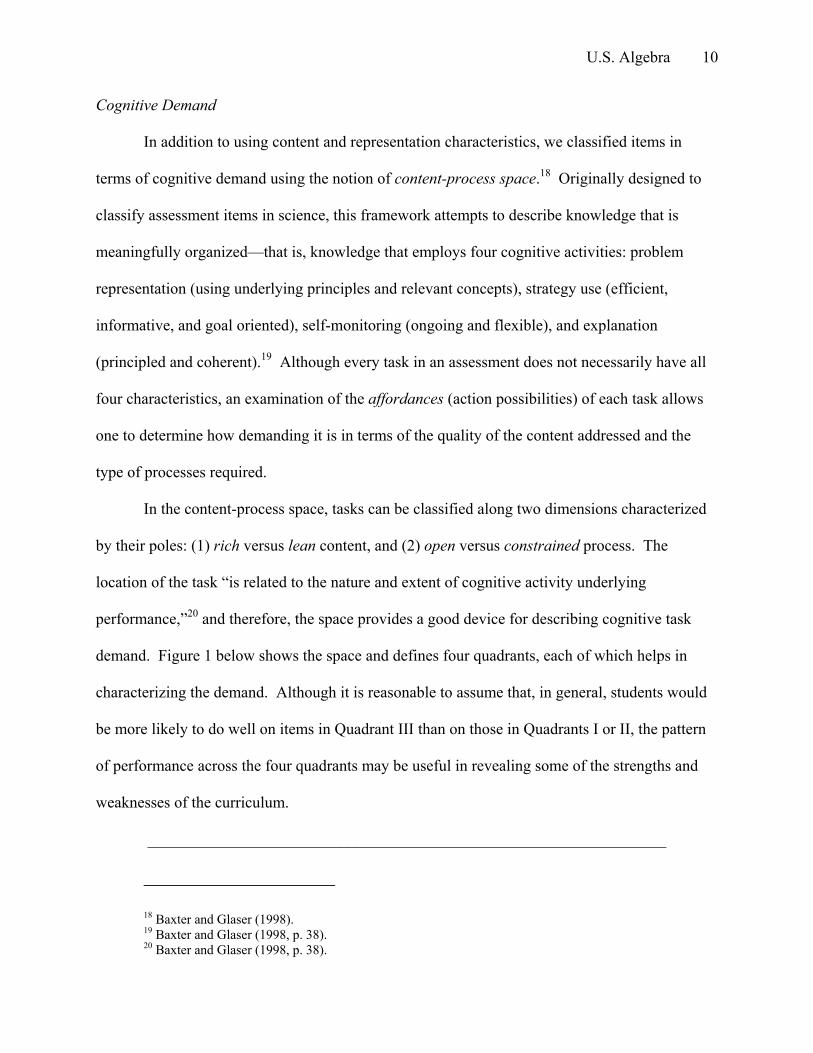
In the content-process space, tasks can be classified along two dimensions characterized
by their poles: (1) rich versus lean content, and (2) open versus constrained process. The
location of the task “is related to the nature and extent of cognitive activity underlying
performance,”20 and therefore, the space provides a good device for describing cognitive task
demand. Figure 1 below shows the space and defines four quadrants, each of which helps in
characterizing the demand. Although it is reasonable to assume that, in general, students would
be more likely to do well on items in Quadrant III than on those in Quadrants I or II, the pattern
of performance across the four quadrants may be useful in revealing some of the strengths and
weaknesses of the curriculum.
_________________________________________________________________
18 Baxter and Glaser (1998). 19 Baxter and Glaser (1998, p. 38). 20 Baxter and Glaser (1998, p. 38).
U.S. Algebra 11
Insert Figure 1 about here
_________________________________________________________________
Content dimension
Quadrant II: Activities that are rich in content but more process constrained—tend to measure specific content in particular settings
Rich Quadrant I: Activities that are rich in content and open in process—tend to be complex open-ended tasks that require extensive mobilization of information
Process dimension
Constrained Quadrant III: Activities that are lean in content and process constrained—tend to assess factual knowledge
OpenQuadrant IV: Activities that are lean in content with a more open process—tend to assess originality or creativity Lean
Figure 1. Content-process space (Baxter and Glaser, 1998).
Absolute Performance
In a first look at U.S. students’ performance, we consider just those algebra items that at
least 75 percent of the students got correct, and then those that no more than 25 percent got
correct, quite apart from how students in other countries did on the items.21
High-Performance Items (p ≥ .75)
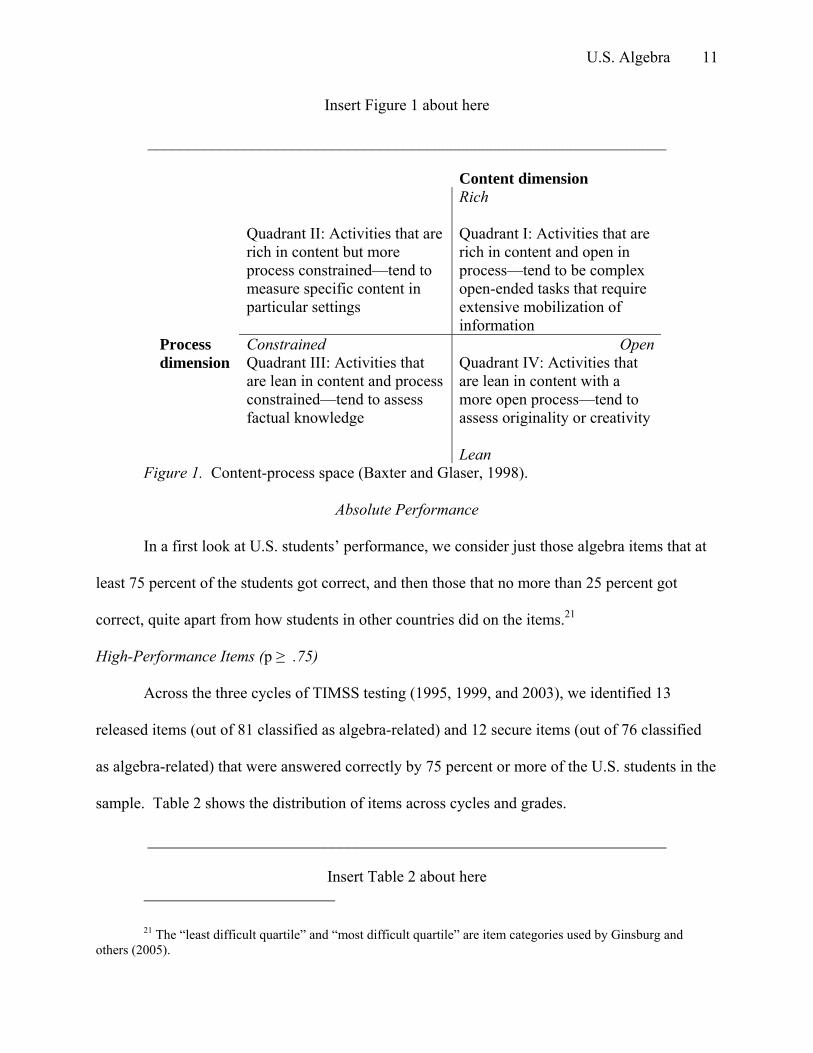
Across the three cycles of TIMSS testing (1995, 1999, and 2003), we identified 13
released items (out of 81 classified as algebra-related) and 12 secure items (out of 76 classified
as algebra-related) that were answered correctly by 75 percent or more of the U.S. students in the
sample. Table 2 shows the distribution of items across cycles and grades.
_________________________________________________________________
Insert Table 2 about here
21 The “least difficult quartile” and “most difficult quartile” are item categories used by Ginsburg and others (2005).
U.S. Algebra 12
_________________________________________________________________
Table 2
Distribution of TIMSS High-Performance Algebra Items (p ≥ .75)
Grade 1995 1999 2003 Total Released Items 4 1 - 3 4 8 2 4 2 8 12 1 - - 1 Secure Items 4 1 - 3 4 8 2 1 5 8 12 0 - - 0
Low-Performance Items (p ≤ .25)
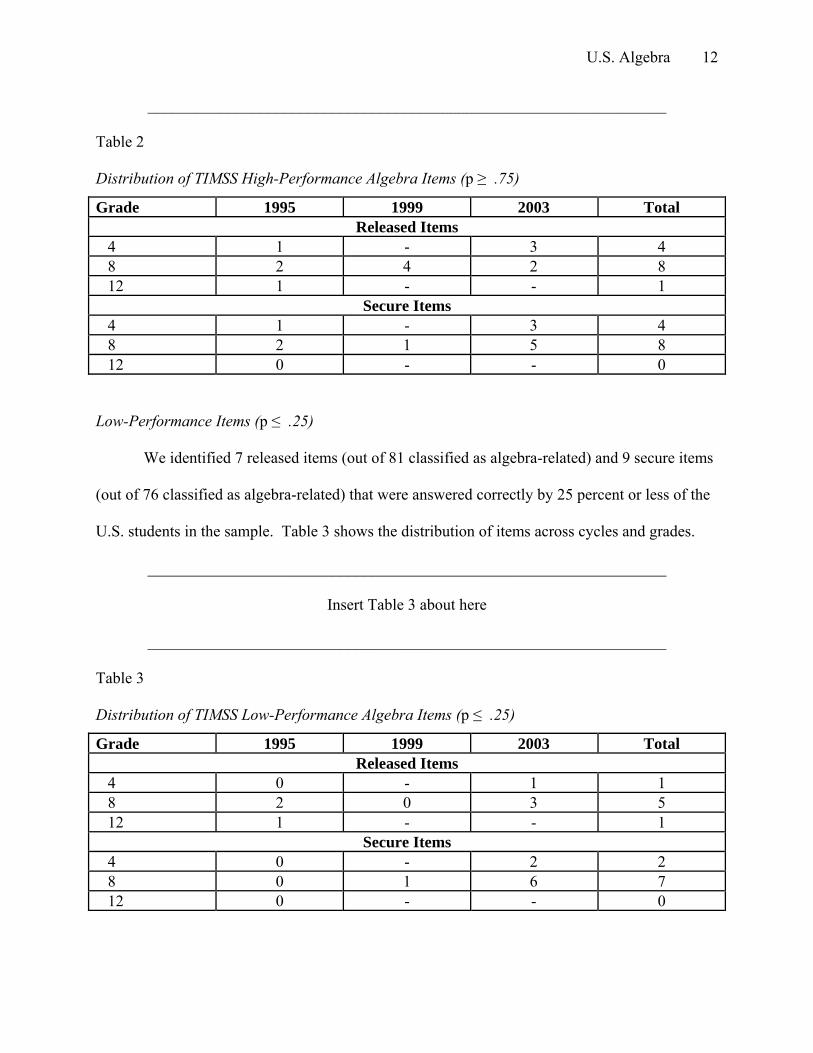
We identified 7 released items (out of 81 classified as algebra-related) and 9 secure items
(out of 76 classified as algebra-related) that were answered correctly by 25 percent or less of the
U.S. students in the sample. Table 3 shows the distribution of items across cycles and grades.
_________________________________________________________________
Insert Table 3 about here
_________________________________________________________________
Table 3
Distribution of TIMSS Low-Performance Algebra Items (p ≤ .25)
Grade 1995 1999 2003 Total Released Items 4 0 - 1 1 8 2 0 3 5 12 1 - - 1 Secure Items 4 0 - 2 2 8 0 1 6 7 12 0 - - 0
U.S. Algebra 13
Below we discuss, for each TIMSS cycle, the content and representation of the released
items for which performance was high, followed by their cognitive demand. We then do the
same for those released items for which performance was low. We tried as best we could to
categorize and analyze the secure items using item descriptions alone to see if performance on
them followed the same patterns as on the released items, but we eventually decided that the
results were too speculative to report here. Therefore, the analyses described here draw on the
released items only. We present these analyses in the chronological order of the TIMSS cycles
(1995, 1999, and 2003).
High-Performance Items
1995 Items
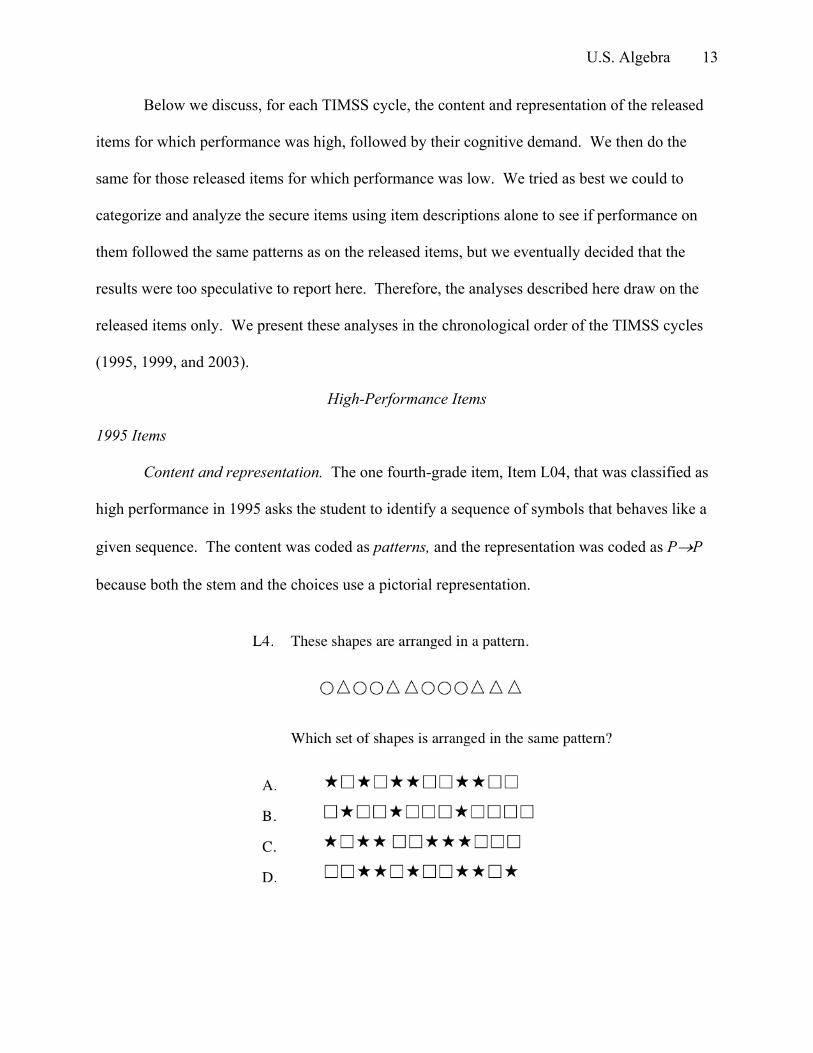
Content and representation. The one fourth-grade item, Item L04, that was classified as
high performance in 1995 asks the student to identify a sequence of symbols that behaves like a
given sequence. The content was coded as patterns, and the representation was coded as P→P
because both the stem and the choices use a pictorial representation.
U.S. Algebra 14
The two high-performance eighth-grade items in 1995 were also patterns items, both of
which were also administered to fourth graders. Item L13 is the same as Item L04 above.
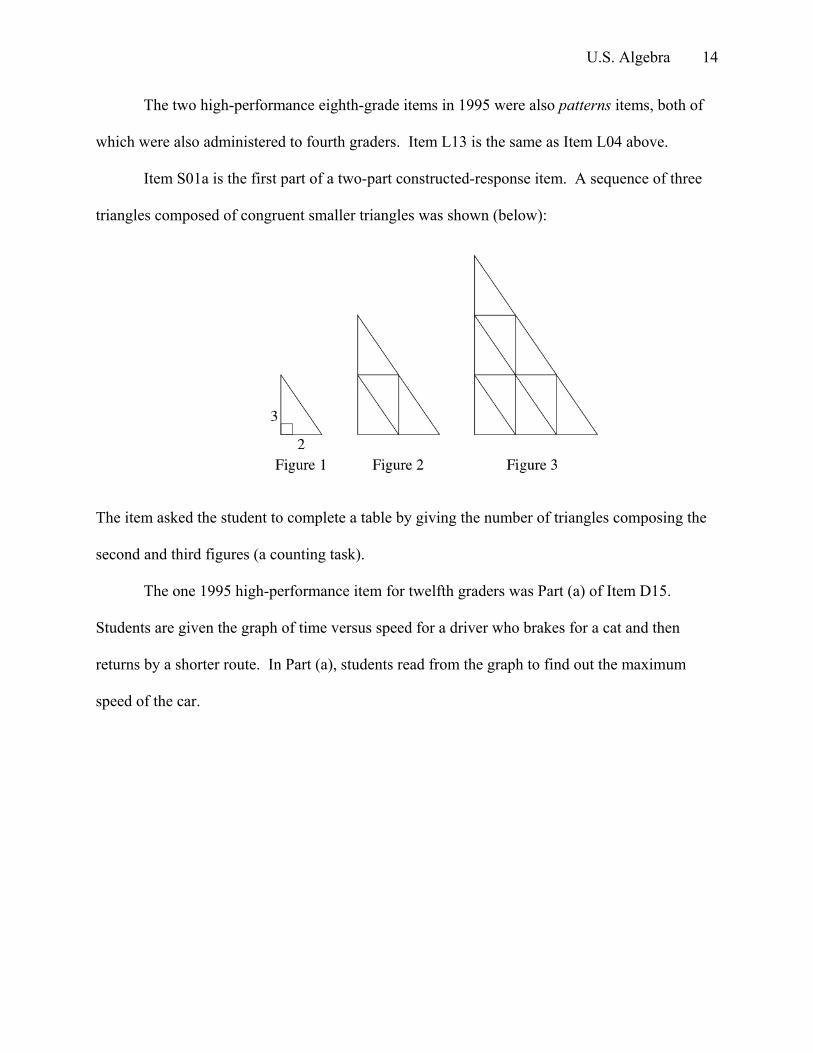
Item S01a is the first part of a two-part constructed-response item. A sequence of three
triangles composed of congruent smaller triangles was shown (below):
The item asked the student to complete a table by giving the number of triangles composing the
second and third figures (a counting task).
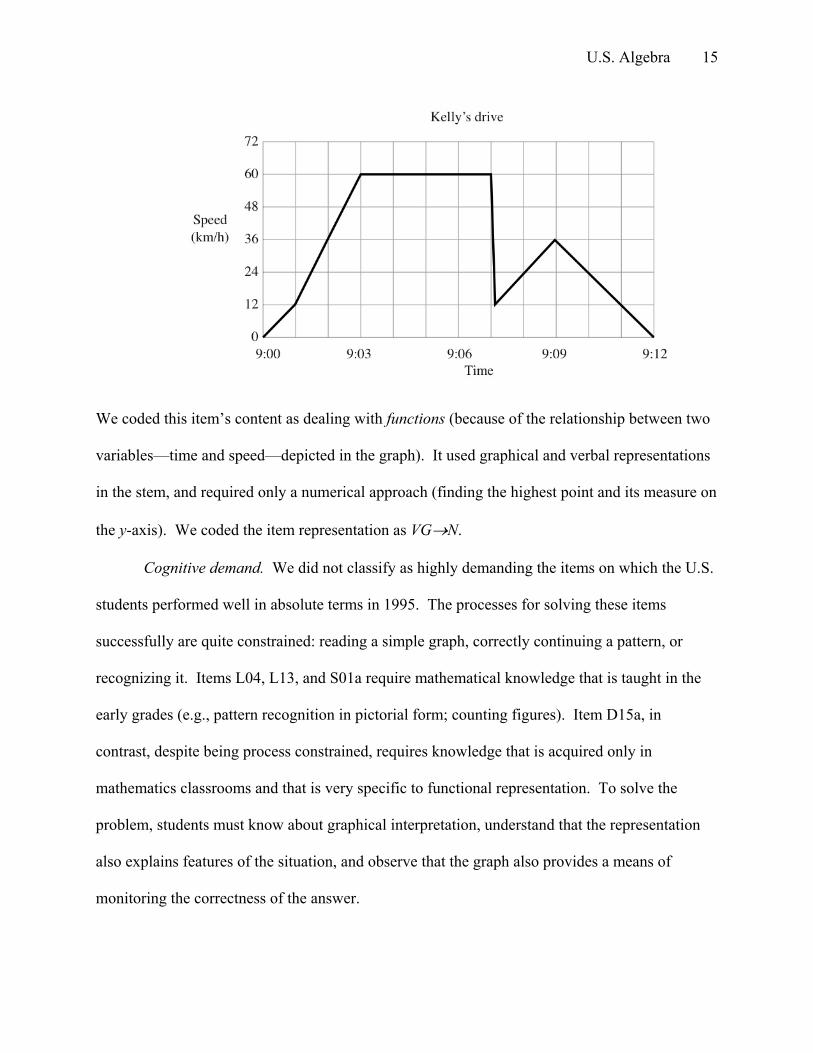
The one 1995 high-performance item for twelfth graders was Part (a) of Item D15.
Students are given the graph of time versus speed for a driver who brakes for a cat and then
returns by a shorter route. In Part (a), students read from the graph to find out the maximum
speed of the car.
U.S. Algebra 15
We coded this item’s content as dealing with functions (because of the relationship between two
variables—time and speed—depicted in the graph). It used graphical and verbal representations
in the stem, and required only a numerical approach (finding the highest point and its measure on
the y-axis). We coded the item representation as VG→N.
Cognitive demand. We did not classify as highly demanding the items on which the U.S.
students performed well in absolute terms in 1995. The processes for solving these items
successfully are quite constrained: reading a simple graph, correctly continuing a pattern, or
recognizing it. Items L04, L13, and S01a require mathematical knowledge that is taught in the
early grades (e.g., pattern recognition in pictorial form; counting figures). Item D15a, in
contrast, despite being process constrained, requires knowledge that is acquired only in
mathematics classrooms and that is very specific to functional representation. To solve the
problem, students must know about graphical interpretation, understand that the representation
also explains features of the situation, and observe that the graph also provides a means of
monitoring the correctness of the answer.
U.S. Algebra 16
1999 Items
Content and representation. In 1999, at least 75 percent of U.S. students—all in the
eighth-grade population, the only populated assessed—gave a correct response to four released
items (as shown in Table 2). Two of the items, B12 and H12, have the same descriptions as two
eighth-grade secure items from 1995.22 Item B12 in 1999 makes a statement about n (When n is
multiplied by 7, and 6 is then added, the result is 41) and asks students to choose the
equation that represents the relation. Item H12 provides a situation in words that needs to be
modeled with an arithmetic expression (□ represents the number of magazines Lina reads
each week), and students are asked to choose the expression that represents the total number of
magazines she reads in 6 weeks. The choices are arithmetic expressions with □ as an operand.
Both items use a verbal representation for the statement, but H12 requires recognizing a pre-
symbolic representation (□ instead of x). We classified the representations of both, however, as
V→S. The other two high-performance items in 1999 correspond to identifying a number that
satisfies a proportionality relationship (Item D8: The ratio of 7 to 13 is the same as the ratio
of x to 52; what is x?) and identifying a symbolic expression for n × n × n (Item P9).
Altogether, the 1999 items on which the US students performed well deal with basic
algebraic situations in which students use notions from elementary algebraic for the solution.
These items tend to involve symbolic representations of verbally presented situations.
Cognitive demand. In terms of content, the high-performance 1999 items require the use
of knowledge that is taught in the middle grades, with the exception perhaps of item H12, which
seeks an arithmetic expression that might well have been encountered in the earlier grades. In
terms of complexity, Item D8 is probably the most demanding of the group; it involves the use of
22 The items have the same IDs as the 1995 items and are likely to be identical to their secure counterparts in view of the TIMSS policy of writing new items and releasing some secure items for each successive cycle.
U.S. Algebra 17
multiplicative reasoning, which is known to be a difficult conceptual transition for students.23
The other items ask students to identify a model that matches a given statement, but in Item D8
students might perform any of a number of procedures to get the answer (e.g., use the “rule of
three,” identify that 52 is obtained by multiplying 13 by 4 and then multiply 7 by 4, or write an
equation and then cross multiply and simplify). The process in D8, therefore, is less constrained
than in the other items.
2003 Items24
Content and representation. In 2003, there were three high-performance items at fourth
grade (Table 2): Items M03_11, M04_04, and M04_05. Item M03_11 asked students to give the
three numbers that continue the pattern 100, 1, 99, 2, 98, __, __, __.
Item M04_04 gives students a table with three times at which a movie starts. The student
is asked to find the start time for the fourth show assuming that the pattern continues.
Item M04_05 presents a situation verbally (“Ali had 50 apples. He sold some and
then had 20 left”). The student is asked to identify the expression (with □ for the unknown
number of apples sold) that fits the situation. Note that this item is essentially parallel to Item
H12 (Lina’s magazines) described above
The two eighth-grade high-performance items in 2003 (Table 2) were M01_10 and
M03_01. In Item M01_10, the student is given an equation—12/n = 36/21—and asked to
determine the value of n.
23 Vergnaud (1994). 24 In 2003, there was a strong position effect for some TIMSS items because they appeared in different
positions in the booklets. “Some students in all countries did not reach all the items in the third block position, which was the end of the first half of each booklet before the break. The same effect was evident for the sixth block position, which was the last block in the booklets.” Mullis, Martin, and Diaconu (2004, p. 248). Items in the third and sixth block positions were treated in TIMSS scale analyses as if they were unique, but we were advised not to include those items in our study. Personal communication from Joe Galia, TIMSS & PIRLS International Study Center, Boston College, October 11, 2006.
U.S. Algebra 18
Item M03_01 presents a graph of time versus distance for two hikers. The student was
asked to find the time at which the two hikers meet, given that they started from the same place
and headed in the same direction.
Cognitive demand. Like the 1995 items, the 2003 released high-performance items
mainly addressed elementary notions of patterns and pre-symbolization work. Unlike the 1999
items, they did not include algebraic manipulation. As before, the fourth-grade items were less
demanding than the eighth-grade items. The 2003 items required factual knowledge for which
instruction was necessary (e.g., for dealing with an equation with fractions in which one
denominator is unknown, for interpreting a graph, for operating with time). There were at least
two ways by which students could solve Item M01_10: by cross-multiplying or by using a
multiplicative argument. Because of these two possibilities, we considered the item to be less
process constrained than the other four.
Summary of High-Performance Items
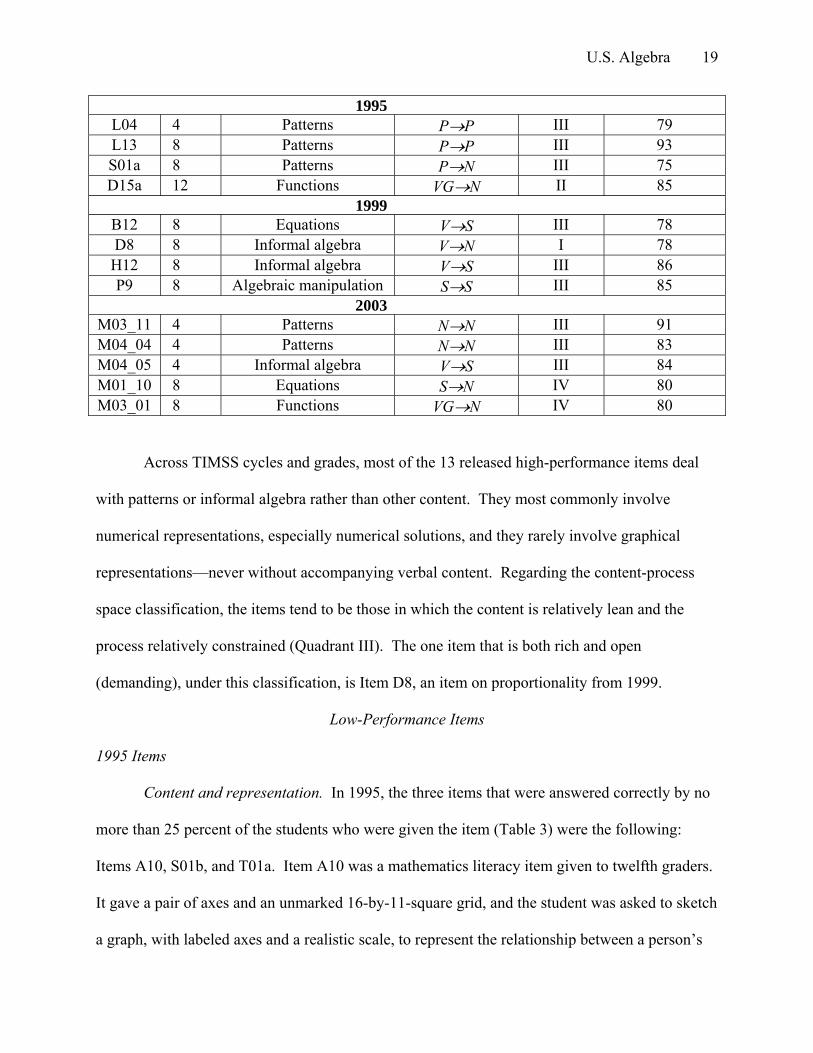
Table 4 provides summary data on the four released high-performance items in 1995, the
four in 1999, and the five in 2003. For each item, we provide the item number and the grade at
which it was administered. We also provide our classification of the item content, the item
representation, and the quadrant of the item’s cognitive demand. Finally, we give the percent
correct for U.S. students given the item.
_________________________________________________________________
Insert Table 4 about here
_________________________________________________________________
Table 4
Summary Data on Released High-Performance Items for Each TIMSS Cycle
Item Grade Content Representation Quadrant U.S. %Correct
U.S. Algebra 19
1995 L04 4 Patterns P→P III 79 L13 8 Patterns P→P III 93 S01a 8 Patterns P→N III 75 D15a 12 Functions VG→N II 85
1999 B12 8 Equations V→S III 78 D8 8 Informal algebra V→N I 78 H12 8 Informal algebra V→S III 86 P9 8 Algebraic manipulation S→S III 85
2003 M03_11 4 Patterns N→N III 91 M04_04 4 Patterns N→N III 83 M04_05 4 Informal algebra V→S III 84 M01_10 8 Equations S→N IV 80 M03_01 8 Functions VG→N IV 80
Across TIMSS cycles and grades, most of the 13 released high-performance items deal
with patterns or informal algebra rather than other content. They most commonly involve
numerical representations, especially numerical solutions, and they rarely involve graphical
representations—never without accompanying verbal content. Regarding the content-process
space classification, the items tend to be those in which the content is relatively lean and the
process relatively constrained (Quadrant III). The one item that is both rich and open
(demanding), under this classification, is Item D8, an item on proportionality from 1999.
Low-Performance Items
1995 Items
Content and representation. In 1995, the three items that were answered correctly by no
more than 25 percent of the students who were given the item (Table 3) were the following:
Items A10, S01b, and T01a. Item A10 was a mathematics literacy item given to twelfth graders.
It gave a pair of axes and an unmarked 16-by-11-square grid, and the student was asked to sketch
a graph, with labeled axes and a realistic scale, to represent the relationship between a person’s
U.S. Algebra 20
height and age from birth to age 30. The rubric looked for correct labeling of axes, sensible
scales, and an adequate growth curve in terms of the two variables.
Items S01b and T01a were eighth-grade items. We noted above that U.S. students did
very well on Part (a) of S01 (which required the student to count the small triangles composing a
larger triangle). In Part (b) of Item S01, the student is asked to extend the pattern and determine
the number of small triangles in the eighth triangle in the sequence. The rubric does not indicate
that the student needed to come up with a formula for the number of triangles, nor does it suggest
that the student use an iterative process to arrive at the solution.
Item T01a asked the student to solve a word problem involving apples in boxes: There
are 54 kilograms of apples in two boxes. The second box of apples weighs 12 kilograms
more than the first. How many kilograms of apples are in each box? Although the
students could have used some symbolic manipulation, the rubric did not suggest that as a
possibility.
Cognitive demand. A major difference between Item A10 and Item D15 (the high-
performance twelfth-grade item from 1995 given and discussed above) is that in Item A10 the
student had to produce a graph for the situation, a much more difficult task than simply reading
the graph.25 Although the functional relation—that is, that height increases with age—may not
be necessarily acquired in a mathematics class, the techniques and processes for creating a
representation of the problem are. The process for arriving at a particular graph may be limited
to recalling milestones or turning points in growth and plotting them on the graph
Similarly, the difference between Items S01a and S01b resides in the extension of the
sequence of triangles in Item S01b to a step in which the student should either formulate a
25 Kilpatrick, Swafford, and Findell (2001, p. 290).
U.S. Algebra 21
general rule or develop a strategy for systematically counting the triangles at each step. The item
can be conceived of as testing the relationship between area and length in similar figures:
Altering the lengths of a figure by a factor a affects the area of the resulting similar figure by a
factor of a2. The item can also be conceived of as being about summing the elements in a
sequence in which each new figure increases the number of small triangles by an odd number:
a1 = 1, a2 = 1 + 3; a3 = 1 + 3 + 5; so the item might be testing whether students could demonstrate
that Σ i = 1, n (2i − 1) = n2 and find the result for n = 8. Students might know this relationship
already, and then the process would be direct recall. Or in the absence of such knowledge,
students might simply calculate each term up to the eighth. The item can also be interpreted as
involving a straightforward pattern table in which each second term is the first term squared.
Which path a student took might depend on many circumstances. The TIMSS rubric suggests
that the important aspect was the final response (64). Because the item requires understanding
principles governing these figures, it is a relatively rich, and the process is less constrained than
in Part (a).
Item T01a requires the identification of the two variables (the number of kilograms in
each box) and taking into account the constraints on them (altogether there are 54kg, and the
difference is 12kg). To respond correctly to the item, a student must know that the two variables
are related. The item has the form of a classic problem: The sum of two numbers is a; the
difference is b; what are the numbers? Independently of whether students choose to represent
the variables with a symbol (e.g., x and y), they know that the combined weight is 54 (or x + y =
54). They also know that one box weighs more than the other (y = x + 12). Thus, 2x + 12 = 54,
or x = 21, and therefore, y = 33. Another approach consists of assuming that the two boxes
weighed the same (27kg). Because the difference in weights is 12, 6 kg need to be taken from
U.S. Algebra 22
one box and put into the other; thus there will be 27 − 6 = 21kg in one box and 27 + 6 = 33kg in
the other. A student might also use trial and error; that is, looking at how 54 can be decomposed
into two integers and taking the pair whose difference is 12 (of course, that process can also be
modeled with symbols). These approaches require a level of sophistication that is probably
beyond most students. The item also asks students to show work, which only adds to its
complexity. The TIMSS rubric credits only the final numerical response as correct and penalizes
students when no explanation is provided.
1999 Items
There were no released items in 1999 on which the performance of U.S. students was low
(Table 3).
2003 Items
Content and representation. There were four released items in 2003 to which no more
than 25 percent of U.S. students responded correctly (Table 3). One item, Item M09_04, was
given to fourth graders. It reads as follows:
37 × □ = 703. What is the value of 37 × □ + 6?
The other three low-performance items were given to eighth graders. In Item M04_01,
the student is given an equation for determining the sum of three consecutive even numbers that
add to 84—k + (k + 2) + (k + 4) = 84—and is asked what k represents. The choices are the
following: the least of the three numbers, the middle number, the greatest number, or the
average.
Item M04_10c is Part (c) of an item containing three figures: The first is a square with a
diagonal forming 2 triangles; the second is a square whose sides are twice as long and which
U.S. Algebra 23
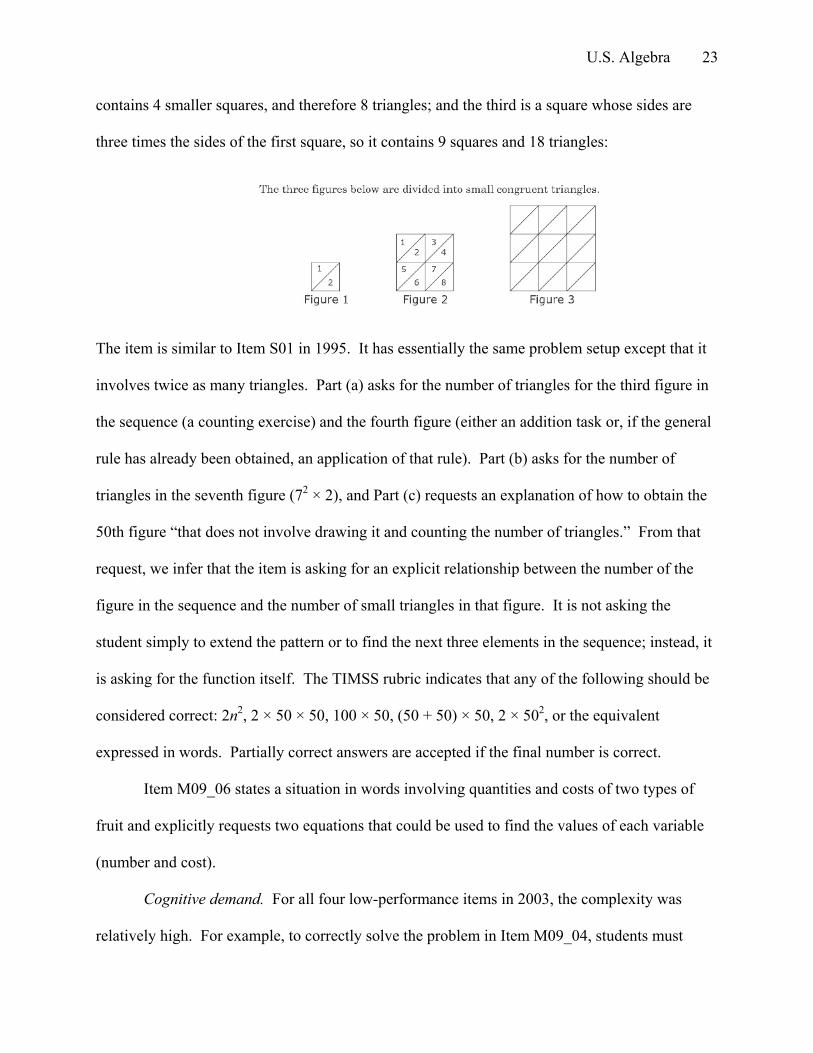
contains 4 smaller squares, and therefore 8 triangles; and the third is a square whose sides are
three times the sides of the first square, so it contains 9 squares and 18 triangles:
The item is similar to Item S01 in 1995. It has essentially the same problem setup except that it
involves twice as many triangles. Part (a) asks for the number of triangles for the third figure in
the sequence (a counting exercise) and the fourth figure (either an addition task or, if the general
rule has already been obtained, an application of that rule). Part (b) asks for the number of
triangles in the seventh figure (72 × 2), and Part (c) requests an explanation of how to obtain the
50th figure “that does not involve drawing it and counting the number of triangles.” From that
request, we infer that the item is asking for an explicit relationship between the number of the
figure in the sequence and the number of small triangles in that figure. It is not asking the
student simply to extend the pattern or to find the next three elements in the sequence; instead, it
is asking for the function itself. The TIMSS rubric indicates that any of the following should be
considered correct: 2n2, 2 × 50 × 50, 100 × 50, (50 + 50) × 50, 2 × 502, or the equivalent
expressed in words. Partially correct answers are accepted if the final number is correct.
Item M09_06 states a situation in words involving quantities and costs of two types of
fruit and explicitly requests two equations that could be used to find the values of each variable
(number and cost).
Cognitive demand. For all four low-performance items in 2003, the complexity was
relatively high. For example, to correctly solve the problem in Item M09_04, students must
U.S. Algebra 24
understand that the equal sign is bidirectional and that an equation relates two objects. They also
must know that to maintain the equation, what one does on one side must be done on the other
side, which indicates that, in this case, the answer should be 703 + 6. At a grade—in this case,
fourth grade—in which most of the students’ arithmetical work deals with operations, the
transition to a conception of the equal sign as representing the same quantities is difficult.26
Arithmetic and arithmetic sentences are very much involved with doing—with processes
associated with operating on numbers. Moving towards a more static view of the equal sign and
seeing expressions linked by that sign as forming an equation constitute a major step toward
conceptualizing equations as objects
Item M04_01 is an unusual item that asks students to consider a symbolic expression and
decide on the meaning of the variable. A more common item would have asked the student to
find the three numbers, not to give the meaning of the variable. The item draws on students’
knowledge of the meaning of algebraic symbols and knowledge of their relation to expressions
and equations. That is knowledge for which instruction is necessary, and it requires familiarity
with problem representation, but the process is constrained.
The remaining two items, Items M04_10 (sequence of triangles) and M09_06 (number
and cost), require more substantial knowledge. Both are constructed-response items and give
students the opportunity to select the process by which they will respond. The first item asks for
an explanation of how to find a number, and the second asks for two equations that fit a given
situation. Both require the coordination of basic knowledge and principles.
26 Kieran (1981).
U.S. Algebra 25
Summary of Low-Performance Items
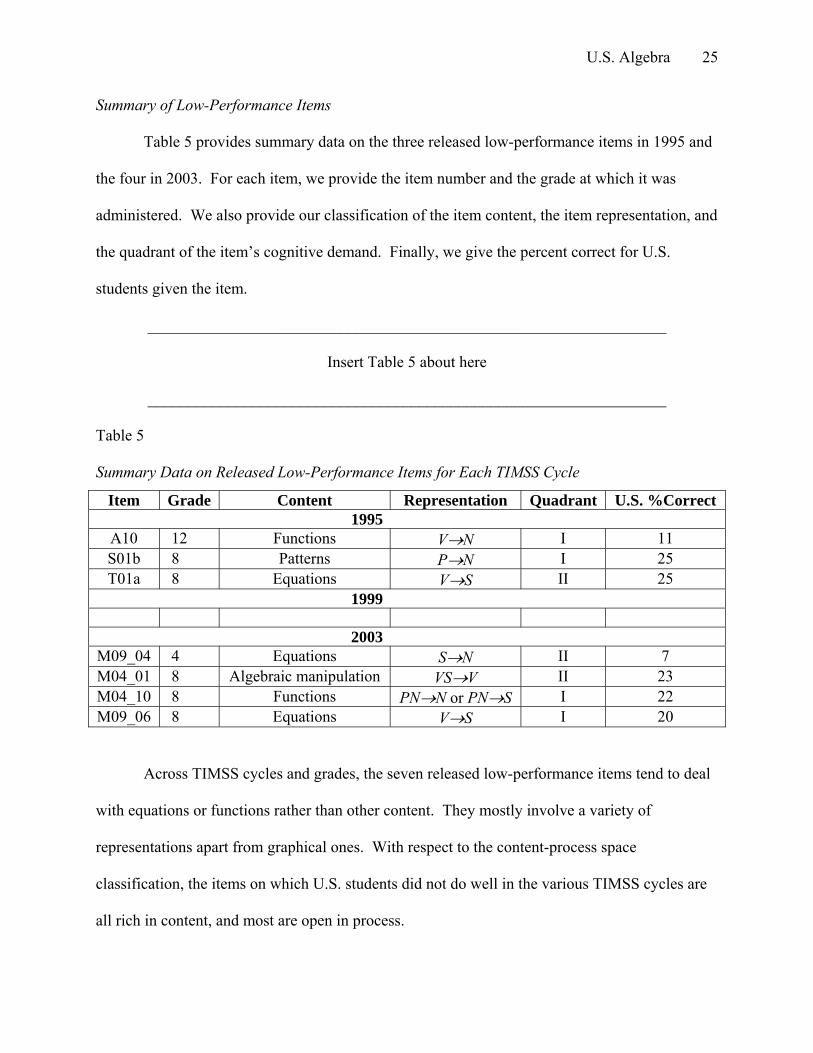
Table 5 provides summary data on the three released low-performance items in 1995 and
the four in 2003. For each item, we provide the item number and the grade at which it was
administered. We also provide our classification of the item content, the item representation, and
the quadrant of the item’s cognitive demand. Finally, we give the percent correct for U.S.
students given the item.
_________________________________________________________________
Insert Table 5 about here
_________________________________________________________________
Table 5
Summary Data on Released Low-Performance Items for Each TIMSS Cycle
Item Grade Content Representation Quadrant U.S. %Correct 1995
A10 12 Functions V→N I 11 S01b 8 Patterns P→N I 25 T01a 8 Equations V→S II 25
1999 2003
M09_04 4 Equations S→N II 7 M04_01 8 Algebraic manipulation VS→V II 23 M04_10 8 Functions PN→N or PN→S I 22 M09_06 8 Equations V→S I 20
Across TIMSS cycles and grades, the seven released low-performance items tend to deal
with equations or functions rather than other content. They mostly involve a variety of
representations apart from graphical ones. With respect to the content-process space
classification, the items on which U.S. students did not do well in the various TIMSS cycles are
all rich in content, and most are open in process.
U.S. Algebra 26
Whether an item is responded to correctly by at least 75 percent of U.S. students or by no
more than 25 percent, however, tells only part of the story of their performance in algebra. Even
when U.S. students showed high levels of performance, students in other countries often
outperformed them, and when U.S. students showed low levels of performance, students in other
countries performed about the same as or did not do as badly as their U.S. peers. We turn now to
the analysis of relative performance.
Relative Performance
To analyze performance across TIMSS 1995, 1999, and 2003, we chose a set of systems
representing comparably developed countries that participated in TIMSS and for which we had
complete data. The following countries, all of which are members of the Organisation for
Economic Cooperation and Development (OECD), met the criteria for participation: For 1995
and 1999, the countries were Australia, Canada, the Czech Republic, Hungary, the Netherlands,
New Zealand, and the United States. For 2003, Ontario and Quebec participated as separate
systems; they replaced Canada and the Czech Republic.
Relative-High-Performance Items
We considered the United States to have high performance on an item when it ranked
first or second among the seven OECD countries. Across the three cycles, we identified 11
released items (out of 81 classified as algebra-related) and 9 secure items (out of 76 classified as
algebra-related) in which the performance of U.S. students ranked first or second. As before,
although we looked at performance on the secure items, we do not discuss it here. Table 6 shows
the distribution of the 20 items across cycles and grades.
_________________________________________________________________
Insert Table 6 about here
U.S. Algebra 27
_________________________________________________________________
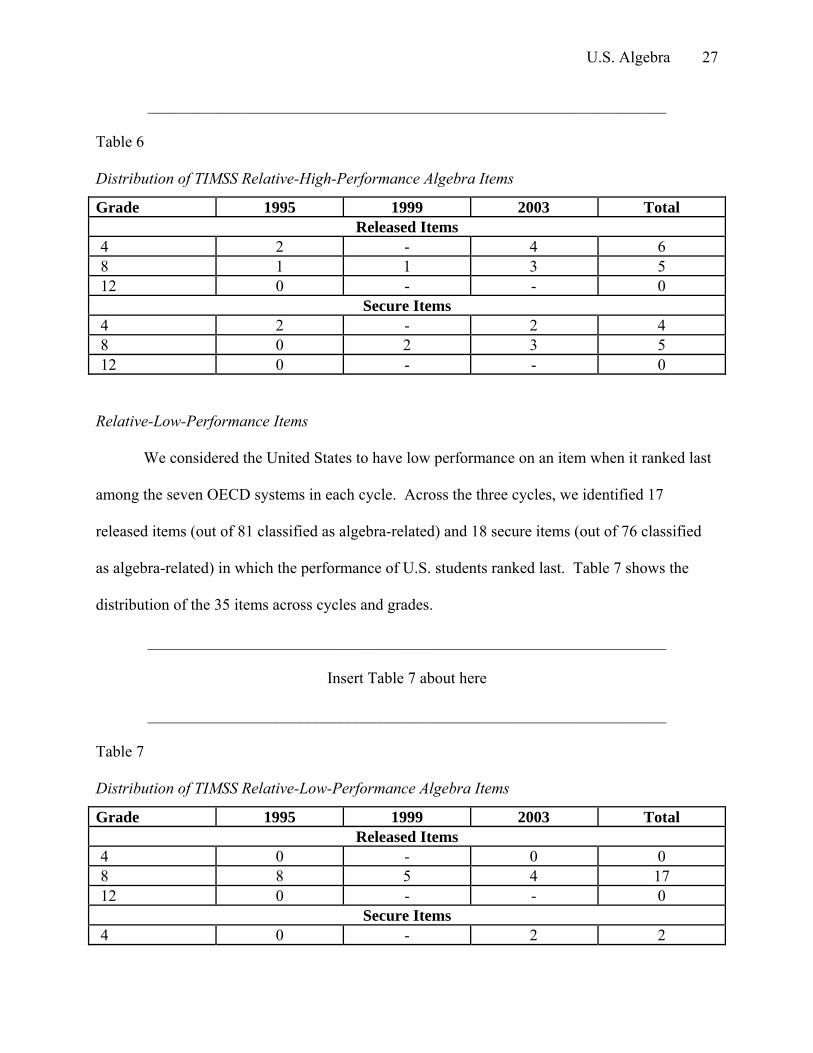
Table 6
Distribution of TIMSS Relative-High-Performance Algebra Items
Grade 1995 1999 2003 Total Released Items 4 2 - 4 6 8 1 1 3 5 12 0 - - 0 Secure Items 4 2 - 2 4 8 0 2 3 5 12 0 - - 0
Relative-Low-Performance Items
We considered the United States to have low performance on an item when it ranked last
among the seven OECD systems in each cycle. Across the three cycles, we identified 17
released items (out of 81 classified as algebra-related) and 18 secure items (out of 76 classified
as algebra-related) in which the performance of U.S. students ranked last. Table 7 shows the
distribution of the 35 items across cycles and grades.
_________________________________________________________________
Insert Table 7 about here
_________________________________________________________________
Table 7
Distribution of TIMSS Relative-Low-Performance Algebra Items
Grade 1995 1999 2003 Total Released Items 4 0 - 0 0 8 8 5 4 17 12 0 - - 0 Secure Items 4 0 - 2 2
U.S. Algebra 28
8 3 4 7 14 12 2 - - 2
Below we discuss, for each TIMSS cycle, the content, representation, and cognitive
demand of the released items for which performance was relatively high. We then do the same
for those released items for which performance was relatively low.
Relative-High-Performance Items
1995 Items
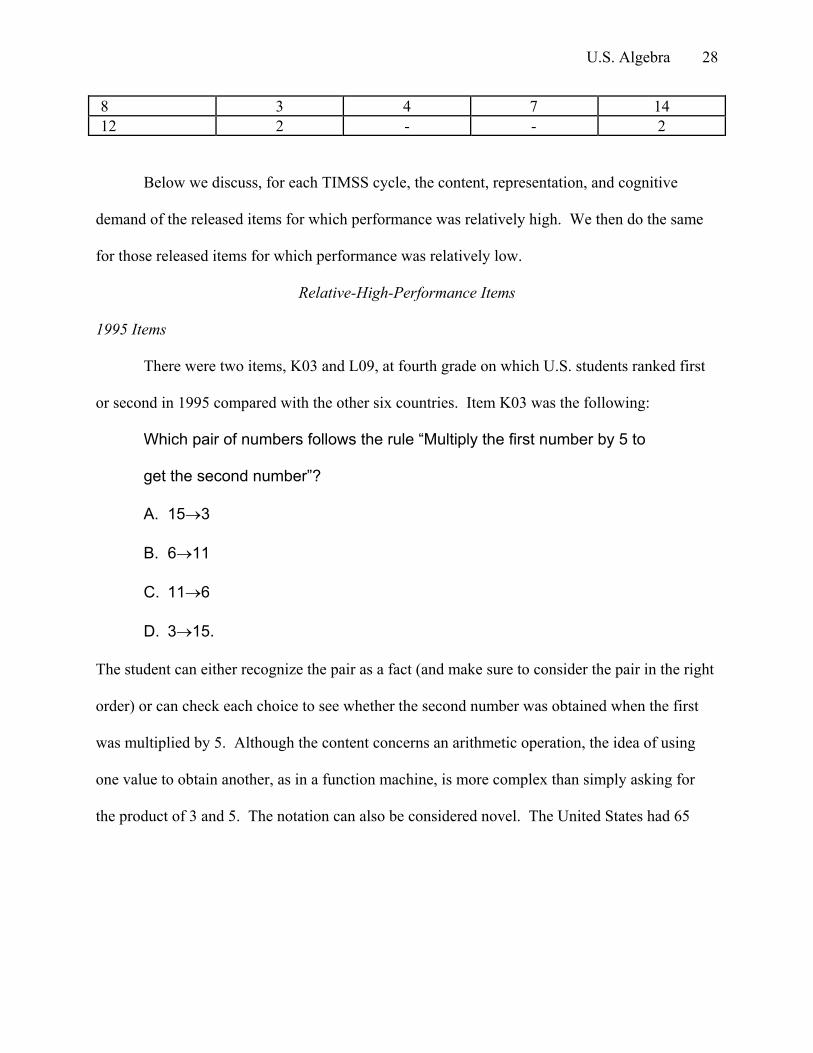
There were two items, K03 and L09, at fourth grade on which U.S. students ranked first
or second in 1995 compared with the other six countries. Item K03 was the following:
Which pair of numbers follows the rule “Multiply the first number by 5 to
get the second number”?
A. 15→3
B. 6→11
C. 11→6
D. 3→15.
The student can either recognize the pair as a fact (and make sure to consider the pair in the right
order) or can check each choice to see whether the second number was obtained when the first
was multiplied by 5. Although the content concerns an arithmetic operation, the idea of using
one value to obtain another, as in a function machine, is more complex than simply asking for
the product of 3 and 5. The notation can also be considered novel. The United States had 65
U.S. Algebra 29
percent of its fourth graders responding correctly, which was just behind Hungary, which had 68
percent correct. That difference,27 however, is not statistically significant (z = .92, p > .05).
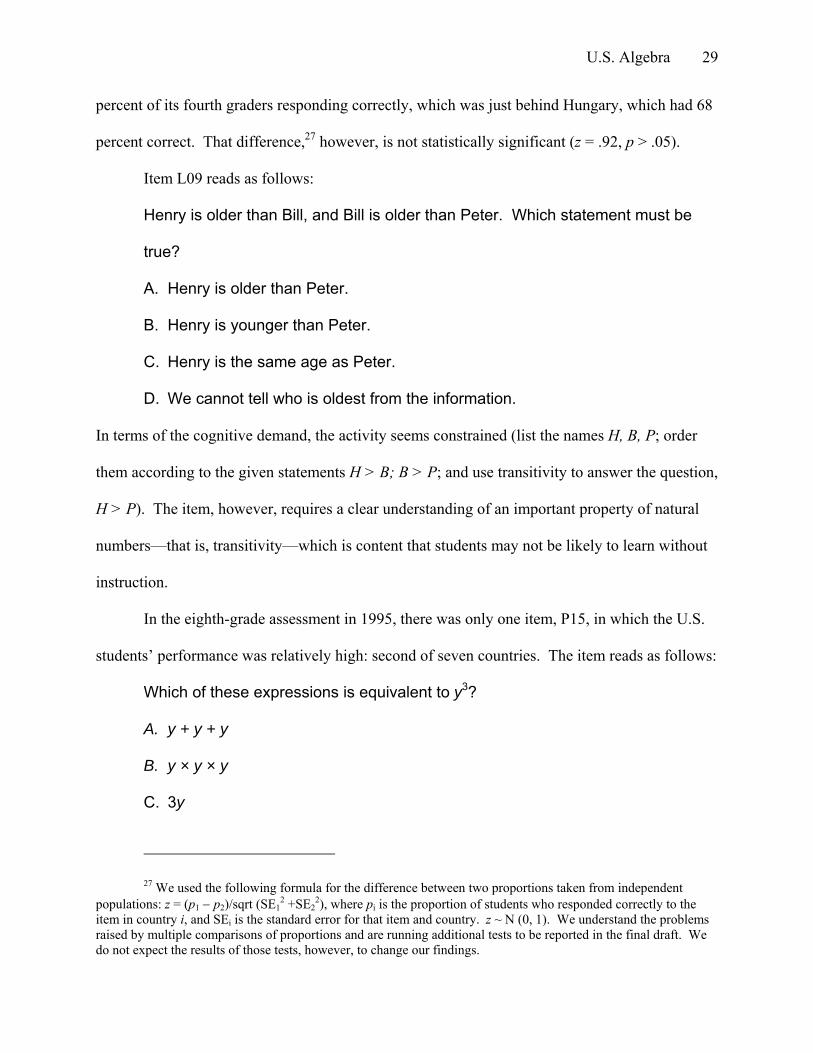
Item L09 reads as follows:
Henry is older than Bill, and Bill is older than Peter. Which statement must be
true?
A. Henry is older than Peter.
B. Henry is younger than Peter.
C. Henry is the same age as Peter.
D. We cannot tell who is oldest from the information.
In terms of the cognitive demand, the activity seems constrained (list the names H, B, P; order
them according to the given statements H > B; B > P; and use transitivity to answer the question,
H > P). The item, however, requires a clear understanding of an important property of natural
numbers—that is, transitivity—which is content that students may not be likely to learn without
instruction.
In the eighth-grade assessment in 1995, there was only one item, P15, in which the U.S.
students’ performance was relatively high: second of seven countries. The item reads as follows:
Which of these expressions is equivalent to y3?
A. y + y + y
B. y × y × y
C. 3y
27 We used the following formula for the difference between two proportions taken from independent populations: z = (p1 − p2)/sqrt (SE1
2 +SE22), where pi is the proportion of students who responded correctly to the
item in country i, and SEi is the standard error for that item and country. z ~ N (0, 1). We understand the problems raised by multiple comparisons of proportions and are running additional tests to be reported in the final draft. We do not expect the results of those tests, however, to change our findings.
U.S. Algebra 30
D. y2 + y
1999 Items
There was only one relative-high-performance item in 1999, Item P09 (discussed above
in the section on absolute performance). Like all the items in that assessment cycle, it was given
to eighth graders only.
2003 Items
There were seven released items for which the performance of U.S. students ranked first
or second among the seven systems in 2003: Items M01_12, M03_11, M04_04, and M04_05 at
fourth grade; and Items M01_12, M04_04, and M09_05 at eighth grade.
In the fourth-grade item M01_12, students are given a sentence in words about the
number of magazines a child reads in a week, and the item asks students to select the expression
that would give the number of magazines read in 6 weeks. The item uses a verbal representation
in stating the task, but requires the use of semi-symbolic expression (□) and various operations
with 6 for the answer. The process is constrained, and students need to use some arithmetic
reasoning to select the appropriate equation. Item M03_11 was the number pattern item given to
fourth graders that was discussed in the section on absolute performance, as were Items M04_04,
the item containing a table of movie start times, and Item M04_05 (Ali’s apples).
Item M01_12, one of the three items given to eighth graders in 2003 on which U.S.
students’ performance was relatively high, reads as follows:
If x = -3, what is the value of -3x?
A. -9
B. -6
C. -1
U.S. Algebra 31
D. 1
E. 9
The process used to solve the item is constrained (direct substitution), but the content—
manipulation of negative numbers and substitution of a variable that takes a negative value into
an expression that has a negative sign (therefore changing the sign of the expression)—makes it
require the mobilization of important underlying principles.
Item M04_04 is another 2003 item for which the performance of U.S. eighth graders was
relatively high. The item reads as follows:
The numbers in the sequence 7, 11, 15, 19, 23, … increase by four. The
numbers in the sequence 1, 10, 19, 28, 37, … increase by nine. The
number 19 is in both sequences. If the two sequences are continued,
what is the next number that is in BOTH the first and the second
sequences?
The process used in responding to the item is not very constrained: Students may take the trouble
to extend each pattern to find the next number common to both sequences, or they may recall
that the greatest common multiple of the two numbers, 36 (because 4 and 9 are relatively prime),
gives the next common number after 19 (that is, 36 + 19). They may instead notice that for the
two sequences to meet again, their jumps must catch up with each other, which happens after the
first sequence has jumped nine times and the second sequence has jumped four times; that is, 36
units after 19. In any case, the mobilization of knowledge and principles is great. The task
requires some reasoning about sequences even if the patterns are simply extended.
On Item M09_05, the third item on which the performance of U.S. eighth graders in 2003
was relatively high, was difficult for students in every country. The item gives the student an
U.S. Algebra 32
algebraic expression, y = 3x + 2, and asks which choice expresses x in terms of y. The process
is constrained, and the techniques for solving the problem are among the strategies needed in
manipulating algebraic expressions.
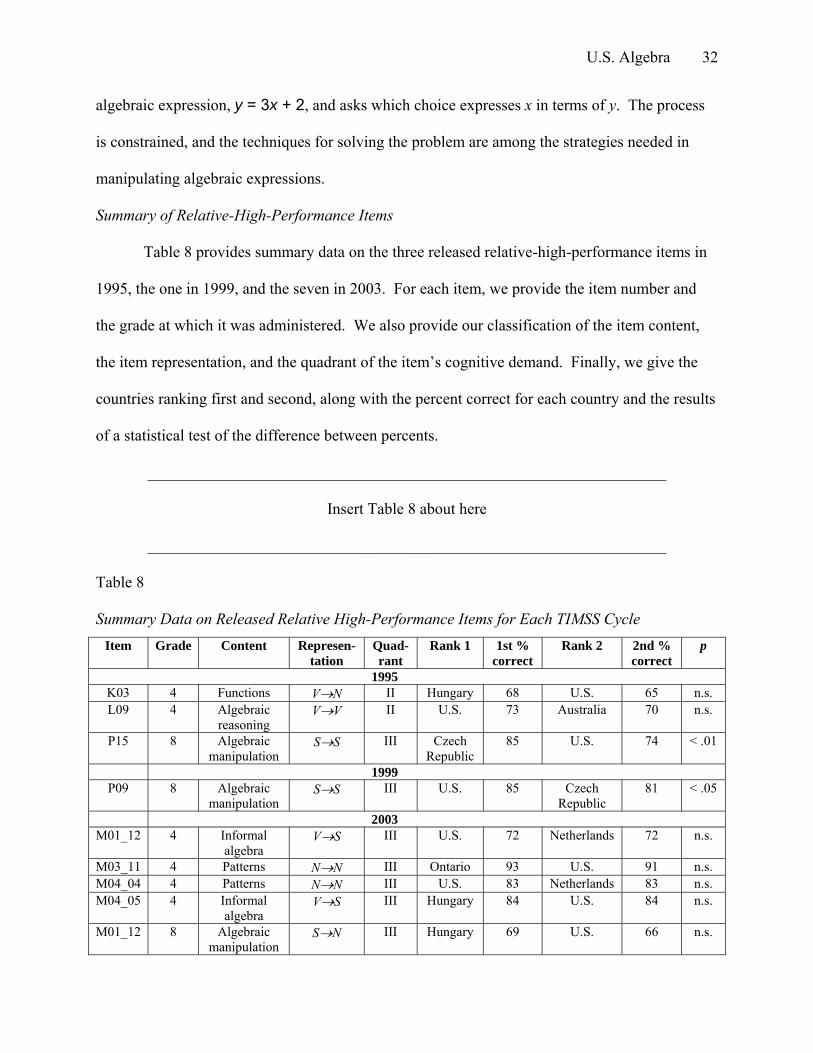
Summary of Relative-High-Performance Items
Table 8 provides summary data on the three released relative-high-performance items in
1995, the one in 1999, and the seven in 2003. For each item, we provide the item number and
the grade at which it was administered. We also provide our classification of the item content,
the item representation, and the quadrant of the item’s cognitive demand. Finally, we give the
countries ranking first and second, along with the percent correct for each country and the results
of a statistical test of the difference between percents.
_________________________________________________________________
Insert Table 8 about here
_________________________________________________________________
Table 8
Summary Data on Released Relative High-Performance Items for Each TIMSS Cycle Item Grade Content Represen-
tation Quad-rant
Rank 1 1st % correct
Rank 2 2nd % correct
p
1995 K03 4 Functions V→N II Hungary 68 U.S. 65 n.s. L09 4 Algebraic
reasoning V→V II U.S. 73 Australia 70 n.s.
P15 8 Algebraic manipulation
S→S III Czech Republic
85 U.S. 74 < .01
1999 P09 8 Algebraic
manipulation S→S III U.S. 85 Czech
Republic 81 < .05
2003 M01_12 4 Informal
algebra V→S III U.S. 72 Netherlands 72 n.s.
M03_11 4 Patterns N→N III Ontario 93 U.S. 91 n.s. M04_04 4 Patterns N→N III U.S. 83 Netherlands 83 n.s. M04_05 4 Informal
algebra V→S III Hungary 84 U.S. 84 n.s.
M01_12 8 Algebraic manipulation
S→N III Hungary 69 U.S. 66 n.s.
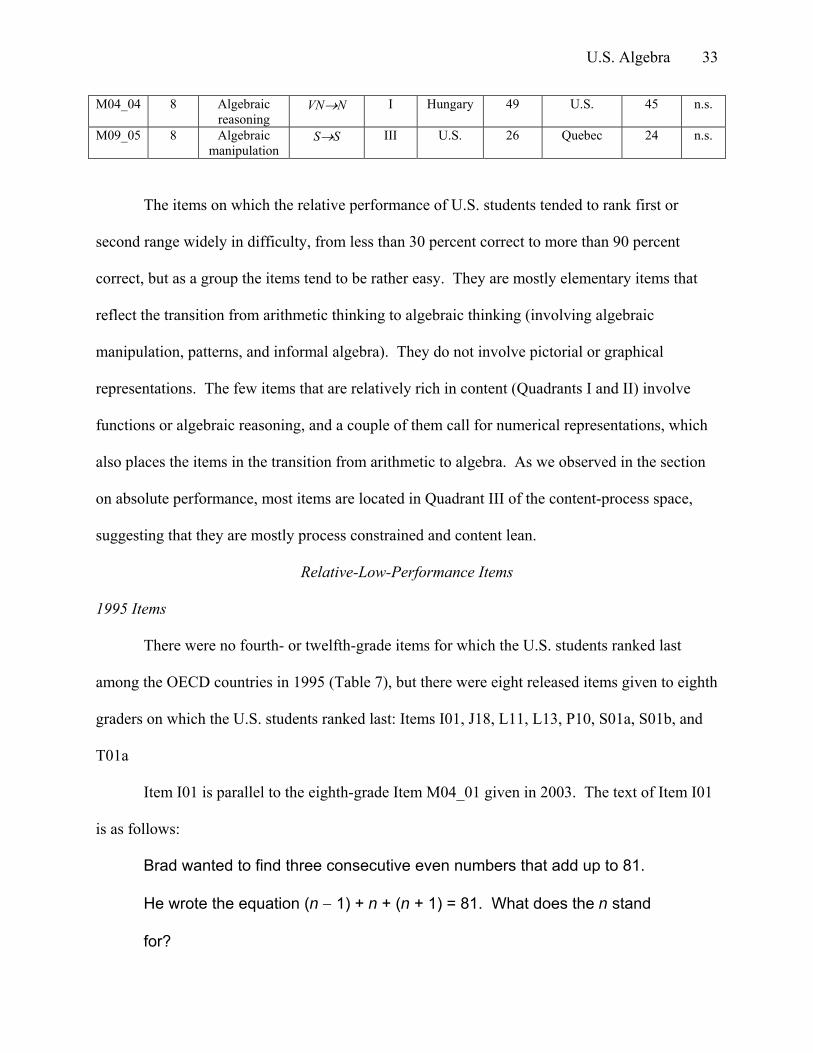
U.S. Algebra 33
M04_04 8 Algebraic reasoning
VN→N I Hungary 49 U.S. 45 n.s.
M09_05 8 Algebraic manipulation
S→S III U.S. 26 Quebec 24 n.s.
The items on which the relative performance of U.S. students tended to rank first or
second range widely in difficulty, from less than 30 percent correct to more than 90 percent
correct, but as a group the items tend to be rather easy. They are mostly elementary items that
reflect the transition from arithmetic thinking to algebraic thinking (involving algebraic
manipulation, patterns, and informal algebra). They do not involve pictorial or graphical
representations. The few items that are relatively rich in content (Quadrants I and II) involve
functions or algebraic reasoning, and a couple of them call for numerical representations, which
also places the items in the transition from arithmetic to algebra. As we observed in the section
on absolute performance, most items are located in Quadrant III of the content-process space,
suggesting that they are mostly process constrained and content lean.
Relative-Low-Performance Items
1995 Items
There were no fourth- or twelfth-grade items for which the U.S. students ranked last
among the OECD countries in 1995 (Table 7), but there were eight released items given to eighth
graders on which the U.S. students ranked last: Items I01, J18, L11, L13, P10, S01a, S01b, and
T01a
Item I01 is parallel to the eighth-grade Item M04_01 given in 2003. The text of Item I01
is as follows:
Brad wanted to find three consecutive even numbers that add up to 81.
He wrote the equation (n − 1) + n + (n + 1) = 81. What does the n stand
for?
U.S. Algebra 34
There is a slight difference in wording between the two items, but the classification is the same.
Item J18 gives a numerical table representing the relation between x and y, and asks for
the missing value for x = 2. The student has to find the relationship between the two variables,
and it is not straightforward to establish the pattern (e.g., the student has to realize that there are
missing numbers 3, 5, and 6 for which the relation must be true). The kind of thinking that is
needed to solve the problem requires instruction; the process is constrained, but the content is not
lean.
Item L11 gives a situation of a rubber ball that rebounds half the height each time,
starting at 18m. The student is asked to find the distance traveled when the ball hits the floor the
third time. Some modeling is required, but there is no need to use symbolic representations. The
problem can be solved through repeated addition by sketching the heights of the ball, or it can be
solved by finding the sum of the numbers in the sequence 18, 9, 9, 4.5, and 4.5. We classified it
as an open-process problem with lean content (it uses knowledge acquired in previous grades).
Item L13 is the patterns problem (circles and triangles) that we discussed above in the
section on absolute performance (L4 at fourth grade). Item P10 reads as follows:
If m represents a positive number, which of these is equivalent to m + m+
m +m?
The remaining three items were discussed in the section on absolute performance. Not
much eighth-grade content knowledge is needed for Item S01a; it can be solved using
information learned in earlier grades. Item S01b is process open with rich content, and Item
T01a is also process open but the content is leaner.
U.S. Algebra 35
1999 Items
In 1999, there were five released items on which performance of the U.S. students ranked
last out of seven countries: Items L12, P11, T01, V04a, and V04b. Like all items in 1999, these
were eighth-grade items.
Item L12 resembles Item L11 (bouncing rubber ball) from 1995, discussed above,
although it differs from that item in some important ways. Item L12 describes the situation of an
elevator that makes a series of starts and stops as it goes from one floor to another. The student
is asked to estimate how far the elevator has traveled given that the floors are 3m apart. In this
item, students have to create a representation of the situation that allows them to interpret
correctly the distances that need to be added. It is not a given pattern (as with the rubber ball), so
the students have to keep track of where the elevator is. The only operation involved is addition.
The process is constrained (there are not many paths to the solution), and the problem demands
basic arithmetic operations.
Item P11 is similar to Item P9 from 1995. It reads as follows:
For all numbers k, k + k + k + k + k can be written as:
A. k+5
B. 5k
C. k5
D. 5(k +1)
Item T01 is a constructed-response item that reads as follows:
A club has 86 members, and there are 14 more girls than boys. How
many boys and how many girls are members of the club? Show your
work.
U.S. Algebra 36
This item is similar to Item T01 in the 1995 eighth-grade assessment (dealing with kg of apples
in two boxes). Students may choose a numerical approach or a symbolic approach, and the
TIMSS scoring rubric admits either.
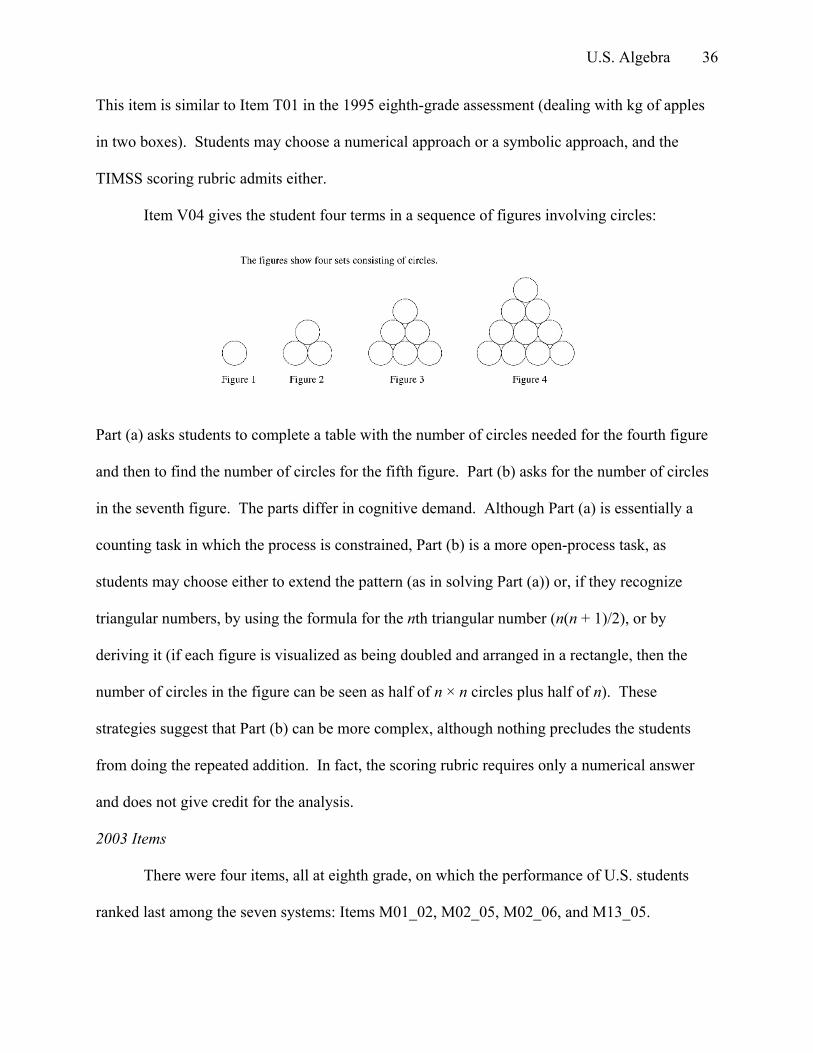
Item V04 gives the student four terms in a sequence of figures involving circles:
Part (a) asks students to complete a table with the number of circles needed for the fourth figure
and then to find the number of circles for the fifth figure. Part (b) asks for the number of circles
in the seventh figure. The parts differ in cognitive demand. Although Part (a) is essentially a
counting task in which the process is constrained, Part (b) is a more open-process task, as
students may choose either to extend the pattern (as in solving Part (a)) or, if they recognize
triangular numbers, by using the formula for the nth triangular number (n(n + 1)/2), or by
deriving it (if each figure is visualized as being doubled and arranged in a rectangle, then the
number of circles in the figure can be seen as half of n × n circles plus half of n). These
strategies suggest that Part (b) can be more complex, although nothing precludes the students
from doing the repeated addition. In fact, the scoring rubric requires only a numerical answer
and does not give credit for the analysis.
2003 Items
There were four items, all at eighth grade, on which the performance of U.S. students
ranked last among the seven systems: Items M01_02, M02_05, M02_06, and M13_05.
U.S. Algebra 37
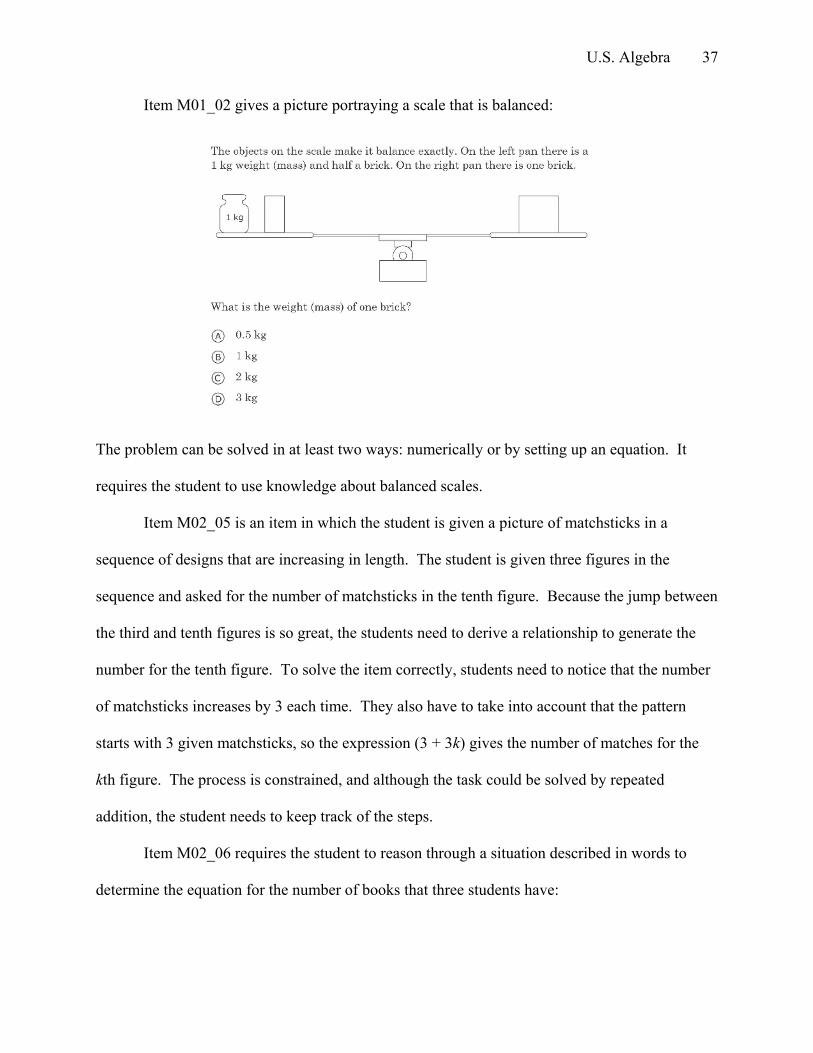
Item M01_02 gives a picture portraying a scale that is balanced:
The problem can be solved in at least two ways: numerically or by setting up an equation. It
requires the student to use knowledge about balanced scales.
Item M02_05 is an item in which the student is given a picture of matchsticks in a
sequence of designs that are increasing in length. The student is given three figures in the
sequence and asked for the number of matchsticks in the tenth figure. Because the jump between
the third and tenth figures is so great, the students need to derive a relationship to generate the
number for the tenth figure. To solve the item correctly, students need to notice that the number
of matchsticks increases by 3 each time. They also have to take into account that the pattern
starts with 3 given matchsticks, so the expression (3 + 3k) gives the number of matches for the
kth figure. The process is constrained, and although the task could be solved by repeated
addition, the student needs to keep track of the steps.
Item M02_06 requires the student to reason through a situation described in words to
determine the equation for the number of books that three students have:
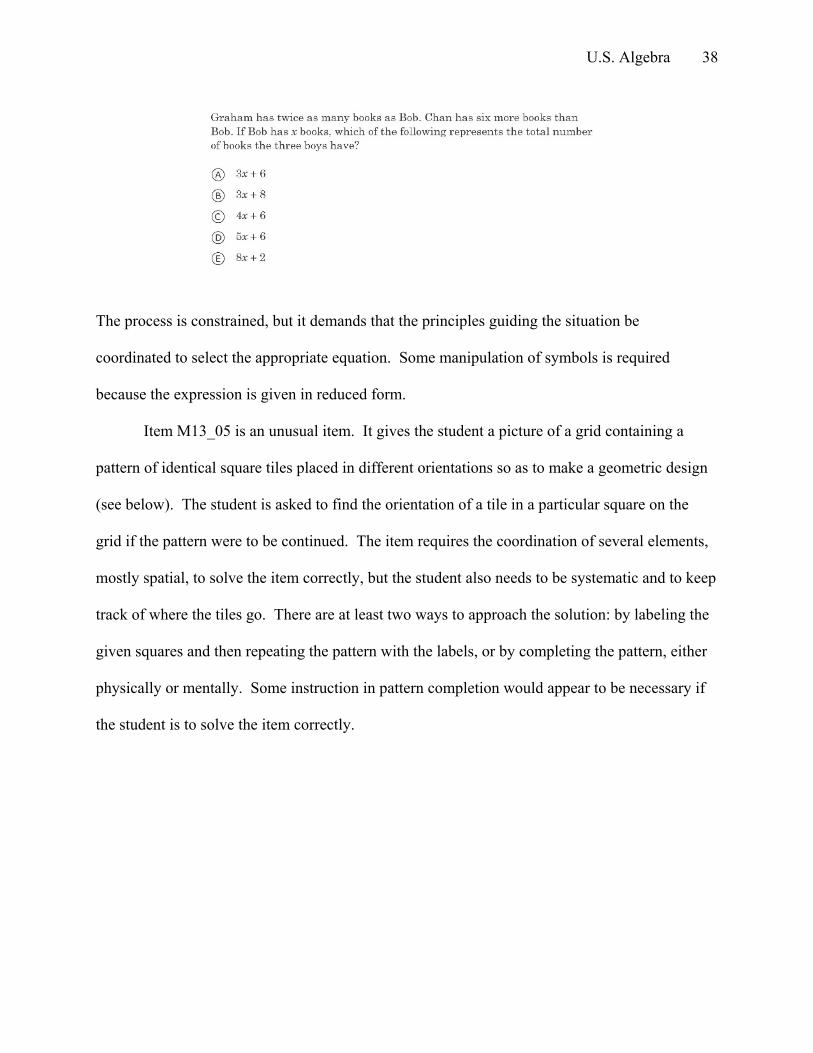
U.S. Algebra 38
The process is constrained, but it demands that the principles guiding the situation be
coordinated to select the appropriate equation. Some manipulation of symbols is required
because the expression is given in reduced form.
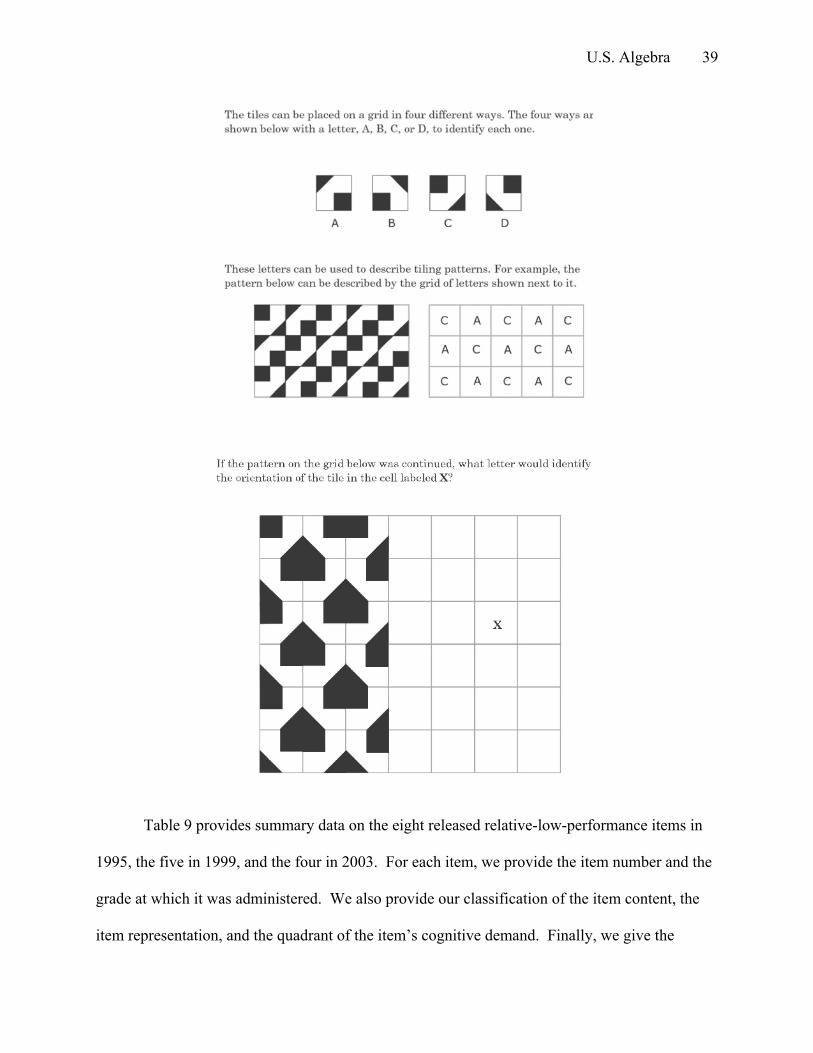
Item M13_05 is an unusual item. It gives the student a picture of a grid containing a
pattern of identical square tiles placed in different orientations so as to make a geometric design
(see below). The student is asked to find the orientation of a tile in a particular square on the
grid if the pattern were to be continued. The item requires the coordination of several elements,
mostly spatial, to solve the item correctly, but the student also needs to be systematic and to keep
track of where the tiles go. There are at least two ways to approach the solution: by labeling the
given squares and then repeating the pattern with the labels, or by completing the pattern, either
physically or mentally. Some instruction in pattern completion would appear to be necessary if
the student is to solve the item correctly.
U.S. Algebra 39
Table 9 provides summary data on the eight released relative-low-performance items in
1995, the five in 1999, and the four in 2003. For each item, we provide the item number and the
grade at which it was administered. We also provide our classification of the item content, the
item representation, and the quadrant of the item’s cognitive demand. Finally, we give the
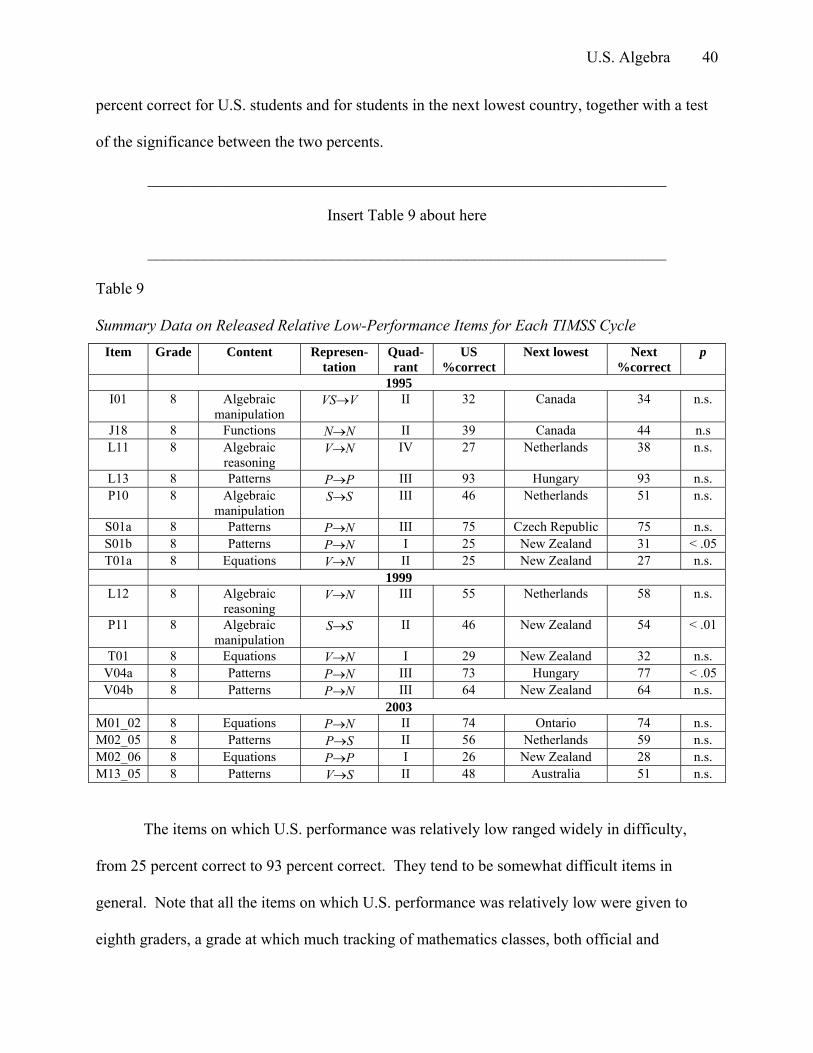
U.S. Algebra 40
percent correct for U.S. students and for students in the next lowest country, together with a test
of the significance between the two percents.
_________________________________________________________________
Insert Table 9 about here
_________________________________________________________________
Table 9
Summary Data on Released Relative Low-Performance Items for Each TIMSS Cycle Item Grade Content Represen-
tation Quad-rant
US %correct
Next lowest Next %correct
p
1995 I01 8 Algebraic
manipulation VS→V II 32 Canada 34 n.s.
J18 8 Functions N→N II 39 Canada 44 n.s L11 8 Algebraic
reasoning V→N IV 27 Netherlands 38 n.s.
L13 8 Patterns P→P III 93 Hungary 93 n.s. P10 8 Algebraic
manipulation S→S III 46 Netherlands 51 n.s.
S01a 8 Patterns P→N III 75 Czech Republic 75 n.s. S01b 8 Patterns P→N I 25 New Zealand 31 < .05 T01a 8 Equations V→N II 25 New Zealand 27 n.s.
1999 L12 8 Algebraic
reasoning V→N III 55 Netherlands 58 n.s.
P11 8 Algebraic manipulation
S→S II 46 New Zealand 54 < .01
T01 8 Equations V→N I 29 New Zealand 32 n.s. V04a 8 Patterns P→N III 73 Hungary 77 < .05 V04b 8 Patterns P→N III 64 New Zealand 64 n.s.
2003 M01_02 8 Equations P→N II 74 Ontario 74 n.s. M02_05 8 Patterns P→S II 56 Netherlands 59 n.s. M02_06 8 Equations P→P I 26 New Zealand 28 n.s. M13_05 8 Patterns V→S II 48 Australia 51 n.s.
The items on which U.S. performance was relatively low ranged widely in difficulty,
from 25 percent correct to 93 percent correct. They tend to be somewhat difficult items in
general. Note that all the items on which U.S. performance was relatively low were given to
eighth graders, a grade at which much tracking of mathematics classes, both official and
U.S. Algebra 41
unofficial, is in place and at which the relative performance in mathematics of U.S. students has
tended to be low in earlier international comparisons. The items require a wide range of skills to
be brought to bear on the tasks, and students in the United States perform like students in other
low-performing countries. The items tend to involve basic skills in arithmetic or algebra.
Items that deal with patterns are prominently represented in Table 9. In every case, the
pattern may be continued for a few steps, but a solution to the problem requires some
generalization beyond what can be reasonably accomplished by counting or repeated addition.
This challenge seems to be a weakness for U.S. students. Interestingly, however, in most cases,
students in the other countries tended to perform at about the same level.
Items in Quadrant II are also common in Table 9. Such items may have a constrained
process, but they require relatively high levels of content for their solution, and one might have
predicted low performance by U.S. eighth graders. Items in Quadrant III (lean in content and
process constrained) are also prominently represented, which is an interesting result. Students in
most of the countries tended to do relatively well on those items (except for Items P10 and L12).
Items in Quadrants I and IV, which require more open processes, tended to be more difficult too
(performance between 25 and 50 percent). In only one case, however, is the performance of the
U.S. students significantly below that of the other countries in the group, which may suggest that
these items are consistently difficult for all students. The observed differences appear to be
attributable to different curricular intentions and implementations.
Summary Observations About U.S. Algebra Performance
The general level of performance of U.S. fourth graders is not bad on items that ask for
rather straightforward calculations or reasoning. They do relatively well in interpreting a rule,
engaging in transitive reasoning, translating from words to symbols, and extending numerical
U.S. Algebra 42
patterns. U.S. twelfth graders do rather well in interpreting the graph of a function, but relative
to twelfth graders in other countries, their performance is weak.
The most and greatest differences between performance in the United States and in other
countries come at eighth grade. U.S. eighth graders demonstrate relatively good understanding
of the notation for exponents, ability to interpret simple algebraic expressions, reasoning about
sequences, and solving an equation for one variable in terms of another. In contrast, their
performance is relatively weak in interpreting symbols in an equation, completing a table
showing a relation between variables, finding the sum of series expressed by verbal rules,
identifying a pattern, manipulating a simple algebraic expression, extending sequences of
geometric figures to find the pattern, solving word problems involving relations between
quantities, translating from words into algebraic symbols, and completing a geometric pattern.
To some degree, our results extend and complement those of a study comparing the
performance of U.S. students with that of an average taken across 12 countries participating in
TIMSS 2003 and PISA 2003.28 When items from TIMSS were classified as low rigor versus
high rigor and from both TIMSS and PISA as low difficulty versus high difficulty, U.S.
performance was below the 12-country average at both levels of rigor and at both levels of
difficulty. Our results indicate, however, that although U.S. students’ performance may be low
in general, it is not uniformly low.
Conclusion
Given that U.S. students’ performance in algebra is about at their average across
mathematics topics, we chose to examine the extremes of the distribution of item difficulty to see
what U.S. students manage quite well, what they need help with, and how their performance
28 Ginsburg and others (2005).
U.S. Algebra 43
compares with that of students in other systems. U.S. eighth graders are reasonably competent
with problems that involve algebraic manipulation and the transition from arithmetic to algebra
(which might be considered good news, given that most U.S. students do not take algebra until
they reach ninth grade). But U.S. students do not do well on items that involve the extension of a
pattern if the item requires that they explicitly produce a relationship rather than simply find the
next few terms in a sequence.
U.S. eighth graders have teachers who claim—far more than teachers in other countries—
that in more than half of their lessons, they relate the mathematics to daily life.29 Their students,
however, do relatively poorly in setting up an equation to model a real situation. Compared with
eighth-grade teachers in some other countries, U.S. teachers tend not to use many high-
complexity problems in their lessons,30 which may help account for some of the difficulties that
U.S. students have. Beyond tracking, another source of poor performance in algebra may be that
U.S. eighth-grade teachers spend considerable time reviewing topics already taught; almost 30
percent of their lessons are devoted entirely to review.31
In short, if they are to improve their performance in algebra, U.S. students appear to need
many more opportunities to engage in functional thinking with complex problems and in
particular, in functional thinking as it relates to realistic situations. They will live not in a post-
industrial society but rather in a knowledge society32 that will demand a different set of skills
than mathematics courses have traditionally supplied. These students need to be able to use the
algebra that they study to solve problems they will face professionally and personally.
29 Ginsburg and others (2005, p. 23). 30 Hiebert and others (2003, p. 6). 31 Hiebert and others (2003, p. 5). 32 Hargreaves (2003).
U.S. Algebra 44
Algebra is of limited use if it is understood as generalized arithmetic only. If students are
to use algebra, they need to be proficient in functional thinking. The algebra they study in school
should enable them not simply to manipulate expressions and solve equations but also to
formulate problems using algebraic notation, fit functions to data, manipulate those functions to
understand phenomena, visualize functional relations, and interpret properties of functions. The
United States is not the only country in which eighth-grade teachers could be giving greater
attention to functions,33 but it is one in which too many people have assumed for too long that
most students cannot learn, use, or value algebra.
References
Baxter, Gail P., and Robert Glaser. 1998. “Investigating the Cognitive Complexity of Science
Assessments.” Educational Measurement 17(3), 37–45.
Bybee, Rodger W., Jeremy Kilpatrick, Mary Lindquist, & Janet C. Powell. 2005. “TIMSS
2003: An Introduction.” The Natural Selection: The Journal of BSCS (Winter), pp. 8–10.
Cajori, Florian. The Teaching and History of Mathematics in the United States Bureau of
Education Circular of Information No. 3 (U.S. Government Printing Office, 1890).
Cogan, Leland S., and William H. Schmidt. 2002. “‘Culture Shock’—Eighth-Grade
Mathematics From an International Perspective.” Educational Research and Evaluation
8, 13–39.
Ginsburg, Alan and others. 2005, November. Reassessing U.S. International Mathematics
Performance: New Findings From the 2003 TIMSS and PISA. Washington, DC:
American Institutes for Research.
33 Patterns, relations, and functions was among the top five topics included in eighth-grade standards documents and textbooks from 36 countries participating in TIMSS 1995, but it did not appear among the top five topics that teachers reported teaching or to which the most teaching time was devoted. See Cogan and Schmidt (2002, p. 37).
U.S. Algebra 45
Gonzales, Patrick and others. 2004. Highlights From the Trends in International Mathematics
and Science Study: TIMSS 2003 (NCES 2005-005). U.S. Department of Education,
National Center for Education Statistics.
Hargreaves, Andy. 2003. Teaching in the knowledge society: Education in the age of insecurity.
Teachers College Press.
Hiebert, James and others. 2003. Highlights From the TIMSS 1999 Video Study of Eighth-
Grade Mathematics Teaching (NCES 2003-011). U.S. Department of Education,
National Center for Education Statistics.
Kieran, Carolyn. 1981. “Concepts Associated With the Equality Symbol.” Educational Studies
in Mathematics 12, 317–326.
Kilpatrick, Jeremy. 1997. “Confronting Reform.” American Mathematical Monthly 104
(December), pp. 955–962.
Kilpatrick, Jeremy, and Judith Lynn Gieger. 2000. “The Performance of Students Taking
Advanced Mathematics Courses.” In Results From the Seventh Mathematics Assessment
of the National Assessment of Educational Progress, edited by Edward A. Silver and
Patricia A. Kenney (Reston, VA: National Council of Teachers of Mathematics).
Kilpatrick, Jeremy, Jane Swafford, and Bradford Findell (Eds.). 2001. Adding It Up: Helping
Children Learn Mathematics. National Academy Press.
Mullis, Ina V. S., Michael O. Martin, and Dana Diaconu. 2004. “Item Analysis and Review.”
In TIMSS 2003 Technical Report, edited by Michael O. Martin, Ina V.S. Mullis, and
Steven J. Chrostowski. TIMSS & PIRLS International Study Center, Boston College.
National Assessment Governing Board. 2004, September. Mathematics Framework for the
2005 National Assessment of Educational Progress. U.S. Department of Education.
U.S. Algebra 46
Reys, Robert E. 2001. “Curricular Controversy in the Math Wars: A Battle Without Winners.”
Phi Delta Kappan 83 (November), pp. 255–258.
Schmidt, William H., Curtis C. McKnight, and Senta A. Raizen. 1997. A Splintered Vision: An
Investigation of U.S. Science and Mathematics Education. Boston: Kluwer.
Schmidt, William H., Hsing Chi Wang, and Curtis C. McKnight. 2005. “Curriculum
Coherence: An Examination of US Mathematics and Science Content Standards From an
International Perspective.” Journal of Curriculum Studies 37, pp. 525–559.
Silver, Edward A. 1998. Improving Mathematics in Middle School: Lessons From TIMSS and
Related Research. U.S. Department of Education.
Stanic, George M. A., and Jeremy Kilpatrick. 1992. “Mathematics Curriculum Reform in the
United States: A Historical Perspective.” International Journal of Educational Research
5: 407–417.
Star, Jon R., Beth A. Herbel-Eisenmann, and John P. Smith III. 2000. “Algebraic Concepts:
What’s Really New in New Curricula?” Mathematics Teaching in the Middle School
5(7): 446–451.
Steen, Lynn Arthur. 1999. “Algebra for All in Eighth Grade: What’s the Rush?” Middle
Matters 8 (Fall): 1, 6–7.
U.S. Department of Education. 1997, October 20. Mathematics Equals Opportunity: White
Paper Prepared for U. S. Secretary of Education Richard W. Riley. Available
http://www.ed.gov/pubs/math/mathemat.pdf
Vergnaud, Gerard. 1994. “Multiplicative Conceptual Fields: What and Why?” In The
Development of Multiplicative Reasoning, edited by Guershon Harel and Jere Confrey.
SUNY Press.

U.S. Algebra 47
Wirt, John and others. 2002. The Condition of Education 2002 (NCES 2002-025). U.S.
Department of Education, National Center for Education Statistics.
Wirt, John and others. 2004. The Condition of Education 2004 (NCES 2004-077). U.S.
Department of Education, National Center for Education Statistics.