Embed Size (px)
Citation preview
Tuberculosis
Scott Lindquist MD MPHWashington State Communicable
Disease Epidemiologist
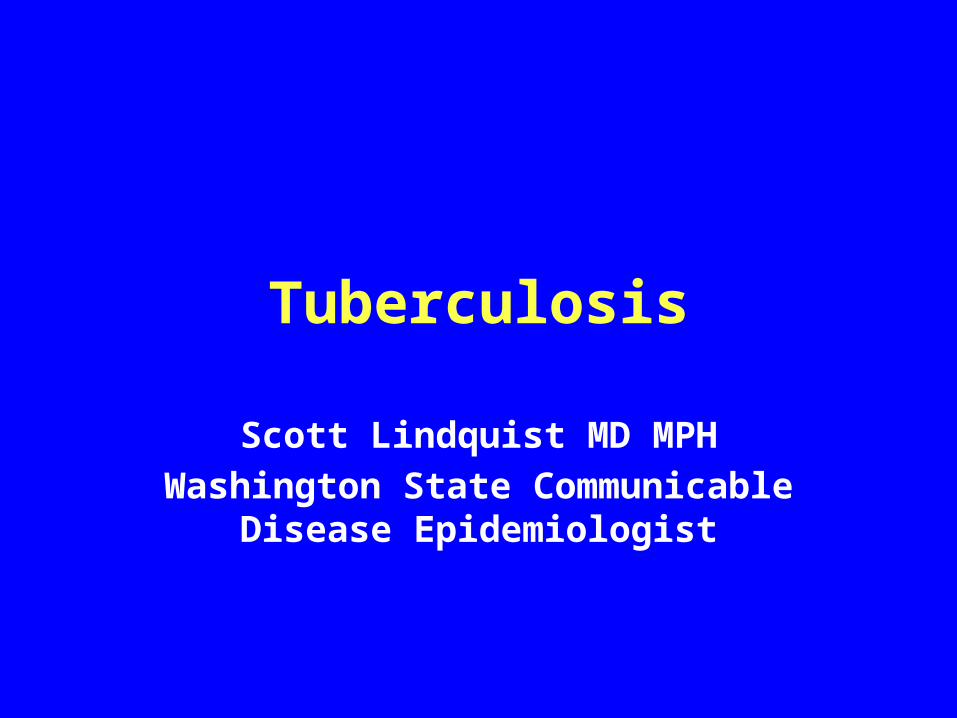
Estimated TB Global Incidence 2012
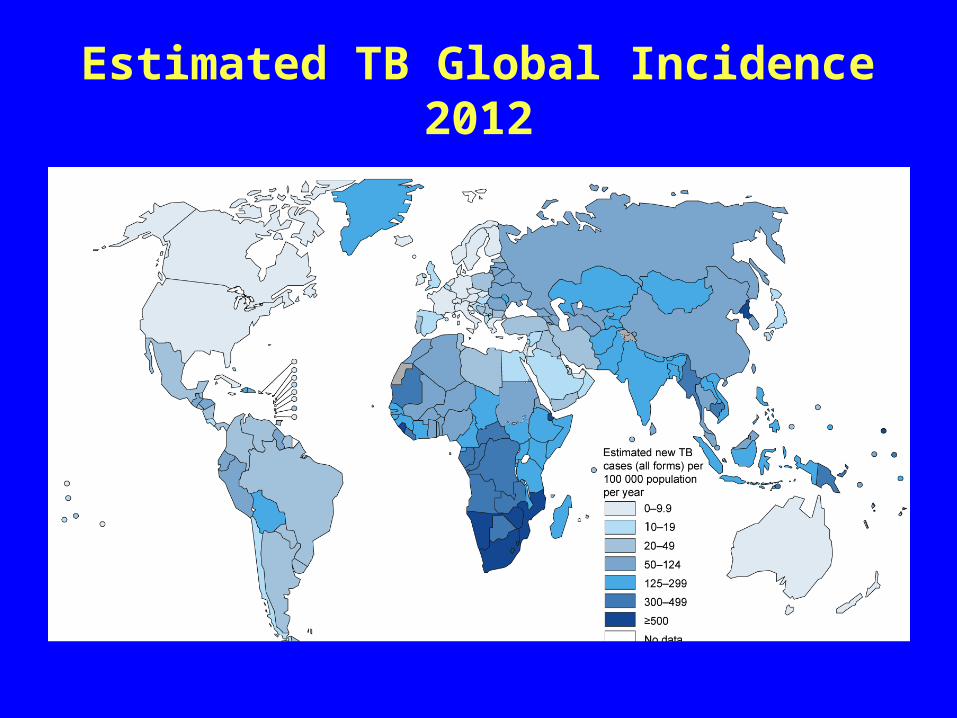
A Brief History of Tuberculosis (TB)
- Tuberculosis (phthisis) described since the time of Hippocrates (460 BC - 370 BC)
- 1689: Doctor Richard Morton used the term “consumption” to denote TB.
- Second half of the 17th century: high death rates from TB in Europe.
- 1722: Doctor Benjamin Marten proposed that TB could be transmitted in the air and described TB as being caused by “wonderfully minute living creatures”
- End of 19th century to the start of 20th century: Principal cause of death in Europe was TB.
- The romantic Era of TB“Queen Guinevere” painted by William Morris
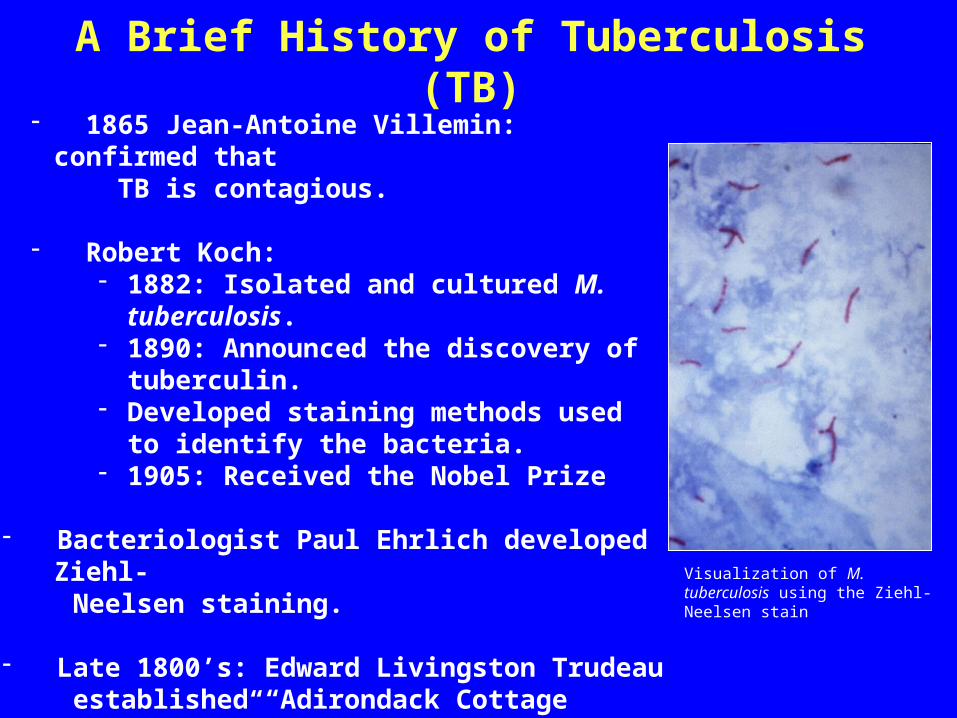
A Brief History of Tuberculosis (TB)- 1865 Jean-Antoine Villemin: confirmed that
TB is contagious.
- Robert Koch:- 1882: Isolated and cultured M. tuberculosis.- 1890: Announced the discovery of tuberculin.- Developed staining methods used to identify
the bacteria.- 1905: Received the Nobel Prize
- Bacteriologist Paul Ehrlich developed Ziehl- Neelsen staining.
- Late 1800’s: Edward Livingston Trudeau established “Adirondack Cottage Sanatorium”, first TB sanatorium in the US.
Visualization of M. tuberculosis using the Ziehl-Neelsen stain
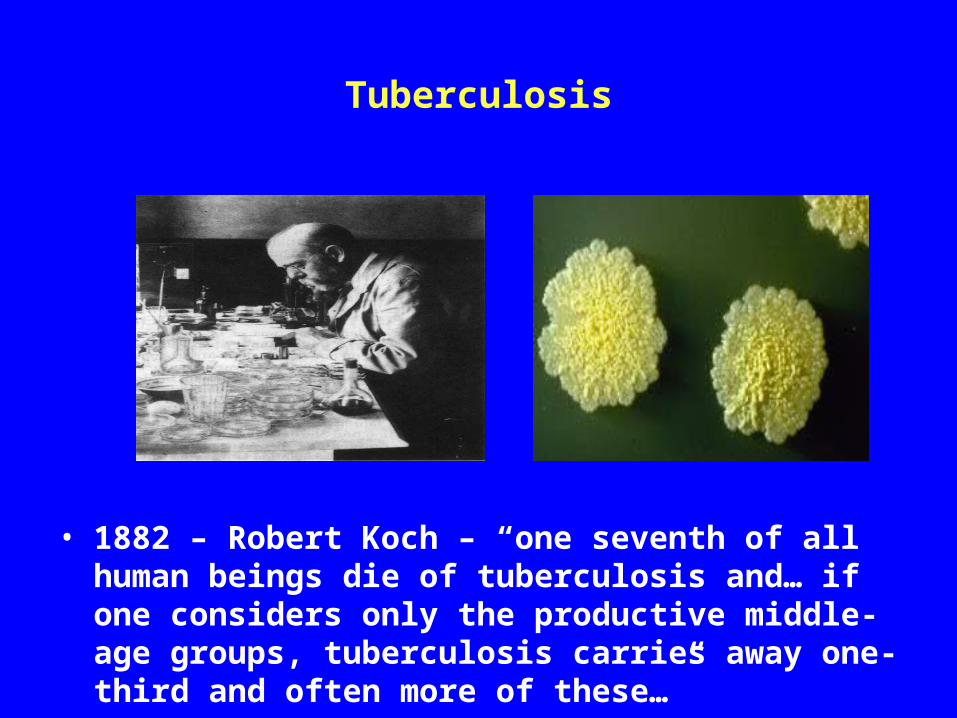
Tuberculosis
• 1882 – Robert Koch – “one seventh of all human beings die of tuberculosis and… if one considers only the productive middle-age groups, tuberculosis carries away one-third and often more of these…”
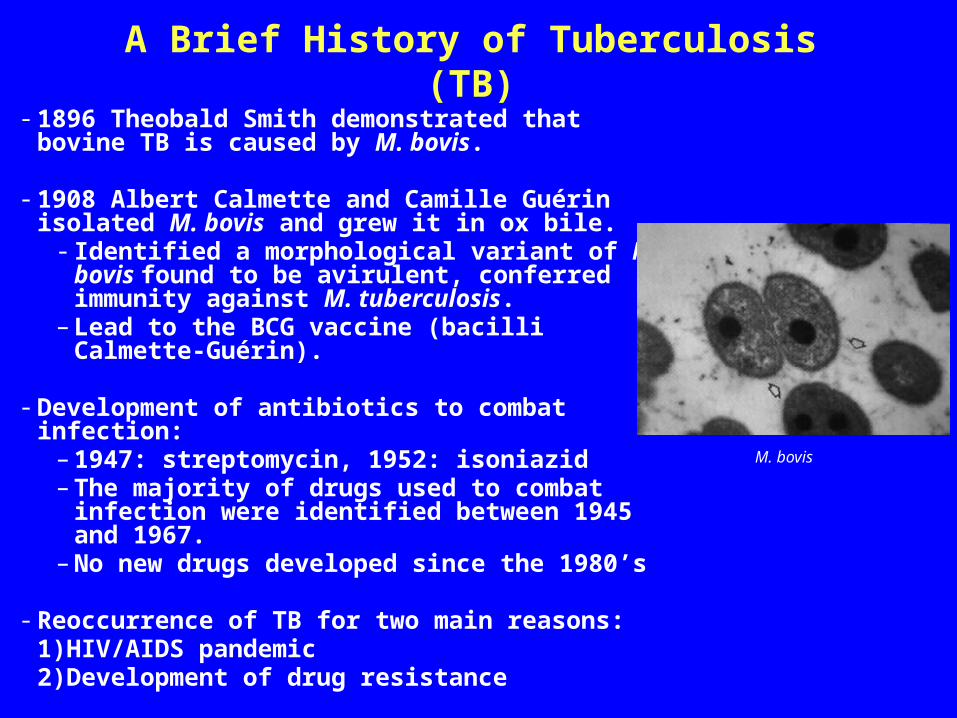
- 1896 Theobald Smith demonstrated that bovine TB is caused by M. bovis.
- 1908 Albert Calmette and Camille Guérin isolated M. bovis and grew it in ox bile.
- Identified a morphological variant of M. bovis found to be avirulent, conferred immunity against M. tuberculosis.
– Lead to the BCG vaccine (bacilli Calmette-Guérin).
- Development of antibiotics to combat infection:– 1947: streptomycin, 1952: isoniazid– The majority of drugs used to combat infection
were identified between 1945 and 1967.– No new drugs developed since the 1980’s
- Reoccurrence of TB for two main reasons:1)HIV/AIDS pandemic 2)Development of drug resistance
A Brief History of Tuberculosis (TB)
M. bovis
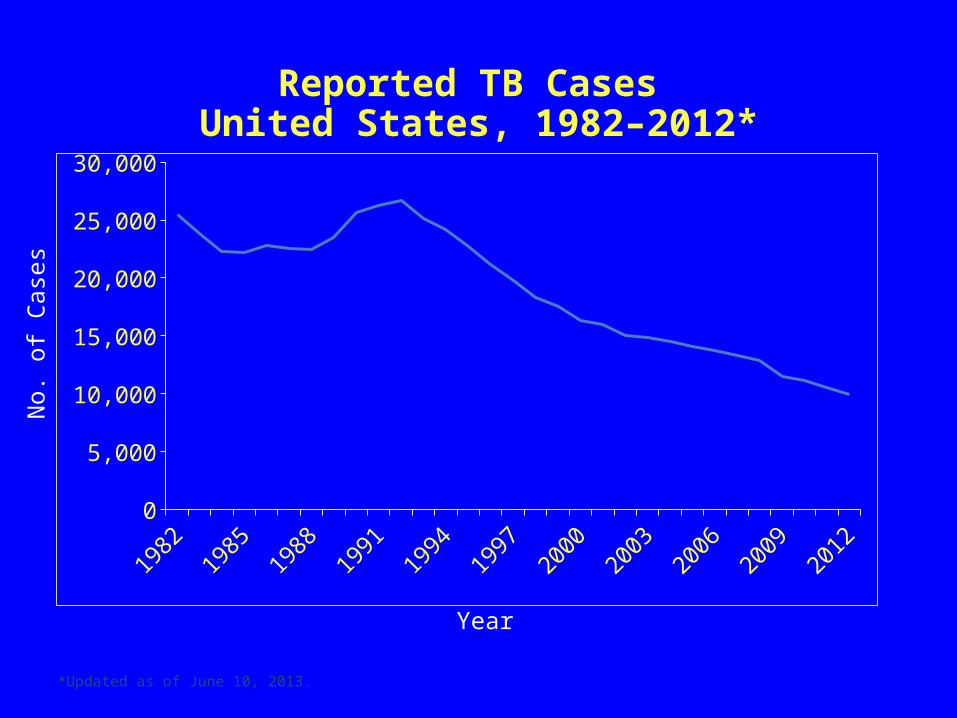
Reported TB Cases United States, 1982–2012*
*Updated as of June 10, 2013.
19821984
19861988
19901992
19941996
19982000
20022004
20062008
20102012
0
5,000
10,000
15,000
20,000
25,000
30,000
No.
of C
ases
Year
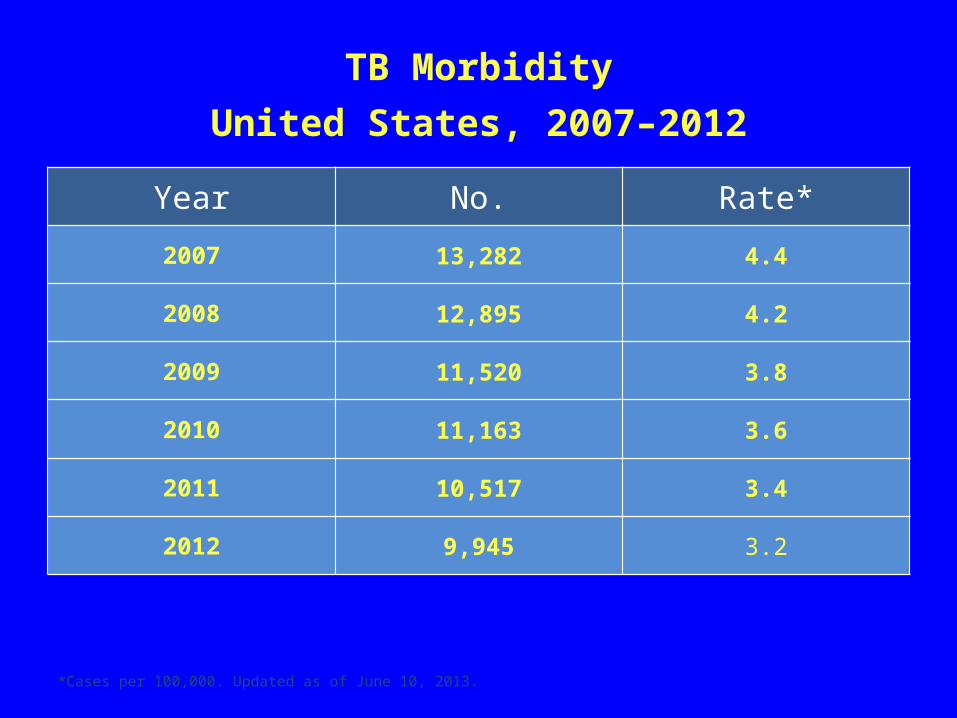
Year No. Rate*
2007 13,282 4.4
2008 12,895 4.2
2009 11,520 3.8
2010 11,163 3.6
2011 10,517 3.4
2012 9,945 3.2
*Cases per 100,000. Updated as of June 10, 2013.
TB MorbidityUnited States, 2007–2012
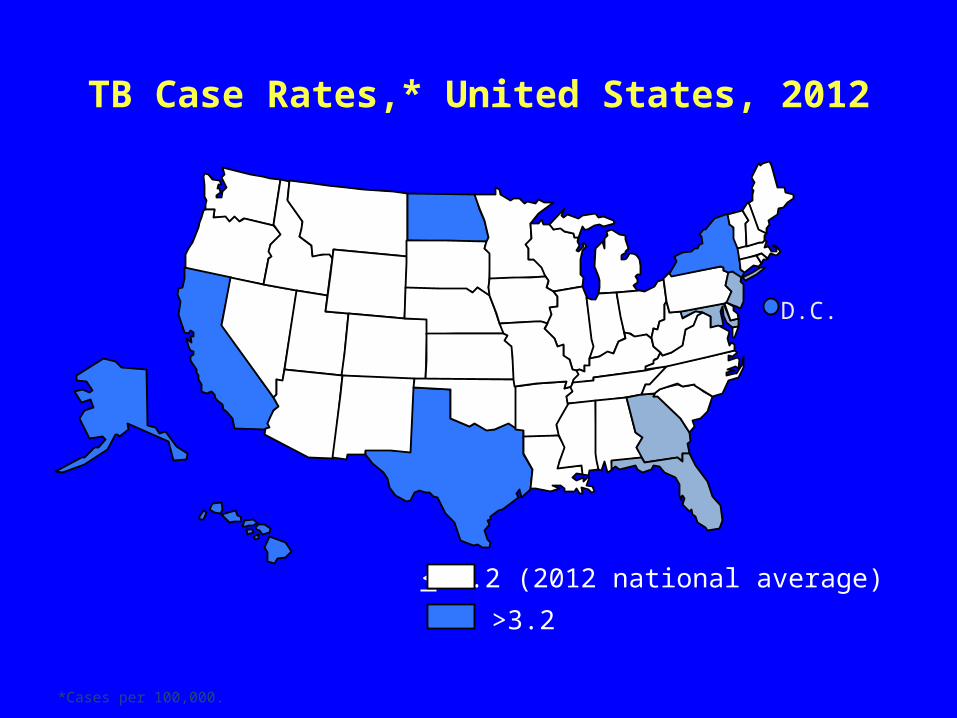
TB Case Rates,* United States, 2012
*Cases per 100,000.
< 3.2 (2012 national average)
>3.2
D.C.
≥5010–49.9
≤9.9
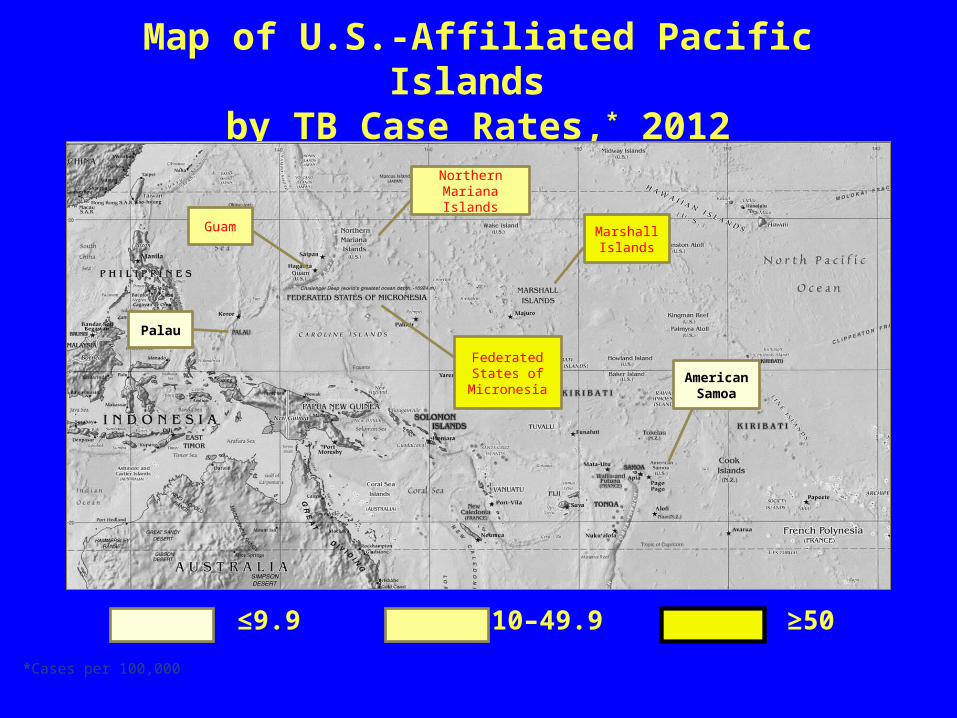
Map of U.S.-Affiliated Pacific Islands by TB Case Rates,* 2012
*Cases per 100,000
Federated States of
Micronesia
Marshall Islands
Northern Mariana Islands
American Samoa
Guam
Palau
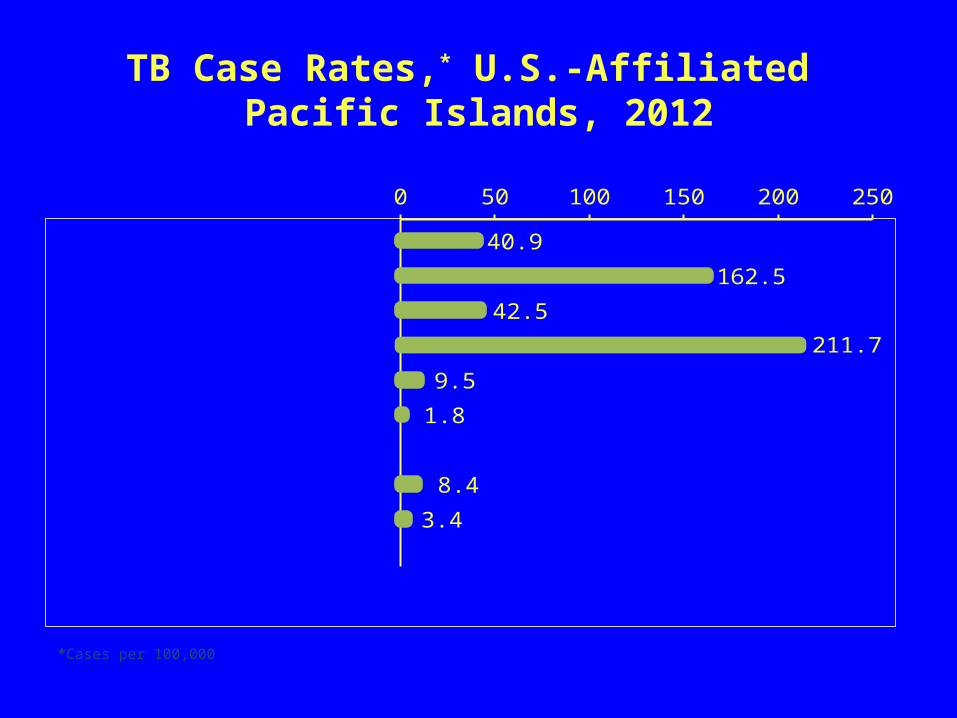
Northern Mariana Islands
Federated States of Micronesia
Guam
Marshall Islands
Palau
American Samoa
Hawaii
United States overall
0 50 100 150 200 250
40.9
162.5
42.5
211.7
9.5
1.8
8.4
3.4
TB Case Rates,* U.S.-Affiliated Pacific Islands, 2012
*Cases per 100,000
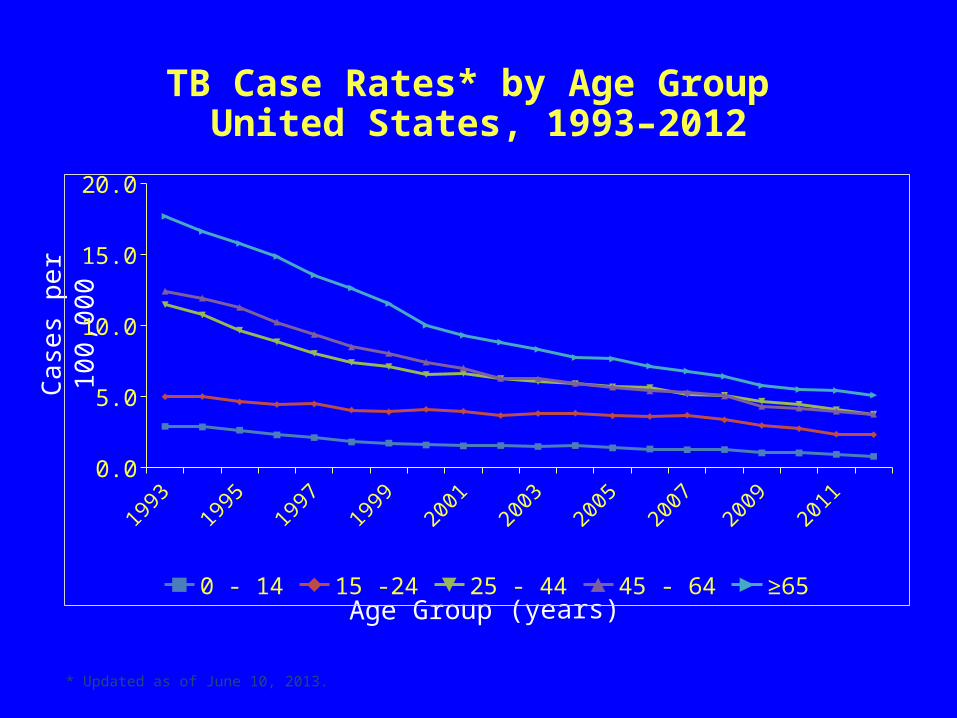
TB Case Rates* by Age Group United States, 1993–2012
* Updated as of June 10, 2013.
Cas
es p
er 1
00,0
00
Age Group (years)
19931994
19951996
19971998
19992000
20012002
20032004
20052006
20072008
20092010
20112012
0.0
5.0
10.0
15.0
20.0
0 - 14 15 -24 25 - 44 45 - 64 ≥65
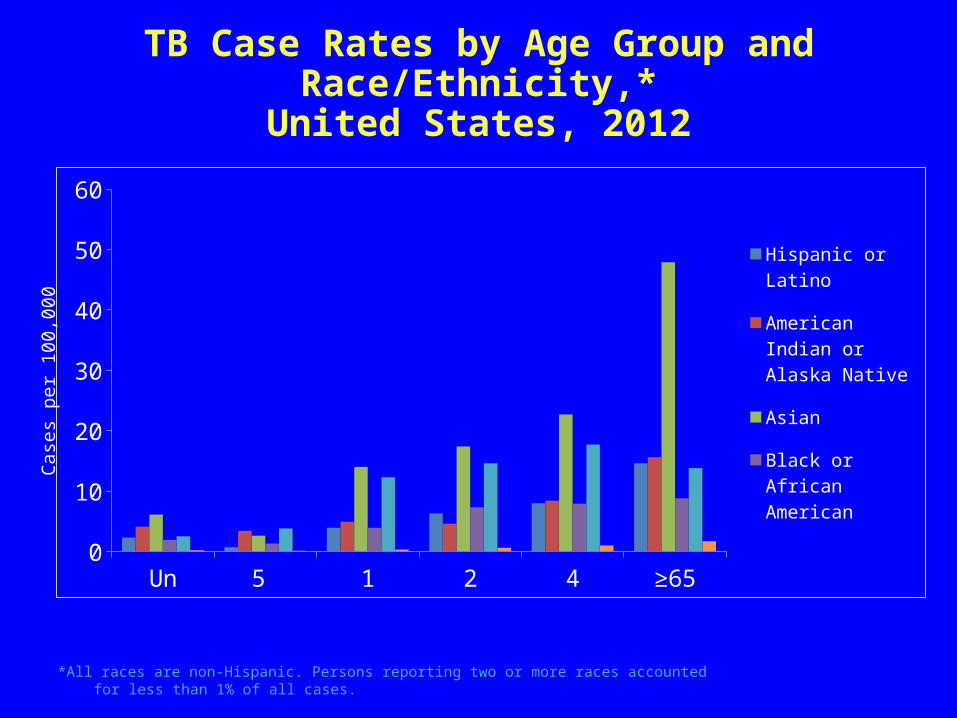
TB Case Rates by Age Group and Race/Ethnicity,*United States, 2012
*All races are non-Hispanic. Persons reporting two or more races accounted for less than 1% of all cases.
Cas
es p
er 1
00,0
00
Under 5 5 - 14 15 - 24 24 - 44 45-64 ≥650
10
20
30
40
50
60
Hispanic or Latino
American Indian or Alaska Native
Asian
Black or African American
Native Hawaiian or Other Pacific Is-lander
White
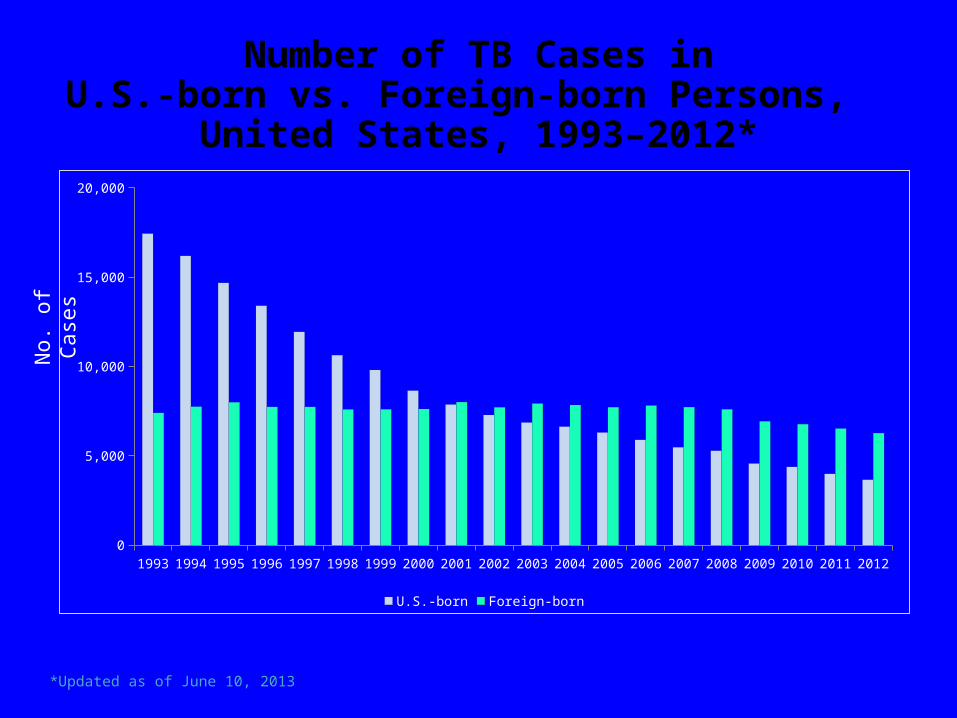
Number of TB Cases inU.S.-born vs. Foreign-born Persons,
United States, 1993–2012*
*Updated as of June 10, 2013
No.
of C
ases
1993 1994 1995 1996 1997 1998 1999 2000 2001 2002 2003 2004 2005 2006 2007 2008 2009 2010 2011 20120
5,000
10,000
15,000
20,000
U.S.-born Foreign-born
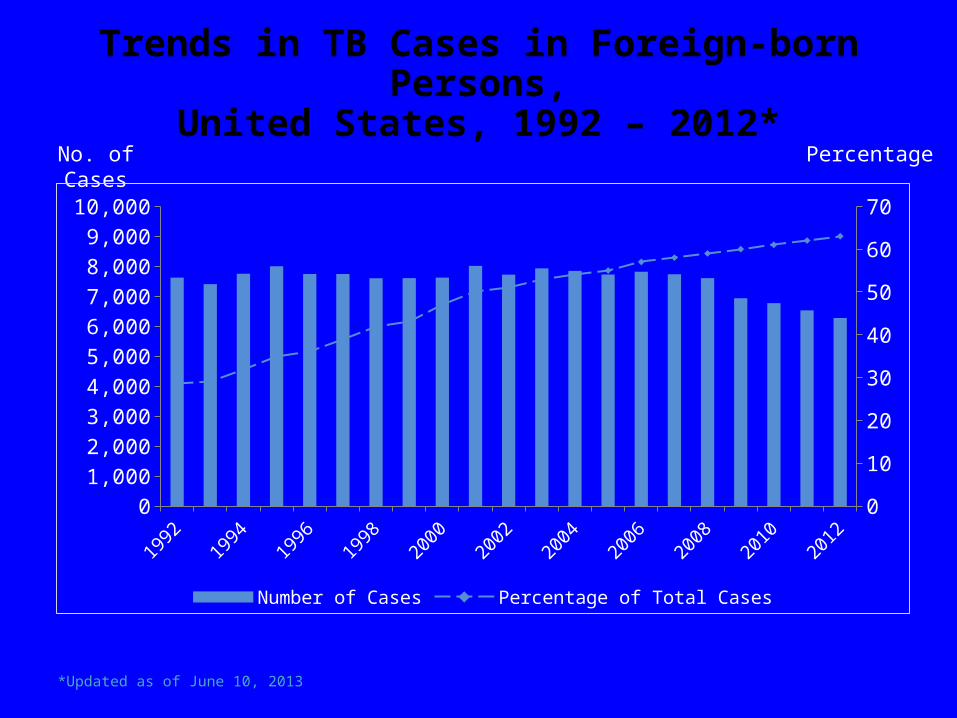
Trends in TB Cases in Foreign-born Persons,United States, 1992 – 2012*
*Updated as of June 10, 2013
No. of Cases Percentage
19921993
19941995
19961997
19981999
20002001
20022003
20042005
20062007
20082009
20102011
20120
1,0002,0003,0004,0005,0006,0007,0008,0009,000
10,000
0
10
20
30
40
50
60
70
Number of Cases Percentage of Total Cases
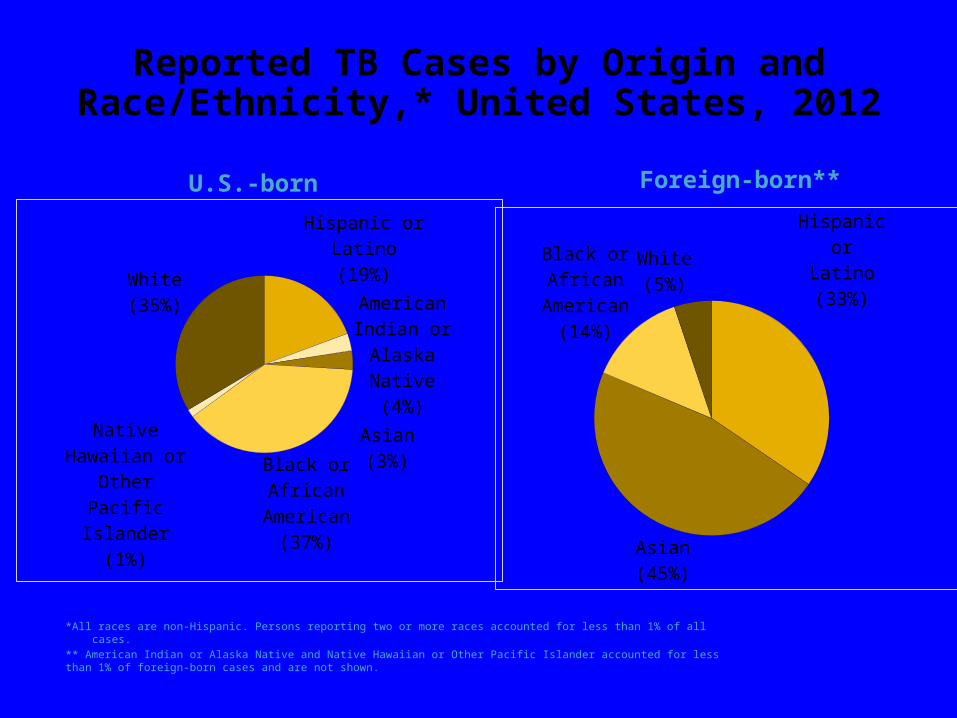
Reported TB Cases by Origin and Race/Ethnicity,* United States, 2012
*All races are non-Hispanic. Persons reporting two or more races accounted for less than 1% of all cases.** American Indian or Alaska Native and Native Hawaiian or Other Pacific Islander accounted for less than 1% of foreign-born cases and are not shown.
Hispanic or Latino(19%)
American In-dian or
Alaska Native(4%)
Asian(3%)
Black or African American
(37%)
Native Hawaiian or Other Pacific
Islander(1%)
White(35%)
Hispanic or Latino
(33%)
Asian(45%)
Black or African Ameri-
can(14%)
White(5%)
U.S.-born Foreign-born**
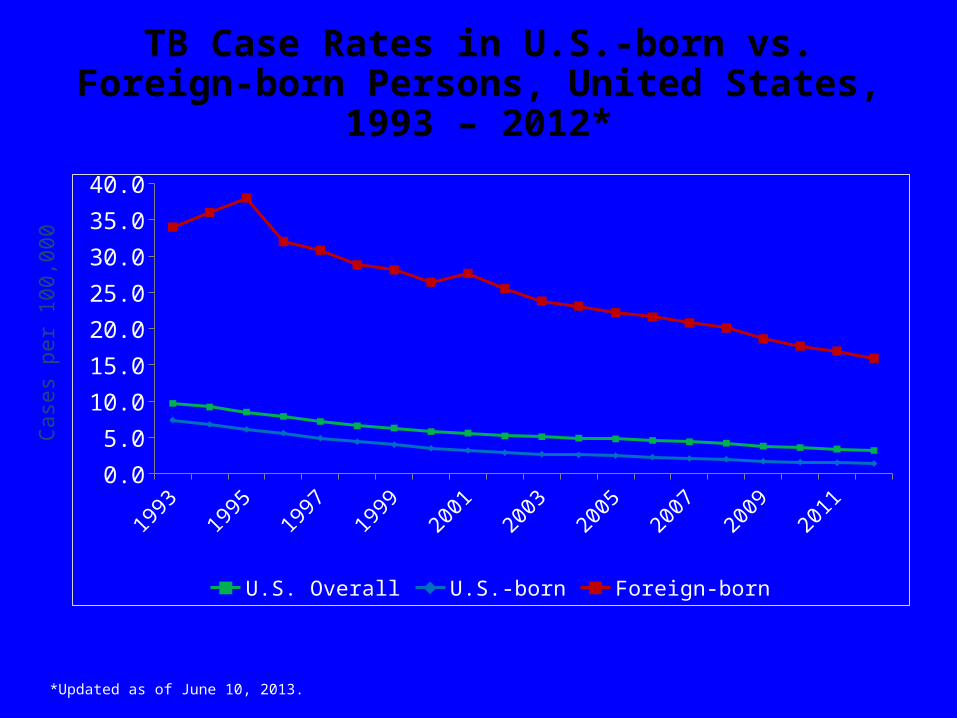
TB Case Rates in U.S.-born vs. Foreign-born Persons, United States, 1993 – 2012*
*Updated as of June 10, 2013.
Cas
es p
er 1
00,0
00
19931994
19951996
19971998
19992000
20012002
20032004
20052006
20072008
20092010
20112012
0.0
5.0
10.0
15.0
20.0
25.0
30.0
35.0
40.0
U.S. Overall U.S.-born Foreign-born
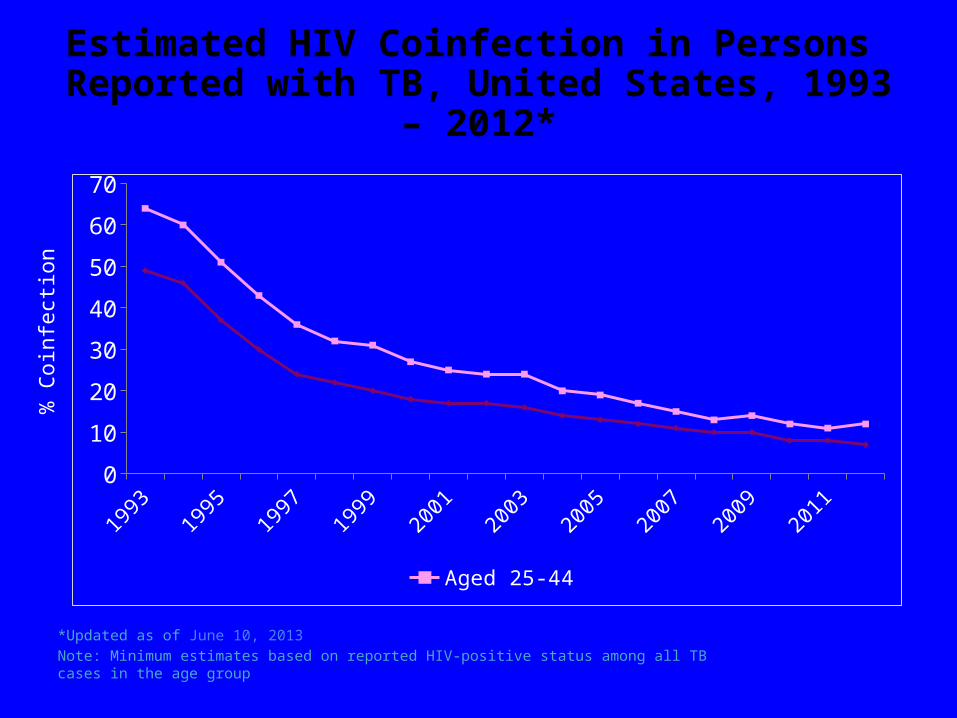
Estimated HIV Coinfection in Persons Reported with TB, United States, 1993 – 2012*
*Updated as of June 10, 2013Note: Minimum estimates based on reported HIV-positive status among all TB cases in the age group
% C
oinf
ectio
n
19931994
19951996
19971998
19992000
20012002
20032004
20052006
20072008
20092010
20112012
0
10
20
30
40
50
60
70
Aged 25-44 All Ages
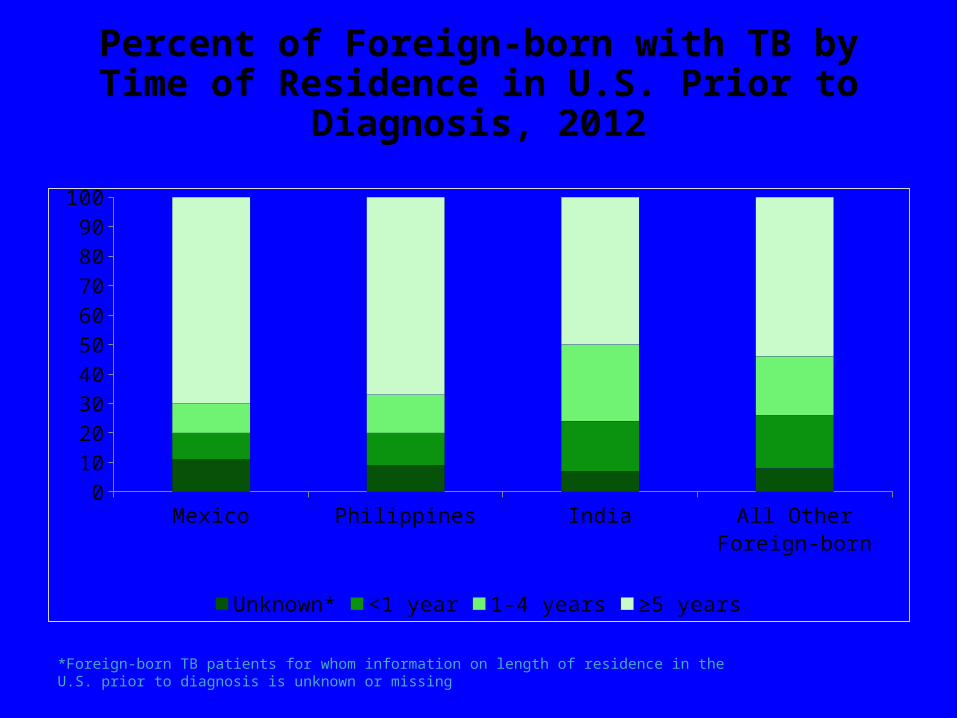
Percent of Foreign-born with TB by Time of Residence in U.S. Prior to Diagnosis, 2012
*Foreign-born TB patients for whom information on length of residence in the U.S. prior to diagnosis is unknown or missing
Mexico Philippines India All Other Foreign-born0
10
20
30
40
50
60
70
80
90
100
Unknown* <1 year 1-4 years ≥5 years
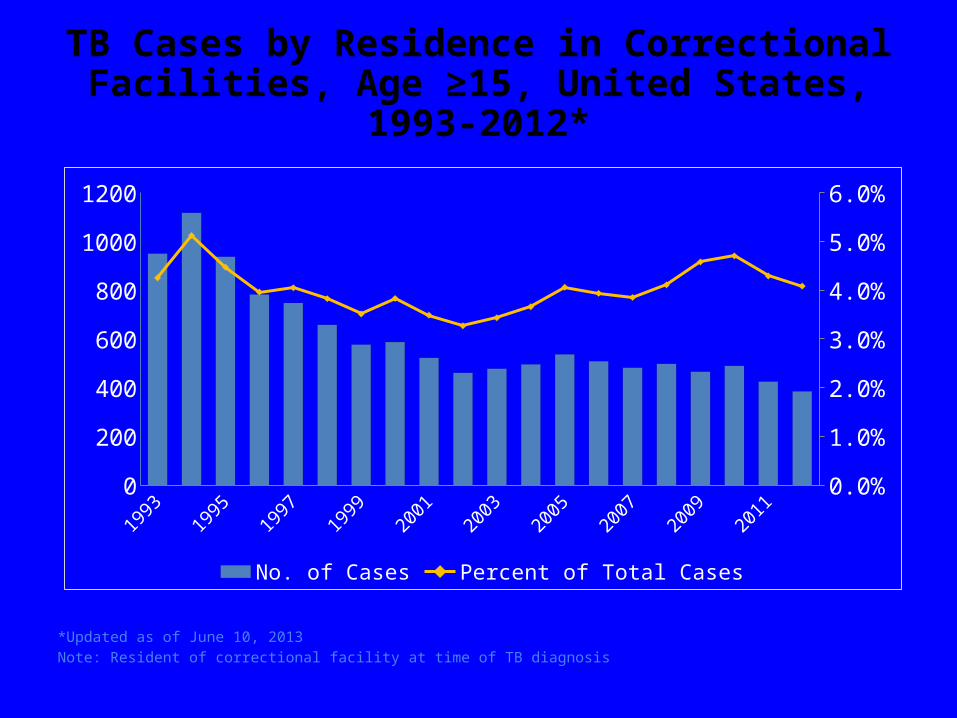
TB Cases by Residence in Correctional Facilities, Age ≥15, United States, 1993-2012*
*Updated as of June 10, 2013Note: Resident of correctional facility at time of TB diagnosis
19931994
19951996
19971998
19992000
20012002
20032004
20052006
20072008
20092010
20112012
0
200
400
600
800
1000
1200
0.0%
1.0%
2.0%
3.0%
4.0%
5.0%
6.0%
No. of Cases Percent of Total Cases
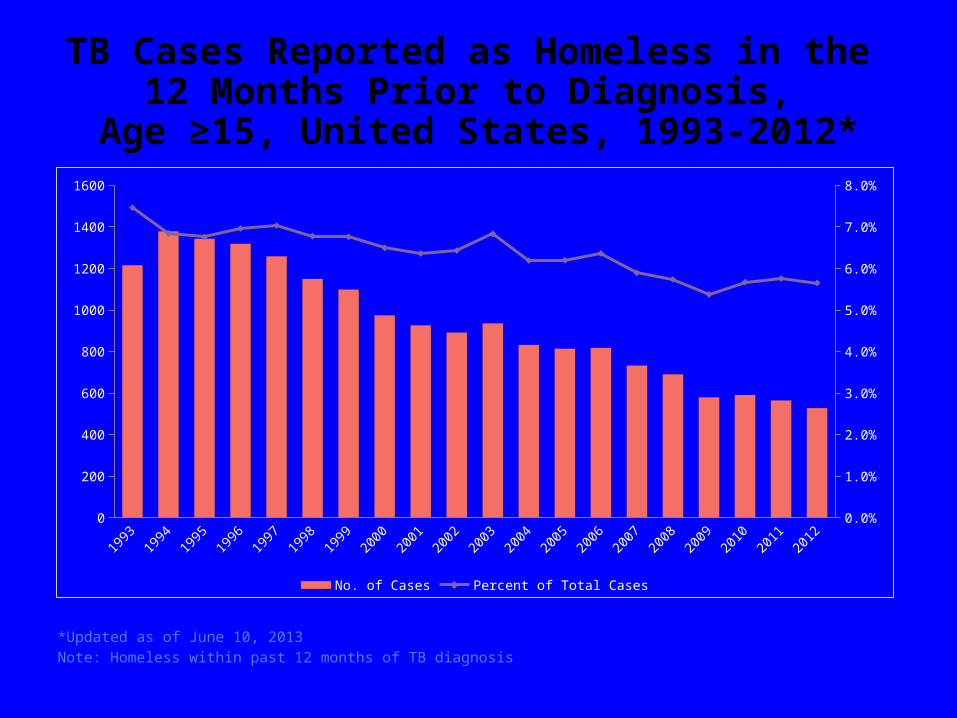
TB Cases Reported as Homeless in the 12 Months Prior to Diagnosis,
Age ≥15, United States, 1993-2012*
*Updated as of June 10, 2013Note: Homeless within past 12 months of TB diagnosis
19931994
19951996
19971998
19992000
20012002
20032004
20052006
20072008
20092010
20112012
0
200
400
600
800
1000
1200
1400
1600
0.0%
1.0%
2.0%
3.0%
4.0%
5.0%
6.0%
7.0%
8.0%
No. of Cases Percent of Total Cases
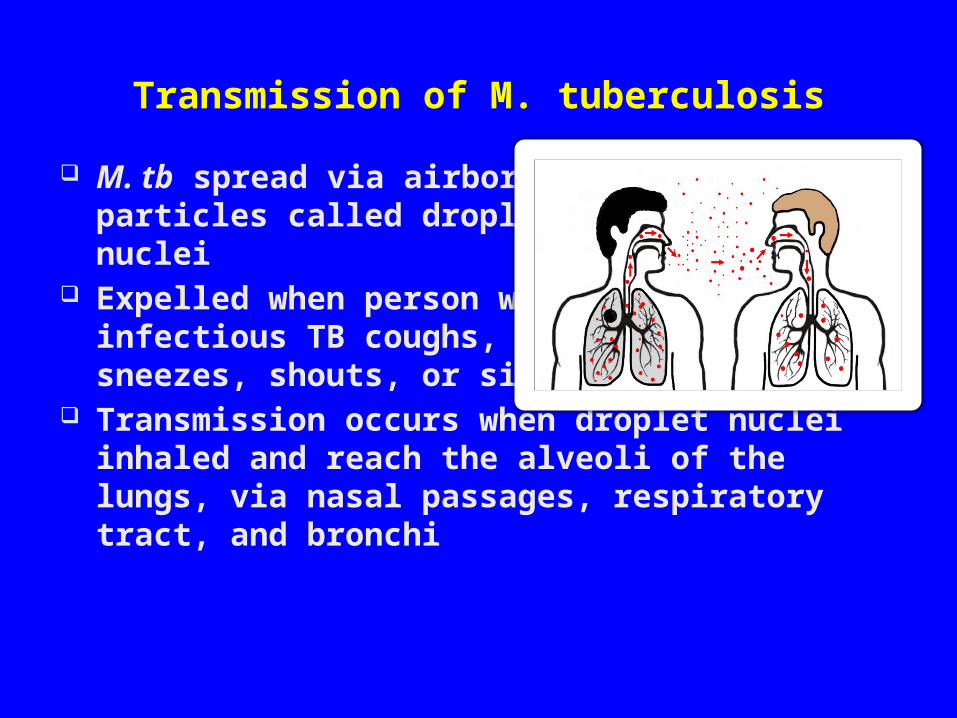
Transmission of M. tuberculosis
M. tb spread via airborneparticles called dropletnuclei
Expelled when person withinfectious TB coughs, sneezes, shouts, or sings
Transmission occurs when droplet nuclei inhaled and reach the alveoli of the lungs, via nasal passages, respiratory tract, and bronchi
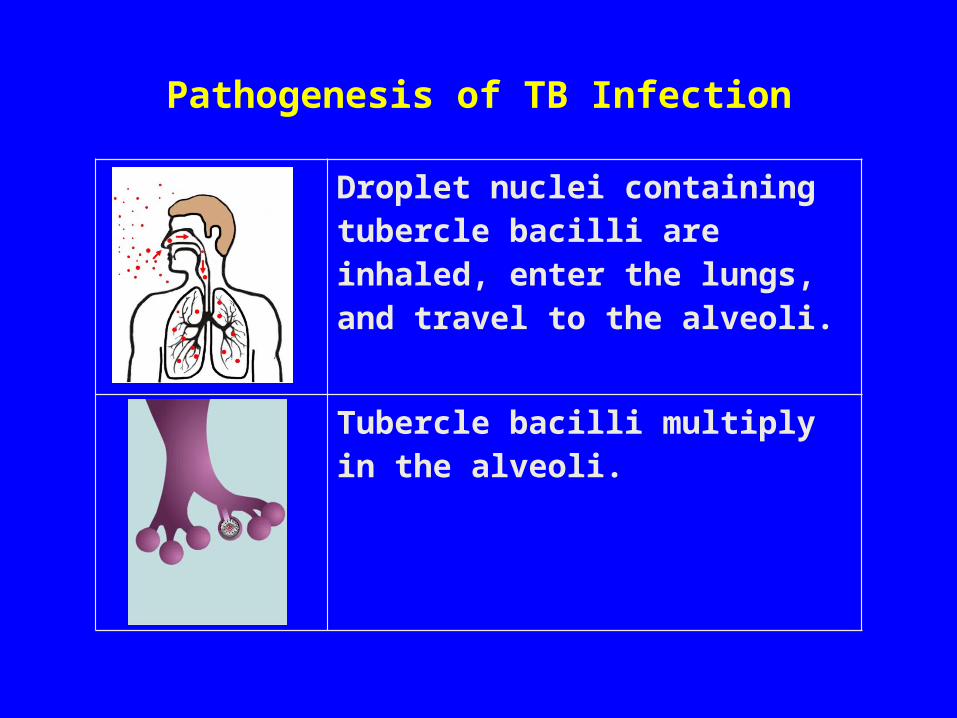
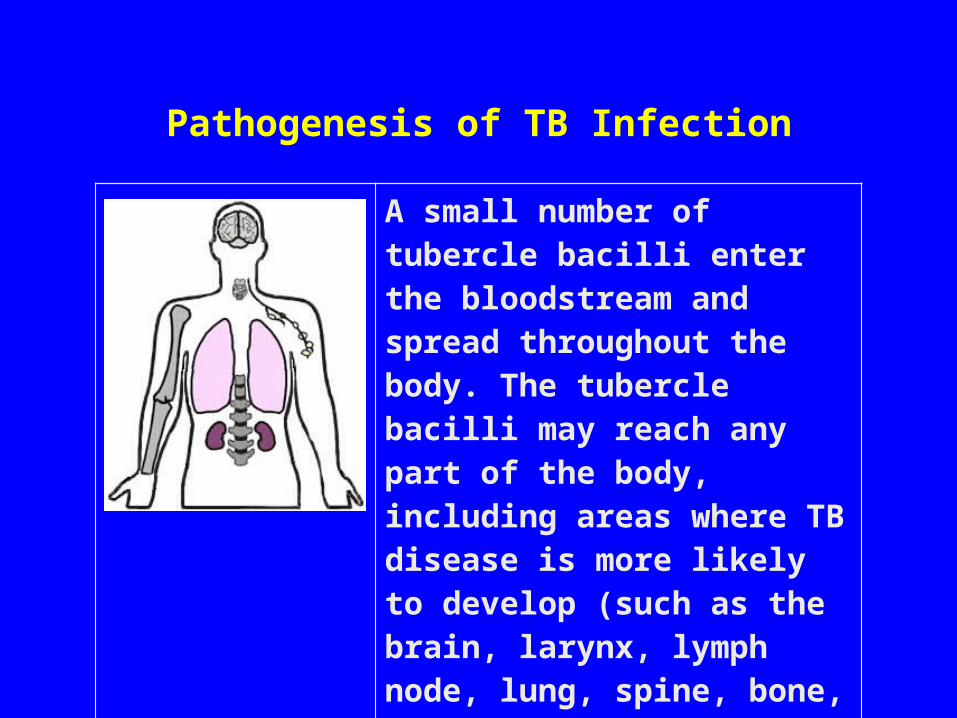
Pathogenesis of TB Infection
Droplet nuclei containing tubercle bacilli are inhaled, enter the lungs, and travel to the alveoli.
Tubercle bacilli multiply in the alveoli.
Pathogenesis of TB Infection
A small number of tubercle bacilli enter the bloodstream and spread throughout the body. The tubercle bacilli may reach any part of the body, including areas where TB disease is more likely to develop (such as the brain, larynx, lymph node, lung, spine, bone, or kidney).
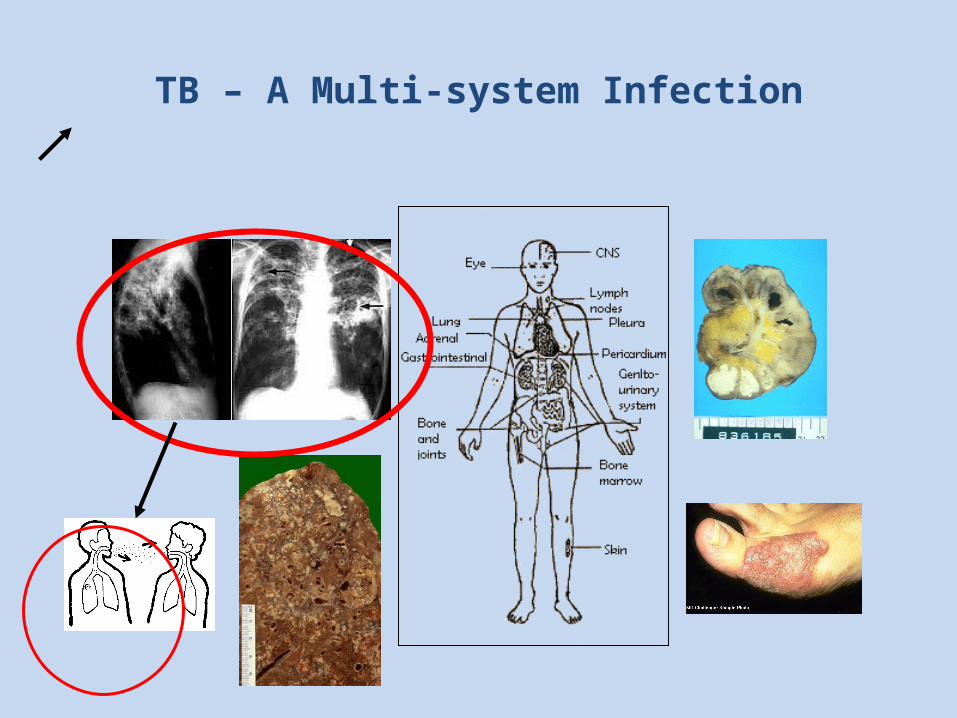
TB – A Multi-system Infection
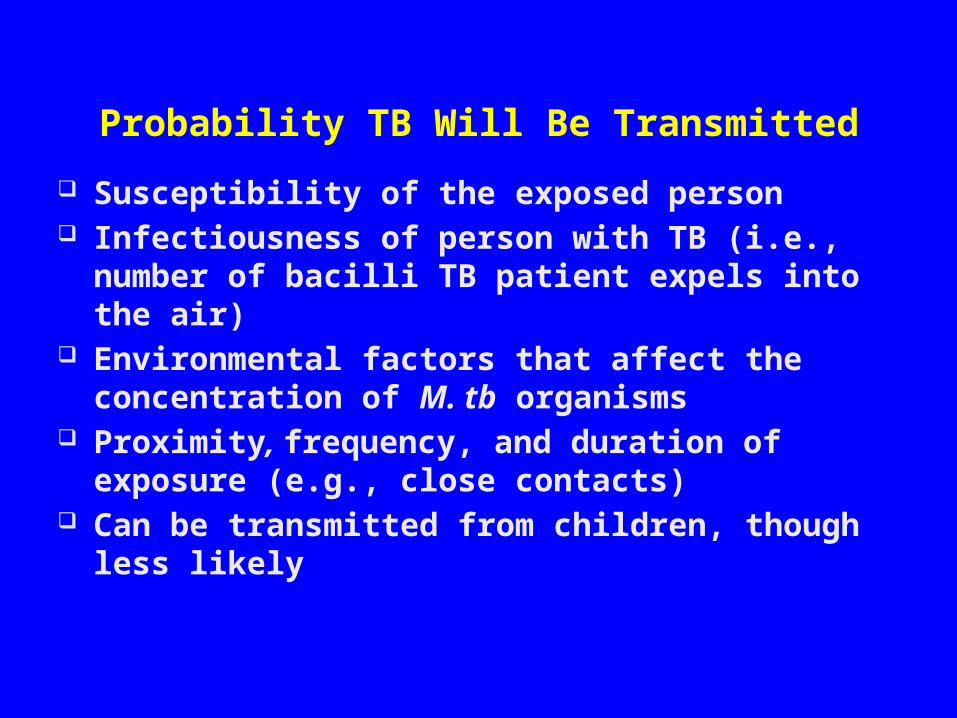
Probability TB Will Be Transmitted
Susceptibility of the exposed person Infectiousness of person with TB (i.e., number of bacilli TB
patient expels into the air) Environmental factors that affect the concentration of M. tb
organisms Proximity, frequency, and duration of exposure (e.g., close
contacts) Can be transmitted from children, though less likely
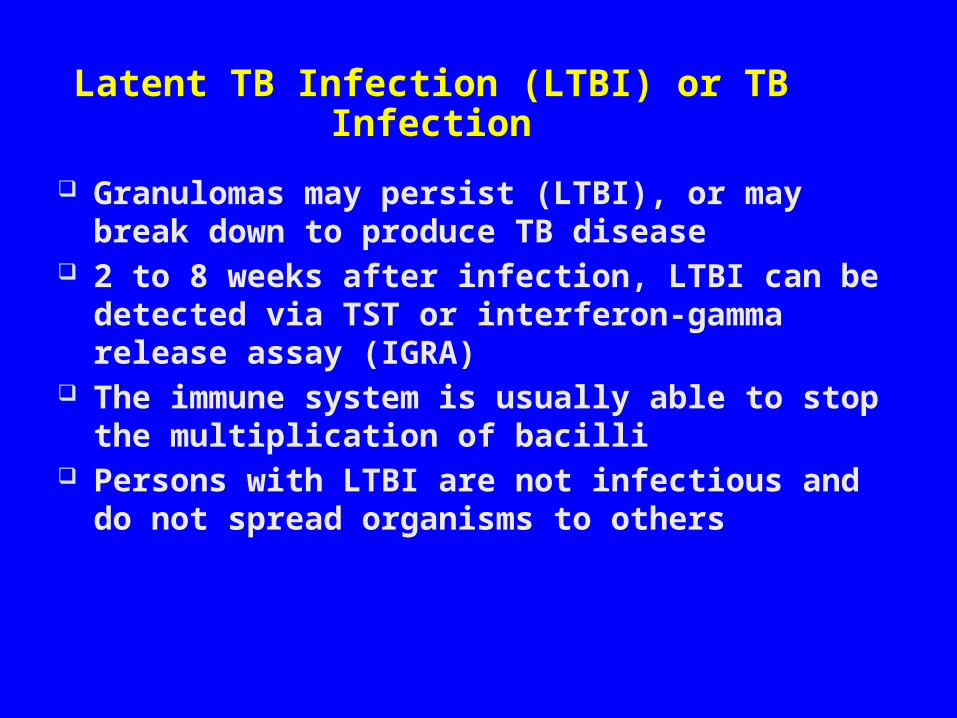
Latent TB Infection (LTBI) or TB Infection
Granulomas may persist (LTBI), or may break down to produce TB disease
2 to 8 weeks after infection, LTBI can be detected via TST or interferon-gamma release assay (IGRA)
The immune system is usually able to stop the multiplication of bacilli
Persons with LTBI are not infectious and do not spread organisms to others
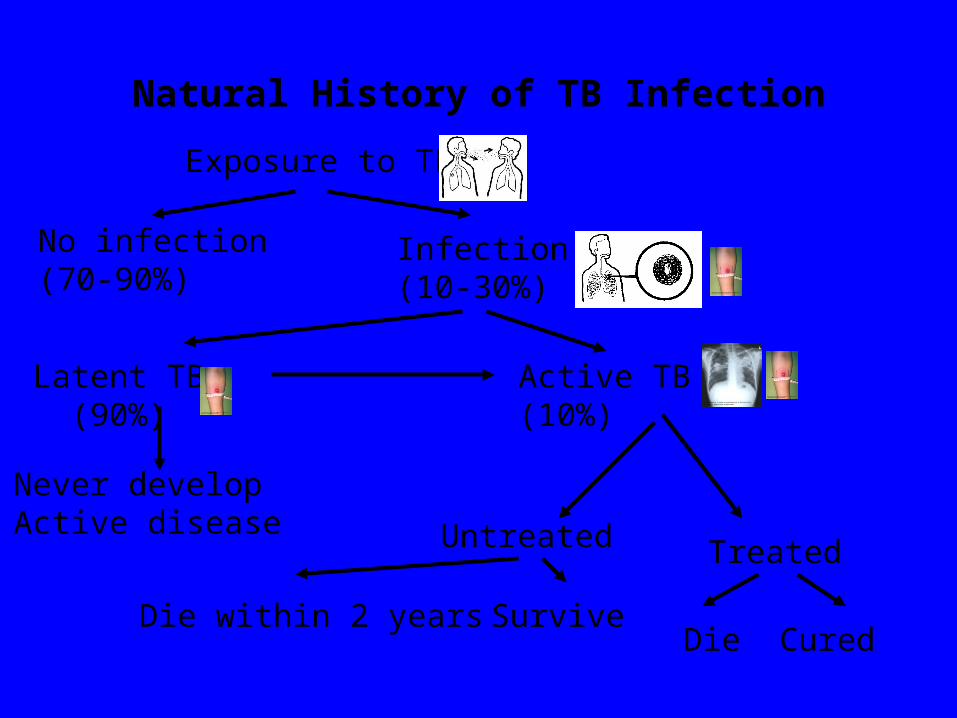
Natural History of TB Infection
Exposure to TB
No infection (70-90%)
Infection(10-30%)
Latent TB (90%)
Active TB(10%)
Untreated
Die within 2 years Survive
Treated
Die Cured
Never develop Active disease
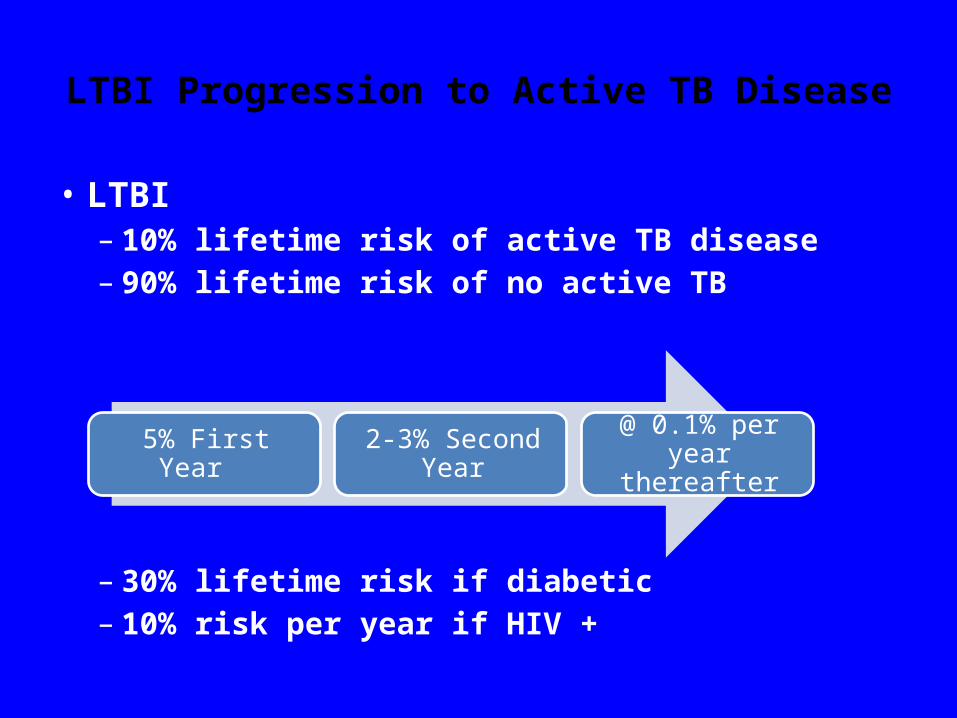
LTBI Progression to Active TB Disease
• LTBI– 10% lifetime risk of active TB disease– 90% lifetime risk of no active TB
– 30% lifetime risk if diabetic– 10% risk per year if HIV +
5% First Year 2-3% Second Year @ 0.1% per year thereafter
TB Disease
In some, the granulomas break down, bacilli escape and multiply, resulting in TB disease
Can occur soon after infection, or years later Persons with TB disease are usually infectious and can
spread bacteria to others Positive M. tb culture confirms TB diagnosis
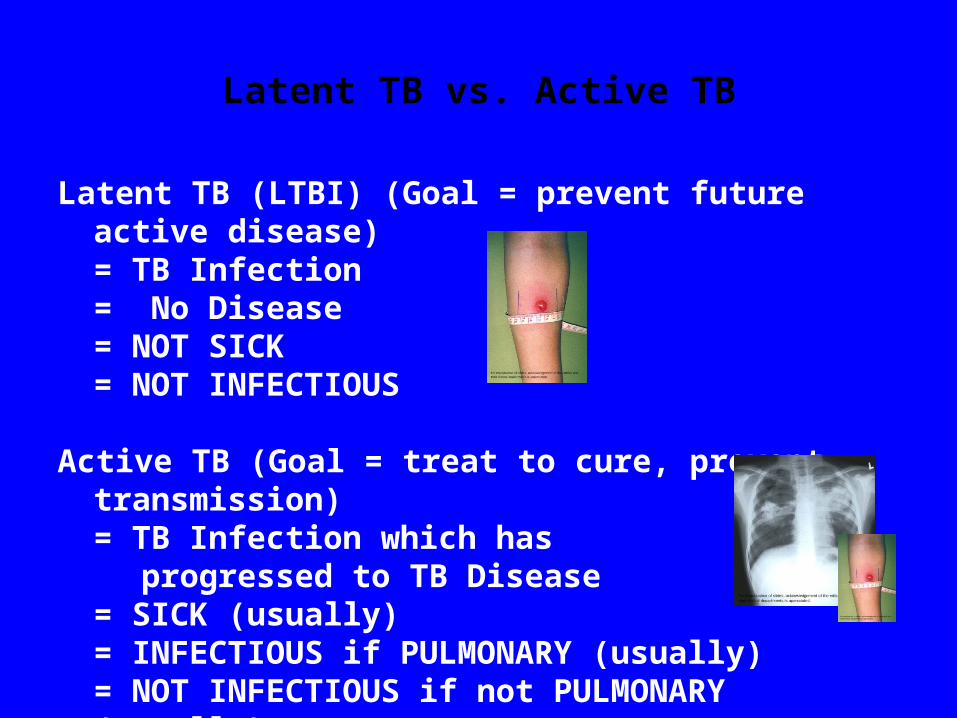
Latent TB vs. Active TB
Latent TB (LTBI) (Goal = prevent future active disease)= TB Infection = No Disease = NOT SICK = NOT INFECTIOUS
Active TB (Goal = treat to cure, prevent transmission)= TB Infection which has
progressed to TB Disease= SICK (usually)= INFECTIOUS if PULMONARY (usually)= NOT INFECTIOUS if not PULMONARY (usually)
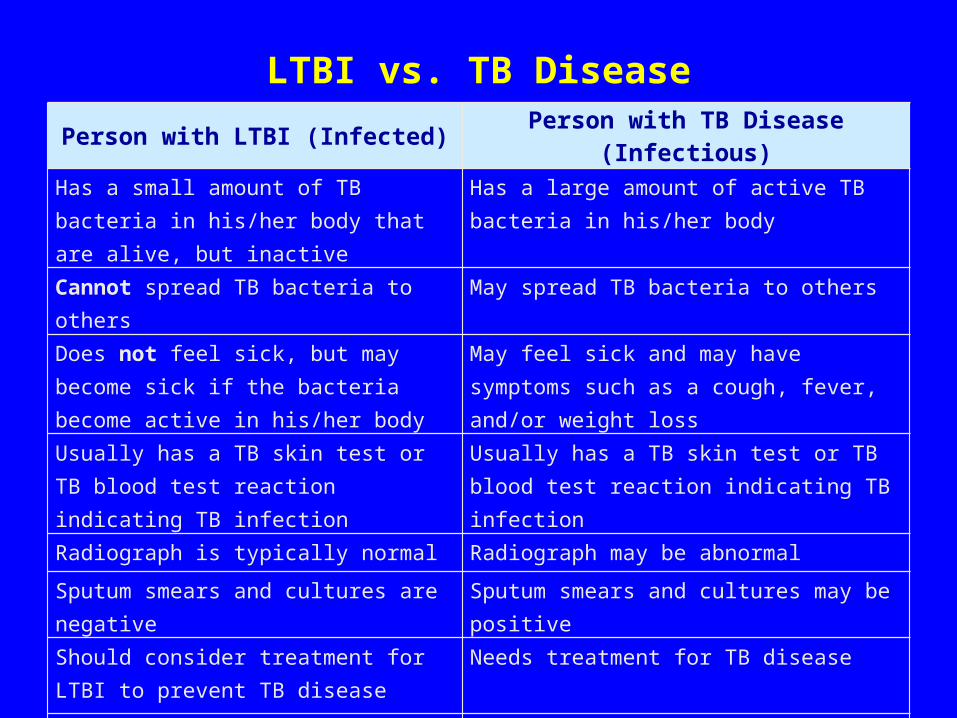
LTBI vs. TB DiseasePerson with LTBI (Infected) Person with TB Disease (Infectious)
Has a small amount of TB bacteria in his/her body that are alive, but inactive
Has a large amount of active TB bacteria in his/her body
Cannot spread TB bacteria to others May spread TB bacteria to others
Does not feel sick, but may become sick if the bacteria become active in his/her body
May feel sick and may have symptoms such as a cough, fever, and/or weight loss
Usually has a TB skin test or TB blood test reaction indicating TB infection
Usually has a TB skin test or TB blood test reaction indicating TB infection
Radiograph is typically normal Radiograph may be abnormal
Sputum smears and cultures are negative Sputum smears and cultures may be positive
Should consider treatment for LTBI to prevent TB disease
Needs treatment for TB disease
Does not require respiratory isolation May require respiratory isolation
Not a TB case A TB case
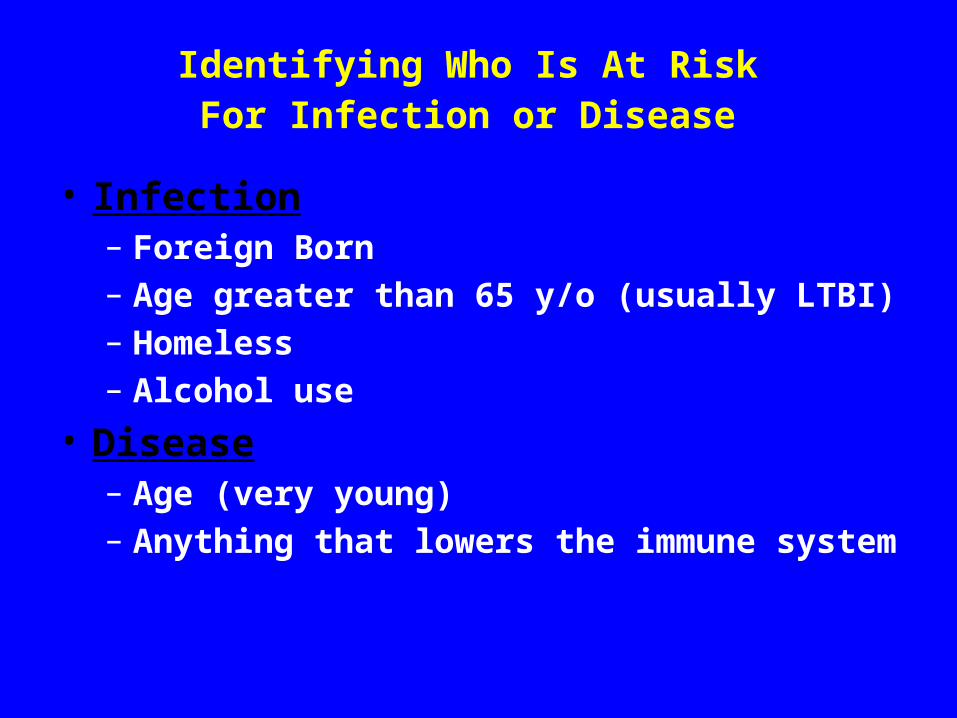
Identifying Who Is At Risk For Infection or Disease
• Infection– Foreign Born – Age greater than 65 y/o (usually LTBI)– Homeless– Alcohol use
• Disease– Age (very young)– Anything that lowers the immune system
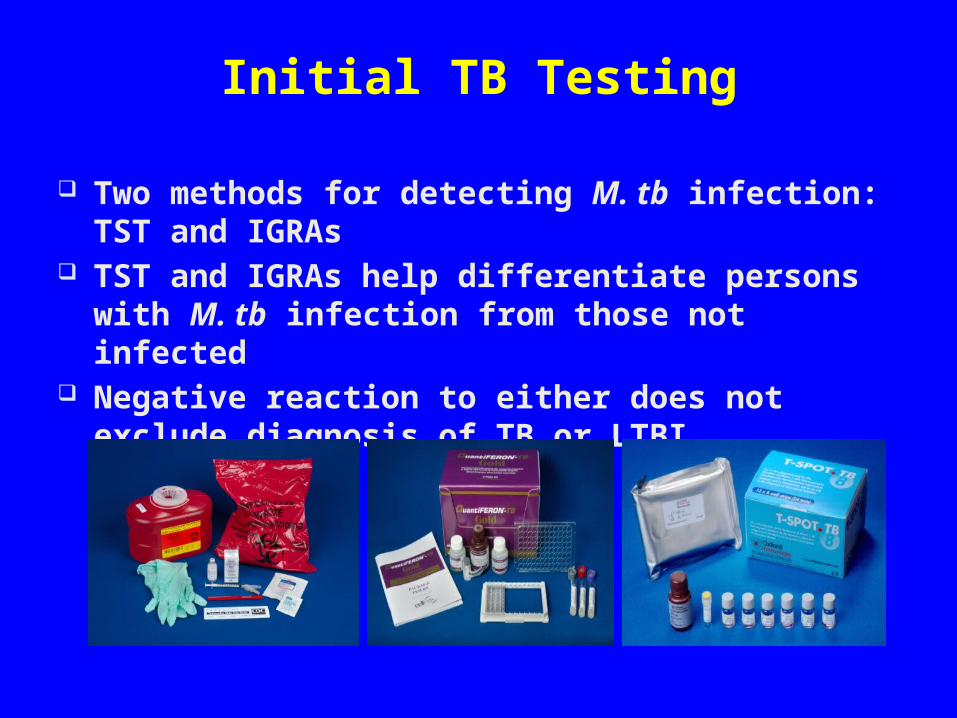
Initial TB Testing
Two methods for detecting M. tb infection: TST and IGRAs TST and IGRAs help differentiate persons with M. tb
infection from those not infected Negative reaction to either does not exclude diagnosis of TB
or LTBI
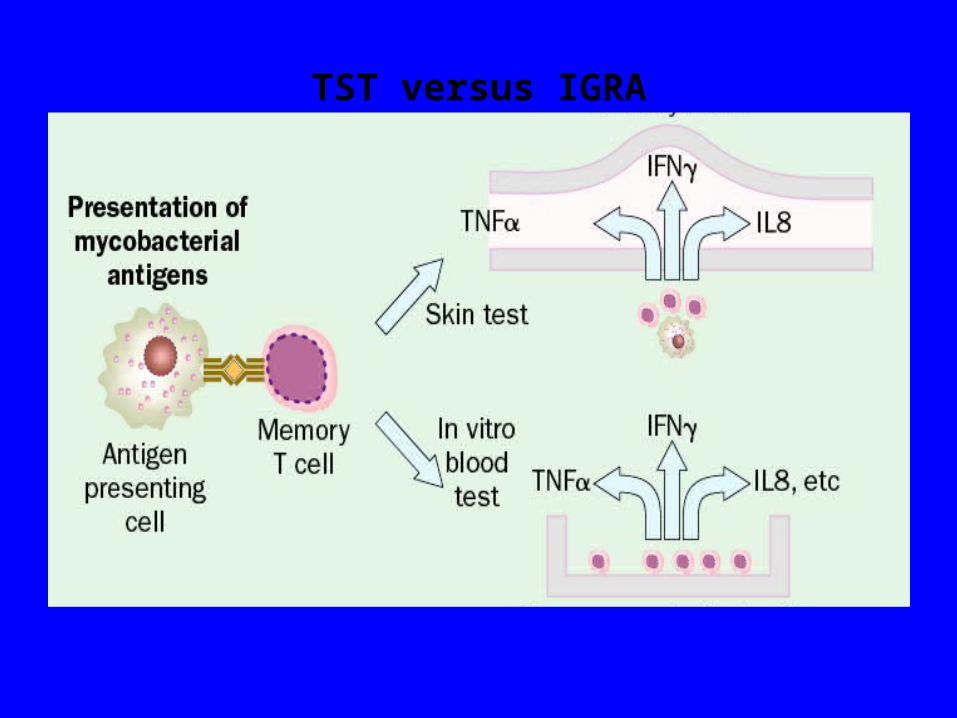
TST versus IGRA
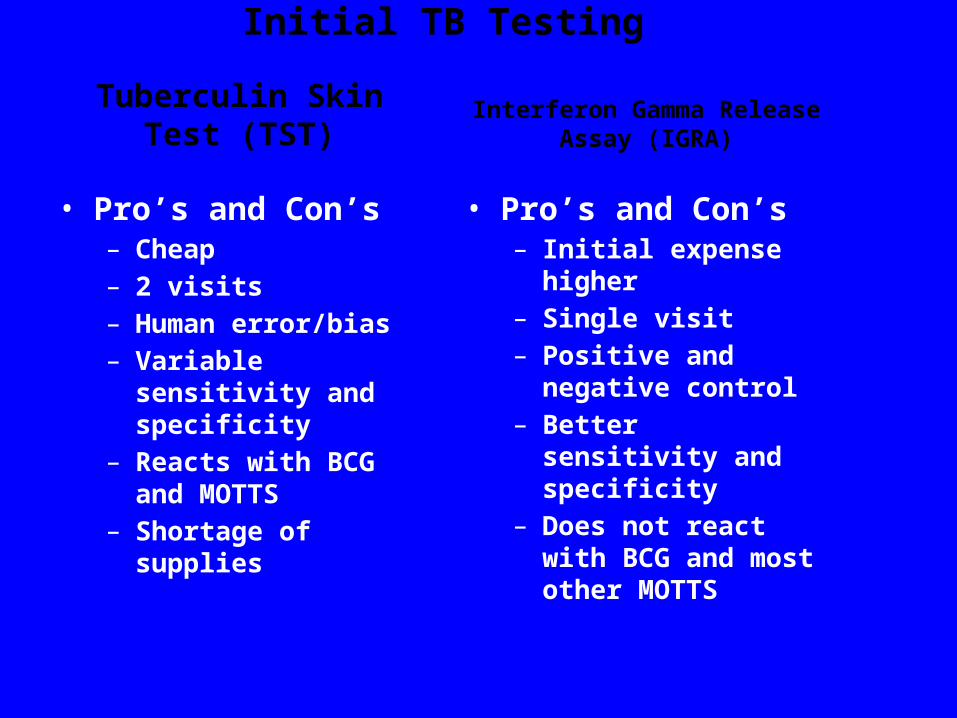
Initial TB Testing
• Pro’s and Con’s– Cheap– 2 visits– Human error/bias– Variable sensitivity and
specificity– Reacts with BCG and
MOTTS– Shortage of supplies
• Pro’s and Con’s– Initial expense higher– Single visit– Positive and negative
control– Better sensitivity and
specificity– Does not react with BCG
and most other MOTTS
Tuberculin Skin Test (TST)Interferon Gamma Release Assay
(IGRA)
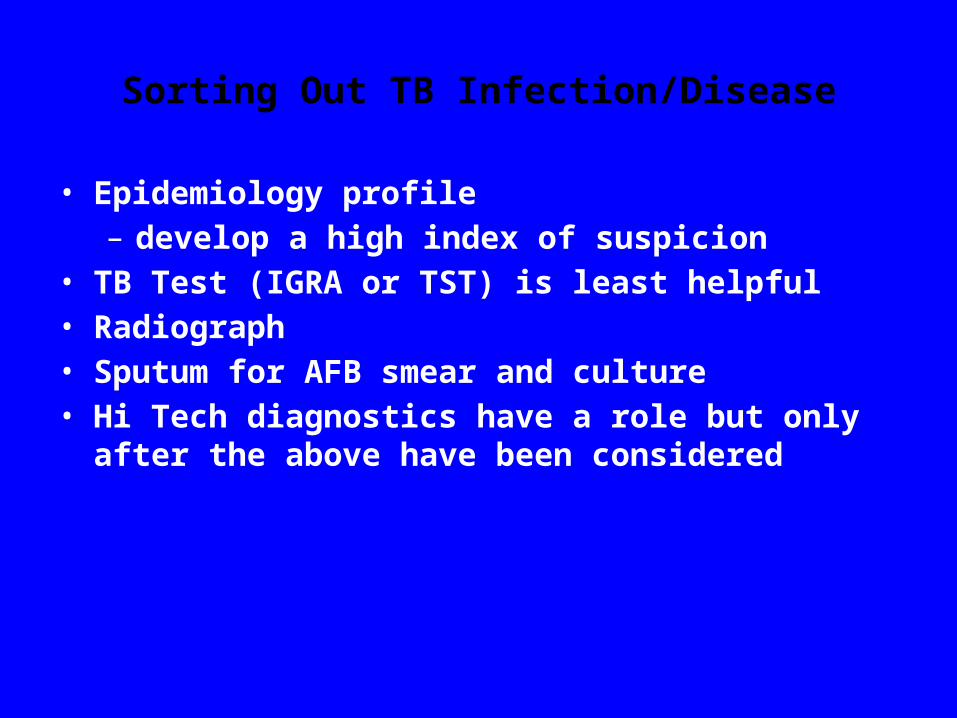
Sorting Out TB Infection/Disease
• Epidemiology profile – develop a high index of suspicion
• TB Test (IGRA or TST) is least helpful• Radiograph• Sputum for AFB smear and culture• Hi Tech diagnostics have a role but only after the above have
been considered
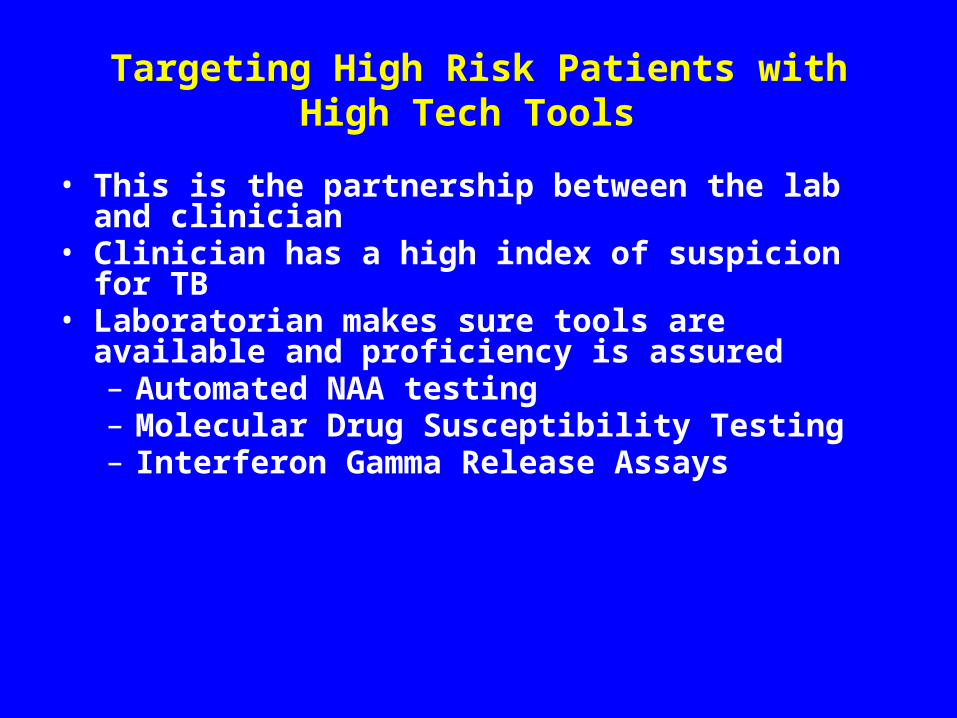
Targeting High Risk Patients with High Tech Tools
• This is the partnership between the lab and clinician• Clinician has a high index of suspicion for TB• Laboratorian makes sure tools are available and proficiency
is assured– Automated NAA testing– Molecular Drug Susceptibility Testing– Interferon Gamma Release Assays
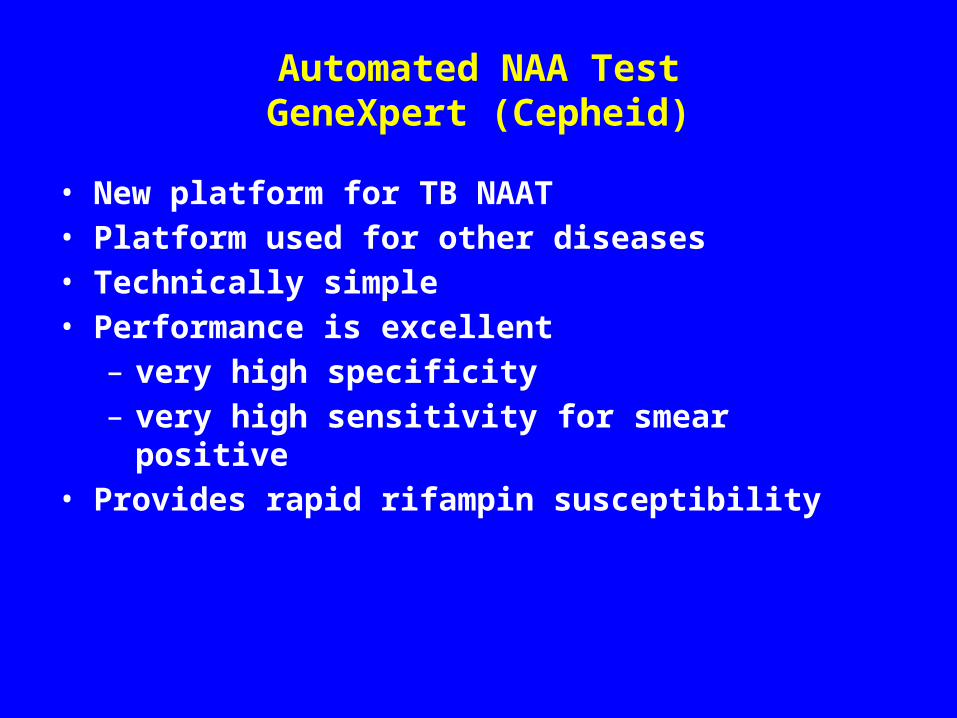
Automated NAA TestGeneXpert (Cepheid)
• New platform for TB NAAT• Platform used for other diseases• Technically simple• Performance is excellent
– very high specificity– very high sensitivity for smear positive
• Provides rapid rifampin susceptibility
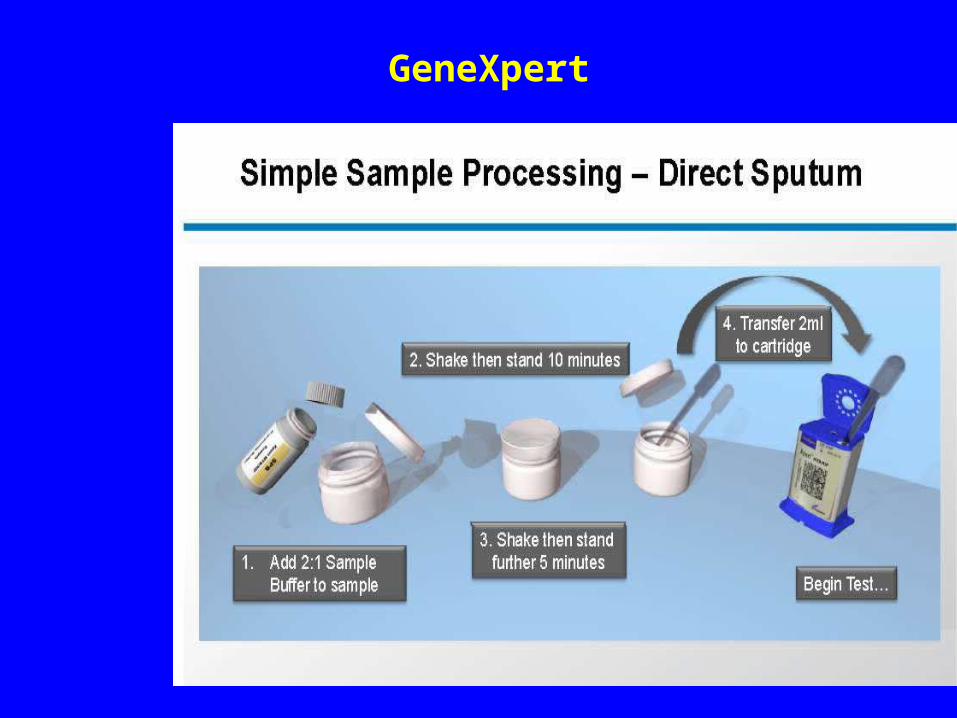
GeneXpert
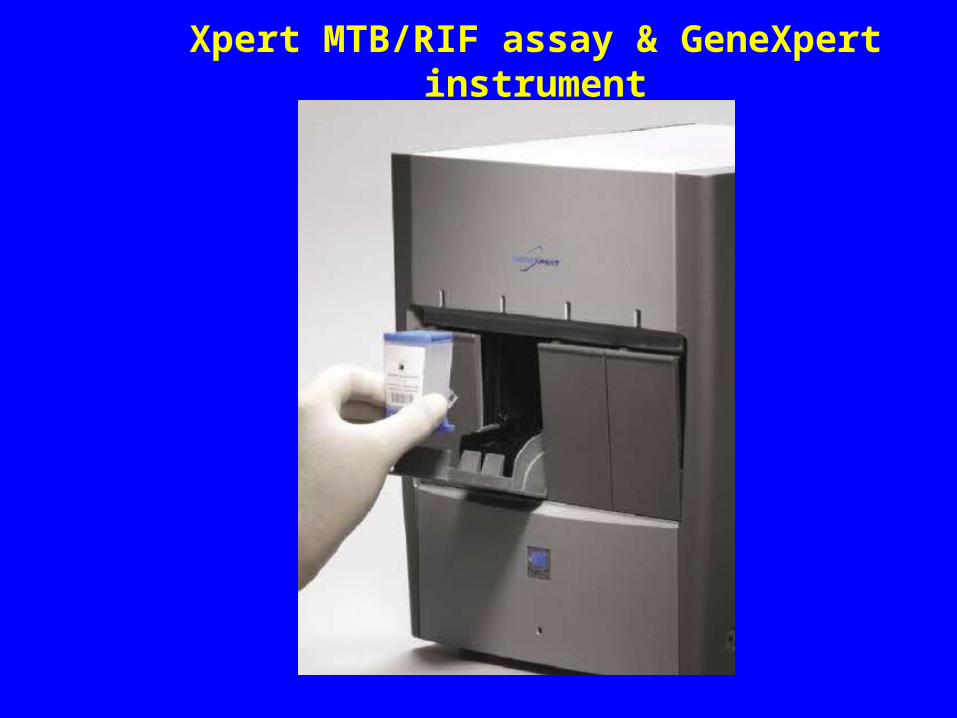
Xpert MTB/RIF assay & GeneXpert instrument
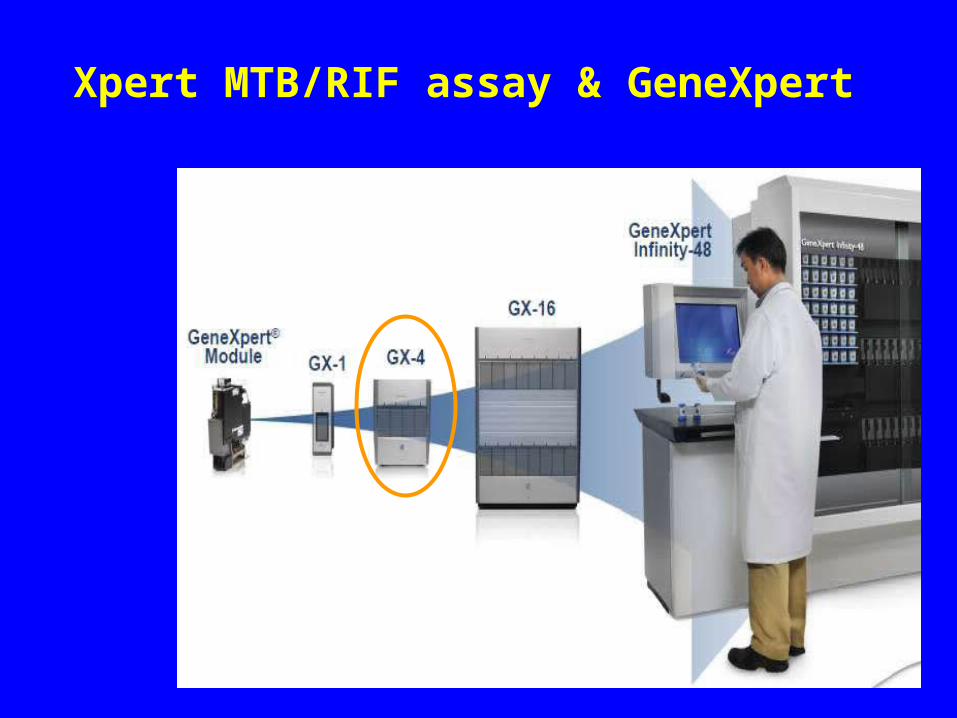
Xpert MTB/RIF assay & GeneXpert
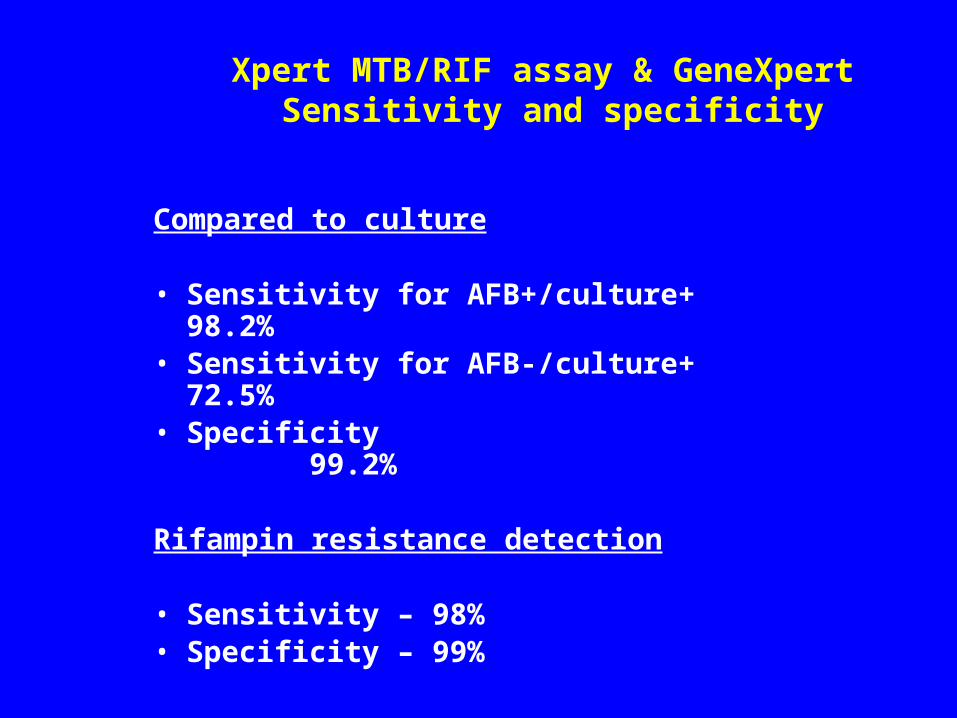
Compared to culture
• Sensitivity for AFB+/culture+ 98.2%• Sensitivity for AFB-/culture+ 72.5%• Specificity 99.2%
Rifampin resistance detection
• Sensitivity – 98%• Specificity – 99%
Xpert MTB/RIF assay & GeneXpert Sensitivity and specificity
Universal Genotyping
• All TB cultures are now sent to CDC sponsored labs for “fingerprinting” from each state
• Goal is to detect clusters
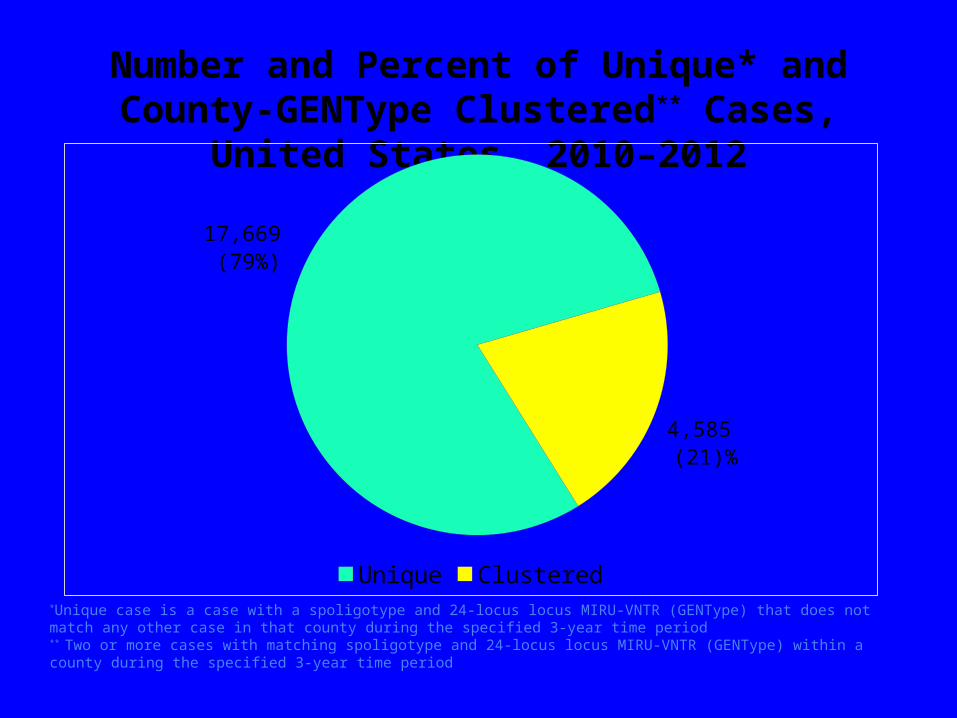
Number and Percent of Unique* andCounty-GENType Clustered** Cases,
United States, 2010–2012
17,669 (79%)
4,585 (21)%
Unique Clustered*Unique case is a case with a spoligotype and 24-locus locus MIRU-VNTR (GENType) that does not match any other case in that county during the specified 3-year time period** Two or more cases with matching spoligotype and 24-locus locus MIRU-VNTR (GENType) within a county during the specified 3-year time period
Molecular Detection of Drug Resistance
• CDC offers a semi-automated rapid detection of drug resistance in isolates
• Using conventional PCR and DNA sequencing• Looks for common mutations associated with drug
resistance• The resistance testing will define MDR and XDR
Molecular Detection of Drug Resistance
• Drug Resistance Testing– INH – Rifampin– FQ– KAN– AMK– CAP
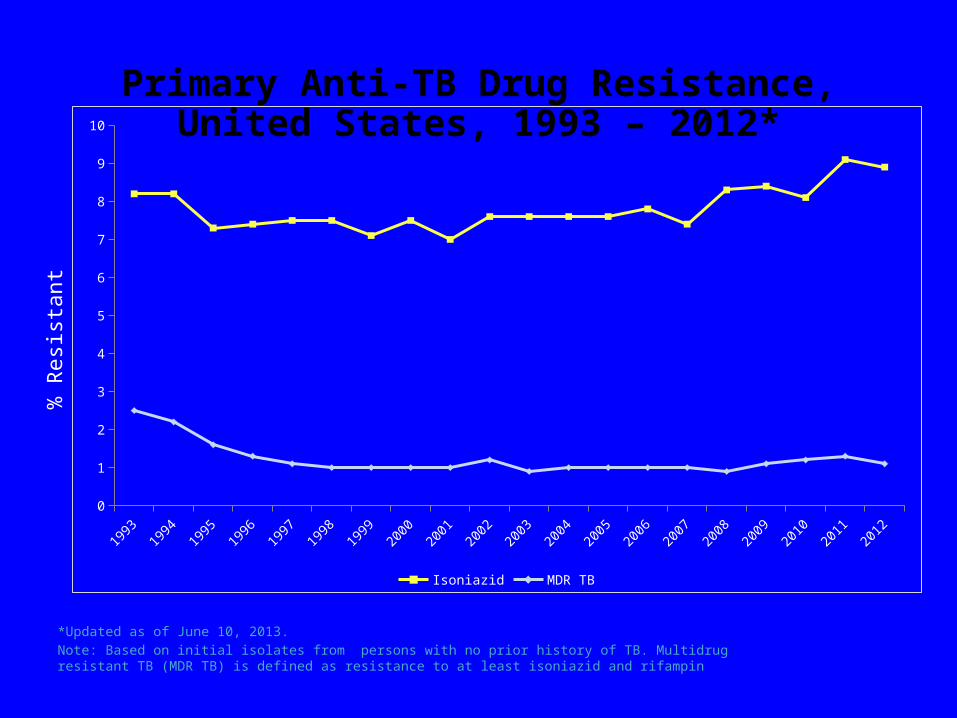
Primary Anti-TB Drug Resistance,United States, 1993 – 2012*
*Updated as of June 10, 2013.Note: Based on initial isolates from persons with no prior history of TB. Multidrug resistant TB (MDR TB) is defined as resistance to at least isoniazid and rifampin
% R
esis
tant
19931994
19951996
19971998
19992000
20012002
20032004
20052006
20072008
20092010
20112012
0
1
2
3
4
5
6
7
8
9
10
Isoniazid MDR TB
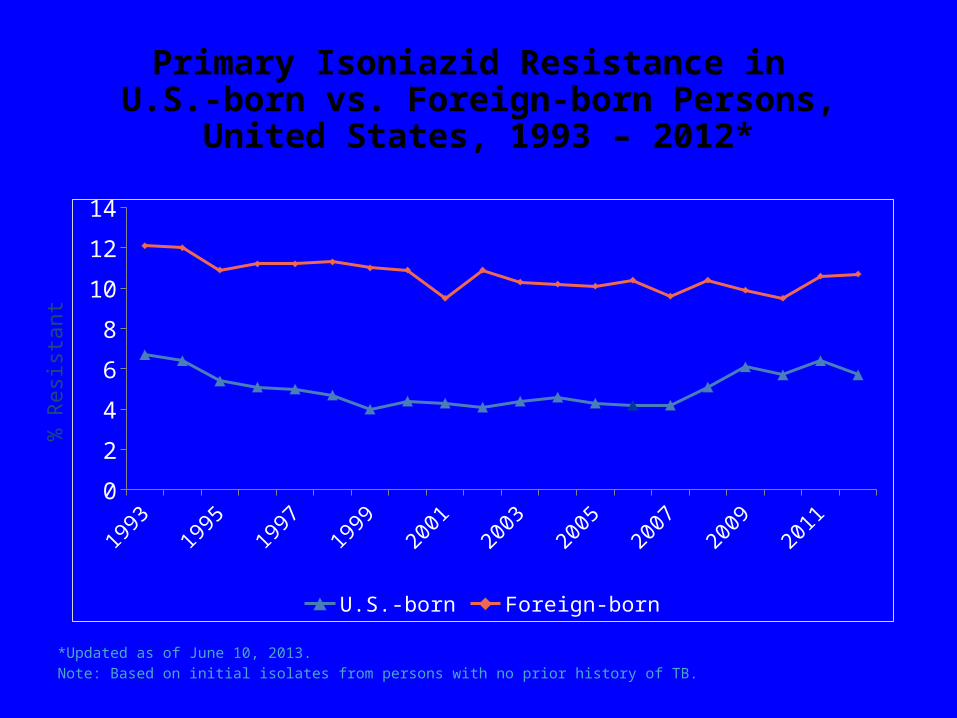
Primary Isoniazid Resistance in U.S.-born vs. Foreign-born Persons,
United States, 1993 – 2012*
*Updated as of June 10, 2013.Note: Based on initial isolates from persons with no prior history of TB.
% R
esis
tant
19931994
19951996
19971998
19992000
20012002
20032004
20052006
20072008
20092010
20112012
0
2
4
6
8
10
12
14
U.S.-born Foreign-born
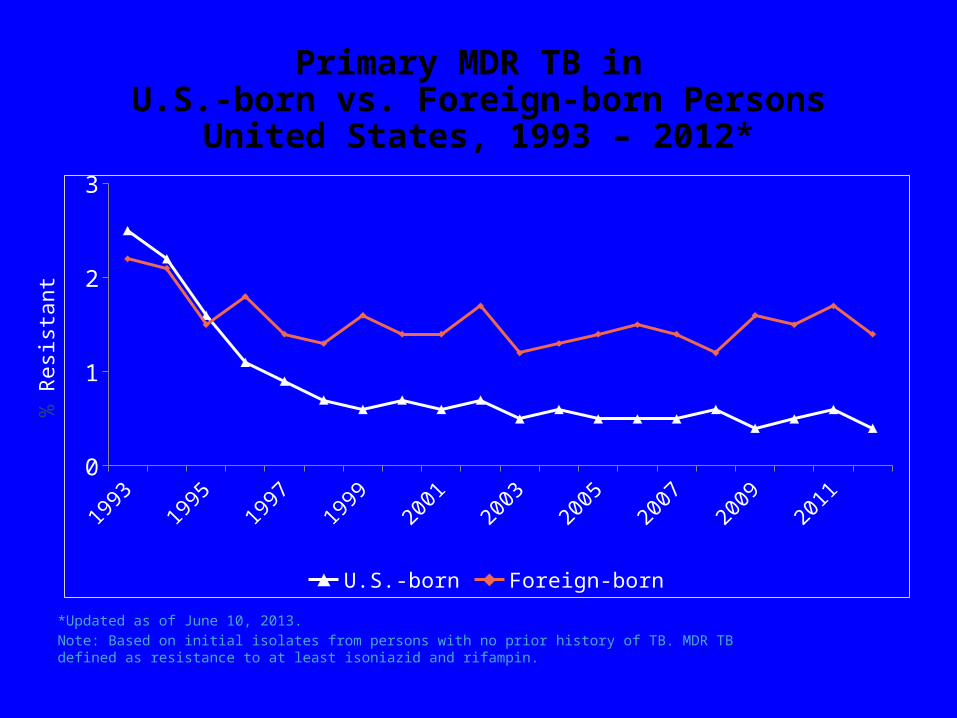
*Updated as of June 10, 2013.Note: Based on initial isolates from persons with no prior history of TB. MDR TB defined as resistance to at least isoniazid and rifampin.
Primary MDR TB in U.S.-born vs. Foreign-born Persons
United States, 1993 – 2012*
% R
esis
tant
19931994
19951996
19971998
19992000
20012002
20032004
20052006
20072008
20092010
20112012
0
1
2
3
U.S.-born Foreign-born
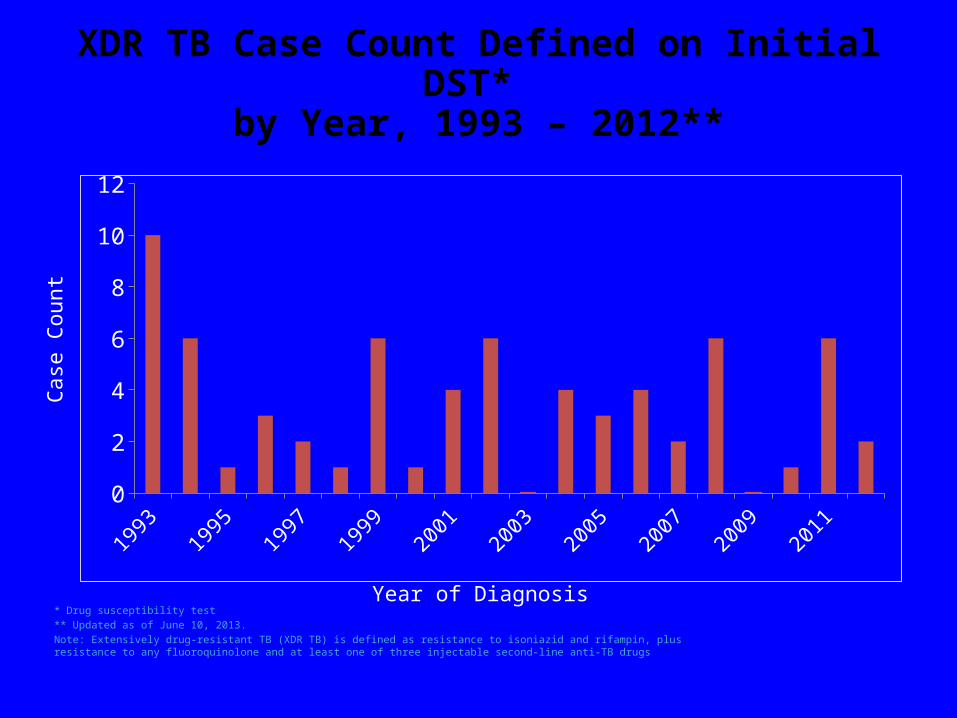
XDR TB Case Count Defined on Initial DST* by Year, 1993 – 2012**
* Drug susceptibility test** Updated as of June 10, 2013.Note: Extensively drug-resistant TB (XDR TB) is defined as resistance to isoniazid and rifampin, plus resistance to any fluoroquinolone and at least one of three injectable second-line anti-TB drugs
Case
Cou
nt
Year of Diagnosis1993
19941995
19961997
19981999
20002001
20022003
20042005
20062007
20082009
20102011
20120
2
4
6
8
10
12
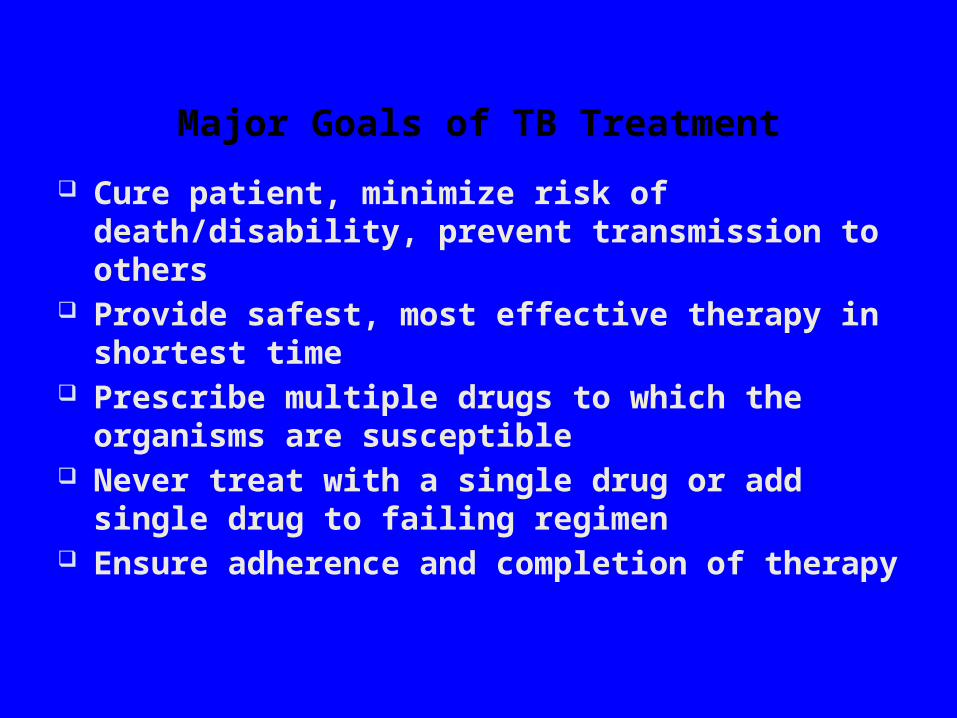
Major Goals of TB Treatment
Cure patient, minimize risk of death/disability, prevent transmission to others
Provide safest, most effective therapy in shortest time Prescribe multiple drugs to which the organisms are
susceptible Never treat with a single drug or add single drug to failing
regimen Ensure adherence and completion of therapy
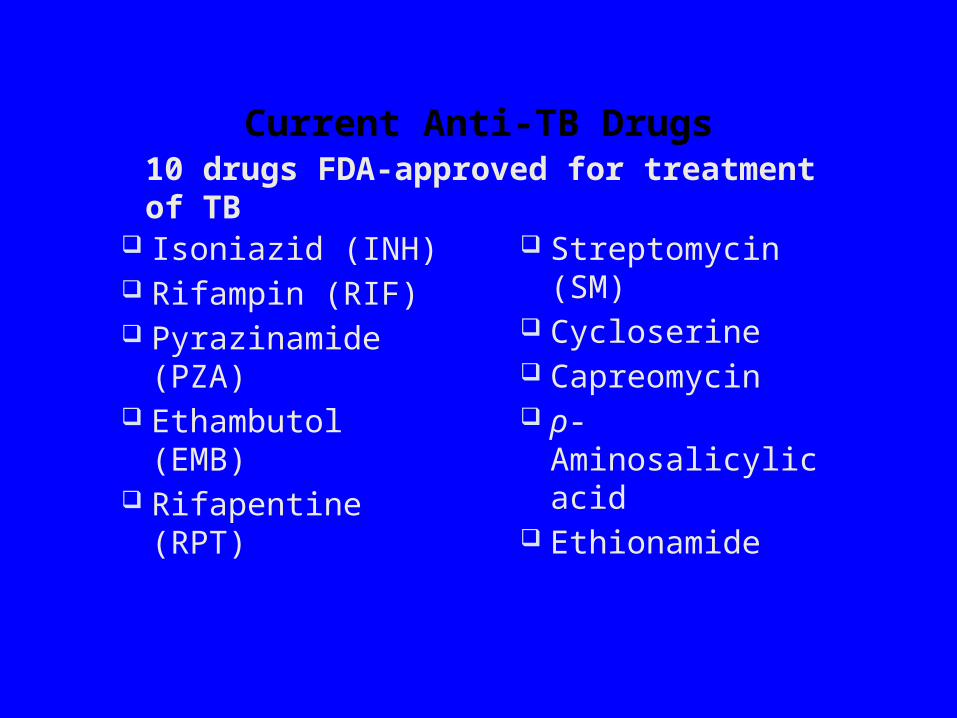
Current Anti-TB Drugs
Isoniazid (INH) Rifampin (RIF) Pyrazinamide (PZA) Ethambutol (EMB) Rifapentine (RPT)
10 drugs FDA-approved for treatment of TB
Streptomycin (SM) Cycloserine Capreomycin ρ-Aminosalicylic acid Ethionamide
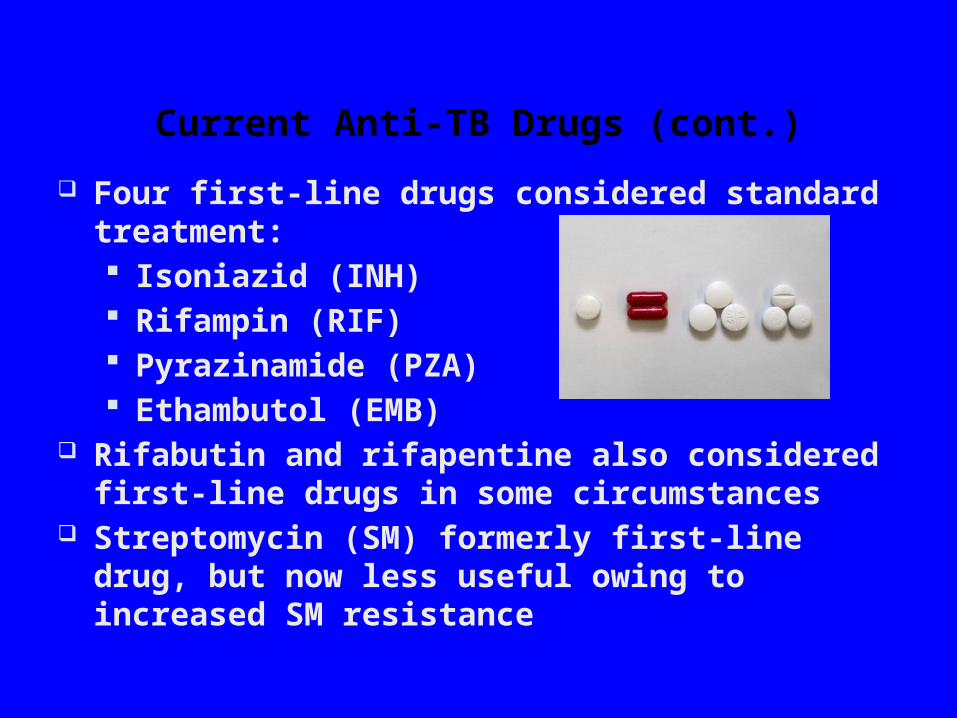
Current Anti-TB Drugs (cont.)
Four first-line drugs considered standard treatment: Isoniazid (INH) Rifampin (RIF) Pyrazinamide (PZA) Ethambutol (EMB)
Rifabutin and rifapentine also considered first-line drugs in some circumstances
Streptomycin (SM) formerly first-line drug, but now less useful owing to increased SM resistance
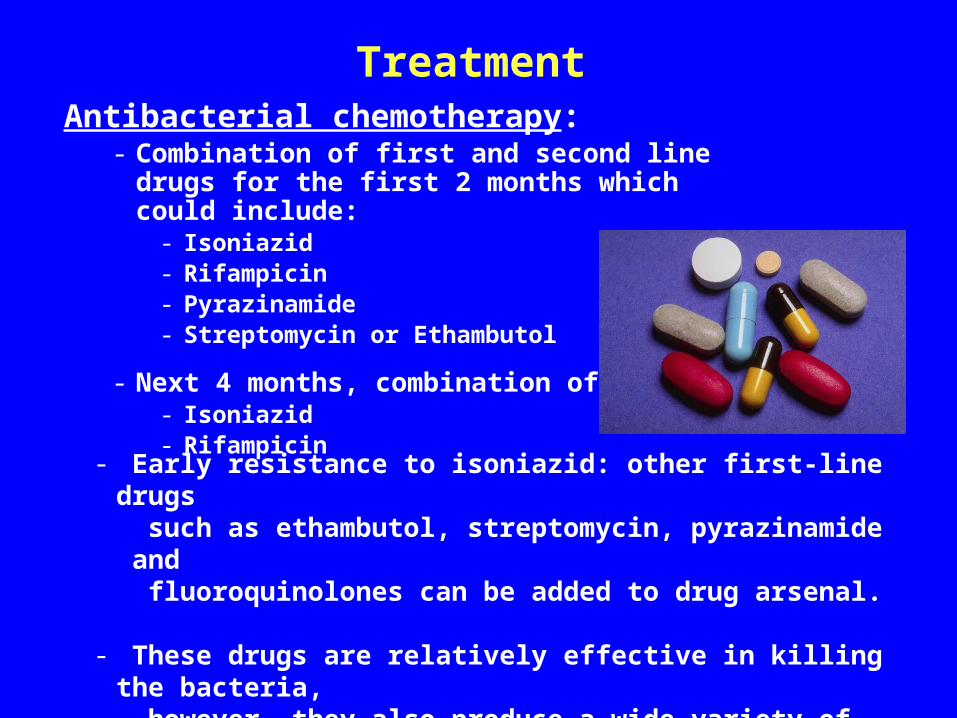
Antibacterial chemotherapy:- Combination of first and second line drugs for the first 2
months which could include:- Isoniazid- Rifampicin- Pyrazinamide- Streptomycin or Ethambutol
- Next 4 months, combination of:- Isoniazid- Rifampicin
Treatment
- Early resistance to isoniazid: other first-line drugs such as ethambutol, streptomycin, pyrazinamide and fluoroquinolones can be added to drug arsenal.
- These drugs are relatively effective in killing the bacteria, however, they also produce a wide variety of side effects.
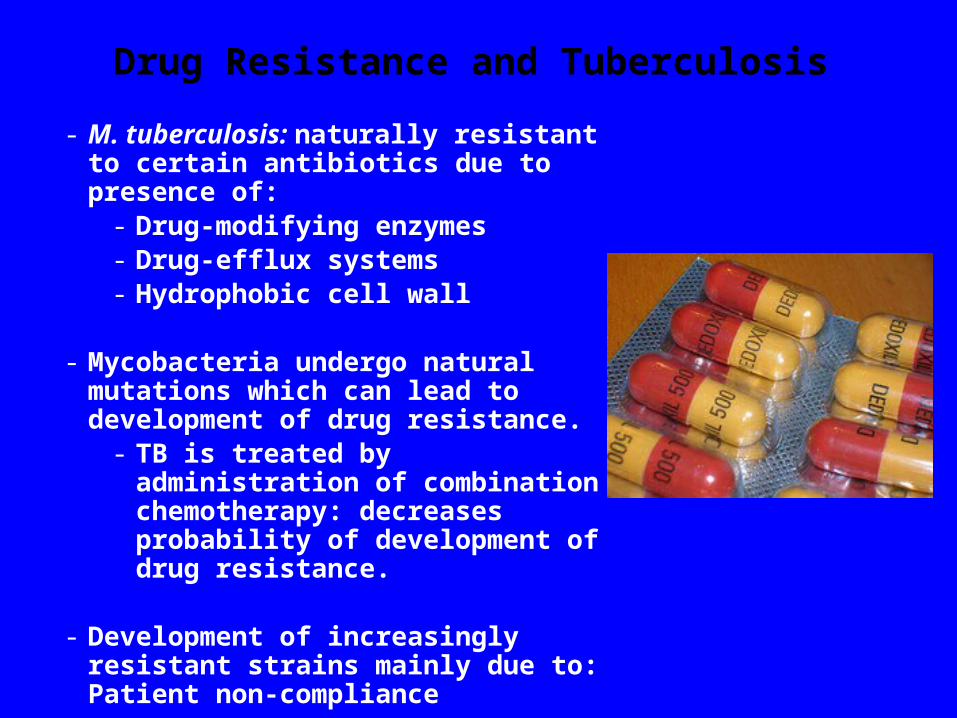
- M. tuberculosis: naturally resistant to certain antibiotics due to presence of:
- Drug-modifying enzymes- Drug-efflux systems- Hydrophobic cell wall
- Mycobacteria undergo natural mutations which can lead to development of drug resistance.
- TB is treated by administration of combination chemotherapy: decreases probability of development of drug resistance.
- Development of increasingly resistant strains mainly due to: Patient non-compliance
Drug Resistance and Tuberculosis
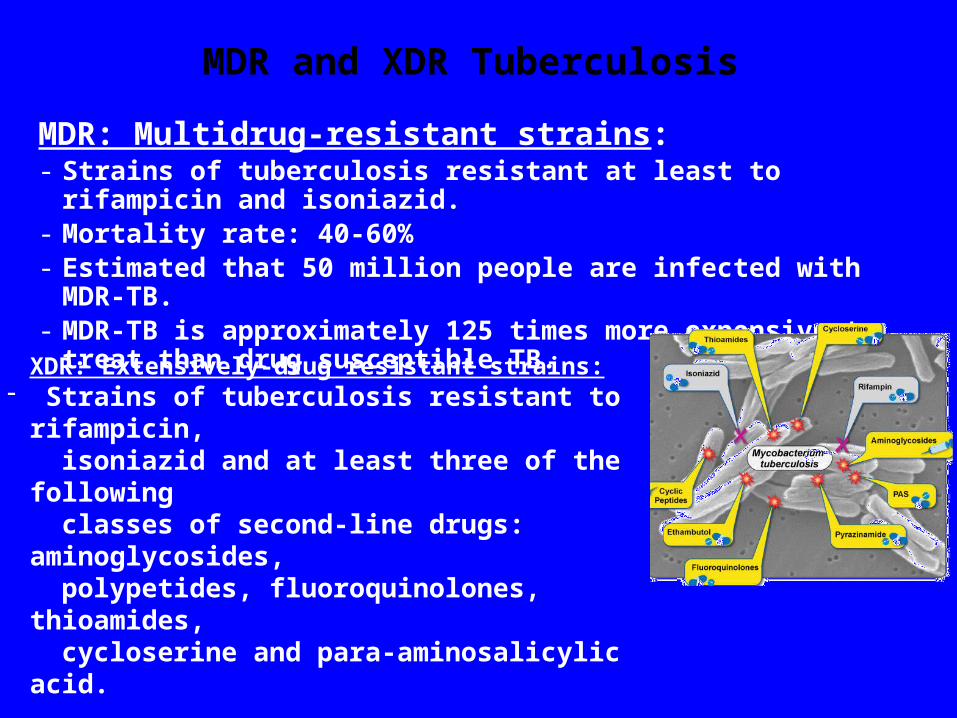
MDR: Multidrug-resistant strains:- Strains of tuberculosis resistant at least to rifampicin and isoniazid.- Mortality rate: 40-60%- Estimated that 50 million people are infected with MDR-TB.- MDR-TB is approximately 125 times more expensive to treat than drug
susceptible TB.
MDR and XDR Tuberculosis
XDR: Extensively-drug resistant strains:- Strains of tuberculosis resistant to rifampicin,
isoniazid and at least three of the following classes of second-line drugs: aminoglycosides, polypetides, fluoroquinolones, thioamides, cycloserine and para-aminosalicylic acid.
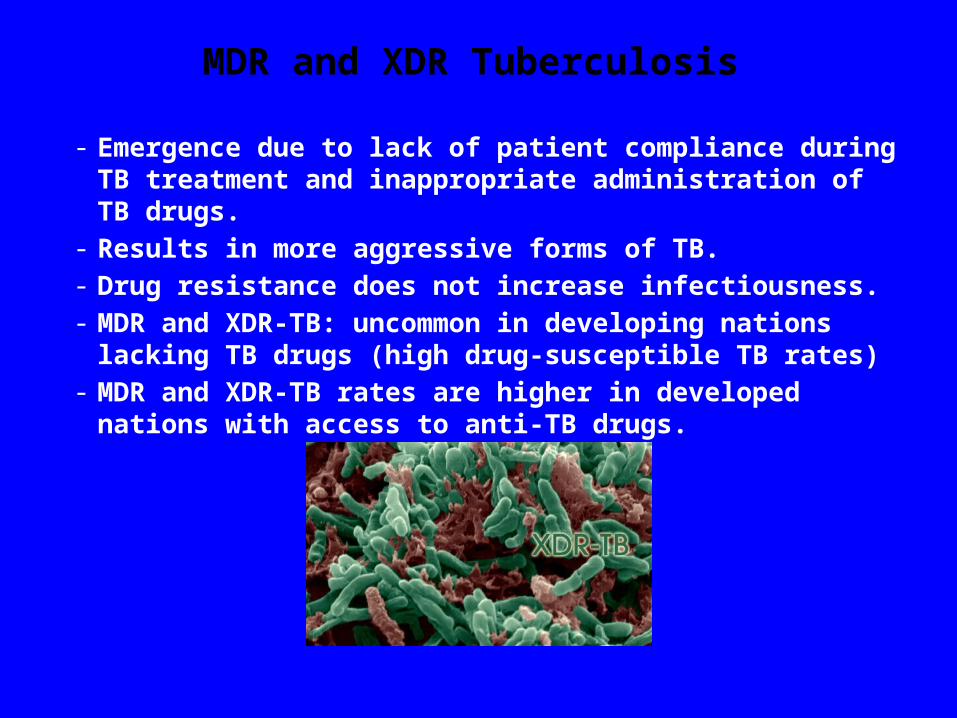
- Emergence due to lack of patient compliance during TB treatment and inappropriate administration of TB drugs.
- Results in more aggressive forms of TB.- Drug resistance does not increase infectiousness. - MDR and XDR-TB: uncommon in developing nations lacking TB drugs
(high drug-susceptible TB rates)- MDR and XDR-TB rates are higher in developed nations with access to
anti-TB drugs.
MDR and XDR Tuberculosis
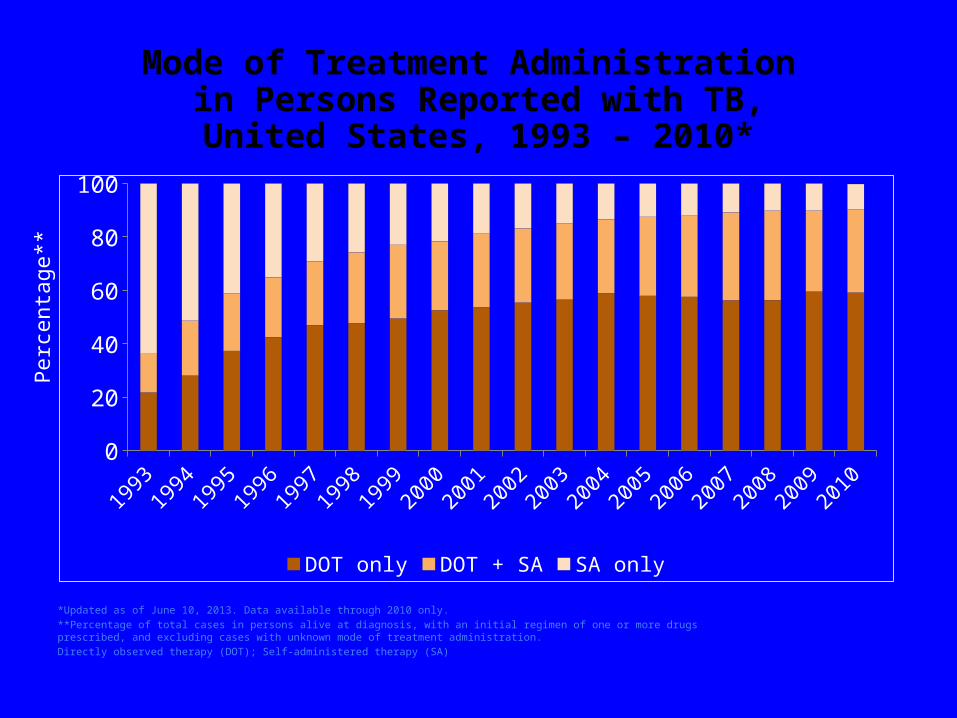
Mode of Treatment Administration in Persons Reported with TB,United States, 1993 – 2010*
*Updated as of June 10, 2013. Data available through 2010 only.**Percentage of total cases in persons alive at diagnosis, with an initial regimen of one or more drugs prescribed, and excluding cases with unknown mode of treatment administration.Directly observed therapy (DOT); Self-administered therapy (SA)
Perc
enta
ge**
19931994
19951996
19971998
19992000
20012002
20032004
20052006
20072008
20092010
0
20
40
60
80
100
DOT only DOT + SA SA only