Embed Size (px)
Citation preview
US 395 NSC Community
Engagement Planning
Urban and Regional Planning
Eastern Washington University
PLAN 490 Capstone Studio
Spring 2017
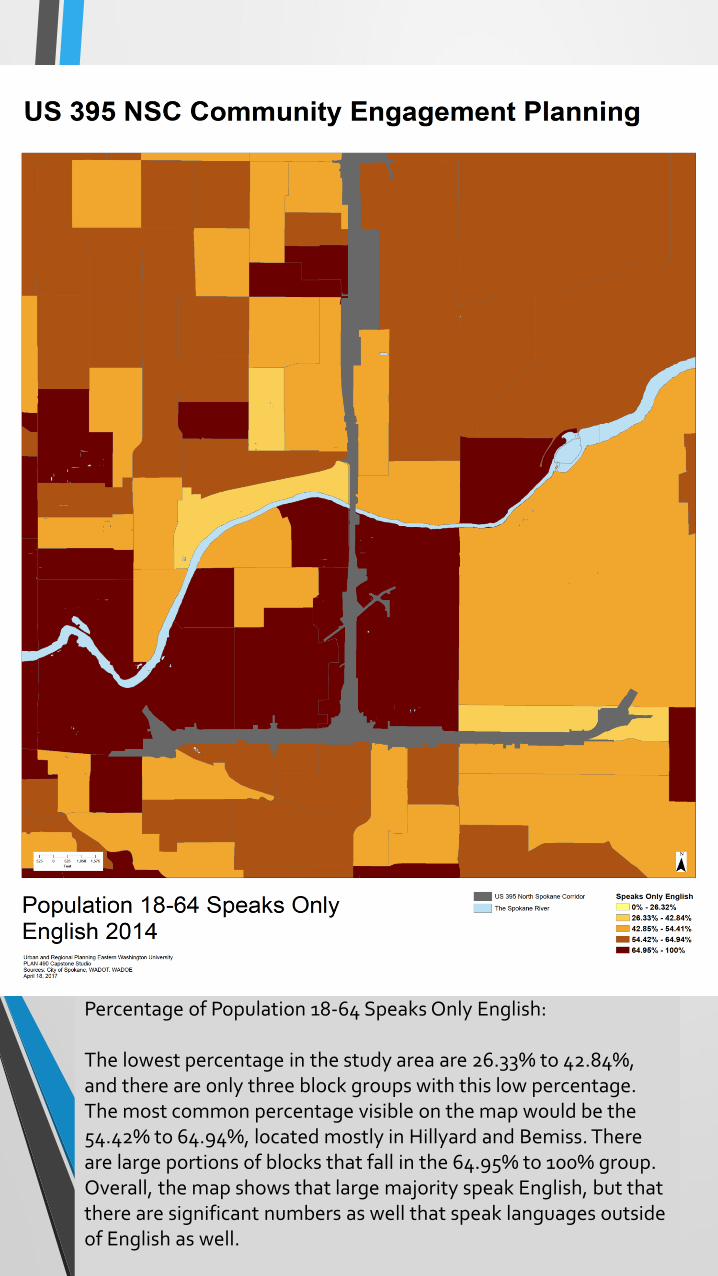
Percentage of Population 18-64 Speaks Only English:
The lowest percentage in the study area are 26.33% to 42.84%, and there are only three block groups with this low percentage. The most common percentage visible on the map would be the 54.42% to 64.94%, located mostly in Hillyard and Bemiss. There are large portions of blocks that fall in the 64.95% to 100% group. Overall, the map shows that large majority speak English, but that there are significant numbers as well that speak languages outside of English as well.
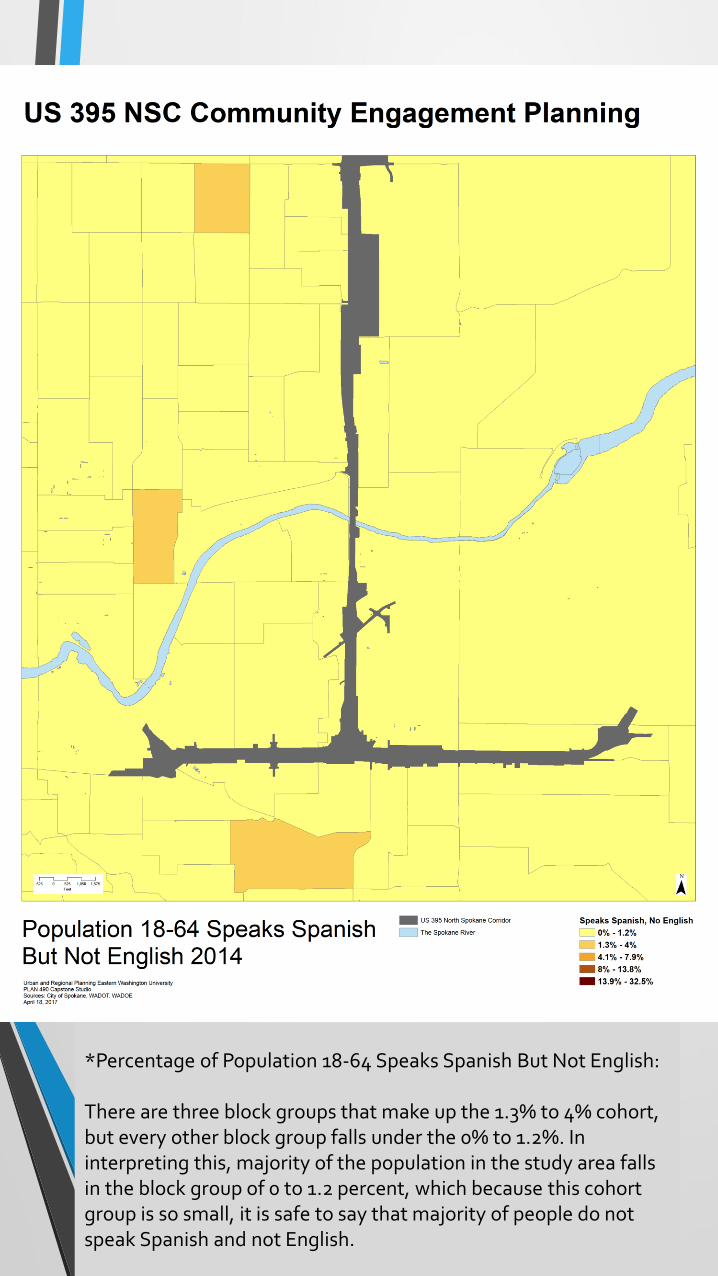
*Percentage of Population 18-64 Speaks Spanish But Not English:
There are three block groups that make up the 1.3% to 4% cohort, but every other block group falls under the 0% to 1.2%. In interpreting this, majority of the population in the study area falls in the block group of 0 to 1.2 percent, which because this cohort group is so small, it is safe to say that majority of people do not speak Spanish and not English.
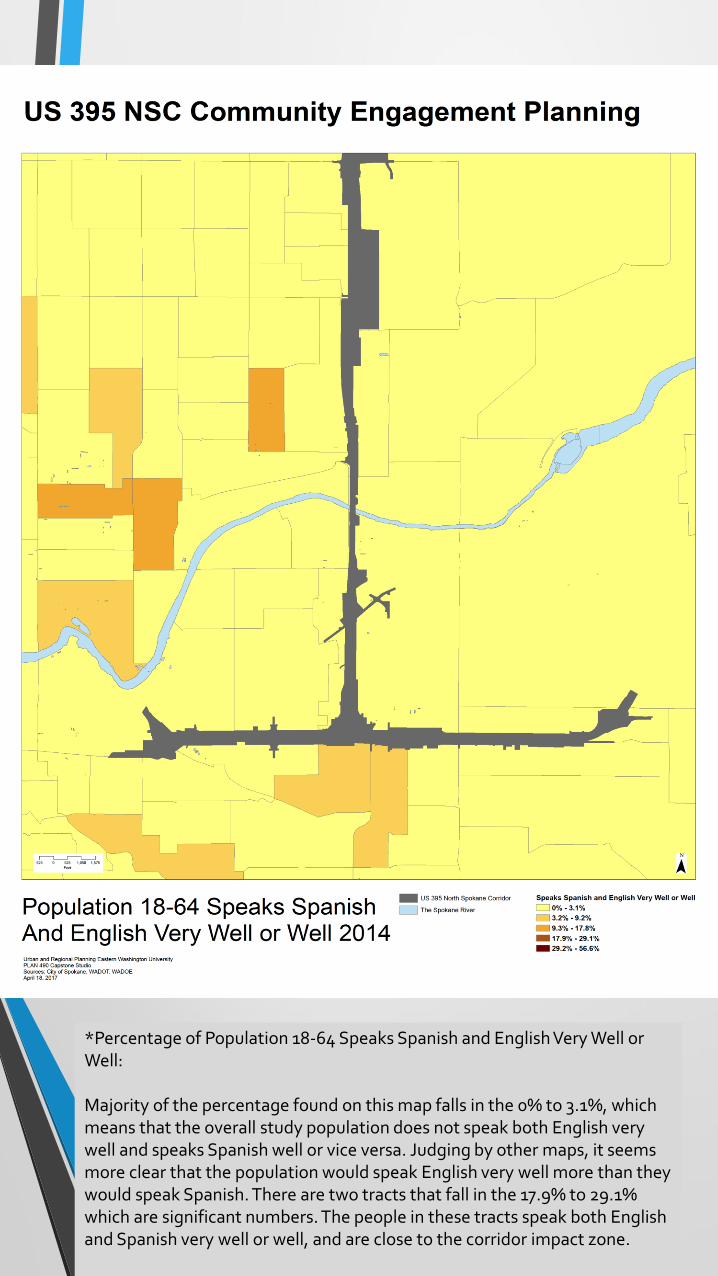
*Percentage of Population 18-64 Speaks Spanish and English Very Well or Well:
Majority of the percentage found on this map falls in the 0% to 3.1%, which means that the overall study population does not speak both English very well and speaks Spanish well or vice versa. Judging by other maps, it seems more clear that the population would speak English very well more than they would speak Spanish. There are two tracts that fall in the 17.9% to 29.1% which are significant numbers. The people in these tracts speak both English and Spanish very well or well, and are close to the corridor impact zone.
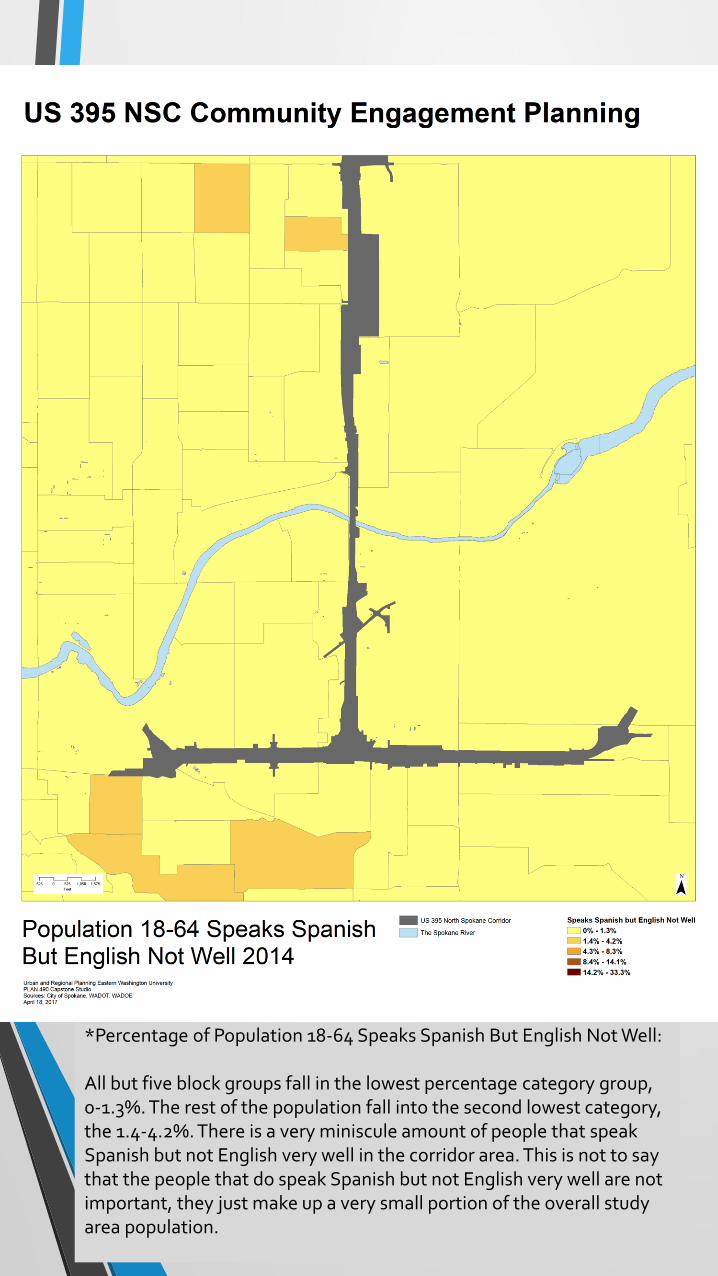
*Percentage of Population 18-64 Speaks Spanish But English Not Well:
All but five block groups fall in the lowest percentage category group, 0-1.3%. The rest of the population fall into the second lowest category, the 1.4-4.2%. There is a very miniscule amount of people that speak Spanish but not English very well in the corridor area. This is not to say that the people that do speak Spanish but not English very well are not important, they just make up a very small portion of the overall study area population.
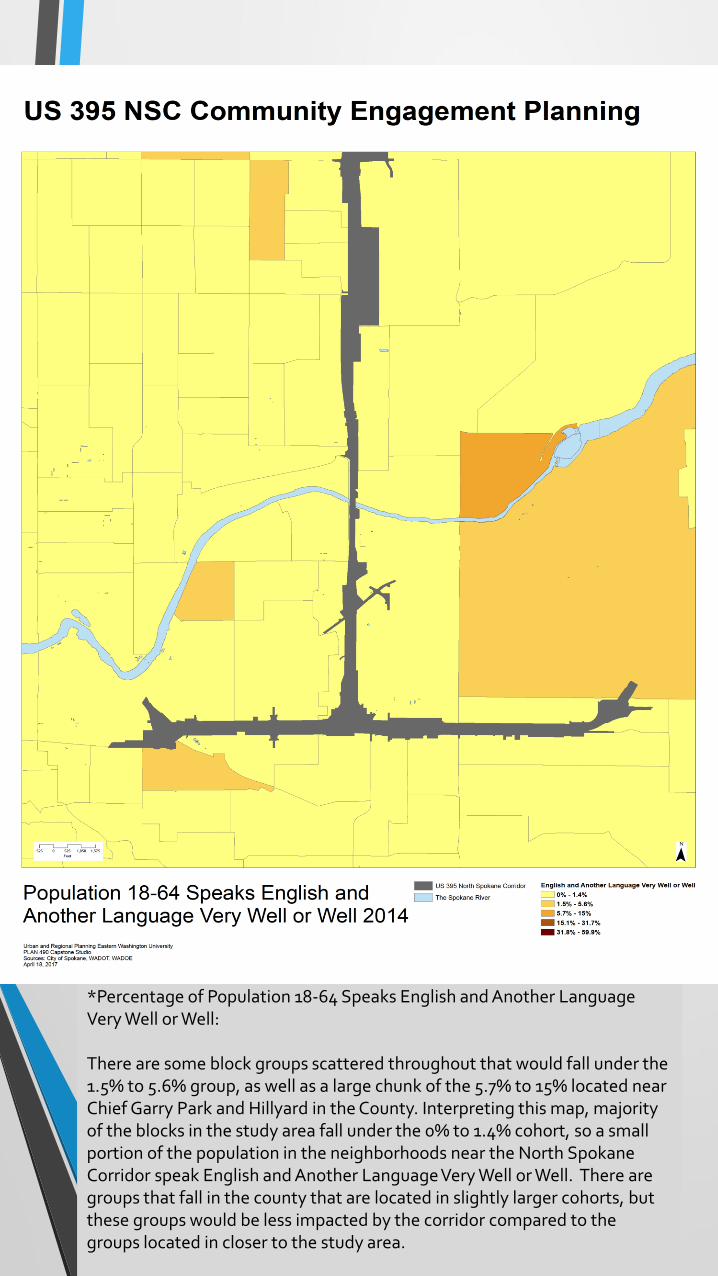
*Percentage of Population 18-64 Speaks English and Another Language Very Well or Well:
There are some block groups scattered throughout that would fall under the 1.5% to 5.6% group, as well as a large chunk of the 5.7% to 15% located near Chief Garry Park and Hillyard in the County. Interpreting this map, majority of the blocks in the study area fall under the 0% to 1.4% cohort, so a small portion of the population in the neighborhoods near the North Spokane Corridor speak English and Another Language Very Well or Well. There are groups that fall in the county that are located in slightly larger cohorts, but these groups would be less impacted by the corridor compared to the groups located in closer to the study area.
Insert analysis here
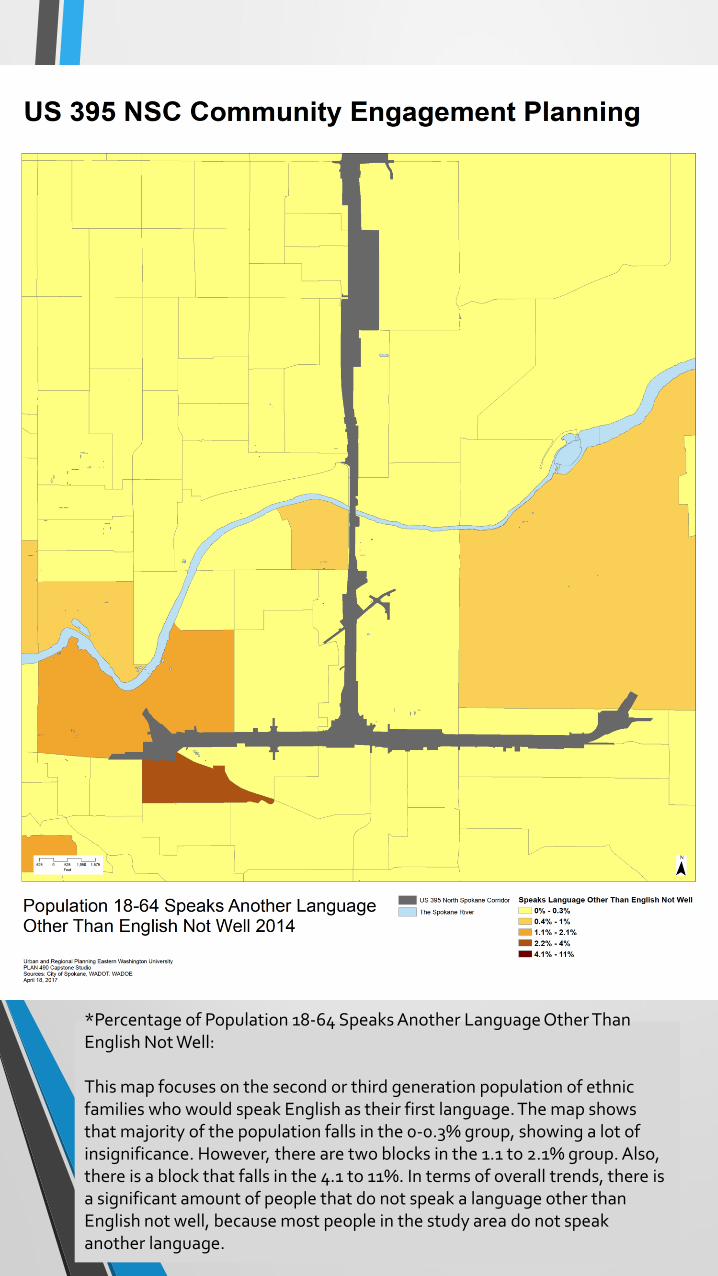
*Percentage of Population 18-64 Speaks Another Language Other Than English Not Well:
This map focuses on the second or third generation population of ethnic families who would speak English as their first language. The map shows that majority of the population falls in the 0-0.3% group, showing a lot of insignificance. However, there are two blocks in the 1.1 to 2.1% group. Also, there is a block that falls in the 4.1 to 11%. In terms of overall trends, there is a significant amount of people that do not speak a language other than English not well, because most people in the study area do not speak another language.
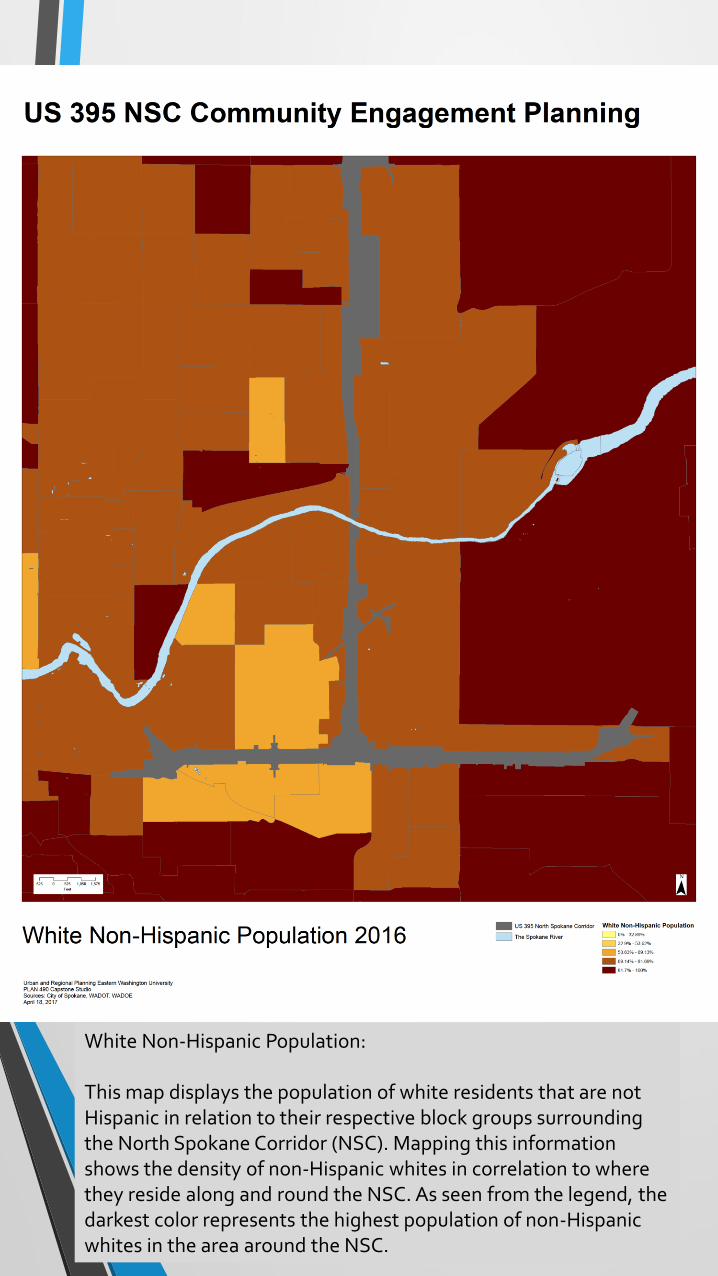
White Non-Hispanic Population:
This map displays the population of white residents that are not Hispanic in relation to their respective block groups surrounding the North Spokane Corridor (NSC). Mapping this information shows the density of non-Hispanic whites in correlation to where they reside along and round the NSC. As seen from the legend, the darkest color represents the highest population of non-Hispanic whites in the area around the NSC.
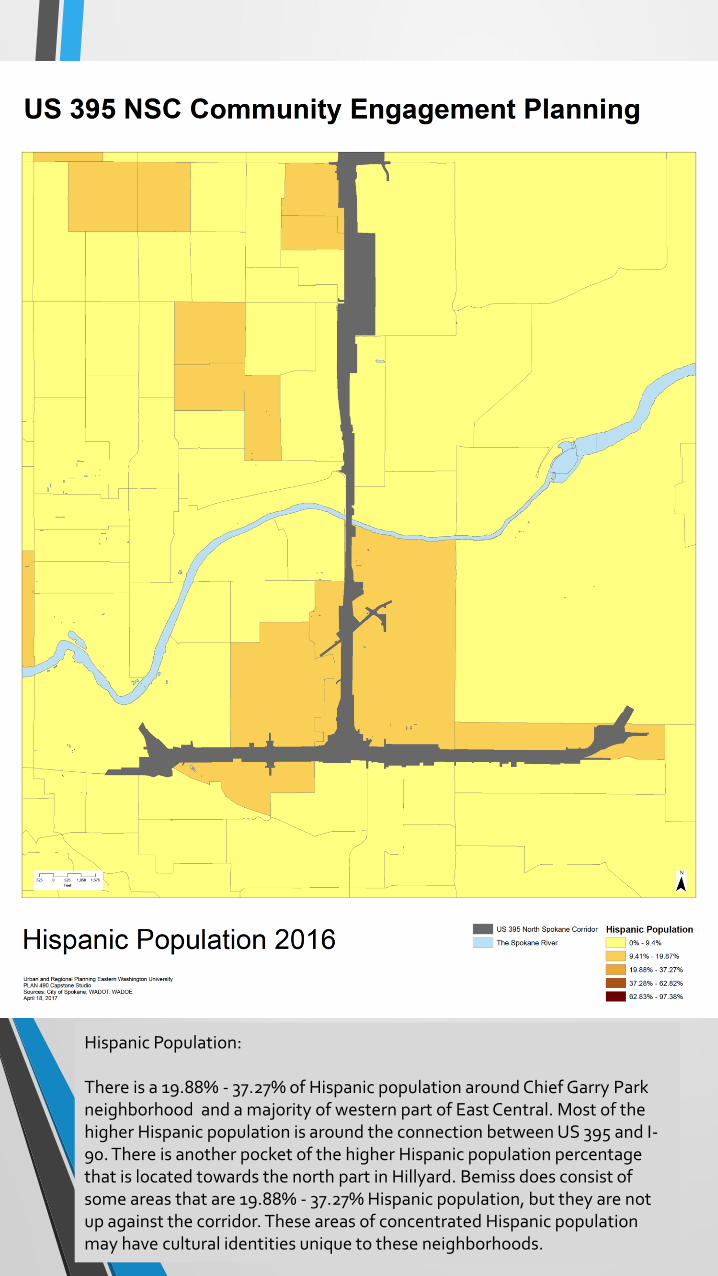
Hispanic Population:
There is a 19.88% - 37.27% of Hispanic population around Chief Garry Park neighborhood and a majority of western part of East Central. Most of the higher Hispanic population is around the connection between US 395 and I-90. There is another pocket of the higher Hispanic population percentage that is located towards the north part in Hillyard. Bemiss does consist of some areas that are 19.88% - 37.27% Hispanic population, but they are not up against the corridor. These areas of concentrated Hispanic population may have cultural identities unique to these neighborhoods.
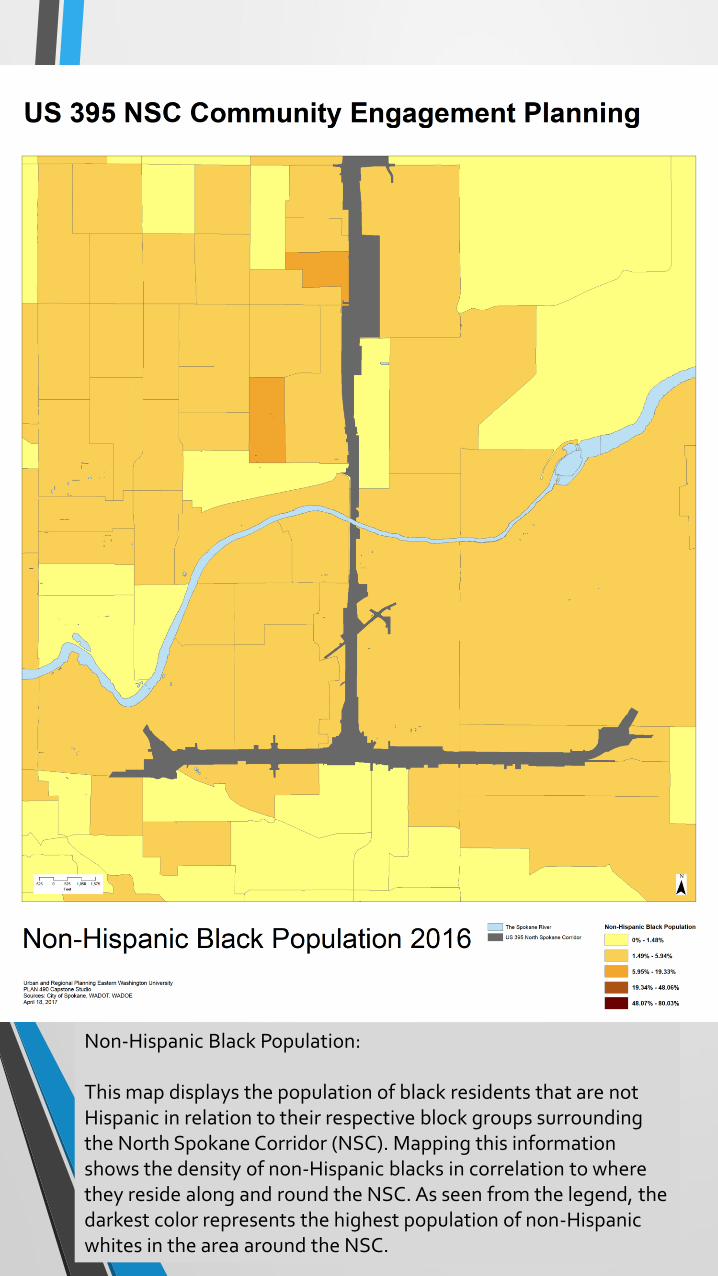
Non-Hispanic Black Population:
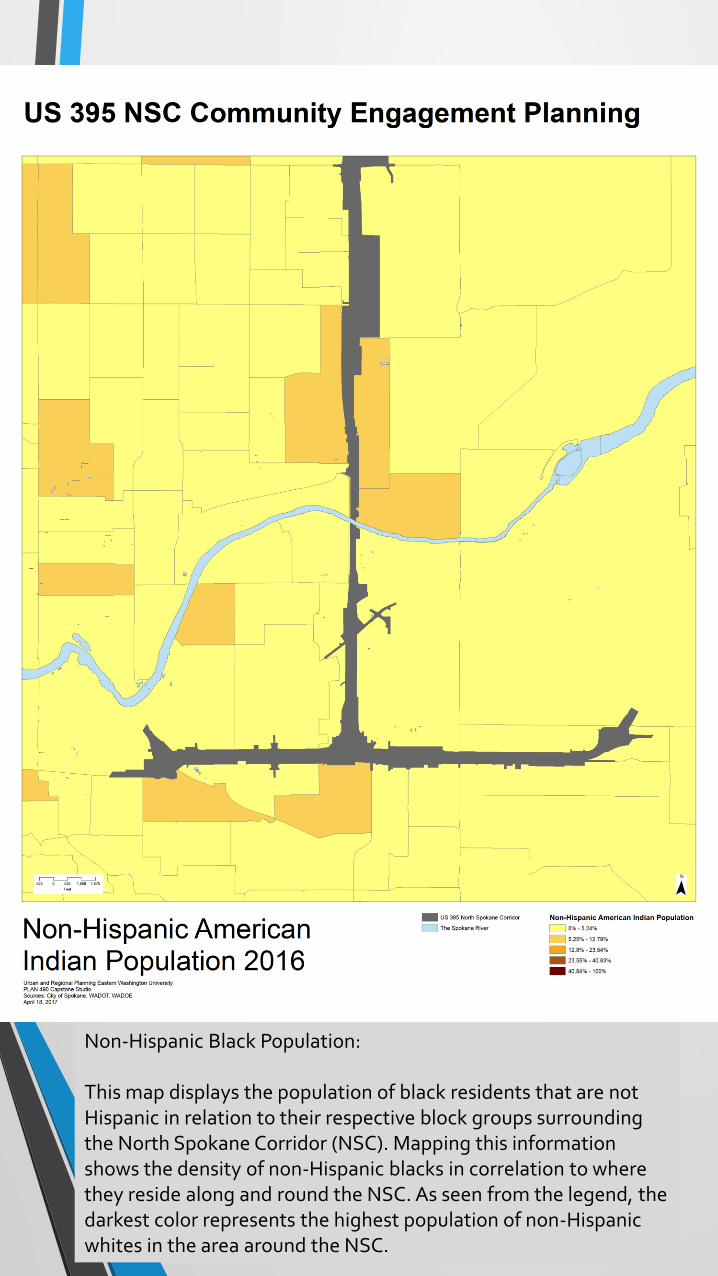
This map displays the population of black residents that are not Hispanic in relation to their respective block groups surrounding the North Spokane Corridor (NSC). Mapping this information shows the density of non-Hispanic blacks in correlation to where they reside along and round the NSC. As seen from the legend, the darkest color represents the highest population of non-Hispanic whites in the area around the NSC.
Non-Hispanic Black Population:
This map displays the population of black residents that are not Hispanic in relation to their respective block groups surrounding the North Spokane Corridor (NSC). Mapping this information shows the density of non-Hispanic blacks in correlation to where they reside along and round the NSC. As seen from the legend, the darkest color represents the highest population of non-Hispanic whites in the area around the NSC.
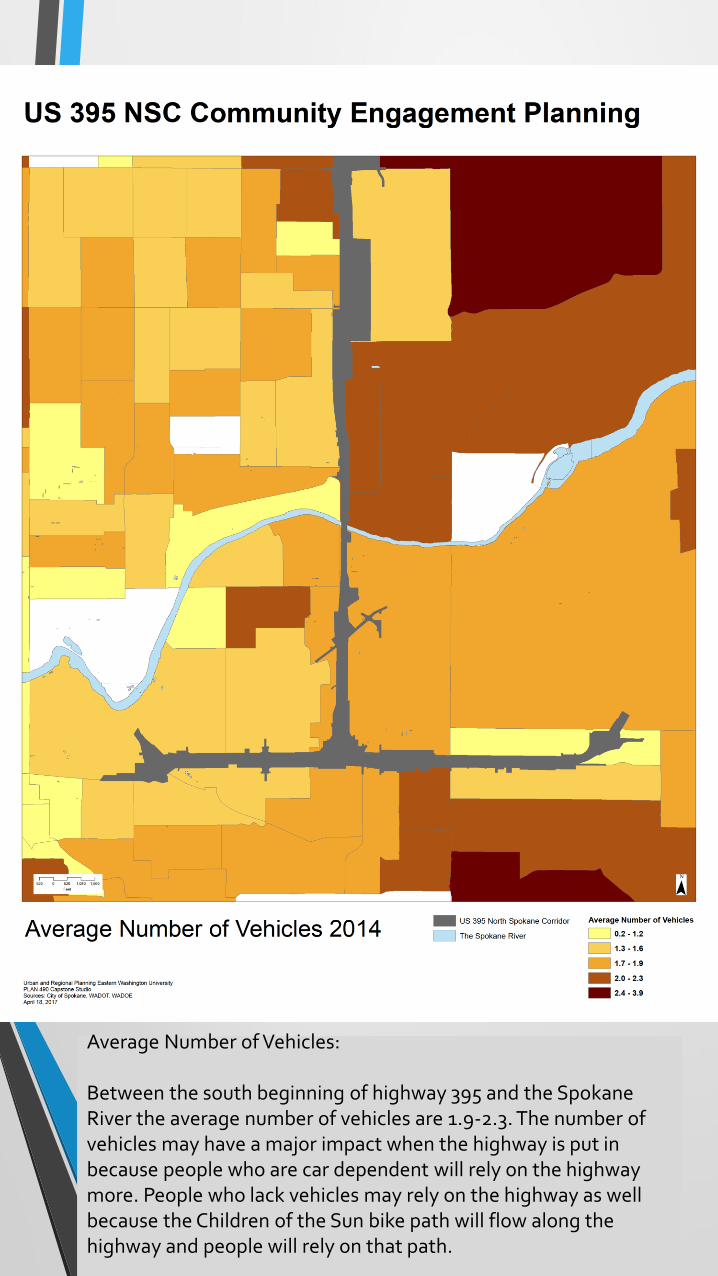
Average Number of Vehicles:
Between the south beginning of highway 395 and the Spokane River the average number of vehicles are 1.9-2.3. The number of vehicles may have a major impact when the highway is put in because people who are car dependent will rely on the highway more. People who lack vehicles may rely on the highway as well because the Children of the Sun bike path will flow along the highway and people will rely on that path.
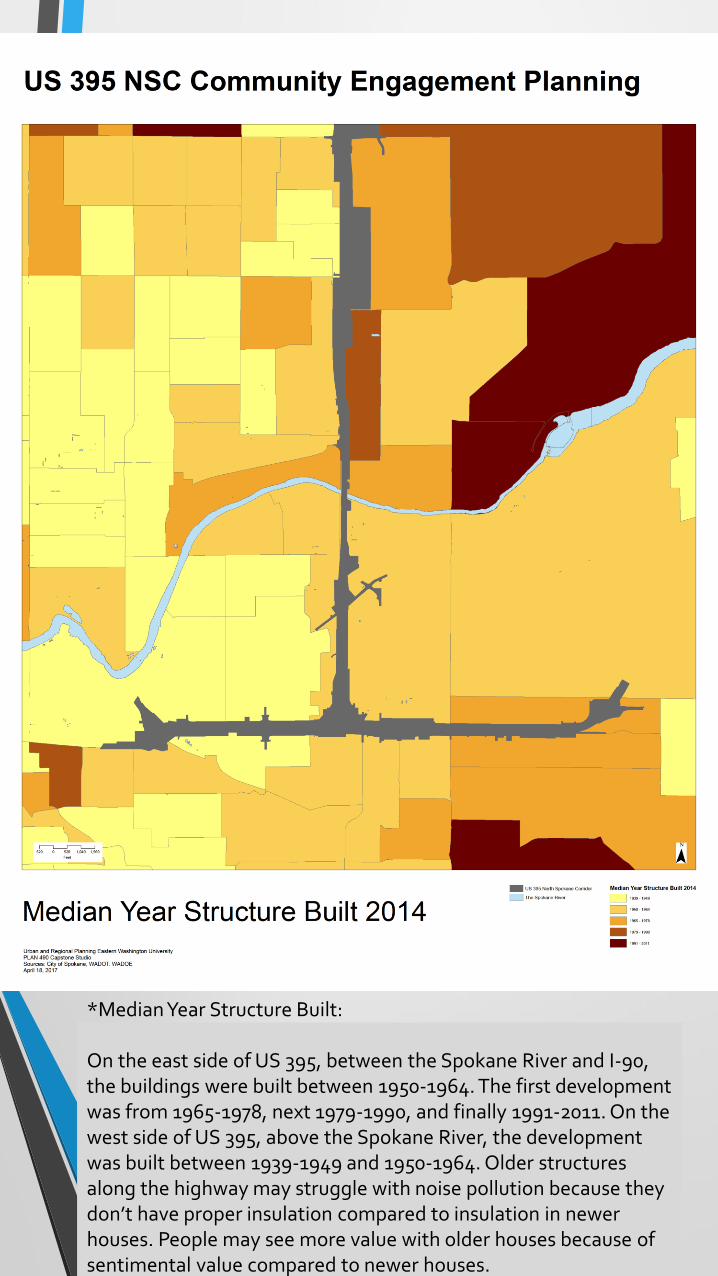
*Median Year Structure Built:
On the east side of US 395, between the Spokane River and I-90, the buildings were built between 1950-1964. The first development was from 1965-1978, next 1979-1990, and finally 1991-2011. On the west side of US 395, above the Spokane River, the development was built between 1939-1949 and 1950-1964. Older structures along the highway may struggle with noise pollution because they don’t have proper insulation compared to insulation in newer houses. People may see more value with older houses because of sentimental value compared to newer houses.
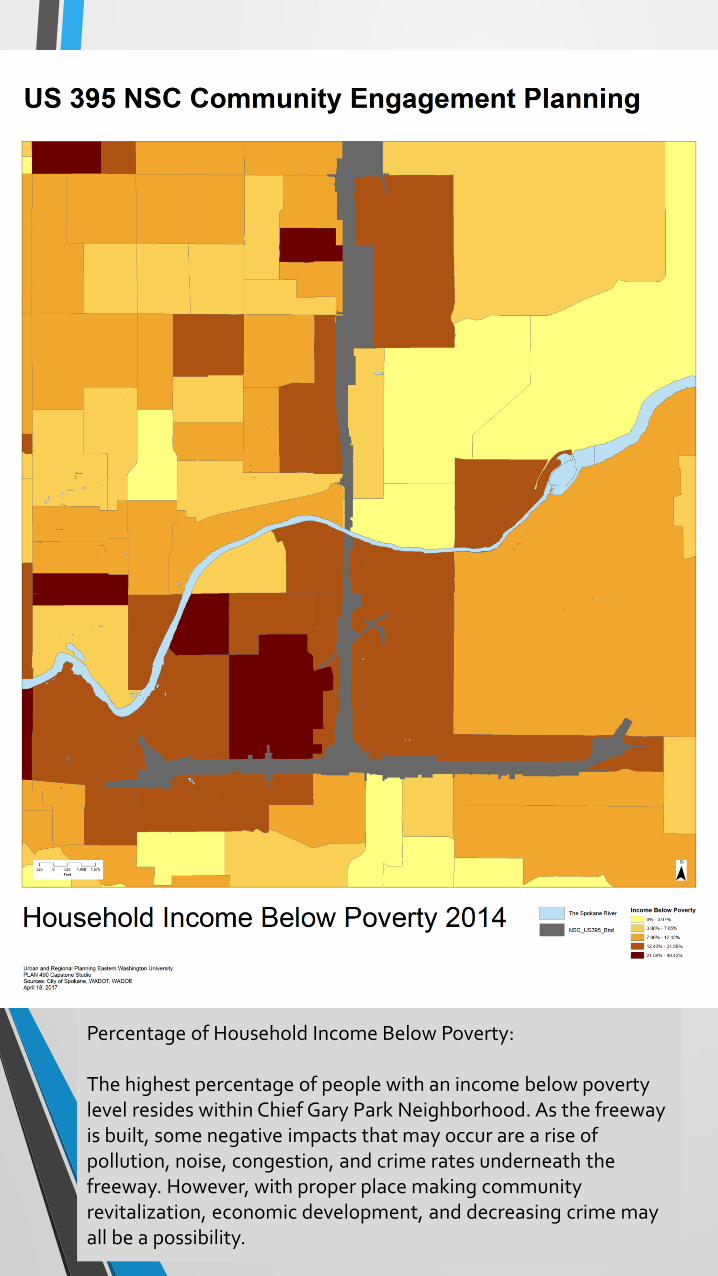
Percentage of Household Income Below Poverty:
The highest percentage of people with an income below poverty level resides within Chief Gary Park Neighborhood. As the freeway is built, some negative impacts that may occur are a rise of pollution, noise, congestion, and crime rates underneath the freeway. However, with proper place making community revitalization, economic development, and decreasing crime may all be a possibility.
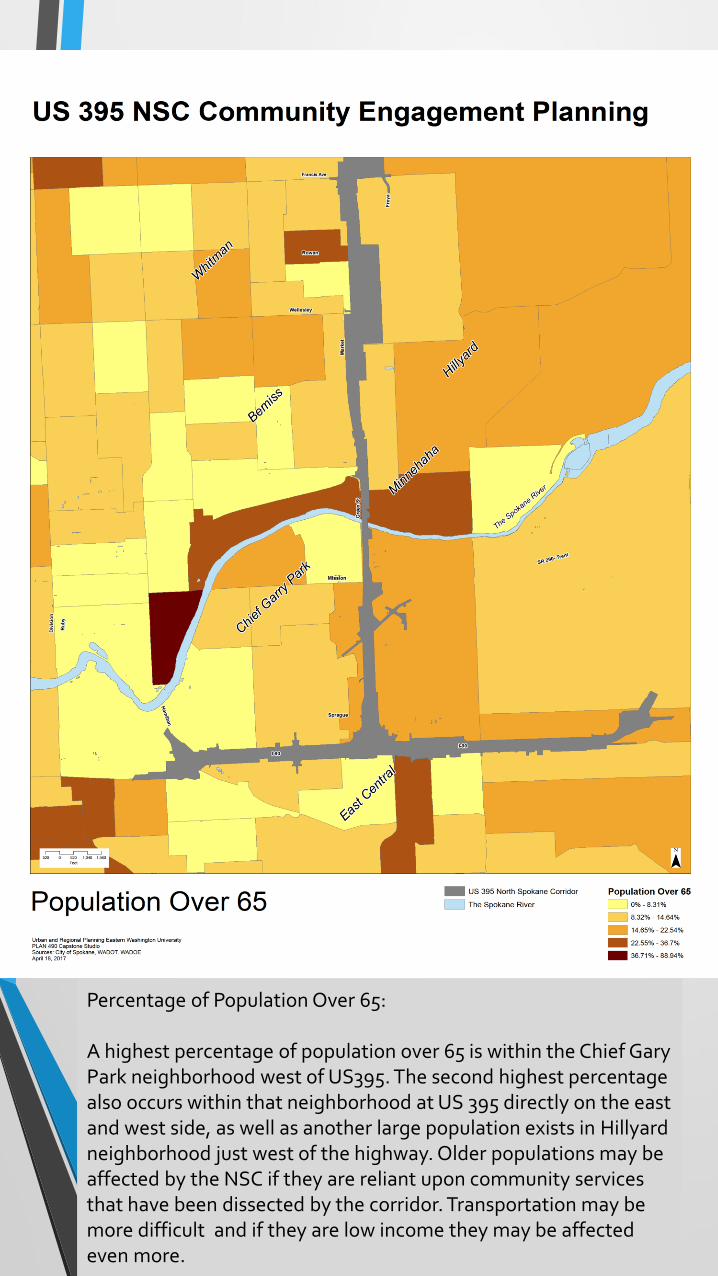
Percentage of Population Over 65:
A highest percentage of population over 65 is within the Chief Gary Park neighborhood west of US395. The second highest percentage also occurs within that neighborhood at US 395 directly on the east and west side, as well as another large population exists in Hillyardneighborhood just west of the highway. Older populations may be affected by the NSC if they are reliant upon community services that have been dissected by the corridor. Transportation may be more difficult and if they are low income they may be affected even more.