Embed Size (px)
Citation preview

UROPATHOGENS AND SUSCEPTIBILITY IN WOMEN WITH UNCOMPLICATED UTI IN PRIMARY CARE
Heytens Stefan1
De Sutter An1
Christiaens Thierry1
Boelens Jerina² Claeys Geert²
(1) Department of family practice and general health care(2) Department of microbiology
1

UROPATHOGENS AND SUSCEPTIBILITY IN WOMEN WITH UNCOMPLICATED UTI IN PRIMARY CARE
2

Uropathogen distribution and antimicrobial susceptibility in women with uncomplicated cystitis in Belgium, a high antibiotics prescribing country:
20 year surveillance
Heytens Stefan, De Sutter An, Christiaens Thierry,
Boelens Jerina, Claeys Geert,
3

Three of a kind: • Wich bacteria are found in Belgian women with uncomplicated urinary tract
infections in primary health care, and what is their susceptibility pattern anno 95-96? Christiaens T, Heytens S, Verschraegen G, De Meyere M, De Maeseneer J. Acta Clinica Belgica 1998.
• Evolution of bacterial susceptibility pattern of E. coli in uncomplicated urinary tract infections in a country with high antibiotic consumption : a comparison of two surveys with a 10 year interval. (2005-2006)De Backer D, Christiaens T, Heytens S, De Sutter A, Stobberingh E, Verschraegen G. Journal of Antimicrobial Chemotherapy 2008; 62, 364-368.
• Uropathogen distribution and antimicrobial susceptibility in uncomplicated cystitis in Belgium, a high antibiotics prescribing country: 20 years surveillance. (2014 -2015)European journal of clinical microbiology and infectious diseases 2016
1995 - 2005 - 2015 4

UROPATHOGENS AND SUSCEPTIBILITY IN WOMEN WITH CYSTITIS AND PREVALENCE OF ESBL PRODUCING BACTERIA IN PRIMARY CARE. (2014 -2015)
STUDY DESIGN
5
In- / exclusion criteria
INCLUSION
• Adult non pregnant women with dysuria or urinary frequency or urgency
EXCLUSION
• Signs of complicated UTI
• Symptoms > 7 days
• Temp > 38°C
• Prominent gynaecologic complaints
• Known nephrologic or urologic problems
• Diabetes
• Immunocompromizing condition (leukemia, immunosuppressants)
• Frequent episodes of UTI (> 3/year of > 2 in last 6 months)
6

In- / exclusion criteria
1) 1995
2) 2005
3) 2015
7

Comparison
1995 – 2005 - 2015
8

Characteristics1995 – 2005 – 2015
1995 2005 2015
Study duration 19 17 20
N 279 299 256
Pos rate (> 105 CFU/mL) 59% 65% 63.7%
Pos rate (EFU 2000) NA 71.2% 79.3%
Breakpoints susceptibility NCCLS 1994 CLSI 2004 EUCAST 2014
Premenopausal: 18-55 yPostmenopausal: > 55 y
279 0
222 (83%)45 (17%)
188 (73.4%)68 (26.6%)
Mean age• Premenopausal• Postmenopausal
34340
393368
42.63467
9

Distribution of uropathogens in culture positive samples.All age groups included.
1995n=176
2005n=213
2015n = 212
E. coli 78.4 % 80.3 % 81.6 %
S. saprophyticus 9,1 % 8.5 % 8 %
Enterococcus faecalis 2.3 % 0.7 % 5.2 %
Proteus spp. 4 % 4.2 % 0 %
Klebsiella pneumoniae 0 % 2.8 % 3.3 %
Other gram – 2.8 % 2.8 % 1 %
Other Gram + 2.3 % 0.7 % 1 %
10

Susceptibility pattern (%)1995 - 2005
E. coli
1995n=138
2005n=170
Ampicillin 73.2 % 62.9 %
TMP-SMX 83.3 % 84.7 %
Nitrofurantoin 99.3 % 99.4 %
Ofloxacin/levofloxacin 99.3 98.8 %
Fosfomycin - 98.8 %
11

Resistance rate of E. coli for cotrimoxazole %ARESC (Naber 2008)
Austria 29
brazil 45.4
France 12.2
Germany 25.9
Hungary 40.3
Italy 28.8
Poland 20.0
Russia 30.5
Spain 33.7
The Netherlands 20.6
12
ARESC: Antimicrobial Resistance Epidemiology Survey on Cystitis

HIGH RESISTANCE RATES AGAINST TMP-SMX?
Belgium guideline: TMP as first choice
Can we still recommend TMP?
13

HIGH RESISTANCE AGAINST TMP-SMX?
Naber et al (2011)
• Recommendation country-specific
• Threshold: resistance rate: 20%
Gupta et al (2011):
• TMP-SMX remains a highly effective treatment
• Threshold: resistance rate < 20%
14

Susceptibility pattern (%)1995 - 2005
E. coli
1995(n=138)
2005(n=170)
Ampicillin 73.2 % 62.9 %
TMP-SMX 83.3 % 84.7 %
Nitrofurantoin 99.3 % 99.4 %
Ofloxacin/levofloxacin 99.3 98.8 %
Fosfomycin - 98.8 %
15

Can we still recommend TMP ?
YES WE CAN
16

Can we still recommend TMP ?
BUT….
17
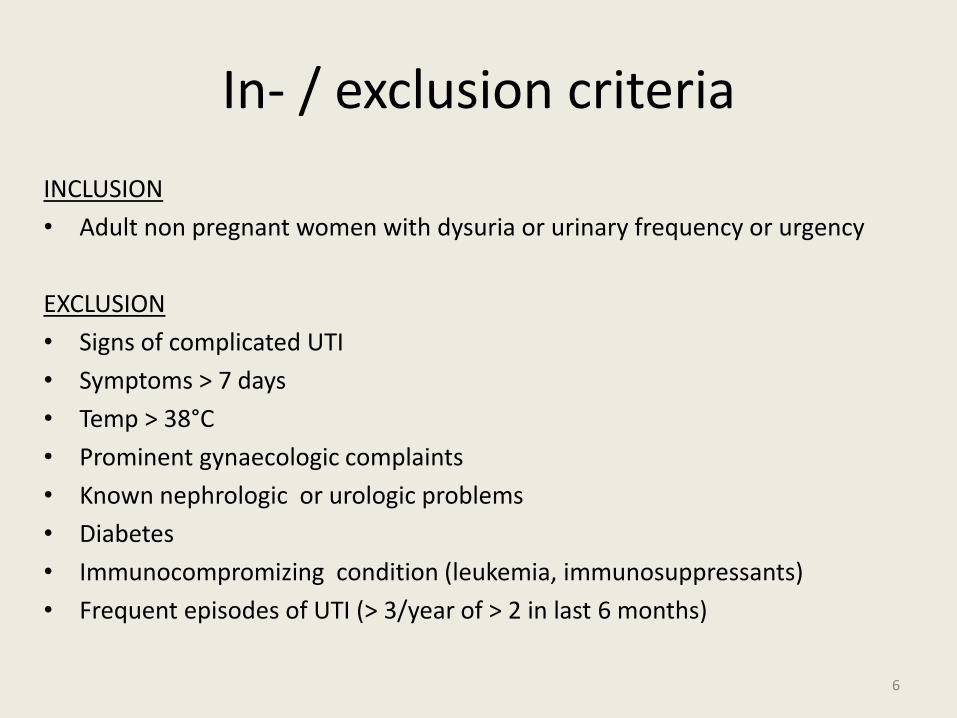
Susceptibility pattern (%)1995 – 2005 – 2015
E. coli
1995n=138
2005n=170
2015N=173
Ampicillin 73.2 % 62.9 % 55.5 %
TMP-SMX / TMP* 83.3 % 84.7 % 76.3 %
Nitrofurantoin 99.3 % 99.4 % 99.4 %
Ofloxacin/levofloxacin
99.3 98.8 % 94.2 %
Fosfomycin - 98.8 % 100 %
18*TMP not tested in 1995

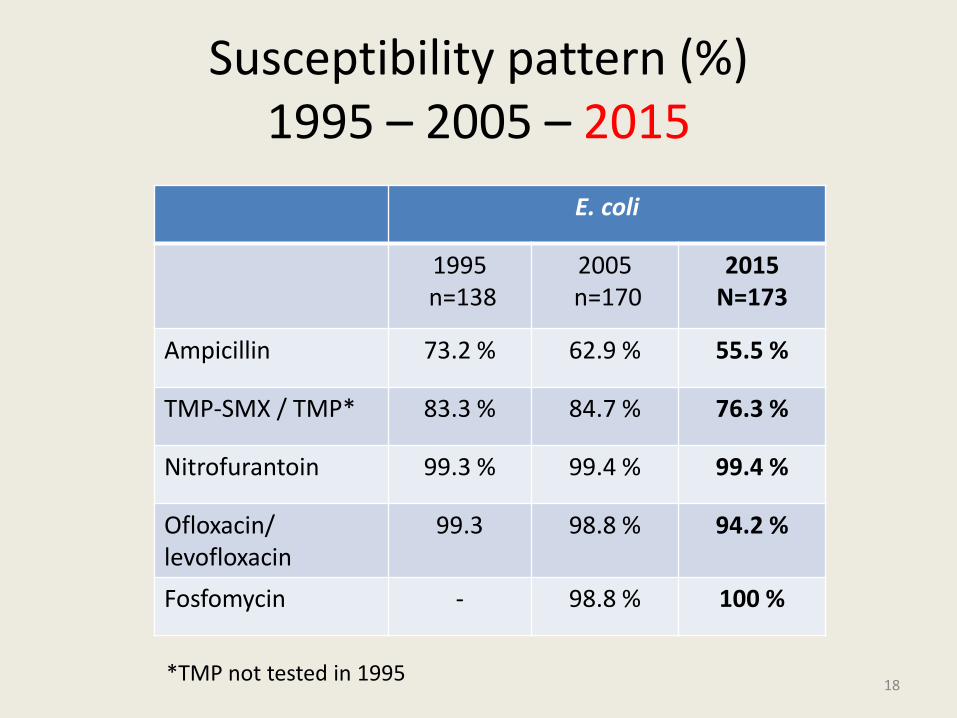
Susceptibility pattern (%)1995 - 2005
E. coli
1995n=138
2005n=170
2015N=173
Ampicillin 73.2 % 62.9 % 55.5 %
TMP-SMX / TMP* 83.3 % 84.7 % 76.3 %
Nitrofurantoin 99.3 % 99.4 % 99.4 %
Ofloxacin/levofloxacin
99.3 98.8 % 94.2 %
Fosfomycin - 98.8 % 100 %
19*TMP not tested in 1995

TMP resistance
• TMP-SMX: <1% of total DDD
(RIZIV data 2013)*
• Frequent use in industrial animal production**
* RIZIV: Belgian Disease and Disability Institution
** Persoons et al (2012)
20

HIGH RESISTANCE RATES AGAINST TMP-SMX
Can we still recommend TMP ?
21

HIGH RESISTANCE RATES AGAINST TMP-SMX
Can we still recommend TMP ?
20% threshold?
22

TMP-SMX RESISTANCE – CURE RATE
TMP/SMX resistance rates
Expected bateriologiceradication rate
Expected clinical succes rate
0% 93% 95%
10% 89% 92%
20% 84% 88%
30% 80% 85%
23
Gupta et al. Ann Intern Med. 2001; 135:9-12; 41-50

Pharmacokinetics
• Breakpoints?
• Curine = 10 x Cserum
• Urinary breakpoints?
24

TMP?
• Clinical relevance: 20% vs 30% resistance rate
Cure rate: 88% vs 85%
• Urinary breakpoints ≠ systemic breakpoints ?
• Well known,
• inexpensive,
• few side effects
25

Uncomplicated UTI in women20 year surveillance
• Bacterial distribution remained stable
• No change in Susceptibility of E. coli (exc TMP)
• Nitrofurantoin, fosfomycin = first choice
• TMP?
26

WOMEN WITH SYMPTOMS OF A UTI
BUT A NEGATIVE CULTURE.
27

case
• 35 y female patient
• Dysuria, frequency
• No other signs or symptoms
• Dipstick: Nitrite: - ; LE: -
• Treatment?28

case
• 35 y female patient
• Dysuria, frequency
• No other signs or symptoms
• Dipstick: Nitrite: - ; LE: -
• Culture: < 10³ CFU/mL;
• Lab report: negative culture
• Treatment?29

SYMPTOMATIC WOMEN AND NEGATIVE CULTURE
Women with typical symptoms of cystitis
30

SYMPTOMATIC WOMEN AND NEGATIVE CULTURE
Women with typical symptoms of cystitis
=> 25 – 30% negative culture
31

SYMPTOMATIC WOMEN AND NEGATIVE CULTURE
WOMEN WITH URINARY COMPLAINTS BUT A NEGATIVE CULTURE?
What do they have?
32

SYMPTOMATIC WOMEN AND NEGATIVE CULTURE
WOMEN WITH URINARY COMPLAINTS BUT A NEGATIVE CULTURE?
What do they have?
An infection?
33

Do culture negative women have an infection?
1. Cut off rate
34

Do culture negative women have an infection?
1. Cut off rate: Kass: 105 !
35

Do culture negative women have an infection?
1. Cut off rate: Kass: 105
• 105 Kass (1956), Brumfit, Bolan
• 104 Callagher, Smith, Baerheim, Shultz, Leibovici
• 10³ Osterberg, Johnson, Echols, Rubin, Pfau, Pfaller, Gupta
• 10² Stamm (1980), Hooton, Reid, Elder
36

Cystitis studyPositive urine samples
37
Threshold N=256 %
> 105 163 63,7
European Federation for Urinalysis. Aspeval, 2000.

Cystitis studyPositive urine samples
38
Threshold N=256 %
> 105 163 63,7
> 104 193 75.4
European Federation for Urinalysis. Aspeval, 2000.

Cystitis studyPositive urine samples
39
Threshold N=256 %
> 105 163 63,7
> 104 193 75.4
> 10³ 206 80.9
European Federation for Urinalysis. Aspeval, 2000.

Do culture negative women have an infection?
1. Cut off: 105 => 10³ cfu/ml
40

Do culture negative women have an infection?
1. Cut off: 105 => 10³ cfu/ml
2. Richards et al (2005)
41
Do culture negative women have an infection?
Richards et al 2005
Symptoms and neg culture
42

Do culture negative women have an infection?
Richards et al 2005
Symptoms and negative culture
P=0.002
300 mg TMP/d placebo
43

Do culture negative women have an infection?
Richards et al 2005
Symptoms and negative culture
P=0.002
300 mg TMP/d
Median: 3 days
placebo
Median: 5 days
44

Do culture negative women have an infection?
1. Cut off: 105 => 10³ cfu/ml
2. Richards et al (2005)
3. Routine laboratory protocol
45
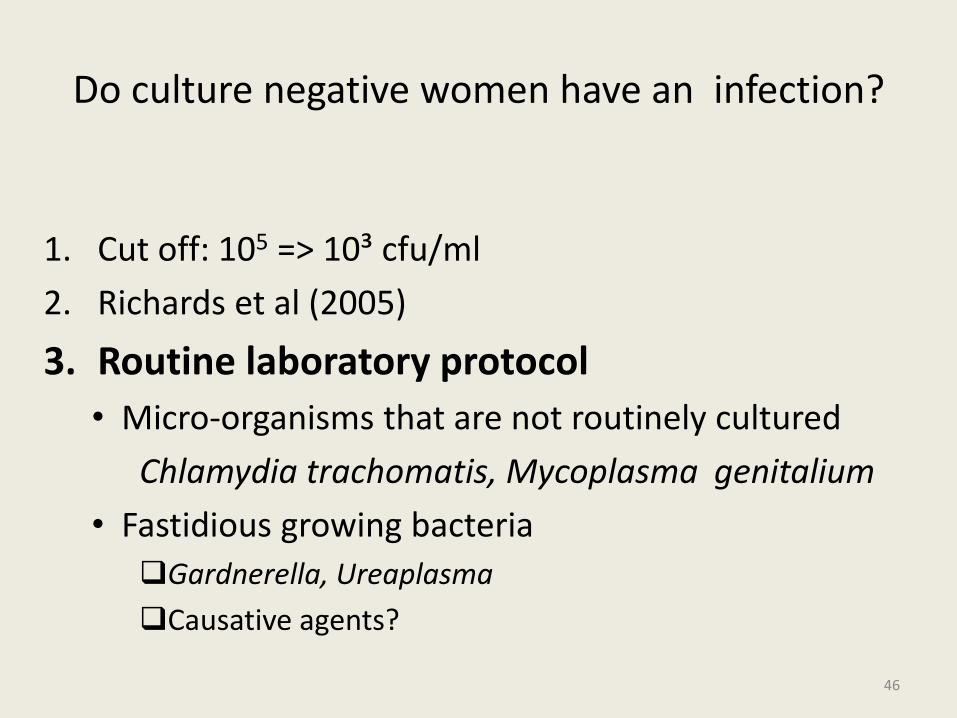
Do culture negative women have an infection?
1. Cut off: 105 => 10³ cfu/ml
2. Richards et al (2005)
3. Routine laboratory protocol
• Micro-organisms that are not routinely cultured
Chlamydia trachomatis, Mycoplasma genitalium
• Fastidious growing bacteria
Gardnerella, Ureaplasma
Causative agents?
46
Do culture negative women have an infection?
1. Cut off: 105 => 10³ cfu/ml
2. Richards et al (2005)
3. Routine laboratory procedure
4. Intracellular E. coli (Hunstad 2010)
47

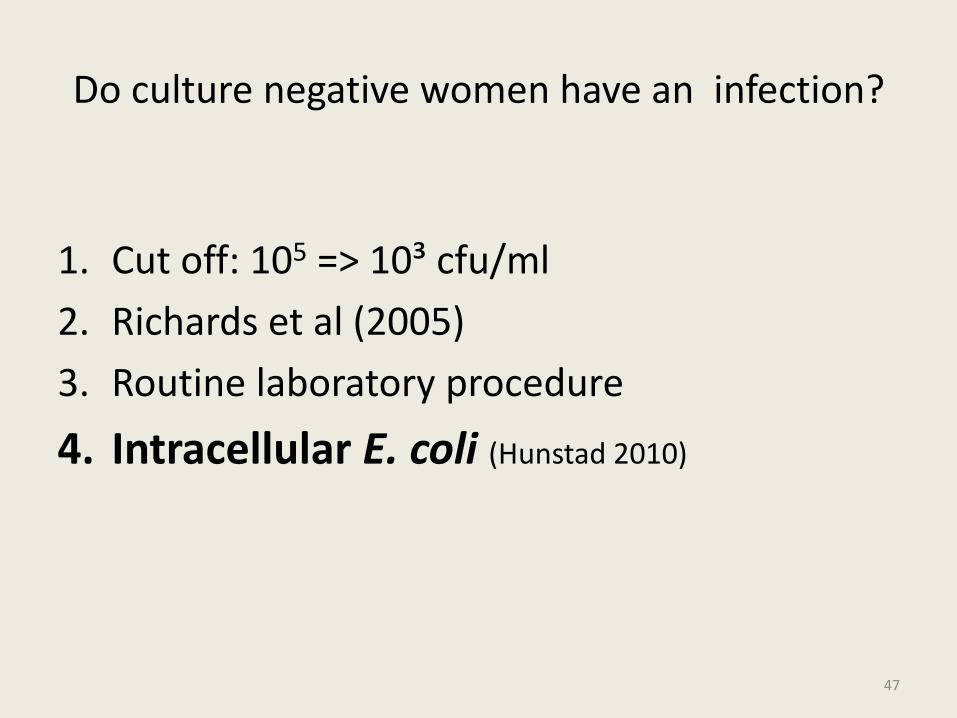
Do culture negative women have an infection?
1. Cut off: 105 => 10³ cfu/ml
2. Richards et al (2005)
3. Routine laboratory procedure
4. Intracellular E. coli (Hunstad 2010)
5. ‘New’ uropathogens – Aerococcus urinae
– Actinobaculum schaalii
48

SYMPTOMATIC WOMEN AND NEGATIVE CULTURE
Women with symptoms of cystitis
But a negative culture
Infection?
49

SYMPTOMATIC WOMEN AND NEGATIVE CULTURE
“Culture Negative Gap”
50

Do culture negative women have an infection?
PCR
• Cystitis study >> symptomatic group
• Healthy volunteers >> control group
51

Control group (n=86)
Exclusion criteria
• Dysuria or other signs and symptoms of UTI
• Frequent episodes of UTI (> 3/year of > 2 in last 6 months)
• Have received an antibiotic during the past 4 weeks
• Abnormal vaginal discharge or vaginal itch
• Prominent gynaecologic complaints
• Known nephrologic or urologic problems
• Diabetes or other chronic condition
• Immunocompromizing condition (leukemia, immunosuppressants)
• Pregnant women52

Characteristics
Characteristic Control group Women with symptoms of UTI
Number of women 86 220
Mean age in years*(Standard deviation)
37.2(11.481)
38.5(13.839)
Range (years) 23-65 17-91
Recruitment University of Ghent campus volunteers
Patients consulting their GP’s practice
Culture Fresh urine sampleLaboratory work out
Fresh urine sampleDipslide
Legend: *: p = 0.44053

E. Coli culture and qPCR results
% of positives
Group (number of women) PCR Culture
Symptomatic group (220) 95.9 80.9
54

E. Coli culture and qPCR results
% of positives
Group (number of women) PCR Culture
Symptomatic group (220) 95.9 80.9
Control group (86) 11.5 8.1
55

Control group (n = 86): Correspondence between E. coli qPCR and culture
56
qPCR E. coli(geqs/ml)
Culture E. coli(CFU/ml)
107 106
106 106
105 106
105 105
104 104
104 Negative
104 Negative
104 Negative
104 Negative
106 <10³
0 <10³
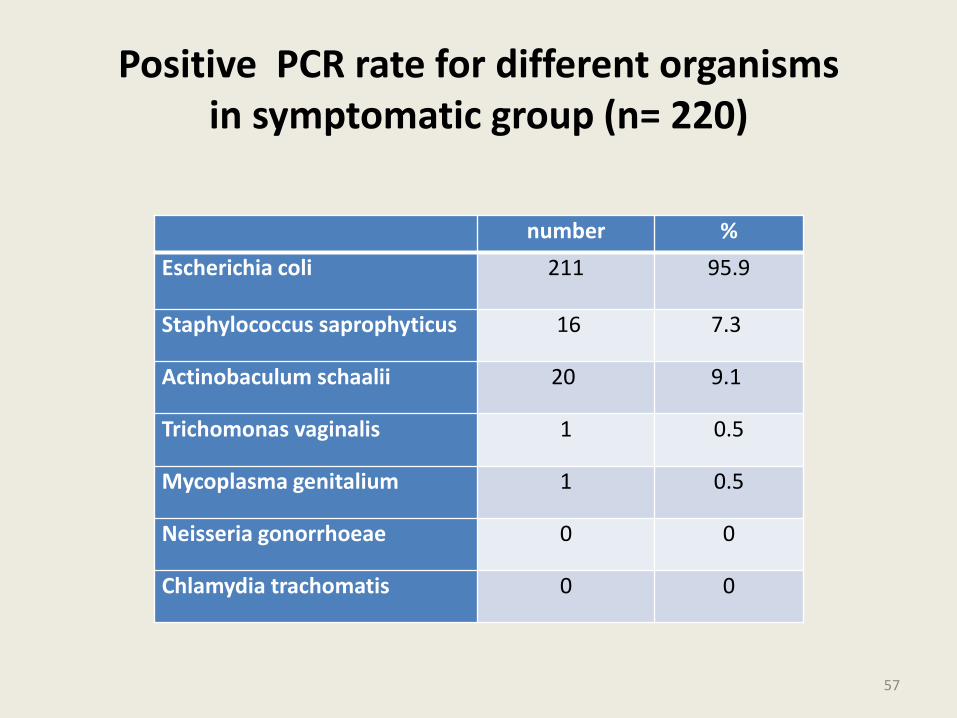
Positive PCR rate for different organisms in symptomatic group (n= 220)
number %
Escherichia coli 211 95.9
Staphylococcus saprophyticus 16 7.3
Actinobaculum schaalii 20 9.1
Trichomonas vaginalis 1 0.5
Mycoplasma genitalium 1 0.5
Neisseria gonorrhoeae 0 0
Chlamydia trachomatis 0 0
57

Positive PCR rate for different organisms in symptomatic group (n= 220)
number %
Escherichia coli 211 95.9
Staphylococcus saprophyticus 16 7.3
Actinobaculum schaalii 20 9.1
Trichomonas vaginalis 1 0.5
Mycoplasma genitalium 1 0.5
Neisseria gonorrhoeae 0 0
Chlamydia trachomatis 0 0
58

Positive PCR rate for different organisms in symptomatic group (n= 220)
number %
Escherichia coli 211 95.9
Staphylococcus saprophyticus 16 7.3
Actinobaculum schaalii 20 9.1
Trichomonas vaginalis 1 0.5
Mycoplasma genitalium 1 0.5
Neisseria gonorrhoeae 0 0
Chlamydia trachomatis 0 0
59
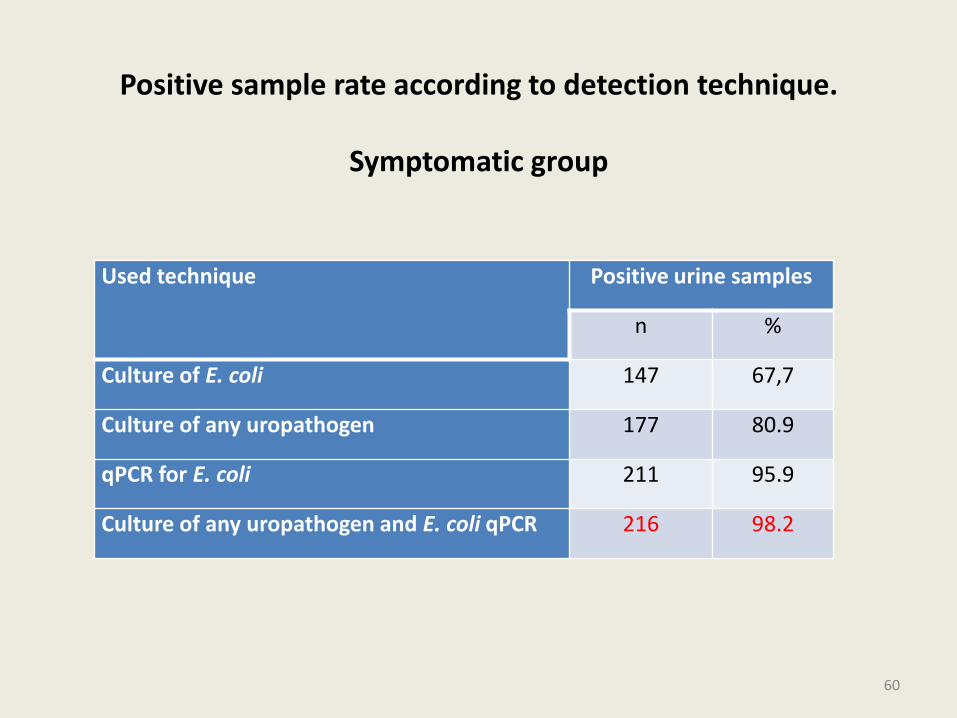
Positive sample rate according to detection technique.
Symptomatic group
Used technique Positive urine samples
n %
Culture of E. coli 147 67,7
Culture of any uropathogen 177 80.9
qPCR for E. coli 211 95.9
Culture of any uropathogen and E. coli qPCR 216 98.2
60

E. coli qPCR
• Positive in 95.9% of symptomatic women
• Remained negative in control group
• Yet postitive in asymptomatic bacteriuria
61

“Closing the negative gap”
All women with typical urinary symptoms
have an E. coli infection
62

What do women with symptoms of cystitis but a negative urine culture have? PCR based quantification of Escherichia coli indicates that they have an infection after all.
Heytens S, De Sutter A, Coorevits L, Cools P, Boelens J, Vaneechoutte Mario, Christiaens T, Van Simaey L, Claeys G.
63

END
64

65

Syplementary slides
66

Do culture negative women have an infection?
67

WHY NOT SIMPLY USE EXISTING DATA?
Which bacteria and susceptibility pattern 1995-1996
Christiaens et al 1998
68
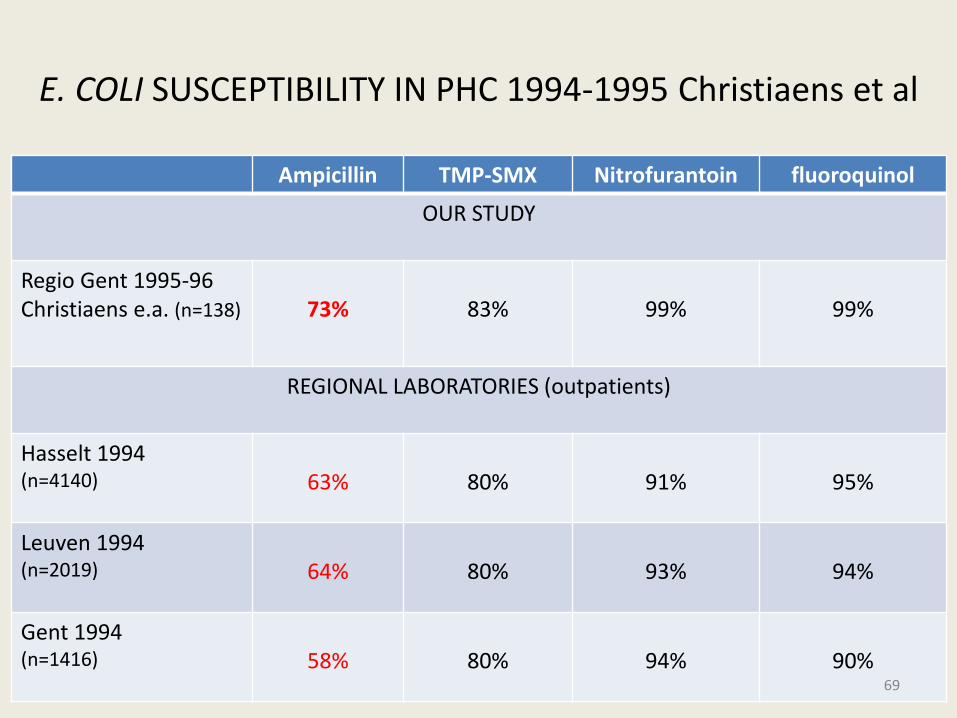
E. COLI SUSCEPTIBILITY IN PHC 1994-1995 Christiaens et al
Ampicillin TMP-SMX Nitrofurantoin fluoroquinol
OUR STUDY
Regio Gent 1995-96 Christiaens e.a. (n=138) 73% 83% 99% 99%
REGIONAL LABORATORIES (outpatients)
Hasselt 1994(n=4140) 63% 80% 91% 95%
Leuven 1994(n=2019) 64% 80% 93% 94%
Gent 1994(n=1416) 58% 80% 94% 90%
69

E. COLI SUSCEPTIBILITY IN PHC 1994-1995 Christiaens et al 1998
Ampicillin TMP-SMX Nitrofurantoin fluoroquinol
OUR STUDY
Regio Gent 1995-96 Christiaens e.a. (n=138) 73% 83% 99% 99%
REGIONAL LABORATORIES (outpatients)
Hasselt 1994(n=4140) 63% 80% 91% 95%
Leuven 1994(n=2019) 64% 80% 93% 94%
Gent 1994(n=1416) 58% 80% 94% 90%
70

Distribution of uropathogens in culture positive samplespre and post menopausal women
2015
201518-55 yn = 153
2015> 55 yn= 59
E. coli 78.4 % 89.8 %
S. saprophyticus 11.1 % 0 %
Enterococcus faecalis 5.2 % 5.1 %
Proteus spp. 0 % 0 %
Klebsiella pneumoniae 3.3 % 3.4 %
Other gram – 0.7 % 1.8 %
Other Gram + 1.4 % 0 %
71

Knottnerus 2013
1. Dysuria?
2. Vaginal irritation
3. Selfreporting
72
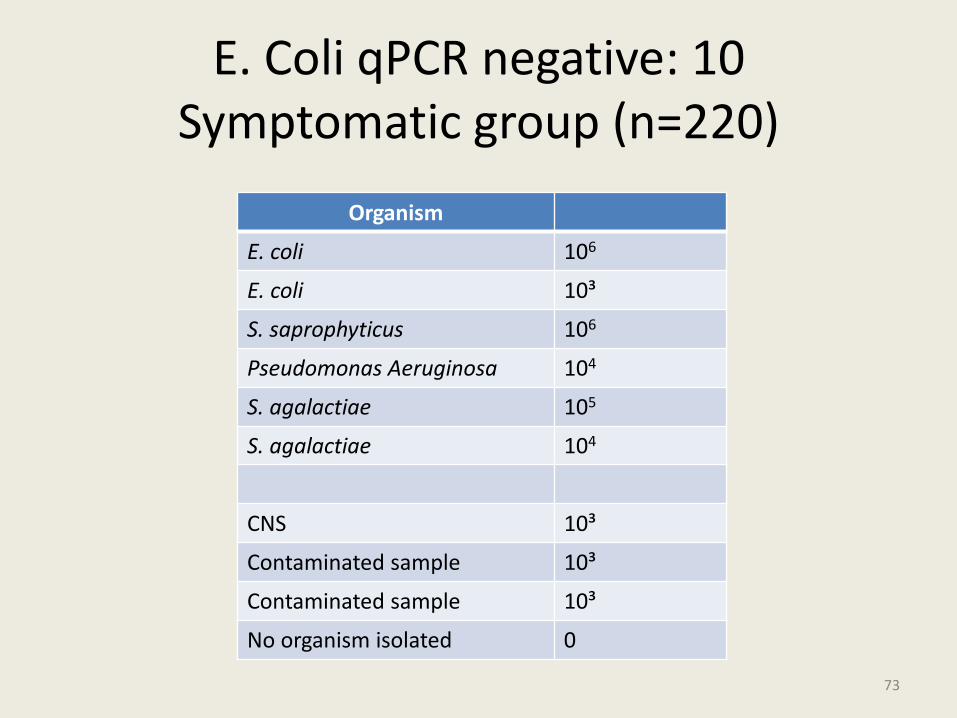
E. Coli qPCR negative: 10Symptomatic group (n=220)
Organism
E. coli 106
E. coli 10³
S. saprophyticus 106
Pseudomonas Aeruginosa 104
S. agalactiae 105
S. agalactiae 104
CNS 10³
Contaminated sample 10³
Contaminated sample 10³
No organism isolated 0
73

European Guideline for Urine analysis
Primary pathogens:• E. coli and S. saprophyticus
• > 10³ CFU/mL
Secondary pathogens: • Other Gram negative rods en Enterococcus spp
• > 104 CFU/mL
74

Culture negative: 43Symptomatic group (n=220)
E. coli qPCR result Number of culture negative samples
Negative 5
< 10³ 5
10³ 1
104 4
105 20
> 106 8
75

Intracellular E. coli (Hunstad 2010)
76

S. saprophyticus
• 16 S.s PCR positive
Culture:
– 9 S. saprophyticus
– 6 E. coli
– 1 Klebsiella
• 15 culture positive => 6 negative S.s PCR
77

Actinobaculum schaalii
• 20 qPCR positive
• Culture:
– 10 E. coli
– 2 S. saprophyticus
– 1 Enterobacter aerogenes
– 7 negative culture
78

E. coli qPCR results in culture positive samples symptomatic group
Culture(cfu/ml of urine)*
N qPCR E. coli positive
qPCR E. coli negative
Escherichia coli 10² 3 0 010³ 10 0 0104 21 11 0105 32 40 0
> 106 83 93 0149 144
Staphylococcus saprophyticus
104 2 2 0
105 1 1 0106 12 11 1
Klebsiella pneumoniae 104 1 1 0106 4 4 0
Enterococcus faecalis > 105 2 2 0
79

WHY NOT SIMPLY USE EXISTING DATA?
• Filter raw data of regional lab’s
• Filter:o womeno 18-55 yearo 1 sample per patient per yearo Only samples sent by GP’so (Not from patients in LTCF)
=> age restriction
80

Threshold of 20%
• Clinical studies
• In vitro studies
• Mathematical modelling
81

Pharmacokinetics
• Urinary breakpoints?
• Curine = 10 x Cserum
• PK/PD targets are not known
– Dependent on time above MIC (%T/MIC)
– Concentration-dependent (AUC/MIC)
82

END
83