Embed Size (px)
Citation preview

1
Differential vulnerability & Susceptibility: expanding the scope of risk assessment
Authors:
Joel Schwartz1
Thomas A. Glass2 David C. Bellinger3
Version 11 Do not cite without author permission
Affiliations:
1. Professor of Environmental Epidemiology, Director, Harvard Center for Risk
Analysis, Harvard School of Public Health, Boston, MA
2. Associate Professor, Department of Epidemiology, Johns Hopkins Bloomberg
School of Public Health, Baltimore, MD
3. Professor of Environmental Health, Harvard School of Public Health and Professor of
Neurology, Harvard Medical School, Boston, MA.
2
Table of contents:
A. Introduction and statement of goals ......................................................................... 6 A.1. Assumptions underlying risk assessment .......................................................... 7
A.1.1. Assumption 1: Risk independence (aka risk autonomy) .............................. 7 A.1.2. Assumption 2: risk averaging...................................................................... 7 A.1.3. Assumption 3: Risk uniformity .................................................................... 8 A.1.4. Assumption 4: Risk non-transferability ........................................................ 8 A.1.5. Assumption 5: Risk synchrony .................................................................... 9 A.1.6. Assumption 6: Risk accumulation and chaining .......................................... 9
A.2. Moving toward differential vulnerability: interactions and beyond .....................10 A.3. Dose-Response Considerations ......................................................................11
A.3.1. Dose-response and threshold effects ........................................................11 A.4. Differential risk: exposure ................................................................................13 A.5. Conclusion .......................................................................................................14
B. Lead and Air Pollution: extended examples ............................................................14 B.1. Sources of Susceptibility (Susceptibility in Response to Exposure) ..................14
B.1.1. Genetic Sources of Variable Response .....................................................14 B.1.1.i. General Issues .....................................................................................14 B.1.1.ii. Lead ....................................................................................................15 B.1.1.iii. Air Pollution ........................................................................................15
B.1.2. Phenotypic (Host characteristics) Sources of Variable Response .............16 B.1.2.i. General Issues .....................................................................................16 B.1.2.ii. Lead ....................................................................................................17 B.1.2.iii. Air Pollution ........................................................................................17
B.1.3. Psychosocial hazards and stress ..............................................................18 B.1.3.i. General issues .....................................................................................18 B.1.3.ii. Lead ....................................................................................................18 B.1.3.iii. Air Pollution ........................................................................................20
B.1.4. Socio-economic Position ...........................................................................20 B.1.4.i. General Issues .....................................................................................20 B.1.4.ii. Lead ....................................................................................................21 B.1.4.iii. Air Pollution ........................................................................................22 B.1.4.iv. Age ....................................................................................................22
3
B.1.5. Other Environmental Agents......................................................................23 B.2. Sources of Susceptibility (Differential Dose/Exposure) .....................................23
B.2.1.i. Air pollution ..........................................................................................25 B.3. Cumulative Exposure .......................................................................................26 B.4. Markers of Cumulative Risk .............................................................................26
C. Methodological considerations ...............................................................................27 C.1. General overview of methodological issues. ....................................................27
C.1.1. Methods for exploring interactions .............................................................27 C.1.1.i. Hierarchical Mixed Models ...................................................................28
C.1.2. Methods for addressing risk chaining ........................................................30 C.2. Alternative approaches to quantification of inequity .........................................31
C.2.1. Underlying Issues. .....................................................................................31 C.2.2. Approaches and examples ........................................................................32 C.2.3. Transgenerational Risk .............................................................................37
D. Conclusions and recommendations .......................................................................38 D.1. Unpacking the risk assessment black-box .......................................................38 D.2. Acknowledging the need for social justice in risk assessment ..........................39

4
ABSTRACT: Objectives: The central paradigm for EPA standard setting is risk assessment. This paradigm
has served public health well for decades. However, gaps have emerged in the fabric of this
framework, causing some authors to challenge certain underlying assumptions. Our overall aim
is to extend the risk assessment approach by examining, both conceptually and
methodologically, how differential responses across population groups can be better integrated
into the risk assessment process. We illustrate these issues, focusing on two specific examples:
lead and air pollution.
Relevance: Addressing inequities in health risks and health outcomes will require an extension
of the risk assessment paradigm. Currently, methods and approaches are available for
considering differential risk and vulnerability, but have not yet found their way into wide-spread
usage. Our proposed extension is intended to increase the precision and effectiveness of risk
assessment generally, and to provide additional policy tools to help target resources to achieve
greater equity in the health status of populations in addition to efficient risk reduction.
Summary of Findings: Our central conclusion is that people respond differently, and this is an
important enough phenomenon to require integration into risk assessment. Moreover, such
integration is difficult with paradigms like reference dose, and flows more easily from a
quantitative consideration of dose-response curves, which have the additional advantage of
incorporating the non-trivial effects that may be observed at low dose for common exposures.
We identify and discuss 6 assumptions implicit in standard risk assessment models that must
change to accomplish this. For convenience, we label these 1) risk independence, 2) risk
averaging, 3,) risk non-transferability, 4) risk synchrony, 5) risk accumulation and chaining, and
6) quantification of numbers of persons above certain thresholds or limit values is sufficient to
characterize risk. The literature on lead and air pollution are reviewed in order to illustrate how
these assumptions might be modified to take account of differential risk and vulnerability. Our
main finding is that differential risk and vulnerability is a critically important but neglected area
within risk assessment. However, a wide range of methodological and conceptual tools are now
available for addressing these gaps.
Recommendations: If continued progress is to be made in incorporating these concepts into
risk assessment, future studies of toxicant exposure-risk relationships must invest the resources
necessary to measure contextual and individual-level factors that might modify these
relationships. In most cases we do not know which subgroups are the most vulnerable or, if we
do, subgroups are defined very broadly. We advocate defining vulnerable subgroups with
greater specificity.. At the same time, information is available on differential susceptibility for
5
some agents, and EPA risk assessments have failed to characterize the impact of those
differences on the distribution of risk. EPA should commit to making this a standard part of their
risk assessments whenever the information is available to do so. To characterize more fully the
bases of inter-individual differences in vulnerability, we recommend epidemiologic studies
incorporate the measurements and analytical techniques to tease out effect modifiers at multiple
levels. In essence, we argue for moving beyond the reliance on standard uncertainty factors
and working to explicitly unpack the “black box” that represents variability in vulnerability.
6
A. Introduction and statement of goals
The central paradigm for EPA standard setting is risk assessment. Based on scientific
data, EPA prepares quantitative estimates of the changes in health status that will result at
different potential levels of a standard, and uses that quantification as input into decision-
making, where risk management depends on other inputs as well. Specific regulatory actions
are targeted to particular environmental agents, whose marginal impacts, sources, and control
strategies often differ. Often a cruder approach is taken. A regulatorily acceptable dose is
defined (e.g. the RfD or reference dose) and risk assessment merely quantifies numbers above
vs below this magic number. Implicit is the latter approach is that this quantity is meaningful,
which implicitly assumes that risk is zero below the RfD, and the same no matter how much
above the RfD the exposure is. This paradigm has served public health for decades. However,
gaps have emerged in the fabric of this framework causing some authors to begin to challenge
and examine certain underlying assumptions.
A recent NAS report declared that “..risk assessment is at a crossroads”1. It’s key
recommendation to to abandon the reference dose approach whenever possible and move to a
quantitative estimate of changes in health. The purpose of this paper is to review some of the
assumptions inherent in those studies and to propose an expansion of the current risk
assessment approach. Simply put, we suggest that risk assessment should be updated to
consider, both conceptually and methodologically, the issue of differential vulnerability and
susceptibility across population groups, and how this results in the inequitable distribution of
risk, a key concern for environmental justice. We address the conceptual and methodological
issues in turn, and build our case around lead and air pollution as running examples.
Susceptibility and Vulnerability: The standard definition of a person who is susceptible is
that the person is more responsive to the exposure. More recently, the word vulnerability has
been used to describe situations where the susceptibility arises from psycho-social or economic
differences, rather than biologic differences among the people. We do not think this distinction is
a good one, because recent research into how socio-economic factors, stress, etc exert
influence on health has identified clear biological pathways. Stress is associated with differential
baseline levels and differential response of the hypothalamic-pituitary-adrenal system for
example. That is, these social factors really do describe people with different biological states. A
more useful distinction is one vs many. Just as in physics, collections of particles are capable of
behavior quite different than what one would expect examining them singly or via simple two
way interactions, human’s health, and response to external stimuli, depends in part on the fact

7
that humans live in groups. And differences across persons in the groups they live in influence
their responses.
A.1. Assumptions underlying risk assessment
In this section of the paper, we examine 6 assumptions that underlie the general risk
assessment framework. Some of these assumptions have been made explicitly in previous
work, and others have been explored relatively little.
A.1.1. Assumption 1: Risk independence (aka risk autonomy) Risk assessment traditionally assumes that exposures and their health impacts are
independent of one other, and can hence be evaluated singly as distinct isolable factors.
Evaluating different agents separately inherently presumes that the impacts are independent
and additive at the exposure ranges of interest. Hence, one can compute the incremental effect
of substance A, and make decisions on that basis, independent of exposure to substance B.
Where there are interactions between A and B, this approach can produce spurious results.
A.1.2 Assumption 2: risk averaging In addition, the standard risk assessment paradigm reduces the multidimensional
aspects of risk (the risk of each individual in the population, given their particular attributes) to a
single estimate: the overall risk in the population, or equivalently, the mean risk. Much work in
risk assessment recently has focused on understanding the uncertainty in this scalar estimate.
But recent work in epidemiology, toxicology, and exposure science has suggested that a more
multidimensional approach may be more useful. Two main problems arise. First, if risks are
substantially elevated primarily in a subpopulation that is small, overall risk estimates may be
low, masking the substantial burden of risk to the subpopulation. A second problem is that if a
risk factor has opposing effects in populations of approximately equal magnitude, pooled
estimates will “wash out” the deleterious effect in more vulnerable groups. In such a case,
regulatory options should take into account that there are beneficial effects in some and
deleterious effects in others, rather than assuming there is no effect. Both issues point to the
potential importance of the distribution of risk.
The mean or population attributable risk is a good single metric when the typical risk of
exposure to individuals is low, reducing concerns about the details of the distribution. This
situation does not imply a trivial public health impact because for environmental agents, the
population exposed is often large, resulting in an important population attributable risk. As an
analogy, the relative risk of mortality associated with a 7 mmHg change in blood pressure
8
(typical of the reduction produced by most anti-hypertensive drugs) is modest, but the
population impact of a seven mmHg shift in the mean distribution of the population is huge.
Treating hypertension in individuals produces a small change in individual risk, masking large
changes in population rates of heart disease. As an environmental example, EPA’s risk
assessment for controlling off road Diesel engine emissions estimated it would save over
12,000 lives per year by 2030, although individual risk reduction was estimated to be small2.
Implicit in this focus on attributable risk is that while individual risks may vary about the mean,
the risks in a definable subpopulation do not reach a level of concern (defined by decision
makers such as the EPA Administrator) that would require additional efforts.
Implicit in this is that while individual risks may vary about the mean, the risks in a
definable subpopulation do not reach a level of concern. The risk assessment framework
presumes that average risk is an appropriate and sufficient single estimate of population risk.
That is, there is a focus on the distribution of outcomes within stochastic parameters, but an
under-appreciation of two important factors that are the subject of much of this paper: a) the
distribution of risks is not random or uniform, and b) the vulnerability of individuals and
populations may vary as a function of factors related to persons or places.
A.1.3 Assumption 3: Risk non-transferability One other standard assumption in risk assessment is that the risks may accumulate but
that they apply to each person exposed without reference to the exposure status of others. But
recent studies of the risks due to environmental exposures suggest that some risk may be
transgenerational, and even hereditable. Epigenetics is the science of changes to the
chromosome that do not involve changes in the nucleotides, but do affect transcription. The new
field of environmental epigenomics has begun to show for the first time that heritable
environmentally induced epigenetic modifications underlie reversible transgenerational
alterations in phenotype 3, 4 Some of these changes can occur in children whose mothers are
exposed during pregnancy; and while non-genetic, some may be hereditary. For example,
exposure of rats to endocrine disrupting compounds during pregnancy resulted in reduced
spermatogenesis in their male offspring, a pattern that was transmitted for at least 3 subsequent
generations of unexposed animals5. This was the result of hereditable changes in DNA
methylation patterns in the offspring. Further research indicated the same exposure produced
transgenerational changes in gene expression in the hippocampal area in the brain, as well as
transgenerational changes in anxiety behavior6. There is growing evidence that exposures to
other environmental agents such as Bisphenyl A7, lead8, traffic pollution9, and metal-rich
particles10 result in epigenetic changes in humans.
9
Psychosocial factors may play a similar role in producing transgenerational effects. For
example, lead exposure is associated with increased hyperactivity and reduced executive
function, which may impact parents who were exposed as children by making them less able to
cope with normal stresses, which would further impact their parenting ability. Yehuda has
recently shown that offspring of parents exposed to holocaust trauma have altered
neuroendocrine responses suggestive of epigenetic programming across generations11. Collins
has shown that parents exposed to poverty appear to transmit increased risk to their offspring
through low birthweight and other deleterious effects12. This research shows the myriad ways
in which the social environment alters fetal programming in ways that extend across
generations, suggesting both that the exposed person may not be the only person suffering the
consequence of the exposure and that individuals may start life with varying degrees of
vulnerability to subsequent environmental risk factors.
A.1.4 Assumption 4: Risk synchrony Risk assessment sometimes relies on snapshots of exposure based on one point in
time or on a narrow time window, or alternatively lifetime exposure, without sufficient attention to
the issues of critical windows, dose rate, or the ways in which underlying vulnerability changes
as risk accumulates across the entire life course. When available, methods for looking at
critical windows and dose rates are considered in risk assessment, but less attention has been
paid to the timing of vulnerability. Several models have been proposed to move from a
synchronous (or snapshot) view of risk to a diachronic (or movie) approach. These include the
study of allostatic load13-15, the weathering hypothesis16-18 as well as life-course epidemiology 19,
20. Cumulative exposure to individual environmental agents, or to all environmental agents
acting along similar pathways may, in some cases, represent a better metric for risk
assessment. For example, tibia lead levels are a cumulative index of exposure to lead, and
show stronger associations with some health outcomes. Also, as attention focuses on
intermediary biomarkers of health (for example blood pressure and cholesterol levels rather
than cardiovascular events, are now commonly used as surrogate markers for pharmaceutical
agents that represent deliberate exposure to manmade chemicals) finding the best indicator for
environmental exposures’ cumulative impact on health is acquiring greater importance. There
are some candidate markers, which should be considered in risk assessments.
A.1.2. Assumption 5: Risk accumulation and chaining Lastly, a single scalar estimate of risk will also fail to capture important aspects of the
public health problem, even in the absence of differences in susceptibility and exposure, if there
10
are skewed distributions of other underlying risk factors, resulting in substantially different
cumulative burdens in one subpopulation than in another. That is, one input into policy making
may be how a given option changes the distribution of cumulative risk due to all risk factors in
the population, and not merely how it changes the distribution of risk due to the targeted
exposure. Again, because the distributions of multiple sources of risk are not independent, this
can produce cascading inequities even in the absence of interactions.
A.2. Moving toward differential vulnerability: interactions and beyond
But what if the above set of assumptions are not met? What if the distribution of risk in
the population is skewed, or markedly higher in one group and lower in another? What if risk
factors accumulate in synergistic ways to create subgroups that are differentially susceptible?
This can happen in several ways. The first brings us back to interactions. Differential responses
can result from differences in genetic susceptibility or due to exacerbations of the effect of
exposure by underlying disease status, by psychosocial factors (e.g., stress) or by sociomaterial
factors (e.g., poverty). This is not to suggest that effect modification is always exacerbatory;
diets rich in antioxidants and omega-3 fatty acids have been shown to blunt the effect of air
pollution21, 22 for example. Differential response can also flow from more complex social or
physical factors or more than one interaction. Several examples are: persons with diabetes
have twice the risk of cardiovascular mortality following exposure to particulate air pollution as
persons without the syndrome,23 stress modifies the effects of lead on blood pressure and
cognition24, race and educational level strongly modify the mortality risk on very hot days25, and
genes related to oxidative stress defenses modify the risk of air pollution26.
These risk modifiers are rarely independently distributed, nor do they occur randomly
throughout the population. Assuming independence often produces underestimates. For
instance, risk assessments underestimated the risk of the Chernobyl disaster because they
assumed independent distributions of individual actions, rather than the systemic behaviors that
actually occurred27. In the case of environmental exposures, many modifiers are related and not
independently distributed. For example, both diabetes and stress are more prevalent among
black Americans. And for some pollutants, exposure is greater among this subgroup of the
population as well. A risk assessment that seeks to capture the distributional aspects of risk
must include the covariance of the risk modifiers, which could greatly increase the actual
skewness of risk in the population.
11
A.3. Dose-Response Considerations
Dose-response can be an important part of the improvement of risk assessment. For
some substances, such as lead or air pollution, EPA has used quantitative risk assessment
based on epidemiologic dose-response or exposure-response curves. In other cases they have
computed reference doses, or some similar estimate of a dose that conveys de minimis risk.
The National Research Council has recently recommended that EPA take an integrated
approach, including moving to more quantitative risk assessment, in lieu of reference doses.
This fits well with the emphasis here on cumulative risk, distribution of risk, and interactions,
since it is difficult to incorporate those factors into “magic numbers” such as RfDs. It is important
to consider that “de Minimus” exposure to large populations may not have “de Minimus”
aggregate risks. For example, most of the lung cancer cases attributable to radon exposure
occurs in homes below the EPA guideline, Similarly one must consider the possibility that some
populations may be substantially more affected and that multiple exposures that accumulate
may yield risks that are no longer de minimus.
A.3.1. Dose-response and threshold effects One special topic is what the shape of the exposure-response or dose-response relation
is. Many studies fail to consider adequately whether there is a threshold in the association
between exposure and response. Thresholds have traditionally been assumed in toxicology for
most outcomes, possibly excepting cancer. However, as epidemiology studies have extended to
consider more exposure-response relations in relevant exposure ranges, a striking finding is the
lack of evidence for departure from linearity in many associations for non-carcinogens, down to
the lowest observable exposures in the general population. For example, the concentration-
response between PM2.5 and mortality is linear, and the dose-response between blood lead
levels and IQ is supralinear-that is, the slope is substantially higher at lower doses.
In a paper in 2000 reporting on a method (meta-smoothing) for combining data across
studies to examine the shape of the exposure-response, Schwartz developed a theoretical basis
for such findings28. Suppose each subject has a threshold for a serious health response, for
example mortality. These thresholds differ across subjects based on differences in existence
and intensities of current illnesses, differences in intensities of chronic illnesses, and in general
differences in all the genetic, social, psychosocial etc modifiers we have discussed in this paper.
At any given exposure in a population, the number of individuals having the event will be the
sum of all individuals whose threshold is at or below the given exposure. That is, the exposure-
response curve in the population will be the cumulative distribution curve of individual

12
thresholds. Because the distribution of thresholds in the general population is the sum of the
distribution due to multiple acute illnesses, multiple chronic conditions, multiple social factors,
multiple stressors, multiple genetic factors, etc, that distribution will tend, by the Central Limit
Theorem, to approach the normal distribution, and hence the cumulative distribution of the
thresholds (which, as noted above, is the exposure-response curve in the total population) will
tend to approach the logit or probit curve. Since we are generally dealing with population
exposures to environmental contaminants, with exposures at levels where the probability of an
event in any individual is small, we are at the low dose end of those exposure-response curves.
And the low dose ends of the logistic and probit curves are linear. Hence, as a population
exposure-response to an exposure with multiple sources of susceptibility, a linear association is
not unexpected, even in the presence of individual thresholds. Another implication is that when
we look at populations exposed to higher doses, we might expect to be on a different part of the
curve, with different slopes, including the part of the logistic curve where slopes are declining.
This is important both for extrapolating epidemiologic results for risk assessment and for doing
the risk assessment on population with a wide distribution of exposure.
Since that paper many additional studies have reported no-threshold relationships
between ambient levels of daily particles and daily deaths29-31, daily NO2 and daily deaths32,
long term exposure to particulate air pollution and survival33, the effect of Lead on IQ34, the
effect of Arsenic on cancer risk35, etc. The implications of significant public health risks at low
exposure concentrations are large, as recent EPA regulatory impact assessments have
demonstrated. Hence identifying whether the association is linear, or what shape it has, has
become a central issue. Among the other techniques introduced to determine the shape of the
exposure-response are regression splines36, penalized splines37, and Bayesian model
averaging38. The existence of these no-threshold, and often linear, associations is now widely
accepted.
For example, the National Research Council, in 2002 stated “For pollutants such as
PM10 and PM2.5, there is no evidence for any departure of linearity in the observed range of
exposure, nor any indication of a threshold” 39.
Nonlinearities are still possible, and still observed. For example, the dose-response
curve for the cognitive effects of lead, and for the cardiovascular effects of particles, show
nonlinearities, with decreasing effects of incremental exposures when exposures are already
high. Risk assessment must clearly consider such whether steeper responses at lower levels
exist in each case, particularly if we seek to understand differential effects on subpopulations
whose exposures may differ. But research must also identify the reasons. Are these general
13
physiologic phenomena—such as saturation, or do they result from a wide distribution of
susceptibility? Knowing the answer to this question could result in different choices of policy
options.
A.4. Differential risk: exposure
A single scalar estimate of risk may also fail to fully characterize the public health
problem where there are substantial differences in the distribution of exposure, again resulting
in a skewed distribution of risk. This is distinct from the case of risk chaining (A.1.5) where the
issue was the differential distribution of risk factors other than the exposure of interest. For
example, the distribution of lead exposure is highly skewed, with greater exposure among
minorities and persons in poverty40-42. Over the last 30 years, multiple national surveys have
documented increasing skewness of the blood lead distribution, as general sources of lead
exposure (e.g. gasoline lead) have been reduced, while less universal sources of exposure
have fallen more slowly. That is, the decrease in exposure in all parts of the population has not
been proportional. Hence inequity in the sociogeography of risk has increased.
The main point is that much of the risk assessment literature regards the systematic
patterning of risk in different places and in different populations as unproblematic. The
landscape of exposure to chemicals reflects inequities in the distribution of resources more
generally, and should not be treated as exogenous (that is, something outside of the scope of
the risk assessment and risk management decisions, and taken as given). So while we know
quite a bit about the impact of particular exposures on overall population risk, we know far less
about the socio-environmental processes the deliver those risks differently to different groups.
Insufficient attention has been paid in traditional risk assessment models to the social
determinants of exposure. As Link and Phelan argue, we are obliged to consider as
fundamental causes of disease, those factors that place individuals at risk for risk 43. However,
epidemiologic and toxocologic studies struggle to classify and incorporate “upstream” factors
that account for differential distribution of risks. Such factors as racial discrimination, social
disintegration and marginalization, and social inequality are hard to incorporate into a causal
modeling framework. It is often difficult to envision meaningful counterfactuals, or to conduct
experiments in which one factor (such as discrimination) is altered, and all other factors remain
the same. Glass and McAtee44 have suggested the concept of a risk regulator, features of the
built and social environments that impact the distribution of risks across places or populations.
Increasingly, systems analysis is also being used to generate new models and approaches for
understanding the social patterning of risk 45-47

14
A.5. Conclusion
These arguments about distributional aspects of risk derive ultimately from a moral
judgment. Suppose an emission source increases the risk of dying by e.g. 1 in 100,000 in a
large community around the source, resulting in an expectation of 1 additional death per year.
Contrast this with an alternative: it increases the risk of dying by 1 in 10 in a small neighborhood
around the plant, resulting in the same number of excess deaths per year. The attributable risk
(i.e. the total number of cases attributable to the exposure) is the same, but many people would
be less comfortable with the second scenario, because all the risk is concentrated in a small
group, and because the level of the focused risk seems unconscionably high. That is, equity
matters. How to deal with equity in public policy decisions is a societal judgment. But unless risk
assessors provide the relevant information, those judgments will be made in ignorance. This
example is for clarity, we are not suggesting that EPA does not take into account differential
exposure in their risk assessments, e.g. for air toxics. But they rarely take into account different
slopes, which can matter just as much for equity. Failure to identify subgroups based on
differential vulnerability can lead to a masking of pockets of inequity. This in turn provides an
excuse for ignoring the ethical issues that arise.
B. Lead and Air Pollution: extended examples
This paper seeks to expand on the issues raised above, illustrate them with examples
that demonstrate that the issues are not hypothetical, and suggest approaches to generalize the
risk assessments to incorporate these other dimensions. To provide clarity, we will attempt to
always illustrate our points with examples, and for simplicity and consistency, we will emphasize
the cases of lead exposure or air pollution as our examples.
B.1. Sources of Susceptibility (Susceptibility in Response to Exposure)
B.1.1. Genetic Sources of Variable Response B.1.1.i. General Issues
Genetic susceptibility to environmental exposures is clear from the literature, and the
field is rapidly advancing. As early as the 1970’s studies of subjects experimentally exposed to
ozone in chambers demonstrated substantial variability in response. This variability was
repeatable, and un-explained by phenotype48. Large scale animal studies have identified genes
with human homologues that may explain this result49. The existence of common
polymorphisms affecting Phase I and Phase II detoxification pathways indicates this is a likely
source of important variations in response to multiple toxicants. If genetic susceptibility is

15
important for certain exposures, and several pathways contribute to that susceptibility, this could
result in substantial differences in the distribution of risk.
B.1.1.ii. Lead
The evidence regarding the role of the genetic factors in health outcomes associated
with increased lead exposure is mixed. Some studies suggest that carriers of the 2 allele of the
amino levulinic acid dehydratase gene (i.e.,ALAD-2 carriers) are at increased risk of lead-
associated neurobehavioral deficits50, 51, while other studies, focusing on similar endpoints,
suggest that this subgroup is at reduced risk52, 53. Some of the inconsistency in results across
studies might be due to age-dependence in this association. A recent study of lead and
cognitive function using NHANES data suggested modification by ALAD status in 20 to 59 year
olds, but not in 12 to 16 year olds or in adults older than 60 years54. This also highlights our
point about the importance of age at time of exposure, and not exposure alone. A similar
potential age-dependence in the relationship between genotype and risk has been reported for
apoliprotein E (ApoE). In adults, carriers of the APoE4 allele appear to be at increased risk of
lead-associated neurobehavioral deficits55, while this was not found in a study of children56.
There is also evidence that the impact of APoE4 depends on (and varies according to)
environmental factors including stress57. In males, the adverse effects of lead exposure on a
test of executive functioning were greatest among those lacking the dopamine receptor D4-758.
In adult workers, those with the vitamin D B variant showed greater lead-associated impairment
of renal function59. Vitamin D polymorphisms also modified the effect of lead on cognition in
children in NHANES III60.
Recent attention has been devoted to the hypothesis that lead increases the risk of
neurodegenerative processes in later life by means of an epigenetic mechanism. In rodents
and primates, Zawia and colleagues found that early lead exposure causes a developmental
reprogramming, resulting in over-expression in adulthood of the amyloid precursor protein
(APP) gene, specifically APP mRNA, APP, and beta-amyloid61.Amyloid protein is a major factor
in Alzheimer’s disease. An inverse association has also been reported between prenatal lead
exposure (maternal bone lead) and DNA methylation in cord blood8, and between bone lead
levels and DNA methylation in leukocytes in the elderly62.
B.1.1.iii. Air Pollution
There is strong and growing evidence that genetic polymorphisms modify the response
to air pollution. The strongest evidence to date is for polymorphisms along the oxidative defense
pathway. For example, polymorphisms along this pathway have been shown to modify the
effects of particles on heart rate variability26, 63, the effects of traffic particles on homocysteine

16
levels64, the effects of traffic pollutants on lengthening of the QT interval on electrocardiograms,
the effects of air pollution on lung function65, 66, the risk of ozone induced asthma67 and
wheeze68, the risk of endothelial inflammation caused by traffic particles69etc. The specific
genes along this pathway that matter vary amongst these studies, however, which may reflect
differences in outcomes studied, stochastic variability in the results, or interactions with as yet
unknown other risk modifiers. This makes it more difficult to use these results for risk
assessment of specific genes, but not to acknowledge that there is a skewed distribution of risk.
However, Glutathione S Transferase mu 1 (GSTM1) null variant is the most commonly reported
modifier along this path. In addition, other genetic polymorphisms that may modify the effects of
air pollution include those in the divalent metal metabolism pathway70, the angiotensin
pathway71, the methyl metabolism pathway72, and genes related to processing of micro RNA’s,
which are small non-coding RNA’s that post-transcriptionally control gene expression73.
In addition, there is growing evidence for a role of epigenetic mechanisms both as
pathways for the effects of air pollution, and potential modifiers of response. Metal rich particles
have been associated with reduced methylation of the promoter region of the iNOS gene10, for
example. And traffic officers have changes in methylation of cancer suppressor and promotion
genes similar to those seen in leukemia74. Exposure to traffic particles75 and polycyclic aromatic
hydrocarbons76 has also been shown to alter DNA methylation patterns.
B.1.2. Phenotypic (Host characteristics) Sources of Variable Response B.1.2.i. General Issues
There are a number of theoretical arguments to suggest that physiologic and disease
states of individuals may influence their response to environmental agents. In the early 1800’s
Scottish public health advocates, lead by William Pulteney Alison, chair of the practice of
medicine at the University of Edinburgh argued that the (unkown) agents that caused infectious
disease were ubiquitous, and what mattered was subject susceptibility, which was principally
driven by malnutrition. They recommended prescribing food77. Johns Cassel similarly argued in
1976 that host factors that alter the underlying susceptibility of an individual to the deleterious
effects of various exposures are of paramount importance 78. The most obvious is that the
phenotype may be characterized by disturbances among one or more physiologic pathways that
are also important to the toxicity of the environmental agent. Environmental disturbances to
those pathways may have greater effects if the reserve capacity for dealing with such
disturbances is already impaired by the presence of disease, or allostatic load. This also has
implications for cumulative risk assessment, as some pathways may be relevant to multiple

17
different exposures. For example, both lead and air pollution have been shown to work, in part,
by increasing oxidative stress. Diabetes and obesity are phenotypes that are characterized by
elevated baseline levels of oxidative stress before exposure, and co-exposure to multiple agents
that produce further oxidative stress may result in nonlinear increases in risk. Indeed
interactions between lead exposure and air pollution have already been reported79. In addition
dietary antioxidants, such as vitamin C and vitamin E, or methyl related substrates such as B-
vitamins or methionine, or N-3 fatty acids21 have also been reported to modify responses to
environmental agents22, 72, 80. The potential for highly skewed distributions in risk exist because
these dietary intakes tend to be lower in more disadvantaged areas, where the prevalence of
obesity and diabetes also tends to be higher, and where exposure to some environmental
chemicals is also higher.
B.1.2.ii. Lead
Relatively few data are available on the issue of whether disease states modify the
effects of lead. Some studies, which are somewhat controversial, suggest that lead-associated
decrement in renal function is more pronounced in patients with pre-existing chronic kidney
disease (e.g., hypertension, gout)81. In an elderly cohort, higher lead level was associated with
impaired renal function, but only in diabetic subjects82. Among adult men, the association
between increased patella lead (but not tibia lead) and autonomic dysfunction (heart-rate
variability) was reported to be greatest among those with metabolic syndrome83.
B.1.2.iii. Air Pollution
While a number of conditions have been reported to modify the effects of air pollution on
health, the strongest evidence is for obesity and diabetes. The increasing prevalence of obesity
and diabetes make these susceptibility factors especially important for risk assessment, since
they need to take into account the changing proportion of the population that is susceptible. A
2002 study of 4 US cities found that diabetics had double the risk of a PM10-associated
cardiovascular admission compared with nondiabetics84 A study in Montreal found air pollution
was associated with a much higher risk of death for diabetes than for all causes.85 Similarly, a
2.0-fold higher mortality risk associated with PM10 exposure was found for diabetics than for
controls in a 2004 case-crossover study23. Likewise, PM10 effects on mortality were stronger in
diabetics than in non-diabetics in 9 Italian cities.86 Other studies have reported that diabetes
modified the effects of air pollution on endothelial function87, 88, and on systemic inflammation89,
90.
Obese individuals were found to have twice the PM2.5-induced reduction in heart rate
variability than non-obese individuals, and had more PM2.5-mediated HR increases.91 Obesity
18
was a significant susceptibility factor for ozone (O3) acute effects on lung function, with twice
the estimated decrease in FEV1 due to O3 in obese subjects compared to non-obese
subjects.92 This is supported by animal data showing increased lung inflammation in response
to ozone in obese animals93, 94. In addition, obesity worsened the PM2.5 effects on the HF
component of HRV,95 and there was a greater effect of traffic-related PM on inflammatory
markers in obese individuals.96,97,89 Again, in the NHANES III, metabolic syndrome modified the
PM10 effect on inflammatory markers.98
Diet may also modify the effects of air pollution. For example, a randomized trial found
that Omega-3 fatty acid supplementation reduced the effect of particles on heart rate
variability.22 A chamber study of well characterized asthmatics also found that supplementation
with vitamins C and E reduced the increase in bronchial responsiveness following controlled
exposure to ozone99.
B.1.3. Psychosocial hazards and stress B.1.3.i. General issues
Psychological stress is a physiologic response to some environmental stimuli, that
can be positive and adaptive, or, under conditions including prolonged exposure, can
become dysregulated, leading to a variety of negative health consequences100. The
literature on stress is inconsistent about what it is in the environment that gives rise to a
stress response. Borrowing language from an environmental science perspective, we
argue that stress arises from exposure to a psychosocial hazard, defined as relatively
stable, visible features of the social and built environment that gives rise to a heightened
state of vigilance, alarm and fear101, 102. Previous studies have shown that dysregulation of
the stress response system has been consistently linked to cardiovascular and other
diseases.103 The Institute of Medicine reported that potential social causes of
neurodevelopmental disabilities, including social isolation and psychosocial stress, have not
been well studied.104 Recent animal studies and epidemiologic data suggest that social
context modifies environmental neurotoxicants.105 In poor communities, social and chemical
hazard exposure in childhood can jointly alter development and organization of the central
nervous system.106
B.1.3.ii. Lead
The study of how stress exacerbates the influence of lead dates back to classic studies
by Selye investigating how stressors (both systemic and local) act as “conditioners”, whose
effect while minor in isolation, is, when combined with lead exposure, powerful and complex107
In studying these “pluricausal” syndromes, Selye was concerned with physiologic stressors (skin

19
clip), however, the implications of this work have been carried forward into the study of stress of
a psychological and social origins.
A consistent finding is that stress may exacerbate the deleterious consequences of lead
exposure. In a series of rodent studies of maternal stress during pregnancy (novelty, restraint,
cold) and lead exposure through weaning, Cory-Slechta and colleagues showed that pups who
experienced both lead-exposure and stress demonstrated more impaired learning, compared to
controls, on fixed-interval schedule-controlled responding, as well as increased basal and
stress-induced corticosterone responses than did pups exposed to stress alone or to lead
alone108, 109. In addition, Schneider110 demonstrated that animals raised in social isolation were
more sensitive to the neurotoxic effects of lead than animals raised in an enriched environment.
Animal studies have shown that stress can increase the hormonal mobilization of lead from
bone to blood 111 and that lead exposure can alter responsiveness to environmental stress 112,
113. Exposure to psychosocial hazards in the laboratory increases cortisol production, the
primary hormonal mediator of the hypothalamic-pituitary-adrenal (HPA) axis. Cortisol itself is
associated with impaired memory and executive ability in older adults 114-116. Further, both lead
and cortisol are thought to alter common pathways in the mesocorticolimbic system including
calcium and glutamate-mediated processes 113, 117, 118. Both cortisol and lead appear to be
associated with similar domains of cognitive function (especially memory and executive
functioning). Glucocorticoid receptors are known to be present in relevant brain structures that
govern these areas.
To date, much less human evidence bears directly on the hypothesis that stress
modifies lead effects. In two studies of older men, the inverse associations between bone lead
level and cognition (Mini-Mental Status Examination score) and blood pressure were more
pronounced among men who self-reported greater stress24, 119.
The potential importance of the social/physical environment in modifying lead
neurotoxicity was demonstrated by a study that show that an impairment of spatial learning
caused by exposing a pup to lead in utero or through lactation can be mitigated by rearing it in
an enriched environment (i.e., larger cage, other rodents, toys)120. Moreover, the learning
effects were accompanied by differences in gene expression in the hippocampus (i.e., recovery
of deficits in NMDA receptor subunit 1 mRNA, induction of BDNF factor mRNA).
Another pathway by which lead effects might be expressed differentially by
socioeconomic position (SEP) concerns the possibility that early life lead exposure impairs the
response to a later brain insult. For example, lead-exposed rats showed reduced behavioral
recovery to an induced ischemic stroke in the hind limb parietal sensory-motor cortex in
20
adulthood121. Early lead exposure also impairs the topographic organization of the columnar
processing units in the barrel field somatosensory cortex in rats122 as well as the reorganization
of the barrel field that occurs following whisker follicle ablation123.
This general finding has also been shown in human studies. A study of children by
Gump124 found that higher cord blood lead levels were associated with higher baseline systolic
blood pressure (SBP), and higher early childhood lead levels were associated with greater total
peripheral (vascular) resistance (TPR) responses to acute stress. Very few studies have
examined the environmental backdrop that gives rise to the spatial distribution of stress
dysregulation. In one such study of older adults, Glass102 found that in those living in
neighborhoods with the most psychosocial hazards, tibia bone lead concentration had a more
deleterious effect on three of seven domains of cognitive function examined. Despite these
findings, most studies assume risk uniformity and either do not systematically investigate how
host characteristics (including stress) alter the effect of lead, or are underpowered to do so
effectively125
B.1.3.iii. Air Pollution
Limited but growing epidemiological evidence suggests that psychological stress may
also alter susceptibility to air pollution exposures. Social stress has been shown to modify
traffic-related air pollution effects on asthma etiology126 or exacerbation.127, 128 A study of
singleton births in Eastern Massachusetts examined the association between black carbon (BC)
and birth weight, and investigated confounding and effect modification by individual and area-
based socioeconomic measures (SEP).129 Also, some air pollutants and psychosocial stress
may independently affect common physiologic processes such as oxidative stress130 or
inflammatory cell (IgE) production.131 Among adults, 8-hydroxy-deoxyguanosine, a marker of
oxidative damage to DNA, has been linked to depressive symptoms,132 clinical depression,133, 134
perceived stress and perceived impossibility for alleviating stress,132 and caregiving for
advanced cancer patients (a measure of chronic stress).135 disease.136, 137 Given the evidence
to date that both psychosocial stress and air pollutants may influence oxidative stress and
cellular aging processes, further investigation of whether social-environmental interactions
contribute to cardiovascular disease will be important to advancing risk assessment.
B.1.4. Socio-economic Position B.1.4.i. General Issues
Socioeconomic position (SEP) is known to have an enduring, robust and complex
association with many health states. While the mechanisms underlying the SEP gradients in
health are not precisely known, different SEP groups clearly have markedly different health
21
status as well as vulnerability to the impact of common exposures. The relationship between
SEP and poor health is not confined to poor people alone. Although it is clear that the highest
risks occur among the persons with the lowest position, the dose-response is continuous138. At
each step of the socio-economic hierarchy, individuals tend to have better health compared with
those below them. Hence this potential co-risk factor and risk modifier cannot be simply dealt
with by looking at the extremes.
Further, SEP can be conceptualized and measured at both the individual level and the
area level (e.g., neighborhoods). Evidence suggests that each level exerts an independent
influence on an individual’s chances of health. That is, a wealthy person living in a poor area is
exposed to the same excess of fast food, lack of nearby fresh produce, higher crime rate,
greater distance to pharmacies, lack of attractive green space, etc, as their neighbors, and this
tends to impact their health, and potentially their response to environmental pollutants.
B.1.4.ii. Lead
Several studies have provided evidence that the impact of lead on human health is
connected in complex ways to SEP139. In humans, some epidemiological studies have reported
that children from families of low SEP either express an exposure-associated deficit at lower
biomarker levels of lead or fail to recover/compensate as quickly or completely as children with
higher SEP levels125. A recent analysis suggested that the effect of increased blood lead levels
on children’s performance on an end-of-grade reading test was more pronounced at the lower
than the upper tail of the distribution of reading scores140. In other words, the effects of
increased lead exposure were greater among children who faced other risk factors for lower
reading achievement. This phenomenon is not restricted to lead. Rauh et al141 measured
prenatal and post-natal exposure to ETS, social stress factors, and Bayley Scales of infant
development in 226 urban children enrolled during pregnancy and followed longitudinally.
Prenatal ETS exposure was associated with a 5 point reduction in Bayley MDI scores. Material
hardship was similarly associated with a 3 point reduction in MDI. However, the interaction of
material hardship and prenatal ETS was associated with a further 7 point decline in MDI scores
(p=0.03). In order to understand the basis of this finding, it is necessary to deconstruct the
complex construct of SEP into its component features. These include nutrition, stress, other
chemical exposures, and the social/physical environment. Some evidence can be marshaled to
suggest a role for each of these features in the apparent effect modification of lead neurotoxicity
by SEP.
Many studies have treated SEP solely as a confounder of the lead-health association142.
Given the usual pattern of covariance between increased lead exposure and other risk factors
22
for adverse health states, there is no question that potential confounding by SEP must be
considered, but careful consideration must be given, as well, to the possibility that treating SEP
as a confounder could lead to bias. To the extent that blood lead level is an imperfect measure
of lead exposure history, or is subject to misclassification bias, other factors (like SEP or
race/ethnicity) may, in some circumstances, be better markers of cumulative exposure than a
biomarker measurement. Secondly, lead exposure may be on the causal pathway between
SEP and health. This arises from the social patterning of lead exposure along socioeconomic
lines42, 143 These considerations suggest that methodological tools such as directed acyclic
graphs or techniques such as structural equation modeling might be useful in dissecting these
complex relationships and controlling only those portions of the relationships that confound the
exposure-outcome relationships of interest.
B.1.4.iii. Air Pollution
There is also a modest but consistent set of studies indicating that SEP modifies the
effect of air pollution. For example, Forestiere and coworkers, using a city where it was the
upper SEP subjects who had higher exposures, showed the effects of PM10 on daily death
varied by SEP144, a result consistent with other findings145, 146. There is also a small, but
developing literature on other outcomes such as preterm delivery147, or birthweight129.
B.1.4.iv. Age
The elderly represent a particularly susceptible population, and the current growth in the
number and proportion of older adults is unprecedented in the history of the United States. By
2030, the proportion of the U.S. population aged 65 and older will double to about 71 million
older adults, or one in every five Americans. Cognitive decline in the elderly is also a growing
burden. Recent estimates are that 6.4% of people over age 60 years in North America have
dementia, and the number with dementia is expected to almost triple by the year
2040. Importantly, small changes in cognition are strong predictors of eventual development of
dementia. Previous studies have also reported that heterogeneity in cognition is especially
pronounced in the elderly compared to younger adults.115 This raises the question of whether
there are environmental causes of this heterogeneity. Air pollution exposure has been linked to
increased inflammation in the brain,148 and brain inflammation has been implicated in the
development of Alzheimer's disease.149
The elderly are also at increased risk of cardiovascular disease, and air pollution has
been shown to have differential effects on the elderly for a number of cardiovascular endpoints,
including mortality23, 150-152.
23
Children are also generally considered to be a subgroup at increased risk of toxicant-
associated harm. Their greater vulnerability can be attributed to age-related differences in
metabolism (e.g., greater absorption of toxicants from the gastrointestinal tract, reduced
excretion, immaturity of detoxification pathways), developmental stage (e.g., ongoing
development and organization of organs such as the central nervous system), and behavior
(e.g., greater hand-to-mouth activity, greater relative dietary and respiratory intake of
toxicants153.
For example, children are more vulnerable with respect to air pollution because their
lungs are only partially developed at birth and are not fully functional until about 6–8 years of
age154. Infants are born with only one-tenth the number of alveoli of
adults and an under-developed epithelium. Indeed, alveolar development begins only in the late
3d trimester155. There are approximately 24 million alveoli present at birth, which grows 10-fold
to 257 million between birth and age 4156. This is postnatal development pattern is not merely a
theoretical concern for air pollutants. Fanucchi and coworkers157 exposed infant monkeys to 5
months of episodic exposure to 0.5 ppm of ozone. Compared to controls, O3-exposed animals
had fewer airway generations, hyperplastic bronchiolar epithelium, and altered smooth muscle
in terminal and respiratory bronchioles.
B.1.5. Other Environmental Agents Evidence that co-exposure to other neurotoxicants (e.g., manganese, arsenic) increases
the likelihood of lead-associated impairments is limited and comes mostly from animal models 158-161. In humans, two studies162, 163 reported that the slope of the dose-effect relationship
between blood lead level and neurodevelopment in infants is steeper among those with higher
blood manganese levels. In NHANES (1999-2006), adults whose blood levels of cadmium and
lead were both in the highest quartiles had greater odds of albuminuria and reduced GFR164.
B.2. Sources of Susceptibility (Differential Dose/Exposure)
The sections above describe how exposures to lead and air pollution may interact with
other factors conveying risk, such as stress, SEP, genetics, and pre-existing disease. But in
addition to interacting with such other risk factors, lead and air pollution often covary with them,
resulting in a further skewness of the risk distribution.

24
Substantial socioeconomic and ethnic disparities in blood lead levels have been
documented by the NHANES surveys since the 1980’s165 166. In recent decades blood lead
levels have declined across all subgroups of the U.S. population and the magnitude of the
subgroups disparities has diminished. Nevertheless, in the NHANES 1999-2002, the
percentage of individuals with a level exceeding 10 µg/dL was greater among non-Hispanic
blacks (1.4%) and Mexican-Americans (1.5%) than among non-Hispanic whites (0.5%). In
analyses of NHANES data 1999- 2004, among children 1-5 years of age, the frequencies of
blood lead levels greater than 10 µg/dL, by race/ethnicity, were: non-Hispanic black 3.4%,
Mexican-American 1.2%, non-Hispanic white 1.2%. The frequency was greater among poorer
children (poverty-to-income ratio ≤1.3)(1.8% vs. 0.8%) and among children on Medicaid (1.9%
vs. 1.1%)The strongest risk factors for higher blood lead levels were residence in older housing,
poverty, age, and being non-Hispanic black167
Other subgroups that have been identified as being at risk of greater blood lead levels
include children of immigrant parents 168, international adoptees (MMWR, 2000), and refugee
children 169. It is uncertain, however, whether this reflects geographic differences in exposure
opportunities (such as lead in folk and Ayurvedic medicines), genetic susceptibilities, or the
prevalence of toxicokinetic modifiers.
Several genetic variants or polymorphisms thought to affect lead metabolism have been
evaluated in terms of their influence on lead biomarker levels or their influence on lead-
associated health effects. These include amino levulinic acid dehydratase (ALAD), the
dopamine receptor D4, the HFE protein (hemochromatosis gene), apolipoprotein E (APoE), and
peptide transporter 2. Several studies have compared lead biomarkers in individuals with the
two co-dominant ALAD alleles (ALAD-1 and ALAD-2). There are substantial inconsistencies
across studies, although some have reported that carriers of the ALAD-2 allele (1-2 or 2-2) have
greater blood or cortical bone lead levels 51, 170-172. One study of adults suggested that the
plasma/whole blood lead ratio is greater in ALAD-2 carriers 173. In a sample of Hispanic
children, those homozygous for the peptide transporter 2 polymorphism had higher blood lead
levels than those without or heterozygous for this polymorphism 172. Another study showed that
children who were carriers of the variant hemochromatosis or transferrin gene had significantly
higher blood lead levels than wild-type children, and children carrying both variants were more
likely to have a blood lead level >10 µg/dL174 . Adult workers with the vitamin D B allele had
significantly higher patella lead levels 175.
Systematic data are not available on the distribution of genetic variants of interest in
relation to factors such as ethnicity and other demographic characteristics, and recent work

25
demonstrating the generally greater genetic variability within ethnic groups than between them
suggests that this might not be a fruitful avenue of investigation in explicating differences
between groups in toxicant-associated risks 176. However, the prevalence of some variants do
appear to vary substantially by geographic region. For example, ALAD-2 carrier status has a
prevalence of 3% in Indian workers 170, 8% in Chinese children177, and 16% in US men50 . In
another study, the frequencies of ALAD-2 allele were comparable in Asian and Caucasian
samples but absent in African samples 178.
Based on epidemiologic associations, a variety of dietary variables have been proposed
as modifiers of lead absorption or toxicity, most notably iron and calcium179. In the Normative
Aging Study cohort of adult men, reduced dietary vitamin D was associated with increased bone
lead levels, while decreased dietary vitamin C and iron were associated with increased blood
lead level180. A study of children in the Philippines showed that higher folate and iron levels
mitigated the inverse association between blood lead level and cognition 181.
B.2.1.i. Air pollution
There is strong evidence to support the view that socioeconomic position is strongly
associated with increased exposure to a variety of air pollutants. This in itself, helps explain the
differential distribution of lung related diseases in populations. For example, a study by Mohai 182and colleagues found that Blacks and respondents at lower educational levels and, to a
lesser degree, lower income levels were significantly more likely to live within a mile of a
polluting facility. Similarly, traffic air pollution has been shown to be higher in persons of lower
SEP129, 183, 184. In addition, exposure to pollution from concentrated animal feed lots varies by
SEP and race185. And Woodruff and coworkers showed that ambient air pollution
concentrations in general were higher in neighborhoods of pregnant women at higher risk for
adverse pregnancy outcomes because of lower social conditions186. In one of the few studies to
look at both indoor and outdoor air pollution concentrations, Baxter187 found evidence that
persons living in disadvantaged communities had higher exposure to both. They also showed
that lower socioeconomic status not only was associated with greater exposure outside the
home, but that factors associated with poverty such as cooking time, gas stove usage, occupant
density, and humidifiers were contributors to higher indoor concentrations of PM2.5 and NO2.
Using such covariation of exposures with susceptibility factors, a recent risk assessment
showed a considerable disparity in the impact of air pollution on mortality in Mexico188, and,
relevant to cumulative risk assessment, showed the same disparity gradient for poor water
quality and cooking fuel use.
26
B.3. Cumulative Exposure
The phrase cumulative exposure has been used to described two separate phenomena:
a) long term sequelae of continuing exposure to a substance, and b) the cumulative burden
resulting from exposure to many stressors. That cumulative burden may be enhanced by
interactions among the different stressors, as described above. Prior research in the Normative
Aging Study and other cohorts has demonstrated a link between cumulative lead exposure (as
measured by bone lead) and heart rate variability,83 hypertension,189, 190 ischemic heart
disease191, 192 and death193. Several frameworks have been established to conceptualize
cumulative exposure to all stressors over the life course. These include Geronimus’s concept of
weathering17, 18 and more recently, the concept of allostatic load13, 14. Both approaches attempt
to capture the cumulative wear and tear that occurs as a result of long-term exposure to multiple
stressors as reflected in increased vulnerability and decreased reserve capacity. In
environmental science, Zartarian summarizes various efforts undertaken by the EPA to assess
cumulative exposure in communities including the “Cumulative Communities Research
Program” within the National Exposure Research Laboratory194 Additional tools have been
developed in “life course epidemiology”, although a great deal more work is needed to further
refine these ideas. As Menzie et al argue, a key requirement for thinking about cumulative
exposures is the development of clear conceptual frameworks195. Complications arise when
there are interactions among multiple exposures, or when there are latencies in the onset of
biological effect.
Lead exposure shows strong socio-economic gradients, which are in turn associated
with higher stress, and is higher in black Americans, who have a higher prevalence of renal
disease. Hence, if, as suggested above, lead also has a multiplicative interaction with those risk
factors, the distribution of lead associated risks, or of cumulative risks, can become highly
skewed. Similarly, if as noted above, air pollution exposure is more common in populations with
higher rates of diabetes, hypertension and obesity, and those conditions modify the effects of
exposures, cumulative burdens may become large.
B.4. Markers of Cumulative Exposure
Assessing cumulative burden from multiple stressors is difficult, and consideration of this
issue could be advanced if a biomarker of cumulative burden were available. Telomeres are
regions of non-coding DNA at the ends of chromosomes that protect against structural
degradation, inappropriate recombination, and end-to-end fusion of chromosomes.196, 197
27
Telomere length declines with each successive cell division and thus serve as a measure of
biological aging.198 In addition to aging in general, shorter telomeres are associated with
various chronic diseases, including diabetes,199 hypertension,199-202 atherosclerosis,203 coronary
artery disease,204, 205 heart failure206 and increased cardiovascular risk.207, 208 Evidence from in
vitro209-211 and human studies 199, 210 suggests that oxidative stress and inflammation accelerate
telomere shortening. Reduced blood DNA telomere length has been also related to cumulative
long-life exposure to tobacco smoking.212, 213Recently, exposure to traffic pollution has been
associated with reduced telomere length214. It is too early to tell if this could be a useful
biomarker either for susceptibility or cumulative burden, but the possibility deserves greater
attention.
C. Methodological considerations
This next section addresses a partial set of methodological issues that might arise if the
issues raised above were to be taken into greater account. There are a number of other issues
we do not address here having to do for example with problems in the measurement of lead
dose. A rich literature on measurement issues in lead research exists 139, 215-218 Instead, we
focus here in issues related to the further elucidation of issues related to differential vulnerability
and susceptibility.
C.1. General overview of methodological issues.
C.1.1. Methods for exploring interactions A key issue in modeling interactions between environmental exposures and measures of
susceptibility, whether social, genetic, or due to disease status, is that the variables often exist
on multiple levels, with potentially different meanings. It is clear that in addition to individual level
SEP, contextual aspects of place affect people’s health, and potentially, their response to
exposure. Hence, a well off person residing in a geographic area that is predominantly poor will
be exposed to the same excess of fast food, deficits of fresh fruits and vegetables, safe
recreational areas and drug stores, as the poorer residents. This may affect their health, and
their response to environmental contaminants. The presence of environmental contaminants
may similarly, vary geographically, and this spatial patterning may effect exposure. For
example, within city variation in airborne particles is predominantly driven by traffic particles,
while cross-city, or cross time variations may be more due to secondary particles. These are not
necessarily equally toxic. Similarly, soil lead declines with distance from a smelter, but some soil
lead is from past emissions of leaded gasoline, or lead paint residues. These may vary on
28
different spatial scales, and have different bioavailability. Hence statistical modeling needs to
recognize the presence of different scales of variation, both spatial and temporal.
C.1.1.i. Hierarchical Mixed Models
One approach that lends itself to examining these issues is the Hierarchical Mixed
model. Where appropriate, such as where multiple measurements of each outcome are
available for a subject (or for an area), it allows us to identify whether there is variation in
baseline health across subjects (via the random intercepts), whether there is variability in
response to exposure (via the random slopes), and to examine what individual level or area
level, or temporal level factors modify baseline levels or responses. That is, if some subjects
have higher blood pressures than average, and others lower than average, the repeated
measurements of the first subject will all tend to be higher (or lower) than predicted and hence
the residuals (measured – predicted) will all tend to have one sign, rather than varying randomly
about zero. We may also have correlations over space. Suppose the jth observation in subject i
and subject i´ depends on the spatial distance between them for example. The spatial patterning
of residences by social status, ethnicity, etc. may induce such a structure. Again, there may be
period effects or trends which may make observations in the same year more alike than
average. Mixed models can be used for binomial outcomes such as health events, or rates, but
it is easiest to focus on continuous outcomes to illustrate the point. That model assumes:
Where i denotes a level of aggregation: usually subject (but census tract or year are
also common), t denotes repeated measures, where present, ui is the difference from the overall
mean in subject i, and vi is the difference from average response to pollution (X) for subject i, Z
and Q are variables that explain some of the susceptibility. If i represents subject, for example,
than the variables in Z and Q may be subject level, may be neighborhood level (for example
median household income in a Census block group), or may represent periods. Similarly, we
could decompose, where appropriate X. For example, we might let
)()( tttittit ZXXXZX −+−+=
Where Zt is the air pollution reading from a central monitor, tX is the average of the personal
exposures of all the subjects on day t, and Xit is the exposure of the ith subject on day t. In this
framework we replace the single coefficient (β1 above) with 3 coefficients—one representing the
effect of area level pollution, one the effect of the difference of individual level exposure from the
QvZu
XvuY
i
i
ititiiit
λλγγ
εββ
+=+=
+++++=
0
0
10 )(covariates)(
29
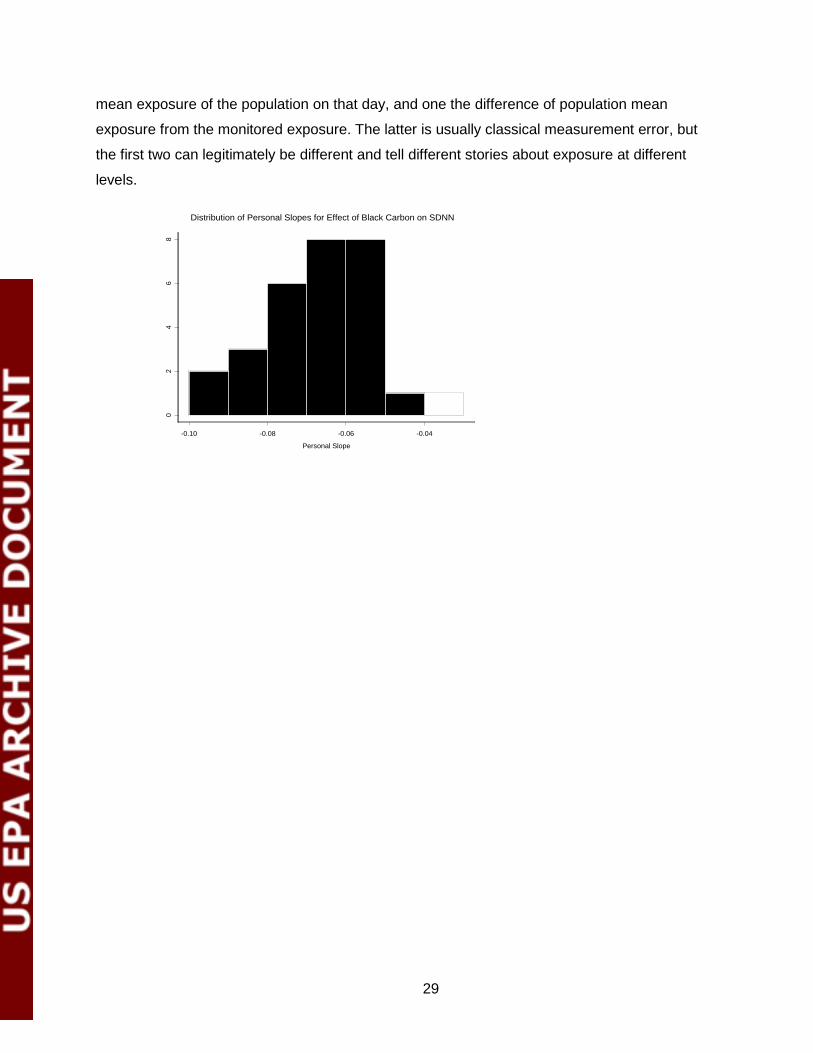
mean exposure of the population on that day, and one the difference of population mean
exposure from the monitored exposure. The latter is usually classical measurement error, but
the first two can legitimately be different and tell different stories about exposure at different
levels.
-0.10 -0.08 -0.06 -0.04
02
46
8
Personal Slope
Distribution of Personal Slopes for Effect of Black Carbon on SDNN
30
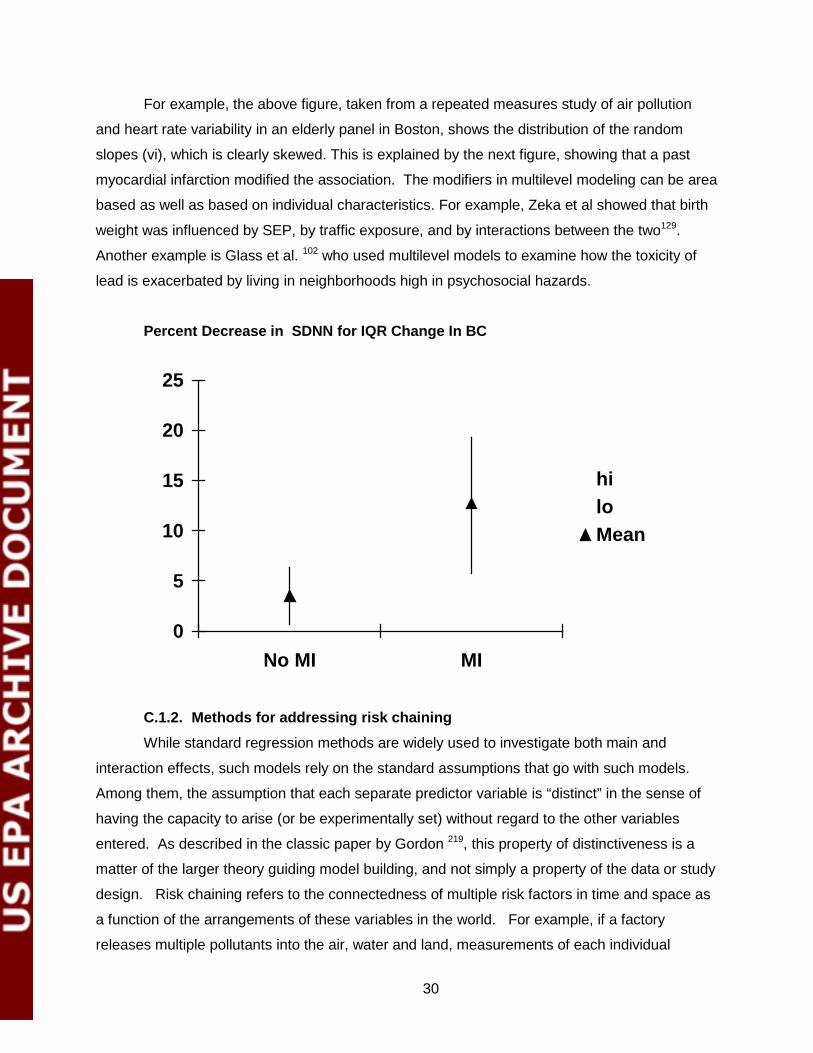
For example, the above figure, taken from a repeated measures study of air pollution
and heart rate variability in an elderly panel in Boston, shows the distribution of the random
slopes (vi), which is clearly skewed. This is explained by the next figure, showing that a past
myocardial infarction modified the association. The modifiers in multilevel modeling can be area
based as well as based on individual characteristics. For example, Zeka et al showed that birth
weight was influenced by SEP, by traffic exposure, and by interactions between the two129.
Another example is Glass et al. 102 who used multilevel models to examine how the toxicity of
lead is exacerbated by living in neighborhoods high in psychosocial hazards.
Percent Decrease in SDNN for IQR Change In BC
0
5
10
15
20
25
No MI MI
hiloMean
C.1.2. Methods for addressing risk chaining While standard regression methods are widely used to investigate both main and
interaction effects, such models rely on the standard assumptions that go with such models.
Among them, the assumption that each separate predictor variable is “distinct” in the sense of
having the capacity to arise (or be experimentally set) without regard to the other variables
entered. As described in the classic paper by Gordon 219, this property of distinctiveness is a
matter of the larger theory guiding model building, and not simply a property of the data or study
design. Risk chaining refers to the connectedness of multiple risk factors in time and space as
a function of the arrangements of these variables in the world. For example, if a factory
releases multiple pollutants into the air, water and land, measurements of each individual

31
pollutant are not distinct from one another (due to arising from a common source). If the
correlation among those exposures is high enough, it will not be possible to treat them all as
independent variables. In such cases, new metrics that combine multiple exposures (for say
exposures that operate through a common biological pathway) can be generated. Alternatively,
various clustering approaches can be used to identify distinct groupings of exposures, treating
them either as latent or manifest constructs (see 195). Beyond regression approaches, these
model constraints can be relaxed and the data explored for both clustering and interactions with
fewer assumptions using decision tree and machine learning approaches220, including kernal
machines221. Finally, new methods drawn from engineering and computer science in systems
dynamics offer ways of analyzing complex chains (or disease production algorithms) that can
not be seen given the assumptions imposed by standard regression models 45, 222, 223.
C.2. Alternative approaches to quantification of inequity
C.2.1. Underlying Issues. Thus far we have demonstrated that there are social, medical, and genetic factors that
modify risk, but have provided little quantitative evidence for how important this could be for the
equity issues. Doing so will require a measure. There are well-established methods to quantify
the inequality of distribution of outcomes that can be brought to bear on this issue. For example,
Levy et al quantified the risk reduction and equity considerations of alternative methods for
reducing mortality risk associated with coal burning power plants224, 225. He showed alternative
control strategies on two dimensions: efficiency (essentially risk divided by cost) and equity.
Equity was quantified using the Atkinson’s Index, a measure of the inequality in the distribution
of risk. This presupposes no judgment about what an acceptable inequality is, it merely
quantifies the level. By plotting multiple alternatives policies on the two dimensional scale of
efficiency and equity this approach provides decision makers with the necessary information to
make decisions based on their judgments of appropriate societal tradeoffs. Moreover, by
making the tradeoffs explicit rather than implicit, it encourages the appropriate public discussion
during rulemaking that will allow decisions to reflect societal values.
Another approach was taken by Su and coworkers, who adapted the “concentration
index” from social science as a measure of inequality226. Using small geographic scale units
they quantified the inequality in the distribution of risk from three pollutants, aggregated either
on a multiplicative or additive scale, and applied it to a real world scenario in Los Angeles. While
their metric was not risk per se, but the ratio of risk to, for example, an ambient standard, the
approach could be adopted to an absolute risk scale, and clearly demonstrates the ability to
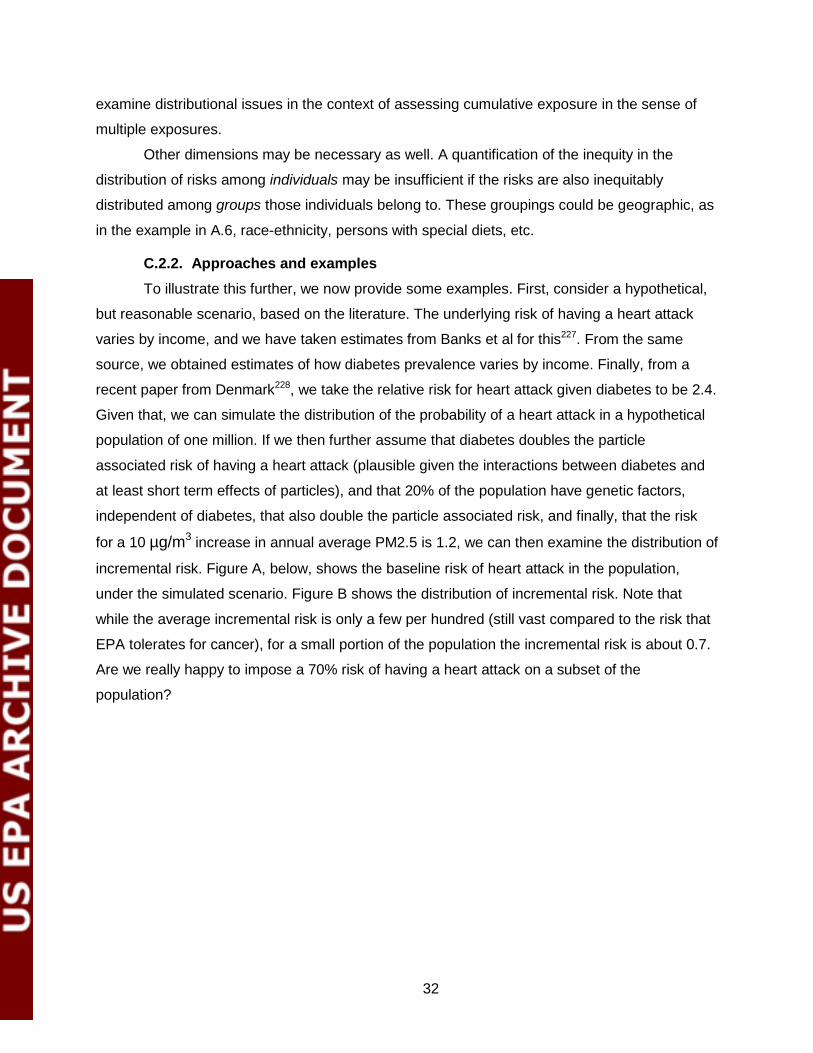
32
examine distributional issues in the context of assessing cumulative exposure in the sense of
multiple exposures.
Other dimensions may be necessary as well. A quantification of the inequity in the
distribution of risks among individuals may be insufficient if the risks are also inequitably
distributed among groups those individuals belong to. These groupings could be geographic, as
in the example in A.6, race-ethnicity, persons with special diets, etc.
C.2.2. Approaches and examples To illustrate this further, we now provide some examples. First, consider a hypothetical,
but reasonable scenario, based on the literature. The underlying risk of having a heart attack
varies by income, and we have taken estimates from Banks et al for this227. From the same
source, we obtained estimates of how diabetes prevalence varies by income. Finally, from a
recent paper from Denmark228, we take the relative risk for heart attack given diabetes to be 2.4.
Given that, we can simulate the distribution of the probability of a heart attack in a hypothetical
population of one million. If we then further assume that diabetes doubles the particle
associated risk of having a heart attack (plausible given the interactions between diabetes and
at least short term effects of particles), and that 20% of the population have genetic factors,
independent of diabetes, that also double the particle associated risk, and finally, that the risk
for a 10 µg/m3 increase in annual average PM2.5 is 1.2, we can then examine the distribution of
incremental risk. Figure A, below, shows the baseline risk of heart attack in the population,
under the simulated scenario. Figure B shows the distribution of incremental risk. Note that
while the average incremental risk is only a few per hundred (still vast compared to the risk that
EPA tolerates for cancer), for a small portion of the population the incremental risk is about 0.7.
Are we really happy to impose a 70% risk of having a heart attack on a subset of the
population?
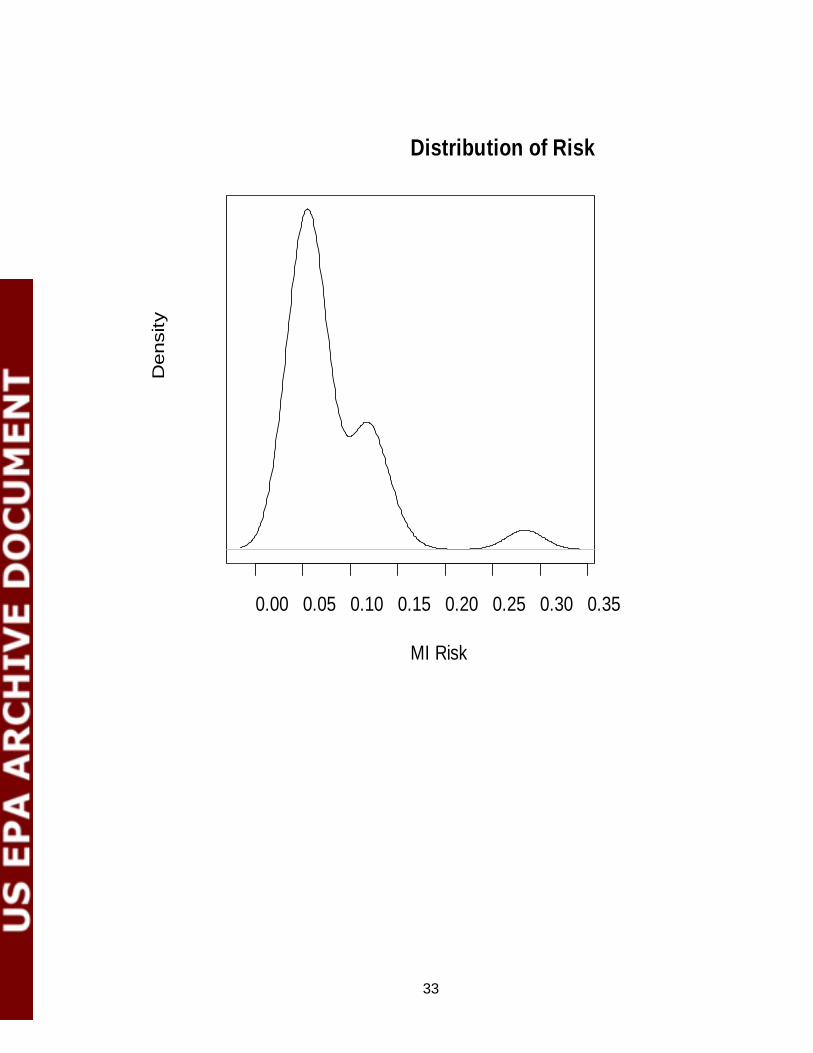
33
0.00 0.05 0.10 0.15 0.20 0.25 0.30 0.35
Distribution of Risk
MI Risk
Den
sity
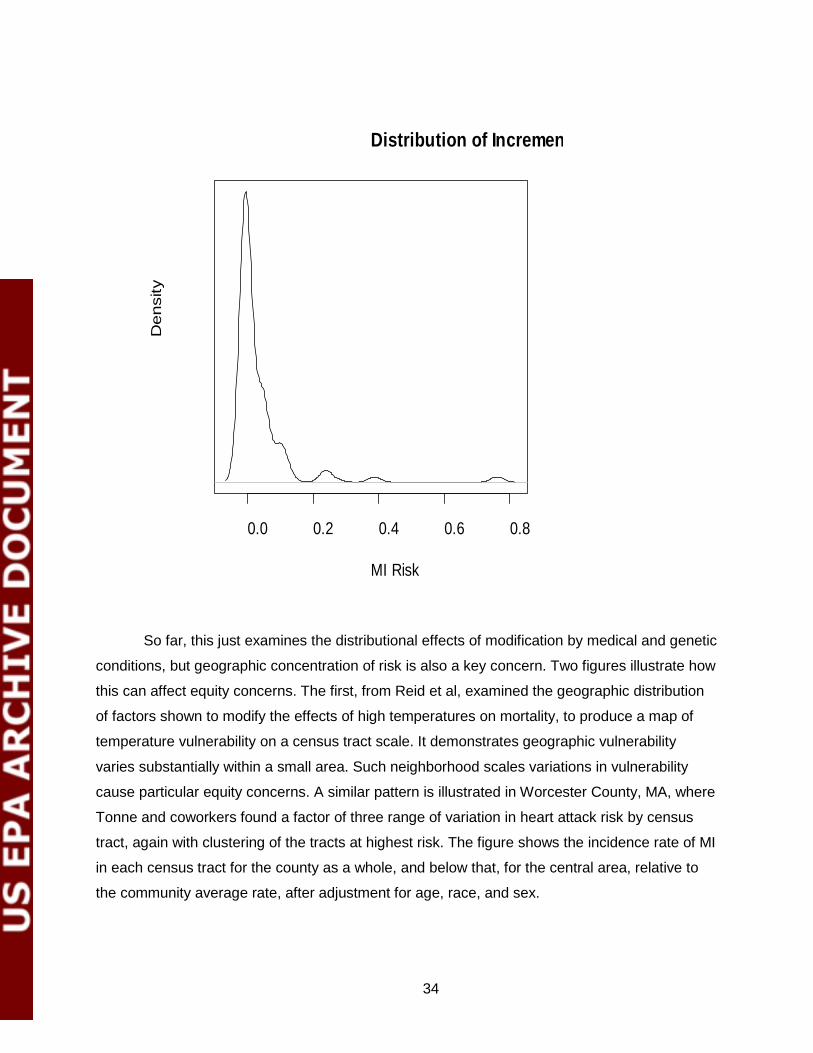
34
So far, this just examines the distributional effects of modification by medical and genetic
conditions, but geographic concentration of risk is also a key concern. Two figures illustrate how
this can affect equity concerns. The first, from Reid et al, examined the geographic distribution
of factors shown to modify the effects of high temperatures on mortality, to produce a map of
temperature vulnerability on a census tract scale. It demonstrates geographic vulnerability
varies substantially within a small area. Such neighborhood scales variations in vulnerability
cause particular equity concerns. A similar pattern is illustrated in Worcester County, MA, where
Tonne and coworkers found a factor of three range of variation in heart attack risk by census
tract, again with clustering of the tracts at highest risk. The figure shows the incidence rate of MI
in each census tract for the county as a whole, and below that, for the central area, relative to
the community average rate, after adjustment for age, race, and sex.
0.0 0.2 0.4 0.6 0.8
Distribution of Incremen
MI Risk
Den
sity
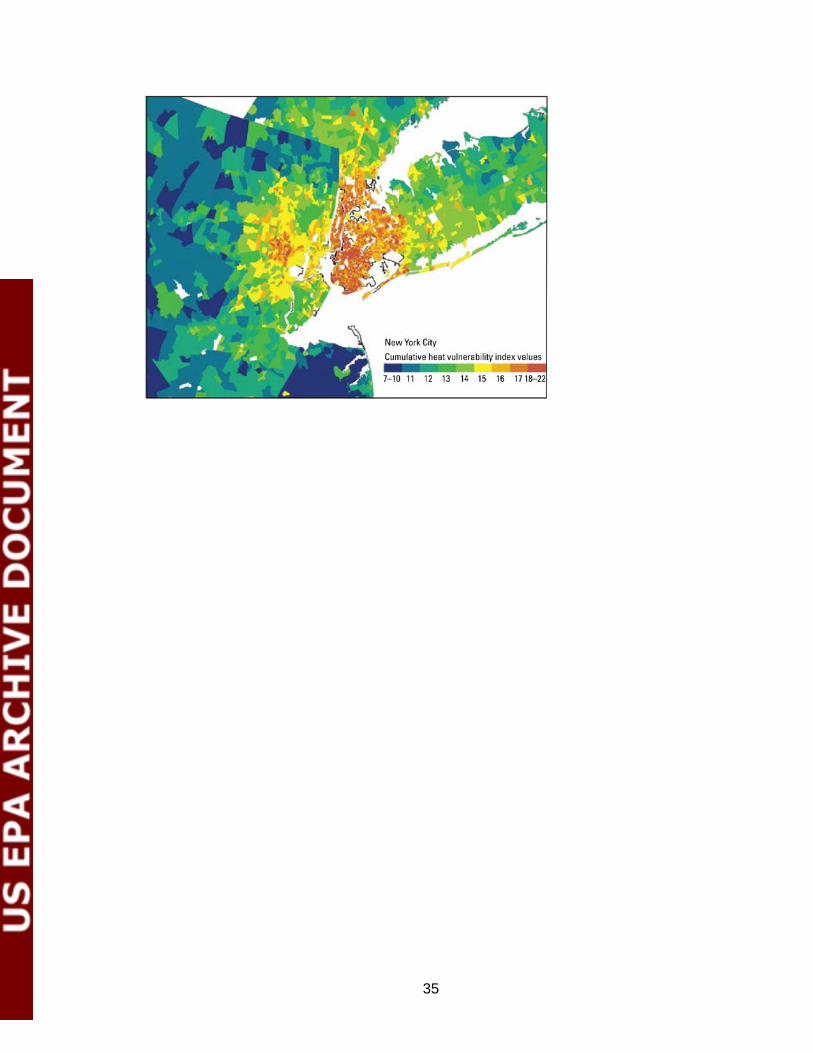
35
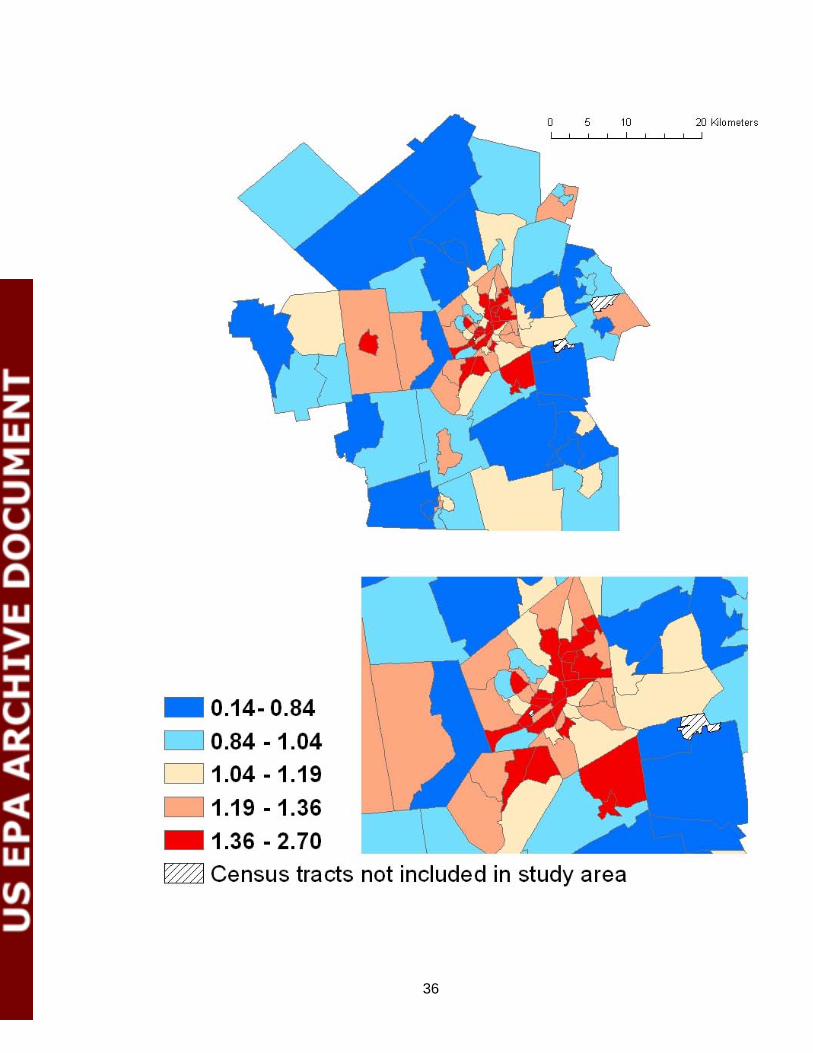
36
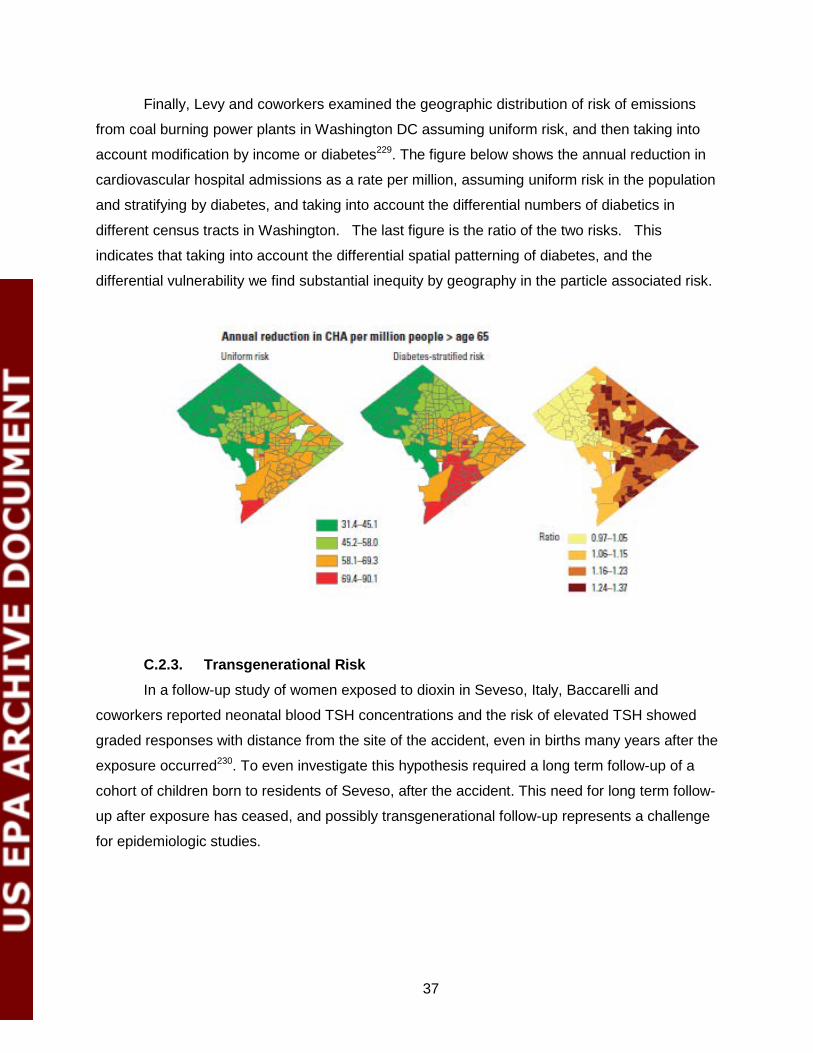
37
Finally, Levy and coworkers examined the geographic distribution of risk of emissions
from coal burning power plants in Washington DC assuming uniform risk, and then taking into
account modification by income or diabetes229. The figure below shows the annual reduction in
cardiovascular hospital admissions as a rate per million, assuming uniform risk in the population
and stratifying by diabetes, and taking into account the differential numbers of diabetics in
different census tracts in Washington. The last figure is the ratio of the two risks. This
indicates that taking into account the differential spatial patterning of diabetes, and the
differential vulnerability we find substantial inequity by geography in the particle associated risk.
C.2.3. Transgenerational Risk In a follow-up study of women exposed to dioxin in Seveso, Italy, Baccarelli and
coworkers reported neonatal blood TSH concentrations and the risk of elevated TSH showed
graded responses with distance from the site of the accident, even in births many years after the
exposure occurred230. To even investigate this hypothesis required a long term follow-up of a
cohort of children born to residents of Seveso, after the accident. This need for long term follow-
up after exposure has ceased, and possibly transgenerational follow-up represents a challenge
for epidemiologic studies.
38
D. Conclusions and recommendations
If continued progress is to be made in explicating these complex phenomena, future
studies of toxicant exposure-risk relationships must invest the resources necessary to measure
individual and contextual factors that might modify these relationships. Risk assessments need
to move from an RfD approach to estimating attributable risk and the distribution of that
attributable risk, in order to allow the assessment of inequity and to allow risk mangers to have
quantitative measures of both overall risk and the distributional aspects to use to in reaching
judgments. Environmental rulemakings are often supposed to provide protection to the
population subgroup most vulnerable to a toxicant (and thus, by extension, be protective for all
other subgroups). The reality is that in most cases we do not know which subgroups are the
most vulnerable or, if we do, subgroup is defined very broadly, such as the fetus in the case of
methylmercury, or young children in the case of lead. Based on the evidence we have
marshaled, however, it is likely that not all fetuses are equally sensitive to methylmercury or that
all young children are equally sensitive to lead. If the perspective that we are advocating were
incorporated into epidemiology studies and subsequent risk assessments, the definition of the
most vulnerable subgroup would therefore become much more specific and, therefore, much
more useful in terms of targeting preventive strategies for reducing toxicant-associated
morbidities. But first, more studies must be conducted to provide the necessary data on factors
that modify vulnerability.
D.1. Unpacking the risk assessment black-box
In most risk assessments conducted for the purpose of identifying an acceptable level of
exposure, various uncertainty factors (UF) are applied to effect levels derived from empirical
studies. These are necessary to address inter-species extrapolation (if the critical effect level is
based on a nonhuman model), human variability in vulnerability (which is usually interpreted as
pertaining to toxicokinetic/toxicodynamic variability), absence of data on long-term sequela, or
other gaps in the available database. The specific value assumed for an UF varies, but often a
generic default value of 10 is used. Most models regard this variability as stochastic, and not
explainable given the data. A main recommendation implied by our paper is the need to move to
modeling those sources of variability using data. What we have proposed in this paper is a
strategy for understanding, at a more precise quantitative level, human (or inter-individual)
variability in vulnerability. In essence, we have begun to address how the workings of the “black
box” that represents this variability can be understood. We have shown that considerable
39
progress has been made in understanding the myriad factors that influence the magnitude of an
individual’s external dose to a toxicant, the association between the external dose and the
internal (or absorbed) dose (i.e., toxicokinetics), and the biological response at the critical target
organs to the internal dose (i.e., toxicodynamics). That is, epidemiologic studies designed to
identify susceptibility often do so—the goal is quite achievable. In the short run, EPA should
incorporate those findings into quantitative risk assessment now while encouraging the research
that will allow the approach to be extended to more pollutants in the future. Moreover, we have
shown that the distribution of these important factors is not random within the population.
Rather, they co-occur in patterns that result in some subgroups of the population bearing a
disproportionate burden of the health morbidities that can be attributed to toxicants.
D.2. Acknowledging the need for social justice in risk assessment
The call to pay greater attention to the clustering of risk and differential vulnerability is
more than a concern about technical or methodological issues. In part, the emphasis of
individual-level biological and genetic factors arises from the fact that these are the sort of data
that are easier to collect and which we have more mature tools of investigation. We cannot,
however, escape that fact that the clustering of high and low exposure regimes in particular
environments also represents social, political and economic processes at work 231. While less
familiar and harder to study, these “upstream” factors are important drivers of disparities in
health outcomes. Disparities in health arise from inequities in the distributions of resources and
risks. Those inequities are sensitive to policies that are often not considered part of the health
policy domain, but which can be powerful levers of intervention. The example of the ozone hole
and the banning of CFCs is an important historical example. But beyond the caliber of the
science, we recognize a moral imperative to augment risk assessment approaches in the
pursuit of greater social justice 232, 233. In part, this involves the need to link to a greater extent
exposure and health data to social and demographic data using Geographic Information
Systems 234. But it also means treating inequities in the delivery of exposure as a fundamental
problem that requires explanation and action.
40
References 1. Committee on Improving Risk Analysis Approaches. Science and Decisions:
Advancing Risk Assessment. Washington, DC: National Research Council (U.S.). Committee on Improving Risk Analysis Approaches Used by the U.S. EPA.; 2008.
2. Agency EP. Final Regulatory Analysis: Control of Emissions from Nonroad Diesel Engines. In: Agency UEP, ed; 2004.
3. Dolinoy DC, Jirtle RL. Environmental epigenomics in human health and disease. Environ Mol Mutagen. 2008;49(1):4-8.
4. Jirtle RL, Skinner MK. Environmental epigenomics and disease susceptibility. Nat Rev Genet. 2007;8(4):253-262.
5. Anway MD, Cupp AS, Uzumcu M, Skinner MK. Epigenetic transgenerational actions of endocrine disruptors and male fertility. Science. 2005;308(5727):1466-1469.
6. Skinner MK, Anway MD, Savenkova MI, Gore AC, Crews D. Transgenerational epigenetic programming of the brain transcriptome and anxiety behavior. PLoS ONE. 2008;3(11):e3745.
7. Dolinoy DC, Huang D, Jirtle RL. Maternal nutrient supplementation counteracts bisphenol A-induced DNA hypomethylation in early development. Proc Natl Acad Sci U S A. 2007;104(32):13056-13061.
8. Pilsner JR, Hu H, Ettinger A, Sanchez BN, Wright RO, Cantonwine D, Lazarus A, Lamadrid-Figueroa H, Mercado-Garcia A, Tellez-Rojo MM, Hernandez-Avila M. Influence of prenatal lead exposure on genomic methylation of cord blood DNA. Environmental health perspectives. 2009;117(9):1466-1471.
9. Baccarelli A, Wright RO, Bollati V, Tarantini L, Litonjua AA, Suh HH, Zanobetti A, Sparrow D, Vokonas PS, Schwartz J. Rapid DNA methylation changes after exposure to traffic particles. Am J Respir Crit Care Med. 2009;179(7):572-578.
10. Tarantini L, Bonzini M, Apostoli P, Pegoraro V, Bollati V, Marinelli B, Cantone L, Rizzo G, Hou L, Schwartz J, Bertazzi PA, Baccarelli A. Effects of particulate matter on genomic DNA methylation content and iNOS promoter methylation. Environ Health Perspect. 2009;117(2):217-222.
11. Yehuda R, Bierer LM. Transgenerational transmission of cortisol and PTSD risk. Prog Brain Res. 2008;167:121-135.
12. Collins JW, Jr., David RJ, Rankin KM, Desireddi JR. Transgenerational effect of neighborhood poverty on low birth weight among African Americans in Cook County, Illinois. Am J Epidemiol. 2009;169(6):712-717.
13. McEwen BS. Allostasis and allostatic load: implications for neuropsychopharmacology. Neuropsychopharmacology. 2000;22(2):108-124.
14. McEwen BS, Stellar E. Stress and the individual. Mechanisms leading to disease. Arch Intern Med. 1993;153(18):2093-2101.
15. Seeman TE, Singer BH, Rowe JW, Horwitz RI, McEwen BS. Price of adaptation--allostatic load and its health consequences. MacArthur studies of successful aging. Arch Intern Med. 1997;157(19):2259-2268.
16. Geronimus AT. Understanding and eliminating racial inequalities in women's health in the United States: the role of the weathering conceptual framework. J Am Med Womens Assoc. 2001;56(4):133-136, 149-150.
41
17. Geronimus AT. The weathering hypothesis and the health of African-American women and infants: evidence and speculations. Ethn Dis. 1992;2(3):207-221.
18. Geronimus AT, Hicken M, Keene D, Bound J. "Weathering" and age patterns of allostatic load scores among blacks and whites in the United States. Am J Public Health. 2006;96(5):826-833.
19. Davey Smith G, ed. Health Inequalities: Lifecourse approaches. Bristol, UK: The Policy Press; 2003.
20. Kuh D, Ben-Shlomo Y, Lynch J, Hallqvist J, Power C. Life course epidemiology. J Epidemiol Community Health. 2003;57(10):778-783.
21. Samet JM, Hatch GE, Horstman D, Steck-Scott S, Arab L, Bromberg PA, Levine M, McDonnell WF, Devlin RB. Effect of antioxidant supplementation on ozone-induced lung injury in human subjects. American journal of respiratory and critical care medicine. 2001;164(5):819-825.
22. Romieu I, Tellez-Rojo MM, Lazo M, Manzano-Patino A, Cortez-Lugo M, Julien P, Belanger MC, Hernandez-Avila M, Holguin F. Omega-3 fatty acid prevents heart rate variability reductions associated with particulate matter. American journal of respiratory and critical care medicine. 2005;172(12):1534-1540.
23. Bateson TF, Schwartz J. Who is sensitive to the effects of particulate air pollution on mortality? A case-crossover analysis of effect modifiers. Epidemiology. 2004;15(2):143-149.
24. Peters JL, Kubzansky L, McNeely E, Schwartz J, Spiro A, 3rd, Sparrow D, Wright RO, Nie H, Hu H. Stress as a potential modifier of the impact of lead levels on blood pressure: the normative aging study. Environmental health perspectives. 2007;115(8):1154-1159.
25. O'Neill MS, Zanobetti A, Schwartz J. Modifiers of the temperature and mortality association in seven US cities. Am J Epidemiol. 2003;157(12):1074-1082.
26. Chahine T, Baccarelli A, Litonjua A, Wright RO, Suh H, Gold DR, Sparrow D, Vokonas P, Schwartz J. Particulate air pollution, oxidative stress genes, and heart rate variability in an elderly cohort. Environ Health Perspect. 2007;115(11):1617-1622.
27. Reason J. Human Error: models and management. British Medical Journal. 2000;320:768-770.
28. Schwartz J, Zanobetti A. Using meta-smoothing to estimate dose-response trends across multiple studies, with application to air pollution and daily death. Epidemiology. 2000;11(6):666-672.
29. Daniels MJ, Dominici F, Zeger SL, Samet JM. The National Morbidity, Mortality, and Air Pollution Study. Part III: PM10 concentration-response curves and thresholds for the 20 largest US cities. Res Rep Health Eff Inst. 2004(94 Pt 3):1-21; discussion 23-30.
30. Samoli E, Analitis A, Touloumi G, Schwartz J, Anderson HR, Sunyer J, Bisanti L, Zmirou D, Vonk JM, Pekkanen J, Goodman P, Paldy A, Schindler C, Katsouyanni K. Estimating the exposure-response relationships between particulate matter and mortality within the APHEA multicity project. Environ Health Perspect. 2005;113(1):88-95.
31. Schwartz J, Laden F, Zanobetti A. The concentration-response relation between PM(2.5) and daily deaths. Environ Health Perspect. 2002;110(10):1025-1029.
42
32. Samoli E, Touloumi G, Zanobetti A, Le Tertre A, Schindler C, Atkinson R, Vonk J, Rossi G, Saez M, Rabczenko D, Schwartz J, Katsouyanni K. Investigating the dose-response relation between air pollution and total mortality in the APHEA-2 multicity project. Occup Environ Med. 2003;60(12):977-982.
33. Schwartz J, Coull B, Laden F, Ryan L. The Effect of Dose and Timing of Dose on the Association between Airborne Particles and Survival. . Environ Health Perspect. 2008;116:64–69.
34. Lanphear BP, Hornung R, Khoury J, Yolton K, Baghurst P, Bellinger DC, Canfield RL, Dietrich KN, Bornschein R, Greene T, Rothenberg SJ, Needleman HL, Schnaas L, Wasserman G, Graziano J, Roberts R. Low-level environmental lead exposure and children's intellectual function: an international pooled analysis. Environmental health perspectives. 2005;113(7):894-899.
35. Morales KH, Ryan L, Kuo TL, Wu MM, Chen CJ. Risk of internal cancers from arsenic in drinking water. Environmental health perspectives. 2000;108(7):655-661.
36. Eilers P, Marx B. Flexible smoothing with B-splines and penalties (with discussion). Statist Sci. 1996;89:89-121.
37. Wood S. Modeling and smoothing parameter estimation with multiple quadratic penalties. JRSS B. 2000; 62:413-428.
38. Hoeting J, Madgan D, Rafferty A, Volinsky C. Bayesian model averaging: A tutorial. Statistical Science. 1999;14:382-417.
39. Council NR. Estimating the public health benefit of proposed air pollution regulations. Washington, DC: National Academy Press; 2002.
40. Baghurst PA, Tong S, Sawyer MG, Burns J, McMichael AJ. Sociodemographic and behavioural determinants of blood lead concentrations in children aged 11-13 years. The Port Pirie Cohort Study. Med J Aust. 1999;170(2):63-67.
41. Bellinger D, Leviton A, Waternaux C, Needleman H, Rabinowitz M. Low-level lead exposure, social class, and infant development. Neurotoxicol Teratol. 1988;10(6):497-503.
42. Elreedy S, Krieger N, Ryan PB, Sparrow D, Weiss ST, Hu H. Relations between individual and neighborhood-based measures of socioeconomic position and bone lead concentrations among community-exposed men: the Normative Aging Study. Am J Epidemiol. 1999;150(2):129-141.
43. Link BG, Phelan J. Social conditions as fundamental causes of disease. J Health Soc Behav. 1995;Extra Issue:80-94.
44. Glass TA, McAtee MJ. Behavioral science at the crossroads in public health: extending horizons, envisioning the future. Soc Sci Med. 2006;62(7):1650-1671.
45. Diez Roux AV. Integrating social and biologic factors in health research: a systems view. Ann Epidemiol. 2007;17(7):569-574.
46. Galea S, Riddle M, Kaplan GA. Causal thinking and complex system approaches in epidemiology. Int J Epidemiol. 2009.
47. Gibbons MC, Brock M, Alberg AJ, Glass T, Laveist TA, Baylin S, Levine D, Fox CE. The Sociobiologic Integrative Model (SBIM): Enhancing the Integration of Sociobehavioral, Environmental, and Biomolecular Knowledge in Urban Health and Disparities Research. J Urban Health. 2007;84(2):198-211.

43
48. Hackney JD, Linn WS, Buckley RD, Pedersen EE, Karuza SK, Law DC, Fischer A. Experimental studies on human health effects of air pollutants: I. Design considerations. Archives of environmental health. 1975;30(8):373-378.
49. Kleeberger SR. Genetic aspects of susceptibility to air pollution. The European respiratory journal. 2003;40:52s-56s.
50. Weuve J, Kelsey KT, Schwartz J, Bellinger D, Wright RO, Rajan P, Spiro A, 3rd, Sparrow D, Aro A, Hu H. Delta-aminolevulinic acid dehydratase polymorphism and the relation between low level lead exposure and the Mini-Mental Status Examination in older men: the Normative Aging Study. Occupational and environmental medicine. 2006;63(11):746-753.
51. Rajan P, Kelsey KT, Schwartz JD, Bellinger DC, Weuve J, Spiro A, 3rd, Sparrow D, Smith TJ, Nie H, Weisskopf MG, Hu H, Wright RO. Interaction of the delta-aminolevulinic acid dehydratase polymorphism and lead burden on cognitive function: the VA normative aging study. Journal of occupational and environmental medicine / American College of Occupational and Environmental Medicine. 2008;50(9):1053-1061.
52. Chia S, Huijun Z, Theng T, Yap E. Possibilities of newer ALAD polymorphism influencing human susceptibility to effects of inorganic lead on the neurobehavioral functions. Neurotoxicology. 2007;28:312-317.
53. Rajan P, Kelsey KT, Schwartz JD, Bellinger DC, Weuve J, Sparrow D, Spiro A, 3rd, Smith TJ, Nie H, Hu H, Wright RO. Lead burden and psychiatric symptoms and the modifying influence of the delta-aminolevulinic acid dehydratase (ALAD) polymorphism: the VA Normative Aging Study. Am J Epidemiol. 2007;166(12):1400-1408.
54. Krieg EF, Jr., Butler MA, Chang MH, Liu T, Yesupriya A, Lindegren ML, Dowling N. Lead and cognitive function in ALAD genotypes in the third National Health and Nutrition Examination Survey. Neurotoxicology and teratology. 2009;31(6):364-371.
55. Stewart WF, Schwartz BS, Simon D, Kelsey K, Todd AC. ApoE genotype, past adult lead exposure, and neurobehavioral function. Environ Health Perspect. 2002;110(5):501-505.
56. Wright RO, Hu H, Silverman EK, Tsaih SW, Schwartz J, Bellinger D, Palazuelos E, Weiss ST, Hernandez-Avila M. Apolipoprotein E genotype predicts 24-month bayley scales infant development score. Pediatr Res. 2003;54(6):819-825.
57. Lee BK, Glass TA, Wand GS, McAtee MJ, Bandeen-Roche K, Bolla KI, Schwartz BS. Apolipoprotein E genotype, cortisol, and cognitive function in community-dwelling older adults. Am J Psychiatry. 2008;64(7):810-818.
58. Froehlich T, Lanphear B, Dietrich K, al. e. Interactive effects of a DRD4 polymorphism, lead, and sex on executive functions in children. Biol Psychiatry. 2007;62:243-249.
59. Weaver V, Lee B, Todd A, al. e. Effect modification by delta-aminolevulinic acid dehydratase, vitamin D receptor, and nitric oxide synthase gene polymorphisms on associations between patella lead and renal function in lead workers. Environmental research. 2006;102:61-69.
60. Krieg EF, Jr., Butler MA, Chang MH, Liu T, Yesupriya A, Dowling N, Lindegren ML. Lead and cognitive function in VDR genotypes in the third National Health
44
and Nutrition Examination Survey. Neurotoxicology and teratology.32(2):262-272.
61. Wu J, Basha M, Zawia N. The environment, epigenetics and amyloidogenesis. J Mol Neurosci 2008;34:1-7.
62. Wright RO, Schwartz J, Wright RJ, Bollati V, Tarantini L, Park SK, Hu H, Sparrow D, Vokonas P, Baccarelli A. Biomarkers of Lead Exposure and DNA Methylation within Retrotransposons. Environ Health Perspect.
63. Le Tertre A, Schwartz J, Touloumi G. Empirical Bayes and adjusted estimates approach to estimating the relation of mortality to exposure of PM(10). Risk Anal. 2005;25(3):711-718.
64. Ren C, Park SK, Vokonas P, Sparrow D, Wilker E, Baccarelli A, Suh H, Tucker KL, Wright R, Schwartz J. Air pollution and Homocysteine: Modification by Oxidative Stress related genes. Epidemiology IN PRESS. 2009.
65. Curjuric I, Imboden M, Schindler C, Downs SH, Hersberger M, Liu SL, Matyas G, E WR, Schwartz J, Thun GA, Postma DS, Rochat T, Probst-Hensch NM. HMOX1 and GST variants modify attenuation of FEF25-75-decline due to PM10 reduction. Eur Respir J. 2009.
66. Alexeeff SE, Litonjua AA, Wright RO, Baccarelli A, Suh H, Sparrow D, Vokonas PS, Schwartz J. Ozone exposure, antioxidant genes, and lung function in an elderly cohort: VA normative aging study. Occup Environ Med. 2008;65(11):736-742.
67. Islam T, Berhane K, McConnell R, Gauderman WJ, Avol E, Peters JM, Gilliland FD. Glutathione-S-transferase (GST) P1, GSTM1, exercise, ozone and asthma incidence in school children. Thorax. 2009;64(3):197-202.
68. Schroer KT, Biagini Myers JM, Ryan PH, LeMasters GK, Bernstein DI, Villareal M, Lockey JE, Reponen T, Grinshpun S, Khurana Hershey GK. Associations between multiple environmental exposures and Glutathione S-Transferase P1 on persistent wheezing in a birth cohort. J Pediatr. 2009;154(3):401-408, 408 e401.
69. Madrigano J, Baccarelli A, Wright R, Suh H, Sparrow D, Vokonas P, Schwartz J. Air Pollution, Obesity, Genes, and Cellular Adhesion Molecules. Occup Environ Med. 2009.
70. Park SK, O'Neill MS, Wright RO, Hu H, Vokonas PS, Sparrow D, Suh H, Schwartz J. HFE genotype, particulate air pollution, and heart rate variability: a gene-environment interaction. Circulation. 2006;114(25):2798-2805.
71. Wilker E, Mittleman MA, Litonjua AA, Poon A, Baccarelli A, Suh H, Wright RO, Sparrow D, Vokonas P, Schwartz J. Postural changes in blood pressure associated with interactions between candidate genes for chronic respiratory diseases and exposure to particulate matter. Environmental health perspectives. 2009;117(6):935-940.
72. Baccarelli A, Cassano PA, Litonjua A, Park SK, Suh H, Sparrow D, Vokonas P, Schwartz J. Cardiac autonomic dysfunction: effects from particulate air pollution and protection by dietary methyl nutrients and metabolic polymorphisms. Circulation. 2008;117(14):1802-1809.
73. Wilker EH, Baccarelli A, Suh H, Vokonas P, Wright RO, Schwartz J. Black Carbon Exposures, Blood Pressure and Interactions with SNPs in MicroRNA Processing Genes. Environ Health Perspect.
45
74. Bollati V, Baccarelli A, Hou L, Bonzini M, Fustinoni S, Cavallo D, Byun HM, Jiang J, Marinelli B, Pesatori AC, Bertazzi PA, Yang AS. Changes in DNA methylation patterns in subjects exposed to low-dose benzene. Cancer research. 2007;67(3):876-880.
75. Baccarelli A, Wright RO, Bollati V, Tarantini L, Litonjua AA, Suh HH, Zanobetti A, Sparrow D, Vokonas PS, Schwartz J. Rapid DNA Methylation Changes after Exposure to Traffic Particles. American journal of respiratory and critical care medicine. 2009.
76. Perera F, Tang WY, Herbstman J, Tang D, Levin L, Miller R, Ho SM. Relation of DNA methylation of 5'-CpG island of ACSL3 to transplacental exposure to airborne polycyclic aromatic hydrocarbons and childhood asthma. PLoS ONE. 2009;4(2):e4488.
77. Hamlin C. Predisposing causes and public health in early nineteenth century medical thought. . Soc. Hist Med. 1992;5:43-70. 78. Cassel J. The contribution of the social environment to host resistance: the
Fourth Wade Hampton Frost Lecture. Am J Epidemiol. 1976;104(2):107-123. 79. Park SK, O'Neill MS, Vokonas PS, Sparrow D, Wright RO, Coull B, Nie H, Hu H,
Schwartz J. Air pollution and heart rate variability: effect modification by chronic lead exposure. Epidemiology (Cambridge, Mass. 2008;19(1):111-120.
80. Park SK, O'Neill MS, Vokonas PS, Sparrow D, Spiro A, 3rd, Tucker KL, Suh H, Hu H, Schwartz J. Traffic-related particles are associated with elevated homocysteine: the VA normative aging study. American journal of respiratory and critical care medicine. 2008;178(3):283-289.
81. Ekong EB, Jaar BG, Weaver VM. Lead-related nephrotoxicity: a review of the epidemiologic evidence. Kidney Int. 2006;70(12):2074-2084.
82. Tsaih SW, Korrick S, Schwartz J, Amarasiriwardena C, Aro A, Sparrow D, Hu H. Lead, diabetes, hypertension, and renal function: the normative aging study. Environmental health perspectives. 2004;112(11):1178-1182.
83. Park SK, Schwartz J, Weisskopf M, Sparrow D, Vokonas PS, Wright RO, Coull B, Nie H, Hu H. Low-level lead exposure, metabolic syndrome, and heart rate variability: the VA Normative Aging Study. Environ Health Perspect. 2006;114(11):1718-1724.
84. Zanobetti A, Schwartz J. Cardiovascular damage by airborne particles: are diabetics more susceptible? Epidemiology. 2002;13(5):588-592.
85. Goldberg MS, Burnett RT, Bailar JC, 3rd, Brook J, Bonvalot Y, Tamblyn R, Singh R, Valois MF, Vincent R. The association between daily mortality and ambient air particle pollution in Montreal, Quebec. 2. Cause-specific mortality. Environmental research. 2001;86(1):26-36.
86. Forastiere F, Stafoggia M, Berti G, Bisanti L, Cernigliaro A, Chiusolo M, Mallone S, Miglio R, Pandolfi P, Rognoni M, Serinelli M, Tessari R, Vigotti M, Perucci CA. Particulate matter and daily mortality: a case-crossover analysis of individual effect modifiers. Epidemiology. 2008;19(4):571-580.
87. O'Neill MS, Veves A, Zanobetti A, Sarnat JA, Gold DR, Economides PA, Horton ES, Schwartz J. Diabetes enhances vulnerability to particulate air pollution-associated impairment in vascular reactivity and endothelial function. Circulation. 2005;111(22):2913-2920.

46
88. O'Neill MS, Veves A, Zanobetti A, Sarnat JA, Gold DR, Economides PA, Horton E, Schwartz J. Diabetes enhances vulnerability to particulate air pollution-associated impairment in vascular reactivity and endothelial function. Circulation. in press.
89. Dubowsky SD, Suh H, Schwartz J, Coull BA, Gold DR. Diabetes, obesity, and hypertension may enhance associations between air pollution and markers of systemic inflammation. Environmental health perspectives. 2006;114(7):992-998.
90. O'Neill MS, Veves A, Sarnat JA, Zanobetti A, Gold DR, Economides PA, Horton ES, Schwartz J. Air pollution and inflammation in type 2 diabetes: a mechanism for susceptibility. Occupational and environmental medicine. 2007;64(6):373-379.
91. Chen JC, Cavallari JM, Stone PH, Christiani DC. Obesity is a modifier of autonomic cardiac responses to fine metal particulates. Environmental health perspectives. 2007;115(7):1002-1006.
92. Alexeeff SE, Litonjua AA, Suh H, Sparrow D, Vokonas PS, Schwartz J. Ozone exposure and lung function: effect modified by obesity and airways hyperresponsiveness in the VA normative aging study. Chest. 2007;132(6):1890-1897.
93. Johnston RA, Theman TA, Lu FL, Terry RD, Williams ES, Shore SA. Diet-induced obesity causes innate airway hyperresponsiveness to methacholine and enhances ozone-induced pulmonary inflammation. J Appl Physiol. 2008;104(6):1727-1735.
94. Lu FL, Johnston RA, Flynt L, Theman TA, Terry RD, Schwartzman IN, Lee A, Shore SA. Increased pulmonary responses to acute ozone exposure in obese db/db mice. Am J Physiol Lung Cell Mol Physiol. 2006;290(5):L856-865.
95. Schwartz J, Park SK, O'Neill MS, Vokonas PS, Sparrow D, Weiss S, Kelsey K. Glutathione-S-transferase M1, obesity, statins, and autonomic effects of particles: gene-by-drug-by-environment interaction. American journal of respiratory and critical care medicine. 2005;172(12):1529-1533.
96. Zeka A, Sullivan JR, Vokonas PS, Sparrow D, Schwartz J. Inflammatory markers and particulate air pollution: characterizing the pathway to disease. International journal of epidemiology. 2006;35(5):1347-1354.
97. Madrigano J, Baccarelli A, Wright R, Suh H, Sparrow D, Vokonas P, Schwartz J. Air Pollution, Obesity, Genes, and Cellular Adhesion Molecules. Occup Environ Med. Published Online First: Nov 2. 2009.
98. Chen JC, Schwartz J. Metabolic syndrome and inflammatory responses to long-term particulate air pollutants. Environmental health perspectives. 2008;116(5):612-617.
99. Trenga CA, Koenig JQ, Williams PV. Dietary antioxidants and ozone-induced bronchial hyperresponsiveness in adults with asthma. Archives of environmental health. 2001;56(3):242-249.
100. Chrousos GP, Gold PW. The concepts of stress and stress system disorders. Overview of physical and behavioral homeostasis. JAMA. 1992;267(9):1244-1252.
101. Augustin T, Glass TA, James BD, Schwartz BS. Neighborhood psychosocial hazards and cardiovascular disease: the Baltimore Memory Study. Am J Public Health. 2008;98(9):1664-1670.
47
102. Glass TA, Bandeen-Roche K, McAtee M, Bolla K, Todd AC, Schwartz BS. Neighborhood psychosocial hazards and the association of cumulative lead dose with cognitive function in older adults Am J Epidemiol. 2009;169(6):683-692.
103. Kubzansky LD. Sick at heart: the pathophysiology of negative emotions. Cleve Clin J Med. 2007;74 Suppl 1:S67-72.
104. Institute of Medicine (IOM). Meeting the Challenge in the Developing World. Committee on Nervous System Disorders in Developing Countries, Board on Global Health, Neurological, Psychiatric, and Developmental Disorders. Washington, D.C.: National Academies Press; 2001.
105. Hubbs-Tait L, Nation JR, Krebs NF, Bellinger DC. Neurotoxicants, micronutrients, and social environments: Individual and combined effects of children's development Psychological Science in the Public Interest 2005;6(3):57-121.
106. Calderon J, Navarro ME, Jimenez-Capdeville ME, Santos-Diaz MA, Golden A, Rodriguez-Leyva I, Borja-Aburto V, Diaz-Barriga F. Exposure to arsenic and lead and neuropsychological development in Mexican children. Environ Res. 2001;85(2):69-76.
107. Selye H, Somogyi A, Vegh P. Inflammation, topical stress and the concept of pluricausal diseases. Biochem Pharmacol. 1968;17:Suppl:107-122.
108. Virgolini MB, Chen K, Weston DD, Bauter MR, Cory-Slechta DA. Interactions of chronic lead exposure and intermittent stress: consequences for brain catecholamine systems and associated behaviors and HPA axis function. Toxicological Sciences: an official journal of the Society of Toxicology. 2005;87(2):469-482.
109. Cory-Slechta DA, Virgolini MB, Thiruchelvam M, Weston DD, Bauter MR. Maternal stress modulates the effects of developmental lead exposure. Environmental Health Perspectives. 2004;112(6):717-730.
110. Schneider JS, Lee MH, Anderson DW, Zuck L, Lidsky TI. Enriched environment during development is protective against lead-induced neurotoxicity. Brain Res. 2001;896(1-2):48-55.
111. Bushnell PJ, Shelton SE, Bowman RE. Elevation of blood lead concentration by confinement in the rhesus monkey. Bull Environ Contam Toxicol. 1979;22(6):819-826.
112. Virgolini MB, Chen K, Weston DD, Bauter MR, Cory-Slechta DA. Interactions of chronic lead exposure and intermittent stress: consequences for brain catecholamine systems and associated behaviors and HPA axis function. Toxicol Sci. 2005;87(2):469-482.
113. Virgolini MB, Bauter MR, Weston DD, Cory-Slechta DA. Permanent alterations in stress responsivity in female offspring subjected to combined maternal lead exposure and/or stress. Neurotoxicology. 2006;27(1):11-21.
114. Lupien SJ, de Leon M, de Santi S, Convit A, Tarshish C, Nair NP, Thakur M, McEwen BS, Hauger RL, Meaney MJ. Cortisol levels during human aging predict hippocampal atrophy and memory deficits. Nat Neurosci. 1998;1(1):69-73.
115. Lupien SJ, Fiocco A, Wan N, Maheu F, Lord C, Schramek T, Tu MT. Stress hormones and human memory function across the lifespan. Psychoneuroendocrinology. 2005;30(3):225-242.
116. Lupien SJ, Lepage M. Stress, memory, and the hippocampus: can't live with it, can't live without it. Behav Brain Res. 2001;127(1-2):137-158.
48
117. Bowirrat A, Oscar-Berman M. Relationship between dopaminergic neurotransmission, alcoholism, and reward deficiency syndrome. Am J Med Genet B Neuropsychiatr Genet. 2005;132(1):29-37.
118. Cory-Slechta DA, Virgolini MB, Thiruchelvam M, Weston DD, Bauter MR. Maternal stress modulates the effects of developmental lead exposure. Environ Health Perspect. 2004;112(6):717-730.
119. Peters J, Weisskopf M, Spiro A, 3rd, Schwartz J, Sparrow D, Huiling N, Hu H, Wright R, Wright R. Interaction of stress, lead burden and age on cognition in older men: The Normative Aging Study. Environmental health perspectives. in press.
120. Guilarte T, Toscano C, McGlothan J, Weaver S. Environmental enrichment reverses cognitive and molecular deficits induced by developmental lead exposure. Ann Neurol. 2003;53:50-56.
121. Schneider JS, Decamp E. Postnatal lead poisoning impairs behavioral recovery following brain damage. Neurotoxicology. 2007;28(6):1153-1157.
122. Wilson M, Johnston M, Goldstein G, Blue M. Neonatal lead exposure impairs development of rodent barrel field cortex. Proc Natl Acad Sci U S A. 2000;97:5540-5545.
123. Wilson M, Blue M, Patra R, Gordon-Lipkin E, Johnston M. Neonatal lead exposure impairs plasticity in developing rat somatosensory cortex. Paper presented at: XXII International Neurotoxicology Conference, 2006; Little Rock, Arkansas.
124. Gump BB, Stewart P, Reihman J, Lonky E, Darvill T, Matthews KA, Parsons PJ. Prenatal and early childhood blood lead levels and cardiovascular functioning in 9(1/2) year old children. Neurotoxicol Teratol. 2005;27(4):655-665.
125. Bellinger DC. Effect modification in epidemiologic studies of low-level neurotoxicant exposures and health outcomes. Neurotoxicol Teratol. 2000;22(1):133-140.
126. Clougherty JE, Levy JI, Kubzansky LD, Ryan PB, Suglia SF, Canner MJ, Wright RJ. Synergistic effects of traffic-related air pollution and exposure to violence on urban asthma etiology. Environmental health perspectives. 2007;115(8):1140-1146.
127. Chen E, Schreier HM, Strunk RC, Brauer M. Chronic traffic-related air pollution and stress interact to predict biologic and clinical outcomes in asthma. Environmental health perspectives. 2008;116(7):970-975.
128. Shankardass K, McConnell R, Jerrett M, Milam J, Richardson J, Berhane K. Parental stress increases the effect of traffic-related air pollution on childhood asthma incidence. Proc Natl Acad Sci U S A. 2009;106(30):12406-12411.
129. Zeka A, Melly SJ, Schwartz J. The effects of socioeconomic status and indices of physical environment on reduced birth weight and preterm births in Eastern Massachusetts. Environ Health. 2008;7:60.
130. Fugisawa T. Role of oxygen radicals on bronchial asthma. Drug Targets Inflamm Allergy. 2005;4(4):505-509.
131. Diaz-Sanchez D, Penichet-Garcia M, Saxon A. Diesel exhaust particles directly induce activated mast cells to degranulate and increase histamine levels and symptom severity. J Allergy Clin Immunol. 2000;106(6):1140-1146.
49
132. Irie M, Asami S, Nagata S, Miyata M, Kasai H. Relationships between perceived workload, stress and oxidative DNA damage. Int Arch Occup Environ Health. 2001;74(2):153-157.
133. Forlenza MJ, Miller GE. Increased serum levels of 8-hydroxy-2'-deoxyguanosine in clinical depression. Psychosomatic medicine. 2006;68(1):1-7.
134. Irie M, Miyata M, Kasai H. Depression and possible cancer risk due to oxidative DNA damage. J Psychiatr Res. 2005;39(6):553-560.
135. Ratnakar S, Banupriya C, Doureradjou P, Vivekanandam S, Srivastava MK, Koner BC. Evaluation of anxiety, depression and urinary protein excretion among the family caregivers of advanced cancer patients. Biol Psychol. 2008;79(2):234-238.
136. Epel ES, Blackburn EH, Lin J, Dhabhar FS, Adler NE, Morrow JD, Cawthon RM. Accelerated telomere shortening in response to life stress. PNAS. 2004;101(49):17312-17315.
137. Elder A, Gelein R, Silva V, Feikert T, Opanashuk L, Carter J, Potter R, Maynard A, Ito Y, Finkelstein J, Oberdorster G. Translocation of inhaled ultrafine manganese oxide particles to the central nervous system. Environmental health perspectives. 2006;114(8):1172-1178.
138. Marmot M. Health in an unequal world. The Lancet. 2006;368(9552):2081-2094. 139. Hu H, Shih R, Rothenberg S, Schwartz BS. The epidemiology of lead toxicity in
adults: measuring dose and consideration of other methodologic issues. Environ Health Perspect. 2007;115(3):455-462.
140. Miranda ML, Kim D, Reiter J, Overstreet Galeano MA, Maxson P. Environmental contributors to the achievement gap. Neurotoxicology. 2009;30(6):1019-1024.
141. Rauh VA, Whyatt RM, Garfinkel R, Andrews H, Hoepner L, Reyes A, Diaz D, Camann D, Perera FP. Developmental effects of exposure to environmental tobacco smoke and material hardship among inner-city children. Neurotoxicology & Teratology. 2004;26(3):373-385.
142. Bellinger DC. Lead neurotoxicity and socioeconomic status: conceptual and analytical issues. Neurotoxicology. 2008;29(5):828-832.
143. Krieger N, Chen JT, Waterman PD, Soobader MJ, Subramanian SV, Carson R. Choosing area based socioeconomic measures to monitor social inequalities in low birth weight and childhood lead poisoning: The Public Health Disparities Geocoding Project (US). J Epidemiol Community Health. 2003;57(3):186-199.
144. Forastiere F, Stafoggia M, Tasco C, Picciotto S, Agabiti N, Cesaroni G, Perucci CA. Socioeconomic status, particulate air pollution, and daily mortality: differential exposure or differential susceptibility. Am J Ind Med. 2007;50(3):208-216.
145. Ou CQ, Hedley AJ, Chung RY, Thach TQ, Chau YK, Chan KP, Yang L, Ho SY, Wong CM, Lam TH. Socioeconomic disparities in air pollution-associated mortality. Environmental research. 2008;107(2):237-244.
146. Zanobetti A, Schwartz J. Race, gender, and social status as modifiers of the effects of PM10 on mortality. Journal of occupational and environmental medicine / American College of Occupational and Environmental Medicine. 2000;42(5):469-474.

50
147. Yi O, Kim H, Ha E. Does area level socioeconomic status modify the effects of PM(10) on preterm delivery? Environmental research.110(1):55-61.
148. Campbell A, Oldham M, Becaria A, Bondy SC, Meacher D, Sioutas C, Misra C, Mendez LB, Kleinman M. Particulate matter in polluted air may increase biomarkers of inflammation in mouse brain. Neurotoxicology. 2005;26(1):133-140.
149. Akiyama H, Barger S, Barnum S, Bradt B, Bauer J, Cole GM, Cooper NR, Eikelenboom P, Emmerling M, Fiebich BL, Finch CE, Frautschy S, Griffin WS, Hampel H, Hull M, Landreth G, Lue L, Mrak R, Mackenzie IR, McGeer PL, O'Banion MK, Pachter J, Pasinetti G, Plata-Salaman C, Rogers J, Rydel R, Shen Y, Streit W, Strohmeyer R, Tooyoma I, Van Muiswinkel FL, Veerhuis R, Walker D, Webster S, Wegrzyniak B, Wenk G, Wyss-Coray T. Inflammation and Alzheimer's disease. Neurobiology of aging. 2000;21(3):383-421.
150. Fischer P, Hoek G, Brunekreef B, Verhoeff A, van Wijnen J. Air pollution and mortality in The Netherlands: are the elderly more at risk? Eur Respir J Suppl. 2003;40:34s-38s.
151. Aga E, Samoli E, Touloumi G, Anderson HR, Cadum E, Forsberg B, Goodman P, Goren A, Kotesovec F, Kriz B, Macarol-Hiti M, Medina S, Paldy A, Schindler C, Sunyer J, Tittanen P, Wojtyniak B, Zmirou D, Schwartz J, Katsouyanni K. Short-term effects of ambient particles on mortality in the elderly: results from 28 cities in the APHEA2 project. Eur Respir J Suppl. 2003;40:28s-33s.
152. Devlin RB, Ghio AJ, Kehrl H, Sanders G, Cascio W. Elderly humans exposed to concentrated air pollution particles have decreased heart rate variability. Eur Respir J Suppl. 2003;40:76s-80s.
153. Moya J, Bearer C, Etzel R. Children’s Behavior and Physiology and How It Affects Exposure to Environmental Contaminants. Pediatrics. 2004;113:996-1006.
154. Burri PH. Fetal and postnatal development of the lung. Annu Rev Physiol. 1984;46:617–628.
155. Langston C, Kida K, Reed M, Thurlbeck WM. Human lung growth in late gestation and in the neonate. Am. Rev. Respir. Dis. 1984;129:607–613.
156. Dunnill MD. Postnatal growth of the lung. Thorax. 1962;17:329–333. 157. Fanucchi MV, Plopper CG, Evans MJ, Hyde DM, Van Winkle LS, Gershwin LJ,
Schelegle ES. Cyclic exposure to ozone alters distal airway development in infant rhesus monkeys. Am J Physiol Lung Cell Mol Physiol. 2006;291(4):L644-650.
158. Chandra A, Ali M, Saxena D, Murthy R. Behavioral and neurochemical changes in rats simultaneously exposed to manganese and lead. Arch Toxicol 1981;49:49-56.
159. Chandra A, Murthy R, Saxena D, Lal B. Effects of pre- and postnatal combined exposure to Pb and Mn on brain development in rats. Indust Health. 1983;21:273-279.
160. Rodriguez VM, Dufour L, Carrizales L, Diaz-Barriga F, Jimenez-Capdeville ME. Effects of oral exposure to mining waste on in vivo dopamine release from rat striatum. Environ Health Perspect. 1998;106(8):487-491.
51
161. Mejia JJ, Diaz-Barriga F, Calderon J, Rios C, Jimenez-Capdeville ME. Effects of lead-arsenic combined exposure on central monoaminergic systems. Neurotoxicol Teratol. 1997;19(6):489-497.
162. B CH, Ettinger A, Schwartz J, Téllez-Rojo M, Lamadrid-Figueroa H, Hernández-Avila M, Schnaas L, Amarasiriwardena C, Bellinger D, Hu H, Wright R. Early Postnatal Blood Manganese Levels and Children’s Neurodevelopment. Epidemiol. in press.
163. Kim Y, Kim BN, Hong YC, Shin MS, Yoo HJ, Kim JW, Bhang SY, Cho SC. Co-exposure to environmental lead and manganese affects the intelligence of school-aged children. Neurotoxicology. 2009;30(4):564-571.
164. Navas-Acien A, Tellez-Plaza M, Guallar E, Muntner P, Silbergeld E, Jaar B, Weaver V. Blood cadmium and lead and chronic kidney disease in US adults: a joint analysis. Am J Epidemiol. 2009;170(9):1156-1164.
165. Mahaffey KR, Annest JL, Roberts J, Murphy RS. National estimates of blood lead levels: United States, 1976-1980: association with selected demographic and socioeconomic factors. N Engl J Med. 1982;307(10):573-579.
166. Mahaffey KR, Gartside PS, Glueck CJ. Blood lead levels and dietary calcium intake in 1- to 11-year-old children: the Second National Health and Nutrition Examination Survey, 1976 to 1980. Pediatrics. 1986;78(2):257-262.
167. Jones RL, Homa DM, Meyer PA, Brody DJ, Caldwell KL, Pirkle JL, Brown MJ. Trends in blood lead levels and blood lead testing among US children aged 1 to 5 years, 1988-2004. Pediatrics. 2009;123(3):e376-385.
168. Tehranifar P, Leighton J, Auchincloss AH, Faciano A, Alper H, Paykin A, Wu S. Immigration and risk of childhood lead poisoning: findings from a case control study of New York City children. Am J Public Health. 2008;98(1):92-97.
169. Plotinsky RN, Straetemans M, Wong LY, Brown MJ, Dignam T, Dana Flanders W, Tehan M, Azziz-Baumgartner E, Dipentima R, Talbot EA. Risk factors for elevated blood lead levels among African refugee children in New Hampshire, 2004. Environ Res. 2008;108(3):404-412.
170. Shaik AP, Jamil K. A study on the ALAD gene polymorphisms associated with lead exposure. Toxicol Ind Health. 2008;24(7):501-506.
171. Shen XM, Wu SH, Yan CH, Zhao W, Ao LM, Zhang YW, He JM, Ying JM, Li RQ, Wu SM, Guo D. Delta-aminolevulinate dehydratase polymorphism and blood lead levels in Chinese children. Environ Res. 2001;85(3):185-190.
172. Sobin C, Gutierrez M, Alterio H. Polymorphisms of delta-aminolevulinic acid dehydratase (ALAD) and peptide transporter 2 (PEPT2) genes in children with low-level lead exposure. Neurotoxicology. 2009;30(6):881-887.
173. Montenegro MF, Barbosa F, Jr., Sandrim VC, Gerlach RF, Tanus-Santos JE. A polymorphism in the delta-aminolevulinic acid dehydratase gene modifies plasma/whole blood lead ratio. Arch Toxicol. 2006;80(7):394-398.
174. Hopkins MR, Ettinger AS, Hernandez-Avila M, Schwartz J, Tellez-Rojo MM, Lamadrid-Figueroa H, Bellinger D, Hu H, Wright RO. Variants in iron metabolism genes predict higher blood lead levels in young children. Environ Health Perspect. 2008;116(9):1261-1266.
175. Theppeang K, Schwartz BS, Lee BK, Lustberg ME, Silbergeld EK, Kelsey KT, Parsons PJ, Todd AC. Associations of patella lead with polymorphisms in the
52
vitamin D receptor, delta-aminolevulinic acid dehydratase and endothelial nitric oxide synthase genes. J Occup Environ Med. 2004;46(6):528-537.
176. Pritchard JK. Are rare variants responsible for susceptibility to complex diseases? Am J Hum Genet. 2001;69(1):124-137.
177. Wu S, Yan C, Shen X. [Molecular genetic susceptibility to lead poisoning]. Wei sheng yan jiu = Journal of hygiene research. 2004;33(2):226-228, 232.
178. Fujihara J, Agusa T, Yasuda T, Soejima M, Kato H, Panduro A, Koda Y, Kimura-Kataoka K, Takeshita H. Ethnic variation in genotype frequencies of delta-aminolevulinic acid dehydratase (ALAD). Toxicol Lett. 2009;191(2-3):236-239.
179. Elmarsafawy SF, Jain NB, Schwartz J, Sparrow D, Nie H, Hu H. Dietary calcium as a potential modifier of the relationship of lead burden to blood pressure. Epidemiology (Cambridge, Mass. 2006;17(5):531-537.
180. Cheng Y, Willett WC, Schwartz J, Sparrow D, Weiss S, Hu H. Relation of nutrition to bone lead and blood lead levels in middle-aged to elderly men. The Normative Aging Study. Am J Epidemiol. 1998;147(12):1162-1174.
181. Solon O, Riddell TJ, Quimbo SA, Butrick E, Aylward GP, Lou Bacate M, Peabody JW. Associations between cognitive function, blood lead concentration, and nutrition among children in the central Philippines. J Pediatr. 2008;152(2):237-243.
182. Mohai P, Lantz PM, Morenoff J, House JS, Mero RP. Racial and socioeconomic disparities in residential proximity to polluting industrial facilities: evidence from the Americans' Changing Lives Study. Am J Public Health. 2009;99 Suppl 3:S649-656.
183. Havard S, Deguen S, Zmirou-Navier D, Schillinger C, Bard D. Traffic-related air pollution and socioeconomic status: a spatial autocorrelation study to assess environmental equity on a small-area scale. Epidemiology (Cambridge, Mass. 2009;20(2):223-230.
184. Yanosky JD, Schwartz J, Suh HH. Associations between measures of socioeconomic position and chronic nitrogen dioxide exposure in Worcester, Massachusetts. J Toxicol Environ Health A. 2008;71(24):1593-1602.
185. Mirabelli MC, Wing S, Marshall SW, Wilcosky TC. Race, poverty, and potential exposure of middle-school students to air emissions from confined swine feeding operations. Environmental health perspectives. 2006;114(4):591-596.
186. Woodruff TJ, Parker JD, Kyle AD, Schoendorf KC. Disparities in exposure to air pollution during pregnancy. Environmental health perspectives. 2003;111(7):942-946.
187. Baxter LK, Clougherty JE, Laden F, Levy JI. Predictors of concentrations of nitrogen dioxide, fine particulate matter, and particle constituents inside of lower socioeconomic status urban homes. J Expo Sci Environ Epidemiol. 2007;17(5):433-444.
188. Stevens GA, Dias RH, Ezzati M. The effects of 3 environmental risks on mortality disparities across Mexican communities. Proc Natl Acad Sci U S A. 2008;105(44):16860-16865.
189. Cheng Y, Schwartz J, Sparrow D, Aro A, Weiss ST, Hu H. Bone lead and blood lead levels in relation to baseline blood pressure and the prospective
53
development of hypertension: the Normative Aging Study. Am J Epidemiol. 2001;153(2):164-171.
190. Hu H, Aro A, Payton M, Korrick S, Sparrow D, Weiss ST, Rotnitzky A. The relationship of bone and blood lead to hypertension. The Normative Aging Study. Jama. 1996;275(15):1171-1176.
191. Jain NB, Potula V, Schwartz J, Vokonas PS, Sparrow D, Wright RO, Nie H, Hu H. Lead levels and ischemic heart disease in a prospective study of middle-aged and elderly men: the VA Normative Aging Study. Environ Health Perspect. 2007;115(6):871-875.
192. Schwartz J. Lead, blood pressure, and cardiovascular disease in men. Arch Environ Health. 1995;50(1):31-37.
193. Weisskopf MG, Jain N, Nie H, Sparrow D, Vokonas P, Schwartz J, Hu H. A Prospective Study of Bone Lead Concentration and Death From All Causes, Cardiovascular Diseases, and Cancer in the Department of Veterans Affairs Normative Aging Study. Circulation. 2009.
194. Zartarian VG, Schultz BD. The EPA's human exposure research program for assessing cumulative risk in communities. J Expo Sci Environ Epidemiol. 2009.
195. Menzie CA, MacDonell MM, Mumtaz M. A phased approach for assessing combined effects from multiple stressors. Environ Health Perspect. 2007;115(5):807-816.
196. Blackburn EH. Switching and signaling at the telomere. Cell. 2001;106(6):661-673.
197. Wong JM, Collins K. Telomere maintenance and disease. Lancet. 2003;362(9388):983-988.
198. Aviv A. Chronology versus biology: telomeres, essential hypertension, and vascular aging. Hypertension. 2002;40(3):229-232.
199. Fitzpatrick AL, Kronmal RA, Gardner JP, Psaty BM, Jenny NS, Tracy RP, Walston J, Kimura M, Aviv A. Leukocyte telomere length and cardiovascular disease in the cardiovascular health study. Am J Epidemiol. 2007;165(1):14-21.
200. Yang Z, Huang X, Jiang H, Zhang Y, Liu H, Qin C, Eisner GM, Jose P, Rudolph L, Ju Z. Short telomeres and prognosis of hypertension in a chinese population. Hypertension. 2009;53(4):639-645.
201. Perez-Rivero G, Ruiz-Torres MP, Rivas-Elena JV, Jerkic M, Diez-Marques ML, Lopez-Novoa JM, Blasco MA, Rodriguez-Puyol D. Mice deficient in telomerase activity develop hypertension because of an excess of endothelin production. Circulation. 2006;114(4):309-317.
202. Vasan RS, Massaro JM, Wilson PW, Seshadri S, Wolf PA, Levy D, D'Agostino RB. Antecedent blood pressure and risk of cardiovascular disease: the Framingham Heart Study. Circulation. 2002;105(1):48-53.
203. Benetos A, Gardner JP, Zureik M, Labat C, Xiaobin L, Adamopoulos C, Temmar M, Bean KE, Thomas F, Aviv A. Short telomeres are associated with increased carotid atherosclerosis in hypertensive subjects. Hypertension. 2004;43(2):182-185.
204. Brouilette SW, Moore JS, McMahon AD, Thompson JR, Ford I, Shepherd J, Packard CJ, Samani NJ. Telomere length, risk of coronary heart disease, and
54
statin treatment in the West of Scotland Primary Prevention Study: a nested case-control study. Lancet. 2007;369(9556):107-114.
205. Mukherjee M, Brouilette S, Stevens S, Shetty KR, Samani NJ. Association of shorter telomeres with coronary artery disease in Indian subjects. Heart. 2009;95(8):669-673.
206. van der Harst P, van der Steege G, de Boer RA, Voors AA, Hall AS, Mulder MJ, van Gilst WH, van Veldhuisen DJ. Telomere length of circulating leukocytes is decreased in patients with chronic heart failure. J Am Coll Cardiol. 2007;49(13):1459-1464.
207. Fitzpatrick AL, Kronmal RA, Gardner JP, Psaty BM, Jenny NS, Tracy RP, Walston J, Kimura M, Aviv A. Leukocyte Telomere Length and Cardiovascular Disease in the Cardiovascular Health Study. Am J Epidemiol. 2006.
208. Edo MD, Andres V. Aging, telomeres, and atherosclerosis. Cardiovasc Res. 2005;66(2):213-221.
209. Honda S, Hjelmeland LM, Handa JT. Oxidative stress--induced single-strand breaks in chromosomal telomeres of human retinal pigment epithelial cells in vitro. Invest Ophthalmol Vis Sci. 2001;42(9):2139-2144.
210. Saretzki G, Von Zglinicki T. Replicative aging, telomeres, and oxidative stress. Ann N Y Acad Sci. 2002;959:24-29.
211. von Zglinicki T. Oxidative stress shortens telomeres. Trends Biochem Sci. 2002;27(7):339-344.
212. Nawrot TS, Staessen JA, Gardner JP, Aviv A. Telomere length and possible link to X chromosome. Lancet. 2004;363(9408):507-510.
213. Muller KC, Welker L, Paasch K, Feindt B, Erpenbeck VJ, Hohlfeld JM, Krug N, Nakashima M, Branscheid D, Magnussen H, Jorres RA, Holz O. Lung fibroblasts from patients with emphysema show markers of senescence in vitro. Respir Res. 2006;7:32.
214. Hoxha M, Dioni L, Bonzini M, Pesatori AC, Fustinoni S, Cavallo D, Carugno M, Albetti B, Marinelli B, Schwartz J, Bertazzi PA, Baccarelli A. Association between leukocyte telomere shortening and exposure to traffic pollution: a cross-sectional study on traffic officers and indoor office workers. Environ Health. 2009;8:41.
215. Carroll RJ, Galindo CD. Measurement error, biases, and the validation of complex models for blood lead levels in children. Environ Health Perspect. 1998;106 Suppl 6:1535-1539.
216. O'Meara JM, Fleming DE. Uncertainty calculations for the measurement of in vivo bone lead by x-ray fluorescence. Phys Med Biol. 2009;54(8):2449-2461.
217. Todd AC, Carroll S, Godbold JH, Moshier EL, Khan FA. The effect of measurement location on tibia lead XRF measurement results and uncertainty. Phys Med Biol. 2001;46(1):29-40.
218. Todd AC, Parsons PJ, Carroll S, Geraghty C, Khan FA, Tang S, Moshier EL. Measurements of lead in human tibiae. A comparison between K-shell x-ray fluorescence and electrothermal atomic absorption spectrometry. Phys Med Biol. 2002;47(4):673-687.
219. Gordon RA. Issues in multiple regression. Am J Sociology. 1968;73(5):592-616. 220. Breiman L. Statistical modeling: The two cultures. Stat Sci. 2001;16(3):199-231.
55
221. Liu D, Ghosh D, Lin X. Estimation and testing for the effect of a genetic pathway on a disease outcome using logistic kernel machine regression via logistic mixed models. BMC Bioinformatics. 2008;9:292.
222. Bar-Yam Y. Improving the Effectiveness of Health Care and Public Health: A Multiscale Complex Systems Analysis. Am J Public Health. 2006;96(3):459-466.
223. Boker SM. Specifying latent differential equations models. In: Boker SM, Wenger MJ, eds. Data analytic techniques for dynamical systems. Mahwah, NJ, US: Lawrence Erlbaum Associates Publishers; 2007:131-159.
224. Levy JI, Wilson AM, Zwack LM. Quantifying the efficiency and equity implications of power plant air pollution control strategies in the United States. Environmental health perspectives. 2007;115(5):743-750.
225. Levy JI, Baxter LK, Schwartz J. Uncertainty and variability in health-related damages from coal-fired power plants in the United States. Risk Anal. 2009;29(7):1000-1014.
226. Su J, Morello-Frosch R, Jesdale B, Kyle A, Shamasunder B, Jerrett M. An Index for assessing Demographic Inequalities in Cumulative Environmental Hazards with Application to Los Angeles, California. Environ Sci Technol. 2009;437626-7634.
227. Banks J, Marmot M, Oldfield Z, Smith J. The SES health gradient on both sides of the Atlantic. In: Wise D, ed. Developments in the Economics of Aging. Chicago, Il: Univeristy of Chicago Press; 2009.
228. Schramm T, Gislason G, Kober L, Rasmussen S, Rasmussen J, Abildstrom S, Hansen M, Folke F, Buch P, Madsen M, Vaag A, Torp-Pedersen T. Diabetes patients requiring glucose-lowering therapy and nondiabetics with a prior myocardial infarction carry the same cardiovascular risk. Circulation. 2008;117:1945-1954.
229. Levy JI, Greco SL, Spengler JD. The importance of population susceptibility for air pollution risk assessment: a case study of power plants near Washington, DC. Environmental health perspectives. 2002;110(12):1253-1260.
230. Baccarelli A, Giacomini SM, Corbetta C, Landi MT, Bonzini M, Consonni D, Grillo P, Patterson DG, Pesatori AC, Bertazzi PA. Neonatal thyroid function in Seveso 25 years after maternal exposure to dioxin. PLoS Med. 2008;5(7):e161.
231. Rhodes T. Risk environments and drug harms: a social science for harm reduction approach. Int J Drug Policy. 2009;20(3):193-201.
232. Morello-Frosch R, Shenassa ED. The environmental "riskscape" and social inequality: implications for explaining maternal and child health disparities. Environ Health Perspect. 2006;114(8):1150-1153.
233. Morello-Frosch RA. Discrimination and the political economy of environmental inequality. Environment and Planning C: Government and Policy. 2002;20:477-496.
234. Waller LA, Louis TA, Carlin BP. Environmental justice and statistical summaries of differences in exposure distributions. J Expo Anal Environ Epidemiol. 1999;9(1):56-65.