Embed Size (px)
Citation preview

Hitotsubashi University Repository
TitleCross-Border Acquisitons and Target Firms'
Performance: Evidence from Japanese Firm-Level Data
Author(s)Fukao, Kyoji; Ito, Keiko; Kwon, Hyeog Ug; Takizawa,
Miho
Citation
Issue Date 2006-07
Type Technical Report
Text Version publisher
URL http://hdl.handle.net/10086/13574
Right
Hi-Stat
Discussion Paper Series
No.174
Cross-Border Acquisitions and Target Firms’ Performance: Evidence from Japanese Firm-Level Data
Kyoji Fukao
Keiko Ito Hyoeg Ug Kwon Miho Takizawa
July 2006
Hitotsubashi University Research Unit for Statistical Analysis in Social Sciences
A 21st-Century COE Program
Institute of Economic Research
Hitotsubashi University Kunitachi, Tokyo, 186-8603 Japan
http://hi-stat.ier.hit-u.ac.jp/
Cross-Border Acquisitions and Target Firms’ Performance:
Evidence from Japanese Firm-Level Data*
Kyoji Fukao
Hitotsubashi University and RIETI
Keiko Ito**
Senshu University
Hyeog Ug Kwon
Nihon University
Miho Takizawa
Hitotsubashi University
* This paper was presented at the NBER Seventeenth Annual East Asian Seminar on Economics,
International Financial Issues around the Pacific-Rim, June 22-24, 2006, Hawaii, USA.
Financial support from the Japan Securities Scholarship Foundation and the Japan Society for the
Promotion of Science (JSPS) is gratefully acknowledged. ** Correspondence: Keiko Ito, Senshu University, 2-1-1, Higashi-mita, Tama-ku, Kawasaki,
Japan, 214-8580. Email: [email protected]

1
ABSTRACT
Using Japanese firm-level data for the period from 1994-2002, this paper examines
whether a firm is chosen as an acquisition target based on its productivity level, profitability and
other characteristics and whether the performance of Japanese firms that were acquired by
foreign firms improves after the acquisition. In our previous study for the Japanese
manufacturing sector, we found that M&As by foreigners brought a larger and quicker
improvement in total factor productivity (TFP) and profit rates than M&As by domestic firms.
However, it may argued that firms acquired by foreign firms showed better performance simply
because foreign investors acquired more promising Japanese firms than Japanese investors did.
In order to address this potential problem of selection bias problem, in this study we combine a
difference-in-differences approach with propensity score matching. The basic idea of matching is
that we look for firms that were not acquired by foreign firms but had similar characteristics to
firms that were acquired by foreigners. Using these firms as control subjects and comparing the
acquired firms and the control subjects, we examine whether firms acquired by foreigners show a
greater improvement in performance than firms not acquired by foreigners. Both results from
unmatched samples and matched samples show that foreign acquisitions improved target firms’
productivity and profitability significantly more and quicker than acquisitions by domestic firms.
Moreover, we find that there is no positive impact on target firms’ profitability in the case
of both within-group in-in acquisitions and in-in acquisitions by domestic outsiders. In fact, in
the manufacturing sector, the return on assets even deteriorated one year and two years after
within-group in-in acquisition, while the TFP growth rate was higher after within-group in-in
acquisitions than after in-in acquisitions by outsiders. Our results imply that in the case of
within-group in-in acquisitions, parent firms may be trying to quickly restructure acquired firms
even at the cost of deteriorating profitability.
JEL classification: C14, D24, F21, F23
Keywords: FDI, TFP, Acquisition, Selection bias, Propensity score matching, Average treatment
effect
2
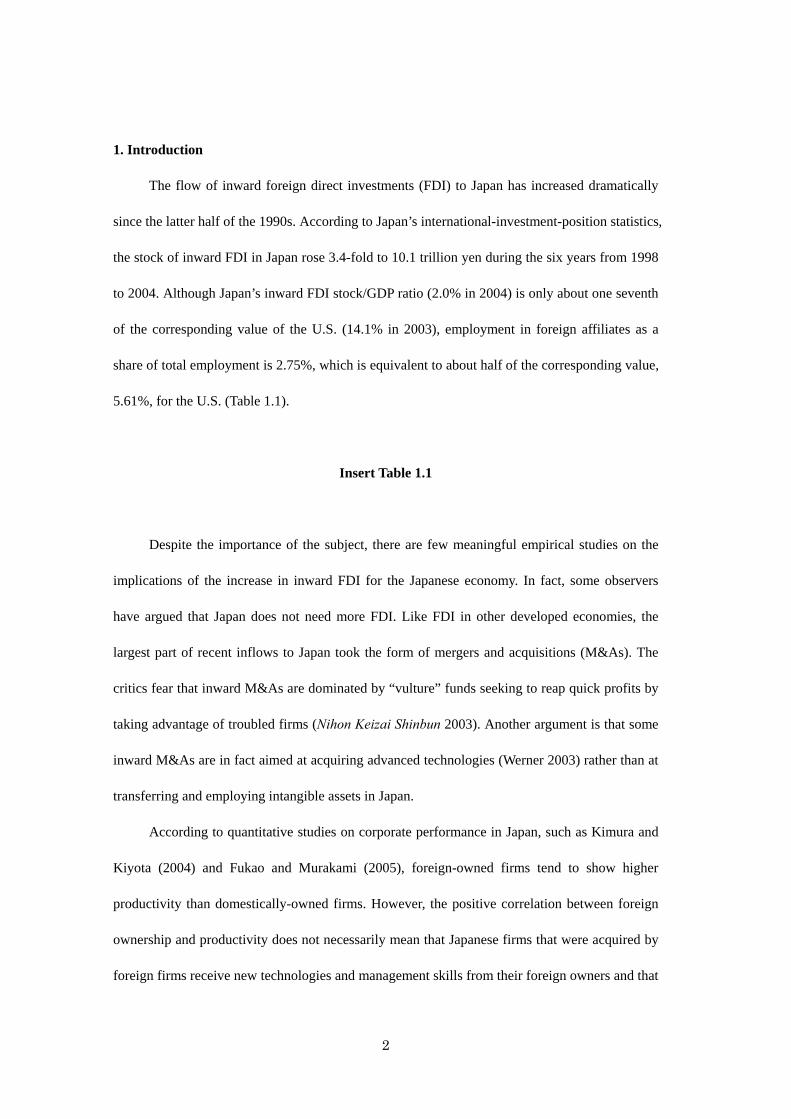
1. Introduction
The flow of inward foreign direct investments (FDI) to Japan has increased dramatically
since the latter half of the 1990s. According to Japan’s international-investment-position statistics,
the stock of inward FDI in Japan rose 3.4-fold to 10.1 trillion yen during the six years from 1998
to 2004. Although Japan’s inward FDI stock/GDP ratio (2.0% in 2004) is only about one seventh
of the corresponding value of the U.S. (14.1% in 2003), employment in foreign affiliates as a
share of total employment is 2.75%, which is equivalent to about half of the corresponding value,
5.61%, for the U.S. (Table 1.1).
Insert Table 1.1
Despite the importance of the subject, there are few meaningful empirical studies on the
implications of the increase in inward FDI for the Japanese economy. In fact, some observers
have argued that Japan does not need more FDI. Like FDI in other developed economies, the
largest part of recent inflows to Japan took the form of mergers and acquisitions (M&As). The
critics fear that inward M&As are dominated by “vulture” funds seeking to reap quick profits by
taking advantage of troubled firms (Nihon Keizai Shinbun 2003). Another argument is that some
inward M&As are in fact aimed at acquiring advanced technologies (Werner 2003) rather than at
transferring and employing intangible assets in Japan.
According to quantitative studies on corporate performance in Japan, such as Kimura and
Kiyota (2004) and Fukao and Murakami (2005), foreign-owned firms tend to show higher
productivity than domestically-owned firms. However, the positive correlation between foreign
ownership and productivity does not necessarily mean that Japanese firms that were acquired by
foreign firms receive new technologies and management skills from their foreign owners and that

3
this transfer of intangible assets is responsible for their higher TFP (the technology-transfer
effect). There is another possible theoretical explanation for the positive correlation:
Foreign-owned firms enjoy greater productivity because foreign firms choose firms with higher
TFP as their M&A targets (the selection effect).
In order to determine which one of the two effects is responsible for the positive
correlation between foreign ownership and productivity, in a previous study (Fukao, Ito and
Kwon, 2005), we conducted two empirical tests using firm-level data for Japan’s manufacturing
industry. In that study, we first estimated a Probit model explaining whether a firm is chosen as
an M&A target based on its TFP level and other characteristics. Second, we tested whether the
TFP of Japanese firms that were acquired by foreign firms improved after the investment.1
Estimating a Probit model, we found that foreign firms acquired Japanese firms enjoyed higher
TFP levels and higher profit rates. In contrast, in-in M&As seemed to have the characteristics of
rescue missions as they tended to target small firms with a higher total liability/total asset ratio.
Estimating the dynamic effects of M&As on target firms, we found that out-in M&As improved
target firms’ TFP level and current profit/sales ratio. Compared with in-in M&As, out-in M&As
brought a larger and quicker improvement in TFP and profit rates but no increase in target firms’
employment two years after the acquisition. Based on these results, we concluded that both the
selection effect and the technology-transfer effect play a role in explaining the positive
correlation between foreign ownership and productivity.
Our previous study has several limitations, which this paper seeks to overcome. First,
although our study found that in-in M&As had the characteristics of rescue missions, this result
1 Although the majority of FDI in developed economies has taken the form of cross-border acquisitions, to our knowledge, there are only two empirical studies on this issue, Conyon et al. (2002) and Fukao, Ito and Kwon (2005). Conyon et al. (2002) conducted an empirical analysis on the impact of foreign ownership on productivity in the United Kingdom for the period 1989-1994. By observing productivity before and after the event of acquisition, they showed that firms that were acquired by foreign firms exhibited an increase in labor productivity of 13%.

4
may have been influenced by the fact that some in-in M&As are conducted within groups of
related firms. In the case of M&As within firm groups, acquisitions are conducted as part of a
restructuring of the firm group and will indeed have the characteristics of rescue missions. On
the other hand, in-in M&As involving outsiders of firm groups may have similar effects as out-in
M&As. In this paper, using data on Japanese firm groups compiled by Toyo Keizai Shinposha,
we distinguish in-in M&As within firm groups and in-in M&As involving outsiders.
Second, although 72 percent of FDI during the 1997-2002 period went into
non-manufacturing sectors, such as the finance & insurance, telecommunications, service, and
retail/wholesale sectors, which experienced deregulation, Fukao, Ito and Kwon (2005) only
examined M&As in Japan’s manufacturing industry. In this paper, we look at M&As not only in
the manufacturing sector but also in the wholesale and retail industry.
Third, estimation results on the dynamic effects of M&As on target firms may suffer from
a selection bias problem. Suppose that foreign investors somehow acquire more promising
Japanese firms than Japanese investors do. Then the ex-post improvement of out-in M&A target
firms’ performance should not be regarded as evidence of technology-transfer from foreign
investors to acquired firms. In order to solve this selection bias problem, following Arnold and
Javorcik (2005), we combine a difference-in-differences approach with propensity score
matching. We employ the propensity score matching technique proposed by Rosenbaum and
Rubin (1983). The basic idea is that we first look for firms that were not acquired by foreign
firms but had similar characteristics to firms that were acquired by foreigners. Using these firms
as control subjects and comparing the treated (out-in M&A targets) and the control subjects, we
examine whether firms acquired by foreigners show a greater improvement in performance than
firms not acquired by foreigners.
Fourth, using data for the period from 1994 to 2001, Fukao, Ito and Kwon (2005)

5
investigated the performance of target firms for only two years after each M&A. By adding data
of one more year, 2002, we now study dynamic effects of M&A with a longer time span.
The remainder of this paper is organized as follows: In Section 2, we provide an overview
of out-in M&As in Japan. Section 3 then presents an outline of our data and reports our empirical
results. Section 4 summarizes our results.
2. An Overview of M&As in Japan
Probably the most comprehensive data on M&As in Japan are published by the private
information service company RECOF. In this section, using these data, we provide an overview
of M&A activity in Japan. Figure 2.1 shows the number of out-in and in-in M&A cases in Japan
by year. Both out-in and in-in M&A cases have dramatically increased since the end of the
1990s.
Insert Figure 2.1
Several factors seem to have contributed to the increase in M&A cases during this period.
Firstly, in order to speed up the restructuring of Japanese firms, Japan’s corporate law was
amended at the end of the 1990s to facilitate M&As. Secondly, advances in information and
communication technology as well as deregulation during the 1990s mean that the optimal size
and optimal scope of firms in many sectors, such as electronics, pharmaceuticals,
telecommunication, finance, insurance, and commerce may have changed. Thirdly, deregulation
in Japan has removed barriers to inward FDI in some industries, such as broadcasting,
telecommunication, finance, and insurance. Fourthly, there was a world-wide boom in M&As
during this period and foreign investors, including private equity funds, and foreign agents of

6
M&A, including investment banks, brought their M&A techniques and the M&A boom to Japan.
Fifthly, as a result of the prolonged recession and the financial crisis in 1998, Japanese stock
prices plunged and financially distressed firms and banks were forced to unwind their
cross-shareholdings, creating a “fire sale” situation that allowed foreign firms to acquire
Japanese companies.
Probably as a result of the last three of these factors, the rapid increase in out-in M&As
preceded the boom in in-in M&As (Figure 2.1). Figure 2.2 shows the number of out-in M&A
cases by source region and by year. U.S. and European firms were the major investors. One
interesting new trend is that since 2000, investments from Asian countries have also been
increasing. Among the total of 97 out-in M&As involving firms from Asia in 1994-2002, 36
involved firms from China, 24 from Korea, 19 from Taiwan, and 8 from Singapore.
Insert Figure 2.2
An interesting question is whether there are any differences in the industry distribution of
target firms between M&A investments from Western countries and from Asia. Table 2.1 shows
the industry distribution of out-in M&A target firms by source region. Compared with
investments from Western countries, M&A investments from Asia tend to be concentrated in
electrical machinery, communication and broadcasting, and software. One possible explanation
regarding these differences is that Asian firms conduct M&A investments in Japan in order to
gain access to the technology of Japanese high-tech firms.
Insert Table 2.1

7
Another issue concerns the extent to which the out-in M&A boom in Japan was dominated
by private equity funds (“vulture funds”). Table 2.1, which shows the number of out-in
acquisitions by purchasers’ industry and by target firms’ industry, provides a clue. The table
shows that out-in M&As in the same industry are much more common than cross-industry out-in
M&As. There were only seven acquisitions of Japanese manufacturing firms by foreign investors
from the financial sector, which includes M&As by private equity funds. It is also interesting to
note that in the case of out-in M&As in the commerce sector, the majority of purchasers were
manufacturing firms. This is probably because manufacturers of differentiated products, such as
automobiles and electronic machinery, usually try to integrate the overseas sales of their products
in order to control and promote their exports.
Insert Table 2.2
3. Research Approach, Empirical Model and Results
Attempts to provide a theoretical explanation for changes in ownership and the causes and
consequences of acquisitions have produced two different hypotheses: the synergy hypothesis
and the managerial-discipline hypothesis.2 The synergy hypothesis claims that acquisitions take
place when the value of the combined new hierarchical firm group to be created by the
acquisition is expected to be greater than the sum of the values of the independent firms. As
Nguyen and Ollinger (2002) have pointed out, if an acquisition is motivated by this synergy
effect, acquiring firms tend to target only productive and efficient firms. After a merger,
2 Lichtenberg and Siegel (1987) and McGuckin and Nguyen (1995) tested these hypotheses using U.S. plant level data. Lichtenberg and Siegel (1987) found that firms with low productivity were chosen and productivity increased after the acquisition. McGuckin and Nguyen (1995) found a positive relationship between changes in ownership and both initial productivity and productivity growth after the acquisition.
8
synergies between the firms are expected to improve the performance of the acquired firm. In
contrast, the managerial-discipline hypothesis claims that acquisitions are driven by the intention
to strengthen managerial control over entrenched managers, who try to maximize their own
benefits rather than owners’ wealth. Therefore, takeover targets are likely to be inefficient firms
and their performance, especially the rate of return on capital, is expected to improve after the
acquisition (Jensen, 1988).
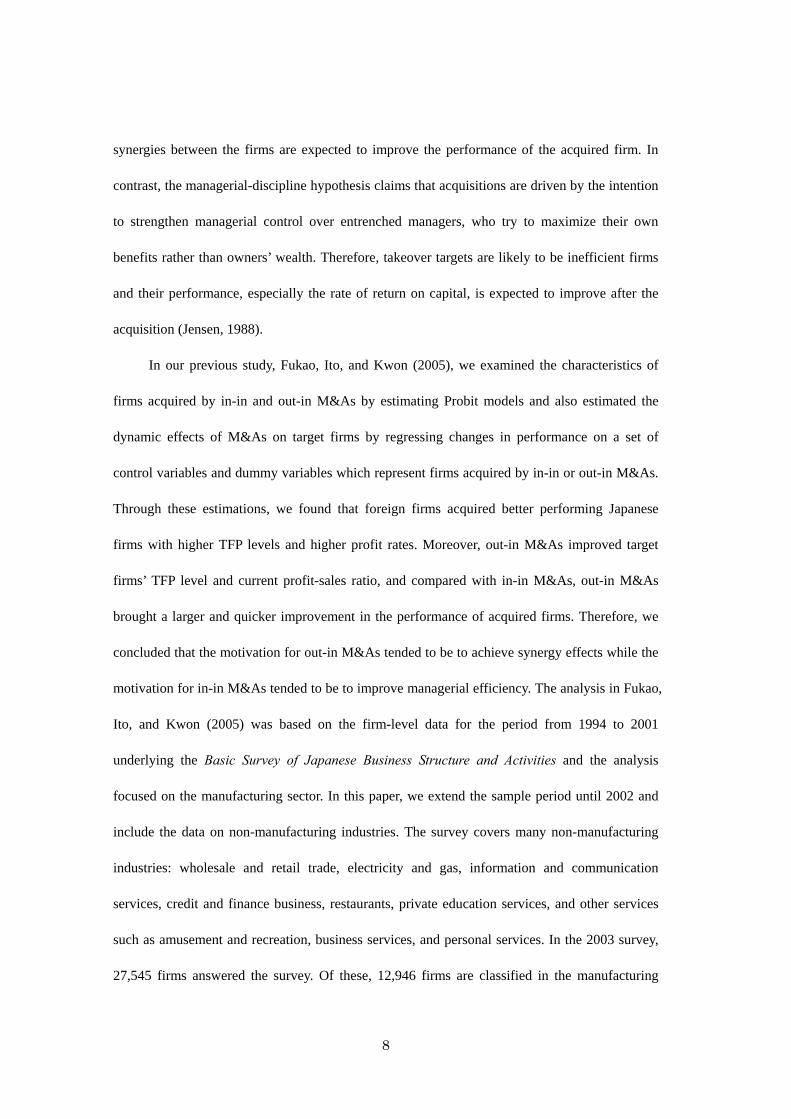
In our previous study, Fukao, Ito, and Kwon (2005), we examined the characteristics of
firms acquired by in-in and out-in M&As by estimating Probit models and also estimated the
dynamic effects of M&As on target firms by regressing changes in performance on a set of
control variables and dummy variables which represent firms acquired by in-in or out-in M&As.
Through these estimations, we found that foreign firms acquired better performing Japanese
firms with higher TFP levels and higher profit rates. Moreover, out-in M&As improved target
firms’ TFP level and current profit-sales ratio, and compared with in-in M&As, out-in M&As
brought a larger and quicker improvement in the performance of acquired firms. Therefore, we
concluded that the motivation for out-in M&As tended to be to achieve synergy effects while the
motivation for in-in M&As tended to be to improve managerial efficiency. The analysis in Fukao,
Ito, and Kwon (2005) was based on the firm-level data for the period from 1994 to 2001
underlying the Basic Survey of Japanese Business Structure and Activities and the analysis
focused on the manufacturing sector. In this paper, we extend the sample period until 2002 and
include the data on non-manufacturing industries. The survey covers many non-manufacturing
industries: wholesale and retail trade, electricity and gas, information and communication
services, credit and finance business, restaurants, private education services, and other services
such as amusement and recreation, business services, and personal services. In the 2003 survey,
27,545 firms answered the survey. Of these, 12,946 firms are classified in the manufacturing

9
sector (47 percent of the total number of responding firms). In this paper, using the new dataset,
we analyze the effect of out-in M&As on target firms’ performance for both the manufacturing
sector and the non-manufacturing sector following the methodology employed by Fukao, Ito, and
Kwon (2005). We examine whether the effects of M&As are temporary or long-lasting by
analyzing the dynamic effects using a longer time span. Moreover, we investigate whether there
are any differences between the effects of in-in M&As within a corporate group and those of
in-in M&As by outsiders.
However, one possible concern is that firms acquired by foreign firms show better
performance simply because foreign firms acquired better performing firms or firms that would
potentially perform well even under local ownership.3 As Arnold and Javorcik (2005: 6) point
out, “plants acquired by foreign investors are unlikely to be a random sample from the
populations. To the extent that the acquisition targets differ systematically from other plants, a
problem of simultaneity between ownership status and other performance-relevant variables will
arise and bias the estimate of the productivity advantage.” In order to control for this selection
bias, we apply a matching technique in this paper. Using this technique, we identify for each firm
acquired by a foreign firm a suitable firm under continued domestic ownership for comparison.4
In other words, we find firms that were not acquired by foreign firms but had similar
characteristics as firms that were acquired by foreigners. Comparing the treated group (out-in
M&A targets) and the control group, we examine whether firms acquired by foreigners show a
3 Many FDI-related studies show that compared with domestically-owned firms, foreign-owned firms tend to be larger in size, more capital- and skill-intensive, and show better business performance in terms of, for instance, productivity and profitability. See, for example, Doms and Jensen (1998) for the United States, Griffith and Simpson (2001) for the United Kingdom, Ramstetter (1999), Takii (2004), and Ito (2004) for Asian countries. Fukao, Ito, and Kwon (2005) also compared differences in performance and other characteristics of local and foreign-owned firms in Japanese manufacturing and found that foreign-owned firms showed a better performance. 4 Arnold and Javorcik (2005), using plant-level data on the Indonesian manufacturing sector, apply the matching technique and compare TFP levels and other performance measures of domestic plants and plants acquired by foreign firms.
10
greater or faster improvement in performance than firms not acquired by foreigners.
In order to examine this issue, we compare the growth rates of performance measures of
acquired firms with those of firms remaining under domestic ownership using a
difference-in-differences (DID) technique. The difference-in-differences technique compares the
difference in average outcome before and after the treatment for the treated group with the
difference in average outcome during the same period for the comparison group.5 However,
before applying the difference-in-differences technique, we need to overcome or at least reduce
the problem of sample selection bias. Following Arnold and Javorcik (2005), we combine the
difference-in-differences approach with propensity score matching.6 We employ the propensity
score matching technique proposed by Rosenbaum and Rubin (1983). In studies evaluating the
effects of economic policy interventions, etc., data often come from (non-randomized)
observational studies and the estimation of the effect of treatment may be biased by the existence
of confounding factors. The propensity score matching method provides a way to reduce the bias
of the estimation of treatment effects controlling for the existence of the confounding effect by
comparing treated and control subjects that are as similar as possible. Since matching subjects on
an n-dimensional vector of characteristics is typically unfeasible for large n, the propensity score
matching method summarizes the pre-treatment characteristics of each subject into a single-index
variable (i.e., the propensity score) which makes the matching feasible.7
3.1 The Propensity Score Matching and the Difference-in-Differences Estimator 5 The DID estimator assumes that unobserved macro-economic shocks affect the treatment and the control group in the same way (“common trends assumption”). 6 This type of strategy is often employed in studies in the field of labor economics such as Heckman, Ichimura, and Todd (1997) and Heckman, Ichimura, Smith, and Todd (1998). Moreover, the matching estimator has become increasingly popular in international economics and other areas of economics. See, for example, Girma, Greenaway, and Kneller (2004), Barba Navaretti, Castellani, and Disdier (2006) and Hijzen, Jean, and Mayer (2006). 7 For details on the method and an explanation of the Stata program for the method, see Becker and Ichino (2002).

11
The propensity score is defined by Rosenbaum and Rubin (1983) as the conditional
probability of assignment to a particular treatment given the pre-treatment characteristics:
( ) { } { }xzExzxp ||1Pr ==≡ (1)
where z = {0, 1} is the indicator of receiving the treatment and x is a vector of observed
pretreatment characteristics. Rosenbaum and Rubin (1983) show that if the recipient of the
treatment is randomly chosen within cells defined by x, it is also random within cells defined by
the values of the single-index variable p(x). Therefore, for each treatment case i, if the propensity
score p(xi) is known, the Average effect of Treatment on the Treated (ATT) can be estimated as
follows:
{ }1|ˆ 01 =−= iiiATT zyyEα (2)
( ){ }{ }iiii xpzyyEE ,1|01 =−=
( ){ } ( ){ }{ }1|,0|,1| 01 ==−== iiiiiii zxpzyExpzyEE
where y1 and y0 denote the potential outcomes in the two counterfactual situations of treatment
and no treatment, respectively. Therefore, according to the last line of equation (2), the ATT can
be estimated as the average difference between the outcome of recipients and non-recipients of
the treatment whose propensity scores p(xi) are identical.
In the case of this study, we focus on the difference in ex post performance between
acquired firms and non-acquired firms. Therefore, in our case, z denotes whether a firm is
acquired or not, x is a vector of various characteristics of a firm such as firm size, length of
business experience, ex ante performance, etc. At the first stage, by estimating a probit model, we
investigate important determinants of acquisitions and compute the propensity score (i.e., the
probability of a firm being acquired by another firm) for each firm. Making use of this result, we
conduct propensity score matching and compare the performance of firms within the pairs of
observations matched on the propensity score. In our matching process, firms are matched
12
separately for each year and industry using one-to-one nearest matching with replacement.8
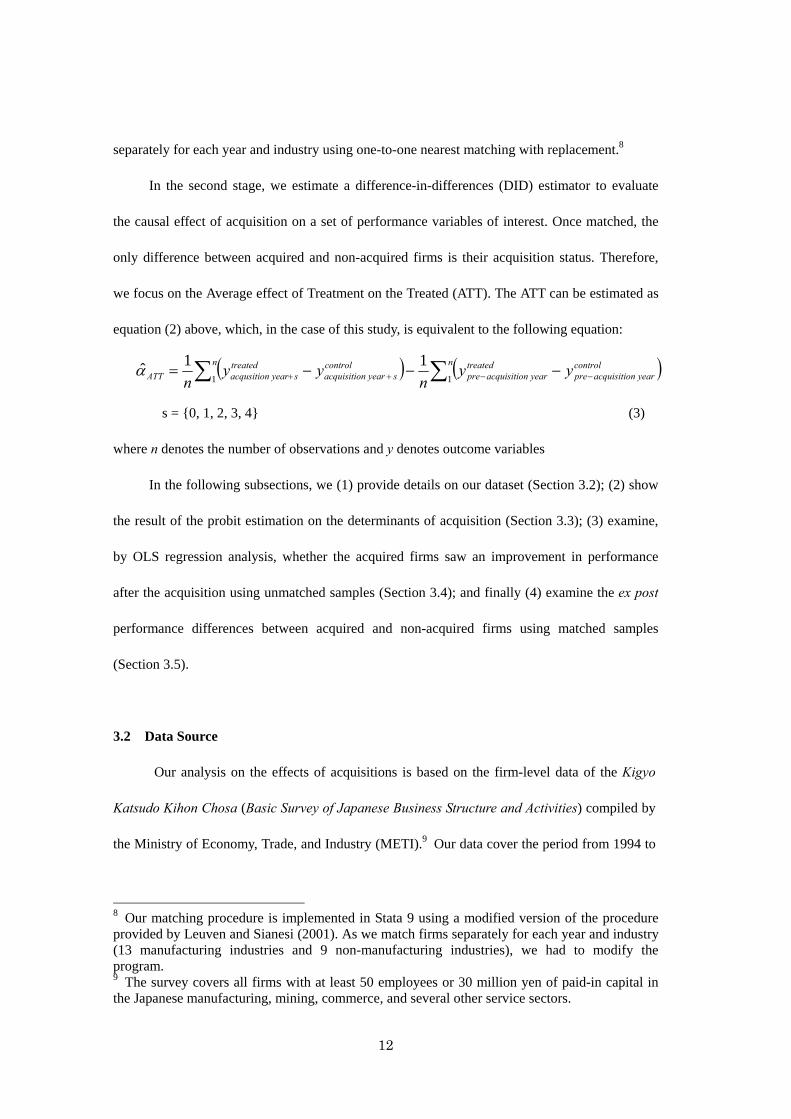
In the second stage, we estimate a difference-in-differences (DID) estimator to evaluate
the causal effect of acquisition on a set of performance variables of interest. Once matched, the
only difference between acquired and non-acquired firms is their acquisition status. Therefore,
we focus on the Average effect of Treatment on the Treated (ATT). The ATT can be estimated as
equation (2) above, which, in the case of this study, is equivalent to the following equation:
( ) ( )∑∑ −−++ −−−=n control
yearnacquisitiopretreated
yearnacquisitiopren control
syearnacquisitiotreated
syearacqusitionATT yyn
yyn 11
11α̂
s = {0, 1, 2, 3, 4} (3)
where n denotes the number of observations and y denotes outcome variables
In the following subsections, we (1) provide details on our dataset (Section 3.2); (2) show
the result of the probit estimation on the determinants of acquisition (Section 3.3); (3) examine,
by OLS regression analysis, whether the acquired firms saw an improvement in performance
after the acquisition using unmatched samples (Section 3.4); and finally (4) examine the ex post
performance differences between acquired and non-acquired firms using matched samples
(Section 3.5).
3.2 Data Source
Our analysis on the effects of acquisitions is based on the firm-level data of the Kigyo
Katsudo Kihon Chosa (Basic Survey of Japanese Business Structure and Activities) compiled by
the Ministry of Economy, Trade, and Industry (METI).9 Our data cover the period from 1994 to
8 Our matching procedure is implemented in Stata 9 using a modified version of the procedure provided by Leuven and Sianesi (2001). As we match firms separately for each year and industry (13 manufacturing industries and 9 non-manufacturing industries), we had to modify the program. 9 The survey covers all firms with at least 50 employees or 30 million yen of paid-in capital in the Japanese manufacturing, mining, commerce, and several other service sectors.

13
2002.10 We define out-in M&As as cases where a firm that did not have a parent firm abroad
with majority ownership at time t–1 comes to have a foreign parent firm with majority
ownership at time t. Similarly, we define in-in M&As as cases where a firm that did not have a
parent firm with majority ownership at time t–1 comes to have a domestic parent firm with
majority ownership at time t. Therefore, if a firm is sold from a domestic parent firm to another
domestic parent firm, such cases are not counted as in-in M&As in our above definition.
Tables 3.1 and 3.2 show the number of out-in and in-in M&A cases in our dataset. We
have 156 cases of out-in M&As and 3,132 cases of in-in M&As for the period from 1994 to 2002.
As shown in Table 3.2, our unbalanced panel consists of 186,080 observations, out of which 53
percent fall into the manufacturing sector. More than 80 percent of the non-manufacturing
observations fall into the wholesale and retail trade sector. Table 3.2 also shows that out-in
M&As are heavily concentrated in a relatively small number of industries, which include
chemicals, machinery, and wholesale and retail trade.11 Although in-in M&As also tend to be
concentrated in these industries, they are more widely dispersed, covering all industries except
agriculture, forestry and fishing.
Insert Tables 3.1 and 3.2
Data on sales, purchases, total assets, profits, total liabilities, firm age, the number of
employees, the number of non-production workers, exports, R&D expenditure, and advertising
expenditure are taken from the Basic Survey of Japanese Business Structure and Activities. We
mainly use newly constructed industry-level deflators which were taken from the JIP (Japan
10 The compilation of the micro data of the METI survey was conducted as part of the project “Study Group on the Internationalization of Japanese Business” at the Research Institute of Economy, Trade and Industry (RIETI). 11 These industries have a higher share of foreign-owned firms than other industries. For detailed statistics on foreign-owned firms in Japan, see Fukao, Ito, and Kwon (2005) and Ito and Fukao (2005).

14
Industry Productivity) Database 2006.12 We use the industry-level output and input deflators to
deflate firms’ sales and intermediate inputs, respectively. Exports and R&D expenditure are
deflated by the export price index compiled by Bank of Japan and the R&D price index
compiled by the Science and Technology Agency and reported in Kagaku Gijutsu Yoran 2003,
respectively. Advertising expenditure is deflated by the corporate services price index provided
by the Bank of Japan. ROA is defined as the ratio of after-tax profits inclusive of interest
payments to total assets. Table 3.3 provides a description of the variables used in our
econometric analysis. The summary statistics for the variables are shown in Appendix Table 1
and a detailed description of our TFP measure is provided in the Appendix.
Insert Table 3.3
3.3 Are Acquisition Targets Better Than the Rest? A Probit Estimation
Using our panel data for 1994-2002, we estimate probit models designed to test whether a
firm is chosen as an M&A target based on its productivity or profitability level or whether other
characteristics are more important.
The dependent variables are the out-in M&A dummy (Out-in) and the in-in M&A dummy
(In-in).13 Each dummy variable takes value one when an acquisition occurs. As explanatory
12 The JIP Database 2006 was compiled as part of the RIETI (Research Institute of Economy, Trade and Industry) research project “Development of a RIETI Manufacturing Database and Study of Productivity by Industry” for fiscal 2004-05. The JIP 2006 contains sector-level information on 108 sectors from 1970 to 2002 that can be used for total factor productivity analyses. These sectors cover the whole Japanese economy. A preliminary version of the JIP database is available from the RIETI website <http://www.rieti.go.jp/jp/database/d04.html>. 13 We were also interested in the difference between determinants of out-in M&As by Asian firms and by Western firms and the difference between the outcomes for these two types of out-in M&As. However, the number of observations for M&A cases by Asian firms is very small and almost no observations were left after we screened the data. Therefore, we gave up investigating the characteristics or outcomes of out-in M&As by Asian firms in this study. Nonetheless, as mentioned in Section 2, the number of out-in M&A cases by Asian firms has been increasing in recent years and M&As by Asian firms are an issue that deserves further investigation in future studies.

15
variables, we use the logarithm of TFP, ROA (return on assets), the logarithm of employment to
represent firm size, firm age, the share of the number of non-production workers in the total
number of workers as an indicator of human capital, R&D intensity, advertising intensity, export
intensity, and the debt-asset ratio.14 All the explanatory variables are values in year t-1, i.e., the
year preceding the year of acquisition, t. The model also includes a full set of industry and year
dummies.
The results from the probit estimation are presented in Table 3.4. The determinants of
acquisition are quite different for out-in acquisitions and in-in acquisitions. In the case of out-in
acquisitions, consistent with the preceding results of Fukao, Ito and Kwon (2005) and Conyon et
al. (2002), we find that firms with higher TFP, a higher profit rate, a higher share of
non-production workers, a higher export intensity, and of larger size are chosen as targets in the
manufacturing sector (equation (1) of Table 3.4). As for the non-manufacturing sector, firms with
a higher profit rate and higher advertising and export intensities tend to be chosen as out-in M&A
targets (equation (2) of Table 3.4). This result implies that foreign firms acquire well-performing
Japanese firms. In contrast, in the case of in-in acquisitions, many of these performance measures
are not significant determinants of acquisitions, although we can see that in the manufacturing
sector, firms with higher TFP are more likely to be acquired (equation (3) of Table 3.4).
Moreover in the case of in-in acquisitions in the non-manufacturing sector, firms with a higher
profit rate and export intensity are less likely to be acquired, which is conspicuously different
14 In the case of the non-manufacturing sector, the share of the number of non-production workers in the total number of workers, R&D intensity, and export intensity are excluded from the explanatory variables. We define “production workers” as the workers who are working in manufacturing plants and consequently, our definition of the share of non-production is not appropriate as a proxy for human capital or skilled labor in the case of the non-manufacturing sector. The data on R&D expenditure are not very reliable for many firms in the non-manufacturing sector in our dataset. As for exports, most of exporting firms are trading companies and there are very few firms who export their products or services in other non-manufacturing industries. Therefore, we think these variables are not appropriate explanatory variables in the case of non-manufacturing sector.

16
from the case of out-in acquisitions (equation (4) of Table 3.4). Another important difference
between out-in and in-in acquisitions is that firms with a higher debt-asset ratio are chosen as
targets in the case of in-in acquisitions while firms with a lower debt-asset ratio are chosen as
targets in the case of out-in acquisitions. This result implies that in-in acquisitions may have the
characteristics of rescue missions. As discussed in Fukao, Ito, and Kwon (2005), in-in
acquisitions in Japan may be mainly conducted within vertical and horizontal keiretsu networks
or within a corporate group, and financially distressed firms are salvaged by other member firms
or parent firms through M&As. We will return to this issue in the next subsection.
Insert Table 3.4
The results from the probit estimation generally indicate that foreign firms tend to target
firms that are more productive and have a higher ROA while Japanese firms target firms with
low profitability. There are two potential explanations for these revealed preferences of foreign
firms. One is the synergy hypothesis. Foreign firms seek synergy effects when they purchase
Japanese firms. In order to make sure they reap synergy effects, foreign firms prefer excellent
Japanese firms. The other explanation, which is not necessarily inconsistent with the first, is an
asymmetric information problem. Foreign firms are disadvantaged in gathering information on
small Japanese firms. It is a very difficult task for foreign firms to correctly evaluate whether
they can restructure a small Japanese firm teetering on the brink of bankruptcy and negotiate
from their home country debt rescheduling with the Japanese main bank of such a firm. Because
of this problem, foreign firms might prefer better Japanese firms as their target.
In the case of cross-border portfolio investment, it is well known that investors tend to
prefer stocks of excellent and large manufacturing firms with high export intensity. Probably in
the case of out-in M&As, the problem of asymmetric information causes a similar phenomenon.
17
After establishing a beachhead by purchasing an excellent Japanese firm, foreign firms probably
can gather more information on smaller and inferior Japanese firms and then start purchasing
such firms. But if this new purchase is conducted by the beachhead Japanese affiliate, our data on
out-in M&As do not cover such cases.
In the case of in-in M&As, we found that Japanese firms tend to target inefficient firms
with low profits or with a high debt-asset ratio. This finding is consistent with the
managerial-discipline hypothesis.
3.4 Do Acquisitions Improve the Performance of Target Firms? – An Analysis of the
Dynamic Effects Based on the Unmatched Sample
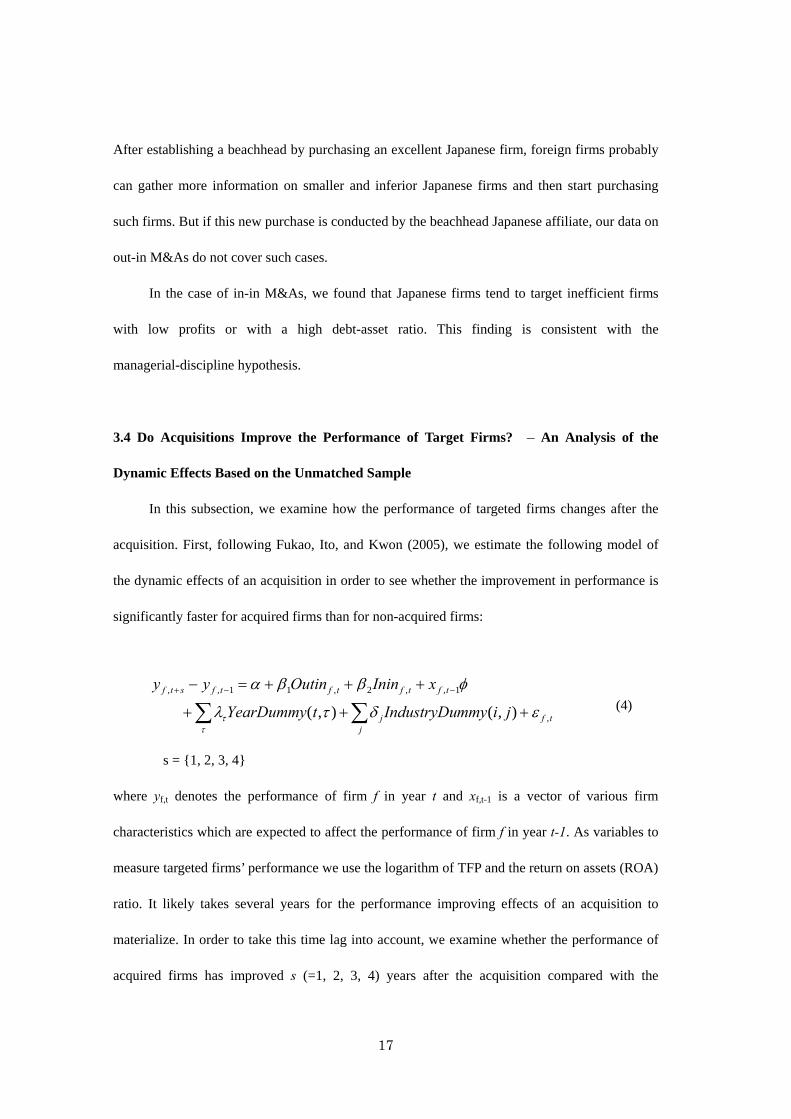
In this subsection, we examine how the performance of targeted firms changes after the
acquisition. First, following Fukao, Ito, and Kwon (2005), we estimate the following model of
the dynamic effects of an acquisition in order to see whether the improvement in performance is
significantly faster for acquired firms than for non-acquired firms:
tfj
j
tftftftfstf
jimmyIndustryDutYearDummy
xIninOutinyy
,
1,,2,11,,
),(),( εδτλ
φββα
ττ +++
+++=−
∑∑−−+
(4)
s = {1, 2, 3, 4}
where yf,t denotes the performance of firm f in year t and xf,t-1 is a vector of various firm
characteristics which are expected to affect the performance of firm f in year t-1. As variables to
measure targeted firms’ performance we use the logarithm of TFP and the return on assets (ROA)
ratio. It likely takes several years for the performance improving effects of an acquisition to
materialize. In order to take this time lag into account, we examine whether the performance of
acquired firms has improved s (=1, 2, 3, 4) years after the acquisition compared with the

18
performance in the year prior to the acquisition. As explanatory variables, we use out-in and in-in
acquisition dummies (Out-in and In-in) which take 1 for an acquired firm in year t when the
acquisition occurs, the lagged values of the two performance variables (the TFP level and the
ROA), the lagged logarithm of the number of employees in year t-1, and several additional firm
characteristics, such as the length of business experience (Age), the ratio of the number of
non-production workers to the number of total workers, R&D intensity, advertising intensity,
export intensity, and the debt-asset ratio.15 A full set of industry and year dummies is also
included. λτ and δj denote the coefficients of the year and industry dummies, respectively. By
looking at the coefficients on the Out-in and In-in dummy variables, β1 and β2, we will evaluate
whether the performance of acquired firms improved faster than that of non-acquired firms once
other characteristics are controlled for.
Insert Tables 3.5 and 3.6
The estimation results for the manufacturing sector on the effects of the acquisition are
reported in Tables 3.5 and 3.6. Table 3.5 presents the effect of the acquisition on the TFP growth
rate, while Table 3.6 shows the effect of the acquisition on the ROA ratio. The results in Table
3.5 suggest that compared with non-acquired firms, both firms acquired by foreigners and firms
acquired by another domestic firm show a significantly higher TFP growth rate during the four-
year-period from the year prior to the acquisition to three years after the acquisition. The
coefficient on the out-in dummy variable is much larger than that on the in-in dummy in the
cases of the 3-year window (equation (2) of Table 3.5) and the 4-year window (equation (3) of
15 In the case of the non-manufacturing sector, we exclude the share of non-production workers, R&D intensity, and export intensity for the same reasons as in the probit estimation in the previous subsection.
19
Table 3.5), which implies that out-in acquisitions may have a larger positive effect on TFP
growth. In the case of the 5-year window (equation (4) of Table 3.5), however, the coefficient on
the out-in dummy becomes insignificant while the coefficient on the in-in dummy remains
positive and significant. Therefore, regarding the effects of acquisitions on the TFP growth rate,
the results in Table 3.5 suggest that out-in acquisitions tend to bring a larger productivity
improvement than in-in acquisitions three years after the acquisition, but the productivity
improvements from out-in acquisitions do not last long.
On the other hand, the results in Table 3.6 indicate that out-in acquisitions lead to a
significant improvement in target firms’ profitability (measured as ROA) three and four years
after the acquisition. Although no immediate improvement in profitability can be observed after
out-in acquisitions, the results clearly indicate that out-in acquisitions contribute to higher
profitability while in-in acquisitions do not have any impact on target firms’ profitability.
In the case of the non-manufacturing sector, the impact of out-in acquisitions on target
firms’ performance differs more sharply from that of in-in acquisitions (Tables 3.7 and 3.8).
Out-in acquisitions result in higher TFP growth for target firms three years after the acquisition,
while the TFP improvement effect of in-in acquisitions is very small or even negative and not
statistically significant (Table 3.7). As for ROA, out-in acquisitions have a significant positive
effect beginning immediately after the acquisition, while the effects of in-in acquisitions are
negative but insignificant in all equations except one in Table 3.8.
Insert Tables 3.7 and 3.8
Overall, we find some evidence that out-in acquisitions lead to an improvement in target
firms’ ROA both in the manufacturing and the non-manufacturing sector. Moreover, out-in

20
acquisitions also lead to a TFP improvement three years after the acquisition both in the
manufacturing and the non-manufacturing sector. These results regarding out-in acquisitions are
consistent with the synergy hypotheses. On the other hand, in the case of in-in acquisitions, the
result that there is no significant improvement in ROA does not provide much support for the
managerial-discipline hypotheses.
Although our results do not seem to support the managerial-discipline hypotheses, in the
case of in-in acquisitions, firms with a lower profit rate (for the non-manufacturing sector) and a
higher debt-asset ratio (for both the manufacturing and the non-manufacturing sectors) are, as
discussed in Section 3.3, more likely to be acquired. This result implies that in-in acquisitions
may have the characteristics of rescue missions, which may be one reason why there is no
conspicuous improvement in performance after an in-in acquisition. As mentioned above, many
cases of in-in acquisitions in Japan are conducted within vertical and horizontal keiretsu
networks or within a corporate group. In the case of within-group acquisitions, since workers
and managers of acquired firms expect further support by group firms, it may be difficult to
accomplish drastic restructuring. On the other hand, in-in acquisitions involving outsiders may
have a positive effect on performance after the acquisition in a way that is similar to out-in
acquisitions. In order to test this hypothesis, we examine the dynamic effects of in-in
acquisitions within firm groups and of in-in acquisitions involving outsiders.
For information on firm groups, we use the Kankei Kaisha database (subsidiary firms
database) compiled by Toyo Keizai Shinposha. We define acquisitions as conducted within a
group if, prior to the acquisition, between 20 and 50 percent of the paid-in capital of the acquired
firm was held by a related company. It is important to note, however, that if firm A was partly
owned by related firm B, but the majority of firm A’s equity is newly acquired by another firm C,
which did not have a close relationship with firm A before the acquisition, such a case is

21
incorrectly included in our sample as a “within-group acquisitions.” Using the Toyo Keizai
information, we find 518 within-group in-in acquisition cases in our dataset for the period from
1994 to 2002, which is approximately one-sixth of the total of in-in acquisition cases (refer to
Table 3.1). The estimation results including the within-group in-in acquisition dummy variable
and the dummy for in-in acquisitions by outsiders are reported in Tables 3.9 to 3.12.
Insert Tables 3.9 and 3.10
Tables 3.9 and 3.10 show the results for the manufacturing sector. Contrary to our
expectation, target firms of within-group in-in acquisitions tend to show a higher TFP growth
rate than target firms of in-in acquisitions by outsiders. The TFP growth rate during the period
from a year prior to the acquisition to three years after the acquisition is significantly higher for
firms acquired by a group firm than for firms acquired by a domestic outsider firm. As for ROA
performance, however, within-group in-in acquisitions tend to have a significant negative impact,
while acquisitions by domestic outsiders did not have any significant effects. These results imply
that again, the managerial-discipline hypothesis does not seem to apply in the case of in-in
acquisitions in Japan. Rather, the results may be interpreted as follows: In the case of
within-group in-in acquisitions, parent firms may try to quickly restructure acquired firms, which
temporarily worsens their profitability. However, after the business restructuring is completed,
the acquired firms may be able to enjoy higher productivity by effectively utilizing managerial
and technological resources within the corporate group.
Insert Tables 3.11 and 3.12

22
According to the results for the non-manufacturing sector shown in Tables 3.11 and 3.12,
we can see a significant positive impact of within-group in-in acquisitions on the TFP growth
rate only in the case of the 5-year window (equation (4) of Table 3.11). In all the other cases, the
coefficients for within-group in-in acquisitions and in-in acquisitions by outsiders are not
statistically significant. Although out-in acquisitions positively affect the return on assets in the
case of the non-manufacturing sector, neither type of in-in acquisitions has a positive impact on
ROA. In the case of the non-manufacturing sector, our results suggest that there is no
conspicuous difference between the effects of within-group in-in acquisitions and in-in
acquisitions by outsiders. That is, in the non-manufacturing sector, even acquisitions by domestic
outsiders do not lead to an improvement in the acquired firms’ performance.
Thus, we find that there is no positive impact on target firms’ ROA both in the case of
within-group in-in acquisitions and in-in acquisitions by outsiders, implying that the
managerial-discipline hypothesis is not supported.
3.5 Do M&As Improve the Performance of Target Firms? – Analysis Based on
Difference-in-Differences Estimates from the Matched Sample
Our estimation results on the dynamic effects of out-in and in-in acquisitions in the
previous subsection indicate that both in the manufacturing and the non-manufacturing sectors
out-in acquisitions lead to improvements in target firms’ TFP and ROA. These results are
consistent with those in Fukao, Ito, and Kwon (2005), although the results of that study indicated
that out-in acquisitions improve target firms’ performance more quickly. 16 However, as
16 The difference between the results of that study and the present one is probably due to the fact that (1) the data for this study cover the period 1994-2002, which is one year longer than the observation period in Fukao, Ito, and Kwon (2005); (2) this study uses newly compiled and detailed industry-level deflators taken from the JIP database 2006; and (3) the explanatory variables employed in the regression analyses are not exactly the same as those in Fukao, Ito, and Kwon (2005).

23
described at the beginning of Section 3, the Fukao, Ito, and Kwon (2005) study does not address
the selection bias problem and therefore suffers from the problem of simultaneity between
ownership status and other performance variables because out-in acquisition targets differ
systematically from other firms as indicated by the results of probit analysis. The analysis in this
study so far also has not addressed the simultaneity problem yet. Therefore, we now employ the
propensity score matching and the difference-in-differences (DID) techniques described in
Section 3.1 and examine whether we still find that out-in acquisitions lead to an improvement in
acquired firms’ performance even after the simultaneity problem has been overcome or at least
reduced. What we are interested in is the causal effect of acquisition on target firms’ performance.
However, changes in performance following an acquisition are not exclusively the result of the
acquisition but also depend on other factors. Applying the DID technique, the change in
performance before and after the acquisition therefore is further differenced with respect to
changes in performance of the control group of non-acquired firms. Therefore, the DID estimator
removes the effects of common shocks and more accurately measures the causal effect of the
acquisition.
Using the probit estimation results shown in Table 3.4, we first identify the probability of
acquisition (or “propensity score”) for all firms in our dataset.17 Our probit estimation model in
Table 3.4 assumes that the propensity of firms to be acquired by other firms is a function of the
17 In order to verify whether the balancing condition is satisfied in our matched sample, we conduct two tests, following Hijzen, Jean, and Mayer (2006). First, we examine the standardized bias for variables included in the propensity score estimation before and after matching (see Smith and Todd, 2005). Rosenbaum and Rubin (1985) assume that a standardized bias in excess of 20 percent is large, although there is no formal criterion to assess the bias. Second, for each variable in the propensity score estimation, we perform standard t-tests for equality of means of each variable between the treated group and the non-treated group before and after matching. The results of these two tests are presented in Appendix Tables 2 and 3. The standardized bias and t-test for equality of means before and after matching indicate that the balancing property is satisfied for most of our variables. However, the debt-asset ratio in the case of manufacturing and the ROA ratio in the case of non-manufacturing are less likely to satisfy the balancing property. Further investigation and improvement in matching accuracy may be necessary.

24
TFP level, firm size, the number of years since establishment, the share of the number of
non-production workers, R&D intensity, advertisement intensity, export intensity, and the
debt-asset ratio.18 A non-acquired firm which is “closest” in terms of its propensity score to an
acquired firm is selected as a match for an actually acquired firm using the one-to-one nearest
neighbor matching method. One-to-one nearest neighbor matching means that we can use data
only from a subset of the sample. In the case of out-in acquisitions, our matched sample contains
132 firms not acquired by foreigners as a match for the 132 firms acquired by foreigners (60
firms in manufacturing and 72 firms in non-manufacturing). In the case of in-in acquisitions, our
matched sample contains 2,820 firms not acquired by domestic firms as a match for the 2,820
firms acquired by domestic firms (1,385 firms in manufacturing and 1,435 firms in
non-manufacturing).
Using the subsets of the sample, we estimate a difference-in-differences (DID) estimator,
which in our case, is equivalent to calculating the Average effect of Treatment on the Treated
(ATT) based on equation (3) in Section 3.1. The calculated effects of out-in and in-in acquisitions
are presented in Tables 3.13 and 3.14. In the case of the manufacturing sector (Table 3.13), a
foreign acquisition leads to an additional 5 percentage-point productivity growth in the firms
acquired by foreigners three years after the acquisition. The result also shows that firms acquired
by foreign firms enjoy an ROA advantage over the control group equivalent to 4
percentage-points at the end of the third year of foreign ownership and 2.5 percentage-points at
the end of the fourth year of foreign ownership. Although we find a TFP improvement effect four
years after in-in acquisitions, the results in Table 3.13 generally show that performance
improvements are likely to be larger in the case of foreign acquisition. Table 3.14 shows that
foreign ownership improved the TFP and ROA of acquired firms also in the non-manufacturing
18 In the case of the non-manufacturing sector, we exclude the share of non-production workers, R&D intensity, and export intensity.

25
sector at the end of the third year of foreign acquisition. On the other hand, in-in acquisitions do
not have any significant impact on the performance of acquired firms. Moreover, the magnitude
of the ATT tends to be much larger for out-in acquisitions in the non-manufacturing sector
compared with that for out-in acquisitions in the manufacturing sector, although in many cases
the ATT is not statistically significant.
The results from the matched sample indicate that foreign acquisitions improve target
firms’ productivity and profitability while acquisitions by domestic firms hardly have any
positive impact on performance. However, the significant positive effect of foreign acquisitions
shows up only three years after acquisition, implying that the realization of synergy effects from
acquisitions or the restructuring of acquired firms take at least three years. Moreover, according
to the results, improvements experienced by firms acquired by foreigners are likely to be a
temporary phenomenon. Although the matching results provide only weak evidence that
acquisition by a foreign firm improves the performance of acquired firms, they do confirm that
such a positive effect exists, even when the sample selection bias is removed. Furthermore, the
matching result that performance improvements are likely to be realized three years after
acquisition are consistent with the estimation results from the unmatched samples in the previous
subsection.
Insert Tables 3.13 and 3.14
4. Conclusion
In recent years, the Japanese government has been actively promoting inward foreign
direct investment with the aim of accelerating structural adjustment and achieving a full-scale
economic recovery. In order to examine whether the entry of foreign firms indeed does provide a
stimulus to the Japanese economy and contribute to a better performance of Japanese firms, we

26
investigated the effects of out-in M&As on target firms’ performance in a previous study (Fukao,
Ito, and Kwon, 2005). Although that study found some evidence that out-in M&As brought
larger and quicker improvements in TFP and the profit-to-sales ratio than in-in M&As, the study
had several limitations. This paper sought to overcome these limitations by conducting (1) a
much more careful investigation of the effect of in-in acquisitions by distinguishing within-group
in-in acquisitions and in-in acquisitions by outsiders; (2) an analysis on firms in the
non-manufacturing sector; (3) a more rigorous analysis by employing propensity score matching
and the difference-in-differences technique; and (4) an analysis using a new dataset which
contains the most recent data available.
The results of this paper were generally consistent with those in Fukao, Ito, and Kwon
(2005). But the present study also produced several new findings. First, we found that there was
no positive impact on target firms’ ROA in the case of both within-group in-in acquisitions and
in-in acquisitions by domestic outsiders. In fact, in the manufacturing sector, the return on assets
even deteriorated one year and two years after within-group in-in acquisitions. The results thus
did not support the managerial-discipline hypothesis which suggests that acquisitions are
intended to strengthen managerial control over entrenched managers who are more interested in
their own benefit than the wealth of the firm’s owners, and which therefore predicts that the
profitability of acquired firms improves after the acquisition. Rather, our results imply that in the
case of within-group in-in acquisitions, parent firms may be trying to quickly restructure
acquired firms even at the cost of deteriorating profitability. Our results also showed that
within-group in-in acquisitions brought a larger and quicker improvement in TFP compared with
in-in acquisitions by domestic outsiders both in the manufacturing and non-manufacturing
sectors.
Second, we found that foreign acquisitions improved target firms’ productivity and
27
profitability significantly more and quicker than acquisitions by domestic firms. We confirmed
these results by employing a methodology that combines propensity score matching and
difference-in-differences techniques. The methodology enabled us to ensure that the
characteristics of acquired firms and non-acquired firms are as close as possible and to isolate
causal effects that can be reliably attributed to acquisitions.
One potential concern is that our results from the matched sample may not be very strong
and robust. A possible reason for our somewhat weak results may be the accuracy of the
matching. As mentioned in Girma, Greenaway, and Kneller (2004), the importance of appropriate
matching cannot be overemphasized. If acquired firms experience a surge in productivity just
before the acquisition, their productivity is likely to grow more slowly in subsequent periods. In
such a case, a difference-in-differences estimator based on randomly matched firms is likely to
underestimate the performance impact of acquisitions. There may be room for further
improvement of the matching methodology in future studies.
Another possible concern is that the reliability of the difference-in-differences
methodology is dependent on the assumption that acquired and non-acquired firms are similarly
affected by macroeconomic factors. However, the bias arising from this assumption is mitigated
as much as possible in this study because firms are matched in the same industry and year in our
matching process.
Although we found some positive effects of foreign acquisitions on target firms’
performance, the magnitude of the positive effects is much smaller than that observed in Arnold
and Javorcik’s (2005) study for Indonesia. This is not surprising because the difference in
technological and managerial capabilities between domestic and foreign firms is much larger in
Indonesia than in Japan and technology transfer effects from foreign firms to domestic firms
should be less relevant in Japan. However, our results in this study imply that even in Japan,
28
where many domestic firms are closer to the technology frontier, performance improvement
effects from foreign acquisitions are present. Moreover, we find that the positive effects of
foreign acquisitions tend to be much larger in the case of the non-manufacturing sector than in
the case of the manufacturing sector. It is often argued anecdotally that the productivity of
Japanese non-manufacturing firms is relatively low compared with firms in other developed
countries. If this is true, the positive effect of foreign acquisitions in the non-manufacturing
sector may have very important policy implications: Foreign acquisitions possibly contribute to a
better performance of target firms in the non-manufacturing sector by transferring advanced
technology or managerial know-how. However, in our dataset, most out-in acquisitions in the
non-manufacturing sector occur in the wholesale and retail trade industries. The majority of
out-in acquisitions in these industries consist of acquisitions by manufacturing firms, suggesting
that foreign manufacturing firms often acquire Japanese wholesalers or retailers in order to
obtain their own distribution channels. Although technology and managerial know-how transfer
effects may not be relevant, such cases possibly contribute to the streamlining of distribution
networks in the Japanese commerce sector. A more detailed investigation of technology transfer
effects particularly in the non-manufacturing sector is an issue warranting of further
investigation.

29
Appendix: Construction of the Multilateral Index
The dataset employed in this paper was obtained from Kigyo Katsudo Kihon Chosa (Basic
Survey of Japanese Business Structure and Activities), which is conducted annually by the
Ministry of Economy, Trade and Industry (METI).
We define the productivity level of firm i in year t in a certain industry in comparison with the
productivity level of a hypothetical representative firm in base year 0 in that industry.
The TFP level is defined as follows:
)]lnln)((21)lnln(
)ln)(ln(21)ln(lnln
1,,1,,1 111
,,,,,,1,,
−−= =−=
=
−+−−+
−+−−=
∑ ∑∑
∑
sfsfsfsft
s
n
fst
s s
tftiftftifn
fttiti
XXSSQQ
XXSSQQTFP (A1)
where Qi, t, Sf, i, t, and Xf, i, t denote the output of firm i in year t, the cost share of factor f for firm i
in year t, and firm i’s input of factor f in year t, respectively. Variables with an upper bar denote
the industry average of that variable.
Output: Except for the commerce sector, gross output is defined as firms’ total sales. For the
commerce sector, gross output is measured as sales minus expenses for purchased materials.
Gross output is deflated by the output deflator derived from the JIP 2006.
Intermediate inputs: For the commerce sector, intermediate inputs are calculated as (Cost of
sales + Operating costs) – (Wages + Depreciation costs + Expenses for purchased materials). The
intermediate inputs of other sectors are defined as (Cost of sales + Operating costs) – (Wages +
Depreciation costs). Intermediate inputs are deflated by the intermediate input deflator provided
in the JIP 2006.
Labor input: As labor input, we used each firm’s total number of workers multiplied by the
sectoral working hours from the JIP 2006.
Capital Stock: For capital stock, the only data available are the nominal book values of tangible
fixed assets. Using these data, we calculated the net capital stock of firm i in industry j in
constant 1995 prices as follows:
)/( jtjtitit IBVINKBVK ∗=
where BVit represents the book value of firm i’s tangible fixed capital in year t, INKjt stands for

30
the net capital stock of industry j in constant 1995 prices, and IBVjt denotes the book value of
industry j’s capital. INKjt was calculated as follows. First, as a benchmark, we took the data on
the book value of tangible fixed assets in 1975 from the Financial Statements Statistics of
Corporations published by MOF. We then converted the book value of year 1975 into the real
value in constant 1995 prices using the investment deflator provided in the JIP 2006. Second, the
net capital stock of industry j, INKjt, for succeeding years was calculated using the perpetual
inventory method. We used the investment deflator in the JIP 2006. The sectoral depreciation
rate used is taken from the JIP 2006.
Cost Shares: Total cost of labor is measured as total wages. We used nominal intermediate input
as the intermediate input cost. Capital cost was calculated by multiplying the real net capital
stock with the user cost of capital. The latter was estimated as follows:
)}()1)(1({11
k
kikk p
piurpuzc
&−+−−+
−−
= δλλ
where λδ ,,,, uipk and z are the price of investment goods, the interest rate, the
depreciation rate, the corporate tax rate, the equity ratio, and the present value of depreciation
deduction on a unit of nominal investment, respectively. Data on investment goods prices,
interest rates, and corporate tax rates were taken from the JIP 2006, the Bank of Japan’s website,
and the Ministry of Finance Statistics Monthly, respectively. The depreciation rate for each sector
was taken from the JIP 2006. We calculated the cost shares of each factor by dividing the cost of
each factor by total costs, which consist of the sum of labor costs, intermediate inputs costs, and
capital costs.
Insert Appendix Tables 1, 2, and 3

31
References
Arnold, Jen and Beata Smarzynska Javorcik (2005) “Gifted Kids or Pushy Parents? Foreign
Acquisitions and Plant Performance in Indonesia,” CEPR Discussion Paper Series
No. 5065, May, Centre for Economic Policy Research.
Barba Navaretti, Giorgio, Davide Castellani, and Anne-Célia Disdier (2006) “How Does
Investing in Cheap Labour Countries Affect Performance at Home? France and
Italy,” mimeo.
Becker, Sascha O. and Andrea Ichino (2002) “Estimation of Average Treatment Effects
Based on Propensity Scores,” Stata Journal, Vol. 2, No. 4, pp. 358-377.
Conyon, Martin J., Sourafel Girma, Steve Thompson, Peter W. Wright (2002) “The Productivity
and Wage Effects of Foreign Acquisitions in the United Kingdom,” Journal of Industrial
Economics 50, pp.85-102.
Doms, Mark E. and J. Bradford Jensen (1998) “Comparing Wages, Skills, and Productivity
Between Domestically and Foreign-Owned Manufacturing Establishments in the United
States,” in Robert E. Baldwin, Robert E. Lipsey, and J. David Richardson, eds.,
Geography and Ownership as Bases for Economic Accounting, NBER Studies in Income
and Wealth, Vol. 59, pp. 235-255, Chicago and London: University of Chicago Press.
Fukao, Kyoji, Keiko Ito and Hyeog Ug Kwon (2005) “Do Out-in M&As Bring Higher TFP to
Japan? An Empirical Analysis Based on Micro-data on Japanese Manufacturing Firms,”
Journal of the Japanese and International Economies 19, pp.272-301.
Fukao, Kyoji and Yukako Murakami (2005) “Do Foreign Firms Bring Greater Total Factor
Productivity to Japan?” Journal of the Asia Pacific Economy, vol.10, No.2, pp.237-254.
Girma, Sourafel, David Greenaway, and Richard Kneller (2004) “Does Exporting Increase
Productivity? A Microeconometric Analysis of Matched Fimrs,” Review of International

32
Economics 12 (5): 855-866.
Griffith, Rachel, and Helen Simpson (2001) “Characteristics of Foreign-Owned Firms in British
Manufacturing,” Working Paper No. 01/10, London: The Institute for Fiscal Studies.
Harris, Robert S. and David Ravenscraft (1991) “The Role of Acquisitions in Foreign Direct
Investment : Evidence from the U.S. Stock Market,” Journal of Finance 46, pp.825-844.
Heckman, James J., Hidehiko Ichimura, and Petra E. Todd (1997) “Matching as an Econometric
Evaluation Estimator: Evidence from Evaluating a Job Training Programme,” Review of
Economic Studies 64, pp. 605-654.
Heckman, James J., Hidehiko Ichimura, Jeffrey Smith, and Petra E. Todd (1998) “Characterizing
Selection Bias Using Experimental Data,” Econometrica 66 (5), pp. 1017-1098.
Hijzen, Alexander, Sébastien Jean, and Thierry Mayer (2006) “The Effects at Home of Initiating
Production Abroad: Evidence from Matched French Firms: What Happens to the
Biological Kids of Foster Parents?,” mimeo.
Ikeda, Katsuhiko and Noriyuki Doi (1983) “The Performance of Merging Firms in Japanese
Manufacturing Industry: 1964-75,” Journal of Industrial Economics 31, pp.257-266.
Ito, Keiko (2004) “Foreign Ownership and Productivity in the Indonesian Automobile Industry:
Evidence from Establishment Data for 1990-99,” in Takatoshi Ito and Andrew K. Rose,
eds., Growth and Productivity in East Asia, NBER-East Asia Seminar on Economic, Vol.
13, pp. 229-270, Chapter 7, Chicago and London: University of Chicago Press.
Ito, Keiko and Kyoji Fukao (2005) “Foreign Direct Investment and Trade in Japan: An Empirical
Analysis Based on the Establishment and Enterprise Census for 1996,” Journal of the
Japanese and International Economies 19: 414-455.
Jensen Michael (1988) “Takeovers: Their Causes and Consequences,” Journal of Economic
Perspectives 2, pp.21-48.

33
Kimura, Fukunari and Kozo Kiyota (2004) “Foreign-owned versus Domestically-owned Firms:
Economic Performance in Japan,” Review of Development Economics, forthcoming.
Leuven, Edwin and Barbara Sianesi (2003) “PSMATCH2: Stata Module to Perform Full
Mahalanobis and Propensity Score Matching, Common Support Graphing, and
Covariate Imbalance Testing,” http://ideas.repec.org/c/boc/bocode/s432001.html.
Version 1.2.3.
Lichtenberg, Frank R. and Donald Siegel (1987) “Productivity Changes in Ownership of
Manufacturing Plants,” Brookings Papers on Economic Activity 3, pp.643-673.
McGuckin, Robert H. and Sang V. Nguyen (1995) “On Productivity and Plant Ownership
Change: New Evidence from the Longitudinal Research Database,” RAND Journal of
Economics 26, pp.257-276.
Nguyen, Sang V. and Michael Ollinger (2002) “Mergers and Acquisitions and Productivity in the
U.S. Meat Products Industries: Evidence from the Micro Data,” CES-WP-02-07, Center
for Economic Studies, U.S. Bureau of the Census.
Odagiri, Hiroyuki and Tatsuo Hase (1989) “Are Mergers and Acquisitions Going to be Popular in
Japan Too? : An Empirical Study,” International Journal of Industrial Organization 7,
pp.49-72.
Paprzycki, Ralph and Kyoji Fukao (2005) “The Extent and History of Foreign Direct Investment
in Japan,” Hi-Stat Discussion Paper Series, no. 84, Hitotsubashi University.
Ramstetter, Eric D. (1999) “Comparisons of Foreign Multinationals and Local Firms in Asian
Manufacturing Over Time,” Asian Economic Journal 13 (2), pp. 163-203.
Rosenbaum, Paul R. and Donald B. Rubin (1983) “The Central Role of the Propensity Score in
Observational Studies for Causal Effects,” Biometrika 70 (1), pp. 41-55.
Smith, Jeffery and Petra Todd (2005) “Rejoinder” Journal of Econometrics 125: 365-375.
34
Swenson, Deborah L. (1993) “Foreign Mergers and Acquisitions in the United States,” in
Kenneth A. Froot (ed.), Foreign Direct Investment, University of Chicago Press, Chapter
9, pp.255-281, Chicago, IL.
Takii, Sadayuki (2004) “Productivity Differentials Between Foreign and Local Plants in
Indonesian Manufacturing, 1995,” World Development 32 (11), pp. 1957-1969.
Werner, Richard A. (2003) “Foreign Money Won’t Help Japan’s Economy,” The Daily Yomiuri.

Table 1.1 Employment in Foreign Affiliates as a Share of Total Employment (in %)
Industry JAFF (33.4%) JAFF (33.4%) JAFF (20%,single owner)
USAFF (10%,single owner)
1996 2001 2001 1997Total all sectors n.a. 1.15 2.75 5.61 Manufacturing total 1.36 1.94 5.91 10.78Food products 0.29 0.34 1.32 8.38Textiles & apparel 0.15 0.17 0.93 5.83Wood and paper products 0.06 0.16 0.83 4.95Publishing & printing 0.13 0.22 0.38 7.83Chemical products 3.61 3.27 13.5 21.8Drugs & medicine 7.21 15.49 15.27 31.9Petroleum and coal products 7.24 2.91 2.31 22.2Plastic products 0.41 0.45 3.22 10.03Rubber products 1.08 1.15 2.81 40.18Ceramic, stone and clay 0.28 0.35 1.55 21.45Iron & steel 0.01 0.13 0.27 19.35Non-ferrous metals 1.61 0.44 7.72 15.73Metal products 0.31 0.2 0.72 7.52General machinery 1.68 1.78 6.82 12.75Electrical machinery 2.46 2.48 12.51 13.78Motor vehicles & parts 4.72 10.79 18.32 15.6Miscellaneous transport equipment 0.7 0.62 12.71 4.23Precision instruments 0.41 0.9 5.04 11.16Miscellaneous manufacturing 0.47 0.72 1.71 6.62 Services total 0.65 0.97 2.04 4.31Construction & civil engineering 0.05 0.05 0.3 1.72Electricity, gas, steam and water supply, etc. 0 0 0.04 1.96Wholesale trade 2.31 2.57 4.24 7.89Retail trade 0.29 0.49 0.77 4.5Financial intermediary services 1.47 1.75 10 6.1Insurance 1.67 6.69 12.57 6.4Real estate 0.02 0.08 0.28 1.64Transportation & postal service 0.5 0.27 3.52 4.82Telecommunications & broadcasting 0.22 2.31 6.55 7.66Education & research institutes 0.34 0.97 1.76 6.39Medical services, health and hygiene 0.02 0.04 0.16 1.99Computer programming & information service 1.83 2.55 4.33 3.88Goods & equipment rental & leasing 0.88 1.2 0.49 3.66Other business services 0.52 1.71 2.1 4.77Eating & drinking places 1.58 2.36 3.89 2.48Other personal services 0.12 0.39 0.38 4.23Other services 0.01 0 0 n.a.Source: Paprzycki and Fukao (2005). Original data is compiled from the micro-data of the Ministry ofInternal Affairs and Communications' Establishment and Enterprise Census for 1996 and 2001 and Bureauof Economic Analysis, Foreign Direct Investment in the United States: Establishment Data for 1997 , online:<http://www.bea.gov/bea/ai/iidguide.htm#FDIUS> (accessed 18 Feb. 2005).Notes: JAFF (33.4%): Japanese Affiliates of Foreign Firms (33.4% or more foreign-owned, one or moreforeign companies); JAFF (20%): Japanese Affiliates of Foreign Firms (20% or more foreign-owned by asingle foreign company); USAFF: U.S. Affiliates of Foreign Firms (10% or more foreign-owned by a singleforeign company).
35

Figure 2.1 Number of In-In and Out-In M&A Transactions in Japan by Year: 1994-2002
Source: RECOF (2003).Note: M&A transactions include mergers, purchases of substantialminority interests, and purchases of additional shares and acquisitions.
0
200
400
600
800
1000
1200
1994 1995 1996 1997 1998 1999 2000 2001 2002Year
In-in
0
20
40
60
80
100
120
140Out-in
In-in
Out-in
36
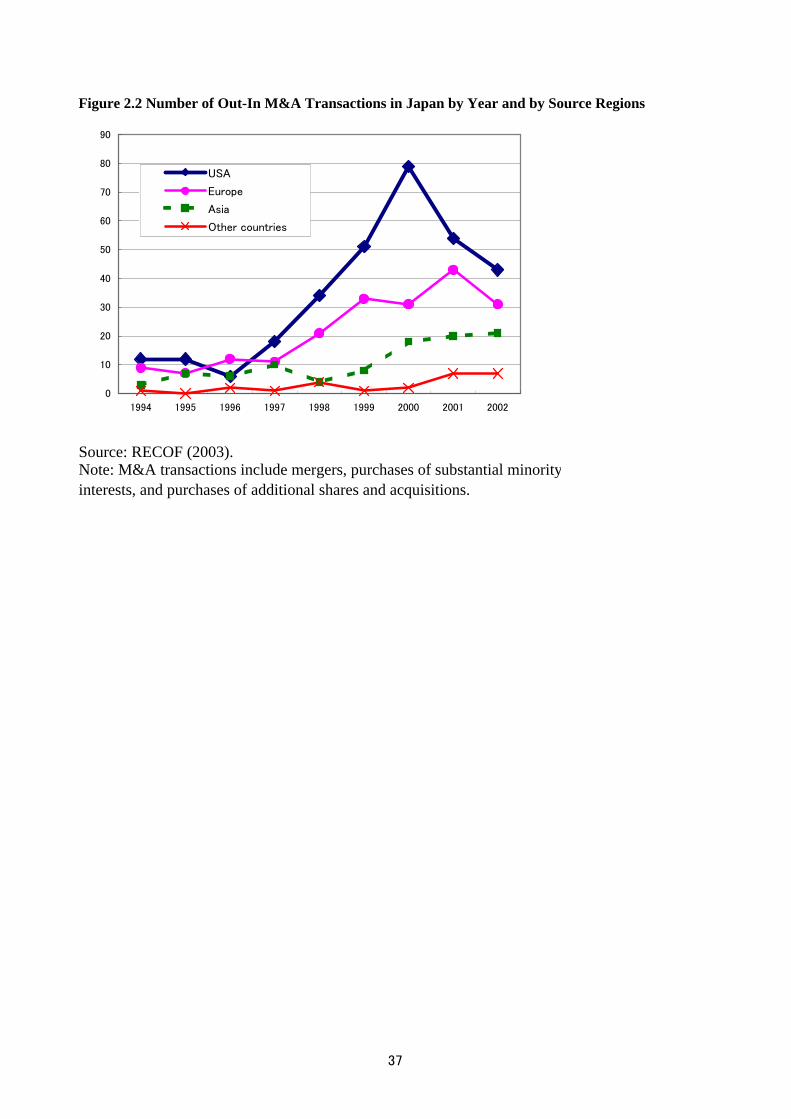
Figure 2.2 Number of Out-In M&A Transactions in Japan by Year and by Source Regions
Source: RECOF (2003).Note: M&A transactions include mergers, purchases of substantial minorityinterests, and purchases of additional shares and acquisitions.
0
10
20
30
40
50
60
70
80
90
1994 1995 1996 1997 1998 1999 2000 2001 2002
USA
Europe
Asia
Other countries
37
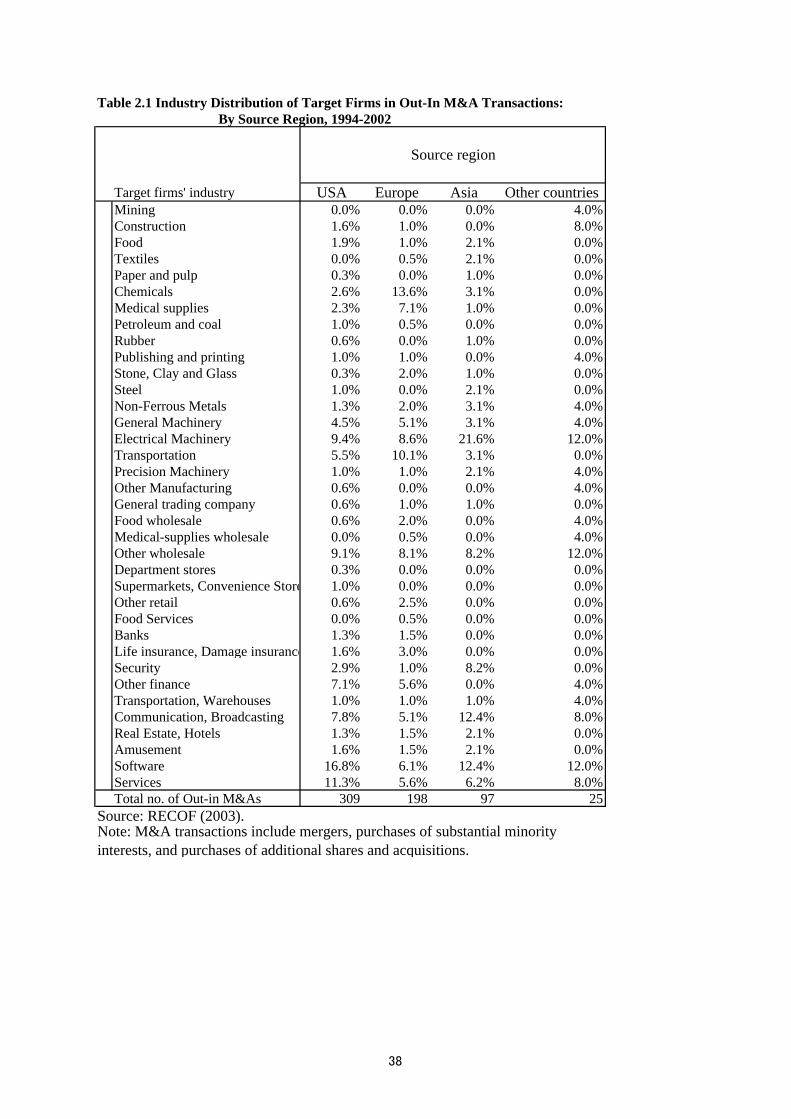
Table 2.1 Industry Distribution of Target Firms in Out-In M&A Transactions: By Source Region, 1994-2002
Target firms' industry USA Europe Asia Other countriesMining 0.0% 0.0% 0.0% 4.0%Construction 1.6% 1.0% 0.0% 8.0%Food 1.9% 1.0% 2.1% 0.0%Textiles 0.0% 0.5% 2.1% 0.0%Paper and pulp 0.3% 0.0% 1.0% 0.0%Chemicals 2.6% 13.6% 3.1% 0.0%Medical supplies 2.3% 7.1% 1.0% 0.0%Petroleum and coal 1.0% 0.5% 0.0% 0.0%Rubber 0.6% 0.0% 1.0% 0.0%Publishing and printing 1.0% 1.0% 0.0% 4.0%Stone, Clay and Glass 0.3% 2.0% 1.0% 0.0%Steel 1.0% 0.0% 2.1% 0.0%Non-Ferrous Metals 1.3% 2.0% 3.1% 4.0%General Machinery 4.5% 5.1% 3.1% 4.0%Electrical Machinery 9.4% 8.6% 21.6% 12.0%Transportation 5.5% 10.1% 3.1% 0.0%Precision Machinery 1.0% 1.0% 2.1% 4.0%Other Manufacturing 0.6% 0.0% 0.0% 4.0%General trading company 0.6% 1.0% 1.0% 0.0%Food wholesale 0.6% 2.0% 0.0% 4.0%Medical-supplies wholesale 0.0% 0.5% 0.0% 4.0%Other wholesale 9.1% 8.1% 8.2% 12.0%Department stores 0.3% 0.0% 0.0% 0.0%Supermarkets, Convenience Store 1.0% 0.0% 0.0% 0.0%Other retail 0.6% 2.5% 0.0% 0.0%Food Services 0.0% 0.5% 0.0% 0.0%Banks 1.3% 1.5% 0.0% 0.0%Life insurance, Damage insurance 1.6% 3.0% 0.0% 0.0%Security 2.9% 1.0% 8.2% 0.0%Other finance 7.1% 5.6% 0.0% 4.0%Transportation, Warehouses 1.0% 1.0% 1.0% 4.0%Communication, Broadcasting 7.8% 5.1% 12.4% 8.0%Real Estate, Hotels 1.3% 1.5% 2.1% 0.0%Amusement 1.6% 1.5% 2.1% 0.0%Software 16.8% 6.1% 12.4% 12.0%Services 11.3% 5.6% 6.2% 8.0%Total no. of Out-in M&As 309 198 97 25
Source: RECOF (2003).
Source region
Note: M&A transactions include mergers, purchases of substantial minorityinterests, and purchases of additional shares and acquisitions.
38

Manufacturing
Com
merce
Finance
Other services
Primary industry andconstruction
Total
Manufacturing 118(98) 31 0 13 0 162
Commerce 2 8(7) 0 1 0 11
Finance 7 4 32(23) 16 0 59
Other services 8 4 5 54(47) 2 73Primary industry and
construction 2 0 0 0 4(4) 6
Total 137 47 37 84 6 311Source: RECOF (2003).
Target firms' industry
Purchasers'industry
Table 2.2 Number of Out-In Acquisition Cases by Purchasers' Industry and by TargetFirms' Industry: 1994-2002
Notes: Figures in parentheses denote the number of acquisition cases between the sameindustries at a 2-digit industry classification. ( See Table 2.1 for the 2-digit industry
39
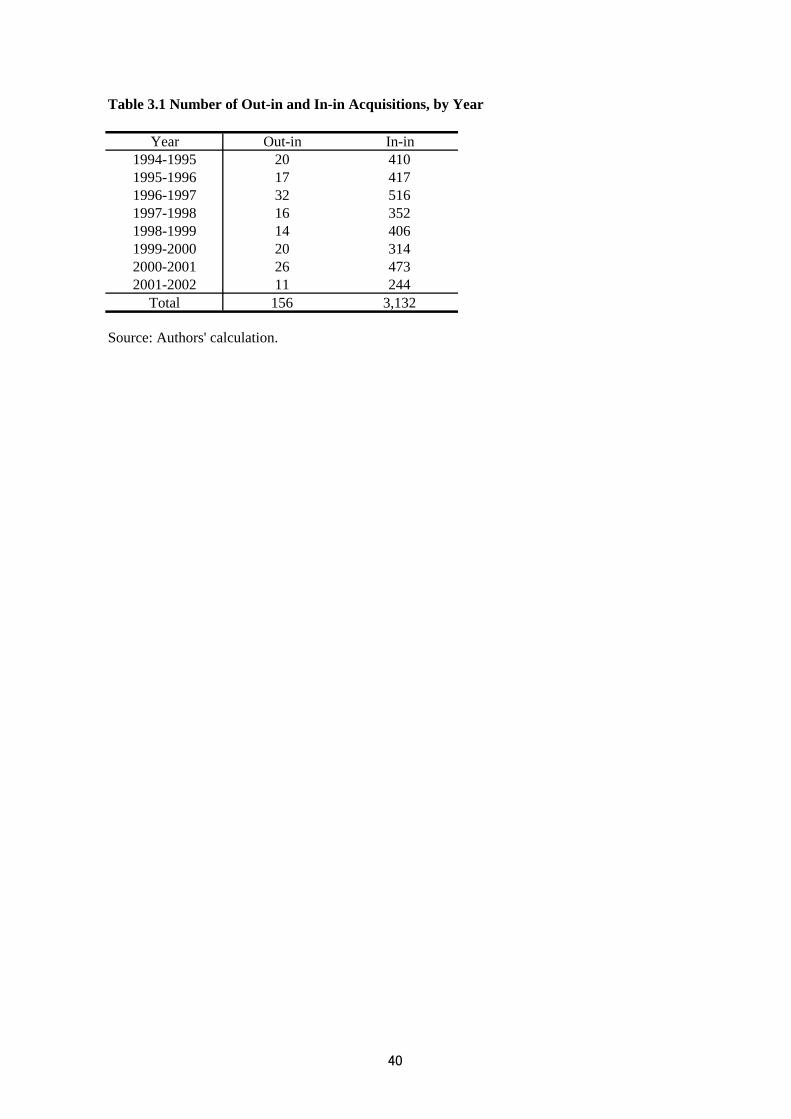
Table 3.1 Number of Out-in and In-in Acquisitions, by Year
Year Out-in In-in1994-1995 20 4101995-1996 17 4171996-1997 32 5161997-1998 16 3521998-1999 14 4061999-2000 20 3142000-2001 26 4732001-2002 11 244
Total 156 3,132
Source: Authors' calculation.
40
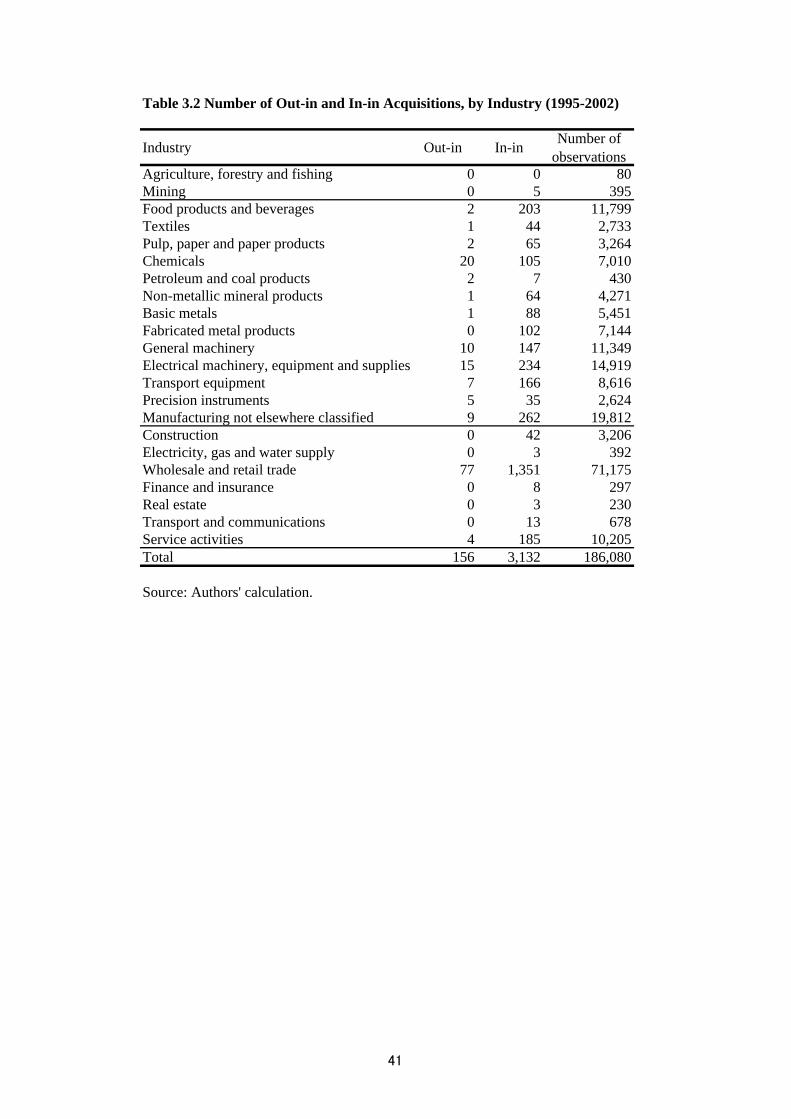
Table 3.2 Number of Out-in and In-in Acquisitions, by Industry (1995-2002)
Industry Out-in In-in Number ofobservations
Agriculture, forestry and fishing 0 0 80Mining 0 5 395Food products and beverages 2 203 11,799Textiles 1 44 2,733Pulp, paper and paper products 2 65 3,264Chemicals 20 105 7,010Petroleum and coal products 2 7 430Non-metallic mineral products 1 64 4,271Basic metals 1 88 5,451Fabricated metal products 0 102 7,144General machinery 10 147 11,349Electrical machinery, equipment and supplies 15 234 14,919Transport equipment 7 166 8,616Precision instruments 5 35 2,624Manufacturing not elsewhere classified 9 262 19,812Construction 0 42 3,206Electricity, gas and water supply 0 3 392Wholesale and retail trade 77 1,351 71,175Finance and insurance 0 8 297Real estate 0 3 230Transport and communications 0 13 678Service activities 4 185 10,205Total 156 3,132 186,080
Source: Authors' calculation.
41

Table 3.3 Definition of Variables
Variable name Definition
TFP Multilateral TFP index (see Appendix)
ROA Return on assets measured as:(after-tax profits +interest payments)/total assets
log(size) Firm size measured as the log of the number of workers
Age Number of years since the foundation of the firm
Number of non-productionworkers/number of workers
Quality of firms' human capital measured as the share of non-production workers
R&D intensity R&D expenditure divided by total sales
Advertising intensity Advertising expenditure divided by total sales
Export intensity Export ratio measured as exports divided by total sales
Debt/total assets Debt-asset ratio measured as total liabilities divided by total assets
42

Table 3.4 What Firms are Chosen as Acquisition Targets? Probit AnalysisDependent variable
Coef. z-value Coef. z-value Coef. z-value Coef. z-valueTFP(t-1) 0.898 2.69 *** -0.071 -0.48 0.218 2.10 ** -0.007 -0.15
ROA(t-1) 0.184 2.97 *** 0.837 4.24 *** -0.011 -0.09 -0.283 -1.95 *
log(size)(t-1) 0.095 3.06 *** 0.064 1.28 -0.020 -1.50 0.003 0.21
Age(t-1) -0.017 -5.75 *** -0.021 -6.47 *** -0.006 -7.31 *** -0.007 -8.47 ***
(Number of non-productionworkers/number of workers)(t-1) 0.516 3.44 *** -0.024 -0.46
R&D intensity(t-1) 1.386 1.25 -0.828 -1.20
Advertising intensity(t-1) -1.443 -0.59 3.833 4.55 *** -1.594 -1.23 -0.468 -0.63
Export intensity(t-1) 1.009 5.18 *** -0.157 -1.18
(Debt/total assets)(t-1) -0.022 -0.12 -0.387 -2.15 ** 0.246 7.72 *** 0.226 6.83 ***
Constant -6.769 -15.86 *** -0.632 0.00 *** -6.055 -6.84 *** -6.238 -9.60 ***
Obs.Pseudo R2 Notes: Estimated coefficients of year dummies and 3-digit industry dummies are not shown in the table. Z-values are White-corrected for heteroskedasticity.* Significant at the 10% level (two-tailed test).**Idem., 5%.*** Idem., 1%.
0.03140.1421 0.03967203337369
0.16308806052611
Out-in Acquisitions In-in Acquisitions
Manufacturing Non-Manufacturing(1) (4)
Manufacturing Non-Manufacturing(3)(2)
43

Table 3.5 Dynamic Effects of Acquisition on TFP Growth: Manufacturing Sector
VariableCoef. t-value Coef. t-value Coef. t-value Coef. t-value
Out-in -0.006 -0.33 0.011 0.68 0.042 2.25 ** 0.012 0.81
In-in 0.001 0.34 0.003 0.74 0.006 1.75 * 0.012 3.18 ***
TFP -0.391 -16.02 *** -0.450 -17.83 *** -0.496 -18.82 *** -0.491 -13.90 ***
ROA -0.046 -1.15 -0.040 -1.10 -0.009 -0.30 -0.005 -0.17
log(size) 0.011 19.13 *** 0.012 20.61 *** 0.014 21.80 *** 0.015 20.32 ***
Age 0.000 -8.93 *** 0.000 -8.93 *** 0.000 -9.88 *** 0.000 -10.74 ***
Number of non-productionworkers/number of workers 0.012 6.91 *** 0.017 8.52 *** 0.018 8.34 *** 0.018 6.78 ***
R&D intensity 0.318 7.74 *** 0.284 6.02 *** 0.337 6.56 *** 0.343 4.97 ***
Advertising intensity 0.094 1.46 0.101 1.44 0.089 1.22 0.113 1.27
Export intensity 0.009 1.64 0.014 2.18 ** 0.014 1.94 * 0.016 2.10 **
Debt/total assets -0.008 -2.71 *** -0.008 -2.63 *** -0.007 -2.17 ** -0.003 -0.64
Constant -0.018 -0.19 0.115 10.89 *** 0.098 9.81 *** 0.042 3.51 ***
Obs.R-squared Notes: Estimated coefficients of year dummies and 3-digit industry dummies are not shown in the table. White-corrected t-values are reported in the table.* Significant at the 10% level (two-tailed test).**Idem., 5%.*** Idem., 1%.
Manufacturing Sector
(1) (2) (3) (4)Dependent variable: Growth Rate of Total Factor Productivity
2 windows((t+1)-(t-1)) 3 windows((t+2)-(t-1)) 4 windows((t+3)-(t-1)) 5 windows((t+4)-(t-1))
72585 59306 47467 363900.2833 0.3170 0.3433 0.3919
44

Table 3.6 Dynamic Effects of Acquisition on ROA Improvement: Manufacturing Sector
VariableCoef. t-value Coef. t-value Coef. t-value Coef. t-value
Out-in -0.008 -0.57 0.011 1.06 0.022 1.71 * 0.021 2.18 **
In-in -0.004 -1.28 -0.002 -0.92 -0.002 -1.03 0.001 0.29
TFP 0.075 5.20 *** 0.073 6.33 *** 0.060 4.44 *** 0.065 5.35 ***
ROA -0.884 -16.85 *** -0.918 -23.78 *** -0.917 -19.79 *** -0.941 -26.74 ***
log(size) -0.001 -3.08 *** -0.001 -2.54 ** 0.000 -0.66 -0.001 -1.28
Age 0.000 -13.17 *** 0.000 -15.82 *** 0.000 -14.23 *** 0.000 -15.32 ***
Number of non-productionworkers/number of workers 0.000 0.02 0.002 1.76 * 0.004 3.45 *** 0.005 3.30 ***
R&D intensity 0.031 1.63 0.001 0.03 -0.001 -0.03 0.010 0.39
Advertising intensity 0.111 3.61 *** 0.108 3.64 *** 0.072 3.18 *** 0.105 3.53 ***
Export intensity 0.014 5.16 *** 0.016 5.15 *** 0.016 4.32 *** 0.015 3.42 ***
Debt/total assets -0.011 -3.22 *** -0.007 -1.94 * -0.005 -1.17 -0.002 -0.47
Constant 0.170 9.01 *** 0.174 19.80 *** 0.177 16.36 *** 0.188 21.06 ***
Obs.R-squared Notes: Estimated coefficients of year dummies and 3-digit industry dummies are not shown in the table. White-corrected t-values are reported in the table.* Significant at the 10% level (two-tailed test).**Idem., 5%.*** Idem., 1%.
0.6888 0.7305 0.7088 0.754672585 59306 47467 36390
2 windows((t+1)-(t-1)) 3 windows((t+2)-(t-1)) 4 windows((t+3)-(t-1)) 5 windows((t+4)-(t-1))
Manufacturing Sector
(1) (2) (3) (4)Dependent variable: Difference in ROA
45

Table 3.7 Dynamic Effects of Acquisition on TFP Growth: Non-Manufacturing Sector
VariableCoef. t-value Coef. t-value Coef. t-value Coef. t-value
Out-in -0.016 -0.51 0.013 0.38 0.090 2.45 ** 0.053 1.02
In-in -0.004 -0.63 -0.003 -0.43 -0.008 -1.00 0.004 0.46
TFP -0.604 -65.57 *** -0.647 -66.97 *** -0.678 -66.97 *** -0.701 -63.17 ***
ROA -0.057 -2.42 ** -0.057 -2.68 *** -0.053 -2.35 ** -0.051 -2.57 ***
log(size) -0.010 -11.12 *** -0.011 -10.34 *** -0.010 -8.45 *** -0.011 -8.27 ***
Age 0.000 7.53 *** 0.000 6.55 *** 0.000 4.08 ** 0.000 3.44 ***
Advertising intensity -0.669 -11.31 *** -0.772 -13.51 *** -0.754 -12.18 *** -0.769 -10.58 ***
Debt/total assets -0.035 -8.87 *** -0.042 -9.25 *** -0.037 -7.19 *** -0.027 -4.33 ***
Constant 0.169 6.82 *** 0.138 4.43 *** 0.140 3.94 *** 0.188 11.44 ***
Obs.R-squared Notes: Estimated coefficients of year dummies and 3-digit industry dummies are not shown in the table. White-corrected t-values are reported in the table.* Significant at the 10% level (two-tailed test).**Idem., 5%.*** Idem., 1%.
Non-manufacturing Sector
(1) (2) (3) (4)Dependent variable: Growth Rate of Total Factor Productivity
2 windows((t+1)-(t-1)) 3 windows((t+2)-(t-1)) 4 windows((t+3)-(t-1)) 5 windows((t+4)-(t-1))
55425 43155 33991 256400.4287 0.4395 0.4503 0.4755
46

Table 3.8 Dynamic Effects of Acquisition on ROA Improvement: Non-Manufacturing Sector
VariableCoef. t-value Coef. t-value Coef. t-value Coef. t-value
Out-in 0.035 2.98 *** 0.058 4.75 *** 0.093 4.21 *** 0.087 2.50 **
In-in -0.003 -1.74 * -0.002 -0.98 -0.001 -0.56 -0.001 -0.58
TFP 0.007 3.70 *** 0.006 3.48 *** 0.006 3.71 *** 0.005 3.89 ***
ROA -0.861 -14.69 *** -0.898 -18.57 *** -0.925 -24.04 *** -0.943 -27.67 ***
log(size) 0.001 5.49 *** 0.001 4.06 *** 0.001 3.59 *** 0.001 1.89 *
Age 0.000 -11.02 *** 0.000 -11.90 *** 0.000 -13.42 *** 0.000 -13.94 ***
Advertising intensity 0.152 4.88 *** 0.140 3.82 *** 0.155 4.28 *** 0.181 4.59 ***
Debt/total assets -0.026 -6.24 *** -0.029 -7.52 *** -0.025 -6.85 *** -0.021 -5.53 ***
Constant 0.089 8.65 *** 0.094 8.25 *** 0.093 7.23 *** 0.083 7.64 ***
Obs.R-squared Notes: Estimated coefficients of year dummies and 3-digit industry dummies are not shown in the table. White-corrected t-values are reported in the table.* Significant at the 10% level (two-tailed test).**Idem., 5%.*** Idem., 1%.
0.7172 0.7707 0.8074 0.832255425 43155 33991 25640
2 windows((t+1)-(t-1)) 3 windows((t+2)-(t-1)) 4 windows((t+3)-(t-1)) 5 windows((t+4)-(t-1))
Non-Manufacturing Sector
(1) (2) (3) (4)Dependent variable: Difference in ROA
47

Table 3.9 Dynamic Effects of Acquisition on TFP Growth: Domestic Acquisitions (Within Group and By Outsiders) and Acquisitions by Foreigners in the Manufacturing Sector
VariableCoef. t-value Coef. t-value Coef. t-value Coef. t-value
Out-in -0.006 -0.32 0.011 0.69 0.043 2.27 ** 0.013 0.83
In-in (within group) 0.007 1.38 0.007 1.13 0.020 3.1 *** 0.021 2.85 ***
In-in (by outsider) -0.001 -0.26 0.001 0.31 0.003 0.66 0.010 2.31 **
TFP -0.391 -16.03 *** -0.450 -17.83 *** -0.496 -18.82 *** -0.491 -13.9 ***
ROA -0.045 -1.15 -0.040 -1.10 -0.009 -0.3 -0.005 -0.17
log(size) 0.011 19.13 *** 0.012 20.61 *** 0.014 21.8 *** 0.015 20.32 ***
Age -0.0003 -8.94 *** -0.0003 -8.93 *** -0.0004 -9.89 *** -0.0005 -10.74 ***
Number of non-productionworkers/number of workers 0.012 6.91 *** 0.017 8.52 *** 0.018 8.35 *** 0.018 6.79 ***
R&D intensity 0.318 7.75 *** 0.284 6.02 *** 0.337 6.57 *** 0.343 4.97 ***
Advertising intensity 0.094 1.46 0.101 1.44 0.089 1.22 0.113 1.28
Export intensity 0.009 1.64 0.014 2.18 ** 0.014 1.92 * 0.016 2.09 **
Debt/total assets -0.008 -2.71 *** -0.008 -2.62 *** -0.007 -2.16 ** -0.003 -0.64
Constant -0.018 -0.19 0.115 10.89 *** 0.098 9.81 *** 0.042 3.51 ***
Obs.R-squared Notes: Estimated coefficients of year dummies and 3-digit industry dummies are not shown in the table. White-corrected t-values are reported in the table.* Significant at the 10% level (two-tailed test).**Idem., 5%.*** Idem., 1%.
Manufacturing sector
(1) (2) (3) (4)Dependent variable: Growth Rate of Total Factor Productivity
2 windows((t+1)-(t-1)) 3 windows((t+2)-(t-1)) 4 windows((t+3)-(t-1)) 5 windows((t+4)-(t-1))
72585 59306 47467 363900.2834 0.3170 0.3433 0.3919
48

Table 3.10 Dynamic Effects of Acquisition on ROA Improvement: Domestic Acquisitions (Within Group and By Outsiders) and Acquisitions by Foreigners in the Manufacturing Sector
VariableCoef. t-value Coef. t-value Coef. t-value Coef. t-value
Out-in -0.008 -0.58 0.011 1.04 0.022 1.70 * 0.021 2.14 **
In-in (within group) -0.006 -1.83 * -0.008 -1.91 ** -0.004 -1.04 -0.007 -1.50
In-in (by outsider) -0.003 -0.80 0.000 -0.06 -0.002 -0.74 0.003 0.87
TFP 0.075 5.20 *** 0.073 6.33 *** 0.060 4.44 *** 0.065 5.35 ***
ROA -0.884 -16.85 *** -0.918 -23.79 *** -0.917 -19.79 *** -0.941 -26.75 ***
log(size) -0.001 -3.08 *** -0.001 -2.54 ** 0.000 -0.65 -0.001 -1.27
Age 0.000 -13.18 *** 0.000 -15.82 *** 0.000 -14.23 *** 0.000 -15.33 ***
Number of non-productionworkers/number of workers 0.000 0.02 0.002 1.76 * 0.004 3.45 *** 0.005 3.29 ***
R&D intensity 0.031 1.63 0.000 0.03 -0.001 -0.04 0.010 0.39
Advertising intensity 0.111 3.61 *** 0.108 3.64 *** 0.072 3.18 *** 0.105 3.53 ***
Export intensity 0.014 5.16 *** 0.016 5.16 *** 0.016 4.32 *** 0.015 3.44 ***
Debt/total assets -0.011 -3.22 *** -0.007 -1.95 * -0.005 -1.17 -0.002 -0.48
Constant 0.170 9.01 *** 0.174 19.80 *** 0.177 16.36 *** 0.188 21.07 ***
Obs.R-squared Notes: Estimated coefficients of year dummies and 3-digit industry dummies are not shown in the table. White-corrected t-values are reported in the table.* Significant at the 10% level (two-tailed test).**Idem., 5%.*** Idem., 1%.
Manufacturing sector
(1) (2) (3) (4)Dependent variable: Difference in ROA
2 windows((t+1)-(t-1)) 3 windows((t+2)-(t-1)) 4 windows((t+3)-(t-1)) 5 windows((t+4)-(t-1))
72585 59306 47467 363900.6888 0.7305 0.7088 0.7546
49

Table 3.11 Dynamic Effects of Acquisition on TFP Growth: Domestic Acquisitions (Within Group and By Outsiders) and Acquisitions by Foreigners in the Non-Manufacturing Sector
VariableCoef. t-value Coef. t-value Coef. t-value Coef. t-value
Out-in -0.016 -0.51 0.013 0.38 0.090 2.45 ** 0.053 1.02
In-in (within group) -0.006 -0.29 -0.027 -1.38 0.015 0.71 0.050 1.72 *
In-in (by outsider) -0.003 -0.56 0.000 -0.03 -0.011 -1.29 -0.001 -0.06
TFP -0.604 -65.57 *** -0.647 -66.98 *** -0.678 -66.95 *** -0.701 -63.17 ***
ROA -0.057 -2.42 ** -0.057 -2.69 *** -0.053 -2.35 ** -0.051 -2.56 ***
log(size) -0.010 -11.12 *** -0.011 -10.34 *** -0.010 -8.45 *** -0.011 -8.26 ***
Age 0.000 7.53 *** 0.000 6.55 *** 0.000 4.08 *** 0.000 3.44 ***
Advertising intensity -0.669 -11.30 *** -0.772 -13.50 *** -0.754 -12.17 *** -0.768 -10.57 ***
Debt/total assets -0.035 -8.87 *** -0.042 -9.25 *** -0.037 -7.19 *** -0.027 -4.32 ***
Constant 0.169 6.82 *** 0.138 4.43 *** 0.140 3.94 *** 0.188 11.44 ***
Obs.R-squared Notes: Estimated coefficients of year dummies and 3-digit industry dummies are not shown in the table. White-corrected t-values are reported in the table.* Significant at the 10% level (two-tailed test).**Idem., 5%.*** Idem., 1%.
Non-manufacturing sector
(1) (2) (3) (4)Dependent variable: Growth Rate of Total Factor Productivity
2 windows((t+1)-(t-1)) 3 windows((t+2)-(t-1)) 4 windows((t+3)-(t-1)) 5 windows((t+4)-(t-1))
55425 43155 33991 256400.4287 0.4396 0.4504 0.4755
50
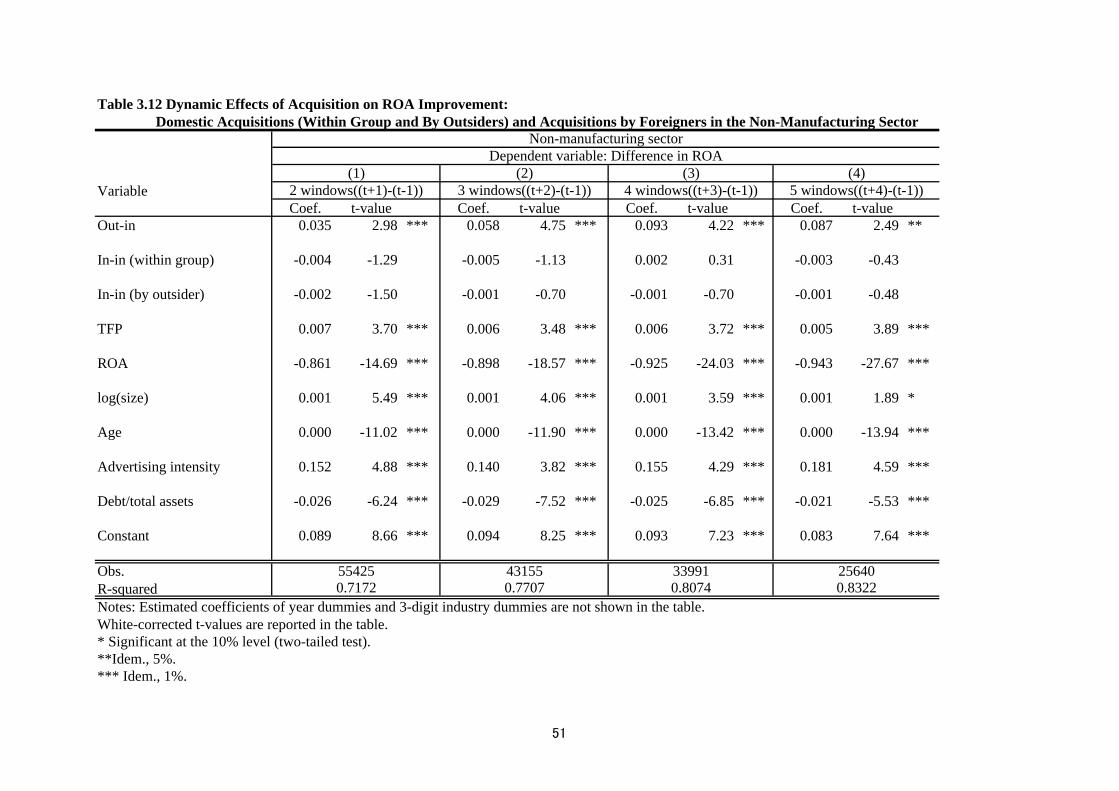
Table 3.12 Dynamic Effects of Acquisition on ROA Improvement: Domestic Acquisitions (Within Group and By Outsiders) and Acquisitions by Foreigners in the Non-Manufacturing Sector
VariableCoef. t-value Coef. t-value Coef. t-value Coef. t-value
Out-in 0.035 2.98 *** 0.058 4.75 *** 0.093 4.22 *** 0.087 2.49 **
In-in (within group) -0.004 -1.29 -0.005 -1.13 0.002 0.31 -0.003 -0.43
In-in (by outsider) -0.002 -1.50 -0.001 -0.70 -0.001 -0.70 -0.001 -0.48
TFP 0.007 3.70 *** 0.006 3.48 *** 0.006 3.72 *** 0.005 3.89 ***
ROA -0.861 -14.69 *** -0.898 -18.57 *** -0.925 -24.03 *** -0.943 -27.67 ***
log(size) 0.001 5.49 *** 0.001 4.06 *** 0.001 3.59 *** 0.001 1.89 *
Age 0.000 -11.02 *** 0.000 -11.90 *** 0.000 -13.42 *** 0.000 -13.94 ***
Advertising intensity 0.152 4.88 *** 0.140 3.82 *** 0.155 4.29 *** 0.181 4.59 ***
Debt/total assets -0.026 -6.24 *** -0.029 -7.52 *** -0.025 -6.85 *** -0.021 -5.53 ***
Constant 0.089 8.66 *** 0.094 8.25 *** 0.093 7.23 *** 0.083 7.64 ***
Obs.R-squared Notes: Estimated coefficients of year dummies and 3-digit industry dummies are not shown in the table. White-corrected t-values are reported in the table.* Significant at the 10% level (two-tailed test).**Idem., 5%.*** Idem., 1%.
Non-manufacturing sector
(1) (2) (3) (4)Dependent variable: Difference in ROA
2 windows((t+1)-(t-1)) 3 windows((t+2)-(t-1)) 4 windows((t+3)-(t-1)) 5 windows((t+4)-(t-1))
55425 43155 33991 256400.7172 0.7707 0.8074 0.8322
51
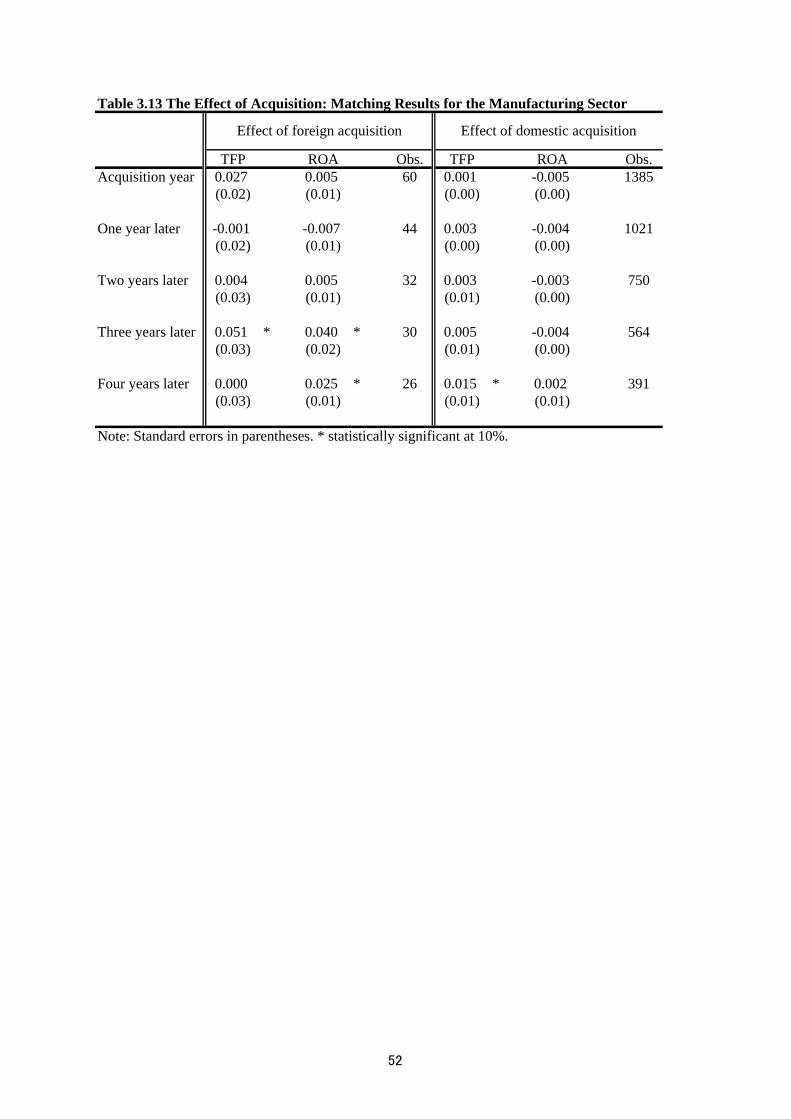
Table 3.13 The Effect of Acquisition: Matching Results for the Manufacturing Sector
TFP ROA Obs. TFP ROA Obs.Acquisition year 0.027 0.005 60 0.001 -0.005 1385
(0.02) (0.01) (0.00) (0.00)
One year later -0.001 -0.007 44 0.003 -0.004 1021(0.02) (0.01) (0.00) (0.00)
Two years later 0.004 0.005 32 0.003 -0.003 750(0.03) (0.01) (0.01) (0.00)
Three years later 0.051 * 0.040 * 30 0.005 -0.004 564(0.03) (0.02) (0.01) (0.00)
Four years later 0.000 0.025 * 26 0.015 * 0.002 391(0.03) (0.01) (0.01) (0.01)
Note: Standard errors in parentheses. * statistically significant at 10%.
Effect of foreign acquisition Effect of domestic acquisition
52

Table 3.14 The Effect of Acquisition: Matching Results for the Non-Manufacturing Sector
TFP ROA TFP ROAAcquisition year 0.028 -0.003 72 0.004 -0.001 1435
(0.04) (0.01) (0.01) (0.00)
One year later 0.041 0.031 44 0.009 -0.001 933(0.05) (0.02) (0.01) (0.00)
Two years later 0.093 0.034 29 -0.004 -0.001 604(0.06) (0.03) (0.02) (0.00)
Three years later 0.201 ** 0.069 * 20 0.010 -0.002 434(0.10) (0.04) (0.02) (0.01)
Four years later -0.115 0.011 10 0.036 -0.005 276(0.10) (0.09) (0.02) (0.00)
Note: Standard errors in parentheses. *, ** statistically significant at 10% and 5%.
Effect of foreign acquisition Effect of domestic acquisition
53

Lagged variables Obs Mean Std. Dev. Min. Max.TFP 163,812 -0.004 0.204 -5.554 4.024ROA 163,812 0.048 0.094 -13.249 15.504log(size) 163,812 5.237 0.998 3.912 11.563Age 163,812 36.101 15.502 0.000 125.000Number of non-productionworkers/number of workers 163,812 0.606 0.368 0.000 1.000
R&D expenditure/sales 163,812 0.006 0.030 0.000 7.339Advertising expenditure/sales 163,812 0.006 0.019 0.000 3.009Export/sales 163,812 0.022 0.082 0.000 1.090Debt/total assets 163,812 0.739 0.277 0.000 12.383
Lagged variables Obs Mean Std. Dev. Min. Max.TFP 90,075 -0.010 0.127 -4.468 1.297ROA 90,075 0.049 0.098 -13.249 15.504log(size) 90,075 5.259 1.007 3.912 11.254Age 90,075 37.471 15.315 0.000 111.000Number of non-productionworkers/number of workers 90,075 0.339 0.250 0.000 1.000
R&D expenditure/sales 90,075 0.009 0.021 0.000 0.734Advertising expenditure/sales 90,075 0.005 0.019 0.000 3.009Export/sales 90,075 0.031 0.097 0.000 1.090Debt/total assets 90,075 0.704 0.274 0.000 8.101
Lagged variables Obs Mean Std. Dev. Min. Max.TFP 73,737 0.002 0.270 -5.554 4.024ROA 73,737 0.046 0.089 -3.928 12.229log(size) 73,737 5.211 0.987 3.912 11.563Age 73,737 34.427 15.565 0.000 125.000Advertising expenditure/sales 73,737 0.008 0.018 0.000 0.528Debt/total assets 73,737 0.781 0.274 0.000 12.383
Manufacturing sector
Appendix Table 1. Summary Statistics
Non-manufacturing sector
Whole sample
54

Appendix Table 2. Balancing Tests for Matching: Manufacturing Sector
% reduct % reductVariable Sample Treated Control % bias bias t p>t Treated Control % bias bias t p>t
TFP(t-1) Unmatched 0.062 -0.008 48.2 4.41 0.000 -0.013 -0.010 -2.3 -0.9 0.385Matched 0.044 0.068 -16.1 66.7 -0.87 0.386 -0.012 -0.011 -0.4 81.3 -0.1 0.907
ROA(t-1) Unmatched 0.088 0.052 40.6 3.01 0.003 0.050 0.049 0.8 0.3 0.789Matched 0.079 0.095 -17.5 56.8 -0.95 0.346 0.050 0.048 2.9 -261.8 0.9 0.397
log(size)(t-1) Unmatched 5.727 5.324 37.2 3.13 0.002 5.160 5.265 -10.8 -3.9 0.000Matched 5.692 5.673 1.8 95 0.09 0.928 5.152 5.136 1.7 84.2 0.5 0.626
Age(t-1) Unmatched 29.169 36.837 -49 -4.09 0.000 32.824 37.523 -30.1 -11.4 0.000Matched 30.650 31.867 -7.8 84.1 -0.42 0.673 32.775 32.721 0.3 98.8 0.1 0.926
Unmatched 0.505 0.329 66.6 5.95 0.000 0.318 0.336 -6.8 -2.6 0.009Matched 0.486 0.512 -9.5 85.7 -0.46 0.650 0.317 0.333 -6.3 7.5 -1.6 0.102
R&D intensity(t-1) Unmatched 0.027 0.012 46.3 5.4 0.000 0.007 0.010 -10.2 -3.6 0.000Matched 0.029 0.030 -2.5 94.7 -0.1 0.920 0.007 0.008 -0.6 94.1 -0.2 0.865
Advertising intensity(t-1) Unmatched 0.008 0.004 18.8 1.47 0.142 0.003 0.005 -7.3 -2.5 0.011Matched 0.008 0.012 -16.8 10.7 -1.04 0.300 0.003 0.003 0.6 91.5 0.2 0.829
Export intensity(t-1) Unmatched 0.118 0.040 48.4 5.78 0.000 0.024 0.032 -8.4 -3.0 0.003Matched 0.100 0.095 2.7 94.4 0.13 0.893 0.024 0.027 -3.3 60.8 -0.9 0.381
(Debt/total assets) (t-1) Unmatched 0.650 0.704 -19.2 -1.61 0.107 0.778 0.703 25.7 10.1 0.000Matched 0.650 0.558 32.7 -70.1 1.83 0.070 0.774 0.766 2.8 89.0 0.8 0.413
(Number of non-productionworkers/number of
Foreign acquisition Domestic acquisitiont-test t-testMean Mean
55

Appendix Table 3. Balancing Tests for Matching: Non-Manufacturing Sector
% reduct % reductVariable Sample Treated Control % bias bias t p>t Treated Control % bias bias t p>t
TFP(t-1) Unmatched 0.015 0.021 -2.2 -0.18 0.856 -0.005 0.003 -2.8 -1.1 0.288Matched 0.015 0.035 -7.3 -233.1 -0.4 0.691 -0.005 0.013 -6.3 -126.0 -1.7 0.095
ROA(t-1) Unmatched 0.108 0.047 65.7 7.57 0.000 0.041 0.046 -6.1 -2.1 0.035Matched 0.108 0.079 31 52.8 1.71 0.089 0.041 0.046 -6.6 -8.2 -1.7 0.088
log(size)(t-1) Unmatched 5.266 5.145 11.5 1.1 0.270 5.234 5.209 2.5 0.9 0.353Matched 5.266 5.209 5.4 52.9 0.33 0.744 5.233 5.257 -2.4 2.1 -0.7 0.516
Age(t-1) Unmatched 21.125 34.890 -87.5 -7.39 0.000 29.372 34.476 -33.2 -12.4 0.000Matched 21.125 22.792 -10.6 87.9 -0.65 0.518 29.333 28.989 2.2 93.3 0.6 0.540
Advertising intensity(t-1) Unmatched 0.025 0.007 49.5 7.25 0.000 0.008 0.008 4.5 1.9 0.062Matched 0.025 0.030 -16 67.6 -0.63 0.530 0.008 0.008 0.3 94.2 0.1 0.941
(Debt/total assets) (t-1) Unmatched 0.730 0.777 -18 -1.48 0.140 0.864 0.780 28.2 11.5 0.000Matched 0.730 0.731 -0.4 97.7 -0.03 0.980 0.863 0.846 5.9 79.1 1.4 0.166
Foreign acquisition Domestic acquisitiont-test t-testMean Mean
56