Embed Size (px)
Citation preview

2012/13
ANNUAL
Enrich quality of life
REPORT


ISSN: 1838-5575
© Queensland Urban Utilities 2013
About this report
This report details Queensland Urban Utilities’
performance during the 2012/13 financial year. It
gives us the opportunity to report on our operational,
environmental, social, and financial performance
against our key business objectives and targets as set
out in our corporate and operational plans. This report
also outlines the challenges we have experienced and
highlights our achievements. It is structured around our
2012-17 corporate objectives, to:
• deliver service that is valued and trusted by customers
and the community,
• focus on business efficiency and continuity,
• keep our people safe, capable and dedicated,
• maintain appropriate financial performance,
• deliver sustainable growth.
Readership
This report aims to communicate comprehensive
information to satisfy the needs of individuals and
groups who are affected by, or have an interest in, our
activities, including, but not limited to:
• our residential and commercial customers,
• the community,
• our employees,
• shareholding councils,
• government departments.
We are committed to open and accountable governance,
and welcome your feedback on our reporting.
Interpreter service statement:
Queensland Urban Utilities is committed to providing
accessible services to our customers and stakeholders
from culturally and linguistically diverse backgrounds.
If you have difficulty in understanding the annual
report, please contact us on 13 14 50 and we will
arrange an interpreter to communicate the report to
you effectively.
Enquiries
Where possible, readers are encouraged to download
the report online at www.urbanutilities.com.au/
annualreport. Where this is not possible, printed copies
are available using one of the contact options below.
Level 2, 15 Green Square Close
Fortitude Valley QLD 4006
Office hours: 8:00am – 5:00pm
T: 13 26 57 (7am – 7pm weekdays)
For more information on any of the initiatives, projects or
services mentioned in this report, visit the Queensland
Urban Utilities website at: www.urbanutilities.com.au.

ABN 86 673 835 011
GPO Box 2765
Brisbane QLD 4001
General Enquiries 13 26 57
Faults & Emergencies 13 23 64
www.urbanutilities.com.au
Hon. Mark McArdle, MP
Minister for Energy and Water Supply
PO Box 15456
CITY EAST QLD 4002
20 September 2013
Dear Minister
I am pleased to present the annual Report 2012/13 for the Central SEQ Distributor-Retailer Authority trading as
Queensland Urban Utilities.
I certify that this annual report complies with:
• the prescribed requirements of the financial accountability act 2009 and the financial and Performance Management
Standard 2009; and
• the detailed requirements set out in the annual Report Requirements for queensland Government agencies.
A checklist outlining the annual reporting requirement can be found at: www.urbanutilities.com.au/annualreport.
Yours sincerely,
Geoff Harley
Board Chairman
Central SEQ Distributor-Retailer Authority trading as Queensland Urban Utilities
Queensland Urban Utilities Annual Report 2012/13i
1 Introduction
Who are we
On 1 July 2010, Queensland Urban Utilities was
established as a statutory body to be a distributor-
retailer under the provision of the South east queensland
Water (Distribution and Retail Restructuring) act 2009 and
as a service provider under the Water Supply (Safety and
Reliability) act 2008.
Our shareholders are Brisbane, Ipswich, Lockyer Valley,
Scenic Rim, and Somerset councils and we are governed
by an independent Board.
What we do
Queensland Urban Utilities is primarily responsible for
delivering drinking water, recycled water and sewerage
services to a population of more than 1.3 million in
South East Queensland.
In 2012/13, we:
• supplied around 132,000ML of tap water to
516,000 residential dwellings and 37,000
commercial properties,
• supplied around 9,700ML of recycled water to
110 businesses,
• supplied around 2,900ML of recycled water to the
Western Corridor Recycled Water Scheme,
• removed and treated around 128,000ML of sewage
from 492,000 residential dwellings and 34,000
commercial properties, including 5,200 trade waste
customers,
• responded to more than 24,000 written customer
enquiries,
• answered more than 300,000 customer phone calls,
• employed more than 1,400 staff.
These services are delivered via our $4.5 billion
infrastructure network, which includes:
• 125 water reservoirs,
• 41 water pump stations,
• 107 water boosters,
• 336 sewage pump stations,
• 27 sewage treatment plants,
• 8,967km of water mains,
• 9,152km of sewerage mains.
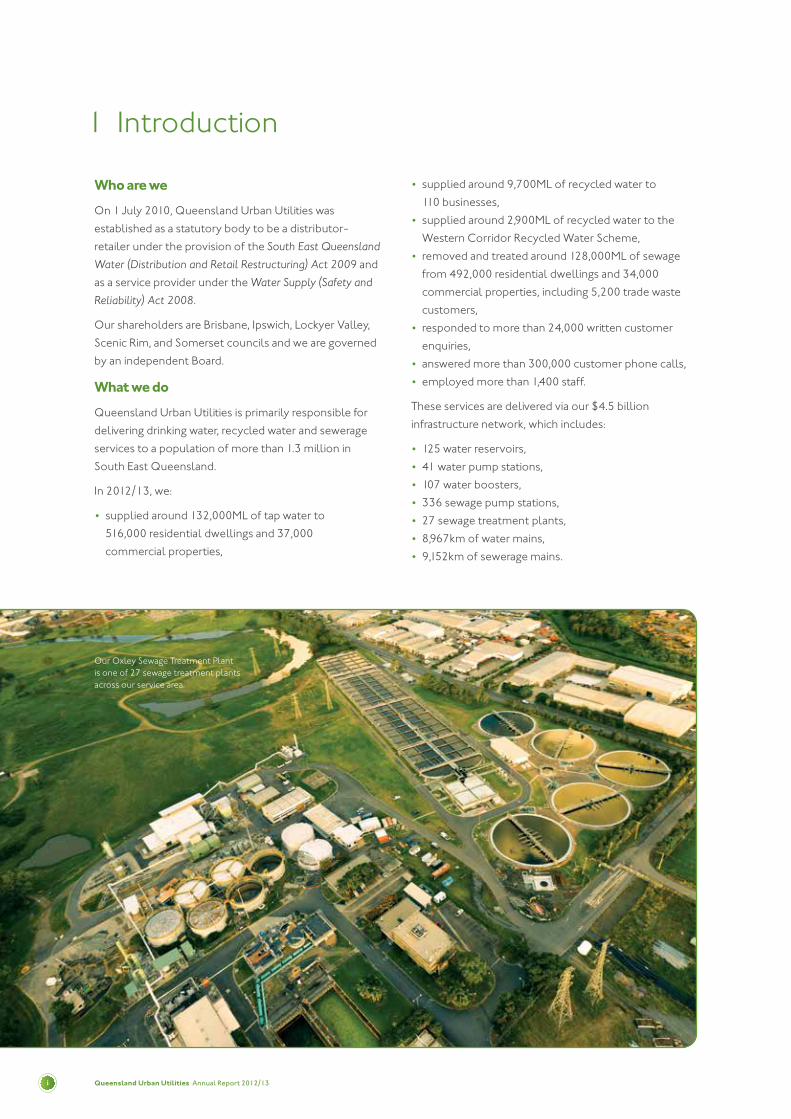
Our Oxley Sewage Treatment Plant is one of 27 sewage treatment plants across our service area.
Queensland Urban Utilities Annual Report 2012/13 ii
To support our core services, we undertake the following functions:
1. Provision for water distribution, sewage transportation and treatment including:
• demand forecasting and management,
• asset planning,
• asset management and alterations.
2. Customer interface and service provision relating to:
• water meter management and data,
• residential billing and customer management,
• bulk water billing and contract management,
• direct supply to large commercial customers, including trade waste management,
• development assessments.
3. Enabling functions for business sustainability including:
• strategy deployment,
• financial and people management,
• legal, governance and risk management,
• environmental management,
• community, shareholder and stakeholder management,
• regulatory and legislative compliance,
• information, communication and technology management,
• procurement and contract management.

Queensland Urban Utilities Annual Report 2012/1300
N
E
S
W
Figure 1 – Our service area is made up of five service territories.

Queensland Urban Utilities Annual Report 2012/13 iv
Our service area
Our customer base lives within a 14,384km2 area,
equivalent to around two-thirds of South East
Queensland (see Figure 1). By geographical area, we are
the fourth-largest water utility in Australia.
Our service area stretches from Cape Moreton in
the east to the outskirts of Toowoomba in the west,
up to the Yabba State Forest in the north, and down to
the New South Wales border along the Scenic Rim in
the south.
Our operating environment
On 1 January 2013, the environment in which
Queensland Urban Utilities operates was reformed
under the South east queensland Water (Restructuring)
and other legislation amendment act 2012. The reform
saw three South East Queensland bulk water entities
(Seqwater, LinkWater and the SEQ Water Grid Manager)
amalgamated into one bulk water supplier, Seqwater. It
also abolished the Queensland Water Commission.
Queensland Urban Utilities’ relationship with other
participants in the South East Queensland water industry
can be seen in Figure 2.
Figure 2 – The South East Queensland water industry as at 1 January 2013.
Responsible for catchment, management, storage, treatment and transportation of bulk water. Sells treated drinking water to local government-owned authorities and council water distributors operating
from July 2010. Transports drinking water from Gold Coast Desalination Plant and Western Corridor through to power stations and Wivenhoe Dam. Transports water from treatment plants
and reservoirs through bulk pipeline networks and into the distribution networks.
These businesses are responsible for delivering potable, recycled and other water to customers, collecting and treating sewage, and charging for water and sewerage services.
Statutory bodies Council water distributors
Stat
e-ow
ned
auth
ority
Queensland Urban Utilities servicing customers in the Brisbane, Ipswich, Lockyer Valley, Scenic Rim and Somerset local authority areas.
Unitywater servicing customers in the
Sunshine Coast and Moreton Bay local authority areas.
Redland City Council
Gold Coast City Council
Logan City Council
Seqwater
Residential and commercial customers

Queensland Urban Utilities Annual Report 2012/13v
1 Introduction
Our stakeholders
We are committed to engaging with our stakeholders –
shareholders, customers, the community, developers, all
levels of government, regulators and relevant industry
groups – to identify and, ultimately, satisfy their needs
and expectations.
Our solid relationship with the state and federal
governments allows us to keep abreast of legislation
and regulations and ensure we continually fulfil our
responsibility to protect the environment and support
sustainable practices.
We maintain a strong relationship with our shareholders
by regularly reporting on our performance, consulting
on our strategic direction, and engaging at all levels
on operational matters that are pertinent to each
service territory.
We continue to strengthen our relationship with the
development industry. This year, we implemented
a number of process improvements and service
enhancements to better support developers. For
example, we held the first of our twice-yearly
Development Industry Forums, which enables us to gain
an insight into developers’ needs and expectations; we
launched a microsite specifically for developers, which
offers a range of services relating to new connections,
land use planning, trade waste and development
assessment; and introduced a Development
Relationship Manager role within the business to provide
support to the development industry.
Our relationship with fellow South East Queensland
water industry participants, suppliers, environmental
groups, and our Customer and Community Reference
Group allows us to work collaboratively to achieve
common goals.
Our strategy
In accordance with the requirements of the Central
Seq Distributor Retailer Participation agreement, we are
required to produce a five-year corporate plan annually.
Queensland Urban Utilities’ 2012–17 Corporate Plan
set our future direction, goals and priorities, as defined
by the Board and reaffirmed by our shareholders. It
conveyed our purpose to “enrich quality of life” and
our vision to be “recognised nationally as a leader in
the delivery of products and services, and valued as a
trusted partner by our customers and community”.
In 2012/13, our purpose and vision were supported by
five corporate objectives:
• deliver service that is valued and trusted by customers
and the community,
• focus on business efficiency and continuity,
• keep our people safe, capable and dedicated,
• maintain appropriate financial performance,
• deliver sustainable growth.
These objectives reinforced the commitment of
our Board and Executive Leadership Team to lead
Queensland Urban Utilities into a future defined by
efficiency, sustainability and growth.
As illustrated within this annual report, our actions and
initiatives delivered in 2012/13 have clearly linked to our
corporate objectives and have moved us closer towards
realising our vision and purpose.
Queensland Urban Utilities Annual Report 2012/13 vi
2 Table of contents
Introduction iWho we are i
What we do i
Our service area iv
Our operating environment iv
Our stakeholders v
Our strategy v
Chairman’s foreword 1
Chief Executive Officer’s foreword 2
Our structure 3Our Board 3
Our Leadership Team 8
Year in review 13Our highlights and challenges 13
Performance at a glance 15
Looking ahead – our five-year strategic outlook 17
Deliver service that is valued and trusted by our customers and the community 18
Case studyExpanding the scope of our social media activity 25
Case studyIn-house contact centre launch 26
Case studyJanuary 2013 flood event 27
Safe, capable and dedicated people 29
Case studyOur employee relations journey 33
Case studySafety: everyone, everywhere, every day 34
Delivering our services 35
Case studyEngineering solutions to benefit our customers 40
Case studyConsolidating technical standards 41
Case studyWoolloongabba Sewer Capacity Upgrade Project 42
Caring for the environment 43
Sustainable growth 46
Case studyPartnering with the community 50
Case studyScientific Analytical Services Laboratory 51
Corporate governance 53Lay solid foundations for management and oversight 53
Structure that adds value 54
Recognise and manage risk 55
Prudent asset management 56
Remunerate fairly and responsibly 57
Promote ethical and responsible decision-making 57
Make timely and balanced disclosures 58
Respect the rights of shareholders 58
Appropriate financial performance 60
Glossary 61

Queensland Urban Utilities Annual Report 2012/131
3 Chairman's foreword
Stakeholder engagement I am particularly proud of our move towards proactive stakeholder engagement – an approach that has been well-received by our five stakeholders.
The Board is committed to fostering strong and trusting relationships with our stakeholders and holds at least one board meeting in each of our stakeholders' service territories annually. In addition, the CEO and I regularly visit all five regions.
In late 2012, we appointed a full-time Councillor Relationship Manager to support the organisation in building positive and strong relationships with our stakeholders. To date, this appointment has proven highly beneficial.
In June 2013, we conducted an online External Stakeholder Satisfaction Survey, which was sent to the Mayors, Councillors and Chief Executives of our five councils, as well as other stakeholders.
While pleasing to see our satisfaction rating increase to 77.5%, the Board recognises that additional action is required to further strengthen our stakeholder relations, particularly with the development sector.
Capital program I am pleased to report that we delivered our 2012/13 capital program on-budget and on-schedule, with $261 million of infrastructure investment across our five service territories. This investment – part of our $3.2 billion investment over 10 years – will ensure we support the economic and population growth across our service area.
The Board will continue to oversee the delivery of Queensland Urban Utilities’ capital investment program, which supports both economic and population growth across our service territory. In 2013/14, we will invest over $300 million in water and sewerage infrastructure.
Minimising price increases We continued to demonstrate our commitment to South East Queensland families by limiting the increase to our 2013/14 water and sewerage prices to 3.9% (less than a dollar a week), despite rising costs and the need for significant investment in infrastructure projects.
We also experienced lower-than-forecast growth across our service area, which impacted our developer contributions and, in turn, our projected revenue. The Board will closely monitor the housing market in 2013/14, the performance of which will inform our financial decisions moving forward.
Development sector This year, the Board focused on strengthening our relationship with the development industry and will continue to do so moving forward.
In 2012/13, we made a number of improvements to better support developers. We held the first of our twice-yearly Development Industry Forums, which enables us to gain an insight into developers’ needs and expectations; we launched an information-rich microsite specifically for developers; and appointed a full-time Development Relationship Manager.
Corporate strategy and planning Significant work was completed during 2012/13 to produce our road map for the next five years - our 2013-18 Corporate Plan. This plan outlines our strategic direction that will keep us well on track to achieve our vision of being recognised for our excellence in water and sewerage services that meets the evolving needs of our customers and enhance our communities.
Our strategic direction is supported by four strategic pillars: customer, shareholders and communities, operational excellence, and people. Each pillar has key focus areas that will drive our improvement initiatives over the next five years.
The Board regularly reviews progress against the corporate plan and holds an annual strategic planning day to consider the future direction of the business.
In 2013/14, the Board will closely focus on the internal Enterprise Excellence Program. This program involves an organisation-wide review to identify and implement opportunities for improvement, which will help shape us into a sustainable and financially viable business.
Acknowledgements Thanks must go to our five stakeholders for their ongoing support and to my fellow Board members for their unwavering commitment and stewardship.
I would like to take this opportunity to thank Barry Ball, a founding Queensland Urban Utilities Board member, for his contributions over the past three years. Barry, whose term concluded on 30 June 2013, contributed a wealth of knowledge and experience across a range of disciplines, including water policy and infrastructure delivery.
I am enthusiastic about Queensland Urban Utilities’ future and look forward to building on our successes already realised.
Geoff Harley Board Chairman
Queensland Urban Utilities Annual Report 2012/13 2
4 Chief Executive Officer's foreword
Just over a year ago, in July 2012, it was with a great sense of honour and pride that I took on the role of Chief Executive Officer of Queensland Urban Utilities. It has been a rewarding 12 months during which the organisation has taken great
strides to improve our customer service, operational efficiency, and safety performance.
I am pleased to be able to highlight some of the more significant achievements below:
• Our ongoing Customer Experience Program has driven a number of process improvements, including a significant reduction in end-to-end timeframes for new connections. As a result of this program, we have seen our Customer Experience Score increase from 6.1 to 6.4 out of 10, which positions us favourably against well-established utilities.
• A Councillor Relationship Manager was appointed to foster strong and trusting relationships with shareholders by acting as a point of referral for issues or customer concerns that have not been resolved through our regular processes. To date, shareholder feedback on this role has been very positive.
• We achieved a major milestone when we began taking customer calls from our newly established in-house contact centre. To enhance our level of customer service, we introduced training programs for contact centre staff, which reduced the occurrence of errors from 7% to <1%.
• We increased our level of customer engagement and transparency by adopting a proactive approach to social media. Our Twitter and Facebook channels are now regularly utilised for a variety of mutually-beneficial purposes, including community education messages, customer liaison, and service interruption notifications.
I am proud to report that we completed a number of major capital projects in 2012/13, including the $115 million Goodna Sewage Treatment Plant Upgrade Project, the $62 million Woogaroo Sewer Upgrade Project, and the $5 million Toowong Sewer Upgrade Project. We also made significant progress on the $80 million Woolloongabba Sewer Upgrade Project, which is our largest capital works project to date in Brisbane.
While 2012/13 was a year of positive operational change, it was also one of significant transitional change.
Perhaps the greatest challenge we faced in 2012/13 was the delivery of our Information and Communication Technology (ICT) Separation Program – an exceptionally complex piece of work to establish stand-alone ICT services.
Over four stages, we separated all of our applications, software, data and infrastructure requirements on-time and without interruption to our customers.
We reached another significant milestone, when our Brisbane-based office staff moved from temporary accommodation in Roma Street to a new building in Fortitude Valley. This relocation will further establish our identity as a modern, efficient and customer- focused business.
We continue to foster an organisational culture that supports and encourages safety. In 2012/13 we implemented a number of safety initiatives to improve our performance, including safety induction DVDs for visitors to our worksites, safety training packages for staff, and robust medical assessments for our employees to ensure they are capable of safely conducting high-risk and manual activities.
The safety and well-being of our customers and staff was our primary concern when, in January 2013, the majority of our service area was ravaged by an extreme wet weather event. Thanks to our forward-planning and coordinated response with other agencies, we were able to minimise the potential impact on our customers and communities. I would like to express my heartfelt gratitude to those Queensland Urban Utilities staff who worked around-the-clock to serve our customers as efficiently as possible.
I would like to take this opportunity to thank not just those involved in this emergency event, but all Queensland Urban Utilities staff for their professionalism and dedication displayed throughout the year.
I would also like to extend my thanks to the Board for its ongoing leadership and guidance.
With a refreshed vision in place for the next five years, I look forward to leading Queensland Urban Utilities into a future where we will be recognised for our excellence in water and sewerage services that meet the evolving needs of our customers and enhance our communities.
Louise Dudley Chief Executive Officer
Queensland Urban Utilities Annual Report 2012/133
5 Our structure
5.1 Our Board
The Queensland Urban Utilities Board is made up of
independent members, each of whom contributes a
wealth of skills, knowledge and experience, including
public and private sector leadership across water
policy and governance; local government leadership;
finance and economic strategy; corporate
development; commercial and financial law; audit;
and infrastructure delivery.
As the highest level of governance, the Board carries out
its duties in accordance with:
• its governing legislation,
• the Central Seq Distributor Retailer
Participation agreement,
• the queensland urban utilities Board Charter,
• the highest levels of ethics and corporate governance.
The Board is accountable under the South east
queensland Water (Distribution and Retail Restructuring)
act 2009 and its regulations, and the Participation
Agreement between Queensland Urban Utilities and
our five shareholders.
The Board is responsible for setting and overseeing our
strategic direction, as well as providing guidance on high-
order operational matters.
The Board also ensures that we perform our functions
and exercise our powers in a proper, effective and
efficient manner and that we comply with planning and
reporting requirements.
In addition to these legislative requirements, the Board
protects and enhances the long-term shareholder value
and ensures sustainable returns.
To facilitate its efficient operation, the Board has
three committees:
i. Audit, Finance and Risk Committee,
ii. Strategic Asset Management Committee,
iii. Human Resources and Community Committee.
Each committee operates to a terms of Reference, which
describes its purpose, role, responsibilities, composition,
structure and membership requirements.
Our governance structure is outlined in Figure 3 on page
4 and our Board members are introduced on page 5.

Queensland Urban Utilities Annual Report 2012/13 4
Shareholders
Minister for Energy and Water Supply
Board
Human Resources and Community Committee
Strategic Asset Management Committee
Audit, Finance and Risk Committee
DelegationAssurance and Accountability
Customers CommunityEmployees
Executive Leadership Team
Executive Leader Planning Paul Belz
Executive Leader People and Safety
Jennifer Leis
Chief Financial Officer
Denise Dawson
Chief Operating Officer
Robin Lewis
Executive Leader Customer & Community
Justin Poulus (acting)
Chief Information Officer
Nina Meyers
Chief Executive Officer Louise Dudley
Office of the CEO
General Counsel and Board Secretary Tracey Moore
Executive Leader Governance Mark Letica
Figure 3 – Queensland Urban Utilities' governance structure.
Queensland Urban Utilities Annual Report 2012/135
5 Our structure
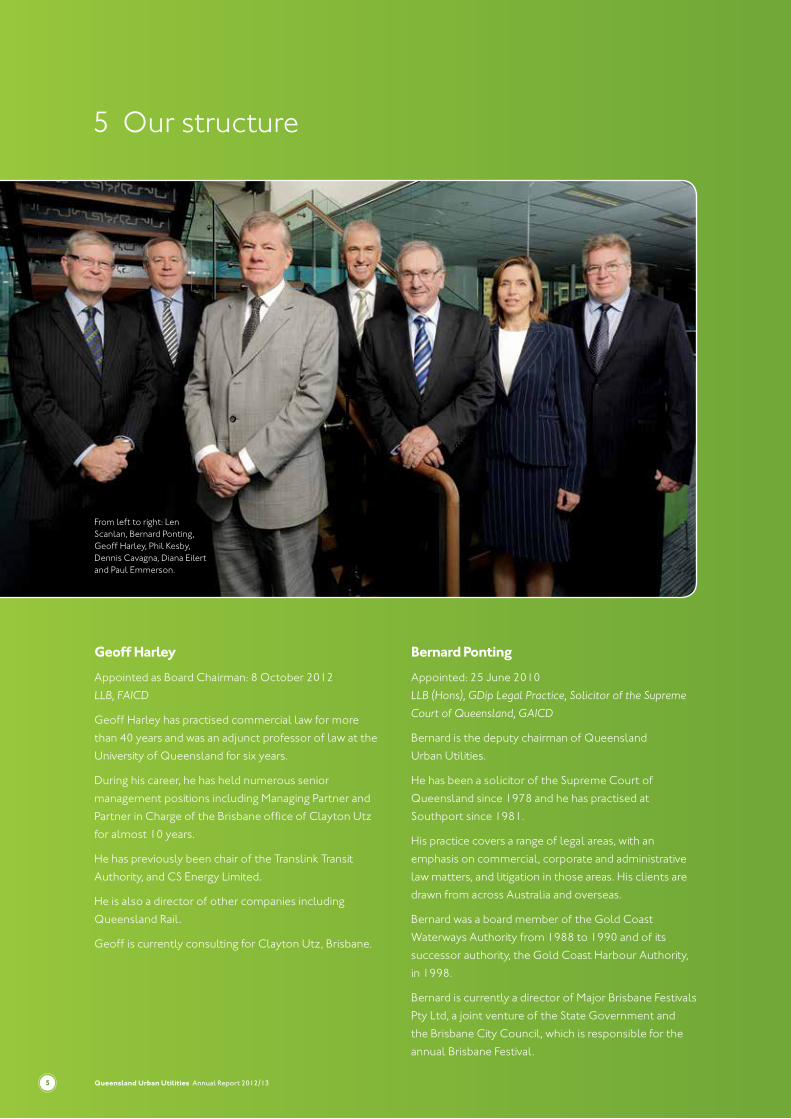
Geoff Harley
Appointed as Board Chairman: 8 October 2012
llB, faiCD
Geoff Harley has practised commercial law for more
than 40 years and was an adjunct professor of law at the
University of Queensland for six years.
During his career, he has held numerous senior
management positions including Managing Partner and
Partner in Charge of the Brisbane office of Clayton Utz
for almost 10 years.
He has previously been chair of the Translink Transit
Authority, and CS Energy Limited.
He is also a director of other companies including
Queensland Rail.
Geoff is currently consulting for Clayton Utz, Brisbane.
Bernard Ponting
Appointed: 25 June 2010
llB (Hons), GDip legal Practice, Solicitor of the Supreme
Court of queensland, GaiCD
Bernard is the deputy chairman of Queensland
Urban Utilities.
He has been a solicitor of the Supreme Court of
Queensland since 1978 and he has practised at
Southport since 1981.
His practice covers a range of legal areas, with an
emphasis on commercial, corporate and administrative
law matters, and litigation in those areas. His clients are
drawn from across Australia and overseas.
Bernard was a board member of the Gold Coast
Waterways Authority from 1988 to 1990 and of its
successor authority, the Gold Coast Harbour Authority,
in 1998.
Bernard is currently a director of Major Brisbane Festivals
Pty Ltd, a joint venture of the State Government and
the Brisbane City Council, which is responsible for the
annual Brisbane Festival.
From left to right: Len Scanlan, Bernard Ponting, Geoff Harley, Phil Kesby, Dennis Cavagna, Diana Eilert and Paul Emmerson.

Queensland Urban Utilities Annual Report 2012/13 6
Barry Ball (Not pictured)
Appointed: 25 June 2010
Beng (Civil), GDip Mgt, MaiCD
Barry is deputy director of the Global Change
Institute at the University of Queensland, and Water
Policy Manager for the International Water Centre.
He provides leadership in the area of water policy
and governance, institutional strengthening and
social change.
Barry held senior management positions with the
Brisbane City Council for more than 18 years and has
held many positions in organisations devoted to issues
of water, planning and natural disaster responses.
Barry’s roles within the water sector include being a
board member of the Water Sensitive Cities Cooperative
Research Centre and the Dow Centre for Sustainable
Engineering Innovation.
Barry is a registered professional engineer and was
awarded the Australian Public Service Medal for
Water Policy.
Barry's term on the Queensland Urban Utilities Board
concluded on 30 June 2013.
Dennis Cavagna
Appointed: 25 June 2010
Becon, GDip fin Planning, GaiCD, fCa
Dennis has a wealth of experience in leadership roles in
finance, economics and IT within the water and essential
services industries in Victoria.
His professional experience spans some 25 years
in the Victorian water industry, including leadership
positions with South East Water, Melbourne Water, the
Mornington Peninsula and District Water Board and the
Department of Water Resources.
Since 2007, as a commissioner of the Essential Services
Commission (the independent economic regulator in
Victoria), Dennis has been involved with the approval of
prices and the quality and reliability of essential utility
infrastructure services, including water services.
Dennis is also a board member with Parks Victoria as
well as an independent member of both the Risk and
Audit Committee of the Victorian Department
of Environment and Primary Industries and Audit
Committee of VicRoads.
Diana Eilert
Appointed: 25 June 2010
BSc (Maths), MComm (fin & Marketing), GaiCD
Diana is a professional non-executive director, appointed
to boards of Queensland Urban Utilities, ASX listed
digital business “onthehouse”, and AMP Life. She was
previously a non-executive director of realestate.com.au
(ASX:REA) and chair of GIO Australia and other
Suncorp subsidiaries.
Diana's executive career spans more than 25 years with
major roles including Group Executive, responsible
for Suncorp’s entire insurance business, and Group
Executive People, Technology, Marketing and Joint
Ventures for Suncorp. Diana also worked for 10 years
with Citibank where she ran retail credit and risk; the
mortgage business; retail funds management business;
and the direct bank. Diana built her strength in strategy
early in her career as a principal of AT Kearney and,
subsequently, as a partner of IBM Consulting. From 2009
until 2012, she gained extensive experience in digital
business models, strategy and transformation working
with News Ltd, initially consulting, then as head of
Strategy and Corporate Development.
Paul Emmerson
Appointed: 25 June 2010
BComm, llB, Solicitor of the Supreme Court of
qlD, GaiCD
Over the course of his career as a qualified solicitor,
certified practising accountant and registered tax
agent, Paul has also acquired first-hand regional and
rural business knowledge thanks to his extensive
experience in the manufacturing, food processing and
farming industries.
Paul has a particular interest in regional development,
with a focus on applied land-care and water issues, such
as securing a sustainable water supply for the Lockyer
Valley ‘food bowl’.
Paul remains heavily involved with water user groups,
including the Upper Lockyer Valley Water Users
Association, Lockyer Water Users Forum and South East
Queensland Western Catchment Groups.
Queensland Urban Utilities Annual Report 2012/137
5 Our structure
Phil Kesby
Appointed: 25 June 2010
CertConst (Hons), licensed Builder (NSW & qlD), GaiCD
Phil has more than 32 years’ experience in infrastructure
delivery and property related industries. He has
exceptional business and people skills and is highly
regarded for his expertise in relationship management
and stakeholder engagement.
Phil was Strategic Relationship Manager within the Thiess
Queensland Leadership Team and was responsible for
relationship management, stakeholder engagement and
marketing. Phil was at the forefront of cultural programs
that improved the personal and business environments
at Thiess.
Phil established his own consultancy practice in 2008,
which provides high-level mentoring and guidance in
the fields of relationship management, stakeholder
engagement and business development.
Len Scanlan
Appointed: 25 June 2010
BBus (acc), Ba (Gov’t/asian Studies/Public admin),
M Pub ad, faiCD
Len’s public sector career spanned 31 years and included
service with the Departments of Premier, Transport,
Auditor-General and the Queensland Treasury.
Len was Auditor-General of Queensland from 1997–
2004. Upon completing his term as Auditor-General,
Len commenced a portfolio career as an independent
private consultant, encompassing various activities in the
public and private sectors.
Len was an active member of CPA Australia for 30 years,
serving on numerous committees at local, state and
national levels, including time as state president.
Len is also chair of Brisbane City Council’s Audit
Committee and is an adjunct professor at The University
of Queensland.
Queensland Urban Utilities Annual Report 2012/13 8
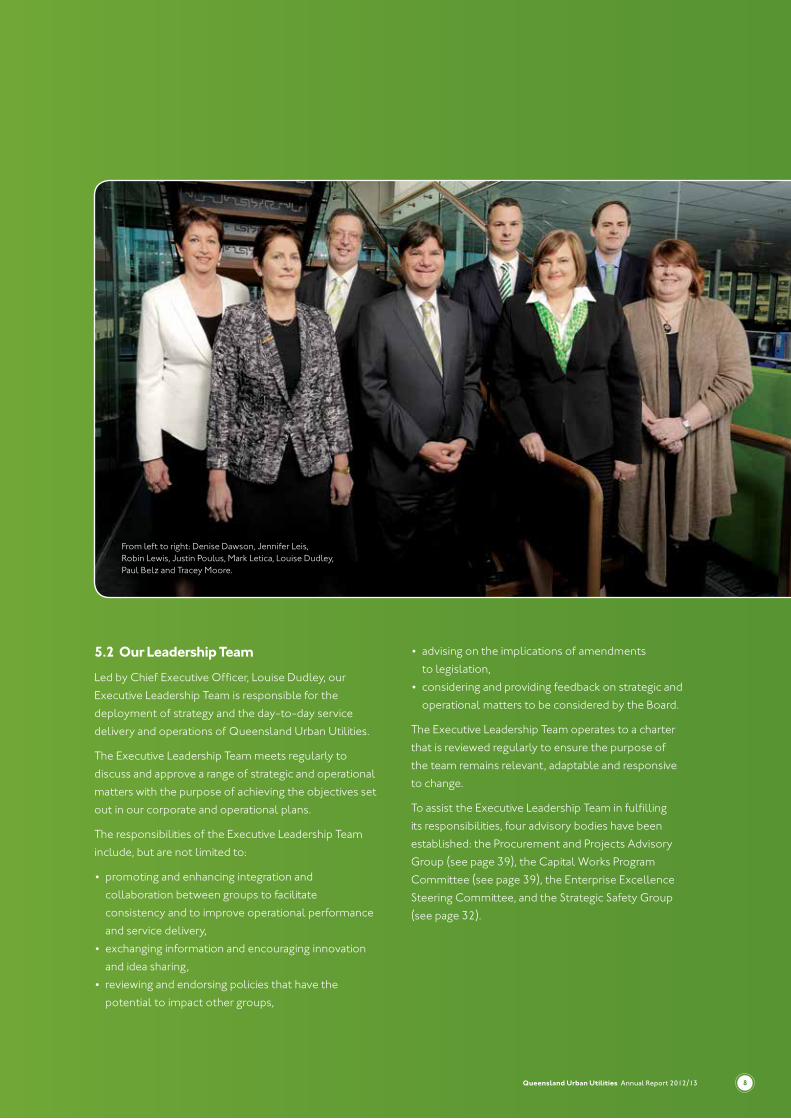
5.2 Our Leadership Team
Led by Chief Executive Officer, Louise Dudley, our
Executive Leadership Team is responsible for the
deployment of strategy and the day-to-day service
delivery and operations of Queensland Urban Utilities.
The Executive Leadership Team meets regularly to
discuss and approve a range of strategic and operational
matters with the purpose of achieving the objectives set
out in our corporate and operational plans.
The responsibilities of the Executive Leadership Team
include, but are not limited to:
• promoting and enhancing integration and
collaboration between groups to facilitate
consistency and to improve operational performance
and service delivery,
• exchanging information and encouraging innovation
and idea sharing,
• reviewing and endorsing policies that have the
potential to impact other groups,
• advising on the implications of amendments
to legislation,
• considering and providing feedback on strategic and
operational matters to be considered by the Board.
The Executive Leadership Team operates to a charter
that is reviewed regularly to ensure the purpose of
the team remains relevant, adaptable and responsive
to change.
To assist the Executive Leadership Team in fulfilling
its responsibilities, four advisory bodies have been
established: the Procurement and Projects Advisory
Group (see page 39), the Capital Works Program
Committee (see page 39), the Enterprise Excellence
Steering Committee, and the Strategic Safety Group
(see page 32).
From left to right: Denise Dawson, Jennifer Leis, Robin Lewis, Justin Poulus, Mark Letica, Louise Dudley, Paul Belz and Tracey Moore.

Queensland Urban Utilities Annual Report 2012/139
Louise Dudley
Chief Executive Officer
BCom, Ca, GaiCD
Louise was appointed Chief Executive Officer of
Queensland Urban Utilities on 2 July 2012, having
been part of the organisation since it was formed on
1 July 2010. Louise previously held the position of
Chief Financial Officer.
Louise played a key role in the creation of Queensland
Urban Utilities during her time as Executive Manager,
Water Retail, Brisbane City Council. This included a
major contribution to the successful transition of five
local authority water businesses into a single entity.
Louise enjoyed a seven-year career with Brisbane City
Council in senior management positions including
Director of Finance and Legal Water Transition Program;
Chief Procurement Officer; and Commercial Manager
Information, Communication and Technology Division.
Prior to joining Brisbane City Council, Louise spent 17
years with leading accounting and advisory firm KPMG,
and in a senior role with PresCare.
She is a Director on a number of Boards including
LGsuper, Water Services Association of Australia and
the Horizon Foundation Inc, a respected not-for-profit
organisation with a focus on delivering opportunities for
people with disabilities.
She is a qualified Chartered Accountant, has a
Bachelor of Commerce degree from the University
of Queensland, a Certificate of Superannuation
Management from Macquarie University, and is a
Graduate Member of the Australian Institute of
Company Directors.
Robin Lewis
Chief Operating Officer
Ba, CiWeM (uK), GaiCD
Robin is responsible for all operational aspects of
Queensland Urban Utilities, including water and
sewerage service delivery, water and wastewater quality
management, infrastructure maintenance, asset planning
and the delivery of our capital investment program.
He has gained significant private and public sector
water industry experience from both national and
international roles.
Prior to joining Queensland Urban Utilities, Robin held
management positions in Brisbane Water (Australia),
Watercare (New Zealand) and Severn Trent Water
(United Kingdom).
Robin has held board positions with the Advanced Water
Management Centre (University of Queensland) and
Water Services Association of Australia.
Paul Belz
Executive Leader Planning
MBa, B eng
Paul is responsible for capital planning, capital
inauguration, and environmental and water quality
planning across Queensland Urban Utilities’ service area.
Paul has more than 20 years’ experience in the water
and sewerage industry across a wide spectrum
of disciplines. His main areas of expertise are in
planning, asset management, and the associated field
of asset optimisation.
Paul was a key member of the team that established
Queensland Urban Utilities and had input into the South
East Queensland water arrangements.
5 Our structure

Queensland Urban Utilities Annual Report 2012/13 10
Denise Dawson
Chief Financial Officer
B.Bus, Grad Dip (acctg), fCPa, GaiCD
Denise Dawson was appointed Chief Financial
Officer in November 2012 and is responsible for all
financial activities for Queensland Urban Utilities as
well as corporate risk and compliance and strategic
procurement.
Denise has spent the previous 11 years working for
Sydney Water in three general manager roles. Her most
recent role was General Manager Corporate Services,
responsible for managing and delivering a range of
business services including financial shared services,
information technology, insurance, risk management,
legal and business improvement. Denise was also Chief
Financial Officer from 2004 until 2007 and prior to that,
General Manager Customer Service.
In addition, Denise spent 20 years in the electricity
industry and held general manager positions with United
Energy Melbourne and Powerlink Queensland. She has
also held finance roles at the South East Queensland
Electricity Board.
Jennifer Leis
Executive Leader People and Safety
MaiCD, aiMM
Jennifer is responsible for leading the provision of a
range of human resource functions, including:
workplace industrial relations, organisational
development, performance and reward, recruitment,
learning and development, workplace health and safety,
and business support.
Jennifer has held senior executive positions within
the Brisbane City Council divisions of Retail, City Policy
and Strategy, Corporate Services, Major Projects, and
Commercial Services. Gaining 24 years of invaluable
experience and knowledge in the sewerage, water
and electricity industry, her successes have been
demonstrated by the delivery of a broad range of
critical projects.
Throughout her career, Jennifer has led the
development, coordination, and implementation of
successful business improvement strategies, integration
and change management efforts, as well as increasing
operational capability. She was also part of the key team
that established Queensland Urban Utilities.
Jennifer continues to inspire, explore and encourage
business management processes that foster a
constructive culture. She upholds strong leadership
values that cascades and influences positive attitudes
and behaviours throughout any workplace. Her
leadership style encourages her staff to maintain
strong work ethics, building relationships to support
foundations attaining ‘job satisfaction’.
Mark Letica
Executive Leader Governance
BCom, CSa (Cert)
Mark and his team have primary responsibility for
Queensland Urban Utilities’ corporate planning,
performance measurement and corporate reporting
and publications functions. He also oversees the
internal audit and corporate property and facilities
management functions.
Mark’s team is also responsible for stakeholder
relationship management, which includes shareholder
relations. This ensures Queensland Urban Utilities
actively engages and interacts with shareholders and
stakeholders to strengthen relationships.
Mark has worked in both state and local governments as
well as in the private sector. Before joining Queensland
Urban Utilities, Mark was one of the founding members
of the Council of Mayors (South East Queensland)
water reform program, which was responsible
for implementing the institutional water reform
arrangements in South East Queensland.
Following this term, Mark was appointed as Program
Manager to establish Queensland Urban Utilities. This
represented the largest water transaction – and second
largest utilities transaction – in Australian history.

Queensland Urban Utilities Annual Report 2012/1311
5 Our structure
Nina Meyers (Not pictured)
Chief Information Officer
B inf, MBa, GaiCD, afaiM
As Queensland Urban Utilities’ Chief Information
Officer, Nina is responsible for managing all aspects
of the organisation’s information, communication and
technology (ICT) environment. She has played a critical
role in outsourcing the commodity ICT services that
support Queensland Urban Utilities' operations and
realigning the internal organisational structure and
service delivery to augment this model.
With more than 20 years’ experience in the ICT industry,
Nina joined Queensland Urban Utilities after leaving
Allconnex Water, where she was part of the Executive
Leadership Team and responsible for establishing a
‘greenfields’ ICT capability and environment.
Her previous ICT experience was gained with
organisations such as Gold Coast City Council, the
Queensland Department of Emergency Services,
Queensland University of Technology, the Queensland
Police Service, and the Queensland Institute of
Medical Research.
Nina has successfully established program-management
offices in three different organisations. She has
delivered a number of large business transformation
programs in complex organisations using ICT solutions
as a catalyst for business process reengineering and
organisational change.
Tracey Moore
General Counsel and Board Secretary
Ba llB (Hons) Ma (Hons)
As the General Counsel/Board Secretary, Tracey is
responsible for providing legal advice to the organisation
(including right to information and Crime and
Misconduct Commission matters), secretarial assistance
to the Board, policy development and implementation,
management of the organisation’s insurance portfolio
and its land access and tenure services.
Tracey has significant experience in infrastructure
delivery in both the public and private sectors. Tracey is
also an experienced probity advisor and contract lawyer.
Immediately prior to this appointment, Tracey was a
partner with, and led the water and electricity practice
groups of a major independent law firm.
Tracey has held several previous board appointments
in the not-for-profit sector and is a member of
Queensland Law Society, Australian Corporate Lawyers
Association and the Australian Water Association.
Justin Poulus
Acting Executive Leader Customer and Community
BComm
Justin has been acting Executive Leader Customer and
Community since March 2013. In that time, he has
overseen the implementation of a Billing Innovations
Strategy designed to streamline Queensland Urban
Utilities’ billing process, the ongoing implementation
of the organisation’s brand and marketing strategies, as
well as customer communication channels such as the
contact centre and correspondence teams.
In addition to his current role, Justin holds the role of
General Manager Marketing and Communication for
Queensland Urban Utilities and previously held senior
marketing roles with Energex, Microsoft and various
marketing agencies. He began his career as a journalist in
the mid-1980s.

Queensland Urban Utilities Annual Report 2012/13 12
Julie McLellan (Not pictured)
Executive Leader Strategy and Growth
assocDegappSci, GradDip (t&D), GaiCD
As Executive Leader Strategy and Growth, Julie was
responsible for Queensland Urban Utilities’ strategic
initiatives and growth opportunities in conjunction with
the Board and Executive Leadership Team.
Julie has over 25 years’ experience in senior positions
within the water industry with an extensive and diverse
background in water management.
Prior to joining Queensland Urban Utilities, Julie held
the role of Water Resources Manager at Brisbane City
Council where she was responsible for leading and
developing Council’s WaterSmart Strategy, delivering
total water cycle solutions for the city of Brisbane. She
also led the development of Council’s FloodSmart
Strategy and delivered the Lord Mayor’s Taskforce on
Suburban Flooding.
Julie was previously a director on a number of boards,
including International RiverFoundation and the
Cooperative Research Centre (CRC) for Water Quality
and Treatment.
Julie left Queensland Urban Utilities in June 2013 to
pursue a role with Healthy Waterways.
Helen Harding (Not pictured)
Executive Leader Customer and Community
BPhys ed, MBus, Dip Comp Dir.
Helen was responsible for leading and managing the
Queensland Urban Utilities Customer and Community
Group. This included overseeing the marketing
and communication, customer service, billing and
collections, and demand management programs.
Prior to joining Queensland Urban Utilities, Helen had a
12-year career in the energy retail industry, during which
time she held the positions of Acting General Manager,
Retail for Babcock and Brown Power, and Senior Manager
for Energex Retail Pty Ltd. The latter role involved
a range of retail management and marketing roles,
including Group Manager, Homesuite (energy related
product and services), Manager Strategic Initiatives, and
Manager – Full Retail Contestability.
Helen left Queensland Urban Utilities in March 2013.

Queensland Urban Utilities Annual Report 2012/1313
6 Year in review – 2012/13
6.1 Our highlights and challenges
July 2012
• Louise Dudley appointed as new Chief Executive Officer
• Demonstrated our commitment to lowering the cost of living for South East Queensland families by freezing our
component of 2012/13 residential water and sewerage accounts
• Launched a new online capital works project map to improve customer awareness of our capital works program
• Co-hosted a community tree planting day with Bulimba Creek Catchment Coordinating Committee (B4C) to help
regenerate the Carindale Recreation Reserve
August 2012
• Acquired the Scientific Analytical Services Laboratory from Brisbane City Council
• Received the MerComm silver award for our 2010/11 annual Report in the Overall Annual Report: Water Supply
Companies category
• Commenced stage two of the $80 million Woollongabba Sewer Upgrade Project – Brisbane's largest capital works
project to date
September 2012
• Executed a Memorandum of Understanding with UnitingCare Community to enhance the support we offer to
financially vulnerable customers
October 2012
• Launched our in-house contact centre to enhance our level of customer service
• Completed a functional realignment of our operations and maintenance areas to deliver improved customer
service, and increased productivity and responsiveness
• Geoff Harley appointed as new Board Chairman
• Received the Innovation Award from pipe manufacturer HOBAS for micro-tunnelling works completed on the
Deebing Creek Trunk Sewer Main Upgrade
• Introduced a Councillor Relationship Manager role into the business to foster strong and trusting relationships with
our shareholders
November 2012
• Launched our incident notification service on Twitter and Facebook
• Sponsored the 2012 WaterAid Golf Day, with proceeds going towards helping the world’s poorest communities
gain access to safe water, sanitation and hygiene education
• Completed the $62.6 million Woogaroo Sewer Upgrade Project, which involved construction of a 4.7km gravity
sewer main
December 2012
• Improved the design of our website home page to allow for ease of navigation
• Completed the $5 million Toowong Sewer Upgrade Project, which involved the installation of a 574m sewer line

Queensland Urban Utilities Annual Report 2012/13 14
January 2013
• Stood-up our Incident, Emergency and Crisis Management Teams to effectively and efficiently respond to South
East Queensland’s extreme wet weather event
• In consultation with Seqwater, we enacted mandatory water restrictions following the temporary closure of
Seqwater’s Mount Crosby Water Treatment Plant and proactively deployed bottled water to affected communities
• Completed the $115 million Goonda Sewage Treatment Plant Upgrade Project, which increased the plant's
capacity by almost 40%
February 2013
• Worked around-the-clock to repair $2.4 million worth of flood and storm-damaged infrastructure
• Promoted Clean Up Australia Day activities in conjunction with community-based organisations
March 2013
• Hosted a community tree planting day in Ipswich to celebrate the completion of the Woogaroo Sewer
Upgrade Project
April 2013
• Hosted a community open day at the upgraded Goodna Sewage Treatment Plant
• Announced as a 2013 Healthy Waterways Awards finalist for our Helidon Reed Bed Treatment Scheme and Aratula
Regional Lagoon Enhancements Project
• Commenced 24/7 website reporting on all unplanned service interruptions
May 2013
• Received a bronze award in the 2013 Australasian Reporting Awards for our 2011/12 annual Report
• Sponsored the Clean Up Award category at the 2013 Healthy Waterways Awards
• Completed works on a new 733m section of water main along Telemon Street, Beaudesert
June 2013
• Sponsored the Mater Little Miracles fun run for the second consecutive year
• Successfully seperated all of our applications, software, date and infrastructure from Brisbane City Council without
interruption to our customers
• Won the 2013 PACE Zenith Award (Water and Wastewater) for our leadership in engineering and technological
excellence and innovation related to our Goodna Sewage Treatment Plant Upgrade

Queensland Urban Utilities Annual Report 2012/1315
6 Year in review – 2012/13
6.2 Performance at a glance
Queensland Urban Utilities’ Customer Service Standards outline the commitments, responsibilities and standards that
our customers can expect from us in relation to their water and sewerage services. We are committed to achieving
these standards by delivering a quality service that meets our customers’ evolving needs.
Table 1 lists our key performance indicators and how we have performed against our service standards over the past
three years.
Indicator Service standard 2010/11 result 2011/12 result 2012/13 result
Water quality
Water quality complaints
≤8 per 1000 properties 3.2 4.6 2.7
Water quality incidents
≤10 per 1000 properties 0.3 0.041 0.03
Water supply
Water pressure Urban area ≥210kPa
Trickle feed areas (and private booster)
≥100kPaQueensland Urban Utilities undertakes ongoing electronic
and manual monitoring of the water network to ensure water supply pressure and volume standards are met. Where an issue is detected or a complaint received, it is investigated and corrective
action is undertaken.Water volume Urban area ≥25 L/min
Trickle feed areas (and private booster) ≥3.2
L/min
Customer service
Calls answered - grade of service
≥80% within 30 secs75%
(% within 20 secs)83%
(% within 30 seconds)76%
(% within 30 secs)
Service connections
Time to install a new service connection
≥95% within 15 working days (following
customer payment)38% 52% 86%
Continuity of supply
Number of unplanned water supply interruptions
≤100 per 1000 properties per annum
63 48 63
Restoration of water supply
≥90% unplanned interruptions restored
within 5 hours87% 89% 89%
Response to incidents
Urgent water100% within 1 hour
93% 99% 93%
Urgent sewerage 85% 97% 93%
Non-urgent water100% within 24 hours
78% 97% 92%
Non-urgent sewerage 86% 98% 95%
Notification of interruptions
Notification of planned interruptions - water and sewerage
48 hours’ notice givenQueensland Urban Utilities provides a minimum of 48 hours’ notice to our
customers before any planned interruption to services. This is done through letterbox notices or hand-delivered calling cards.
Table 1 – Queensland Urban Utilities' three-year performance, measured against our service standards.
1 During 2011/12, Queensland Urban Utilities revised its management of water quality incidents to focus on those incidents that required immediate reporting to the regulator. This provided Queensland Urban Utilities with a better focus on managing water quality incidents within our control.

Queensland Urban Utilities Annual Report 2012/13 16
Grade of service
In 2012/13, our faults and emergencies line received
15,798 (28%) more calls compared to 2011/12, thus
impacting our result for ‘calls answered grade of service’.
A key driver of the increased call volume was the
extreme wet weather event in early 2013, where nearly
10,000 calls were received between 28 January and 4
February. Despite the high call volume, 70% of calls were
answered within 30 seconds.
Queensland Urban Utilities recently introduced an
interactive voice response system to improve our
grade of service and direct our customers to the most
appropriate contact for their enquiry.
Service connections
Queensland Urban Utilities installed 2,795 new service
connections during 2012/13, with 86% installed within
15 working days following customer payment – a
marked improvement from 2011/12.
Based on customer feedback received through the
Customer Experience Program, the process has been
streamlined to simplify how customers apply for a new
connection and reduce the timeframe for installation.
While the new process has improved the customer
experience, further improvements are planned for
deployment in 2013/14.
Unplanned water supply interruptions
During 2012/13, Queensland Urban Utilities restored
89% of unplanned water interruptions within five hours.
Performance was impacted during January 2013 due to
an extended period of dry weather conditions, which
caused a significant increase in the number of burst
water mains. These conditions were closely followed by
an extreme wet weather event in late January and above
average rainfall through to March 2013, which also
impacted our crews’ abilities to restore services within
five hours.
In 2012/13, Queensland Urban Utilities successfully
trialled a number of initiatives to deliver continuous
water supply while planned and unplanned works were
underway. For example, we constructed and operated a
23,000 litre mobile reservoir with an independent pump
and power supply to deliver water to small towns in
the Scenic Rim during construction and repair projects.
We also implemented a bypass system involving the
installation of valves during a three-month water main
construction in Beaudesert.
Both of these systems will be rolled out to the wider
Queensland Urban Utilities service area during 2013/14.

Queensland Urban Utilities Annual Report 2012/1317
6 Year in review – 2012/13
6.3 Looking ahead – our five-year strategic outlook
The Queensland Urban Utilities 2013-18 Corporate Plan
outlines our strategic direction for the next
five years.
While our purpose – to enrich quality of life – remains
unchanged, our vision has been refreshed to clearly
articulate our ultimate goal: to be recognised for our
excellence in water and sewerage services that meet
the evolving needs of our customers and enhance
our communities.
Our strategic direction will be supported by four
strategic pillars: customer, shareholders and
communities, operational excellence, and people.
From each pillar stems key focus areas that will
influence our initiatives and actions over the next five
years (see Table 2).
This plan will keep us well on track to realise a future
defined by accountability, efficiency and innovation,
resulting in quality in all that we do.
Strategic pillar Key focus area Strategic success measures
Customer Develop customer insight and understanding
• Brand index• Customer experience satisfaction• Corporate reputation indexDeliver the Queensland Urban Utilities
customer experience consistency
Influence and educate customers
Shareholders and communities Be a forward-looking organisation with the agility and adaptability to act
• Shareholder satisfaction • Total shareholder returns
Actively engage and interact with shareholders and stakeholders to strengthen relationships
Consistently deliver on shareholder expectations
Operational excellence Define and deploy operational excellence • Operating cost per property• Operating profit after tax• Return on assets• Research and development investment• Capital program deemed to be prudent
and efficient by the Queensland Competition Authority
• Capital program delivered against budget
• Biosolids production• Total net greenhouse gas emissions• Cogeneration
Innovate to identify, assess and adapt to opportunities that align to operational excellence
Influence the supply chain and regulatory environment
People Create and embed a ‘no harm’ workplace through employees who value safety
• Total injury frequency rate• Organisational culture index
Be a performance orientated workforce with strong visible leadership
Build a workforce that is adaptable, agile and change resilient
Table 2 – Queensland Urban Utilities' strategic direction for 2013-18.
Queensland Urban Utilities Annual Report 2012/13 18
7 Deliver service that is valued and trusted by our customers and the community
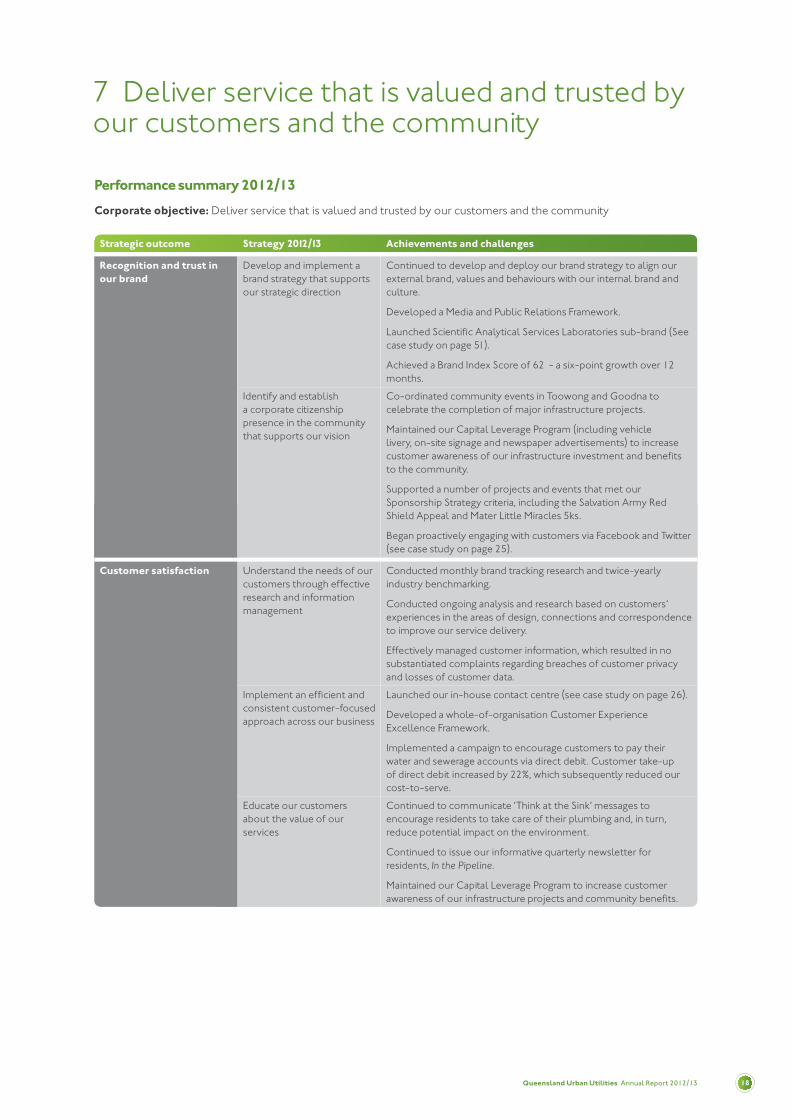
Strategic outcome Strategy 2012/13 Achievements and challenges
Recognition and trust in our brand
Develop and implement a brand strategy that supports our strategic direction
Continued to develop and deploy our brand strategy to align our external brand, values and behaviours with our internal brand and culture.
Developed a Media and Public Relations Framework.
Launched Scientific Analytical Services Laboratories sub-brand (See case study on page 51).
Achieved a Brand Index Score of 62 - a six-point growth over 12 months.
Identify and establish a corporate citizenship presence in the community that supports our vision
Co-ordinated community events in Toowong and Goodna to celebrate the completion of major infrastructure projects.
Maintained our Capital Leverage Program (including vehicle livery, on-site signage and newspaper advertisements) to increase customer awareness of our infrastructure investment and benefits to the community.
Supported a number of projects and events that met our Sponsorship Strategy criteria, including the Salvation Army Red Shield Appeal and Mater Little Miracles 5ks.
Began proactively engaging with customers via Facebook and Twitter (see case study on page 25).
Customer satisfaction Understand the needs of our customers through effective research and information management
Conducted monthly brand tracking research and twice-yearly industry benchmarking.
Conducted ongoing analysis and research based on customers’ experiences in the areas of design, connections and correspondence to improve our service delivery.
Effectively managed customer information, which resulted in no substantiated complaints regarding breaches of customer privacy and losses of customer data.
Implement an efficient and consistent customer-focused approach across our business
Launched our in-house contact centre (see case study on page 26).
Developed a whole-of-organisation Customer Experience Excellence Framework.
Implemented a campaign to encourage customers to pay their water and sewerage accounts via direct debit. Customer take-up of direct debit increased by 22%, which subsequently reduced our cost-to-serve.
Educate our customers about the value of our services
Continued to communicate ‘Think at the Sink’ messages to encourage residents to take care of their plumbing and, in turn, reduce potential impact on the environment.
Continued to issue our informative quarterly newsletter for residents, in the Pipeline.
Maintained our Capital Leverage Program to increase customer awareness of our infrastructure projects and community benefits.
Performance summary 2012/13
Corporate objective: Deliver service that is valued and trusted by our customers and the community

Queensland Urban Utilities Annual Report 2012/1319
Strategic outcome Strategy 2012/13 Achievements and challenges
Operational responsiveness
Demonstrate our commitment to our customers through operational responsiveness
Developed and commenced implementation of our Billing Innovation Strategy, which included:
• a change to the retrospective billing process that will assist in reducing the number of accounts under investigation and improve the customer experience,
• completing a review of our billing system to identify efficiency opportunities to streamline and automate billing and revenue processes.
Implemented a new scripting system for the contact centre to allow for better management of customer contact information and procedures.
Launched our new Correspondence Management System, which streamlines the way our Customer Services team captures and manages customer correspondence.
Implemented a new commendations process to ensure staff who have been acknowledged by customers for their outstanding work are recognised.
Established the Customer Feedback Steering Committee as a means of identifying and addressing systemic issues to ultimately improve operations organisation-wide.
Received and processed the largest volume of special meter read (SMR) applications since our establishment. Around 19,960 SMR applications were processed in 2012/13 – a 41% increase compared to 2011/12 and a 79% increase compared to 2010/11.
Proactively supported property owners who were devastated by the 2013 severe wet weather event by waiving their water and sewerage charges.
An established and effective stakeholder engagement structure
Understand community needs and growth through effective stakeholder and community engagement
Gained valuable customer insights by hosting quarterly Customer and Community Reference Group meetings.
Co-ordinated community tree planting days in-conjunction with Bulimba Creek Catchment Coordinating Committee to help re-generate reserves around key catchment areas.
Held an industry forum with developers and key industry bodies, which enabled us to gain an insight into their needs and expectations.
Work closely with community social groups and provide adequate support for customers facing financial hardship
Sponsored and attended community events including the Salvation Army “Bring Your Bills” event in the Lockyer Valley.
Maintained our Hardship Program by introducing a referral process to the UnitingCare Community Financial First Aid hotline.
Worked with Kildonan Unitingcare to deliver ongoing hardship awareness training for Recovery and Contact Centre teams to better support staff in managing customers in hardship.
7 Deliver service that is valued and trusted by our customers and the community

Queensland Urban Utilities Annual Report 2012/13 20
e-business Strategy
Our e-business Strategy seeks to provide customers with
easier access to key information and more self-service
opportunities on our website.
In 2012/13, we implemented the first phase of our
e-business approach, which aimed to improve the
information presented on our website and provide a
range of online application forms for customers.
As part of phase one, we introduced 24/7 reporting of
all unplanned service interruptions.
We also introduced a dedicated ‘development services’
microsite, which offers developers a range of services
relating to new connections, land use planning, trade
waste, and development assessment.
Customer Experience Program
In September 2012, the Board endorsed a Customer
Experience Excellence Framework to support the
organisation’s priorities around heightened customer
focus, increased professionalism and better planning.
While this will be an ongoing program, a number of
‘quick wins’ have already been realised. During
2012/13, we:
• reduced design application turnaround times from
15 days to five days and reduced ‘application to
construction’ turnaround times from 10-12 weeks to
four-five weeks,
• introduced coaching and training programs for contact
centre staff, which reduced errors from 7% to <1%,
• conducted a Customer Needs and Expectations Study
to better define what our customers need, want and
expect from our services,
• developed and communicated our new customer
statement (“We listen, we care, we deliver”), which will
be embedded into all customer communication,
• introduced an internal Continuous Improvement
Program, which, to date, has generated 34
improvement suggestions from staff,
• increased our Customer Experience Industry
Benchmark from 6.1 to 6.4 out of 10, positioning us
favourably against well-established utilities, and above
our forecast target of 6.3.
Queensland Urban Utilities Annual Report 2012/1321
7 Deliver service that is valued and trusted by our customers and the community
Stakeholder engagement
Queensland Urban Utilities has a diverse range of
stakeholders including, but not limited to:
• shareholders,
• the Queensland Government,
• the Australian Government,
• customers and communities,
• developers,
• regulators,
• Seqwater (bulk water supplier),
• research groups,
• water industry associations,
• other utilities,
• advocacy groups,
• unions,
• suppliers,
• media,
• business and industry.
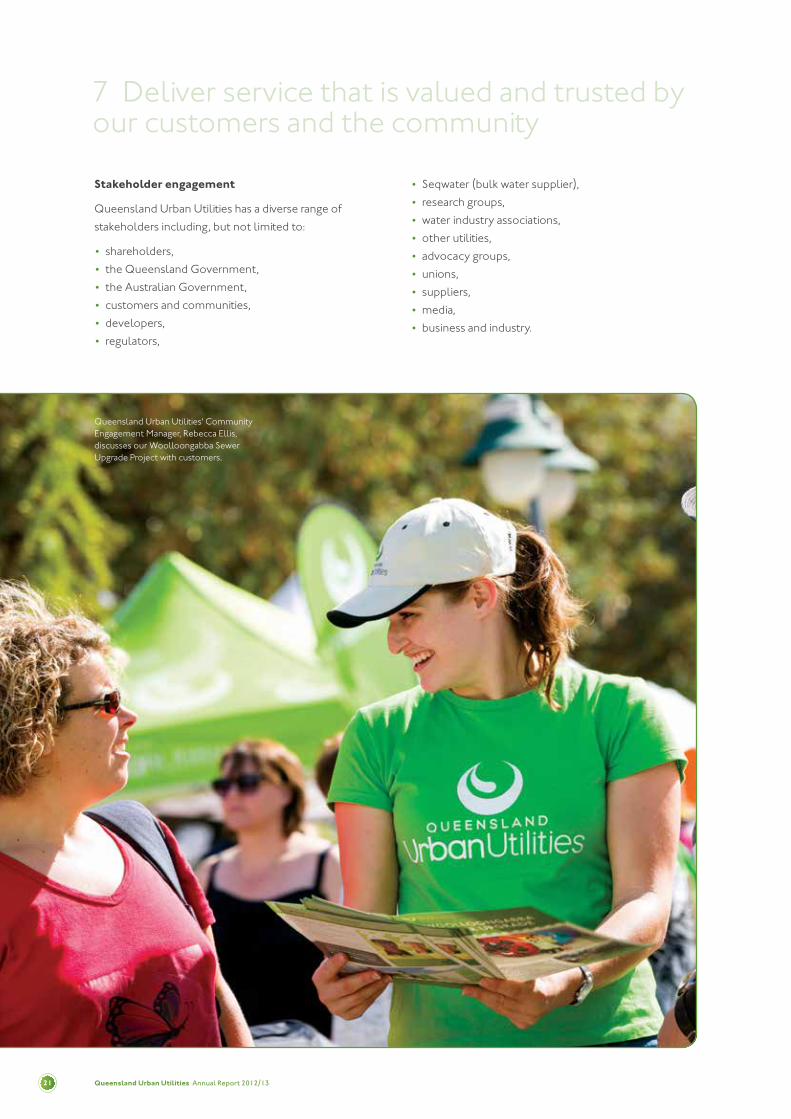
Queensland Urban Utilities' Community Engagement Manager, Rebecca Ellis, discusses our Woolloongabba Sewer Upgrade Project with customers.

Queensland Urban Utilities Annual Report 2012/13 22
We use a range of engagement tools to target our stakeholders appropriately and effectively. Examples of these
engagement tools are detailed in Table 3.
Engagement tools Examples
Customer and Community Reference Group
Quarterly forum for customer and community input and advice on a range of issues, including pricing
Development Industry Forum A twice-yearly forum targeting the development industry to improve planning and delivery of services
Direct communication Includes phone calls, emails and meetings
Fact sheets Objective information about a problem, alternative or solution
Focus groups Small meetings of targeted stakeholder groups used to gather feedback on a particular issue or opportunity
Formal submissions Formal levels of engagement to record information, inform stakeholders, or seek action
Information sessions Opportunities for stakeholders to discuss a range of concerns
Public comment Opportunities for stakeholders to provide comment on a range of relevant topics
Regular corporate publications Corporate and operational plansQuarterly and annual reportsAnnual Stakeholder Report
Social media A mutually beneficial, two-way channel to disseminate information and answer questions about a variety of topics including service interruptions and traffic impacts
Stakeholder and Community Engagement Plans
Initiative and project-specific plans, which outline engagement activities at an individual project level and align with the Corporate Stakeholder Engagement Strategy and Plan
Surveys Online or written channels for receiving stakeholder feedback and opinions on specific issues
Website Online access to key information
Workshops Direct engagement to ensure concerns and aspirations are understood and considered
Table 3 – Methods we use to engage with our stakeholders.
In June 2013, we conducted an online External Stakeholder Satisfaction Survey, which was sent to Mayors, Councillors
and Chief Executives of our five shareholding councils, as well as members of our Customer and Community
Reference Group (CCRG), regulators and members of industry groups.
A total of 55 stakeholders responded to the survey – a 34% increase in the response rate experienced in 2011.
The survey results indicated that our proactive approach to stakeholder engagement has been well received, with our
overall stakeholder satisfaction rating increasing to 77.5%.
Queensland Urban Utilities Annual Report 2012/1323
7 Deliver service that is valued and trusted by our customers and the community
Supporting our communities through sponsorship
We continued to sponsor projects and events
that support our customers and the community. In
2012/13, we:
• supported fun runs in Brisbane and the Lockyer Valley
to help raise funds for the Mater Hospital and Diabetes
Queensland, respectively,
• sponsored WaterAid Golf Day to help raise money for
the WaterAid charity,
• sponsored the Salvation Army ‘Bring in your Bills’
event in Lockyer Valley, which was an opportunity
for those experiencing financial difficulty to receive
face-to-face advice from experts in the finance, legal,
support and utilities sectors,
• continued our involvement with the Healthy
Waterways Awards as sponsor of the Clean Up Award
– an award that recognises the efforts of individuals
and community groups in addressing the issue of
waterway litter,
• provided in-kind support for the Pocket Community
Garden at Woolloongabba,
• provided merchandise and in-kind support for a
range of community fundraising efforts, including
Kilcoy Bowls Club, Toowong Soccer Club, St John’s
Ambulance and the Salvation Army,
• sponsored the Salvation Army Red Shield Appeal
breakfast in Brisbane,
• sponsored the Lockyer Valley Business
Excellence Awards.
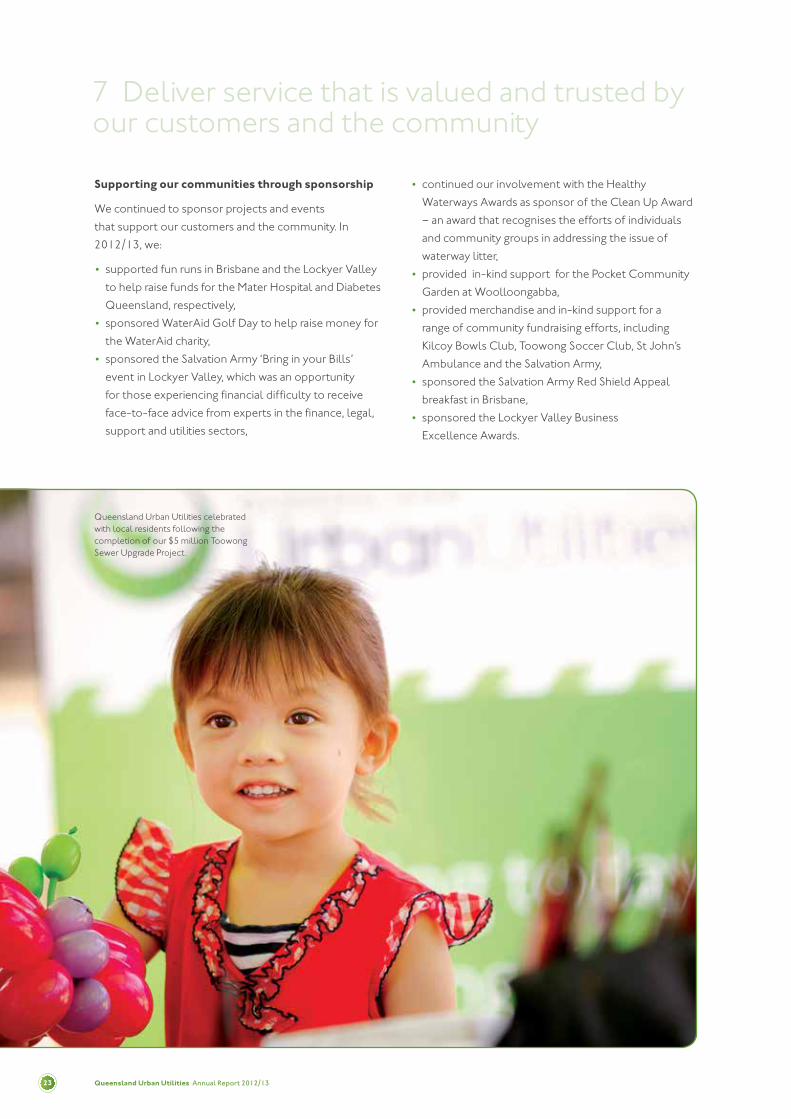
Queensland Urban Utilities celebrated with local residents following the completion of our $5 million Toowong Sewer Upgrade Project.

Queensland Urban Utilities Annual Report 2012/13 24
Celebrating milestones with our communities
To celebrate the completion of our $5 million Toowong
Sewer Upgrade Project, residents were invited to attend
a morning of festivities on 19 January 2013 at Toowong
Memorial Park.
The upgrade project, which was completed in December
2012, has increased the capacity of the sewer system to
cater for long-term growth and development in the area.
Work involved the installation of a 574m sewer line
underground and was carried out in four stages to
minimise impacts on the community. The new sewer
line now supports the original sewerage infrastructure in
Toowong that was installed in 1914 and 1929.
On 6 April 2013, we hosted a Goodna Sewage Treatment
Plant open day, where around 100 local residents took
behind-the-scenes tours of the plant.
Our Chief Executive Officer, Louise Dudley, and Ipswich
City Councillors Paul Tully (Division 2) and Victor
Attwood (Division 3) cut the ribbon at the plant’s official
re-opening, following its recent $115 million upgrade.
The upgrade has increased the plant’s operating capacity
by 40% to meet future growth requirements and has
also improved the plant’s performance and
environmental sustainability.
Introduction of a Councillor Relationship Manager
In January 2012, the Board considered the outcomes
of a broad stakeholder survey conducted in late
2011. Nearly half of the responses received were
from shareholders or local government bodies. While
the survey indicated a high level of satisfaction with
Queensland Urban Utilities, several opportunities to
consolidate and refine our stakeholder approach
were identified.
One opportunity that was delivered in 2012/13 was
the appointment of a Councillor Relationship Manager
to provide an interface between Queensland Urban
Utilities and the Mayors and Councillors from our five
shareholding councils.
The purpose of the role is to provide timely and
relevant information about Queensland Urban Utilities’
operations and performance, and to foster strong and
trusting relationships with shareholders by acting as a point
of referral for issues or customer concerns that have not
been resolved through our regular customer processes.
The Councillor Relationship Manager is responsible for
proactively engaging with Councillors to ensure that
Queensland Urban Utilities is meeting customer and
community needs in all five service territories.
This function is in addition to existing channels that the
Board and Executive Leadership Team use to engage
with elected representatives. Such channels include
annual presentations to shareholders by the Chairman
and Chief Executive Officer, Board meetings hosted
in our five shareholder service territories, the annual
Special General Meeting for Mayors and Chief Executive
Officers, and circulation of information on key capital
projects and other initiatives.
Shareholder feedback on the new Councillor
Relationship Manager function has been very positive.
The role was broadened in January 2013 to include State
Government Members of Parliament in Queensland
Urban Utilities’ service area.
Queensland Urban Utilities will continue to review
and strengthen relationships with shareholders and
other stakeholders to ensure that our engagement and
communication remains responsive and relevant.

Expanding the scope of our social media activity
Case study
Queensland Urban Utilities Annual Report 2012/1325
Our Twitter and Facebook channels are utilised for a variety of purposes, including community education and customer liaison
In November 2012, we increased our level of
customer engagement and transparency by
adopting a proactive social media approach. Queensland
Urban Utilities’ Facebook and Twitter accounts were
originally activated in January 2012 with the sole
purpose of circulating one-way communication during
emergency or crisis events. With the power of social
media growing in popularity, Queensland Urban Utilities
made the decision to increase our social media activity
from reactive, one-way statements, to proactive, two-
way conversations.
Our Twitter and Facebook channels are now used for
a variety of mutually-beneficial purposes, including
community education messages, emergency broadcasts,
customer liaison, and service interruption notifications.
The importance of social media was strongly evident
during the 2013 flood event and associated water
supply issue.
During the seven-day emergency, our social media
presence proved to be a valuable information-sharing
platform, with almost 700 people (including media and
stakeholder organisations) opting to ‘follow’ our Twitter
account for updates on the situation and to engage in
conversations with us. This was a 400% increase in our
‘follower’ base.
Both the Queensland Urban Utilities Facebook and
Twitter pages continue to attract new followers. We
also regularly receive and respond to a variety of
customer interactions, including notifications of water
leaks and supply interruptions, questions about billing,
compliments for our service and suggestions for
service improvement.
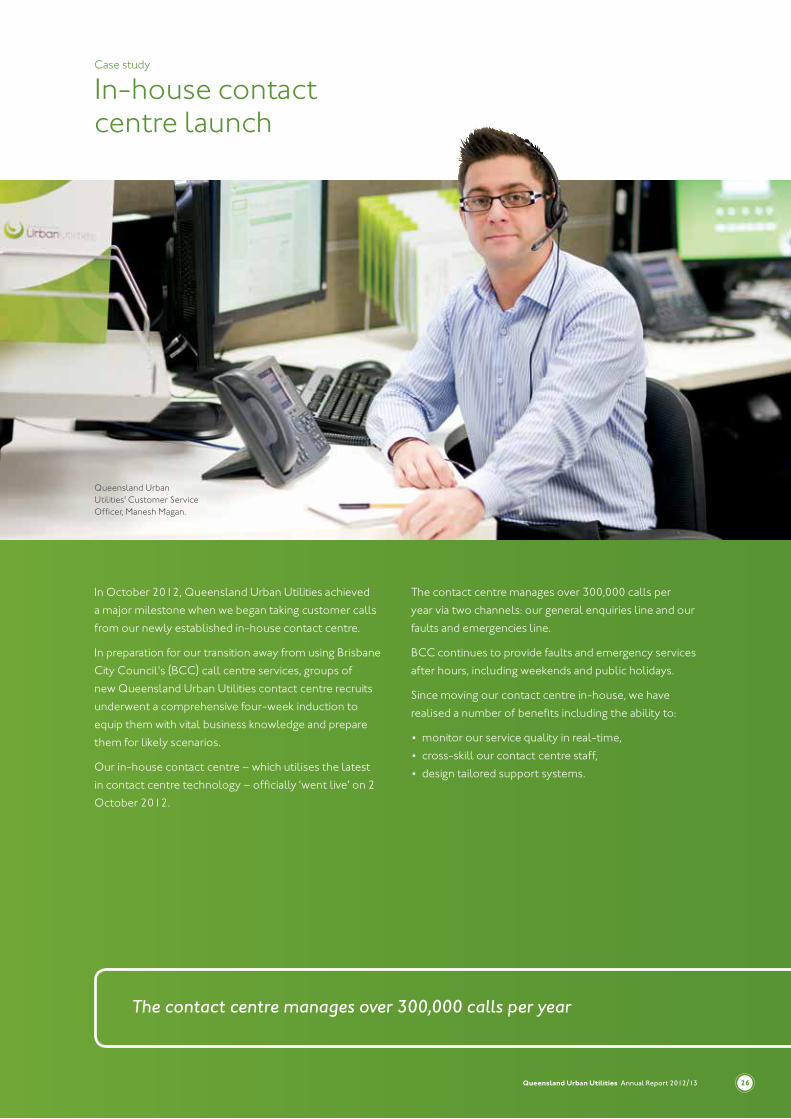
In-house contact centre launch
Case study
Queensland Urban Utilities Annual Report 2012/13 26
The contact centre manages over 300,000 calls per year
In October 2012, Queensland Urban Utilities achieved
a major milestone when we began taking customer calls
from our newly established in-house contact centre.
In preparation for our transition away from using Brisbane
City Council's (BCC) call centre services, groups of
new Queensland Urban Utilities contact centre recruits
underwent a comprehensive four-week induction to
equip them with vital business knowledge and prepare
them for likely scenarios.
Our in-house contact centre – which utilises the latest
in contact centre technology – officially ‘went live’ on 2
October 2012.
The contact centre manages over 300,000 calls per
year via two channels: our general enquiries line and our
faults and emergencies line.
BCC continues to provide faults and emergency services
after hours, including weekends and public holidays.
Since moving our contact centre in-house, we have
realised a number of benefits including the ability to:
• monitor our service quality in real-time,
• cross-skill our contact centre staff,
• design tailored support systems.
Queensland Urban Utilities' Customer Service Officer, Manesh Magan.

January 2013 flood event
Case study
Queensland Urban Utilities Annual Report 2012/1327
In January 2013, ex-tropical cyclone Oswald passed
over parts of Queensland, causing widespread impact
to a large proportion of Queensland Urban Utilities’
service area.
Our flood response
Forward-planning allowed us to avoid potentially
significant damage to our assets and infrastructure. By
utilising flood risk mapping, we were able to relocate
equipment from 64 sewage pump stations and relocate
and install 81 emergency generators.
We responded to flood-related water quality issues in
Laidley and Rathdowney by transporting bottled water
via helicopter to the affected communities. We were
also able to engage in two-way communication with
residents via our social media channels.
In addition to responding to water quality issues, our
dedicated crews battled the harsh elements while they
repaired numerous burst water mains (as many as 30 in
one day) and other damaged assets.
The Queensland Urban Utilities contact centre was
challenged during this period with close to 10,000 calls
received between 28 January and 4 February.
Despite the high call volume, 70% of calls were
answered within 30 seconds, falling just short of our
grade of service standard (80%). To cater for the high
call volume and to maintain continuity of service during
the event, we enacted our Disaster Recovery Business
Continuity Plan and engaged an outsourced contact
centre located in South Australia.
Customer assistance
Queensland Urban Utilities provided financial relief
to customers affected by the flooding event, many of
whom were devastated just two years earlier during the
2011 flood.
For customers we identified to be ‘flood affected’,
we issued their bills later in the billing cycle, offered
them the option of a payment plan, modified any
debt recovery processes already in place, and gave
consideration to concealed leaks potentially caused by
the impact of the flood.
For customers we identified as ‘flood devastated’, we
waived their bills for up to four quarters, suspended any
pre-existing debt recovery processes, and considered
concealed leaks caused by the impact of the flood.
Our crews worked around-the-clock to repair infrastructure that was damaged during the extreme wet weather event.
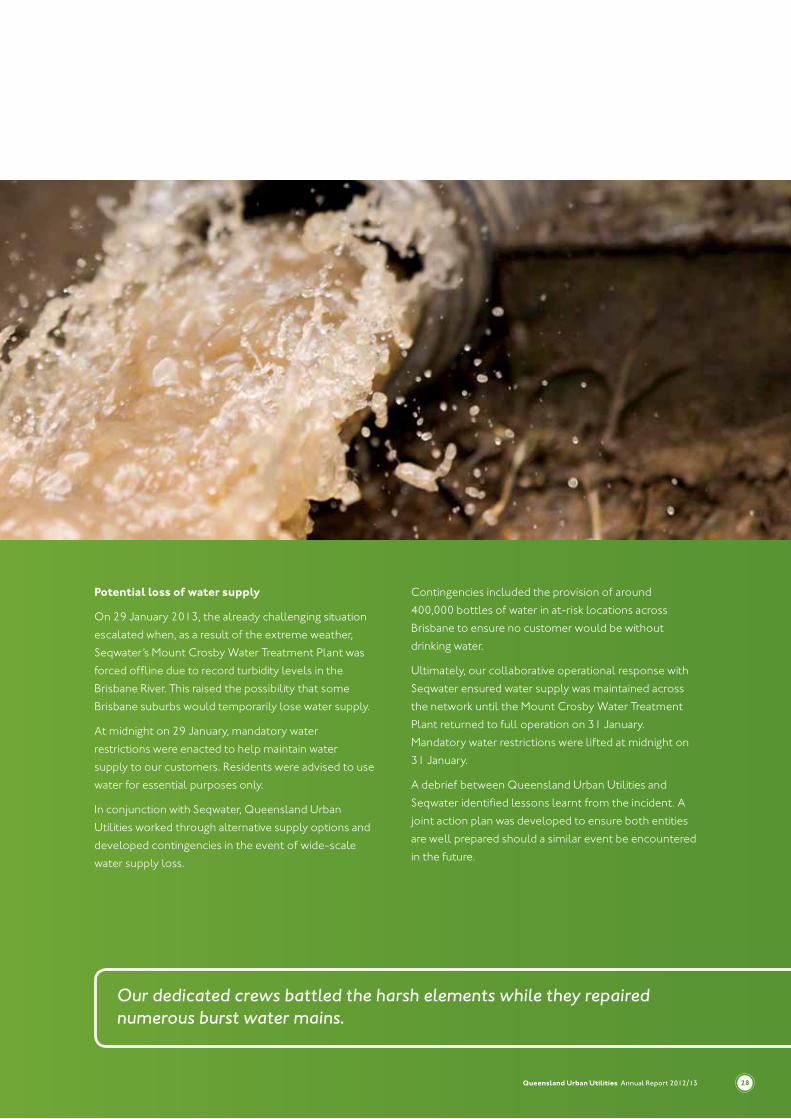
Our dedicated crews battled the harsh elements while they repaired numerous burst water mains.
Queensland Urban Utilities Annual Report 2012/13 28
Potential loss of water supply
On 29 January 2013, the already challenging situation
escalated when, as a result of the extreme weather,
Seqwater’s Mount Crosby Water Treatment Plant was
forced offline due to record turbidity levels in the
Brisbane River. This raised the possibility that some
Brisbane suburbs would temporarily lose water supply.
At midnight on 29 January, mandatory water
restrictions were enacted to help maintain water
supply to our customers. Residents were advised to use
water for essential purposes only.
In conjunction with Seqwater, Queensland Urban
Utilities worked through alternative supply options and
developed contingencies in the event of wide-scale
water supply loss.
Contingencies included the provision of around
400,000 bottles of water in at-risk locations across
Brisbane to ensure no customer would be without
drinking water.
Ultimately, our collaborative operational response with
Seqwater ensured water supply was maintained across
the network until the Mount Crosby Water Treatment
Plant returned to full operation on 31 January.
Mandatory water restrictions were lifted at midnight on
31 January.
A debrief between Queensland Urban Utilities and
Seqwater identified lessons learnt from the incident. A
joint action plan was developed to ensure both entities
are well prepared should a similar event be encountered
in the future.
Queensland Urban Utilities Annual Report 2012/1329
8 Safe, capable and dedicated people
Strategic outcome Strategy 2012/13 Achievements and challenges
Clear accountability and alignment
Ensure that accountabilities across the organisation are clearly articulated
Communicated our purpose, vision and values to staff through a variety of channels, including CEO roadshows, signage, team meetings, staff newsletters and regular CEO communiques.
Refreshed ‘planning for performance’ templates for employees covered by the Enterprise Bargaining Agreement (EBA).
Developed and implemented performance plans for employees on Common Law Contacts.
Revised the Authorities and Delegations Schedule.
Enabling workforce relations
Plan a long-term workforce to support organisational needs
Developed and implemented a suite of policies and procedures to facilitate positive organisational change.
Support current needs and enable future change and growth through workplace relations and industrial instruments
Developed a revised enterprise bargaining agreement (EBA2) – our second since we were established in 2010. The agreement was developed in consultation with employees and unions, and employees will vote on it in August 2013.
Reviewed and rolled-out around 25 different policies and procedures to support EBA2.
Capability uplift and leadership
Understand the benefit of enterprise leadership and deliver a leadership model to support this
Developed and delivered a ‘People Leader’ induction program to address performance planning, recruitment and culture development. This program was one of the many developed and delivered in 2012/13 to ensure our leaders are equipped with the appropriate tools to address performance management issues and performance planning.
Foster employee performance through talent acquisition, retention and succession planning
Talent Management Strategy endorsed by the Board and rolled out to the business.
Deliver a learning and development model, strategy and frameworks that support our current and growth strategies
Delivered a pilot Skills Development Program for leaders to up-skill in giving and receiving feedback and coaching.
Introduced a number of online training courses, including fatigue management, front line management and code of conduct.
Performance summary 2012/13
Corporate objective: Keep our people safe, capable and dedicated

Queensland Urban Utilities Annual Report 2012/13 30
Strategic outcome Strategy 2012/13 Achievements and challenges
Embedded culture and commitment
Foster an organisational culture that supports our purpose, vision, organisation values and brand values, behaviours and capabilities
Designed and distributed an organisational culture survey to all employees, which evaluates both the culture and the causal factors affecting the culture. Results are due in August 2013 and will inform action plans for all business leaders.
Introduced Culture Leaders to assist in our overall culture change by supporting and encouraging employees to participate in the culture survey and other culture-enhancing initiatives.
Continued to present recognition awards to long-serving employees.
Continued to present Values Awards to staff for demonstrating their commitment to our organisational values.
Streamlined internal communication by implementing a new suite of communication channels.
Developed a series of DVDs to build staff understanding of our purpose, vision and brand values, specifically the ‘customer and community’ value.
Healthy and safe people Embed health and safety management in everyday life
Implemented a standardised set of Safe Work Method Statements for the entire business.
Continued to work with our external safety partners to improve the monitoring and measurement of safety management across the business.
Increased safety visibility by installing safety door decals and ‘conditions of entry’ signage at 29 Queensland Urban Utilities locations.
Introduced a highly-mobile safety delivery model, allowing our field staff (our most at-risk group of employees) to easily access advice and direction from our qualified safety advisers.
Introduced robust medical assessments to ensure staff working in confined spaces or at heights are safe.
Launched a suite of safety induction DVDs for visitors to our worksites.
Tailored remuneration, rewards and recognition
Deliver a commercial remuneration framework that optimises performance outcomes
Completed a performance and reward review of executives, leaders and professionals.
Continued to scan external markets to ensure we offer fair and competitive remuneration packages.

Queensland Urban Utilities Annual Report 2012/1331
8 Safe, capable and dedicated people
With end-to-end accountability, our People and Safety
group is responsible for a range of functions, including:
business partnerships; learning and development;
organisational development; performance and reward;
workplace health, safety and wellbeing; and workplace
relations.
Workforce profile
As at 30 June 2013, Queensland Urban Utilities
employed 1,419 staff in a range of professions and
trades in permanent full-time, permanent part-time
and temporary capacities. This figure included 1,120
permanent employees.
The full-time equivalent staff establishment for
permanent employees was 822.
For the 2012/13 financial year, Queensland Urban
Utilities recorded a 91.42% permanent retention rate and
10.9% permanent separation rate.
(Note: the sum of the separation rate and retention rate
is not expected to equate to 100% as they are calculated
using different criteria.)
Workforce planning, attraction and retention
Following the development of our Workforce Plan
in 2012/13, various strategies were implemented to
address organisational needs. These included:
• a review of attraction and retention strategies to
ensure an alignment between current and future
capability requirements,
• building employee relations through ongoing
initiatives such as workplace consultative
committees, safety committees and the introduction
of culture leaders,
• development of an end-to-end performance
management framework,
• development of a frontline leadership program.
Promoting a work/life balance
Queensland Urban Utilities continues to promote work/
life balance for our employees by offering a range of
options, including:
• flexible work arrangements, such as nine-day
fortnights, staggered working weeks/fortnights and
part-time agreements,
• part-time employment options i.e. where two or more
employees share one full-time position, each working
on a fractional basis,
• flex-time for all indoor employees covered by
the EBA,
• the ability for employees to work from a remote
workplace (e.g. their home), while electronically
maintaining a presence in their primary office,
• access to various paid and unpaid leave arrangements,
such as annual and long service leave (either at full
pay or half pay).
In 2012/13, we streamlined and reviewed our
employee-related policies to ensure that the provisions
we offer are both market-competitive and sustainable
for the business.

Queensland Urban Utilities Annual Report 2012/13 32
Performance management
In 2012/13, a program was developed to build the
capability of leaders in performance management. The
program – named “The Learning Curve” through an
internal competition – contains a number of courses
including how to hold a ‘1-2-1’ conversation, how to set
objectives, and how to handle difficult conversations.
The learning platforms of these courses are dependent
on content and objectives, with some being developed
for our e-learning platform and others being delivered
face-to-face. This program supports our strategy of
having employees who are safe, adaptable, capable,
and are committed to achieving our vision and living
our values.
Industrial and employee relations
The Employment Consultative Committee (ECC)
is the primary forum for industrial matters between
Queensland Urban Utilities, our employees, and
relevant unions. In 2012/13, the ECC’s primary
responsibility was to discuss and negotiate our
enterprise bargaining agreement (EBA2).
Like the previous year, no industrial action occurred in
2012/13. This demonstrates that the sound industrial
partnerships established before and during EBA1
negotiations have been sustained and all industrial
matters have been successfully dealt with locally.
Strategic Safety Group
The Strategic Safety Group leads, reviews and sets
direction for the implementation of all Queensland
Urban Utilities safety programs.
The group, which comprises the Executive Leadership
Team, chairs of safety committees, and the Safety
Manager, makes decisions to foster a ‘zero harm’ culture.
The Strategic Safety Group's responsibilities include,
but are not limited to: setting strategic safety goals and
objectives, monitoring and tracking progress towards
these goals, and reviewing the progress of programs
and initiatives.
Recognising our people
We believe it is important to acknowledge staff for a job
well done and have a number of recognition processes
in place.
In 2012/13, we launched a commendation process
whereby staff who formally receive positive feedback
from customers are recognised at both a management
and CEO level.
We continued to present our Values Awards to
recognise those staff who consistently demonstrate
their commitment to our organisational values. In
2012/13, there was a focus on our ‘customer and
community’ value and awards were presented to
staff for outstanding customer service, accountability
for customer outcomes, customer and community
relationships, and outstanding internal customer service.
We also continued to present our long-serving staff with
recognition awards. In 2013, we presented a total of 97
awards, including four to staff who had served 45 years,
seven for serving 40 years and 12 for serving 35 years.

Our employee relations journey
Case study
EBA2 continues to build on the key deliverables of EBA1 and will enable us to modernise in a flexible manner
Queensland Urban Utilities has been on an employee
relations journey since our formation on 1 July 2010.
Within the SEQ Water Reform Framework, we negotiated
our first enterprise bargaining agreement (EBA1), which
amalgamated all terms and conditions of employment
transferred from our five shareholding councils into one
succinct industrial document. We also progressed from
seven industrial awards to four.
EBA1 had a nominal expiry date of 30 June 2013,
with a renegotiation period of six months. As such, we
commenced negotiations with unions in January 2013.
EBA2 continues to build on the key deliverables of
EBA1 and will enable us to modernise in a flexible
manner to ensure we evolve into a sustainable water
and sewerage business.
In 2012/2013, considerable effort was placed on
identifying the key target areas of employee relations that
Queensland Urban Utilities’ leaders needed support in.
Our Employee Relations Team developed and
implemented policies and procedures to ensure
our leaders understand their roles and can act
independently when dealing with their staff on
employee relations matters.
Our Employee Relations Team also developed and
implemented a suite of documents to facilitate positive
organisational change. The suite included:
• a Business Case Impact Assessment (BCIA),
• an Organisational Change Framework,
• an Organisational Change Policy,
• a Retraining, Redeployment and Redundancy Policy
and Procedure,
• Redundancy Support Principles.
The suite was successfully piloted during the realignment
of our Operations Group, which commenced in November
2012. The policies and procedures provided managers with
the correct tools to ensure the right staff were placed in
the right roles, resulting in no industrial action.
Queensland Urban Utilities Annual Report 2012/1333
Queensland Urban Utilities' Marketing and Communications
Coordinator, Mel Argue.

Safety: everyone, everywhere, every day
Case study
In 2012/13, our safety function underwent significant transformation
Queensland Urban Utilities is continually moving
towards instilling a constructive and positive culture
and our safety value is leading this cultural change. In
2012/13, our safety function underwent significant
transformation, both in its delivery model and its capacity
to communicate safety information to employees.
The new, highly-mobile delivery model places our safety
advisors in the field where they can conduct audits for
continuous improvement purposes and test any new
procedures and processes. It also gives field-based staff
ready access to advice and direction from our qualified
and experienced safety professionals. Over 2012/13,
a number of safety initiatives were developed or
progressed. For example, we:
• launched a suite of safety induction DVDs for visitors to
our worksites,
• continued to work with our safety partners to help
us develop and embed the values, attitudes and
behaviours required to succeed with the cultural
element of our safety journey,
• developed online safety training packages for staff,
covering topics such as fatigue management and
fire safety,
• introduced a series of internal communication tools to
keep staff up-to-date with safety news and initiatives,
including toolbox talks and themed safety alerts,
• introduced robust medical assessments for our
employees to ensure they are capable of conducting
high-risk and manual activities safely,
• realigned our safety committee to promote an effective
escalation and management review process,
• recruited and trained over 40 Health and Safety
Representatives (HSRs) to give employees access to
representation within the business and within the safety
committee structure.
While there are still improvements to be made, the
success of the initiatives we have implemented to date
are reflected by our declining Total Recordable Injury
Frequency Rate.
Queensland Urban Utilities Annual Report 2012/13 34
Queensland Urban Utilities' Technical Officer, Leo Bell, demonstrates that safety is our number one priority.

Queensland Urban Utilities Annual Report 2012/1335
9 Delivering our services
Performance summary 2012/13
Corporate objective: Focus on business efficiency and continuity
Strategic outcome Strategy 2012/13 Achievements and challenges
Prudent and efficient asset management
Understand our risks and respond appropriately
Refreshed our Risk Management Framework, which included:
• establishing a new Risk Management Policy, which clearly states our commitment to a consistent business-wide process,
• implementing a new risk management structure, with risk champions and coordinators across the business,
• developing a Risk Management Strategy, which outlines improvements to be made over the next 18 months.
Assessed our corporate compliance obligations, which will be included in our 2013/14 Compliance Program.
Provide infrastructure planning that meets the requirements of all stakeholders and enables timely community growth
South East Queensland Water and Sewerage Design and Construction Code was gazetted in June 2013 (see case study on page 41).
Continued to work on our business case for the proposed Lockyer Valley Recycled Water Scheme.
Completed a review of the water master plan for the Ipswich region. The updated plan considers forecast growth in the catchment over the next five years.
Updated master plans for Luggage Point, Gibson Island, Karana Downs and Wynnum sewage treatment plants.
Engaged with Department of Energy and Water Supply, Ipswich City Council and developers to identify opportunities for sustainable water management in the Ripley Valley greenfield development.
Completed 100% of our project feasibility documentation currently programmed for the 2013/14 and 2014/15 capital works programs and commenced feasibility studies for the 2015/16 capital works program, with 20% completed as at 30 June 2013.
Achieved 100% of our 2012/13 capital works program target ($261 million), which included flood recovery works. Ten of 12 major projects (greater than $5 million) and 25 of 35 minor projects (less than $5 million) were commissioned in 2012/13. Key drivers of our capital program include economic and population growth and environmental compliance.
Reviewed our planned maintenance approach to increase our focus on and resource allocation to planned maintenance activities. This has resulted in improved prioritisation and budgeting.

Queensland Urban Utilities Annual Report 2012/13 36
Strategic outcome Strategy 2012/13 Achievements and challenges
Optimal operational performance
Proactively pursue opportunities for operational efficiency
Introduced a new service delivery model across our five service territories. The new model will improve our customer service, productivity and responsiveness, which will lead to greater organisational efficiencies.
Introduced new rosters to improve the customer experience by minimising service disruptions from planned and reactive maintenance and reducing our incident response times.
Reduced our end-to-end delivery timeframes for new connections by implementing a revised application process, including a web-based application form for new connections. This streamlined approach has improved the customer experience.
Reduced cost-to-serve for design/application processing by adopting a management-by-exception approach.
Ensure that our systems and processes enable us to regularly monitor, review and improve our performance
Established governance groups and revised processes to improve our information management.
Implemented a new correspondence system to improve our management of incoming correspondence.
Commenced a fire hydrant testing program across all five service territories and introduced several electronic processes that have resulted in significant cost efficiencies.
Optimise our asset base with value-added initiatives
Optimised the biosolids dewatering process at our Luggage Point Sewage Treatment Plant, resulting in expected savings of over $500,000 per year. Similar improvements are being implemented at our other sewage treatment plants.
Recommenced operation of our thermal hydrolysis process in October 2012 after being out of service since January 2011 due to flood damage. Since the recommencement of operations, we have decreased our volume of sludge production and, subsequently, reduced sludge haulage costs.

Queensland Urban Utilities Annual Report 2012/1337
Strategic outcome Strategy 2012/13 Achievements and challenges
Optimal operational performance
Plan and deploy efficient and effective technology and systems
To facilitate our technical information, communication and technology (ICT) services separation from BCC, as well as improve the management of our key functions, we:
• implemented the required ICT organisational structure to support our outsourced operations,
• introduced an electronic document and records management system,
• consolidated multiple spatial systems and processes into a single enterprise-wide application providing a single of point of truth for spatial information.
• implemented a legal document and case management system, which links to the corporate electronic records system,
• implemented a new payroll system,• implemented our own Dial Before Your Dig service.
Commenced the development of our Supervisory Control and Data Acquisition (SCADA) strategy. SCADA is a control system used to identify and respond to faults and incidents in our network and captures much of the data used to optimise network performance. The strategy will provide a framework for the development, operation and maintenance of SCADA and will provide guidance in terms of the multi-million dollar investment expected over future years.
Ensure that our governance structure enhances efficient and effective decision making
Approved the following key policies and frameworks:
• asset management,• environmental,• reflux valve subsidy,• off-reticulation water mains,• infrastructure agreement,• complete set of supporting ICT policies.
Commenced preparation of asset management plans to support the revised asset management policy and framework.
Legal and regulatory compliance
Continue to comply with all regulatory requirements
Drinking Water Quality Management Plan approved by regulator.
Signed a Memorandum of Understanding (MoU) with the Queensland Fire and Rescue Service to ensure that legal obligations and community expectations for water flows required for fire fighting purposes are met.
Embraced changes to the Department of Environment and Heritage Protection’s reporting requirements, which broadened the requirements for notifying sewage spills. As a result, the number of spills we reported increased from 39 in 2011/12 to 61 in 2012/13. However, the volume of sewage spilled reduced from 10.3ML in 2011/12 to 6.6ML in 2012/13.
Environmental sustainability
Deliver best environmental practice
Developed and deployed Environmental Due Diligence training for all staff.
9 Delivering our services

Queensland Urban Utilities Annual Report 2012/13 38
Managing our assets effectively
Queensland Urban Utilities is committed to ensuring our
assets are safe, reliable, sustainable and remain available
for the benefit and evolving needs of our customers and
the community.
In 2012, we evaluated our asset management system
using the Water Services Association of Australia’s
Aquamark asset management benchmarking framework.
This comparative assessment showed that we are well
positioned both domestically and internationally.
The benchmarking exercise also highlighted a number of
opportunities for improvement. As a result, we have:
• introduced a corporate Asset Management Policy,
• adopted an Asset Management Framework,
• developed Asset Management Plans for all asset
classes,
• developed key performance indicators and associated
reporting to link strategic outcomes to asset
operations and management.
Asset management has been identified as an area that
can bring substantial savings to the organisation over
the coming years. As such, an Asset Management
Improvement Plan for 2014 -18 has been developed.
This portfolio of activities demonstrates our
commitment to:
• ensuring our assets and infrastructure are safe, reliable,
sustainable and remain available for the benefit of our
customers and the community,
• ensuring our staff have the right skills and competency
to manage all phases of the asset life cycle,
• greater accountability, risk management, service
management and financial efficiency.
Improving our treatment and reuse of biosolids
In 2012, the Queensland Urban Utilities Board
adopted a Biosolids Strategy to address the significant
operational and capital investment associated with the
treatment and ultimate reuse of biosolids.
Biosolids, which are generated at all 27 of our sewage
treatment plants, are nutrient-rich organic materials that
are a by-product of the sewage treatment process.
The strategy, which includes short, medium and
long-term actions, can be summarised into four key
performance areas:
1. Reduce biosolids volume and reuse cost
2. Increase renewable energy production
3. Increase operational savings
4. Maximise resource recovery and beneficial reuse
The short-term component of the strategy, which
is currently being delivered, focuses on improving
the dewatering facilities within several of our sewage
treatment plants. These facilities remove water from
sewage sludge, which reduces the volume of biosolids
produced and, therefore, lowers operational costs.
The strategy has been independently reviewed and
endorsed by a biosolids expert.
ICT Separation
Perhaps the greatest challenge Queensland Urban
Utilities faced as an organisation in 2012/13 was
the delivery of our ICT Separation Program – an
exceptionally complex piece of work to separate our
information, communication and technology (ICT) from
Brisbane City Council (BCC). To ensure the successful
delivery of this significant program of work, it was
divided into several smaller projects:
• corporate reporting,
• desktop, standard operating environment and rollout,
• separation of our core financial and procurement
systems,
• GIS implementation,
• HiAffinity billing,
• ICT managed services,
• legacy applications migration,
• mobile computing,
• payroll services,
• property data solution,
• telecommunication services.
Over four transition tranches, we successfully
separated all of our applications, software, data
and infrastructure requirements from BCC without
interruption to our customers.

9 Delivering our services
Procurement and Projects Advisory Group
The Procurement and Projects Advisory Group is
responsible for reviewing project feasibilities prior
to going to market and planning for the sourcing of
products and services. It also provides advice and
recommendations relating to the awarding of contracts.
The function of this group is to ensure that proper
consideration is given to determining the most
advantageous arrangements for Queensland Urban
Utilities when awarding contracts, and to provide a record
of appropriate governance in the procurement process.
Capital Works Program Committee
The Capital Works Program Committee is responsible
for reviewing:
• the progress of the delivery of the capital program,
• master plans and asset management plans,
• the feasibility of major projects and close-out reports,
• completion reviews of major projects.
The committee also approves entry of new major
projects ($5 million+) into the capital investment
program and provides advice to the Board in accordance
with project approval delegations.
Innovative fire hydrant testing
In 2012/13, we commenced a major program of work to
inspect and undertake maintenance work to all 98,000
fire hydrants across our service area within a two-year
period. As at 30 June 2013, all fire hydrants in Gatton and
Aratula had been tested, along with 630 fire hydrants in the
Ipswich area.
To cope with the high volume of hydrant testing, several
innovations have been introduced by the contracted
provider of the inspection program, Thiess Services.
Most notably, the inspection process is now completely
paperless, with all work issued electronically.
These improvements have resulted in significant cost
efficiencies for Queensland Urban Utilities.
In June 2013, Queensland Urban Utilities and
the Queensland Fire and Rescue Service signed a
Memorandum of Understanding, the purpose of which is
to document the procedures and communication activities
that both parties will adhere to so that legal obligations
and community expectations for water flows or fire fighting
purposes are met. This includes regularly reporting on the
number of hydrant clean-outs and repairs that we have
undertaken as part of our planned maintenance program.
Over two years, we will test and undertake necessary maintenance on all 98,000 fire
hydrants across our service territory.
Queensland Urban Utilities Annual Report 2012/1339

Engineering solutions to benefit our customers
Case study
During all planned and unplanned works, we strive to maintain water supply wherever possible
During all planned and unplanned infrastructure
repair works, we strive to maintain water supply
wherever possible. Below are two examples of how
we re-engineered solutions to ensure a positive
customer experience.
Construction of a new water main along William and
Albert Streets, Beaudesert, was scheduled for delivery
in July 2012. Original plans indicated that around 600
homes and businesses would lose water for periods of
time while the new main was connected into the existing
system. Determined to devise an alternative solution,
Queensland Urban Utilities staff reviewed the plans and,
by installing a number of valves and using bypass hosing,
were able to maintain water supply to all properties for
the entire schedule.
In Rathdowney, the construction of a new water main
was scheduled for between April and June 2013, which
would see the whole township without water supply
for periods of time during construction. In addition,
the reservoir required urgent repair. In response,
Queensland Urban Utilities staff reviewed all options
and, by installing three valves and establishing a
temporary reservoir, water supply was maintained
throughout the three-month construction period.
Queensland Urban Utilities Annual Report 2012/13 40
We strive to engineer solutions that promote a positive customer experience.

Consolidating technical standards
Case study
Greater consistency in technical standards across the region is expected to provide long-term benefits
In 2012/13, the development of the SEQ Water and
Sewerage Design and Construction Code marked a
new era in technical standards for water and sewerage
services infrastructure.
Under the South-east queensland Water (Distribution and
Retail Restructuring) act 2009, all South East Queensland
water distributor-retailers and Council-owned water
distributors were required to develop a uniform code
for the design and construction of new water supply and
sewerage assets.
In developing the code, Queensland Urban Utilities,
along with Unitywater and Gold Coast, Logan and
Redland City councils, undertook extensive consultation
with stakeholders from across the development and
construction industry.
The code includes design criteria, technical standards
based on the Water Services Association of Australia
national codes, asset information standards and
accepted products and materials lists.
It provides a single reference point for the design and
construction of water supply and sewerage infrastructure
across South East Queensland and replaces the many
documents that previously comprised the standards of
the individual water service providers, making it much
simpler for the development and construction industry
to conduct business in the region.
Greater consistency in technical standards across
the region is expected to provide long-term benefits,
including increased efficiency for engineering
consultants and construction contractors, greater ease
of compliance, product rationalisation for suppliers, and
ultimately lower costs for infrastructure provision.
Queensland Urban Utilities Annual Report 2012/1341
Queensland Urban Utilities' Team Leader Service Delivery Support, Peter Granzien.
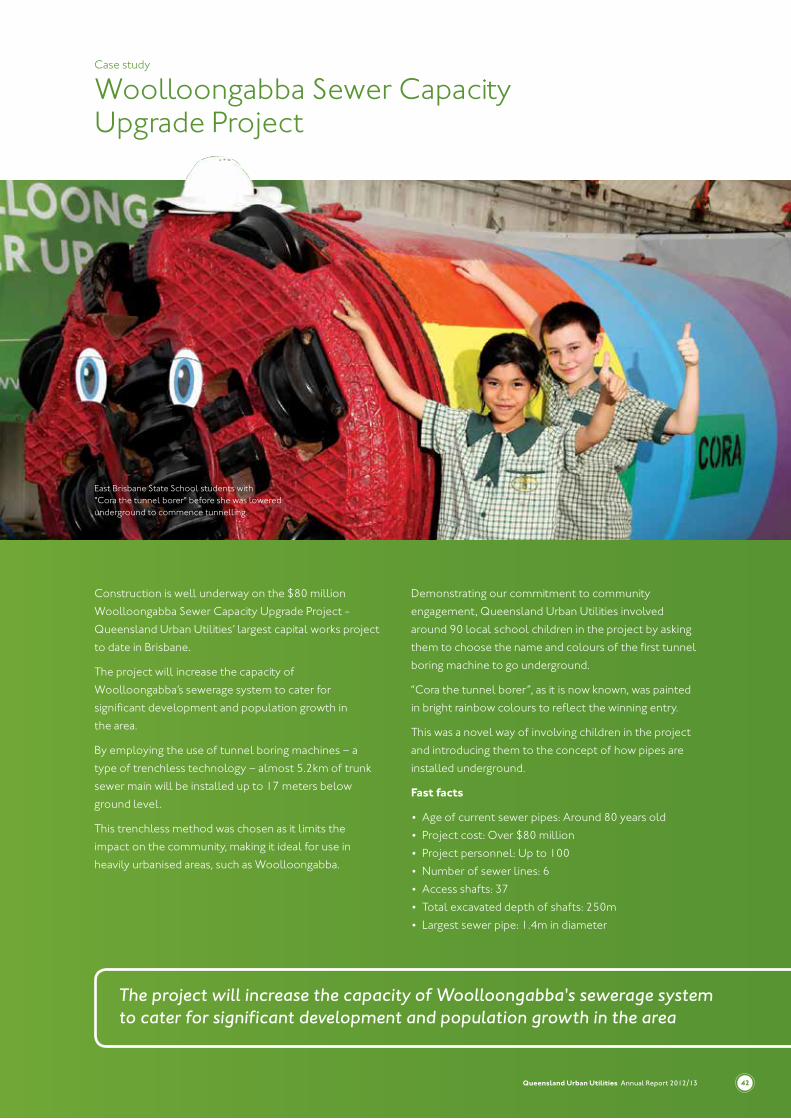
Woolloongabba Sewer Capacity Upgrade Project
Case study
The project will increase the capacity of Woolloongabba's sewerage system to cater for significant development and population growth in the area
Construction is well underway on the $80 million
Woolloongabba Sewer Capacity Upgrade Project -
Queensland Urban Utilities’ largest capital works project
to date in Brisbane.
The project will increase the capacity of
Woolloongabba’s sewerage system to cater for
significant development and population growth in
the area.
By employing the use of tunnel boring machines – a
type of trenchless technology – almost 5.2km of trunk
sewer main will be installed up to 17 meters below
ground level.
This trenchless method was chosen as it limits the
impact on the community, making it ideal for use in
heavily urbanised areas, such as Woolloongabba.
Demonstrating our commitment to community
engagement, Queensland Urban Utilities involved
around 90 local school children in the project by asking
them to choose the name and colours of the first tunnel
boring machine to go underground.
“Cora the tunnel borer”, as it is now known, was painted
in bright rainbow colours to reflect the winning entry.
This was a novel way of involving children in the project
and introducing them to the concept of how pipes are
installed underground.
Fast facts
• Age of current sewer pipes: Around 80 years old
• Project cost: Over $80 million
• Project personnel: Up to 100
• Number of sewer lines: 6
• Access shafts: 37
• Total excavated depth of shafts: 250m
• Largest sewer pipe: 1.4m in diameter
Queensland Urban Utilities Annual Report 2012/13 42
East Brisbane State School students with "Cora the tunnel borer" before she was lowered underground to commence tunnelling.

Queensland Urban Utilities Annual Report 2012/1343
9 Delivering our services
Caring for the environment
Managing our energy consumption
As part of our commitment to energy management, we
introduced a number of initiatives that focus on energy
management reporting actions. In 2012/13, we:
• progressed the development of the new Energy
Information Management System (EIMS) for energy
cost and data warehousing and electricity bill
validation,
• completed the installation of Electricity Metering
System (EMS) and dashboards for measuring,
monitoring and displaying electricity performance,
• completed the installation of Meter Data Agent
(Acumen) Interval Data System that provides detailed
energy data for performance reporting,
• continued installation of process sub-metering at
various sites,
• introduced monthly energy and emissions reporting to
management and the Board,
• appointed site energy facilitators at large consumption
sites to monitor and report on energy consumption,
including initiatives to reduce consumption through
revised operation of the site.
Changing with the climate
Aware of the challenges associated with global
warming, Queensland Urban Utilities is well-advanced
in the development of our Environmental Resilience
Plan (formally known as Climate Change Plan) and
Renewable Energy Plan.
Environmental resilience Plan
Once adopted, the Environmental Resilience Plan
will be delivered via two strategies: climate change
adaptation and climate change mitigation.
Adaptation strategies are needed to ensure
we can continue to deliver our services in a
changing climate and during extreme weather
events. By adopting adaptation strategies, we can
reduce the adverse impacts of climate change on
our operations.
Mitigation strategies will ensure we are contributing
to a reduction in greenhouse gas emissions. We will
assess our current level of emissions, implement
prioritised actions to reduce them, monitor our
performance and adjust our approach as new and
innovative ideas and technologies emerge.
As a broad policy commitment, we will include the
Environmental Resilience Plan objectives, priorities
and actions in all of our decision-making processes
and business practices.
renewable Energy Plan
Complementing the Environmental Resilience
Plan strategies are a number of strategies within our
Renewable Energy Plan, the purpose of which is to:
• embed long-term energy cost reductions through
prudent investment in renewable generation to
offset electricity purchases,
• achieve reductions in total emissions by a further
33,000 t CO2-e per year to a target level of
81,500 by 2018.
By implementing our Renewable Energy Plan,
we will position ourselves as an environmentally
responsible corporate citizen that delivers value
to our customers, communities and shareholders
through focused, sustainable and operationally-
efficient investment in renewable energy solutions.
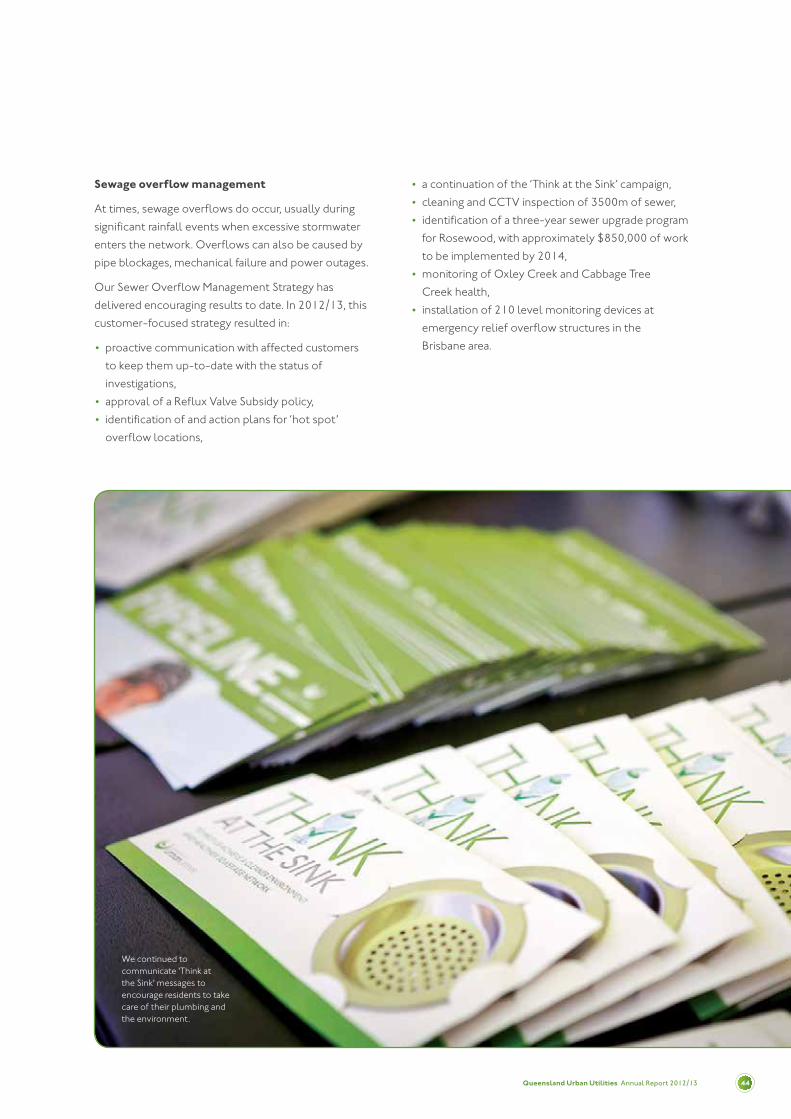
Queensland Urban Utilities Annual Report 2012/13 44
Sewage overflow management
At times, sewage overflows do occur, usually during
significant rainfall events when excessive stormwater
enters the network. Overflows can also be caused by
pipe blockages, mechanical failure and power outages.
Our Sewer Overflow Management Strategy has
delivered encouraging results to date. In 2012/13, this
customer-focused strategy resulted in:
• proactive communication with affected customers
to keep them up-to-date with the status of
investigations,
• approval of a Reflux Valve Subsidy policy,
• identification of and action plans for ‘hot spot’
overflow locations,
• a continuation of the ‘Think at the Sink’ campaign,
• cleaning and CCTV inspection of 3500m of sewer,
• identification of a three-year sewer upgrade program
for Rosewood, with approximately $850,000 of work
to be implemented by 2014,
• monitoring of Oxley Creek and Cabbage Tree
Creek health,
• installation of 210 level monitoring devices at
emergency relief overflow structures in the
Brisbane area.
We continued to communicate 'Think at the Sink' messages to encourage residents to take care of their plumbing and the environment.

Queensland Urban Utilities Annual Report 2012/1345
9 Delivering our services
Our commitment to healthy waterways
Queensland Urban Utilities is committed to improving
the health of our local waterways and continues to
deliver projects that highlight this.
One such project was the Helidon Sewage Treatment
Plant (STP) Upgrade, which achieved finalist status in
the Rural and Agriculture Award category of the 2013
Healthy Waterway Awards.
The upgrade involved the construction of reed beds
(gravel-filled tanks filled with common reed) to enhance
the plant’s treatment process while using minimal
electrical energy.
Treated sewage flows through the reeds, just below
the gravel surface, where suspended solids are trapped
among the roots. Bacteria that live in this environment
feed on the waste, in turn, treating the water in the most
natural way possible.
This cost-effective solution has improved the sewage
treatment process and has resulted in a significantly
smaller ecological footprint than alternative options.
Queensland Urban Utilities also achieved finalist status
in the Sustainable Development Award category for our
Aratula Sewage Treatment Plant Upgrade project. When
the plant first came into our possession in early 2012,
it was struggling to meet environmental compliance
regulations. By employing innovative ‘constructed
wetland’ technology, the plant now exceeds
environmental performance standards.
Reed beds treating sewage naturally in Helidon.

Queensland Urban Utilities Annual Report 2012/13 46
10 Sustainable growth
Performance summary 2012/13
Corporate objective: Deliver sustainable growth
Strategic outcome Strategy 2012/13 Achievements and challenges
Business positioning Understand our growth goals and consistently assess potential value-adding alliances
Continued to develop and implement our Business Sustainability Program.
Continued to implement a sustainable supply chain, working with our suppliers to positively influence their and our own ethical, social and environmental performance.
Implemented a community engagement alliance model with SEQ Catchments.
Commenced Global Reporting Initiative (GRI) reporting for sustainability.
Acquired Scientific Analytical Services Laboratory from Brisbane City Council (see case study on page 51).
Innovative research and development
Identify our potential technology, research and development partners and a funding strategy to engage with them
Appointed an Innovation, Research and Development Co-ordinator to develop business and research partnerships and evaluate innovative technology and process improvements under a centre-led and locally deployed research and development model.
Established and implemented the Research and Development Framework to deliver both a short-term targeted investment plan (1 – 5 years) and a long-term futures plan to 2030.
Developed an innovation framework, which captures ideas through a tiered approach, defining the benefits in relation to operational excellence.
Continued to progress projects through our partnerships with:
• Co-operative Research Centre for Water Sensitive Cities,• Australian Research Council, • Griffith University,• University of Queensland,• Isle Utilities’ Technology Approval Group.
Queensland Urban Utilities Annual Report 2012/1347
10 Sustainable growth
Innovation, research and development
Queensland Urban Utilities recognises that innovation
powered by collaboration and strategic partnerships is
essential for success. During 2012/13, we were involved
in the following projects:
Cooperative Research Centre for Water
Sensitive Cities
The Cooperative Research Centre (CRC) for Water
Sensitive Cities program brings together global
research, expertise and leadership to address the
challenges in urban water management.
The CRC for Water Sensitive Cities will produce blue
prints to help guide the management of urban water
resources for practitioners and developers. These
blue prints will also provide support for legislative
and regulatory reform, investment prioritisation,
design and construction of water sensitive cities,
and education and training of a skilled workforce to
provide safe, reliable and resilient water supplies
now and into the future.
As an essential participant of the CRC for Water
Sensitive Cities, Queensland Urban Utilities will
invest $1 million over nine years. Over this time, we
will regularly review performance data to ensure our
investment remains prudent.
We are currently assessing potential alignments
and outputs from our proposed developments
and projects with the following CRC for Water
Sensitive Cities program streams: society, water
sensitive urbanism, future technologies, and
adoption pathways.
Australian Research Council (ARC) Industry
Linkage Project – In-situ Electrochemical
Generation of Caustic and Oxygen from Sewage
Emission Control in Sewers
This research project focuses on sewer corrosion
and odour generation. Findings from this research
will increase our understanding of the chemical
conditions within our sewer network, which may lead
to extended asset life and reduced operating costs.
Queensland Urban Utilities will invest $100,000
over three years, plus in-kind contributions.
South East Queensland Residential End
Use Study
The South East Queensland Residential End Use
Study is a scientific collaboration between the
Queensland Government, CSIRO, The University of
Queensland and Griffith University.
It is designed to quantify and characterise mains
water end uses in South East Queensland. Stage
one tested around 70 homes located in various
South East Queensland regions, each home with
varying levels of water efficiency and no internally-
connected rain water tanks. Stage two included 320
homes located within Queensland Urban Utilities’
and Unitywater’s service regions.
The data collected will assist Queensland Urban
Utilities in adopting more accurate per capita
demands for our 1.3 million customers. The project’s
level of precision in tracking consumption levels
will help us better understand residential usage to
inform our planning for future grid infrastructure.
Enrichment of Anammox Microorganisms
Anammox – an abbreviation for Anaerobic
Ammonium Oxidation – is a globally-important
microbial process of the nitrogen cycle. It is an
energy-efficient, cost-effective nitrogen removal
process, which requires less oxygen and no
organic carbon, in contrast to the conventional
denitrification process.
We have commissioned the University of
Queensland’s Advanced Water Management Centre
to enrich anammox microorganisms in small sterile
reactor environments.
The next stage of the project will be to establish
a pilot enrichment process at one of our sewage
treatment plants, which will look to establish this
innovative denitrification process on a larger scale to
reduce energy usage and operating expenses.
Queensland Urban Utilities Annual Report 2012/13 48
Isle Utilities’ Technology Approval Group
Isle Utilities seeks to accelerate the market uptake of
step-change technologies by engaging the industry
during the pre-commercial stages of development
and by leveraging external investment from venture
capital investors.
Isle Utilities is a technology and innovation
consultancy specialising in clean technology, with
a track record in accelerating the development
and commercialisation of emerging technologies
through the Technology Approval Group (TAG) –
the industry forum that drives innovation.
During 2012/13, we commenced trialling
or continued to trial a number of emerging
technologies, including:
• Acoustic Sensing Technology’s SewerBatt product,
which uses acoustics to quickly and accurately
show what defects, breaks or blockages there may
be in a sewerage network,
• JD7’s non-disruptive water main CCTV and
condition assessment inspection device, which
is able to enter the network via small pressure
fittings, air valves, or gate valves, thereby
eliminating the time and costs associated
with excavating,
• the Aquatrip leak detection system, which
continuously monitors the flow of water into
a property and shuts off water automatically
in the event of a burst pipe, leaking fitting or
continuously running tap.
Our commitment to business sustainability and
sustainable growth
Business sustainability is the process by which
businesses manage their financial, social and
environmental risks, obligations and opportunities.
Queensland Urban Utilities is committed to excellence
in business sustainability and sustainable growth
management. Moreover, we strive to achieve and
maintain industry best practice in this field.
To assist us in reaching this goal, our operations are
influenced by five sustainability principles:
1. Natural sustainability involves natural resources and
ecological systems.
2. Social sustainability is the critical component of our
relationship with the community.
3. Human sustainability relates to the health,
knowledge, skills, motivation and intellectual output
of our employees.
4. Manufactured sustainability refers to all materials
goods and our infrastructure necessary to provide
our services.
5. Financial sustainability reflects the productive
power and monetary value of the other four types
of sustainability.

10 Sustainable growth
Sustainability programs
During 2012/13, we continued to demonstrate our
commitment to sustainability by implementing or
furthering a number of sustainability projects. A small
selection of these programs is detailed below.
Guided by the concept of ‘shared value creation’, our
Community Empowerment Program continues to
set the stage for our unique approach to community
engagement. The program involves local community
groups in ecological site rehabilitation, planning, and
decision-making. An example of this program in action
is our long-term relationship with the Bulimba Creek
Catchment Coordinating Committee.
In mid-2012, this approach was extended to encompass
regional non-governmental organisations, such as South
East Queensland Catchments (see case study on
page 50).
Our Corporate Social Responsibility Program is driven
by our firm commitment to minimise social impacts by
underpinning and supporting programs that establish
and maintain close relationships with community groups
and the wider community.
Our commitment to corporate social responsibility
is reflected in our advanced approach to community
engagement, which includes local community groups
and non-governmental organisations into our project
planning and decision-making process.
Our Sustainable Procurement Program
continues to develop models that incorporate
sustainability principles into all aspects of our
procurement process.
We are committed to taking our suppliers on a journey
towards sustainable procurement by encouraging them
to adopt a sustainability philosophy complementary to
our own.
Under the umbrella of our Measuring, Benchmarking,
Reporting and Assurance Program, we commenced
assessing and reporting our social, economic and
environmental performance against the Global
Reporting Initiative (GRI) guidelines. The GRI is a
non-profit organisation that promotes economic,
environmental and social sustainability. In 2012,
Queensland Urban Utilities joined GRI as an
organisational stakeholder to further our commitment
to improving our economic, environmental and social
performance, and advancing the sustainability
reporting agenda.
Queensland Urban Utilities’ 2012/13 annual Report has
been prepared in accordance with core GRI sustainability
reporting guidelines. The content index of standard
disclosures is available on the Queensland Urban
Utilities website.
Queensland Urban Utilities Annual Report 2012/1349
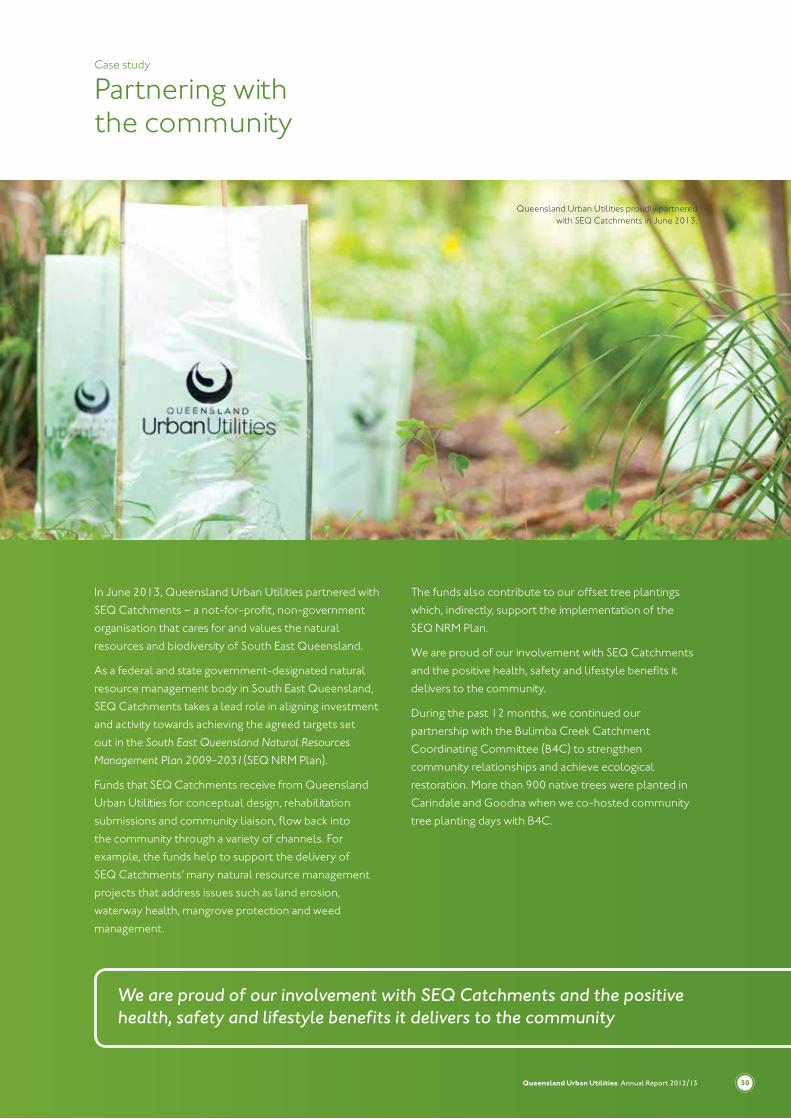
Partnering with the community
Case study
We are proud of our involvement with SEQ Catchments and the positive health, safety and lifestyle benefits it delivers to the community
In June 2013, Queensland Urban Utilities partnered with
SEQ Catchments – a not-for-profit, non-government
organisation that cares for and values the natural
resources and biodiversity of South East Queensland.
As a federal and state government-designated natural
resource management body in South East Queensland,
SEQ Catchments takes a lead role in aligning investment
and activity towards achieving the agreed targets set
out in the South east queensland Natural Resources
Management Plan 2009–2031(SEQ NRM Plan).
Funds that SEQ Catchments receive from Queensland
Urban Utilities for conceptual design, rehabilitation
submissions and community liaison, flow back into
the community through a variety of channels. For
example, the funds help to support the delivery of
SEQ Catchments’ many natural resource management
projects that address issues such as land erosion,
waterway health, mangrove protection and weed
management.
The funds also contribute to our offset tree plantings
which, indirectly, support the implementation of the
SEQ NRM Plan.
We are proud of our involvement with SEQ Catchments
and the positive health, safety and lifestyle benefits it
delivers to the community.
During the past 12 months, we continued our
partnership with the Bulimba Creek Catchment
Coordinating Committee (B4C) to strengthen
community relationships and achieve ecological
restoration. More than 900 native trees were planted in
Carindale and Goodna when we co-hosted community
tree planting days with B4C.
Queensland Urban Utilities Annual Report 2012/13 50
Queensland Urban Utilities proudly partnered with SEQ Catchments in June 2013.
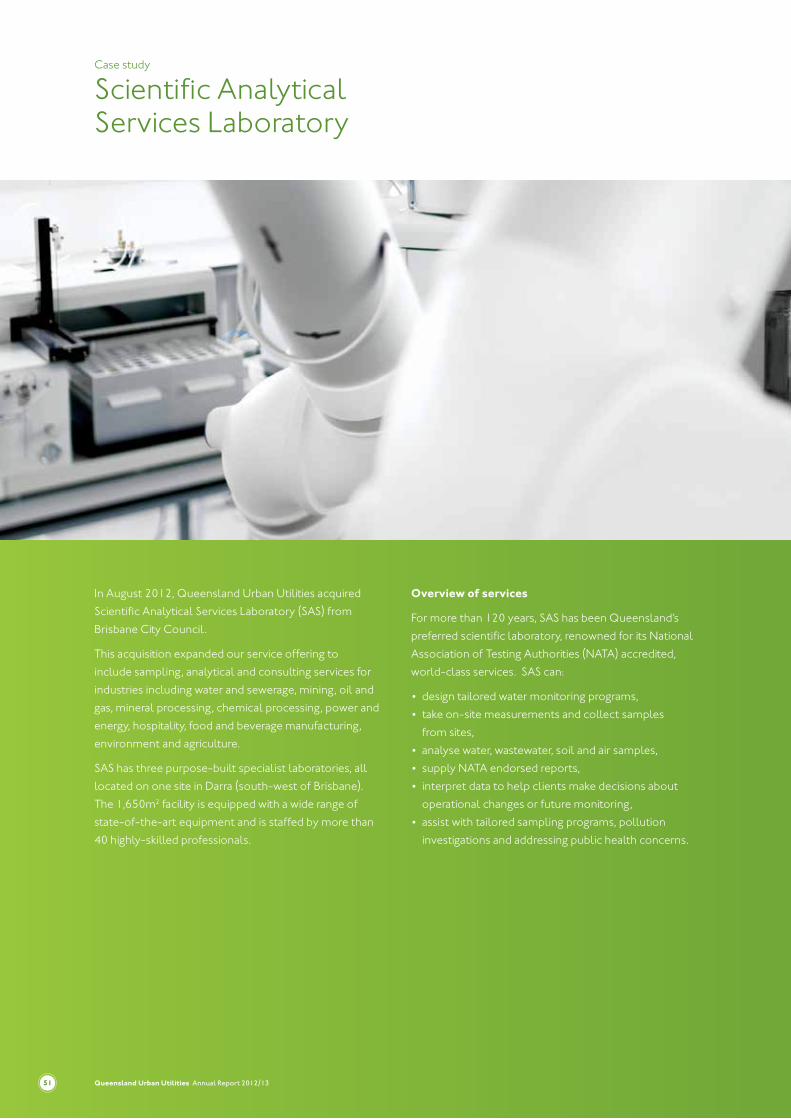
Scientific Analytical Services Laboratory
Case study
In August 2012, Queensland Urban Utilities acquired
Scientific Analytical Services Laboratory (SAS) from
Brisbane City Council.
This acquisition expanded our service offering to
include sampling, analytical and consulting services for
industries including water and sewerage, mining, oil and
gas, mineral processing, chemical processing, power and
energy, hospitality, food and beverage manufacturing,
environment and agriculture.
SAS has three purpose-built specialist laboratories, all
located on one site in Darra (south-west of Brisbane).
The 1,650m2 facility is equipped with a wide range of
state-of-the-art equipment and is staffed by more than
40 highly-skilled professionals.
Overview of services
For more than 120 years, SAS has been Queensland’s
preferred scientific laboratory, renowned for its National
Association of Testing Authorities (NATA) accredited,
world-class services. SAS can:
• design tailored water monitoring programs,
• take on-site measurements and collect samples
from sites,
• analyse water, wastewater, soil and air samples,
• supply NATA endorsed reports,
• interpret data to help clients make decisions about
operational changes or future monitoring,
• assist with tailored sampling programs, pollution
investigations and addressing public health concerns.
Queensland Urban Utilities Annual Report 2012/1351
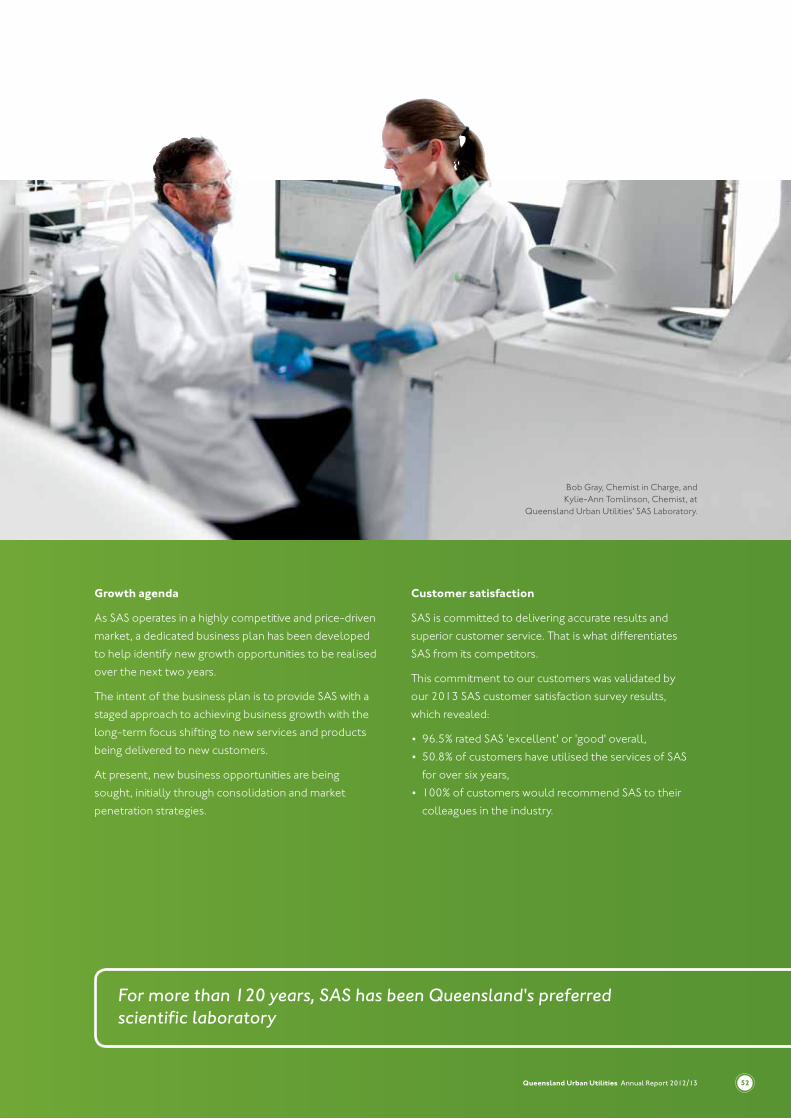
For more than 120 years, SAS has been Queensland's preferred scientific laboratory
Growth agenda
As SAS operates in a highly competitive and price-driven
market, a dedicated business plan has been developed
to help identify new growth opportunities to be realised
over the next two years.
The intent of the business plan is to provide SAS with a
staged approach to achieving business growth with the
long-term focus shifting to new services and products
being delivered to new customers.
At present, new business opportunities are being
sought, initially through consolidation and market
penetration strategies.
Customer satisfaction
SAS is committed to delivering accurate results and
superior customer service. That is what differentiates
SAS from its competitors.
This commitment to our customers was validated by
our 2013 SAS customer satisfaction survey results,
which revealed:
• 96.5% rated SAS 'excellent' or 'good' overall,
• 50.8% of customers have utilised the services of SAS
for over six years,
• 100% of customers would recommend SAS to their
colleagues in the industry.
Queensland Urban Utilities Annual Report 2012/13 52
Bob Gray, Chemist in Charge, and Kylie-Ann Tomlinson, Chemist, at
Queensland Urban Utilities' SAS Laboratory.
Queensland Urban Utilities Annual Report 2012/1353
11 Corporate governance
The aSX Corporate Governance Principles and
Recommendations are the basis upon which Queensland
Urban Utilities demonstrates its commitment to sound
corporate governance performance and practices.
Lay solid foundations for management
and oversight
Role of the Board
The Queensland Urban Utilities Board is made up
of independent, non-executive members who were
appointed in 2010 for terms varying from three to five
years (with the exception of our current Chairman,
Geoff Harley, who was appointed in October 2012).
The appointments were made in accordance with
the provisions of the South-east queensland Water
(Distribution and Retail Restructuring) act 2009.
The Board operates to a number of heads of power,
including, but not limited to, the South-east queensland
Water (Distribution and Retail Restructuring) act 2009.
The Queensland Urban Utilities Board is responsible
for setting and overseeing the organisation’s strategic
direction, and providing guidance on higher-order
operational matters.
To discharge its obligations and responsibilities, the
Board operates to an authorities and delegation
instrument, which describes the powers vested in and
reserved by the Board. This instrument was reviewed and
refreshed in 2012/13.
Outside of these reserved powers, the Chief Executive
Officer has the authority to manage and supervise the
day-to-day operations and activities of Queensland
Urban Utilities.
The Chief Executive Officer, in turn, sub-delegates
her powers, in accordance with Section 53(4) of the
South-east queensland Water (Distribution and Retail
Restructuring) act 2009 to officers through an instrument
of sub-delegation.
Membership criteria
Queensland Urban Utilities’ governing legislation
requires that the Board be comprised of a minimum of
four and a maximum of eight members, each of whom is
subject to retirement by rotation.
The appointed Board members bring a wealth of skills
and expertise to their roles, including, but not limited
to, experience in regulated utility, government, legal,
engineering, finance and audit environments.
Responsibilities of the Board
Under s32 of the South-east queensland Water
(Distribution and Retail Restructuring) act 2009, the
primary role of the Board is to decide Queensland
Urban Utilities’ strategies and supporting policies.
The Board also ensures that Queensland Urban
Utilities performs its functions and exercises its powers
in a proper, effective and efficient manner, and that it
complies with planning and reporting requirements.
The Board’s role and responsibilities are set out in a
Board Charter, and include:
1. Monitoring the implementation of policies, strategies,
and achievement against objectives.
2. Monitoring compliance with control and
accountability systems, regulatory requirements, and
ethical standards.
3. Ensuring that appropriate risk management
systems, internal control and reporting systems, and
compliance frameworks are in place and operating
effectively.
4. Informing and approving the business and capital
investment plans.
5. Tariff and price determination.
6. Approving the annual and long-term budgets,
including operational and capital expenditure.
7. Ensuring the preparation of accurate financial reports
and statements.
8. Reporting to shareholders on the performance and
state of Queensland Urban Utilities.
Structure that adds value

Queensland Urban Utilities Annual Report 2012/13 54
Board meetings
Board ordinary meetings are scheduled monthly in
accordance with the Board Charter. Recognising the
need to be flexible and adapt to changing environments
and circumstances, the Board, from time-to-time,
considers routine matters out-of-session by circular
resolution or by way of an extraordinary Board meeting
where the matter is complex, or requires fulsome
discussion.
A summary of attendance of Board members at ordinary
and extraordinary Board meetings is set out in Table 4.
To provide advice and support to the Board, the Chief
Executive Officer and General Counsel attended
ordinary and extraordinary Board meetings during the
2012/13 financial year.
Recognising the need for Board members to have
sufficient time to review, consider and seek information
prior to an ordinary Board meeting, management
circulates Board papers at least five business days before
ordinary meetings.
Committee meetings
The Board has three sub-committees to assist in
the execution of its duties, and to allow for detailed
consideration of complex issues or areas of special
interest:
1. Audit, Finance and Risk Committee,
2. Strategic Asset Management Committee,
3. Human Resource and Community Committee.
Each committee operates to a Terms of Reference,
which sets out its roles and responsibilities, composition,
structure, membership requirements and the manner in
which it is to operate.
A summary of attendance of Board members at
committee meetings is set out in Table 4.
Member BoardAudit, Finance
and Risk
Human Resources and
Community
Strategic Asset
Management
Ordinary Extraordinary
Term of Appointment* 12 3 8 9 7
Jude Munro** (5 years) 1 1 n/a n/a n/a
Geoff Harley (4 years) 9 1 5 7 4
Bernard Ponting (3 years) 12 3 8 n/a n/a
Barry Ball (3 years) 11 3 n/a n/a 6
Dennis Cavagna (4 years) 12 3 n/a n/a 7
Diana Eilert (4 years) 11 2 n/a 8 5
Paul Emmerson (3 years) 12 3 8 n/a 2***
Phil Kesby (4 years) 9 1 n/a 5 n/a
Len Scanlan (5 years) 11 2 8 n/a n/a
* all Board members appointed 25 June 2010, except Geoff Harley (Chairman), who was appointed in october 2012. Geoff was eligible to attend nine meetings in 2012/13.
** June Munro announced her retirement in July 2012. Jude was eligible to attend one meeting in 2012/13.***Not a standing committee member
Table 4 – Summary of attendance
Queensland Urban Utilities Annual Report 2012/1355
Recognise and manage risk
Risk and Assurance Framework
Our Risk and Assurance Framework ensures our
ability to manage risk by embedding culture and
capability that can rapidly adapt and respond to
dynamic changes, demands, opportunities and threats,
thereby safeguarding the sustainability and reputation of
the business.
The Queensland Urban Utilities Risk and Assurance
Framework was developed and implemented in
accordance with the AS/NZS ISO 31000:2009 Risk
Management – Principles and Guidelines. This enables
the achievement of organisational goals, compliance
with relevant legal and regulatory requirements,
facilitates risk-based planning and decision making,
promotes and supports a risk-focused culture and
improves organisational resilience.
Audit, Finance and Risk Committee
During 2012/13, the membership of the Audit, Finance
and Risk Committee was Len Scanlan (Chair), Bernard
Ponting and Paul Emmerson. Geoff Harley attended
in his capacity as Board Chairman. In 2012/13, the
committee was also attended by the Chief Executive
Officer, Chief Financial Officer, Principal Audit Officer,
the internal audit provider, Brisbane City Council’s Chief
Internal Auditor, and the Queensland Audit Office.
For transparency and good governance, the papers for
the committee are made available to the internal and
external auditors, and closed sessions are undertaken as
required with the internal and external auditors.
The Audit, Finance and Risk Committee provides
independent assurance to the Board on the suitability of
Queensland Urban Utilities’ accountability and control
framework. The committee oversees financial reporting
and internal control, risk and compliance and internal
audit and external audit.
The Audit Finance and Risk Committee has complied
with the objectives as set out in the Committee terms
of Reference.
In 2012/13, the Committee met eight times
(see page 54 for table of attendance) and conducted
the following activities:
• reviewed the organisation's audit activities,
• reviewed the final audit reports and considered key
findings released by the Chief Internal Auditor,
• monitored the implementation of audit
recommendations and actions,
• reviewed the annual financial statements,
• considered policies for recommendation to the Board,
• considered the financial Management Manual and
treasury Report,
• considered all recommendations by the external audit
and the Queensland Audit Office
• reviewed the Gifts and Benefits Register.
Internal audit review
Internal audit is an independent function within
Queensland Urban Utilities’ Office of the Chief
Executive Officer to assist the Chief Executive Officer in
the discharge of her responsibilities under the financial
accountability act 2009, and to provide an independent
review of internal system controls.
Brisbane City Council’s Assurance Security and Ethical
Standards unit has been engaged to perform the
internal audit function for Queensland Urban Utilities, in
accordance with an approved Internal Audit Charter and
2012/13 Audit Plan approved by the Audit, Finance and
Risk Committee. The internal audit function is performed
independently of management and authorised auditors.
Internal Audit has fulfilled its function in accordance with
the above requirements.
In 2012/13, Internal Audit undertook thirteen reviews
based on the organisation's risk profile and in accordance
with the internal audit plan. This excludes the ICT
Separation Audit carried out by external auditors.
The reviews are separated into six key categories:
internal control and risk management; major projects;
revenue assurance; service standards; continuous
assurance and special projects. The reviews supported
service delivery and internal control management with
recommendations for improvements made in the areas
of corporate and local governance.
In addition, assurance data reviews are also carried out
on a quarterly basis.
11 Corporate governance

Queensland Urban Utilities Annual Report 2012/13 56
Review days by key category, and business unit, are
shown in Tables 5 and 6 respectively.
Review areas 2012/13 Review days
Internal control and risk management 175
Major projects 30
Revenue assurance 30
Continuous assurance 59
Table 5 – Key review categories
Business unit Review days
Operations 20
OCEO 25
People and Safety 20
ICT 70
Finance 80
Customer and Community 20
Legal 20
Table 6 – Review days by business unit excluding continuous assurance
External scrutiny
The Queensland Audit Office is Queensland Urban
Utilities’ external auditor under the terms of the
financial accountability act 2009. Besides the report
on financial statements, no other government body,
including the Queensland Audit Office, issued any other
external scrutiny reports regarding the operations of
Queensland Urban Utilities.
Records management (Public Records Act)
Under the provisions of the Public Records act 2002,
we are required to make and keep full and accurate
records of our activities and have regard to any
relevant policy, standards and guidelines made by
the Queensland State Archivist about the making and
keeping of public records.
To facilitate our technical separation from Brisbane City
Council (BCC) in 2012/13, we:
• commenced an organisation-wide deployment
of our electronic document and records
management system,
• developed a supporting policy and
associated procedures,
• implemented a legal document and case
management system, which links to the corporate
electronic records system,
• implemented a correspondence management
work flow in the electronic document and
records management system to facilitate effective
management of customer correspondence.
We will continue to build on these initiatives during
2013/14 to further implement and enhance our record
keeping systems.
Prudent asset management
Strategic Asset Management Committee
The Strategic Asset Management Committee was
chaired by Barry Ball, with Diana Eilert and Dennis
Cavagna as standing members.
The committee is responsible for variety of functions,
including, but not limited to:
• providing advice to the Board on major strategic
initiatives and opportunities,
• providing advice to the Board with regard to the
short-term, medium-term and long-term asset
management plans and the required levels of funding,
• overseeing the enhancement of capital and asset
acquisition and replacement plans and associated
prioritisation processes,
• reviewing the capital expenditure programs to ensure
they have been prepared at the appropriate level.
During 2012/13, the committee maintained a watching
brief on Queensland Urban Utilities’ ICT Separation
Program and provided regular reports to the Board.
Queensland Urban Utilities Annual Report 2012/1357
11 Corporate governance
Remunerate fairly and responsibly
Human Resources and Community Committee
The primary function of this committee is to review and
provide direction on matters related to people, including
attraction and retention and human resource policies.
The committee also has a strong focus on safety, as well
as developing constructive and positive stakeholder
relationships with our customers, the community and
broader stakeholders.
During 2012/13, the committee maintained a
watching brief on the Enterprise Bargaining Agreement
(EBA2) negotiations.
The committee is chaired by Phil Kesby, with Geoff
Harley and Diana Eilert as standing members.
Promote ethical and responsible decision-making
Ethical standards and disclosures
The Board is acutely aware of its members’ obligations
to avoid conflicts of interest between their duties to
Queensland Urban Utilities and their personal interests.
A Conflicts of Interest policy has been in place for the
duration of the reporting period.
The policy sets out the obligation of Board members to
declare any material interests relevant to the activities of
Queensland Urban Utilities, and to ensure that conflict
arising from any material interest is noted and managed
in accordance with the policy.
Code of Conduct
Board members and employees are expected to
maintain the highest ethical standards in discharging
their responsibilities and duties.
Decisions made must be consistent with our
organisational values, our policies and procedures, and
overarching legislative requirements.
Official misconduct
Matters that raise a suspicion of official misconduct are
referred to the Crime and Misconduct Commission.
Where necessary, investigations are undertaken by
Brisbane City Council’s Assurance Security and Ethical
Standards Unit. Outcomes of the investigations are
reviewed and monitored.
Public Sector Ethics Act 1994
Queensland Urban Utilities’ Code of Conduct was
implemented in the latter half of 2011, with a review of
content set to occur in 2013/14.
All Queensland Urban Utilities’ employees are trained in
the Code of Conduct, with all new employees required to
complete online training.
All training is recorded in Queensland Urban Utilities’
learning and development training database, and dates
are set to remind employees to undertake online
refresher training every two years.
Queensland Urban Utilities’ Code of Conduct relies
heavily on the direction set by the Public Sector ethics
act in relation to the operation of the Act and the
application of ethical principles and obligations.
Queensland Urban Utilities’ Code of Conduct specifically
states where employees may take their concerns and
outlines possible ramifications if breaches of the Code
of Conduct occur.
Queensland Urban Utilities’ procedures and practices
support the Code of Conduct as employees are fully
aware of their obligations in regards to their ethics and
principles – these include their obligation to report
‘suspicions of misconduct’. Queensland Urban Utilities’
Code of Conduct makes direct reference to the four
ethics principles:
1. Integrity and impartiality
2. Promoting the public good
3. Commitment to the system of government
4. Accountability and transparency.
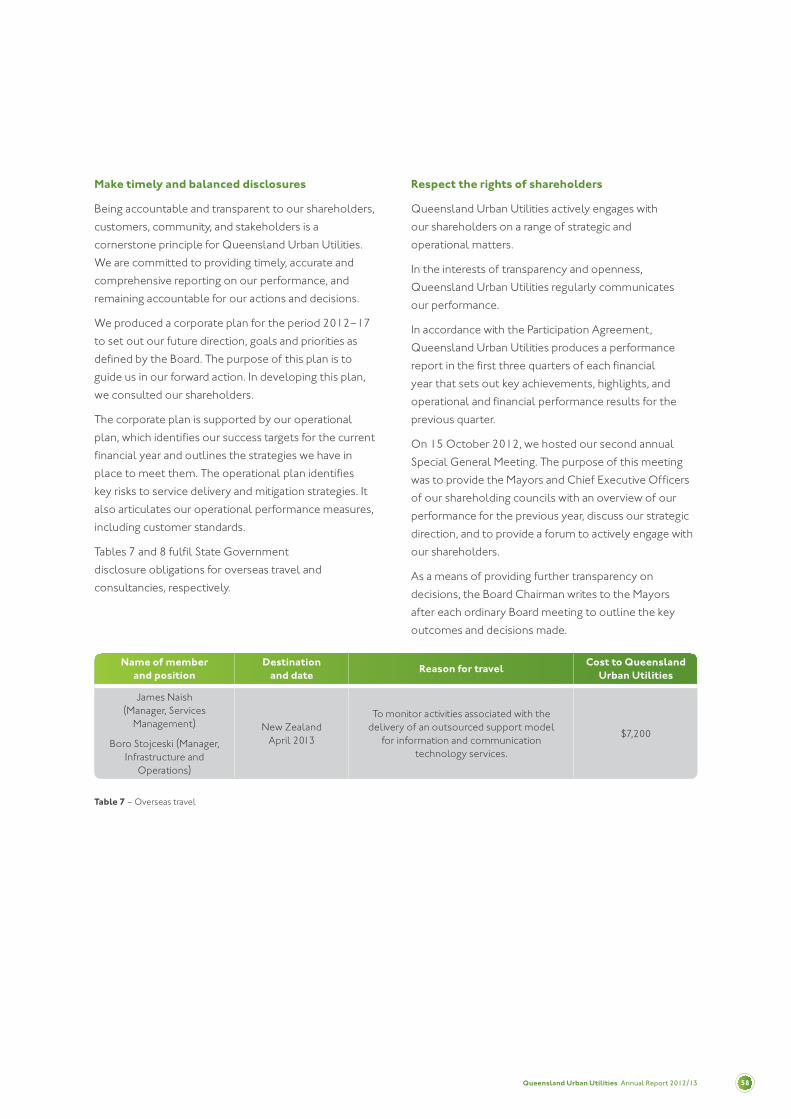
Queensland Urban Utilities Annual Report 2012/13 58
Make timely and balanced disclosures
Being accountable and transparent to our shareholders,
customers, community, and stakeholders is a
cornerstone principle for Queensland Urban Utilities.
We are committed to providing timely, accurate and
comprehensive reporting on our performance, and
remaining accountable for our actions and decisions.
We produced a corporate plan for the period 2012–17
to set out our future direction, goals and priorities as
defined by the Board. The purpose of this plan is to
guide us in our forward action. In developing this plan,
we consulted our shareholders.
The corporate plan is supported by our operational
plan, which identifies our success targets for the current
financial year and outlines the strategies we have in
place to meet them. The operational plan identifies
key risks to service delivery and mitigation strategies. It
also articulates our operational performance measures,
including customer standards.
Tables 7 and 8 fulfil State Government
disclosure obligations for overseas travel and
consultancies, respectively.
Respect the rights of shareholders
Queensland Urban Utilities actively engages with
our shareholders on a range of strategic and
operational matters.
In the interests of transparency and openness,
Queensland Urban Utilities regularly communicates
our performance.
In accordance with the Participation Agreement,
Queensland Urban Utilities produces a performance
report in the first three quarters of each financial
year that sets out key achievements, highlights, and
operational and financial performance results for the
previous quarter.
On 15 October 2012, we hosted our second annual
Special General Meeting. The purpose of this meeting
was to provide the Mayors and Chief Executive Officers
of our shareholding councils with an overview of our
performance for the previous year, discuss our strategic
direction, and to provide a forum to actively engage with
our shareholders.
As a means of providing further transparency on
decisions, the Board Chairman writes to the Mayors
after each ordinary Board meeting to outline the key
outcomes and decisions made.
Name of member and position
Destination and date
Reason for travelCost to Queensland
Urban Utilities
James Naish (Manager, Services
Management)
Boro Stojceski (Manager, Infrastructure and
Operations)
New Zealand April 2013
To monitor activities associated with the delivery of an outsourced support model
for information and communication technology services.
$7,200
Table 7 – Overseas travel
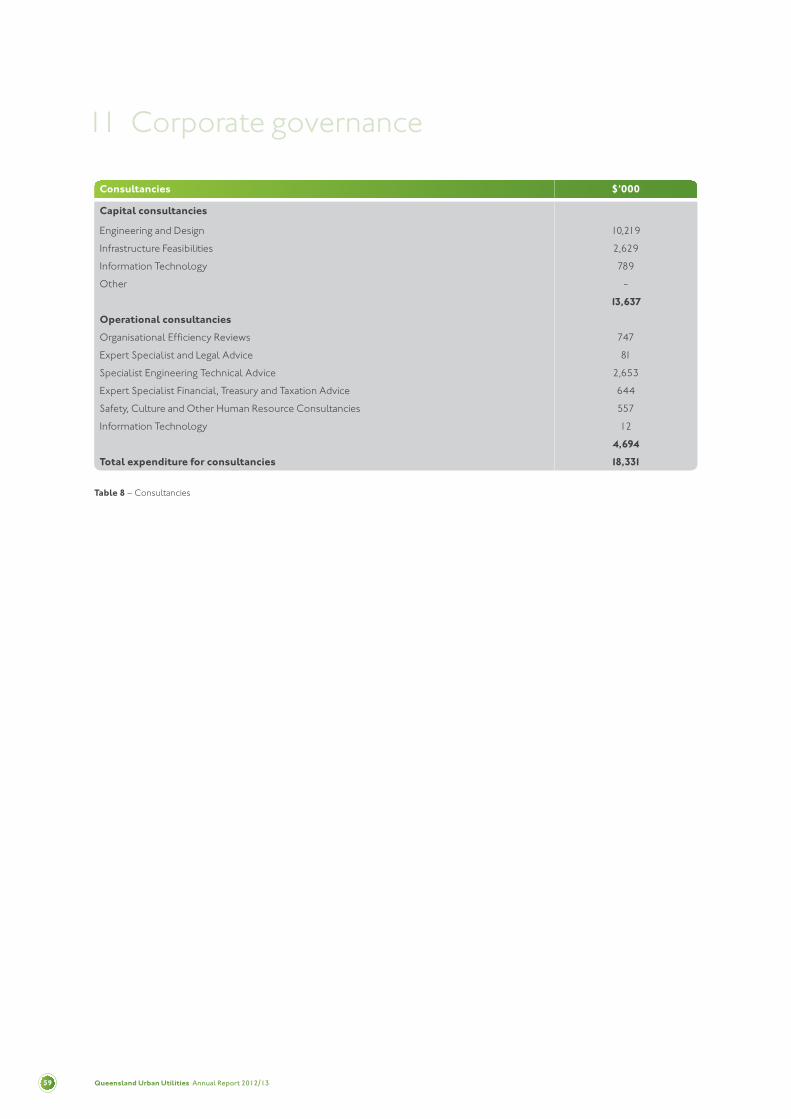
Queensland Urban Utilities Annual Report 2012/1359
11 Corporate governance
Consultancies $’000
Capital consultancies
Engineering and Design 10,219
Infrastructure Feasibilities 2,629
Information Technology 789
Other -
13,637
Operational consultancies
Organisational Efficiency Reviews 747
Expert Specialist and Legal Advice 81
Specialist Engineering Technical Advice 2,653
Expert Specialist Financial, Treasury and Taxation Advice 644
Safety, Culture and Other Human Resource Consultancies 557
Information Technology 12
4,694
Total expenditure for consultancies 18,331
Table 8 – Consultancies

Queensland Urban Utilities Annual Report 2012/13 60
12 Appropriate financial performance
Performance summary 2012/13
Corporate objective: Appropriate financial performance
Strategic outcome Strategy 2012/13 Achievements
Adequate cash flow Ensure that our systems and processes enable us to identify all potential funding opportunities
Continued to identify, define and achieve operational efficiencies.
Further optimised our capital program to ensure funds are directed to the highest priority works with consideration of changes to population projections.
Achieved 100% of our 2012/13 capital works program target.
Financial insight Manage our financial performance
Revenue 3.1% less than original budget due to major shortfall in developer revenues of $32.5 million. Excluding developer revenues, actual revenues were 0.24% higher than budget.
Total controllable expenditure within 0.5% of original budget.
Depreciation 5% less than budget due to no asset revaluation and savings from capital program.
Borrowing costs 9.1% less than budget due to lower than expected borrowings from capital program savings.
Operating profit before tax $13.9 million or 8.8% less than original budget.
Overall shareholding council returns $8.6 million or 4.7% less than original budget.
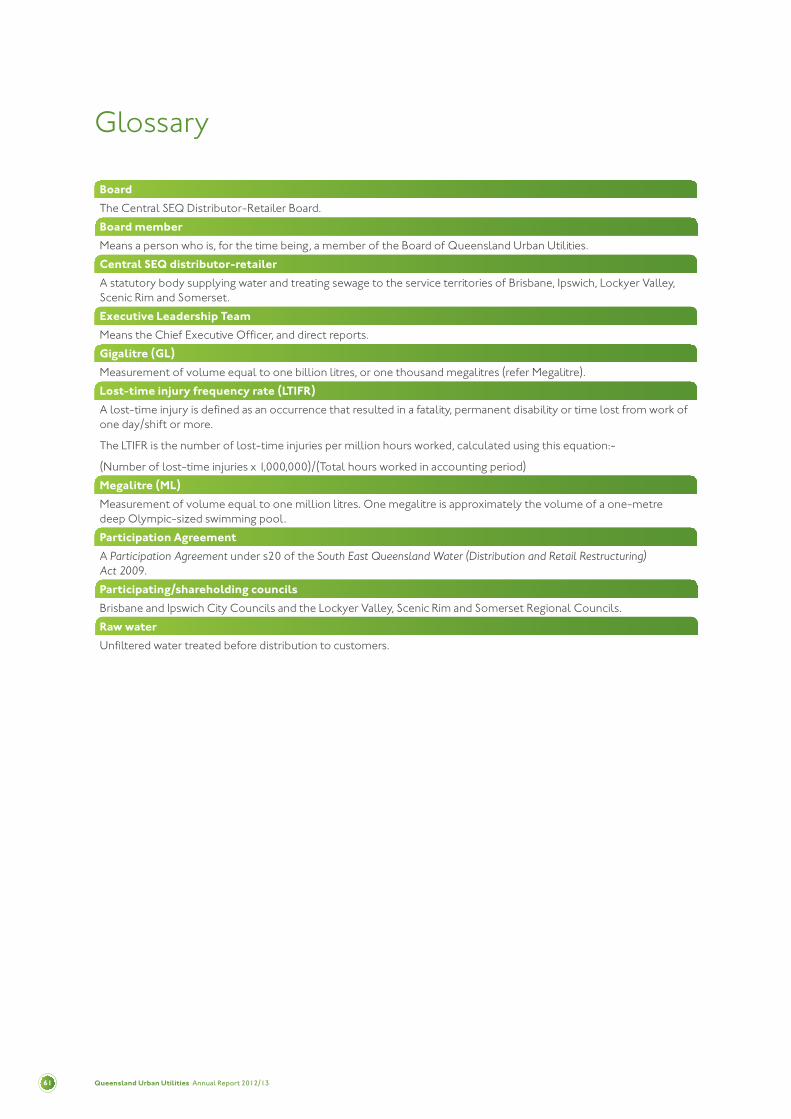
Queensland Urban Utilities Annual Report 2012/1361
Glossary
Board
The Central SEQ Distributor-Retailer Board.
Board member
Means a person who is, for the time being, a member of the Board of Queensland Urban Utilities.
Central SEQ distributor-retailer
A statutory body supplying water and treating sewage to the service territories of Brisbane, Ipswich, Lockyer Valley, Scenic Rim and Somerset.
Executive Leadership Team
Means the Chief Executive Officer, and direct reports.
Gigalitre (GL)
Measurement of volume equal to one billion litres, or one thousand megalitres (refer Megalitre).
Lost-time injury frequency rate (LTIFR)
A lost-time injury is defined as an occurrence that resulted in a fatality, permanent disability or time lost from work of one day/shift or more.
The LTIFR is the number of lost-time injuries per million hours worked, calculated using this equation:-
(Number of lost-time injuries x 1,000,000)/(Total hours worked in accounting period)
Megalitre (ML)
Measurement of volume equal to one million litres. One megalitre is approximately the volume of a one-metre deep Olympic-sized swimming pool.
Participation Agreement
A Participation agreement under s20 of the South east queensland Water (Distribution and Retail Restructuring) act 2009.
Participating/shareholding councils
Brisbane and Ipswich City Councils and the Lockyer Valley, Scenic Rim and Somerset Regional Councils.
Raw water
Unfiltered water treated before distribution to customers.
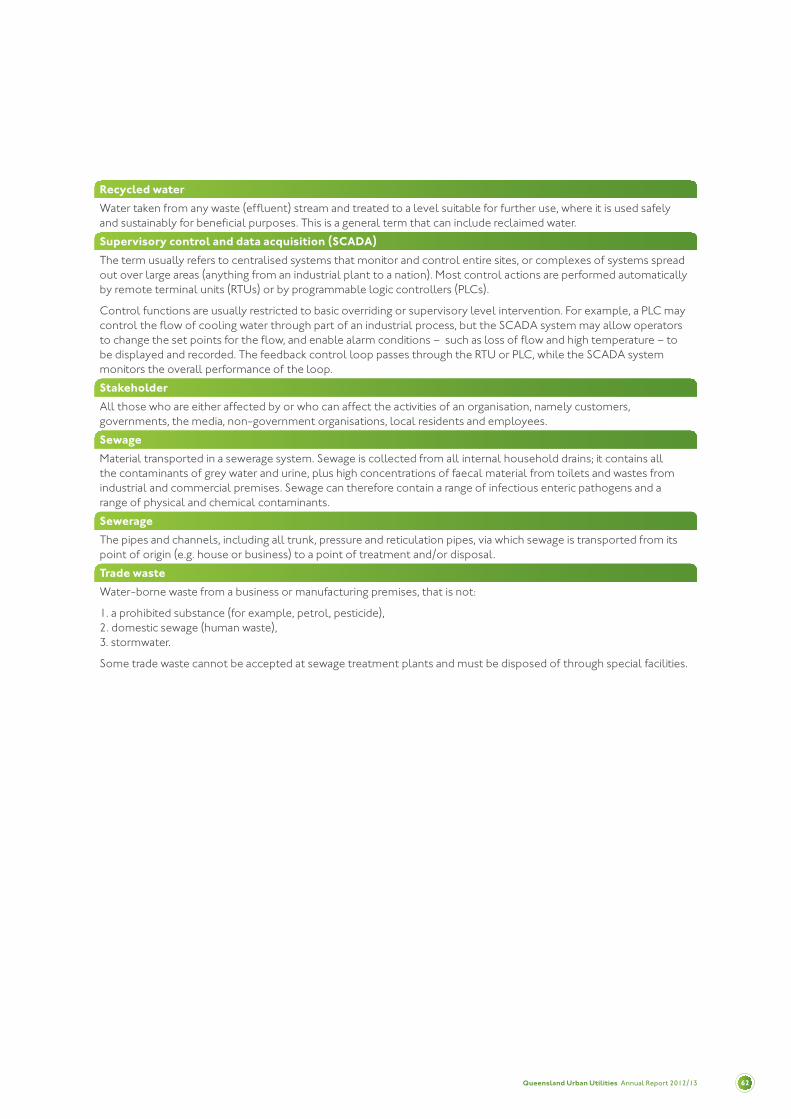
Queensland Urban Utilities Annual Report 2012/13 62
Recycled water
Water taken from any waste (effluent) stream and treated to a level suitable for further use, where it is used safely and sustainably for beneficial purposes. This is a general term that can include reclaimed water.
Supervisory control and data acquisition (SCADA)
The term usually refers to centralised systems that monitor and control entire sites, or complexes of systems spread out over large areas (anything from an industrial plant to a nation). Most control actions are performed automatically by remote terminal units (RTUs) or by programmable logic controllers (PLCs).
Control functions are usually restricted to basic overriding or supervisory level intervention. For example, a PLC may control the flow of cooling water through part of an industrial process, but the SCADA system may allow operators to change the set points for the flow, and enable alarm conditions – such as loss of flow and high temperature – to be displayed and recorded. The feedback control loop passes through the RTU or PLC, while the SCADA system monitors the overall performance of the loop.
Stakeholder
All those who are either affected by or who can affect the activities of an organisation, namely customers, governments, the media, non-government organisations, local residents and employees.
Sewage
Material transported in a sewerage system. Sewage is collected from all internal household drains; it contains all the contaminants of grey water and urine, plus high concentrations of faecal material from toilets and wastes from industrial and commercial premises. Sewage can therefore contain a range of infectious enteric pathogens and a range of physical and chemical contaminants.
Sewerage
The pipes and channels, including all trunk, pressure and reticulation pipes, via which sewage is transported from its point of origin (e.g. house or business) to a point of treatment and/or disposal.
Trade waste
Water-borne waste from a business or manufacturing premises, that is not:
1. a prohibited substance (for example, petrol, pesticide),2. domestic sewage (human waste), 3. stormwater.
Some trade waste cannot be accepted at sewage treatment plants and must be disposed of through special facilities.

Queensland Urban Utilities Annual Report 2012/1363
20 Other current assets 80
21 Property, plant and equipment reconciliation 81
22 Intangible assets 82
23 Key assumptions used in valuation 82
24 Income tax expense/(benefit) 83
25 Interest bearing liabilities 84
26 Employee benefits 85
27 Trade and other payables 85
28 Other current liabilities 85
29 Contributed equity 86
30 Asset revaluation surplus by class 87
31 Financial instruments 87
32 Operating leases 92
33 Capital and other commitments 92
34 Contingencies 93
35 Superannuation 94
36 Funds held in trust 96
37 Key management personnel and remuneration 97
38 Related parties 101
39 Significant weather events 103
Management Certificate 104
Independent Auditor’s Report 105
Statement of Comprehensive Income 64
Statement of Financial Position 65
Statement of Changes in Equity 66
Statement of Cash Flows 67
Index to notes to the financial statements 68 1 Reporting entity 68
2 Basis of preparation 68
3 Significant accounting policies 69
4 Utility charges 76
5 Contributions, grants and subsidies 76
6 Insurance 76
7 Interest received 76
8 Fees and charges 76
9 Other revenue 76
10 Employee expenses 77
11 Bulk water purchases 77
12 Materials and services 77
13 Depreciation and amortisation 77
14 Finance/ borrowing costs 78
15 Loss on disposal of assets 78
16 Other expenses 78
17 Cash and cash equivalents 79
18 Trade and other receivables 80
19 Inventories 80
ContentsFor the year ended 30 June 2013
Central SEQ Distributor-Retailer Authority

Queensland Urban Utilities Annual Report 2012/13 64
Notes2013
$’0002012
$’000
Revenue
Utility charges 4 803,835 750,576
Contributions, grants and subsidies 5 105,342 125,853
Insurance 6 7,979 -
Interest received 7 1,451 3,220
Fees and charges 8 29,936 26,461
Other revenue 9 2,396 5,409
Total operating revenue 950,939 911,519
Expenses
Employee expenses 10 97,009 84,597
Bulk water purchases 11 271,254 224,192
Materials and services 12 161,277 143,398
Depreciation and amortisation 13 146,852 137,702
Finance/borrowing costs 14 117,704 117,823
Loss on disposal of assets 15 4,400 6,793
Other expenses 16 9,233 9,185
Total operating expenses 807,729 723,689
Profit before income tax equivalent 143,210 187,830
Income tax equivalent 24 40,029 55,556
Profit for the year 103,181 132,274
Other comprehensive income
Items that will not be reclassified to profit or loss:
Increase in asset revaluation surplus 30 154,023 -
Defined benefit plan actuarial gains (losses) 35c 167 (478)
Total other comprehensive income 154,190 (478)
Total comprehensive income 257,371 131,796
the accompanying notes form part of these statements.
Statement of Comprehensive IncomeFor the year ended 30 June 2013
Central SEQ Distributor-Retailer Authority

Queensland Urban Utilities Annual Report 2012/1365
Statement of Financial Positionas at 30 June 2013
Central SEQ Distributor-Retailer Authority
Notes2013
$’0002012
$’000
Current assets
Cash and cash equivalents 17 56,291 77,806
Trade and other receivables 18 28,069 27,253
Inventories 19 2,529 2,428
Current income tax receivable 20 277 -
Other current assets 20 128,425 149,273
Total current assets 215,592 256,760
Non current assets
Property, plant and equipment 21 4,933,315 4,506,589
Intangible assets 22 15,008 1,854
Deferred tax assets 24 36,532 29,530
Defined benefit plan 35 780 613
Total non-current assets 4,985,635 4,538,586
Total assets 5,201,227 4,795,346
Current liabilities
Trade and other payables 27 40,457 36,069
Employee benefits 26 34,007 29,785
Current income tax payable 28 - 23,032
Other current liabilities 28 98,138 90,083
Provision for participation rights 29 22,638 59,759
Total current liabilities 195,240 238,728
Non current liabilities
Trade and other payables 27 9,025 476
Employee benefits 26 2,991 2,697
Interest bearing liabilities 25 2,019,895 1,874,895
Deferred tax liabilities 24 119,662 42,455
Total non current liabilities 2,151,573 1,920,524
Total liabilities 2,346,813 2,159,252
Net assets 2,854,414 2,636,094
Equity
Contributed equity 29c 2,538,793 2,538,793
Asset revaluation surplus 30 154,023 -
Retained earnings 161,598 97,301
Total equity 2,854,414 2,636,094
the accompanying notes form part of these statements.

Queensland Urban Utilities Annual Report 2012/13 66
Statement of Changes in EquityFor the year ended 30 June 2013
Central SEQ Distributor-Retailer Authority
Notes
Retained earnings
$’000
Asset revaluation
surplus $’000
Contributed equity $’000
Total $’000
Balance as at 1 July 2011 40,667 - 2,538,793 2,579,460
Contributions by and distributions to Participants
Participation return to Participants 29 (75,163) - - (75,163)
Total contributions by and distributions to Participants (75,163) - - (75,163)
Profit for the year 132,274 - - 132,274
Other comprehensive income
Defined benefit plan actuarial gains (losses) 35c (478) - - (478)
Total comprehensive income for the year 131,796 - - 131,796
Balance as at 30 June 2012 97,301 - 2,538,793 2,636,093
Balance as at 1 July 2012 97,301 - 2,538,793 2,636,093
Contributions by and distributions to Participants
Participation return to Participants 29 (39,051) - - (39,051)
Total contributions by and distributions to Participants (39,051) - - (39,051)
Profit for the year 103,181 - - 103,181
Other comprehensive income
Defined benefit plan actuarial gains (losses) 35c 167 - - 167
Increase in asset revaluation surplus 30 - 154,023 - 154,023
Total comprehensive income for the year 103,348 154,023 - 257,371
Balance as at 30 June 2013 161,598 154,023 2,538,793 2,854,414
the accompanying notes form part of these statements.

Queensland Urban Utilities Annual Report 2012/1367
Statement of Cash FlowsFor the year ended 30 June 2013
Central SEQ Distributor-Retailer Authority
Notes2013
$’0002012
$’000
Cash flows from operating activities
inflows: 862,761 816,312
Receipts from customers 89,980 86,815
Developer cash contributions 1,627 3,312
Interest received 42,366 36,711
GST input tax credits from ATO 659 1,428
GST collected from customers 997,392 944,578
outflows:
Employee expenses (103,461) (95,658)
Suppliers and services (445,138) (397,817)
Finance and borrowing costs (123,104) (119,441)
Income tax (58,940) (42,360)
GST paid to suppliers (42,366) (40,736)
GST remitted to ATO (622) (1,358)
(773,631) (697,368)
Net cash provided by (used in) operating activities 17b 223,761 247,210
Cash flows from investing activities
inflows:
Proceeds from sale of plant and equipment 1,047 871
outflows:
Payments for property, plant and equipment (315,151) (289,581)
Net cash provided by (used in) investing activities (314,104) (288,710)
Cash flows from financing activities
inflows:
Borrowings 145,000 99,910
outflows:
Participation rights payments 29 (76,173) (58,035)
Net cash provided by (used in) financing activities 68,827 41,874
Net increase (decrease) in cash and cash equivalents (21,515) 374
Cash and cash equivalents at the beginning of the financial year 77,806 77,432
Cash and cash equivalents at the end of the financial year 17 56,291 77,806
the accompanying notes form part of these statements.

Queensland Urban Utilities Annual Report 2012/13 68
Notes to and forming part of the Financial Statements 2012-2013
Central SEQ Distributor-Retailer Authority
1. Reporting entity
The Central SEQ Distributor-Retailer Authority (the Authority) was established under the South-east queensland Water (Distribution and Retail Restructuring) act 2009 (the Act) and is a Statutory Body under the financial accountability act 2009 and the Statutory Bodies financial arrangements act 1982 (SBfa).
Under the Act, governance arrangements for the new Authority were established in a Participation Agreement, which became operative from 25 June 2010. The participants are Brisbane City, Ipswich City, Lockyer Valley Regional, Scenic Rim Regional and Somerset Regional Councils.
The assets, liabilities, instruments and employees of the five participating Councils’ water distribution and sewerage operations were transferred to the Authority as a result of the Act and by the Queensland Government gazettal of the First and Second Transfer Schemes on 29 June 2010 and 30 September 2010 respectively . The value of the net assets transferred from the Councils to the Authority has been calculated using a regulatory asset base (RAB) valuation approved by the Queensland Government to represent the market value of the business. This valuation was prepared to underpin the water pricing methodology currently under review by the Queensland Competition Authority. The final transfer notice was completed prior to 30 June 2012.
In return for the net assets transferred to the Authority, each Council participates in the Authority based on its share of the RAB, comprising debt and participation rights as agreed by the five Councils and the Authority in the ratio of 40 to 60.
Section 10(1) of the Act states that the Authority expires at the end of 99 years from when it was established on 3 November 2009. On expiration (a) the Authority’s assets and liabilities become the assets and liabilities of its participants; and (b) the participants become the successor in law of the assets and liabilities rateably in accordance with their participation rights under the participation agreement.
The primary functions of the Authority are to do the following for its geographic area –
(a) purchase water; (b) distribute water; (c) provide the following services to customers – i. water services; ii. wastewater services; (d) charge customers for relevant services; (e) manage customer enquiries, service requests and
complaints; (f) on and from 1 July 2010 – i. perform functions under the South-east queensland
Water (Distribution and Retail Restructuring) act 2009 and the Water Supply act relating to trade waste and seepage water as a sewerage service provider; and
ii. perform particular planning and development assessment functions under the Planning act;
(g) anything else likely to complement or enhance a function mentioned in paragraphs (a) to (f).
The Authority trades as Queensland Urban Utilities and is a “for profit” entity. The registered office is Level 2, 15 Green Square Close, Fortitude Valley, Brisbane, QLD 4006.
2. Basis of preparation
(a) Statement of compliance
These financial statements are general purpose financial statements and have been prepared for the period 1 July 2012 to 30 June 2013 in accordance with:
• Australian Accounting Standards (AASBs) and Interpretations; • the financial accountability act 2009;• the financial and Performance Management Standard 2009; • the Financial Reporting Requirements for Queensland
Government agencies (as applicable to statutory bodies); and• applying the exemptions under the South-east queensland
Water (Distribution and Retail Restructuring) act 2009.
The financial statements were authorised for issue by the Board on 26 August 2013.
(b) Basis of measurement
The financial statements have been prepared on an accrual basis and, except where stated, in accordance with the principles of historical cost.
(c) Presentation currency and comparatives
Amounts included in the financial statement are in Australian dollars and have been rounded to the nearest $1,000 or, where that amount is $500 or less, zero, unless disclosure of the full amount is specifically required. Amounts shown in this financial report may not add to the correct sub-totals or totals due to rounding.
Comparative information has been restated where necessary to be consistent with disclosures in the current reporting period.
(d) Use of estimates and judgements
The preparation of financial statements requires management to make judgements, estimates and assumptions that affect the application of accounting policies and the reported amounts of assets, liabilities, income and expenses. Actual results may differ from these estimates.
Estimates and underlying assumptions are reviewed on an on-going basis. Revisions to accounting estimates are recognised in the period in which the estimate is revised and in any future period affected.
In particular, information about specific areas of estimate, uncertainty and critical judgement in applying accounting policies that have a significant effect on the amounts recognised in the financial statements are described in the following notes:
Note 21 - Property, plant and equipment reconciliationNote 22 - Intangible assetsNote 23 - Key assumptions used in valuation Note 34 - Contingencies
(i) Impairment
Queensland Urban Utilities assesses impairment at each reporting date by evaluating conditions specific to Queensland Urban Utilities that may lead to impairment of assets. In accordance with the provisions of AASB136 impairment of assets, where an indicator of impairment exists, the recoverable amount of the asset is determined. Value-in-use and fair value less costs to sell calculations performed in assessing recoverable amounts incorporate a number of key assumptions (refer to note 23).
Queensland Urban Utilities Annual Report 2012/1369
Notes to and forming part of the Financial Statements 2012-2013
Central SEQ Distributor-Retailer Authority
2. Basis of preparation (contd)
(d) Use of estimates and judgements (contd)
(ii) Provision for impairment of receivables
A provision for impairment of receivables has been made at year end, refer note 18.
(e) Going concern
The financial statements have been prepared on a going concern basis in accordance with AASB 101 Presentation of financial Statements.
(f) New and revised accounting standards
Queensland Urban Utilities did not voluntarily change any of its accounting policies for the year ended 30 June 2013. No amendments to Australian Accounting Standards applicable for the first time for the year ended 30 June 2013 were relevant to Queensland Urban Utilities. Changes applicable for the first time for the year ended 30 June 2013 have had minimal effect on the financial statements, as explained below:
AASB 2011-9 amendments to australian accounting Standards – Presentation of items of other Comprehensive income The only significant impact from AASB 2011-9 will be that, in the Statement of Comprehensive Income, items within the “Other Comprehensive Income” section will need to be presented in separate sub-sections, according to whether or not they are subsequently re-classifiable to the operating result. Whether or not subsequent reclassification is possible depends on the requirements or conditions in the accounting standard/ interpretation that relates to the item concerned.
A number of new standards, amendments to standards and interpretations are effective for annual periods beginning on or after 1 July 2013. Queensland Urban Utilities has not applied any amendments or standards that have been issued but are not yet effective. Queensland Urban Utilities does not plan to early adopt any standards or interpretations and the extent of the impact of these has not been determined. Expected impacts of new or amended standards with future commencement dates applicable to 2013/2014 are set out below:
AASB13 fair Value Measurement sets out a new definition of “fair value” as well as new principles to be applied when determining the fair value of assets and liabilities. This requirement will apply to all assets and liabilities (excluding leases) that are measured and/or disclosed at fair value. AASB13 will require increased disclosure. A review of methodologies, including instructions to valuers, data used and assumptions has been made and no material impacts are expected.
AASB119 employee Benefits changes requirements for the measurement of employer liabilities/assets arising from defined benefit plans and the measurement and presentation of changes in such liabilities/assets. As Queensland Urban Utilities has only a small number of staff remaining in the defined benefit plan for LG Super, the impact of this change will be immaterial.
All other Australian accounting standards and interpretations with future commencement dates are either not applicable or have no material impact on Queensland Urban Utilities.
3. Significant accounting policies
(a) Revenue
(a)(i) Utility charges
Utility charges are recognised as revenue on an accrual basis in the period to which they relate. Queensland Urban Utilities issues utility accounts quarterly and monthly with water consumption billed in arrears and the fixed service charge generally billed in advance. An estimation of unbilled water consumption is performed monthly, based on historical information of the customers’ usage and accrued revenue is recognised for this amount. Accruals or prepayments are recognised for fixed access charges billed in arrears or advance.
(a)(ii) Contributions
Developer contributions Queensland Urban Utilities finances part of its capital works infrastructure program through non-refundable contributions from developers. These contributions received may be in the form of a non-cash contribution (assets) and/or a cash contribution.
Non-cash contributions Non-cash contributions from developers such as water and sewerage infrastructure are recognised as revenue and as non-current assets when the authority obtains control of the assets and becomes liable for any ongoing maintenance. These contributed assets are recognised at their fair value.
Cash contributions Non-refundable cash contributions from developers towards the cost of water supply and sewerage infrastructure are collected by Councils on behalf of Queensland Urban Utilities and transferred to Queensland Urban Utilities when received. Cash developer contributions for specific assets are recognised as a liability where that specific asset has not been constructed at balance date. Cash contributions for assets already constructed or for which there are no performance obligations are recognised as revenue on receipt.
(a)(iii) Grants and subsidies
Grants and subsidies that are non-reciprocal in nature are recognised as revenue in the year in which control is obtained. Where grants and subsidies are reciprocal in nature, revenue is recognised over the term of funding arrangements.
(a)(iv) Interest
Interest income is recognised as it accrues in the Statement of Comprehensive Income, using the effective interest method.
(a)(v) Insurance
Insurance income is recognised when there is near certainty that a claim will be approved and the funds will be received.
(a)(vi) Other services
Revenue from rendering of a service is recognised upon the delivery of the service to the customers and includes fees and charges from the approved fees and charges schedule and from quotes for services.
Queensland Urban Utilities Annual Report 2012/13 70
Notes to and forming part of the Financial Statements 2012-2013
Central SEQ Distributor-Retailer Authority
3. Significant accounting policies (contd)
(b) Cash and cash equivalents
Cash and cash equivalents includes cash on hand, all cash and cheques receipted but not banked at year end, deposits held at call with financial institutions, other short-term, highly liquid investments with original maturities of three months or less that are readily convertible to known amounts of cash and which are subject to an insignificant risk of changes in value, and bank overdrafts.
(c) Receivables
Debtors are recognised at the amounts due at the time of invoicing, sale or service delivery for example the agreed purchase/contract price. Settlement of these amounts is required within 30 days from invoice date.
The collectability of receivables is assessed periodically with provision being made for impairment.
All known bad debts are written off periodically and/or as at 30 June. Subsequent recoveries of amounts previously written off are recognised via an adjustment to finance costs in the Statement of Comprehensive Income.
(d) Inventories
Inventories held for distribution comprise of stores and materials used in operating, maintenance and capital works activities. These inventories are valued at the lower of cost and net realisable value.
(e) Property, plant and equipment
Recognition Items of property, plant and equipment with a total value of less than $5,000, except for network assets, are treated as an expense in the year of acquisition. All other items of property, plant and equipment are capitalised.
All network assets are capitalised. The term “network asset” is applied to an accumulation of individual items or components operating as a cohesive whole in the provision of a particular service. Computer equipment is to be treated as a network asset. Interconnected infrastructure assets are treated as a network asset.
Capital and operating expenditure Labour and materials expenditure, which are directly attributable to the purchase or construction of an asset, is considered capital expenditure. Expenditure necessarily incurred in either maintaining the operational capacity of assets or ensuring that their original life estimates are achieved, is considered maintenance and is treated as an expense as incurred.
acquisition Acquisitions of property, plant and equipment are initially recorded at cost. Cost is determined as the value of the assets given as consideration plus costs incidental to the acquisition, including architects’ fees, engineering design fees and all other establishment costs.
Donated (non-cash) contributions of items of property, plant and equipment except reserve land are recognised as assets and revenue at fair value. Fair value means the amount for which an asset could be exchanged, or a liability settled, between knowledgeable, willing parties in an arm’s length transaction.
Revaluation of non-current physical and intangible assets Land, buildings and infrastructure assets are measured at fair value in accordance with AASB116 Property, Plant and equipment. Assets within each class of property, plant and equipment carried at fair value are subject to ongoing review and revalued as necessary, so that the carrying amount of each class of asset does not materially differ from its fair value at the reporting date.
Where intangible assets have an active market, they are measured at fair value, otherwise they are measured at cost.
Plant and equipment and fleet assets are measured at cost.
Any revaluation increment arising on the revaluation of an asset is credited to the asset revaluation surplus, except to the extent it reverses a revaluation decrement previously recognised as an expense. A decrease in the carryng amount on revaluation is charged as an expense, to the extent it exceeds the balance, if any, in the revaluation surplus for that asset.
On revaluation, accumulated depreciation is restated proportionately with the change in the carrying amount of the asset and any change in the estimate of remaining useful life.
Materiality concepts under AASB1031 Materiality are considered in determining whether the difference between the carrying amount and fair value of an asset is material.
Depreciation Land is not depreciated. Property, plant and equipments is depreciated on a straight-line basis so as to allocate the net cost or revalued amount of each asset, less its estimated residual value, progressively over its estimated useful life. These estimates are reviewed annually. The depreciation method applied to assets is reviewed annually. Details of estimated useful lives of assets are set out below.
Items or components that form an integral part of a complex infrastructure asset are recognised as a separate asset. These items or components may be replaced during the useful life of the complex asset. Each component is depreciated over its individual life or life of the complex asset if shorter.
Property, plant and equipment assets are depreciated from the date acquired or installed and ready for use or, for internally constructed assets, from the time an asset is completed and commissioned ready for use.
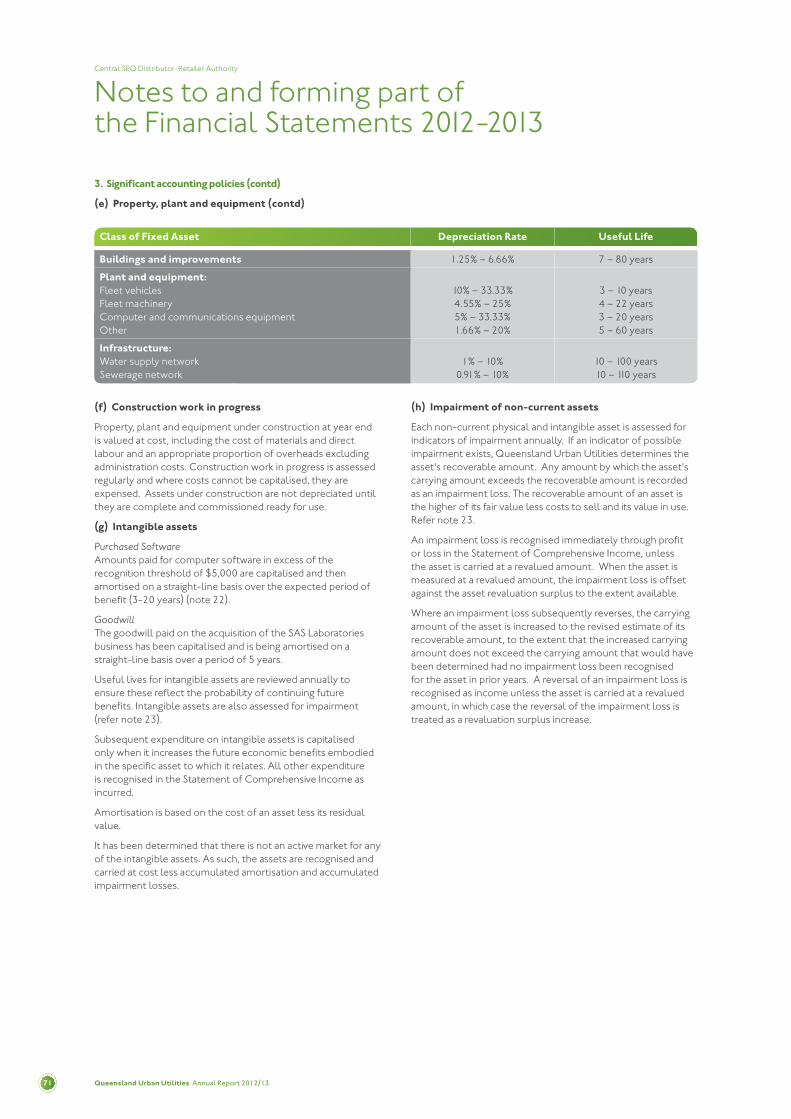
Queensland Urban Utilities Annual Report 2012/1371
Notes to and forming part of the Financial Statements 2012-2013
Central SEQ Distributor-Retailer Authority
Class of Fixed Asset Depreciation Rate Useful Life
Buildings and improvements 1.25% – 6.66% 7 – 80 years
Plant and equipment: Fleet vehicles Fleet machineryComputer and communications equipmentOther
10% – 33.33%4.55% – 25%5% – 33.33%1.66% – 20%
3 – 10 years 4 – 22 years 3 – 20 years 5 – 60 years
Infrastructure:Water supply networkSewerage network
1% – 10%
0.91% – 10%
10 – 100 years 10 – 110 years
(f) Construction work in progress
Property, plant and equipment under construction at year end is valued at cost, including the cost of materials and direct labour and an appropriate proportion of overheads excluding administration costs. Construction work in progress is assessed regularly and where costs cannot be capitalised, they are expensed. Assets under construction are not depreciated until they are complete and commissioned ready for use.
(g) Intangible assets
Purchased Software Amounts paid for computer software in excess of the recognition threshold of $5,000 are capitalised and then amortised on a straight-line basis over the expected period of benefit (3-20 years) (note 22).
Goodwill The goodwill paid on the acquisition of the SAS Laboratories business has been capitalised and is being amortised on a straight-line basis over a period of 5 years.
Useful lives for intangible assets are reviewed annually to ensure these reflect the probability of continuing future benefits. Intangible assets are also assessed for impairment (refer note 23).
Subsequent expenditure on intangible assets is capitalised only when it increases the future economic benefits embodied in the specific asset to which it relates. All other expenditure is recognised in the Statement of Comprehensive Income as incurred.
Amortisation is based on the cost of an asset less its residual value.
It has been determined that there is not an active market for any of the intangible assets. As such, the assets are recognised and carried at cost less accumulated amortisation and accumulated impairment losses.
(h) Impairment of non-current assets
Each non-current physical and intangible asset is assessed for indicators of impairment annually. If an indicator of possible impairment exists, Queensland Urban Utilities determines the asset's recoverable amount. Any amount by which the asset's carrying amount exceeds the recoverable amount is recorded as an impairment loss. The recoverable amount of an asset is the higher of its fair value less costs to sell and its value in use. Refer note 23.
An impairment loss is recognised immediately through profit or loss in the Statement of Comprehensive Income, unless the asset is carried at a revalued amount. When the asset is measured at a revalued amount, the impairment loss is offset against the asset revaluation surplus to the extent available.
Where an impairment loss subsequently reverses, the carrying amount of the asset is increased to the revised estimate of its recoverable amount, to the extent that the increased carrying amount does not exceed the carrying amount that would have been determined had no impairment loss been recognised for the asset in prior years. A reversal of an impairment loss is recognised as income unless the asset is carried at a revalued amount, in which case the reversal of the impairment loss is treated as a revaluation surplus increase.
3. Significant accounting policies (contd)
(e) Property, plant and equipment (contd)
Queensland Urban Utilities Annual Report 2012/13 72
Notes to and forming part of the Financial Statements 2012-2013
Central SEQ Distributor-Retailer Authority
3. Significant accounting policies (contd)
(i) Leases
A distinction is made in the financial statements between finance leases that effectively transfer from the lessor to the lessee substantially all risks and benefits incidental to ownership, and operating leases, under which the lessor retains substantially all risks and benefits.
Queensland Urban Utilities is a statutory body under the Statutory Bodies financial arrangements act 1982 and cannot enter into a finance lease without the approval of the Queensland Treasurer. As at 30 June 2013, Queensland Urban Utilities had not entered into any finance leases.
Operating lease payments are representative of the pattern of benefits derived from the leased assets and are expensed in the periods in which they are incurred.
(j) Investments
Term deposits in excess of three months are reported as investments, with deposits of less than three months being reported as cash equivalents.
(k) Payables
Trade creditors are recognised upon receipt of the goods or services ordered and are measured at the agreed purchase/contract price net of applicable discounts other than contingent discounts. Amounts owing are unsecured and are generally settled on 30 day terms.
(l) Financial instruments
A financial instrument is recognised if Queensland Urban Utilities becomes a party to the contractual provisions of the instrument. Financial assets are derecognised if Queensland Urban Utilities’ contractual rights to the cash flows from the financial assets expire or if Queensland Urban Utilities transfers the financial instrument to another party without retaining control of substantially all risks and rewards of the asset. Financial liabilities are derecognised if Queensland Urban Utilities’ obligations specified in the contract expire or are discharged or cancelled.
Queensland Urban Utilities is not party to any derivative financial instruments and does not enter into transactions for speculative purposes.
Non-derivative financial instrumentsNon-derivative financial instruments comprise trade and other receivables, cash and cash equivalents, loans and borrowings, and trade and other payables.
Non-derivative financial instruments are recognised initially at fair value plus, for instruments not at fair value through profit and loss, any attributable transaction costs. Subsequent to initial recognition non-derivative financial instruments are measured as described below.
Financial instruments are classified and measured as follows:
• Cash and cash equivalents – held at fair value through profit or loss,
• Receivables – held at amortised cost,• Payables – held at amortised cost,• Borrowings – held at amortised cost.

Queensland Urban Utilities Annual Report 2012/1373
3. Significant accounting policies (contd)
(m) Loan liabilities
(i) Queensland Treasury Corporation (QTC)
(a) General purpose borrowings – Queensland Urban Utilities borrows from QTC to fund a range of non-specific capital projects undertaken.
Repayments are made monthly in accordance with the underlying borrowing rate and after adjustment for new borrowings and earlier repayments.
Apportionment of the payment between finance costs and debt redemption will vary according to interest rates. At year end, the outstanding QTC loan balance is disclosed at book value.
(b) Specific borrowings – Queensland Urban Utilities borrows from QTC to fund a range of specific, targeted projects undertaken.
Repayments are made in accordance with the arrangements set up for the specific loans, including frequency of loan repayments and new borrowings.
(c) Queensland Urban Utilities has access to a working capital facility with QTC - refer note 17(c).
(ii) Participants’ loans
Until 30 June 2013 the Participating Councils had provided loans to Queensland Urban Utilities under separate loan agreements (“Participating Local Government Fixed Rate Loan Agreement (Senior Debt)”), subject to a fixed interest rate of 6.7834% with monthly interest-only payments for 3 years from 1 July 2010. The Councils agreed to extend the loans under separate loan agreements (“Participating Local Government Resetting-Rate Loan Agreement (Senior Debt)”) until 30 June 2023. These loans will be subject to an annually resetting fixed rate; the initial fixed rate for the 2013/2014 financial year will be 4.98% with the loans requiring monthly interest-only payments for 10 years from 1 July 2013. The Queensland Treasurer has approved the extension in accordance with the SBFA.
(n) Employee benefits
Employee benefits relate to amounts expected to be paid to employees for annual leave, leave in lieu of statutory holidays worked and overtime, long service leave, sick leave, workers' compensation and superannuation.
Payroll tax and workers’ compensation insurance are a consequence of employing employees, but are not counted in an employee’s total remuneration package. They are not employee benefits and are recognised separately as employee related expenses.
Wages and salaries Wages and salaries due but unpaid at reporting date are recognised in the Statement of Financial Position at the current salary rates.
annual leave Accrued annual leave is recognised in current liabilities (employee benefits) and represents the amount that Queensland Urban Utilities has a present obligation to pay resulting from employees' services provided up to balance date. The accrual has been calculated at nominal amounts based on remuneration rates that would be required to be paid if the liability was settled at balance date and includes related on-costs.
time in lieu Accrued leave in lieu is recognised in current liabilities (employee benefits) and represents the amount which Queensland Urban Utilities has a present obligation to pay resulting from employees' services provided up to balance date. The accrual has been calculated at nominal amounts based on remuneration rates that would be required to be paid if the liability was settled at balance date and includes related on-costs.
long service leave The provision for long service leave represents the present value of the estimated future cash outflows to be made by Queensland Urban Utilities resulting from employees' services provided up to balance date.
The provision comprises amounts that Queensland Urban Utilities has a present obligation to pay resulting from employees' services provided up to balance date and an actuarial estimate of future obligations, taking into account future increases in wage and salary rates, periods of service and experience of employee departures. Related on-costs have also been included. These are reported as current liabilities (employee benefits).
Amounts that Queensland Urban Utilities does not have a present obligation to pay at balance date are discounted using the rates attaching to national government securities at balance date that most closely match the terms of maturity of the related liabilities. This amount is reported as a non current liability (employee benefits).
Notes to and forming part of the Financial Statements 2012-2013
Central SEQ Distributor-Retailer Authority

Queensland Urban Utilities Annual Report 2012/13 74
3. Significant accounting policies (contd)
(n) Employee benefits (contd)
Sick leave The provision for sick leave represents staff entitlements under arrangements that existed prior to 30 June 1996. The reported balances reflect Queensland Urban Utilities present obligation to employees resulting from employees services provided up to 30 June 1996 at which point sick leave ceased to vest (for example employees from this date were no longer entitled to cash equivalents payments for unused sick leave). Accordingly, the vested sick leave entitlement is effectively 'frozen' with remaining balances predominantly paid on termination of those entitled employees who were in service prior to 30 June 1996.
The provision has been calculated at nominal amounts based on remuneration rates as at 1 July 1996 and includes related on-costs and CPI adjustments.
All other sick leave is non-vesting, and an expense is recognised as leave is taken.
Superannuation local Government Superannuation Scheme (lG Super) Queensland Urban Utilities contributes to LG super for employees under both the defined benefit scheme and the accumulation superannuation scheme. Queensland Urban Utilities has no liability to or interest in LG Super other than the payment of the statutory contribution. Any amount by which either scheme is over or under funded would only affect future benefits of employees and is not an asset or liability of Queensland Urban Utilities. Accordingly, there is no recognition in the financial statements of any over-or-under funding of LG Super. Refer to note 35.
Key executive management personnel and remuneration Key executive management personnel and remuneration disclosures are made in accordance with the section 5 of the Financial Reporting Requirements for Queensland Government Agencies. Refer to note 37 for the disclosures on key executive management personnel and remuneration.
Board Remuneration The Participation Agreement discloses the remuneration and benefits of Board Members and the Chairperson. Remuneration includes reasonable travelling, accommodation and other expenses that a Board Member properly incurs in attending Board Meetings or otherwise in connection with the business of Queensland Urban Utilities. To the extent permitted by law, Queensland Urban Utilities must indemnify each Board Member against a liability of that person and the legal costs of that person. Queensland Urban Utilities has an appropriate insurance coverage for Directors and Officers liability.
Detail of payments to each Board Member is included at note 38.
(o) Provisions
Provisions are recorded when Queensland Urban Utilities has a present obligation, either legal or constructive as a result of a past event. They are recognised at the amount expected at reporting date for which the obligation will be settled in a future period. Where the settlement of the obligation is expected after 12 or more months, the obligation is discounted to the present value using an appropriate discount rate. The amounts recognised as provisions in relation to the dismantling and removal of assets and the restoration of land on which the assets have been located, have been included in the cost of the assets.
(p) Trust funds
Funds held in the trust account include deposits lodged to guarantee performance and unclaimed amounts. Queensland Urban Utilities performs only a custodian role in respect of these funds and because they cannot be used for Queensland Urban Utilities purposes they are not considered revenue nor brought to account in the financial statements. They are disclosed in note 36 for information purposes only.
(q) Finance and borrowing costs
Finance and borrowing costs comprise:
• Bank charges;• Interest expense on bank overdrafts, short-term and long-
term borrowings;• Unwinding of the discount on provisions;• Amortisation of discounts or premiums related to
borrowings; and• Ancillary administration charges.
Finance and borrowing costs are recognised in the profit or loss using the effective interest rate method and are expensed in the period in which they are incurred. Finance and borrowing costs that are not settled in the period in which they are incurred are added to the carrying amount of the borrowing.
Finance and borrowing costs directly attributable to a specific capital project that necessarily takes a substantial period of time to prepare for its intended use, are added to the cost of those assets, until such time as the assets are substantially ready for their intended use or sale.
Notes to and forming part of the Financial Statements 2012-2013
Central SEQ Distributor-Retailer Authority
Queensland Urban Utilities Annual Report 2012/1375
3. Significant accounting policies (contd)
(r) Taxation
income tax Queensland Urban Utilities is exempt from Commonwealth Government income taxation but is subject to the Local Government Tax Equivalents Regime (LGTER). Under the LGTER, Queensland Urban Utilities pays an income tax and land tax equivalent to its participating Councils in accordance with the requirements of its Participation Agreement.
Income tax expense comprises current and deferred tax. Current tax and deferred tax is recognised in profit or loss except to the extent that it relates to items recognised directly in equity or in other comprehensive income.
Current tax is the expected tax payable or receivable on the taxable income or loss for the year, using tax rates enacted or substantively enacted at the reporting date, and any adjustment to tax payable in respect of previous years.
Deferred tax is recognised in respect of temporary differences between the carrying amounts of assets and liabilities for financial reporting purposes and the amounts used for taxation purposes. Deferred tax is not recognised for temporary differences on the initial recognition of assets or liabilities in a transaction that is not a business combination and that affects neither accounting nor taxable profit or loss.
Deferred tax is measured at the tax rates that are expected to be applied to temporary differences when they reverse, based on the laws that have been enacted or substantively enacted by the reporting date.
A deferred tax asset is recognised for unused tax losses, tax credits and deductible temporary differences, to the extent that it is probable that future taxable profits will be available against which they can be utilised. Deferred tax assets are reviewed at each reporting date and are reduced to the extent that it is no longer probable that the related tax benefit will be realised.
Goods and services tax Revenue, expenses, assets and liabilities are recognised net of the amount of goods and services tax (GST), except where the amount of GST incurred is not recoverable from the Australian Taxation Office (ATO). In these circumstances, the GST is recognised as part of the cost of acquisition of the asset or as part of the expense.
Receivables and payables are stated with the amount of GST included. The net amount of GST recoverable from, or payable to, the ATO is included as a current asset or liability in the Statement of Financial Position.
Cash flows are included in the Statement of Cash Flows on a gross basis. The GST components of cash flows arising from investing and financing activities which are recoverable from, or payable to, the ATO are classified as operating cash flows.
other taxes Queensland Urban Utilities pays payroll tax to the Queensland Government Office of State Revenue on its activities. Fringe benefits tax is paid to the ATO in accordance with the relevant legislation.
(s) Contributed equity
In return for the net assets transferred to Queensland Urban Utilities, each Council participates based on its share of the RAB, comprising debt and participation rights as agreed by the five Councils and the Authority in the ratio of 40 to 60. The value of participation rights (60% of the RAB) has been brought to account as contributed equity in accordance with advice given by Queensland Treasury and Trade.
(t) Participation returns
Participation returns are paid to the participating Councils in accordance with the Participation Agreement. Payment is from post-tax operating profits (after adjustment for donated assets and other comprehensive income).
An estimate of the total amount of Participation Returns is calculated according to the Participation Return Policy and provided to the participating Councils no later than 30 May annually.
Between 1 and 15 November annually, Queensland Urban Utilities will provide to the participating Councils an estimate of the net profit for the first six months and advise the total amount of the Interim Participation Return.
The Final Participation Return for the year ended 30 June 2013 was declared on 20 May 2013, refer note 29.
Notes to and forming part of the Financial Statements 2012-2013
Central SEQ Distributor-Retailer Authority

Queensland Urban Utilities Annual Report 2012/13 76
Notes to the financial statementsFor the year ended 30 June 2013
Central SEQ Distributor-Retailer Authority
Notes2013
$’0002012
$’000
4. Utility charges
Wastewater charges 356,019 352,034
Water base charges 101,133 99,599
Water consumption 346,683 298,945
803,835 750,576
5. Contributions, grants and subsidies
Developer contributions – cash 47,990 81,838
Developer contributions – donated assets 57,238 43,849
Grants and subsidies 114 168
105,342 125,853
6. Insurance
Insurance recovery 7,979 -
7,979 -
7. Interest received
Interest on arrears 417 680
Interest on investments 1,035 2,540
1,451 3,220
8. Fees and charges
Property connection fees 10,403 10,511
Professional fees 4,356 2,498
Recycled water 9,771 8,535
Other fees 5,406 4,917
29,936 26,461
9. Other revenue
Recovery for damage to services 488 622
Other revenue 1,908 4,787
2,396 5,409
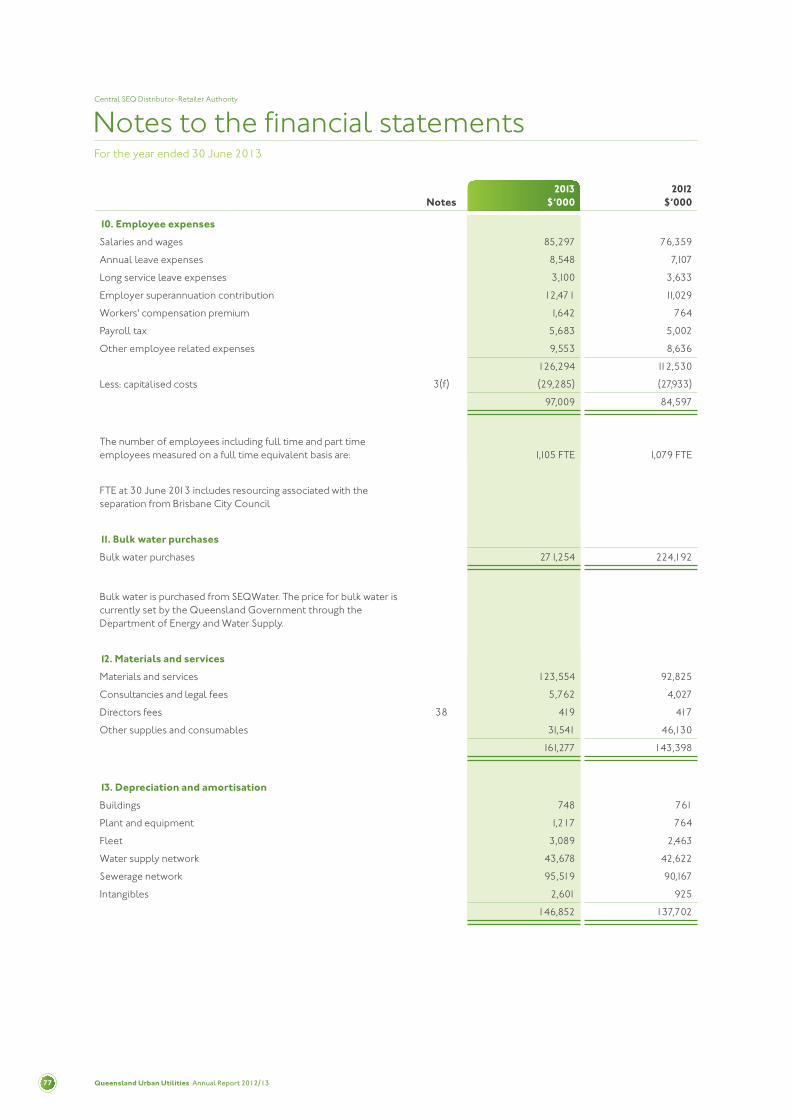
Queensland Urban Utilities Annual Report 2012/1377
Notes to the financial statementsFor the year ended 30 June 2013
Central SEQ Distributor-Retailer Authority
Notes2013
$’0002012
$’000
10. Employee expenses
Salaries and wages 85,297 76,359
Annual leave expenses 8,548 7,107
Long service leave expenses 3,100 3,633
Employer superannuation contribution 12,471 11,029
Workers' compensation premium 1,642 764
Payroll tax 5,683 5,002
Other employee related expenses 9,553 8,636
126,294 112,530
Less: capitalised costs 3(f) (29,285) (27,933)
97,009 84,597
The number of employees including full time and part time employees measured on a full time equivalent basis are: 1,105 FTE 1,079 FTE
FTE at 30 June 2013 includes resourcing associated with the separation from Brisbane City Council
11. Bulk water purchases
Bulk water purchases 271,254 224,192
Bulk water is purchased from SEQWater. The price for bulk water is currently set by the Queensland Government through theDepartment of Energy and Water Supply.
12. Materials and services
Materials and services 123,554 92,825
Consultancies and legal fees 5,762 4,027
Directors fees 38 419 417
Other supplies and consumables 31,541 46,130
161,277 143,398
13. Depreciation and amortisation
Buildings 748 761
Plant and equipment 1,217 764
Fleet 3,089 2,463
Water supply network 43,678 42,622
Sewerage network 95,519 90,167
Intangibles 2,601 925
146,852 137,702

Queensland Urban Utilities Annual Report 2012/13 78
Notes to the financial statementsFor the year ended 30 June 2013
Central SEQ Distributor-Retailer Authority
Notes2013
$’0002012
$’000
14. Finance/borrowing costs
Bank charges 2,280 2,419
QTC finance costs 14,568 14,201
Interest on Participants' debt 100,856 101,203
117,704 117,823
15. Loss on disposal of assets
Proceeds from disposal of assets (1,047) (871)
Less: Cost of assets disposed 5,447 7,664
4,400 6,793
16. Other expenses
Impairment of trade receivables 2,132 3,816
Insurance 3,568 2,564
Audit fees* 721 510
Rates and taxes 2,293 2,073
Remissions 21 221
Other 498 1
9,233 9,185
* total external audit fees paid to the queensland audit office relating to the 2012/2013 financial statements are estimated to be $241,000 (2012: $264,342). there are no non-audit services included in this amount.
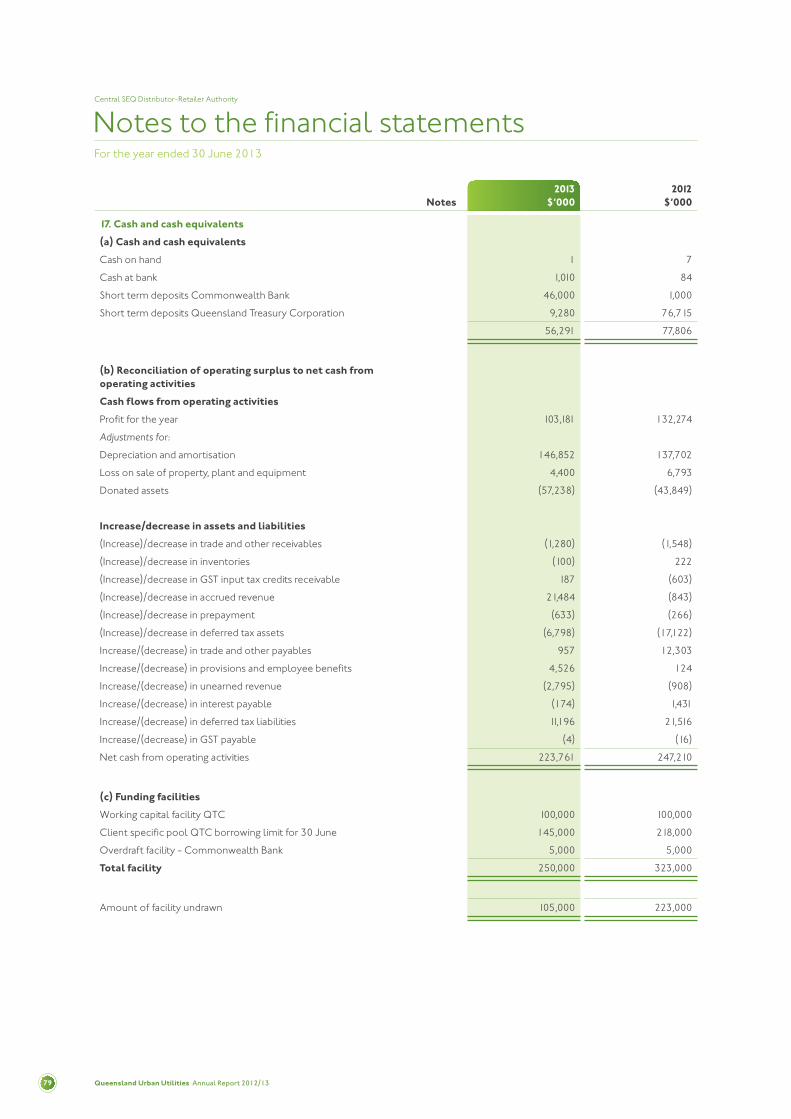
Queensland Urban Utilities Annual Report 2012/1379
Notes to the financial statementsFor the year ended 30 June 2013
Central SEQ Distributor-Retailer Authority
Notes2013
$’0002012
$’000
17. Cash and cash equivalents
(a) Cash and cash equivalents
Cash on hand 1 7
Cash at bank 1,010 84
Short term deposits Commonwealth Bank 46,000 1,000
Short term deposits Queensland Treasury Corporation 9,280 76,715
56,291 77,806
(b) Reconciliation of operating surplus to net cash from operating activities
Cash flows from operating activities
Profit for the year 103,181 132,274
adjustments for:
Depreciation and amortisation 146,852 137,702
Loss on sale of property, plant and equipment 4,400 6,793
Donated assets (57,238) (43,849)
Increase/decrease in assets and liabilities
(Increase)/decrease in trade and other receivables (1,280) (1,548)
(Increase)/decrease in inventories (100) 222
(Increase)/decrease in GST input tax credits receivable 187 (603)
(Increase)/decrease in accrued revenue 21,484 (843)
(Increase)/decrease in prepayment (633) (266)
(Increase)/decrease in deferred tax assets (6,798) (17,122)
Increase/(decrease) in trade and other payables 957 12,303
Increase/(decrease) in provisions and employee benefits 4,526 124
Increase/(decrease) in unearned revenue (2,795) (908)
Increase/(decrease) in interest payable (174) 1,431
Increase/(decrease) in deferred tax liabilities 11,196 21,516
Increase/(decrease) in GST payable (4) (16)
Net cash from operating activities 223,761 247,210
(c) Funding facilities
Working capital facility QTC 100,000 100,000
Client specific pool QTC borrowing limit for 30 June 145,000 218,000
Overdraft facility - Commonwealth Bank 5,000 5,000
Total facility 250,000 323,000
Amount of facility undrawn 105,000 223,000
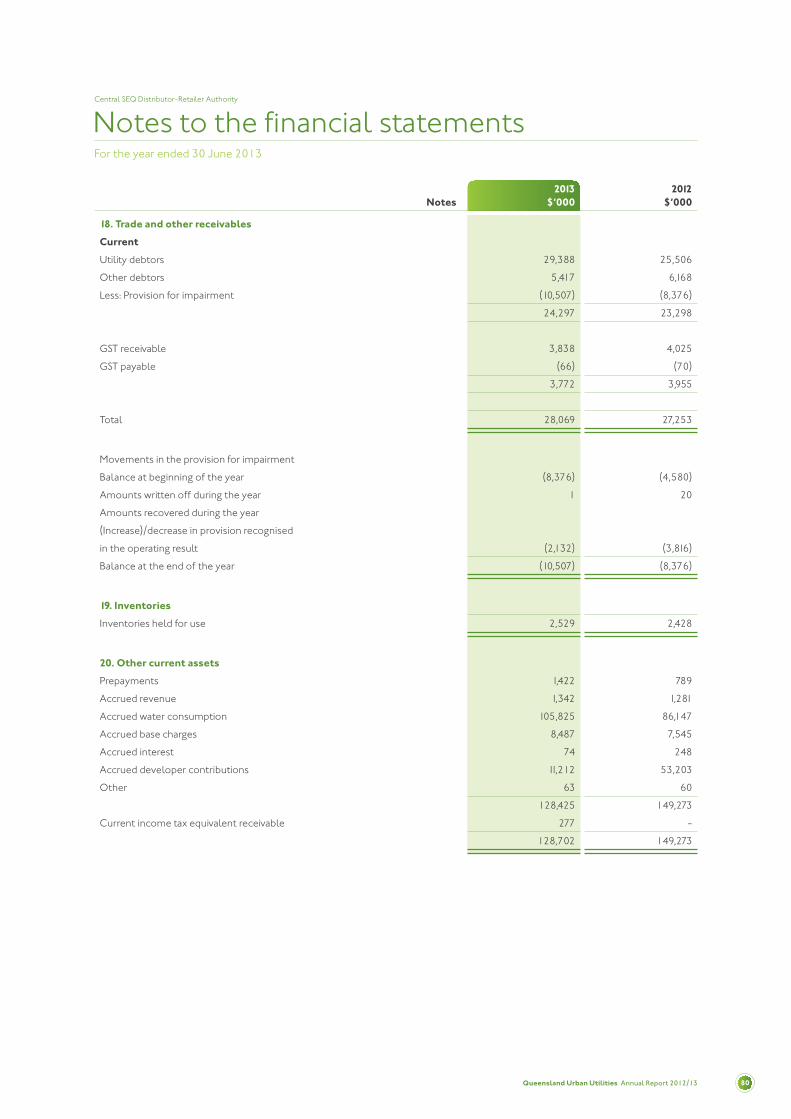
Queensland Urban Utilities Annual Report 2012/13 80
Notes to the financial statementsFor the year ended 30 June 2013
Central SEQ Distributor-Retailer Authority
Notes2013
$’0002012
$’000
18. Trade and other receivables
Current
Utility debtors 29,388 25,506
Other debtors 5,417 6,168
Less: Provision for impairment (10,507) (8,376)
24,297 23,298
GST receivable 3,838 4,025
GST payable (66) (70)
3,772 3,955
Total 28,069 27,253
Movements in the provision for impairment
Balance at beginning of the year (8,376) (4,580)
Amounts written off during the year 1 20
Amounts recovered during the year
(Increase)/decrease in provision recognised
in the operating result (2,132) (3,816)
Balance at the end of the year (10,507) (8,376)
19. Inventories
Inventories held for use 2,529 2,428
20. Other current assets
Prepayments 1,422 789
Accrued revenue 1,342 1,281
Accrued water consumption 105,825 86,147
Accrued base charges 8,487 7,545
Accrued interest 74 248
Accrued developer contributions 11,212 53,203
Other 63 60
128,425 149,273
Current income tax equivalent receivable 277 -
128,702 149,273
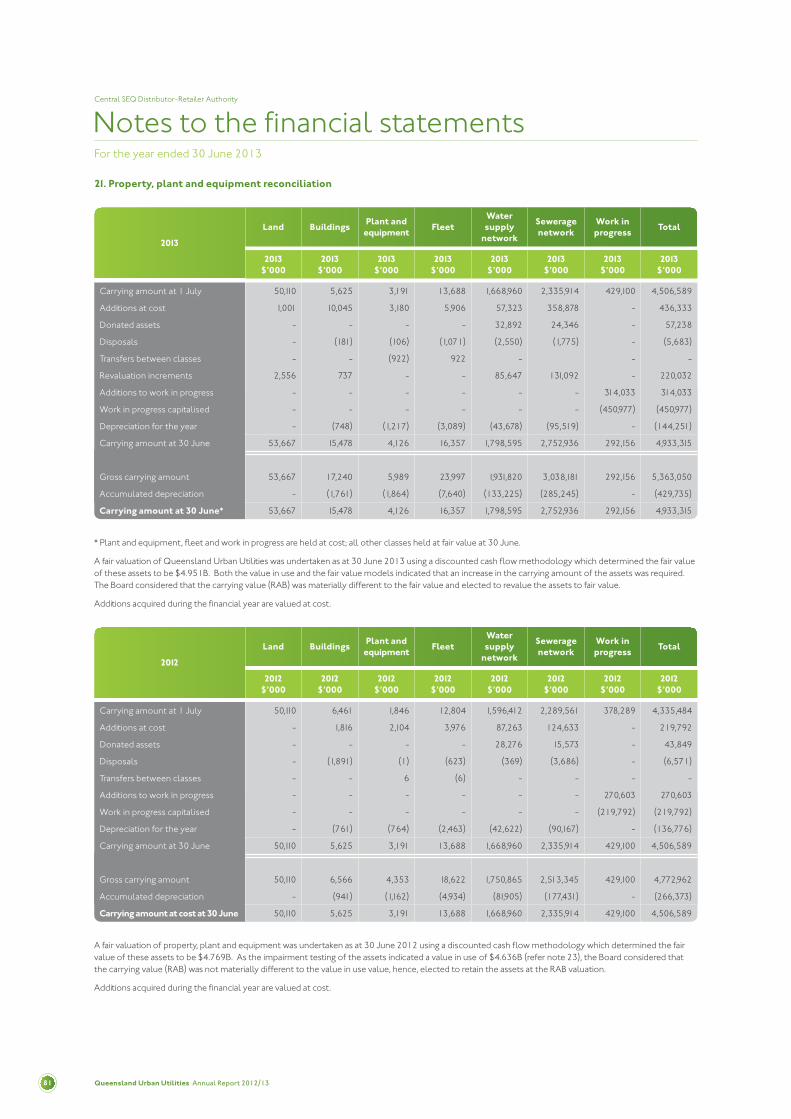
Queensland Urban Utilities Annual Report 2012/1381
Notes to the financial statementsFor the year ended 30 June 2013
Central SEQ Distributor-Retailer Authority
2013
Land BuildingsPlant and
equipmentFleet
Water supply
network
Sewerage network
Work in progress
Total
2013 $’000
2013 $’000
2013 $’000
2013 $’000
2013 $’000
2013 $’000
2013 $’000
2013 $’000
Carrying amount at 1 July 50,110 5,625 3,191 13,688 1,668,960 2,335,914 429,100 4,506,589
Additions at cost 1,001 10,045 3,180 5,906 57,323 358,878 - 436,333
Donated assets - - - - 32,892 24,346 - 57,238
Disposals - (181) (106) (1,071) (2,550) (1,775) - (5,683)
Transfers between classes - - (922) 922 - - -
Revaluation increments 2,556 737 - - 85,647 131,092 - 220,032
Additions to work in progress - - - - - - 314,033 314,033
Work in progress capitalised - - - - - - (450,977) (450,977)
Depreciation for the year - (748) (1,217) (3,089) (43,678) (95,519) - (144,251)
Carrying amount at 30 June 53,667 15,478 4,126 16,357 1,798,595 2,752,936 292,156 4,933,315
Gross carrying amount 53,667 17,240 5,989 23,997 1,931,820 3,038,181 292,156 5,363,050
Accumulated depreciation - (1,761) (1,864) (7,640) (133,225) (285,245) - (429,735)
Carrying amount at 30 June* 53,667 15,478 4,126 16,357 1,798,595 2,752,936 292,156 4,933,315
2012
Land BuildingsPlant and
equipmentFleet
Water supply
network
Sewerage network
Work in progress
Total
2012 $’000
2012 $’000
2012 $’000
2012 $’000
2012 $’000
2012 $’000
2012 $’000
2012 $’000
Carrying amount at 1 July 50,110 6,461 1,846 12,804 1,596,412 2,289,561 378,289 4,335,484
Additions at cost - 1,816 2,104 3,976 87,263 124,633 - 219,792
Donated assets - - - - 28,276 15,573 - 43,849
Disposals - (1,891) (1) (623) (369) (3,686) - (6,571)
Transfers between classes - - 6 (6) - - - -
Additions to work in progress - - - - - - 270,603 270,603
Work in progress capitalised - - - - - - (219,792) (219,792)
Depreciation for the year - (761) (764) (2,463) (42,622) (90,167) - (136,776)
Carrying amount at 30 June 50,110 5,625 3,191 13,688 1,668,960 2,335,914 429,100 4,506,589
Gross carrying amount 50,110 6,566 4,353 18,622 1,750,865 2,513,345 429,100 4,772,962
Accumulated depreciation - (941) (1,162) (4,934) (81,905) (177,431) - (266,373)
Carrying amount at cost at 30 June 50,110 5,625 3,191 13,688 1,668,960 2,335,914 429,100 4,506,589
* Plant and equipment, fleet and work in progress are held at cost; all other classes held at fair value at 30 June.
A fair valuation of Queensland Urban Utilities was undertaken as at 30 June 2013 using a discounted cash flow methodology which determined the fair value of these assets to be $4.951B. Both the value in use and the fair value models indicated that an increase in the carrying amount of the assets was required. The Board considered that the carrying value (RAB) was materially different to the fair value and elected to revalue the assets to fair value.
Additions acquired during the financial year are valued at cost.
A fair valuation of property, plant and equipment was undertaken as at 30 June 2012 using a discounted cash flow methodology which determined the fair value of these assets to be $4.769B. As the impairment testing of the assets indicated a value in use of $4.636B (refer note 23), the Board considered that the carrying value (RAB) was not materially different to the value in use value, hence, elected to retain the assets at the RAB valuation.
Additions acquired during the financial year are valued at cost.
21. Property, plant and equipment reconciliation

Queensland Urban Utilities Annual Report 2012/13 82
Notes to the financial statementsFor the year ended 30 June 2013
Central SEQ Distributor-Retailer Authority
22. Intangible assets
23. Key assumptions used in valuation
(a) Valuation and assumptions
The carrying amount of assets, including intangibles (refer Notes 21 and 22) allocated to the cash-generating unit (CGU) are set out below:
Software purchased Goodwill Total
2013 $’000
2012 $’000
2013 $’000
2012 $’000
2013 $’000
2012 $’000
Carrying amount at 1 July 1,854 1,955 - - 1,854 1,955
Acquisitions at cost 14,644 825 1,111 - 15,755 825
Amortisation for the year (2,364) (925) (237) - (2,601) (925)
Carrying amount at 30 June 14,134 1,854 874 - 15,008 1,854
Gross carrying amount 18,084 3,571 1,111 - 19,196 3,571
Accumulated amortisation (3,950) (1,717) (237) - (4,188) (1,717)
Carrying amount at 30 June 14,134 1,854 874 - 15,008 1,854
Carrying amount of assets
$’000
Recoverable amount
$’000Surplus
$’000
Cash-generating unit – Queensland Urban Utilities 4,948,323 4,951,298 2,975
The Board has adopted the following methodology, key assumptions and approach to determine the recoverable amount for the purpose of impairment testing:
• Queensland Urban Utilities treats its business activities as a single cash-generating unit for the purposes of impairment testing.
• Assumed capital structure is 60% debt and 40% equity.
• Post-tax nominal cash flows are estimated for at least ten years.
• Cash flow projections are based on the Board approved 2013/2014 budget projected for 10 years.
• Cash flow projections are discounted on a mid point basis.
• The Gordon growth model is used for cash flows from year 11 to "in perpetuity".
• The cash flows are effectively EBITDA less renewals capital expenditure allowing for cash flow timing differences.
• Cash flows are estimated using the building block approach consistent with the Queensland Competition Interim Price Monitoring Framework, with a conservative price path for water and sewerage charges for all customers assumed for 10 years within this approach.
• Change in working capital has been taken into account for cash flow requirements.
• A rate from the Reserve Bank of Australia target inflation rate (2.5%) is used as a long term growth rate.
• The discount rate reflects the risk of the cash flows and has been calculated using the WACC and Capital Asset Pricing Model (CAPM) framework.
• For impairment purposes the post-tax nominal discount rate is 6.57%.
(b) Price path post 1 July 2013
As outlined above, for impairment modelling cash flows are estimated using the building block approach consistently with the Queensland Competition Interim Price Monitoring Framework, with a conservative price path assumed for 10 years within this approach.
The fairer Water Prices for Seq amendment Bill 2011 was amended in November 2012 to remove the requirement on our Participating Councils to develop and publish final price paths for water and sewerage charges for residential and small customers by 30 March 2013.
The resultant outcome is that Queensland Urban Utilities is required to announce draft water and sewerage prices by 31 March before the start of the financial year, with final prices to be announced by the end of June.

Queensland Urban Utilities Annual Report 2012/1383
Notes to the financial statementsFor the year ended 30 June 2013
Central SEQ Distributor-Retailer Authority
Notes2013
$’0002012
$’000
24. Income tax expense/(benefit) Queensland Urban Utilities is exempt from Commonwealth Government income taxation but is subject to the Local Government Tax Equivalents Regime. Queensland Urban Utilities is only subject to the Commonwealth taxes being Fringe Benefits Tax (FBT) and Goods and Services Tax (GST).
(a) Income tax expense/(benefit)
Current tax 33,000 53,777
Deferred tax 9,761 1,779
Adjustments for permanent movement from prior periods (2,732) -
40,029 55,556
(b) Numerical reconciliation of income tax expense to prima-facie tax payable
Surplus/(Deficit) from operating activities before income tax expense/(benefit) 143,377 187,352
Tax at the the Australian tax rate of 30% 43,013 56,206
Non-deductible expenditure 9 8
Permanent difference - depreciation on acquired assets 1,242 1,150
Permanent difference - accrued leave provisions (1,487) (1,808)
Permanent difference - co-operative research centres and goodwill 59 -
Permanent overs/unders (75) -
Adjustments for permanent movement from prior periods
• Depreciation on acquired assets 104 -
• Accrued Leave Provisions (2,835) -
Income tax expense/(benefit) 40,029 55,556
(c) Deferred tax equivalent asset
Opening balance 29,530 12,408
(charge)/credit to income tax statement 6,139 -
Adjustments for deferred tax movement from prior periods 863 17,122
36,532 29,530
(d) Deferred tax equivalent asset comprises of:
Provisions 3,560 6,022
Accrued expenses 146 150
Plant and equipment 20,691 18,436
Other 2,986 384
Expenses capitalised for tax 2,269 4,538
Amounts recognised directly in equity:
• Annual leave and Long Sevice Leave: SAS Laboratories 6,880 -
Net tax assets 36,532 29,530
(e) Deferred tax equivalents liability
Opening balance (42,455) (20,939)
(charge)/credit to income tax (11,197) (21,516)
(charge)/credit to equity (66,010) -
(119,662) (42,455)
Deferred tax liability comprises of:
Contributed assets (46,638) (42,271)
Other (7,014) (184)
Amounts recognised directly in equity:
Revaluation of plant and equipment (66,010) -
Net tax liability (119,662) (42,455)

Queensland Urban Utilities Annual Report 2012/13 84
Notes to the financial statementsFor the year ended 30 June 2013
Central SEQ Distributor-Retailer Authority
2013 $’000
2012 $’000
25. Interest bearing liabilities
Non-current
QTC client specific pool loans 533,089 388,089
Participant loans 1,486,806 1,486,806
Total 2,019,895 1,874,895
2013 $’000
2012 $’000
Carrying Amount Carrying Amount
Balances of outstanding loans were as follows:
Participant loans 1,486,806 1,486,806
QTC - client specific pool 533,089 388,089
2,019,895 1,874,895
QTC client specific pool loans
Opening balance 388,089 288,179
Add: Drawdown of debt 145,000 99,910
533,089 388,089
Participant loans
Brisbane City Council 1,241,282 1,241,282
Ipswich City Council 202,309 202,309
Lockyer Valley Regional Council 14,735 14,735
Scenic Rim Regional Council 14,676 14,676
Somerset Regional Council 13,804 13,804
1,486,806 1,486,806
No assets have been pledged as security for any liabilities.
All borrowings are in Australian dollar denominated amounts and an amount of $7,506,199 has been capitalised during the current year (2012: $5,467,653). There have been no defaults or breaches of the loan agreement during the year.
It is Queensland Urban Utilities' intention to hold its borrowings for their full term. No fair value adjustment is made to the carrying amount of the borrowings.
The Weighted Average Borrowing Rate for QTC borrowings as at 30 June 2013 is 4.73% (2012: 5.87%). Interest payments are made monthly in arrears at rates ranging from 4.7251% to 6.7834% (2012: 4.0465% to 6.7834%).
Until 30 June 2013 the Participating Councils had provided loans to Queensland Urban Utilities under separate loan agreements (“Participating Local Government Fixed Rate Loan Agreement (Senior Debt)”), subject to a fixed interest rate of 6.7834% with monthly interest-only payments for 3 years from 1 July 2010. The Councils agreed to extend the loans under separate loan agreements (“Participating Local Government Resetting-Rate Loan Agreement (Senior Debt)”) until 30 June 2023. These loans will be subject to an annually resetting fixed rate; the initial fixed rate for the 2013/2014 financial year will be 4.98% with the loans requiring monthly interest-only payments for 10 years from 1 July 2013. The Queensland Treasurer has approved the extension in accordance with the SBFA.
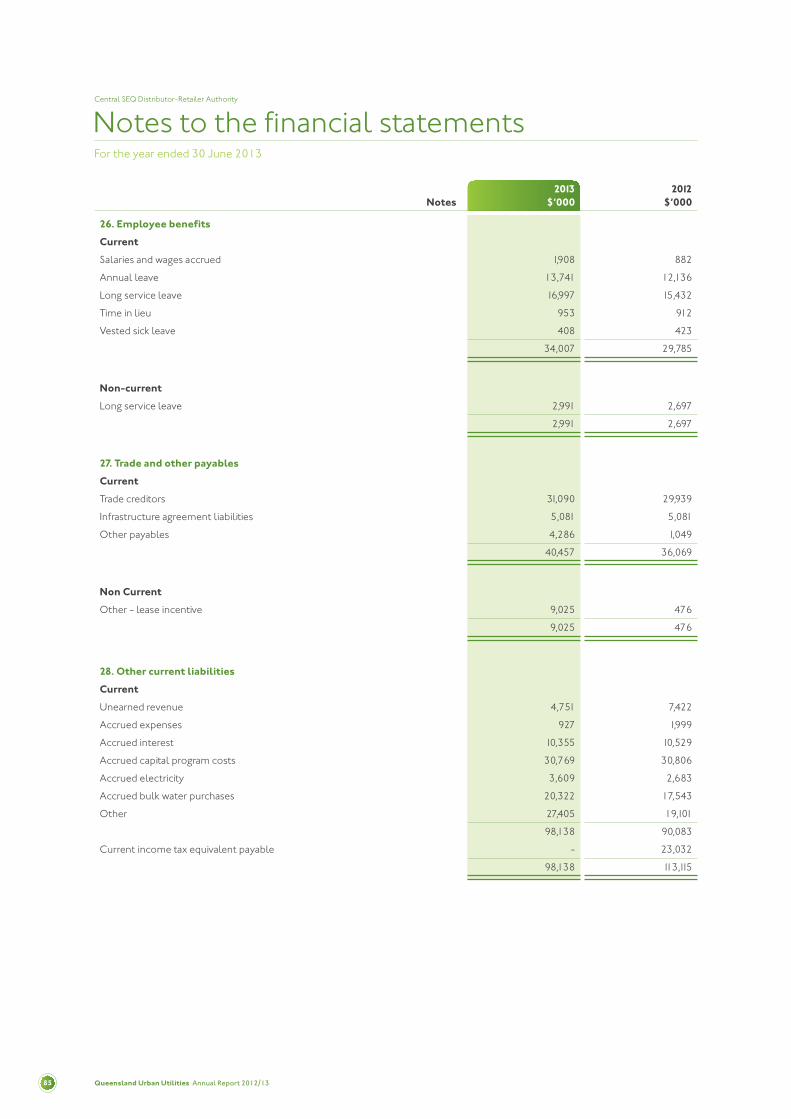
Queensland Urban Utilities Annual Report 2012/1385
Notes to the financial statementsFor the year ended 30 June 2013
Central SEQ Distributor-Retailer Authority
Notes2013
$’0002012
$’000
26. Employee benefits
Current
Salaries and wages accrued 1,908 882
Annual leave 13,741 12,136
Long service leave 16,997 15,432
Time in lieu 953 912
Vested sick leave 408 423
34,007 29,785
Non-current
Long service leave 2,991 2,697
2,991 2,697
27. Trade and other payables
Current
Trade creditors 31,090 29,939
Infrastructure agreement liabilities 5,081 5,081
Other payables 4,286 1,049
40,457 36,069
Non Current
Other - lease incentive 9,025 476
9,025 476
28. Other current liabilities
Current
Unearned revenue 4,751 7,422
Accrued expenses 927 1,999
Accrued interest 10,355 10,529
Accrued capital program costs 30,769 30,806
Accrued electricity 3,609 2,683
Accrued bulk water purchases 20,322 17,543
Other 27,405 19,101
98,138 90,083
Current income tax equivalent payable - 23,032
98,138 113,115

Queensland Urban Utilities Annual Report 2012/13 86
Notes to the financial statementsFor the year ended 30 June 2013
Central SEQ Distributor-Retailer Authority
2013 $’000
2012 $’000
29. Contributed equity
(a) Participation rights returns
In accordance with the Participation Agreement, the Board
declared the final participation rights payment of $22.64m
(2012: $59.76m) on 27 May 2013. Payment will be made on
30 September 2013. 22,638 59,759
An interim participation return was declared on 15 October 16,413 15,403
2012 and paid on 31 January 2013.
Total participation rights paid/payable 39,051 75,162
Amounts per Participant:
Brisbane City Council 33,196 63,893
Ipswich City Council 4,773 9,186
Lockyer Valley Regional Council 353 679
Scenic Rim Regional Council 407 783
Somerset Regional Council 323 621
39,051 75,162
RAB $’000
Participation Rights %
Brisbane City Council 3,596,905 85.007%
Ipswich City Council 517,150 12.222%
Lockyer Valley Regional Council 38,199 0.903%
Scenic Rim Regional Council 44,100 1.042%
Somerset Regional Council 34,969 0.826%
4,231,322 100.000%
(b) Participation rights percentages
Section 5.2(c) of the Participation Agreement provides for the calculation of the participation rights of each Participant. Participation rights are determined based on each Participants’ Regulatory Asset Base (RAB). The RAB is calculated in accordance with the method set out in the Ministerial Direction titled “queensland Competition authority act 1997 section 10(e) Ministers’ Direction Notice” as published in the Queensland Government Gazette No. 46 on 9 October 2009.
The RAB and participation rights percentage for each Participant is:

Queensland Urban Utilities Annual Report 2012/1387
Notes to the financial statementsFor the year ended 30 June 2013
Central SEQ Distributor-Retailer Authority
29. Contributed equity (contd)
(c) Assets and liabilities transferred
On 1 July 2010 the participating Councils transferred the assets, liabilities, instruments and employees necessary for Queensland Urban Utilities to commence trading under a scheme made in accordance with the Act and gazetted on 29 June 2010.
1/7/2010 $’000
Summary of the transferred assets and liabilities is:
Property, plant and equipment 4,003,528
Capital works in progress 227,794
Cash 9,006
Employee entitlements (31,424)
QTC debt transferred to Queensland Urban Utilities (183,092)
4,025,812
Represented by:
Contributed equity 2,538,793
Participant's debt 1,487,019
4,025,812
Land BuildingsWater supply
networkSewerage network
Total
$’000 $’000 $’000 $’000 $’000
Balance 1 July 2012 - - - - -
Revaluation increments 2,556 737 85,647 131,092 220,032
Deferred tax liabilities (767) (221) (25,694) (39,328) (66,010)
Balance 30 June 2013 1,789 516 59,953 91,765 154,023
30. Asset revaluation surplus by class
31. Financial instruments
Queensland Urban Utilities’ activities expose it to a variety of financial risks including credit risk, liquidity risk and interest rate risk. Exposure to financial risks is managed in accordance with approved policies on financial risk management. These policies focus on managing the volatility of financial markets and seek to minimise potential adverse effects on the financial performance of Queensland Urban Utilities. Queensland urban Utilities measures risk exposure for credit risk by ageing analysis, liquidity risk by maturity analysis and interest rate risk by sensitivity analysis.
(a) Categorisation of financial instruments
Queensland Urban Utilities has the following categories of financial assets and financial liabilities
Category Note2013
$’0002012
$’000
Financial assets
Cash and cash equivalents 17 56,291 77,806
Trade and other receivables 18 28,069 27,253
Total 84,360 105,059
Financial liabilities
Trade and other payables 27 49,482 36,545
Interest bearing liabilities 25 2,019,895 1,874,895
Total 2,069,377 1,911,440

Queensland Urban Utilities Annual Report 2012/13 88
Notes to the financial statementsFor the year ended 30 June 2013
Central SEQ Distributor-Retailer Authority
Maximum exposure to credit risk Category Note
2013 $’000
2012 $’000
Cash and cash equivalents 17 56,291 77,806
Trade and other receivables 18 28,069 27,253
Total 84,360 105,059
31. Financial instruments (contd)
(b) Credit risk exposure
Credit risk exposure refers to the situation where a financial loss may be incurred as a result of another party to a financial instrument failing to discharge their obligation.
The maximum exposure to credit risk at balance date in relation to each class of recognised financial asset is the gross carrying amount of those assets inclusive of any provisions for impairment. No collateral is held as security relating to the financial assets held by the Authority. Queensland Urban Utilities has minimum exposure to credit risk due to the large number of small value receivables.
The following table represents the maximum exposure to credit risk based on contractual amounts net of any allowances:
No financial assets and financial liabilities have been offset and presented net in the Statement of Financial Position.
The method of calculating any provisional impairment for risk is based on past experience.
The recognised impairment provision for receivables is $10,507,190 for the current year (2012: $8,375,766).
No financial assets have had their terms renegotiated so as to prevent them from being past due or impaired, and are stated at the carrying amount as indicated.
Ageing of past due receivables and the amount of impairment is disclosed in the following table:
2013 2012
ReceivablesGross $’000
Impairment $’000
Gross $’000
Impairment $’000
Not past due 14,129 - 14,831 -
Past due 31-60 days 8,028 - 5,371 -
Past due 61-90 days 172 - 844 -
More than 90 days 12,476 10,507 10,628 8,376
34,804 10,507 31,674 8,376
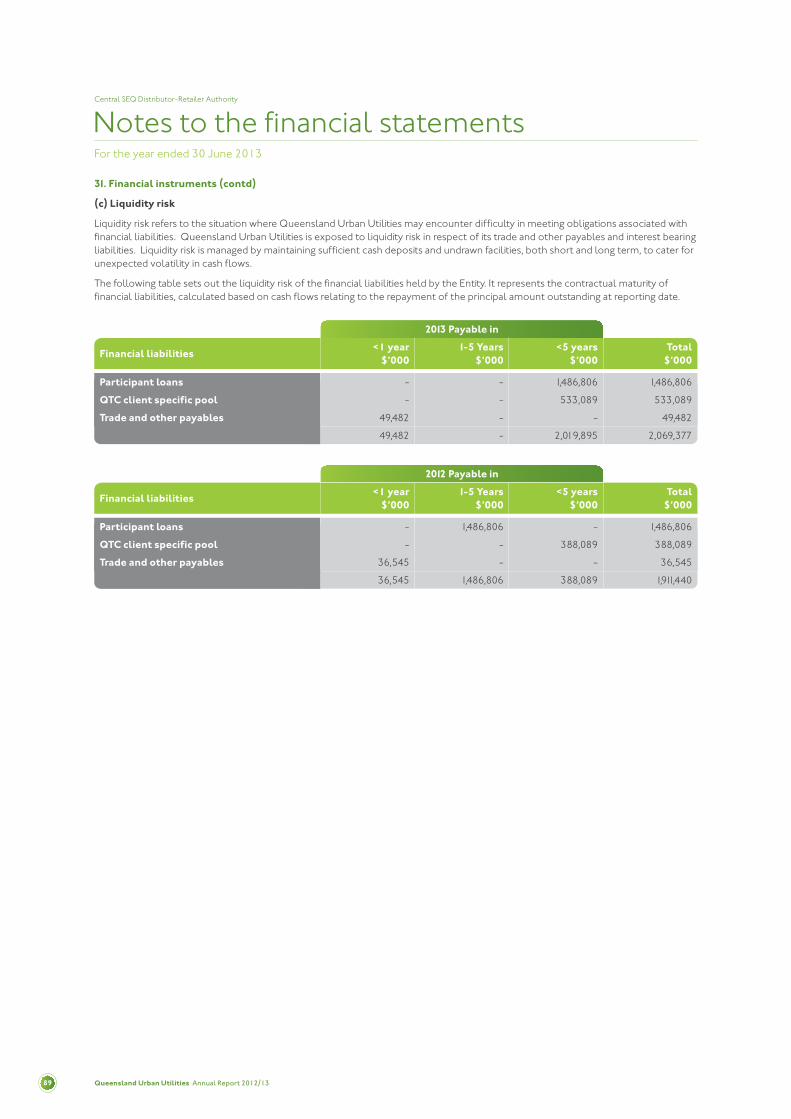
Queensland Urban Utilities Annual Report 2012/1389
Notes to the financial statementsFor the year ended 30 June 2013
Central SEQ Distributor-Retailer Authority
2013 Payable in
Financial liabilities<1 year
$’0001-5 Years
$’000<5 years
$’000Total
$’000
Participant loans - - 1,486,806 1,486,806
QTC client specific pool - - 533,089 533,089
Trade and other payables 49,482 - - 49,482
49,482 - 2,019,895 2,069,377
2012 Payable in
Financial liabilities<1 year
$’0001-5 Years
$’000<5 years
$’000Total
$’000
Participant loans - 1,486,806 - 1,486,806
QTC client specific pool - - 388,089 388,089
Trade and other payables 36,545 - - 36,545
36,545 1,486,806 388,089 1,911,440
31. Financial instruments (contd)
(c) Liquidity risk
Liquidity risk refers to the situation where Queensland Urban Utilities may encounter difficulty in meeting obligations associated with financial liabilities. Queensland Urban Utilities is exposed to liquidity risk in respect of its trade and other payables and interest bearing liabilities. Liquidity risk is managed by maintaining sufficient cash deposits and undrawn facilities, both short and long term, to cater for unexpected volatility in cash flows.
The following table sets out the liquidity risk of the financial liabilities held by the Entity. It represents the contractual maturity of financial liabilities, calculated based on cash flows relating to the repayment of the principal amount outstanding at reporting date.

Queensland Urban Utilities Annual Report 2012/13 90
Notes to the financial statementsFor the year ended 30 June 2013
Central SEQ Distributor-Retailer Authority
31. Financial instruments (contd)
(d) Interest rate sensitivity analysis
Queensland Urban Utilities is exposed to interest rate risk through borrowings and cash deposited in interest bearing accounts. Queensland Urban Utilities manages its portfolio by setting, monitoring and adjusting the terms and duration of its loan portfolio as allowed under its commercial financing contract with QTC. The risk in borrowing is effectively managed through QTC’s capacity to issue securities with variable terms allowing an appropriate duration for that of Queensland Urban Utilities.
Sensitivity analysis The following sensitivity analysis depicts the outcome on net income if interest rates would change by +/- 1% from the year-end rate rates applicable to Queensland Urban Utilites’ financial assets and liabilities. The calculations assume that the rate would be held constant over the next financial year, with the change occurring at the beginning of that year. This is mainly attributable to Queensland Urban Utilities’ exposure to variable interest rates on its borrowings.
2013 -1% +1%
Net carrying amounts
$’000Profit $’000
Equity $’000
Profit $’000
Equity $’000
Cash and cash equivalents 56,291 (563) (563) 563 563
QTC client specific pool 533,089 5,331 5,331 (5,331) (5,331)
Overall effect on profit and equity 4,768 4,768 (4,768) (4,768)
2012 -1% +1%
Net carrying amounts
$’000Profit $’000
Equity $’000
Profit $’000
Equity $’000
Cash and cash equivalents 77,806 (778) (778) 778 778
QTC client specific pool 388,089 3,881 3,881 (3,881) (3,881)
Overall effect on profit and equity 3,103 3,103 (3,103) (3,103)

Queensland Urban Utilities Annual Report 2012/1391
Notes to the financial statementsFor the year ended 30 June 2013
Central SEQ Distributor-Retailer Authority
31. Financial instruments (contd)
(e) Fair value
Queensland Urban Utilities does not recognise any financial assets or financial liabilities at fair value.
The fair value of trade and other receivables and payables is assumed to approximate the value of the original transaction, less any allowance for impairment.
The fair value of borrowings is notified by QTC. It is calculated using discounted cash flow analyses and the effective interest rate and is disclosed below:
Carrying Amount $’000
Fair Value $’000
2013
Financial liabilities
Participant loans 25 1,486,806 1,486,806
QTC client specific pool 25 533,089 537,959
2,019,895 2,024,765
Carrying Amount $’000
Fair Value $’000
2012
Financial liabilities
Participant loans 25 1,486,806 1,507,071
QTC client specific pool 25 388,089 396,043
1,874,895 1,903,114

Queensland Urban Utilities Annual Report 2012/13 92
Notes to the financial statementsFor the year ended 30 June 2013
Central SEQ Distributor-Retailer Authority
Notes2013
$’0002012
$’000
32. Operating leases
(i) Leases as lessee
Non-cancellable operating lease rentals are payable as follows:
Less than one year 6,302 9,728
Between one and five years 24,713 28,898
More than five years 30,375 22,497
61,390 61,123
(ii) Leases as lessor
Non-cancellable operating leases rentals are receivable as follows:
Less than one year 162 130
Between one and five years 566 407
More than five years 410 475
1,138 1,012
33. Capital and other commitments
Contracted but not yet provided for and payable:
Within one year 83,250 139,515
One year and no later than five years 41,423 33,497
More than five years - -
124,673 173,012
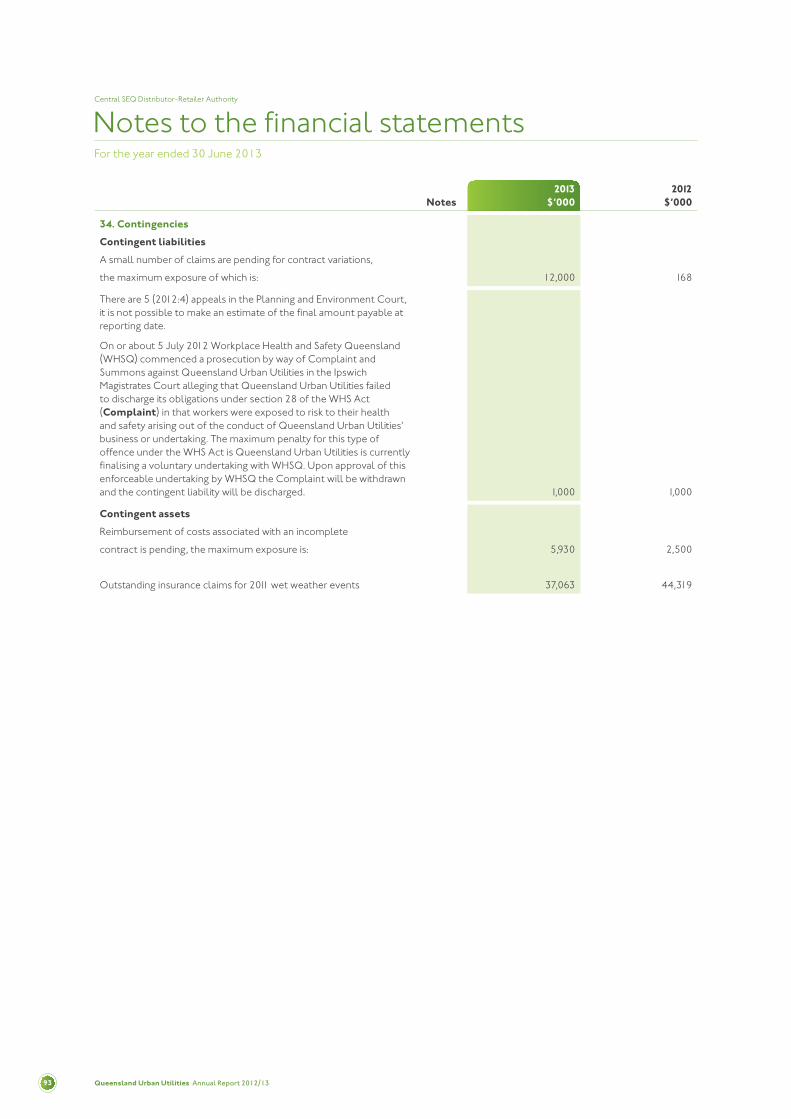
Queensland Urban Utilities Annual Report 2012/1393
Notes to the financial statementsFor the year ended 30 June 2013
Central SEQ Distributor-Retailer Authority
Notes2013
$’0002012
$’000
34. Contingencies
Contingent liabilities
A small number of claims are pending for contract variations,
the maximum exposure of which is: 12,000 168
There are 5 (2012:4) appeals in the Planning and Environment Court, it is not possible to make an estimate of the final amount payable at reporting date.
On or about 5 July 2012 Workplace Health and Safety Queensland (WHSQ) commenced a prosecution by way of Complaint and Summons against Queensland Urban Utilities in the Ipswich Magistrates Court alleging that Queensland Urban Utilities failed to discharge its obligations under section 28 of the WHS Act (Complaint) in that workers were exposed to risk to their health and safety arising out of the conduct of Queensland Urban Utilities’ business or undertaking. The maximum penalty for this type of offence under the WHS Act is Queensland Urban Utilities is currently finalising a voluntary undertaking with WHSQ. Upon approval of this enforceable undertaking by WHSQ the Complaint will be withdrawn and the contingent liability will be discharged. 1,000 1,000
Contingent assets
Reimbursement of costs associated with an incomplete
contract is pending, the maximum exposure is: 5,930 2,500
Outstanding insurance claims for 2011 wet weather events 37,063 44,319

Queensland Urban Utilities Annual Report 2012/13 94
Notes to the financial statementsFor the year ended 30 June 2013
Central SEQ Distributor-Retailer Authority
35. Superannuation
Refer to note 10 for details of amount of superannuation contribution paid by Queensland Urban Utilities to the superannuation funds in respect of this year for the benefit of the employees.
Local government superannuation scheme - LGsuper Queensland Urban Utilities contributes to the Local Government Superannuation Scheme (Qld) (the scheme). The scheme is a Multi-employer Plan as defined in the Australian Accounting Standard AASB119 employee Benefits.
The Queensland Local Government Superannuation Board, the trustee of the scheme, advised that the local government superannuation scheme was a complying superannuation scheme for the purpose of the Commonwealth Superannuation Industry (Supervision) legislation.
The scheme has three elements referred to as:
The City Defined Benefits Fund (CDBF) which covers former members of the City Super Defined Benefits Fund
The Regional Defined Benefits Fund (Regional DBF) which covers defined benefit fund members working for regional areas
The Accumulation Benefits Fund (ABF).
The CDBF is a defined benefit plan as defined in AASB119. Queensland Urban Utilities engaged an actuary to assess the values and to provide the disclosures in accordance with AASB119 (refer note 35 (a) to (k)).
The ABF is a defined contribution scheme as defined in AASB 119. Queensland Urban Utilities has no liability to or interest in the ABF other than the payment of the statutory contributions as required.
The Regional DBF is a defined benefit plan as defined in AASB119. Queensland Urban Utilities is not able to account for the Regional DBF as a defined benefit plan in accordance with AASB119 because the scheme is unable to account to Queensland Urban Utilities for its proportionate share of the defined benefit obligation, plan assets and costs.
Any amount by which the Regional DBF and ABF is over or under funded would only affect future benefits and contributions to the Regional DBF, and is not an asset or liability of Queensland Urban Utilities. Accordingly, there is no recognition in the financial statements of any over or under funding of these funds.
The audited general purpose financial report of the scheme as at 30 June 2012 (the most recent available) which was not subject to any audit qualification, indicates that the assets of the scheme are sufficient to meet the vested benefits.
The most recent actuarial assessment of the scheme was undertaken as at 1 July 2012. The actuary indicated that “the Regional DBF is currently in a satisfactory but modest financial position and remains vulnerable to adverse short and medium term experience."
Following the previous actuarial assessment in 2009, Queensland Urban Utilities was advised by the trustee of the scheme, that additional contributions may be imposed in the future at a level necessary to protect the entitlements of Regional DBF members. In the 2012 actuarial report the actuary has recommended no change to the employer contribution levels at this time.
The next actuarial investigation will be conducted as at 1 July 2015.

Queensland Urban Utilities Annual Report 2012/1395
Notes to the financial statementsFor the year ended 30 June 2013
Central SEQ Distributor-Retailer Authority
2013 $’000
2012 $’000
(a) Reconciliation of the present value of the defined benefit obligation
Present value of defined benefits obligations at the beginning of the current year 11,341 12,037
Current service cost 285 311
Interest cost 373 535
Contributions by plan participants 142 144
Actuarial losses/(gains) 633 834
Benefits paid (898) (2,384)
Taxes and premiums paid (84) (136)
Present value of defined benefits obligations at the end of the current year 11,792 11,341
(b) Reconciliation of the fair value of the plan assets
Fair value of plan assets at the beginning of the year 11,954 13,128
Expected return on plan assets 795 840
Actuarial gains / (losses) 340 (311)
Employer contributions 323 673
Contributions by plan participants 142 144
Benefits paid (898) (2,384)
Taxes and premiums paid (84) (136)
Fair value of plan assets at the end of the year 12,572 11,954
(c) Reconciliation of the assets and liabilities recognised in the Statement of Financial Position
Defined benefit obligations (includes contributions tax provision) 11,792 11,341
Fair value of plan assets (12,572) (11,954)
Net superannuation asset (780) (613)
Defined benefit plan increase/(decrease) 167 (478)
(d) Expense recognised in Statement of Comprehensive Income
Service cost 285 311
Interest cost 373 535
Expected return on assets (795) (840)
Actuarial losses 293 1,145
Superannuation expense 156 1,151
The percentage invested in each asset class at the reporting date:
Australian equity 16% 24%
International equity 16% 24%
Fixed income 39% 12%
Property 14% 15%
Alternatives/other 13% 25%
Cash 2% 0%
35. Superannuation (contd)
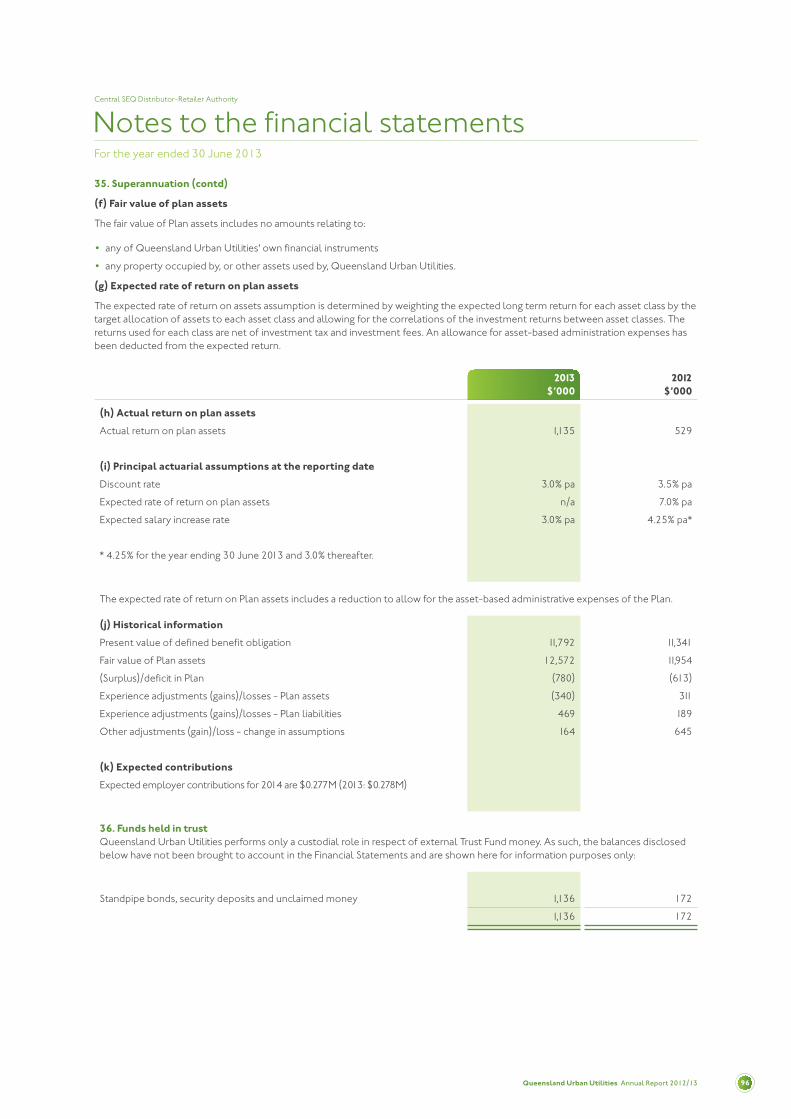
Queensland Urban Utilities Annual Report 2012/13 96
Notes to the financial statementsFor the year ended 30 June 2013
Central SEQ Distributor-Retailer Authority
35. Superannuation (contd)
(f) Fair value of plan assets
The fair value of Plan assets includes no amounts relating to:
• any of Queensland Urban Utilities' own financial instruments
• any property occupied by, or other assets used by, Queensland Urban Utilities.
(g) Expected rate of return on plan assets
The expected rate of return on assets assumption is determined by weighting the expected long term return for each asset class by the target allocation of assets to each asset class and allowing for the correlations of the investment returns between asset classes. The returns used for each class are net of investment tax and investment fees. An allowance for asset-based administration expenses has been deducted from the expected return.
2013 $’000
2012 $’000
(h) Actual return on plan assets
Actual return on plan assets 1,135 529
(i) Principal actuarial assumptions at the reporting date
Discount rate 3.0% pa 3.5% pa
Expected rate of return on plan assets n/a 7.0% pa
Expected salary increase rate 3.0% pa 4.25% pa*
* 4.25% for the year ending 30 June 2013 and 3.0% thereafter.
The expected rate of return on Plan assets includes a reduction to allow for the asset-based administrative expenses of the Plan.
(j) Historical information
Present value of defined benefit obligation 11,792 11,341
Fair value of Plan assets 12,572 11,954
(Surplus)/deficit in Plan (780) (613)
Experience adjustments (gains)/losses - Plan assets (340) 311
Experience adjustments (gains)/losses - Plan liabilities 469 189
Other adjustments (gain)/loss - change in assumptions 164 645
(k) Expected contributions
Expected employer contributions for 2014 are $0.277M (2013: $0.278M)
36. Funds held in trustQueensland Urban Utilities performs only a custodial role in respect of external Trust Fund money. As such, the balances disclosed below have not been brought to account in the Financial Statements and are shown here for information purposes only:
Standpipe bonds, security deposits and unclaimed money 1,136 172
1,136 172
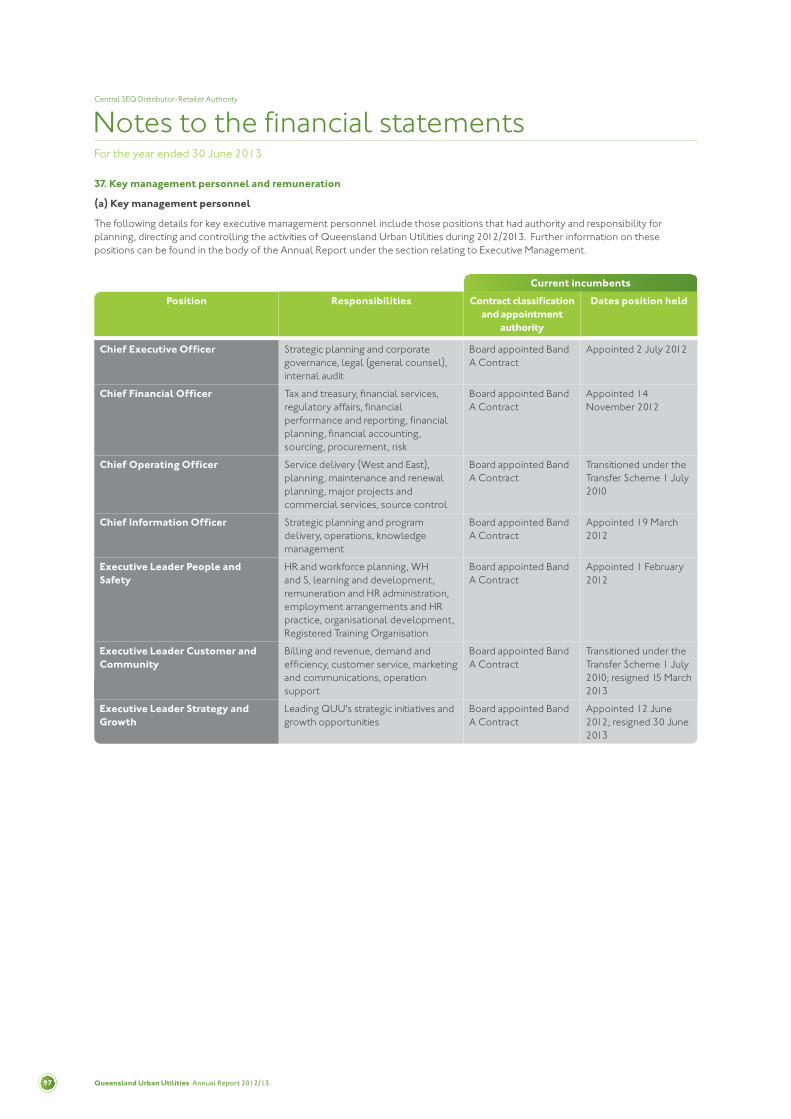
Queensland Urban Utilities Annual Report 2012/1397
Notes to the financial statementsFor the year ended 30 June 2013
Central SEQ Distributor-Retailer Authority
Current incumbents
Position Responsibilities Contract classification and appointment
authority
Dates position held
Chief Executive Officer Strategic planning and corporate governance, legal (general counsel), internal audit
Board appointed Band A Contract
Appointed 2 July 2012
Chief Financial Officer Tax and treasury, financial services, regulatory affairs, financial performance and reporting, financial planning, financial accounting, sourcing, procurement, risk
Board appointed Band A Contract
Appointed 14 November 2012
Chief Operating Officer Service delivery (West and East), planning, maintenance and renewal planning, major projects and commercial services, source control
Board appointed Band A Contract
Transitioned under the Transfer Scheme 1 July 2010
Chief Information Officer Strategic planning and program delivery, operations, knowledge management
Board appointed Band A Contract
Appointed 19 March 2012
Executive Leader People and Safety
HR and workforce planning, WH and S, learning and development, remuneration and HR administration, employment arrangements and HR practice, organisational development, Registered Training Organisation
Board appointed Band A Contract
Appointed 1 February 2012
Executive Leader Customer and Community
Billing and revenue, demand and efficiency, customer service, marketing and communications, operation support
Board appointed Band A Contract
Transitioned under the Transfer Scheme 1 July 2010; resigned 15 March 2013
Executive Leader Strategy and Growth
Leading QUU's strategic initiatives and growth opportunities
Board appointed Band A Contract
Appointed 12 June 2012; resigned 30 June 2013
37. Key management personnel and remuneration
(a) Key management personnel
The following details for key executive management personnel include those positions that had authority and responsibility for planning, directing and controlling the activities of Queensland Urban Utilities during 2012/2013. Further information on these positions can be found in the body of the Annual Report under the section relating to Executive Management.

Queensland Urban Utilities Annual Report 2012/13 98
Notes to the financial statementsFor the year ended 30 June 2013
Central SEQ Distributor-Retailer Authority
37. Key management personnel and remuneration (contd)
(b) Remuneration
Remuneration for key executive management personnel is determined by the Board.
Remuneration and other terms of employment is specified in individual employment contracts. The contracts provide for the provision of performance-related cash bonuses.
For the 2012/2013 year, remuneration of key executive management personnel increased by between 3.0% and 4.25% (2012: 3.6%) based on a market review of similar roles.
Remuneration packages for key executive management personnel comprise the following components:
Short term employee benefits consisting of base salary, allowances and leave entitlements paid and provided for the entire year or for that part of the year during which the employee occupied the specified position. Amounts disclosed equal the amount expensed in the Statement of Comprehensive Income.
Long term employee benefits include long service leave accrued.
Post employment benefits include superannuation contributions.
Redundancy payments are not provided for within individual contracts of employment.
Contracts of employment provide only for notice periods or payment in lieu of notice on termination, regardless of the reason for termination.
Performance bonuses may be paid or payable annually depending upon satisfaction of key criteria.
Performance payments of the key executive management are capped at a range of between 15% and 25% of total fixed remuneration. The amounts payable are tied to the achievement of pre-determined organisational and individual performance targets as agreed by the Board and the Chief Executive Officer.

Queensland Urban Utilities Annual Report 2012/1399
Notes to the financial statementsFor the year ended 30 June 2013
Central SEQ Distributor-Retailer Authority
37. Key management personnel and remuneration (contd)
(b) Remuneration (contd)
Total fixed remuneration is calculated on a "total cost" basis as below.
2013
Position
Short term monetary benefits
$’000
Non- monetary benefits
$’000
Long term employee benefits
$’000
Post employment
benefits $’000
Termination benefits
$’000
Total remuneration
$’000
Chief Executive Officer (appointed 2 July 2012)* 508 - 13 46 - 566
Chief Financial Officer (appointed 14 November 2012) 187 - 5 17 - 209
Chief Operating Officer 313 - 8 28 - 349
Chief Information Officer 223 - 6 20 - 248
Executive Leader People and Safety 235 - 6 21 - 262
Executive Leader Customer and Community 277 - 7 28 37 349
Executive Leader Strategy and Growth 219 - 5 20 - 244
Acting Chief Financial Officer (1 July 2012 to 13 November 2012) 74 - 2 7 - 83
Acting Executive Leader Customer and Community (15 March 2013 to 30 June 2013) 59 - 1 5 - 66
Total remuneration 2,095 - 52 192 37 2,376
* The Chief Executive Officer was appointed on 2 July 2012 and prior to this appointment held the position of Chief Financial Officer. Accordingly the amount disclosed as short term monetary benefits includes benefits associated with the role of Chief Financial Officer.
The outgoing Chief Executive Officer resigned with an effective date of 1 July 2012 and left the organisation after taking leave entitlements. The total remuneration paid on resignation was $153,848.
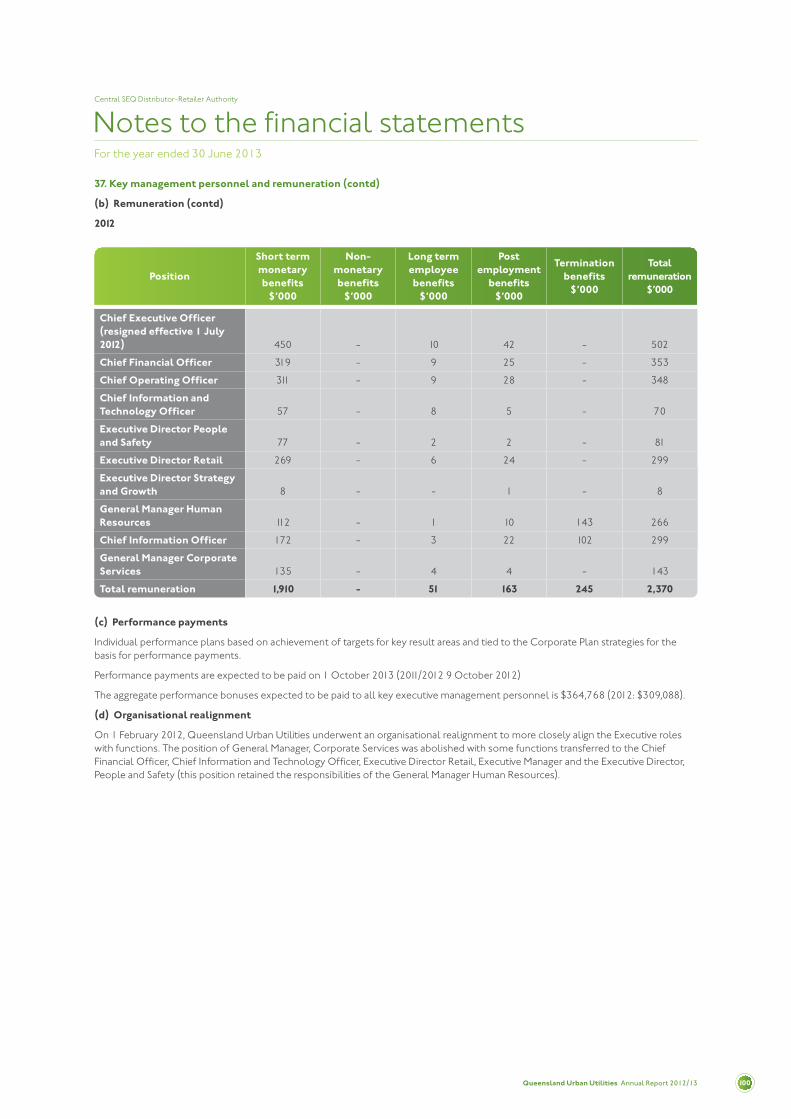
Queensland Urban Utilities Annual Report 2012/13 100
Notes to the financial statementsFor the year ended 30 June 2013
Central SEQ Distributor-Retailer Authority
37. Key management personnel and remuneration (contd)
(b) Remuneration (contd)
2012
Position
Short term monetary benefits
$’000
Non- monetary benefits
$’000
Long term employee benefits
$’000
Post employment
benefits $’000
Termination benefits
$’000
Total remuneration
$’000
Chief Executive Officer (resigned effective 1 July 2012) 450 - 10 42 - 502
Chief Financial Officer 319 - 9 25 - 353
Chief Operating Officer 311 - 9 28 - 348
Chief Information and Technology Officer 57 - 8 5 - 70
Executive Director People and Safety 77 - 2 2 - 81
Executive Director Retail 269 - 6 24 - 299
Executive Director Strategy and Growth 8 - - 1 - 8
General Manager Human Resources 112 - 1 10 143 266
Chief Information Officer 172 - 3 22 102 299
General Manager Corporate Services 135 - 4 4 - 143
Total remuneration 1,910 - 51 163 245 2,370
(c) Performance payments
Individual performance plans based on achievement of targets for key result areas and tied to the Corporate Plan strategies for the basis for performance payments.
Performance payments are expected to be paid on 1 October 2013 (2011/2012 9 October 2012)
The aggregate performance bonuses expected to be paid to all key executive management personnel is $364,768 (2012: $309,088).
(d) Organisational realignment
On 1 February 2012, Queensland Urban Utilities underwent an organisational realignment to more closely align the Executive roles with functions. The position of General Manager, Corporate Services was abolished with some functions transferred to the Chief Financial Officer, Chief Information and Technology Officer, Executive Director Retail, Executive Manager and the Executive Director, People and Safety (this position retained the responsibilities of the General Manager Human Resources).

Queensland Urban Utilities Annual Report 2012/13101
Notes to the financial statementsFor the year ended 30 June 2013
Central SEQ Distributor-Retailer Authority
38. Related parties
Key management personnel compensation
(a) Board members
The Board Members who were paid directly or indirectly were:
2013*
Salary and fees $’000
Superannuation $’000
Total $’000
Jude Munro AO (resigned 17/8/12) 12 1 13
Geoff Harley (appointed 8/10/12) 62 6 68
Barry Ball 43 4 47
Dennis Cavagna 43 4 47
Diana Eilert 43 4 47
Paul Emmerson 43 4 47
Phil Kesby 43 4 47
Bernard Ponting (Acting Chair 18/8/12 to 7/10/12) 50 4 54
Len Scanlan 43 4 47
384 35 418
* 2013 includes 11 months payments. The CPI increase of 1.3% was applied and monthly rates set at $7,781 Chair and $3,935.50 Board members.

Queensland Urban Utilities Annual Report 2012/13 102
Notes to the financial statementsFor the year ended 30 June 2013
Central SEQ Distributor-Retailer Authority
2012*
Salary and fees $’000
Superannuation $’000
Total $’000
Jude Munro AO 101 9 110
Barry Ball 50 5 55
Dennis Cavagna 50 5 55
Diana Eilert 49 6 55
Paul Emmerson 50 5 55
Phil Kesby 50 5 55
Bernard Ponting 50 5 55
Len Scanlan 50 5 55
450 45 495
* 2012 includes 13 months payments. The CPI increase of 3.6% was applied and monthly rates set at $7,770 Chair and $3,885 Board members. Due to timing the above includes 12 payments at the 2011/2012 rate and 1 payment at the 2010/2011 rate.
(b) Loans to key management personnel
None of the key management personnel have personal loans with Queensland Urban Utilities oustanding at 30 June 2013.
(c) Other key management personnel transactions
Transactions with related parties of key management personnel that occurred during the financial year are noted below.
Louise Dudley, Chief Executive Officer, is a Director of LG Super. Queensland Urban Utilities contributed to the fund based on actuarial advice and the total payments for the year were nil (2012: $332,500). All transactions are made on normal commercial terms.
(d) Board member transactions
There are no transactions with related parties of Board members for the financial year, other than on normal commercial terms.
38. Related parties (contd)
(a) Board members (contd)

Queensland Urban Utilities Annual Report 2012/13103
Notes to the financial statementsFor the year ended 30 June 2013
Central SEQ Distributor-Retailer Authority
38. Related parties (contd)
(e) Transactions with Participating Councils
Queensland Urban Utilities entered into a number of transitional service agreements (TSA's) with its Participants. The amount of expenditure included in the Statement of Comprehensive Income follows:
2013 $’000
2012 $’000
Brisbane City Council
Services provided include: 17,481 19,457
information and communication technology, payroll, internal audit, accommodation, contact centre, information management systems, rates processing, sourcing and category management, logistics and warehousing, GIS, radio access
Brisbane City Council (BCC) communicated their intention not to continue service provision under the TSA’s post the expiration date of 30 June 2013.
During 2012/2013 Queensland Urban Utilities will enter into a range of contracts for managed services to faciliate separation from the BCC systems and services.
Ipswich City Council
Services provided include: 242 219
PABX, radio access, GIS, help desk and phones
Capital commitments to be provided by Brisbane City
Council (included in note 33) 10 4,149
Income from insurance 7,256 (74)
Assets written off due to damage beyond repair 819 48
Cost of replacement of assets (12,011) (18,820)
Cost of repair to assets (25) (2,579)
Other costs (2,684) (1,073)
Cost to Queensland Urban Utilities (6,645) (22,498)
39. Significant weather events
In January 2011 there were a number of signicant weather events that affected the business operations across the Brisbane, Ipswich and Lockyer Valley regions. Associated revenue and costs are:

Queensland Urban Utilities Annual Report 2012/13 104
Certificate of Queensland Urban UtilitiesFor the year ended 30 June 2013
Central SEQ Distributor-Retailer Authority
Queensland Urban Utilities Annual Report 2012/13105
Independent Auditor's ReportFor the year ended 30 June 2013
Central SEQ Distributor-Retailer Authority
Queensland Urban Utilities Annual Report 2012/13 106
Independent Auditor's ReportFor the year ended 30 June 2013
Central SEQ Distributor-Retailer Authority


For more information visit www.urbanutilities.com.au
or call 132 657
Queensland Urban Utilities PO BOX 2765
Brisbane QLD 4001 ABN 86 673 835 011
Q00476-2013 © Queensland Urban Utilities 2013.