Embed Size (px)
Citation preview
Urban heat island in the metropolitan area of São Paulo and the influence of warm and dry
air masses during summer
Flavia N. D. Ribeiro1, Arissa S. umezaki1, Jhonathan F. T. de Souza1, Jacyra Soares2, Amauri Pereira de Oliveira2, Regina
Maura de Miranda1
1 School of Arts, Sciences and Humanities – University of Sao Paulo, Av. Arlindo Bettio, 1000, Ermelino Matarazzo, Sao Paulo – SP, Brazil,
[email protected] Institute of Astronomy, Geophysics and Atmospheric Sciences – University
of Sao Paulo, Rua do Matao, 1226,Butanta, Sao Paulo – SP, Brazil
Outline
● UHI in the metropolitan region of Sao Paulo (MRSP)
● Main goals
● Methodology and data
● Results - Spectral analysis and diurnal cycle
● Results - Influence of sea-breeze
● Results - Influence of the dry and warm conditions during Summer 2013/2014
● Conclusions
● References
● Acknowledgment
●UHI in the MRSP
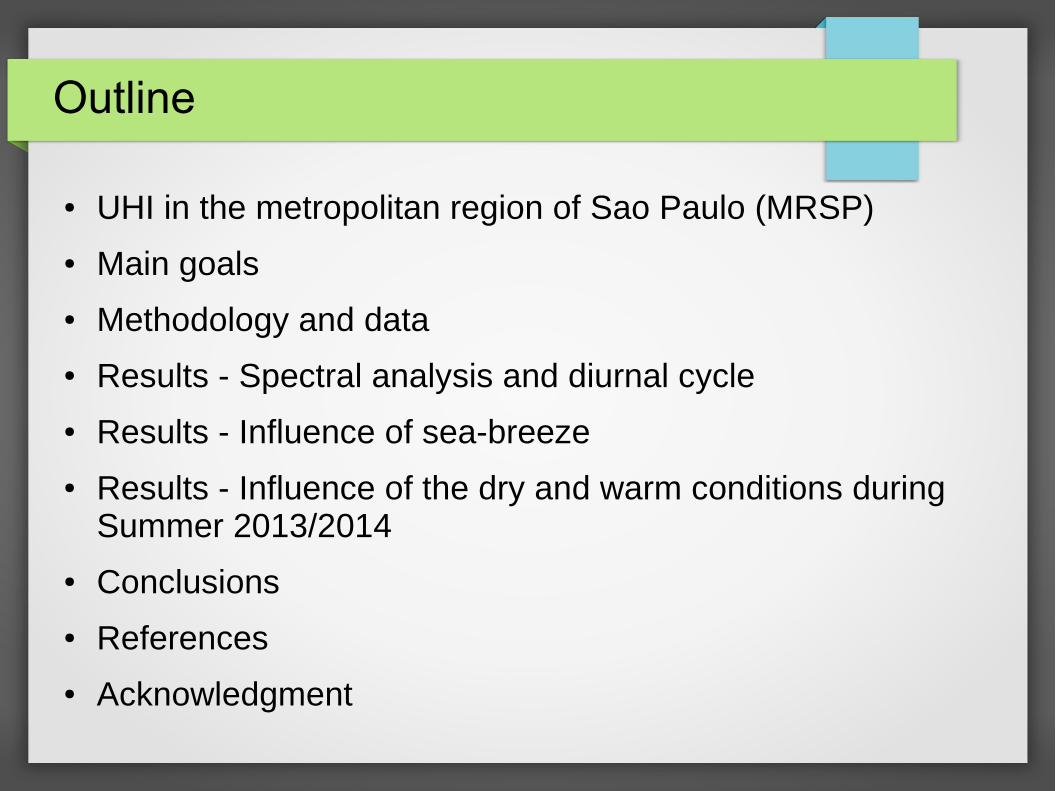
● MRSP – 39 cities, including Sao Paulo
● 20 million inhabitants (48% of the population of the state)
● 8000 km2 area (3% of the area of the state)
● Sao Paulo city (-23° 32' 51'' and -46° 38' 10'') – 1500 km2 of area and more than 11 million inhabitants
● Dry winter and wet summer
● Predominant NE flow (South Atlantic High), disrupted by cold fronts (SW)
● Influence of sea-breeze
● Mountain-valley circulation when winds are weak and building blocking and channeling when winds are strong
● Average altitude of 700 m ASL
● 60 km distant from the coast (Oliveira et al., 2003)
●UHI in the MRSP
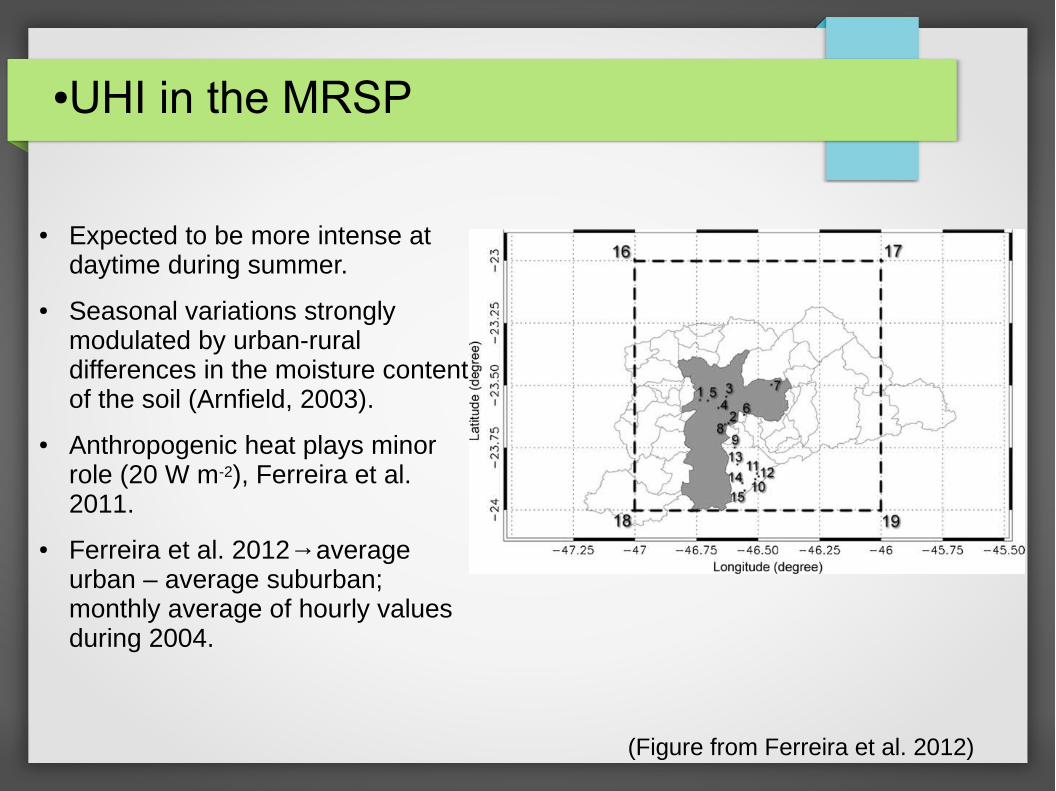
● Expected to be more intense at daytime during summer.
● Seasonal variations strongly modulated by urban-rural differences in the moisture content of the soil (Arnfield, 2003).
● Anthropogenic heat plays minor role (20 W m-2), Ferreira et al. 2011.
● Ferreira et al. 2012→average urban – average suburban; monthly average of hourly values during 2004.
(Figure from Ferreira et al. 2012)
●UHI in the MRSP
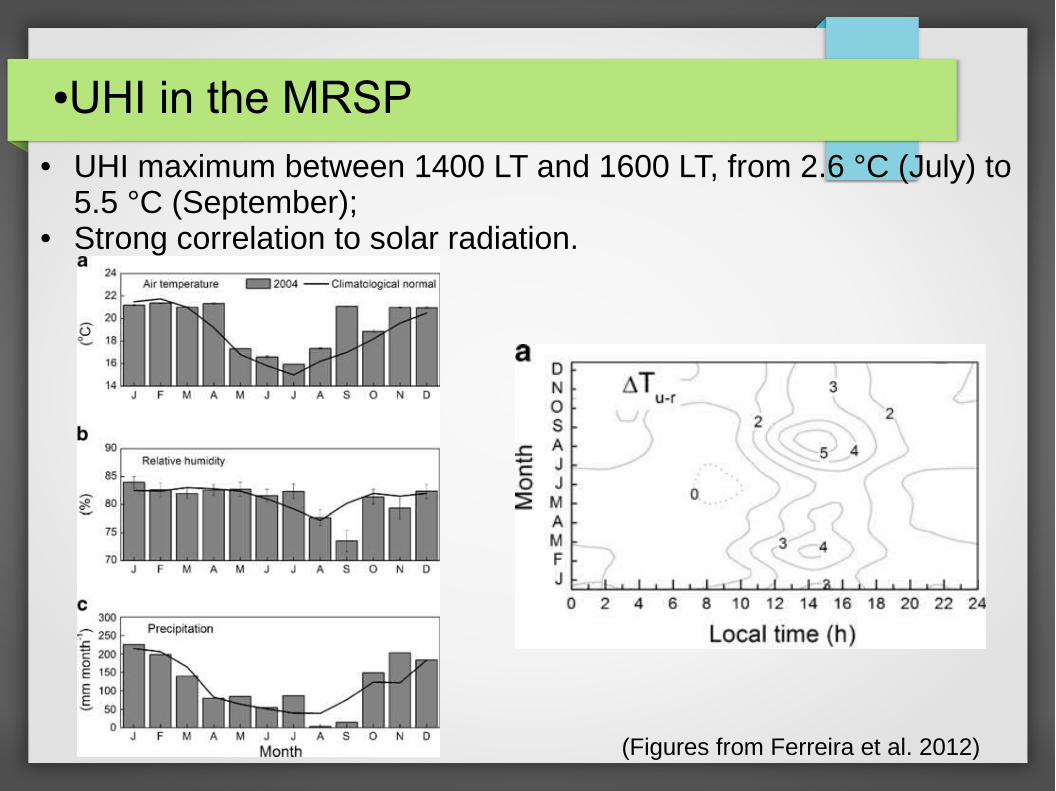
(Figures from Ferreira et al. 2012)
● UHI maximum between 1400 LT and 1600 LT, from 2.6 °C (July) to 5.5 °C (September);
● Strong correlation to solar radiation.
●UHI in the MRSP
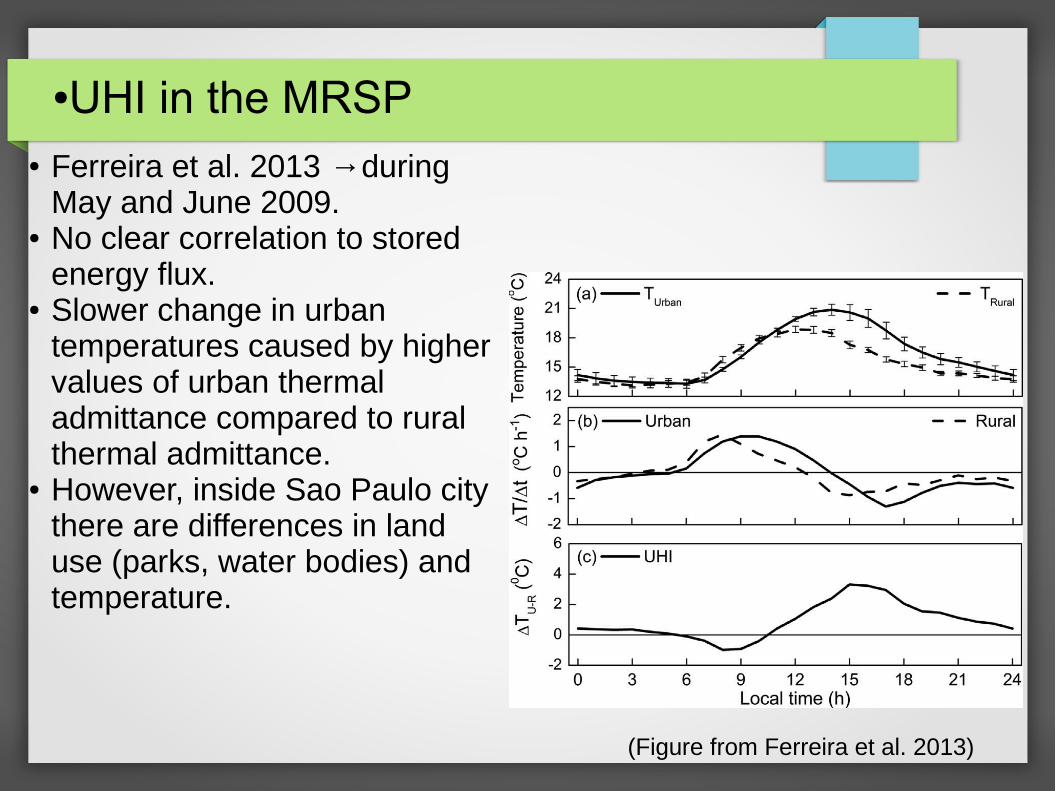
(Figure from Ferreira et al. 2013)
● Ferreira et al. 2013 →during May and June 2009.
● No clear correlation to stored energy flux.
● Slower change in urban temperatures caused by higher values of urban thermal admittance compared to rural thermal admittance.
● However, inside Sao Paulo city there are differences in land use (parks, water bodies) and temperature.
●Main goals
● To study:● the temperature field in the city of Sao Paulo● the evolution in time of the temperature differences
between urban and non-urban sites● the influence of the sea-breeze in the UHI phenomenon● the influence of synoptic conditions that may enhance
the UHI intensity
●Methodology and data
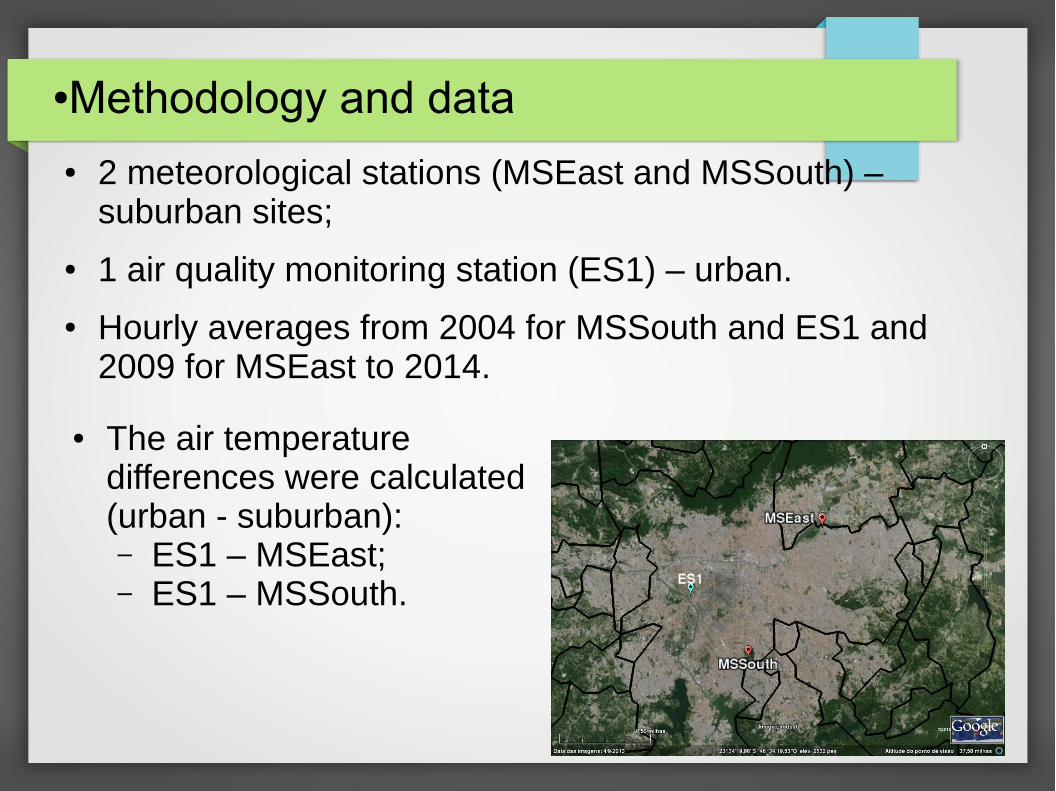
● 2 meteorological stations (MSEast and MSSouth) – suburban sites;
● 1 air quality monitoring station (ES1) – urban.
● Hourly averages from 2004 for MSSouth and ES1 and 2009 for MSEast to 2014.
● The air temperature differences were calculated (urban - suburban):– ES1 – MSEast;– ES1 – MSSouth.
●Methodology and data
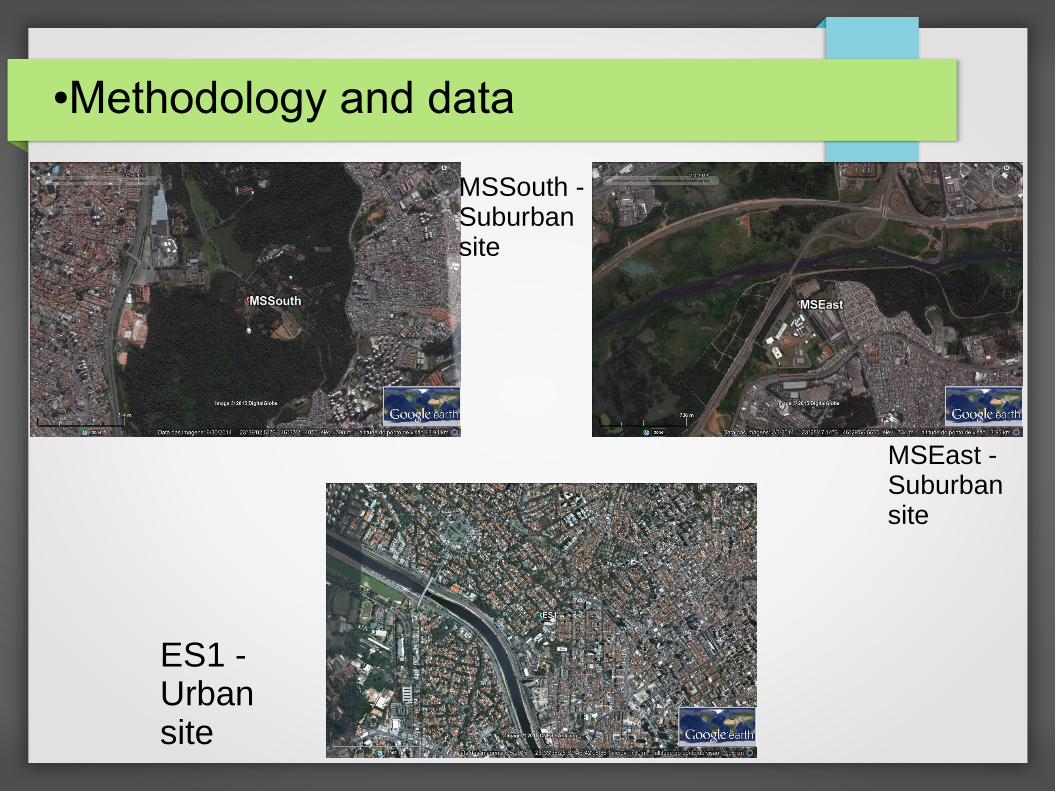
ES1 - Urban site
MSSouth - Suburban site
MSEast - Suburban site
●Methodology and data
● Spectral analysis
– A periodogram was produces with each data series (ES1 – MSEast and ES1 – MSSouth)
● Diurnal evolution
– Hourly averages were calculated for each complete data series● Case study: influence of sea breeze
– Air temperature and humidity fields at August 6th, 2013, using more air quality environmental stations
● Case study: influence of a warm and dry air mass during the Summer of 2013/2014
– Monthly averages for the past years compared to the monthly averages of the anomalous Summer
●Results – Spectral analysis
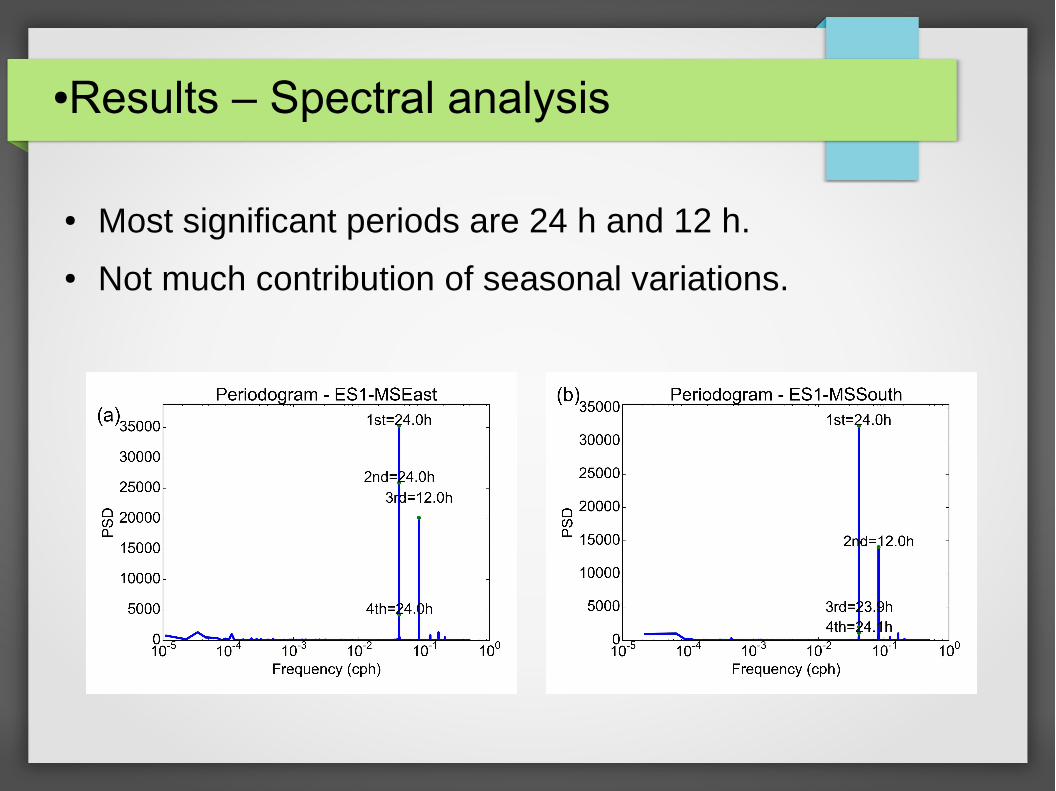
● Most significant periods are 24 h and 12 h.
● Not much contribution of seasonal variations.
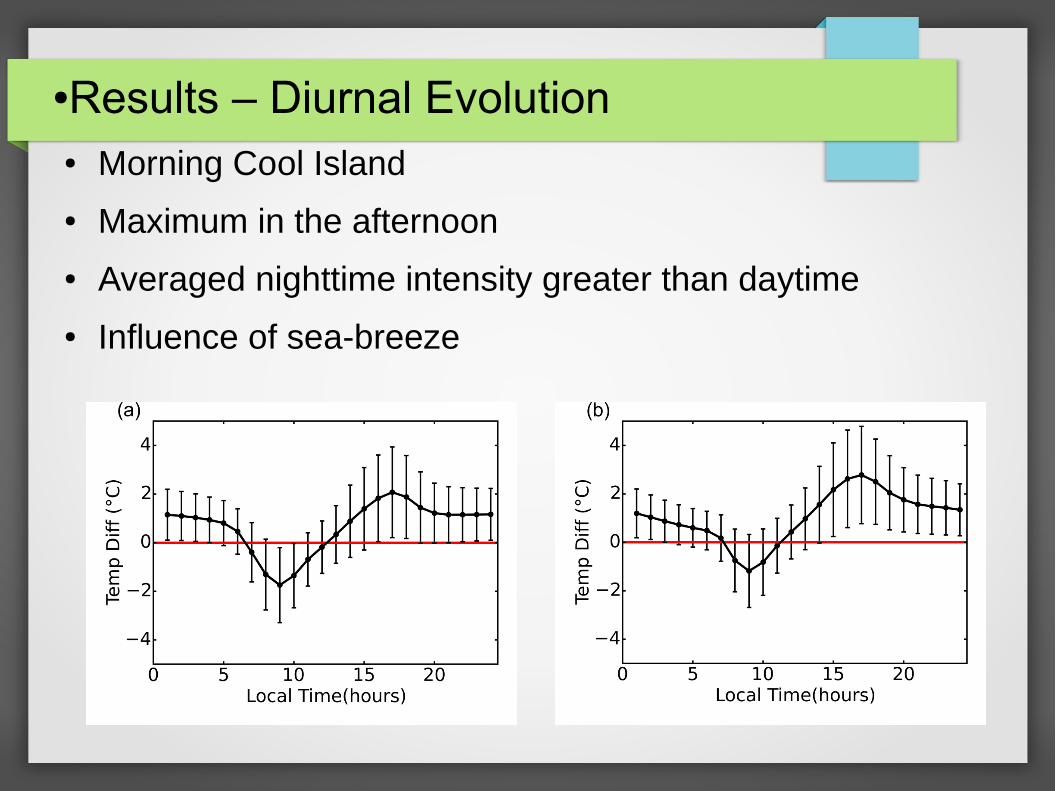
●Results – Diurnal Evolution● Morning Cool Island
● Maximum in the afternoon
● Averaged nighttime intensity greater than daytime
● Influence of sea-breeze
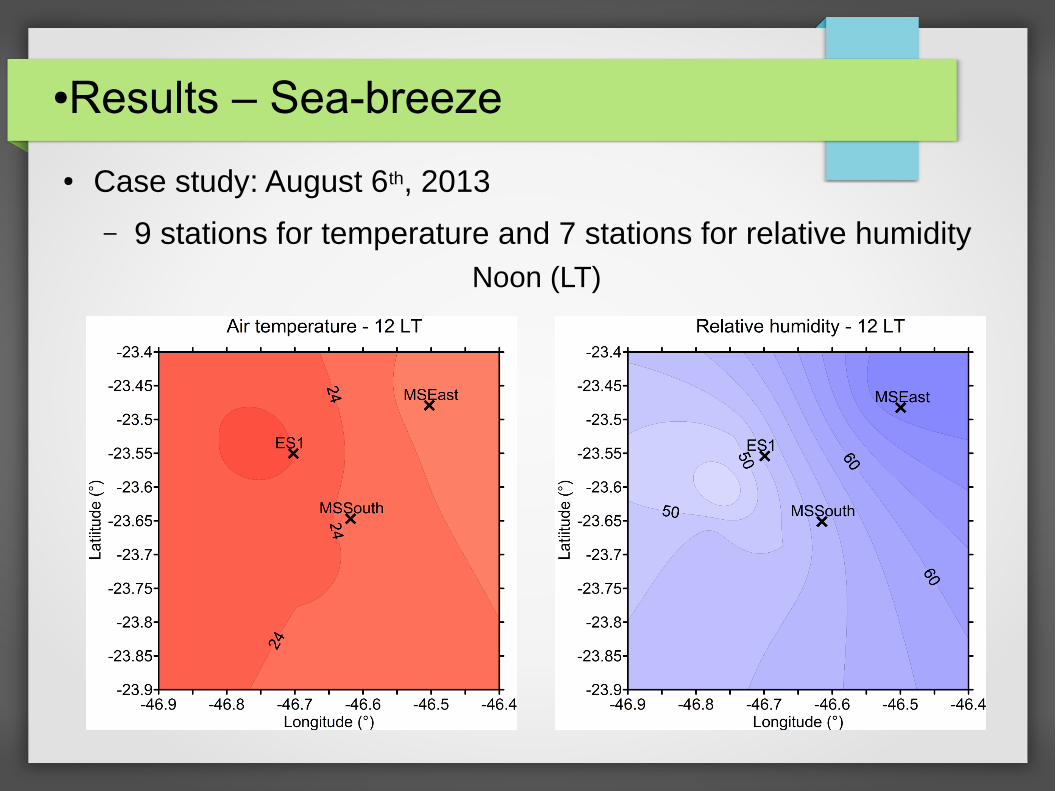
●Results – Sea-breeze
● Case study: August 6th, 2013
– 9 stations for temperature and 7 stations for relative humidityNoon (LT)
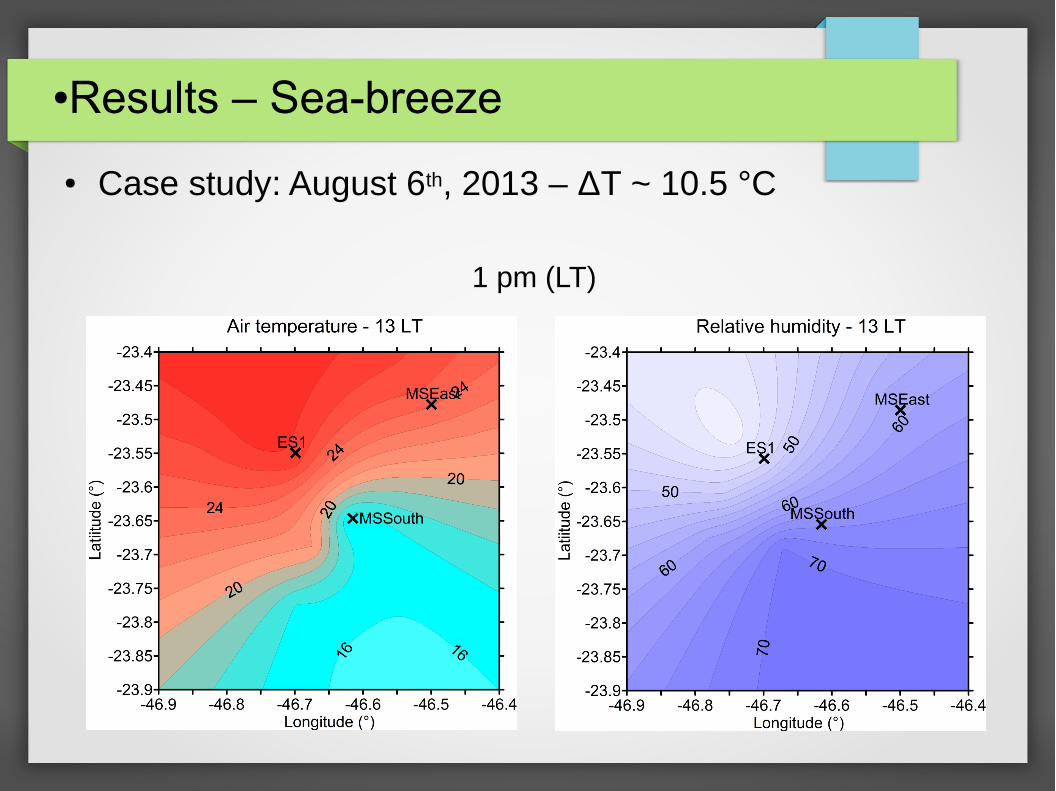
●Results – Sea-breeze
● Case study: August 6th, 2013 – ΔT ~ 10.5 °C
1 pm (LT)
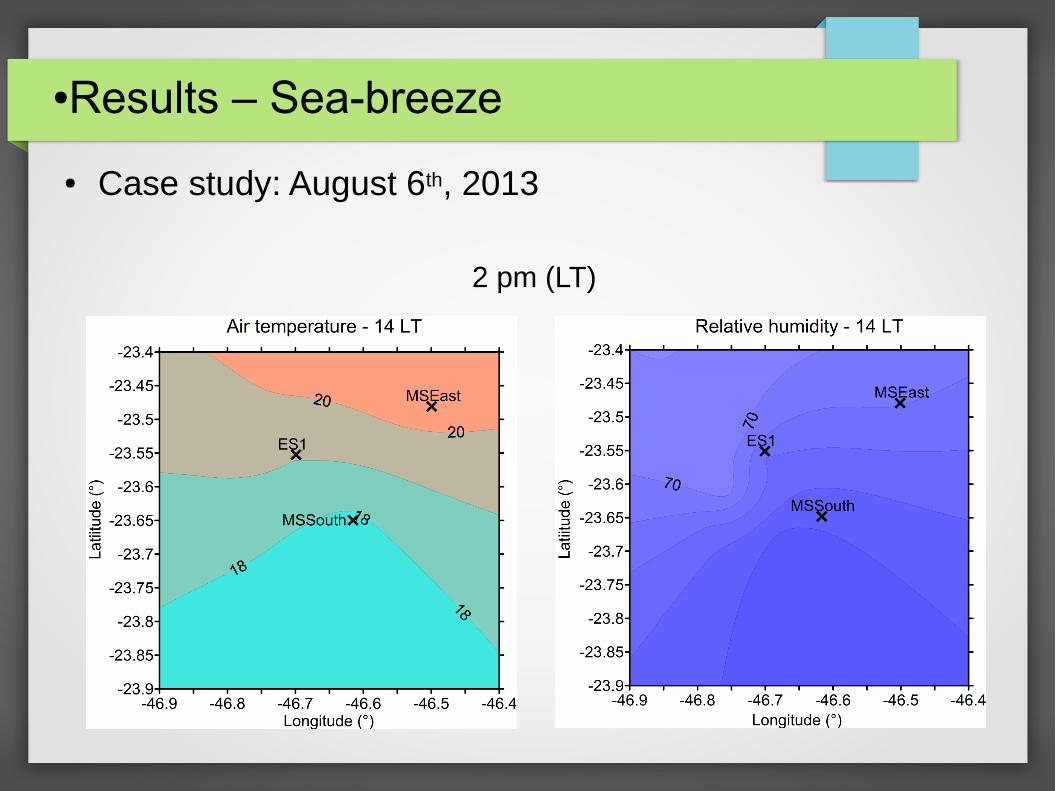
●Results – Sea-breeze
● Case study: August 6th, 2013
2 pm (LT)
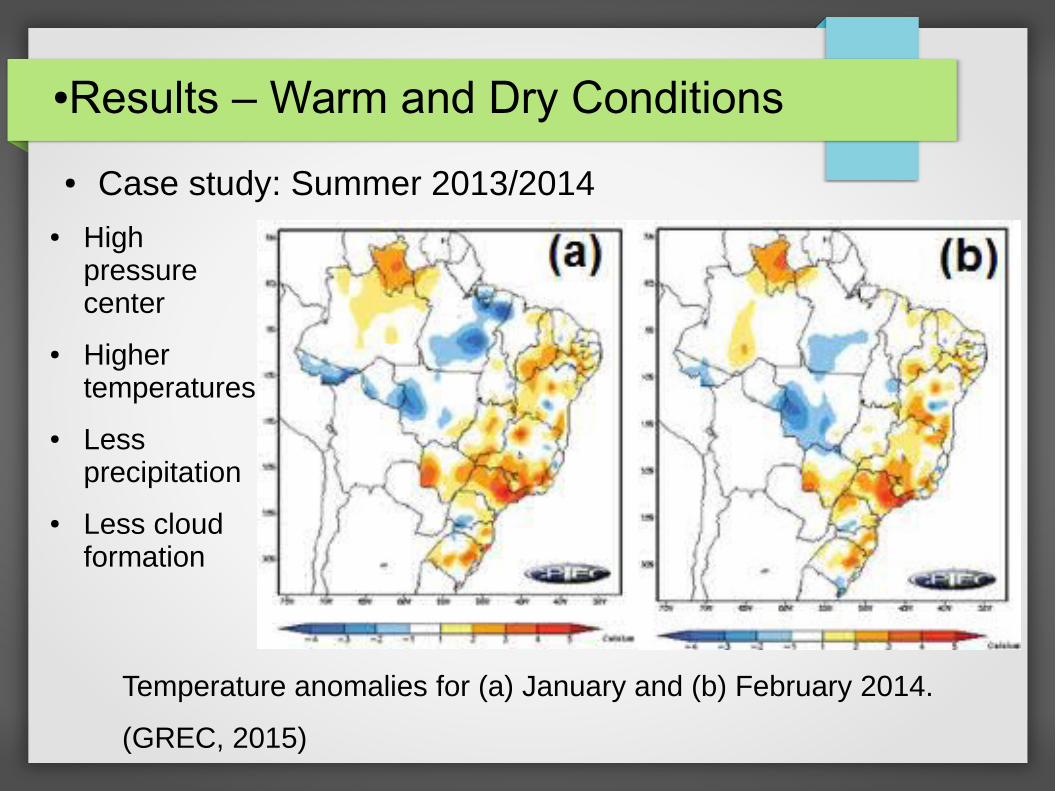
●Results – Warm and Dry Conditions
● Case study: Summer 2013/2014
Temperature anomalies for (a) January and (b) February 2014.
(GREC, 2015)
● High pressure center
● Higher temperatures
● Less precipitation
● Less cloud formation
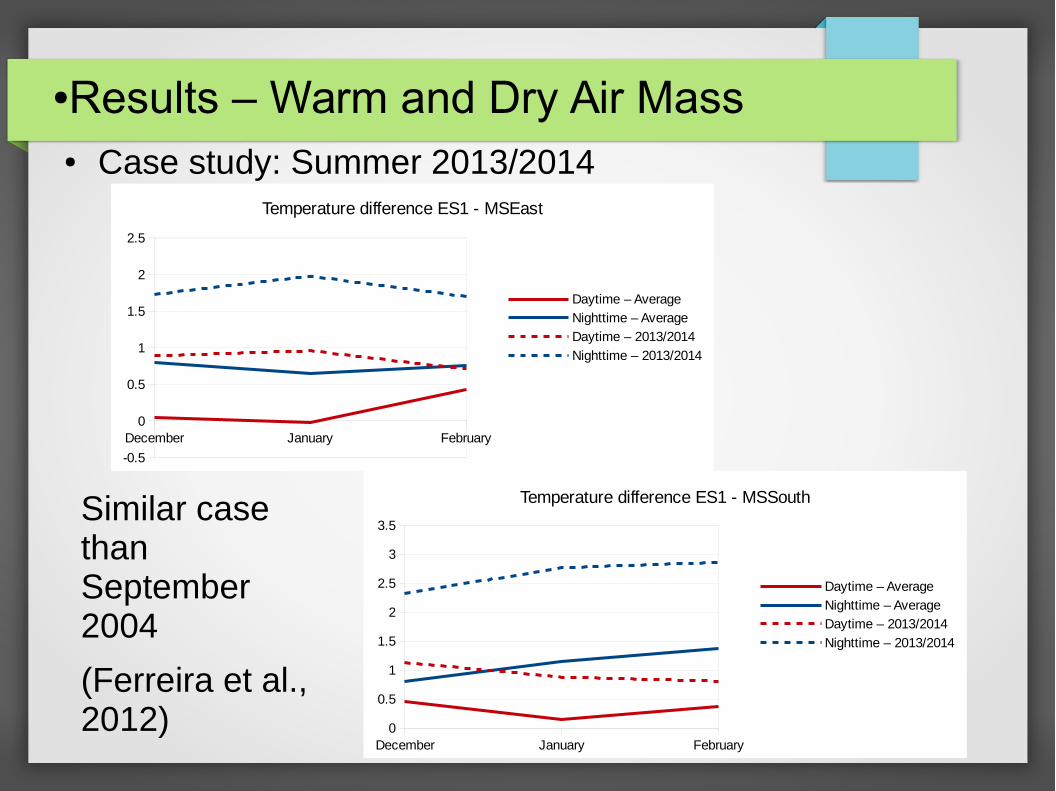
●Results – Warm and Dry Air Mass● Case study: Summer 2013/2014
flavia flavia
December January February
-0.5
0
0.5
1
1.5
2
2.5
Temperature difference ES1 - MSEast
Daytime – Average
Nighttime – Average
Daytime – 2013/2014
Nighttime – 2013/2014
December January February0
0.5
1
1.5
2
2.5
3
3.5
Temperature difference ES1 - MSSouth
Daytime – Average
Nighttime – Average
Daytime – 2013/2014
Nighttime – 2013/2014
Similar case than September 2004
(Ferreira et al., 2012)
●Conclusions
● The UHI in Sao Paulo city is complex (large area, great spatial variation of land use types) and observation are scarce.
– presence of an Urban Cool Island during morning hours;
– maximum intensity of the Urban Heat Island at late evening and early nighttime hours, agreeing with previous results (Ferreira et al., 2013);
– sea breeze circulation influences temperature differences within the Sao Paulo city;
– larger averaged UHI intensity at nighttime, since the morning cool island compensates the evening heat island when averaging daytime hours;
– the presence of a high pressure center, creating hot and dry conditions over the MRSP during the austral Summer of 2013/2014, increased the UHI intensity. This result suggests correlation between solar radiation and UHI intensity, agreeing with previous work (Ferreira et al., 2011).
●References
Arnfield A.J., 2003: Two decades of urban climate research: a review of turbulence, exchanges of energy and water, and the urban heat island. Int. J. Climatol. 23, 1–26 (DOI: 10.1002/joc.859)
GREC – Grupo de Estudos Climaticos. University of Sao Paulo – Institute of Astronomy, Geophysics and Atmospheric Sciences – Department of Atmospheric Sciences. Web. 22 June 2015. (http://www.grec.iag.usp.br/data/monitoramentoclimatico_USA.php)
Ferreira M.J., Oliveira A.P. and Soares J., 2010: Anthropogenic heat in the City of Sao Paulo, Brazil. Theoretical and Applied Climatology, 104, 43-56 (DOI: 10.1007/s00704-010-0322-7
Ferreira M.J., Oliveira A.P., Soares J., Codato G., Barbaro E.W., Escobedo J.F., 2011: Radiation balance at the surface in the City of Sao Paulo, Brazil. Diurnal and seasonal variations. Theoretical and applied climatology, 107, 229-246 (DOI: 10.1007/s00704-011-0480-2)
Ferreira M. J., Oliveira A. P., Soares J, 2013: Diurnal variation in stored energy flux in Sao Paulo city, Brazil. Urban Climate, 5, 36-51
Oliveira A. P., Bornstein R., Soares, J., 2003: Annual and diurnal wind patterns in the city of Sao Paulo. Water, Air and Soil Pollution: FOCUS, 3, 3-15
ACKNOWLEDGMENT
Fundacao de Amparo a Pesquisa do Estado de Sao Paulo (FAPESP) grant number 2014/04372-2
Conselho Nacional de Desenvolvimento Cientifico e Tecnologico (CNPq) grants number 443029/2014-8 and 204726/2014-0
University of Sao Paulo
Environmental Agency of Sao Paulo (CETESB)
National Center of Atmospheric Research (NCAR)
Thank you!