Embed Size (px)
Citation preview
Urban accessibility – methodology and classification
Crown copyright © See Copyright and terms of use for our copyright, attribution, and liability statements.
Citation Stats NZ (2020). Urban accessibility – methodology and classification. Retrieved from www.stats.govt.nz.
ISBN 978-1-99-003215-8
Published in September 2020 by Stats NZ Tatauranga Aotearoa Wellington, New Zealand
Contact Stats NZ Information Centre: [email protected] Phone toll-free 0508 525 525 Phone international +64 4 931 4600
www.stats.govt.nz

Urban accessibility – methodology and classification
3
Contents Purpose ............................................................................................................... 5
Methodology ......................................................................................................................... 5
Key words ............................................................................................................................... 5
Rurality concepts ................................................................................................... 7
Degrees of rurality ................................................................................................................. 7
Methodology ...................................................................................................... 11
Measuring geographic accessibility ..................................................................................... 11
Constructing the UA classification ....................................................................................... 12
Urban–rural typology ........................................................................................................... 14
Limitations ......................................................................................................... 17
Usage ................................................................................................................................... 17
Methodological limitations .................................................................................................. 17
Anomalies ............................................................................................................................ 17
Maintenance ...................................................................................................... 19
Results .............................................................................................................. 20
References ......................................................................................................... 23
Acknowledgements ............................................................................................. 24
Open Source Routing Machine ............................................................................................ 24
OpenStreetMap ................................................................................................................... 24
Appendix 1. Urban rural classification ..................................................................... 25
Appendix 2. Comparison of urban rural classifications ................................................ 26
Urban accessibility – methodology and classification
4
List of tables and figures
List of tables 1 Urban accessibility categories based on drive time ........................................................................... 13 2 Urban accessibility classification ........................................................................................................ 16
List of figures 1 New Zealand’s urban rural continuum ................................................................................................ 8 2 Urban accessibility typology .............................................................................................................. 15 3 Urban accessibility classification, example of non-contiguous area ................................................. 18 4 Urban accessibility by SA1, New Zealand .......................................................................................... 21 5 Urban accessibility by SA1, Auckland and Hamilton .......................................................................... 22

Urban accessibility – methodology and classification
5
Purpose Urban accessibility methodology and classification describes the methodology used to create the urban accessibility (UA) classification. The UA classification measures the degree of urban influence (UI) New Zealand’s urban areas have on surrounding rural areas.
The purpose of the UA classification is to classify rural areas and small urban areas according to their proximity, or degree of remoteness, to larger urban areas, using an approach that:
• is realistic
• is consistent
• has transferability to a range of users
• produces results that can be understood and applied by users
• is easily maintained.
The UA classification provides a consistent measure of urban accessibility for statistical area 1s (SA1s). This approach distinguishes the degrees of rurality in New Zealand and enhances understanding of the differences across rural areas.
Methodology We used drive time to categorise the degree of urban accessibility or rural remoteness at SA1 level. The open-source router designed for use with data from the OpenStreetMap project is used to calculate drive time (duration) from an SA1 address-weighted centroid to the nearest medium, large, or major urban area. We then categorised SA1s on a scale from high urban accessibility to very remote based on the drive time to their closest major, large, and medium1 urban areas.
Key words Urban accessibility; degrees of rurality; level of remoteness
1 As defined in the urban rural classification described in Appendix 1.
Urban accessibility – methodology and classification
6
Background The Statistical standard for geographic areas 2018 (SSGA18) replaced the New Zealand Standard Areas Classification 1992. It is Stats NZ’s official standard for statistical geographic areas in New Zealand. It allows statistical units, such as households, people, or businesses, to be assigned to the location where they live, work, and operate.
SSGA18 includes the urban rural 2018 (UR2018) classification which replaces the urban area geography used until 2017. In UR2018, urban areas represent the urban form or ‘footprint’, that is, areas of high population, building density, and urban features. The urban rural indicator categorises the urban areas based on population size from major to small urban areas. Rural areas are defined as those areas that are not urban.
In 2004, we published the Urban/rural (experimental) profile (UREP), which explored the diversity of social and economic characteristics of people in all areas of the urban-rural spectrum. Understanding the degree of urban accessibility or remoteness is important as it has a major influence on the employment sector, accessibility to services, and population composition and change.
As part of SSGA18, we reviewed the concepts and methodology used to create the UREP and have developed the following two new classifications, grouped under the term urban influence (UI).
1. Urban accessibility (UA) classification – distinguishes rural areas based on their degree of accessibility to urban areas. The creation of this classification is discussed in this paper.
2. Functional urban area (FUA) classification – delineates an urban core and its commuting zone. A draft was completed based on 2013 Census of Population and Dwellings data. The FUA will be updated using 2018 Census data and published in late 2020.
The two classifications will provide increased understanding of the heterogeneity of rural areas and small urban areas and allow more extensive analysis and reporting. They are consistent with the SSGA18 and international best practice.
This paper discusses urban rural concepts and describes the UA methodology and classification. Limitations are also discussed. The classification is illustrated by maps of New Zealand and the Auckland/Hamilton area.
You can download, view, and query the UA classification geospatial layer on the Stats NZ Geographic Data Service. The UA classification and concordance to the UR classification is available to view and download in Stats NZ’s classification system, Ariā.
We shared a draft of the UA with stakeholders in late 2019. We thank them for their feedback and have made refinements to the UA to improve the classification and accommodate stakeholder requests.

Urban accessibility – methodology and classification
7
Rurality concepts
Degrees of rurality Users are interested in delineating degrees of rurality, and, as Dijkstra and Ruiz (2010) found, there are clear differences in the level of productivity, unemployment rate, age, and population decline or growth, between remote rural areas and rural areas close to a city.
Degrees of rurality can be distinguished by using a range of concepts such as population sparsity, accessibility, and interconnectedness measured through concepts such as distance and driveability.
Population sparsity Population sparsity is used to measure the context in which settlements are located, acting as a proxy for the economic mass of an area. This approach was used by the United Kingdom’s Office of National Statistics (ONS) which produced sound results to support the use of social and economic statistics, given the density of settlements and population (Bibby & Brindley, 2013).
Commuting patterns The linkages between areas are commonly measured using census commuting levels, based on numbers of people travelling daily between their usual residence and their place of work. This information delineates realised connections between an urban area and its hinterland. The connections are assumed to represent not only employment locations, but often areas of commercial activity and service use. Rural areas that have high levels of commuting are considered to have high degrees of urban influence, and areas of low commuting are classed as being more remote.
Understanding linkages between urban areas and their peri-urban hinterland is an important concept. This concept, termed ‘functional urban area’ (FUA) by the Organisation for Economic Co-operation and Development (OECD), is a measure of interest used to delineate and understand areas that are predominantly urban in function. According to the OECD:
A functional urban area consists of a city and its commuting zone. Functional urban areas therefore consist of a densely inhabited city and a less densely populated commuting zone whose labour market is highly integrated with the city (OECD, 2012).
FUAs can be used as a proxy for determining socially and economically integrated areas based on the linkages between where people live and where they work, and subsequently where they learn, trade, and access facilities and services. FUAs can also be used to understand linkages among and between urban areas and their hinterlands to improve strategic planning, support urban development, and better understand transportation needs.
FUAs based on 2018 Census of Population and Dwellings’ travel-to-work data will be published in late 2020.
Urban accessibility – methodology and classification
8
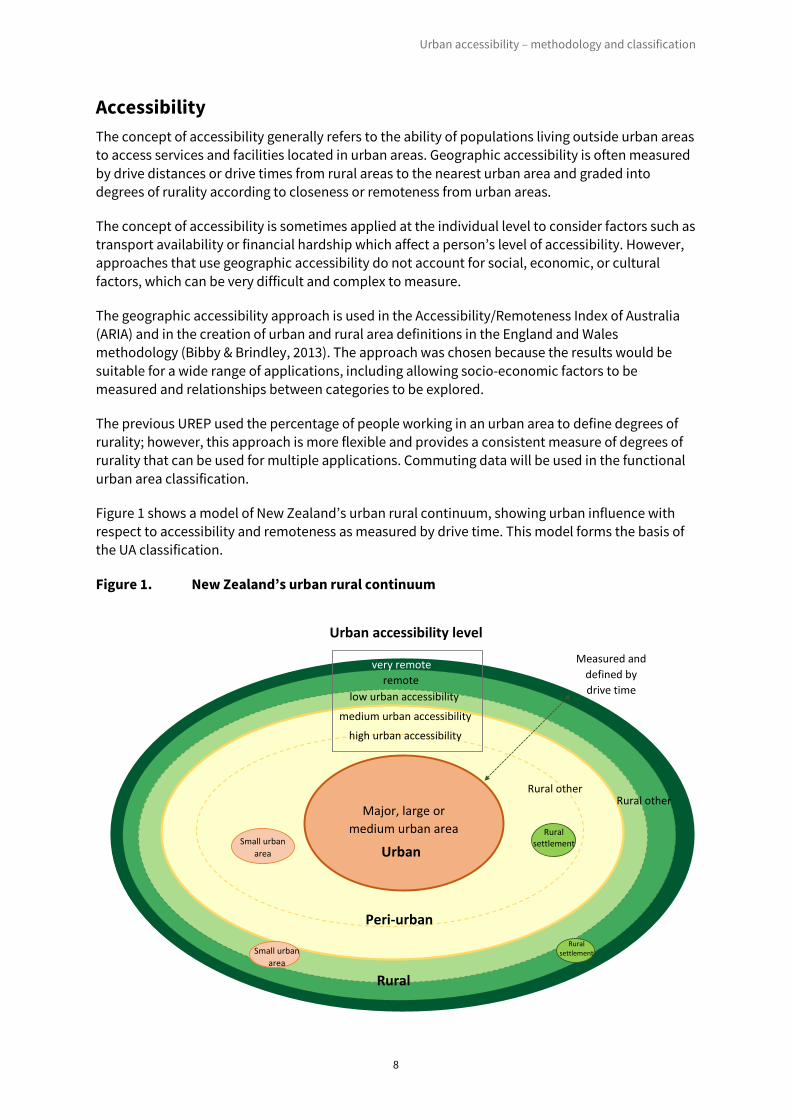
Accessibility The concept of accessibility generally refers to the ability of populations living outside urban areas to access services and facilities located in urban areas. Geographic accessibility is often measured by drive distances or drive times from rural areas to the nearest urban area and graded into degrees of rurality according to closeness or remoteness from urban areas.
The concept of accessibility is sometimes applied at the individual level to consider factors such as transport availability or financial hardship which affect a person’s level of accessibility. However, approaches that use geographic accessibility do not account for social, economic, or cultural factors, which can be very difficult and complex to measure.
The geographic accessibility approach is used in the Accessibility/Remoteness Index of Australia (ARIA) and in the creation of urban and rural area definitions in the England and Wales methodology (Bibby & Brindley, 2013). The approach was chosen because the results would be suitable for a wide range of applications, including allowing socio-economic factors to be measured and relationships between categories to be explored.
The previous UREP used the percentage of people working in an urban area to define degrees of rurality; however, this approach is more flexible and provides a consistent measure of degrees of rurality that can be used for multiple applications. Commuting data will be used in the functional urban area classification.
Figure 1 shows a model of New Zealand’s urban rural continuum, showing urban influence with respect to accessibility and remoteness as measured by drive time. This model forms the basis of the UA classification.
Figure 1. New Zealand’s urban rural continuum
1 New Zealand’s urban rural continuum
remote low urban accessibility
Major, large or medium urban area
medium urban accessibility
very remote
Rural
settlement
Measured and defined by drive time
Urban
high urban accessibility
Rural settlement
Small urban area
Small urban area
Rural other Rural other
Rural
Peri-urban
Urban accessibility level
Urban accessibility – methodology and classification
9
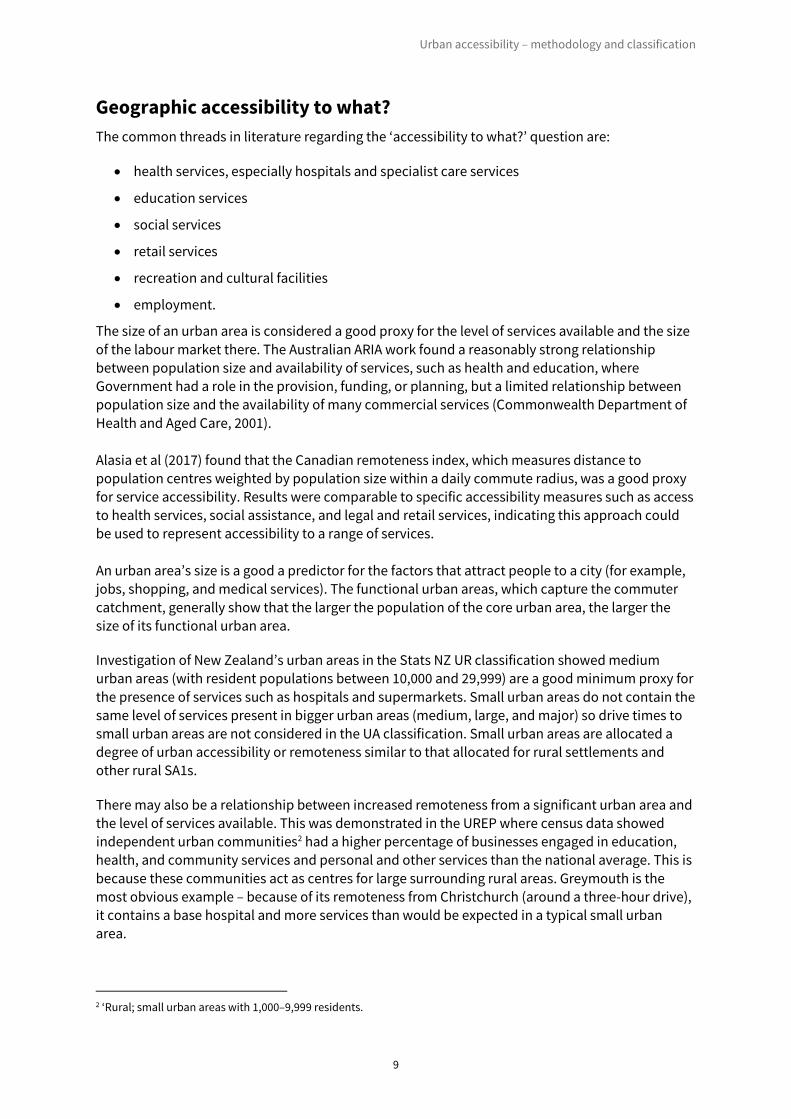
Geographic accessibility to what? The common threads in literature regarding the ‘accessibility to what?’ question are:
• health services, especially hospitals and specialist care services
• education services
• social services
• retail services
• recreation and cultural facilities
• employment.
The size of an urban area is considered a good proxy for the level of services available and the size of the labour market there. The Australian ARIA work found a reasonably strong relationship between population size and availability of services, such as health and education, where Government had a role in the provision, funding, or planning, but a limited relationship between population size and the availability of many commercial services (Commonwealth Department of Health and Aged Care, 2001).
Alasia et al (2017) found that the Canadian remoteness index, which measures distance to population centres weighted by population size within a daily commute radius, was a good proxy for service accessibility. Results were comparable to specific accessibility measures such as access to health services, social assistance, and legal and retail services, indicating this approach could be used to represent accessibility to a range of services.
An urban area’s size is a good a predictor for the factors that attract people to a city (for example, jobs, shopping, and medical services). The functional urban areas, which capture the commuter catchment, generally show that the larger the population of the core urban area, the larger the size of its functional urban area.
Investigation of New Zealand’s urban areas in the Stats NZ UR classification showed medium urban areas (with resident populations between 10,000 and 29,999) are a good minimum proxy for the presence of services such as hospitals and supermarkets. Small urban areas do not contain the same level of services present in bigger urban areas (medium, large, and major) so drive times to small urban areas are not considered in the UA classification. Small urban areas are allocated a degree of urban accessibility or remoteness similar to that allocated for rural settlements and other rural SA1s.
There may also be a relationship between increased remoteness from a significant urban area and the level of services available. This was demonstrated in the UREP where census data showed independent urban communities2 had a higher percentage of businesses engaged in education, health, and community services and personal and other services than the national average. This is because these communities act as centres for large surrounding rural areas. Greymouth is the most obvious example – because of its remoteness from Christchurch (around a three-hour drive), it contains a base hospital and more services than would be expected in a typical small urban area.
2 ‘Rural; small urban areas with 1,000–9,999 residents.
Urban accessibility – methodology and classification
10
Measuring geographic accessibility Many methods are used to measure geographic accessibility. A review of the literature found there is no ‘one size fits all’ approach. Instead, it is need, data, software availability, and local geographic and population patterns that influence choice of methodology.
Distance or drive time by road are commonly used to measure accessibility between location A and location B. Travel costs are included in some cases (Alasia et al, 2017), for example, in Canada where unique challenges are faced in areas accessible only by air. These methods provide a consistent measure of potential accessibility based on proximity, and whether the data used is readily available and the methodologies are widely used. They are also relatively stable over time.
When testing methodologies, Alasia et al (2017) found that drive distance and drive time both provide reasonable proxies for proximity. However, where there were different road conditions or modes of transport, drive time was a more accurate measure.
Urban accessibility – methodology and classification
11
Methodology
Measuring geographic accessibility The aim was to keep the methodology as simple and easy to maintain as possible while attaining adequate accuracy and consistency. Based on the literature review, previous thinking around the urban influence classification, and brief exploration of the data, methodologies using distance by road or drive time by road appeared to be suitable for assessing degrees of urban accessibility. We had the required tools – road network and routing data, population data, and statistical geographies for urban areas and rural SA1s – to create the new geographic classification.
We assessed road distances using the open source routing machine (OSRM) service. OSRM road distances were compared with Google Maps roads to assess whether variations in average speed, and therefore drive time, exist for different routes of a similar road distance to a particular destination point. Findings confirmed the limitations of road distance as a sole variable because there were significant variations in time taken. For example, average speeds over a state highway were almost 20km an hour faster than speeds over winding remote roads to reach the same destination.
We concluded that drive times produced more accurate measures of accessibility given the variety of topography, road conditions, and assigned road speeds in New Zealand.
The additional work to calculate travel cost using different travel modes was ruled out because only a few populated parts of New Zealand cannot be reached by car. Some exceptions, including Waiheke Island and Stewart Island, are discussed later in this paper.
We did not account for multi-mode/public transport due to the limited availability of public transport in Zealand’s rural areas and the increased complexity of adding the variable. This could be considered for future iterations of the classification if public transport to rural areas becomes widespread.
Degrees of urban accessibility can be presented using a graduated index or discrete classes. Both approaches have advantages and disadvantages. An index creates a continuous measure and often shows a graduation from an area of high urban accessibility out to the remotest rural areas. It also provides a measure of relative accessibility between areas without causing possible subjectivity when cut-off points for discrete classes are chosen. However, an index approach is less suitable for analysing and presenting demographic and other data variables. An index number may appear more precise than the methodology and data allows, given the variability in SA1 geographic areas and open-source derived drive times.
We used a single measure of accessibility categorised into discrete classes. We felt that the index approach adds complexity and provides results that are difficult to explain and interpret. Apart from being commonly requested by users, discrete classes allow ad hoc adjustments when data provides unexpected or inconsistent results.

Urban accessibility – methodology and classification
12
Constructing the UA classification
Building block The UA classification is applied at SA1 level. The SA1 classification was created in 2018 as a new geography to be used for releasing low-level census data. SA1s contain one or more meshblocks and have usually resident populations of 100–200 people. They are small enough to allow sufficient granularity to measure differences in urban accessibility and allow for statistical outputs. Larger geographies, for example SA2, especially in rural areas, would not provide enough delineation between areas.
Road network and routing engine The OSRM routing service was used to calculate drive times from the SA1s to urban areas. OSRM was selected because it is freely available, is ready to use with minor changes, and provides fast computation. A comparison with Google Maps drive times, supported by our local knowledge, gave similar results. Durations were calculated and extracted from the routing service on 21 August 2019.
The OSRM uses the OpenStreetMap road network, which is open data that is widely used, is well maintained, and is freely available. This dataset incorporates updates from both LINZ and open source users. Investigation of the road network showed good coverage and alignment with the reality of what is on the ground.
Origin point The address-weighted centroid3 for each SA1 was calculated to represent the average location of residents and was used as the origin in the routing calculation. This address-weighted centroid gives a more accurate representative location than the geographic centroid, particularly in larger rural SA1s where the population is clustered in a small part of the SA1. LINZ addresses, extracted on Census day (6 March 2018), were used to calculate the address-weighted centroids. The OSRM was used to connect the address-weighted centroid to the nearest section of the road network.
Destination Points created at the intersection of the outside boundary of UR2018 medium, large, and major urban areas and the road network were used as the destination points for each route. We considered using a centroid or representative point for each urban area, but that was too presumptive of what services are going to be accessed or where business and employment sites are located. Using urban area centroids would have resulted in dramatically different urban accessibility measures for rural areas surrounding large sprawling cities such as Auckland, compared to more compact cities like Tauranga.
3 Identifies the centre of concentration of a set of addresses.

Urban accessibility – methodology and classification
13
Categories of urban accessibility We created five categories using drive time to the closest major, large, or medium areas, as shown in table 1. These five categories provided adequate distinction given the physical geography of New Zealand and the degree to which rural areas could be sensibly distinguished.
Table 1. Urban accessibility categories based on drive time 1 Urban accessibility categories based on drive time
We chose drive times based on the extent of the 2013 draft FUAs as a proxy for the labour market and extent of the urban pull factor4, and the resulting pattern of the data. The peri-urban boundaries, which include high and medium urban accessibility SA1s, are similar to, but not exactly coincident with, the FUA boundaries. FUAs are delineated by actual census commuting data, whereas high and medium urban accessibility is delineated by potential drive times.
Major urban areas generally indicate the presence of universities, more comprehensive health facilities, and a larger labour market. Therefore, major urban areas were considered to provide the highest level of urban accessibility and have the most significant urban pull. They were the only urban areas to provide a high degree of urban accessibility to surrounding rural areas.
Drive times of 60–120 minutes were categorised as being remote. The 60-minute threshold is often used in emergency medicine and is referred to as the ‘golden hour’ for medical or surgical treatment, beyond which survival rates are reduced. The number of people actually commuting to an urban area is also very low beyond 60 minutes’ drive time. We added the category ‘very remote’ for rural areas that are more than two hours’ drive from a major, large, or medium urban area, to differentiate isolated areas like the South Island’s West Coast and Fiordland, and the top of the North Island.
We treated Greymouth, which in UR2018 is classified as a small urban area, like a medium urban area. Its remoteness and the levels of services it contains (including a base hospital) are more typical of those found in a medium urban area.
When an SA1 centroid fell within the duration thresholds for multiple urban areas, the higher urban accessibility category was assigned. For example, an SA1 centroid that is five minutes from a medium urban area and 10 minutes from a major urban area was assigned to the high urban accessibility class.
4 Factors that attract people to urban areas.
Category Duration High urban accessibility • 0 to 15 minutes from major urban areas Medium urban accessibility
• 15 to 25 minutes from major urban areas • 0 to 25 minutes from large urban areas • 0 to 15 minutes from medium urban areas
Low urban accessibility • 25 to 60 minutes from major urban areas • 25 to 60 minutes from large urban areas • 15 to 60 minutes from medium urban areas
Remote • 60 to 120 minutes from major, large, or medium urban areas Very remote • more than 120 minutes from major, large, or medium urban areas

Urban accessibility – methodology and classification
14
Small urban areas and rural settlements are assigned to a single urban accessibility category. When SA1s within small urban areas or rural settlements had multiple urban accessibility categories, the whole urban area or rural settlement was assigned to the accessibility category of the majority of the SA1s in, or geographic area of, that urban area/settlement.
SA1s that did not contain any addresses were assigned a category based on the majority of their neighbouring SA1s. Categories for a small number of SA1s were adjusted manually to remove ‘lonely’ (outlier) SA1s within a larger area of the same class.
SA1 nearshore islands within swimmable or kayaking distance of the mainland were classified as remote, and islands only accessible by boat were classified as very remote. Nearshore islands that are part of a mainland SA1 have the same classification as their mainland area.
The western more populated part of Waiheke Island and the rural settlement of Oban at Stewart Island were classified as having low urban accessibility, as they can be reached within 60 minutes by regularly scheduled flights and ferries.
Urban–rural typology The typology for the UA classification is shown in figure 2. The urban rural (UR) classification’s urban areas, rural settlements, and other rural SA1s are grouped according to their degree of accessibility or remoteness.
For the UA classification, only major, large, and medium urban areas contained the level of services and labour market size used to create the level of urban accessibility experienced by surrounding areas. Therefore, this typology classifies these areas as urban (UA)5.
The category peri-urban (UA) was created for small urban areas, rural settlements, and other rural areas close to major, large, and medium urban areas that have a high or medium urban accessibility. The peri-urban areas do not fit neatly in a strictly urban or rural class and exhibit different population characteristics from other rural areas. As noted above, the peri-urban boundaries roughly coincide with the FUA rural hinterland boundaries.
The ‘rural (UA)’ category contains small urban areas, rural settlements, and other rural areas that are located further away from urban areas, are considered to have low urban accessibility, or are classified as remote or very remote.
5 UA in brackets is used to distinguish UA urban and rural areas from UR urban and rural areas.

Urban accessibility – methodology and classification
15
Figure 2. Urban accessibility typology
2 Urban accessibility typology
Urban accessibility – methodology and classification
16
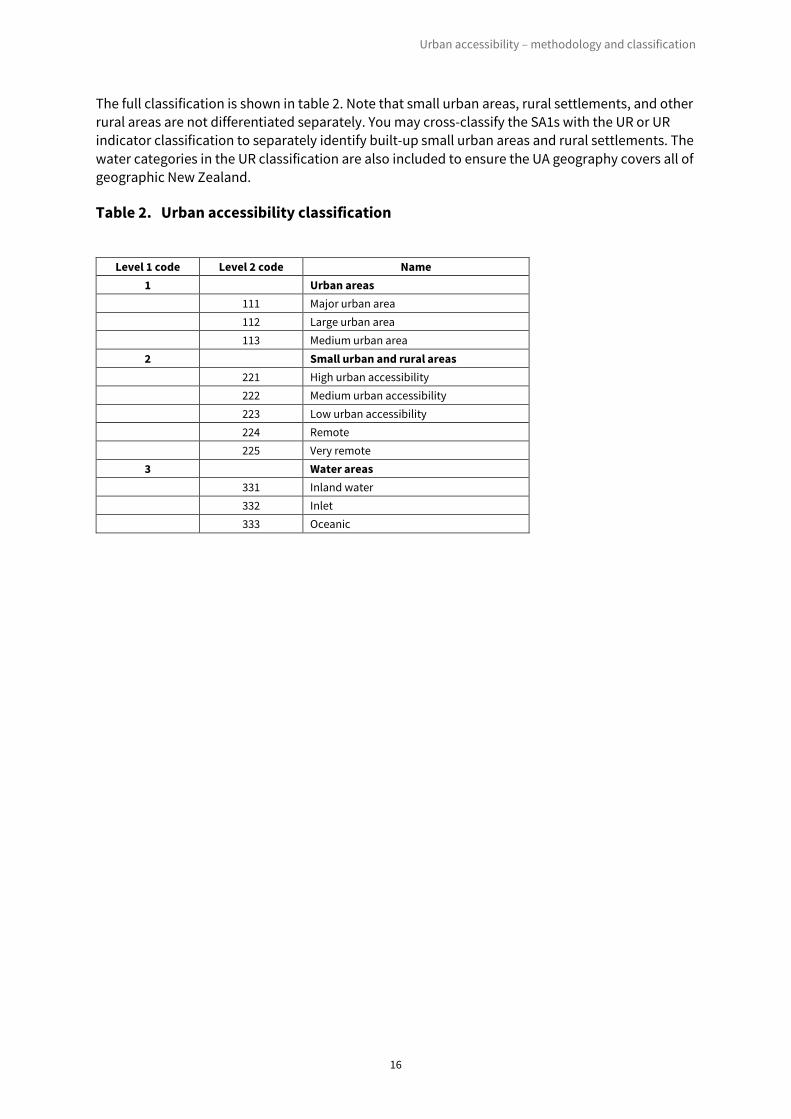
The full classification is shown in table 2. Note that small urban areas, rural settlements, and other rural areas are not differentiated separately. You may cross-classify the SA1s with the UR or UR indicator classification to separately identify built-up small urban areas and rural settlements. The water categories in the UR classification are also included to ensure the UA geography covers all of geographic New Zealand.
Table 2. Urban accessibility classification 2 Urban accessibility classification
Level 1 code Level 2 code Name 1 Urban areas 111 Major urban area 112 Large urban area 113 Medium urban area
2 Small urban and rural areas 221 High urban accessibility 222 Medium urban accessibility 223 Low urban accessibility 224 Remote 225 Very remote
3 Water areas 331 Inland water 332 Inlet 333 Oceanic

Urban accessibility – methodology and classification
17
Limitations
Usage The UA classification measures geographic accessibility based on drive time. It measures potential accessibility, rather than actual interactions of residents in an SA1 with their neighbouring urban area/s. The classification does not measure a person’s accessibility as this would need to account for many factors such as transport availability and financial hardship.
Methodological limitations The UA rating for each SA1 is an average for the area, and not all addresses in the SA1 will fall within the duration time for the assigned rating. Some SA1s in rural areas contain two population (address) concentrations, for example, a small group of houses close to an urban area and a larger group further away. In this case, the whole SA1 is assigned a UA rating based on the concentration of population represented by the weighting centroid of all the addresses. Some areas such as South Wairarapa have fewer remote areas given its topography and its large forested areas, due to most of the SA1 being located closer to the urban area with forestland further out. The shape and geographic size of SA1 areas also influence results. Categories assigned to geographically large SA1s with small populations may be less representative than categories assigned to geographically small SA1s, because of the longer distance/travel time across the respective SA1s.
If there are any significant gaps in address data, the accuracy of the address-weighted centroid will be affected. Large institutions that have many residents but are represented by a single address or a small number of addresses will have little influence on the address-weighted centroid location. Only the addresses, not the population data, are used in the methodology.
The methodology only considers drive time by car, not any other modes of travel such as rail or ferry except for those to Waiheke Island and Oban, Stewart Island as mentioned in Categories of urban accessibility.
Calculated durations are based on the OpenStreetMap road network data and routing methodology. The completeness and accuracy of the roading data will be reflected in the results.
Anomalies Some SA1s were assigned a different urban accessibility class than their surrounding SA1s, appearing as islands. While this may appear unusual, it is a result of the drive time from the respective SA1 address-weighted centroid being closer to the nearest urban area than those of surrounding SA1s, and therefore it is accurate to leave these as they are. Figure 3 illustrates this anomaly.

Urban accessibility – methodology and classification
18
Figure 3. Urban accessibility classification, example of non-contiguous area
3 Urban accessibility classification, example of non-contiguous area
A small number of anomalies in the drive time calculations required manual intervention. Some SA1s had markedly inflated drive times when compared with their travel distances (some showing a duration more than double their distance). We examined a number of these using Google Maps’ drive times and our own local knowledge for comparison, which indicated that the durations were too high.
To minimise the effect of these anomalies, we averaged the duration and distance figures and used these as the basis to classify the relevant SA1s. An example is Stirling in South Otago, which we changed from remote to low urban accessibility. The routing service had obviously used the route from Dunedin to Stirling via Balclutha on State Highway 1 to calculate a drive time of more than 60 minutes. Stirling can be reached much more quickly, well within 60 minutes, using other secondary roads.
Urban accessibility – methodology and classification
19
Maintenance The methodology uses a mostly automated approach and so will be relatively straightforward to update and be a relatively stable classification. The UA classification will be maintained with minimal annual changes to SA1s and urban boundaries due to meshblock updates.
Along with other statistical geographies, we will review the UA classification every five years, before each census. SA1 and urban rural boundaries will change over time to reflect changes in population distribution and expansion of urban boundaries. SA1s may be divided to maintain the 100–200 population target size range. The road network and routing may change due to the addition of new motorways and road upgrades, resulting in reduced travelling times.

Urban accessibility – methodology and classification
20
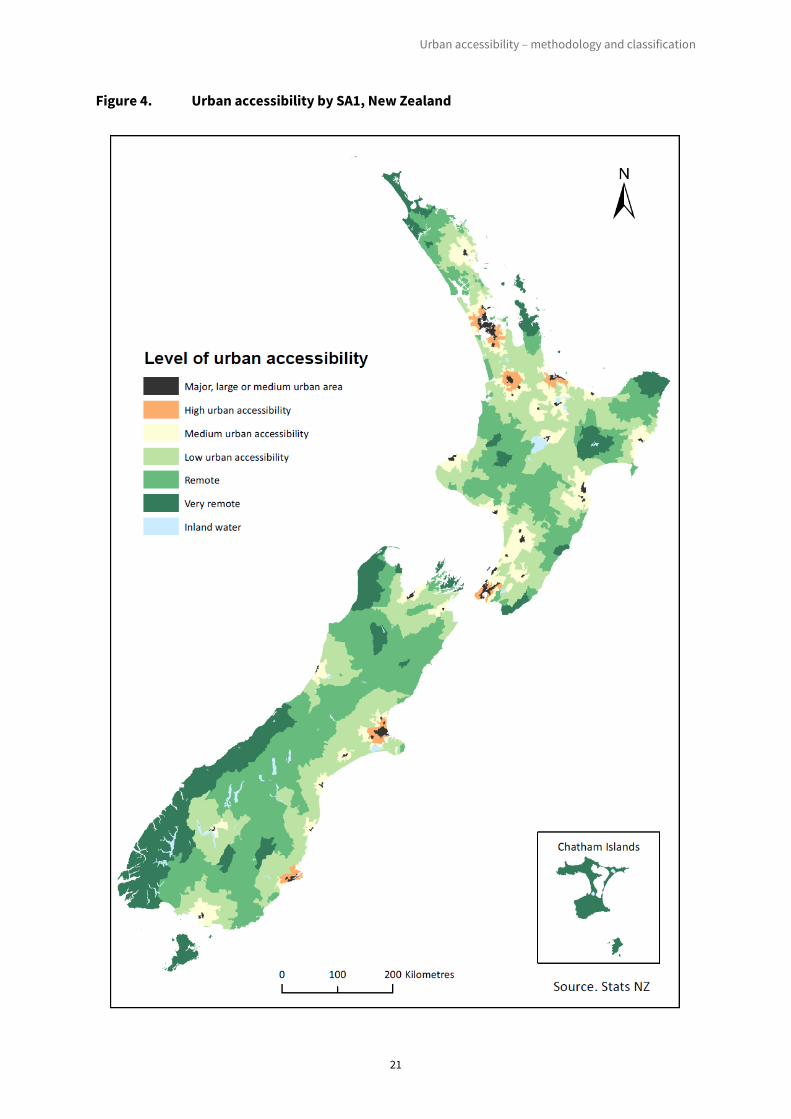
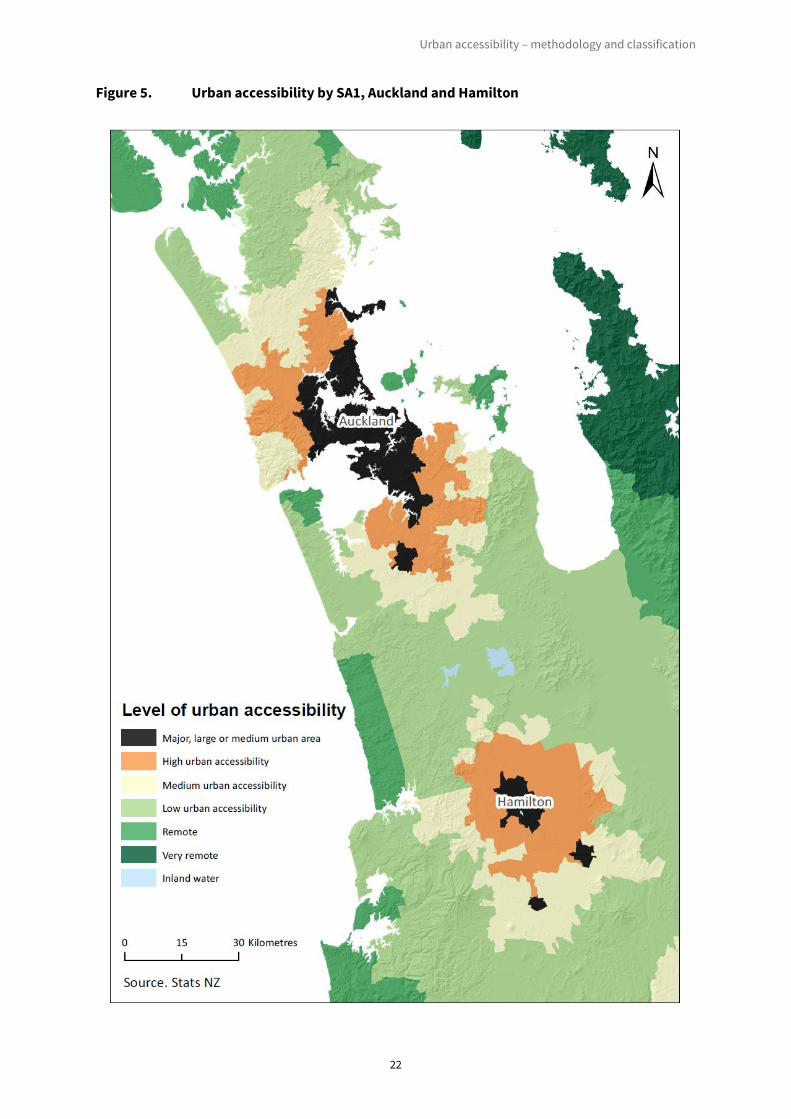
Results The 2018 UA classification for New Zealand is shown in figure 4. The general pattern shows the reducing levels of urban accessibility radiating out from each medium, large, and major urban area. Results align with locations that people intuitively consider to be urban or remote. Most of New Zealand’s geographic areas have been classed as remote or having low urban accessibility, except for the six major urban areas and surrounding peri-urban areas. Figure 5 shows urban accessibility in the Auckland and Hamilton areas.
The geospatial layer can be downloaded, viewed, and queried on the Stats NZ Geographic Data Service. The classification of SA1s to UA categories, and concordance to the UR classification is available to view and download in Stats NZ classification system, Ariā.
Urban accessibility – methodology and classification
21
Figure 4. Urban accessibility by SA1, New Zealand 4 Urban accessibility by SA1, New Zealand
Urban accessibility – methodology and classification
22
Figure 5. Urban accessibility by SA1, Auckland and Hamilton
5 Urban accessibility by SA1, Auckland and Hamilton
Urban accessibility – methodology and classification
23
References Alasia, A, Bédard, F, Bélanger, J, Guimond, E, & Penney, C (2017). Measuring remoteness and accessibility – A set of indices for Canadian communities. Retrieved from www.statcan.gc.ca.
Bibby, P, & Brindley, P (2013). Urban and rural area definitions for policy purposes in England and Wales: methodology (v1.0). Retrieved from https://geoportal.statistics.gov.uk.
Commonwealth Department of Health and Aged Care (CDHAC) (2001). Measuring Remoteness: Accessibility/Remoteness Index of Australia (ARIA) Revised Edition. Retrieved from www1.health.gov.au.
Dijkstra, L, & Ruiz, V (2010). Refinement of the OECD regional typology: Economic Performance of Remote Rural Regions. DG Regio, European Commission.
OECD (2012). Redefining urban: a new way to measure metropolitan areas. Retrieved from www.oecd-ilibrary.org.

Urban accessibility – methodology and classification
24
Acknowledgements
Open Source Routing Machine © OSRM is free, open source, and available under the very permissive (simplified) 2-clause BSD license.
OpenStreetMap
OpenStreetMap® is open data, licensed under the Open Data Commons Open Database License (ODbL) by the OpenStreetMap Foundation (OSMF). Please refer to openstreetmap.org and opendatacommons.org. The New Zealand dataset contains data sourced from the LINZ Data Service and licensed for reuse under CC BY 4.0.

Urban accessibility – methodology and classification
25
Appendix 1. Urban rural classification The urban rural geography classifies New Zealand into areas that share common urban or rural characteristics.
Urban areas Urban areas are statistically defined areas with no administrative or legal basis. They are characterised by high population density with many built environment features where people and buildings are located close together for residential, cultural, productive, trade, and social purposes. Urban areas are further classified by the size of their estimated resident population:
• major urban area – 100,000 or more residents • large urban area – 30,000–99,999 residents • medium urban area – 10,000–29,999 residents • small urban area – 1,000–9,999 residents.
Rural settlements A rural settlement is a cluster of residential dwellings about a place that usually contains at least one community or public building. Rural settlements contain an estimated resident population of 200–1,000, or at least 40 residential dwellings.
Rural other Rural other areas are the mainland areas and islands located outside urban areas or rural settlements. Rural other areas include land used for agriculture and forestry, conservation areas, and regional and national parks. They are defined by territorial authority.
Water Bodies of water are classified separately using the land/water demarcation classification described in the statistical standard for meshblock. These water areas are not named and are defined by territorial authority or regional council.
The water classes include:
• inland water – non-contiguous, defined by territorial authority • inlets (which also includes tidal areas and harbours) – non-contiguous, defined by
territorial authority • oceanic – non-contiguous, defined by regional council.
Refer to Statistical standard for geographic areas 2018 (SSGA18) for comprehensive criteria used for each urban rural category.
Urban accessibility – methodology and classification
26
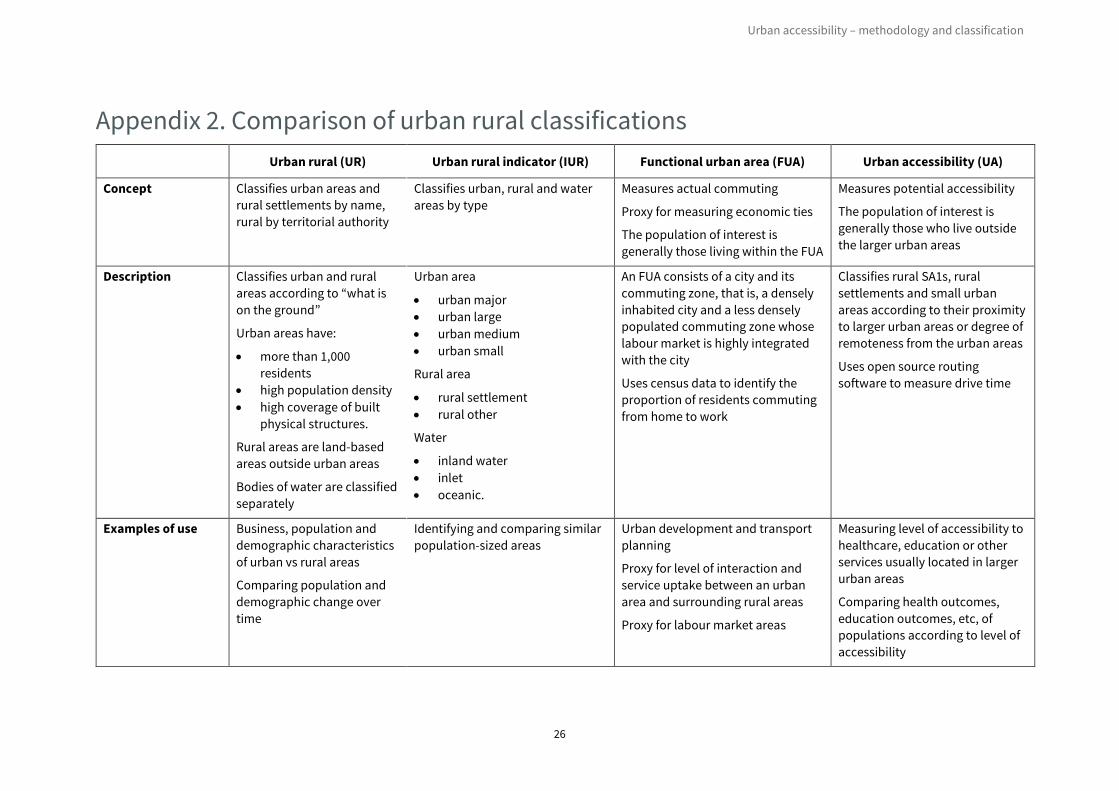
Appendix 2. Comparison of urban rural classifications Urban rural (UR) Urban rural indicator (IUR) Functional urban area (FUA) Urban accessibility (UA)
Concept Classifies urban areas and rural settlements by name, rural by territorial authority
Classifies urban, rural and water areas by type
Measures actual commuting
Proxy for measuring economic ties
The population of interest is generally those living within the FUA
Measures potential accessibility
The population of interest is generally those who live outside the larger urban areas
Description Classifies urban and rural areas according to “what is on the ground”
Urban areas have:
• more than 1,000 residents
• high population density • high coverage of built
physical structures.
Rural areas are land-based areas outside urban areas
Bodies of water are classified separately
Urban area
• urban major • urban large • urban medium • urban small
Rural area
• rural settlement • rural other
Water
• inland water • inlet • oceanic.
An FUA consists of a city and its commuting zone, that is, a densely inhabited city and a less densely populated commuting zone whose labour market is highly integrated with the city
Uses census data to identify the proportion of residents commuting from home to work
Classifies rural SA1s, rural settlements and small urban areas according to their proximity to larger urban areas or degree of remoteness from the urban areas
Uses open source routing software to measure drive time
Examples of use Business, population and demographic characteristics of urban vs rural areas
Comparing population and demographic change over time
Identifying and comparing similar population-sized areas
Urban development and transport planning
Proxy for level of interaction and service uptake between an urban area and surrounding rural areas
Proxy for labour market areas
Measuring level of accessibility to healthcare, education or other services usually located in larger urban areas
Comparing health outcomes, education outcomes, etc, of populations according to level of accessibility