Embed Size (px)
Citation preview
PNNL-25734
Uranium from Seawater Marine Testing Program at the University of Miami’s Broad Key Island Research Station
September 2016
Gary A Gill, Li-Jung Kuo, Jonathan Strivens, Jordana Wood and Nicholas Schlafer, Pacific Northwest National Laboratory, Marine Sciences Laboratory, Sequim, WA 98382
Evan D’Alessandro, University of Miami, Rosensteil School of Marine and Atmospheric Sciences, Miami, FL
PNNL-25734
Uranium from Seawater Marine Testing Program at the University of Miami’s Broad Key Island Research Station
Prepared for: U. S. Department of Energy, Office of Nuclear Energy, Fuel Cycle Research and Development Program, Fuel Resources Program
Prepared by: Gary A Gill, Li-Jung Kuo, Jonathan Strivens, Jordana Wood and Nicholas Schlafer, Pacific Northwest National Laboratory, Marine Sciences Laboratory Sequim, WA 98382
Evan D’Alessandro, University of Miami, Rosensteil School of Marine and Atmospheric Sciences, Miami, FL
Milestone Number: M3FT-16PN030201045 Work Package Number: FT-16PN03020104 Milestone Due Date: September 1, 2016 U. S. DOE-NE Program Manager: Dr. Stephen Kung Milestone Level: M3 PNNL ERICA Release Number:
Prepared for the U.S. Department of Energy under Contract DE-AC05-76RL01830
Pacific Northwest National Laboratory Richland, Washington 99352
iii | P a g e
Executive Summary
Marine testing at Broad Key Island (BKI), FL was conducted to validate adsorption capacity and adsorption kinetics results obtained for several formulations of the ORNL amidoxime-based polymeric adsorbents in Sequim Bay, WA in another location with different oceanographic and water quality conditions (e.g. temperature, dissolved organic carbon, salinity and trace element content). Broad Key is a small island off the southeast coast of Florida at the southern end of Biscayne Bay, approximately 30 miles south of Miami. The Rosensteil School of Marine and Atmospheric Sciences (RSMAS) of the University of Miami operates a research station on the island. Flow-through column and recirculating flume experiments were conducted at BKI using ambient filtered seawater and identical exposure systems as were used at the Pacific Northwest National Laboratory’s (PNNL) Marine Sciences laboratory (MSL). Testing was conducted in two periods in FY 2015 and FY 2016 with five different amidoxime-based adsorbent materials, four produced by ORNL (AF1, AI8, AF8, and AF1-DMSO) and one by LCW technologies (LCW-10). All exposures were conducted at ambient seawater temperatures, with moderate temperature control on the ambient seawater to mitigate large daily swings in the seawater temperature.
The ORNL adsorbents AF1, AI8 and AF1-AO-DMSO all had fairly similar adsorption capacities (6.0 to 6.6 g U/ kg adsorbent) after 56 days of exposure at ambient temperature (26 to 31 °C) and salinity (35.7 to 37.4), but the AF8 adsorbent was considerably lower at 4.4 g U/kg adsorbent. All the adsorbents tested at BKI had higher capacities than was observed at PNNL, with the higher temperatures likely a major factor contributing to this difference.
In general, the elemental distribution (expressed as a relative percentage) on all the adsorbents agreed well, including good agreement with the elemental distribution pattern for AF1 adsorbent exposed at PNNL. The most notable exception to a uniform elemental distributional pattern across the various adsorbents occurs with vanadium. The relative mass percentage for vanadium retained by the adsorbents ranged from a minimum of 13% for the AF8 formulation to a maximum of 29% for the AI8 formulation. Expressed in terms of a V/U mass ratio, it varies from a low of 1.2 for the AF8 adsorbent to a high of 2.7 for the AI8 adsorbent at BKI. All the V/U mass ratios at BKI are lower than observed for the AF1 adsorbent at PNNL (3.0). Temperature likely plays a significant role in the V/U mass ratio difference between BKI and PNNL. Because uranium has a higher adsorption capacity at higher temperatures, one would expect that warmer exposures would favor a lower V/U mass ratio, which could explain why the V/U mass ratio for the PNNL exposures are higher than observed for the BKI exposures.
Marine Testing at BKI offers the opportunity to test adsorbent performance under warmer ambient and more saline conditions than exist at the marine test site on Sequim Bay off the Washington coast. This is particularly important since the amidoxime-based adsorbents respond strongly to temperature; the higher the temperature the higher the uranium adsorption capacity. In addition, since salinities are about 15% higher at BKI compared to Sequim Bay (36 vs. 31),
PNNL-25734
iv | P a g e
uranium adsorption capacities are about 15% higher at the BKI site compared to Sequim Bay. Normalizing to a salinity of 35, however, allows for direct comparison at similar salinities.
PNNL-25734
v | P a g e
Acronyms and Abbreviations
BKI Broad Key Island (Florida)
DOE U.S. Department of Energy
DOE-NE U.S. Department of Energy, Office of Nuclear Energy
ICP-MS Inductively Coupled Plasma Mass Spectrometry
ICP-OES Inductively Coupled Plasma Optical Emission Spectrometry
MSL Marine Sciences Laboratory
NIST National Institute of Standards and Technology
ORNL Oak Ridge National Laboratory
OSLSM One-Site Ligand Saturation Modelling
PNNL Pacific Northwest National Laboratory
RSMAS Rosensteil School of Marine and Atmospheric Sciences (University of Miami)
PNNL-25734
vi | P a g e
Contents
Executive Summary .......................................................................................................................... iii Acronyms and Abbreviations ............................................................................................................. v 1.0 Background ................................................................................................................................. 1 2.0 Objective ..................................................................................................................................... 1 3.0 Experimental Approach .............................................................................................................. 1
3.1 Broad Key Island ................................................................................................................ 1 3.2 Ambient Seawater Exposure System ................................................................................. 3 3.3 Water Quality, Temperature and Flow-rate Monitoring .................................................... 4 3.4 Marine Testing ................................................................................................................... 5 3.5 Ambient Seawater Deployments ........................................................................................ 5 3.6 Analytical Methods ............................................................................................................ 6
3.6.1 Determination of Uranium and Trace Elements on Adsorbent Materials ............... 6 3.6.2 Determination of Uranium and Other Elements in Seawater .................................. 7
3.7 One-Site Ligand Saturation Modeling ............................................................................... 7 4.0 Results ........................................................................................................................................ 8
4.1 Water Quality ..................................................................................................................... 8 4.2 Trace Elements in Seawater ............................................................................................... 9 4.3 Flow-Through Column Experiment with the ORNL AF1 adsorbent ............................... 12 4.4 Recirculating Flume Experiment with the ORNL AF1 Adsorbent .................................. 13 4.5 Recirculating Flume Experiment with the ORNL AI8 Adsorbent ................................... 14 4.6 Recirculating Flume Experiment with the ORNL AF8 Adsorbent .................................. 15 4.7 Ambient Seawater Deployments off the BKI Dock with the ORNL AI8 and AF8
adsorbents ......................................................................................................................... 16 4.8 Flow-Through Column Exposure with the LCW-10MSL Adsorbent .............................. 17 4.9 Recirculating Flume and Ambient Seawater Exposures with the ORNL AF1-AO-
DMSO adsorbent .............................................................................................................. 18 5.0 Discussion ................................................................................................................................. 20
5.1 Comparison of Adsorption Capacities for Flume Experiments ....................................... 20 5.2 Elemental Composition on ORNL Adsorbents at BKI .................................................... 21
5.2.1 Vanadium .............................................................................................................. 22 5.3 Assessment of biofouling Impacts on adsorption capacity with the ORNL adsorbent
AF1-AO-DMSO ............................................................................................................... 24 6.0 Summary and Conclusions ....................................................................................................... 25 7.0 References ................................................................................................................................ 25 8.0 Appendix .................................................................................................................................. 27
PNNL-25734
vii | P a g e
Figures
Figure 1. Location of Broad Key Island at the Southern End of Biscayne Bay off the Southeast Coast of Florida. ......................................................................................................................... 2
Figure 2. Aerial Photograph of Broad Key Island. ............................................................................ 2 Figure 3. Small shed on Broad Key Island used to house the ambient seawater exposure system
for marine testing. ....................................................................................................................... 3 Figure 4. Recirculating flume (left) and flow-through column exposure system (right) used for
marine testing at the University of Miami’s Broad Key Island Research Facility. The flume is encased in insulation to help regulate temperature in the flume. ............................................ 4
Figure 5. Mini braids deployed in a plastic cage off the dock at Broad Key Island. ......................... 6 Figure 6. Hourly determinations of temperature, salinity, and pH collected from the seawater
exposure system for the 4th experimental period (6-3-2016 to 8-13-2016) at Broad Key Island. ........................................................................................................................................ 10
Figure 7. Trace Elements in seawater at Broad Key Island for 3 different sampling periods. Also shown for comparison is trace element concentrations for Sequim Bay (PNNL). ................... 11
Figure 8. Vanadium concentrations in ambient seawater at Broad Key Island for three experimental time periods compared to average concentrations in Sequim Bay (PNNL). Date were normalized to a salinity of 35 psu. ........................................................................... 11
Figure 9. Time series measurements of uranium and selected trace elements (V, Cu, Fe, and Zn) adsorption capacity for the ORNL AF1 adsorbent determined using flow-through column testing at ambient temperature (25.9 °C) and ambient salinity (37.4). ..................................... 12
Figure 10. Broad Key Island Flume Experiment with ORNL AF1 Adsorbent. Data represent adsorption capacities at ambient temperature and ambient salinity. ......................................... 13
Figure 11. Broad Key Island recirculating flume experiment with the ORNL adsorbent AI8. Data and modelling represent exposures at ambient temperature and salinity. ........................ 14
Figure 12. Broad Key Island recirculating flume experiment with the ORNL adsorbent AF8. Data and modelling represent exposures at ambient temperature and ambient salinity. .......... 15
Figure 13. Ambient seawater deployment off the Broad Key Island Dock with the ORNL AI8 and AF8 adsorbent. Data are normalized to a salinity of 35. ................................................... 16
Figure 14. Flow-through column experiment with the adsorbent LCW-10MSL at Broad Key Island at ambient temperature and salinity. .............................................................................. 18
Figure 15. Broad Key Island Recirculating Flume Experiment with the ORNL adsorbent AF1-AO-DMSO. Data represent adsorption capacities at ambient temperature and salinity. ......... 19
Figure 16. Ambient seawater exposure off the dock at Broad Key Island using mini braids cut from the ORNL adsorbent AF1-AO-DMSO. Data represent exposure at ambient temperature and salinity. ........................................................................................................... 19
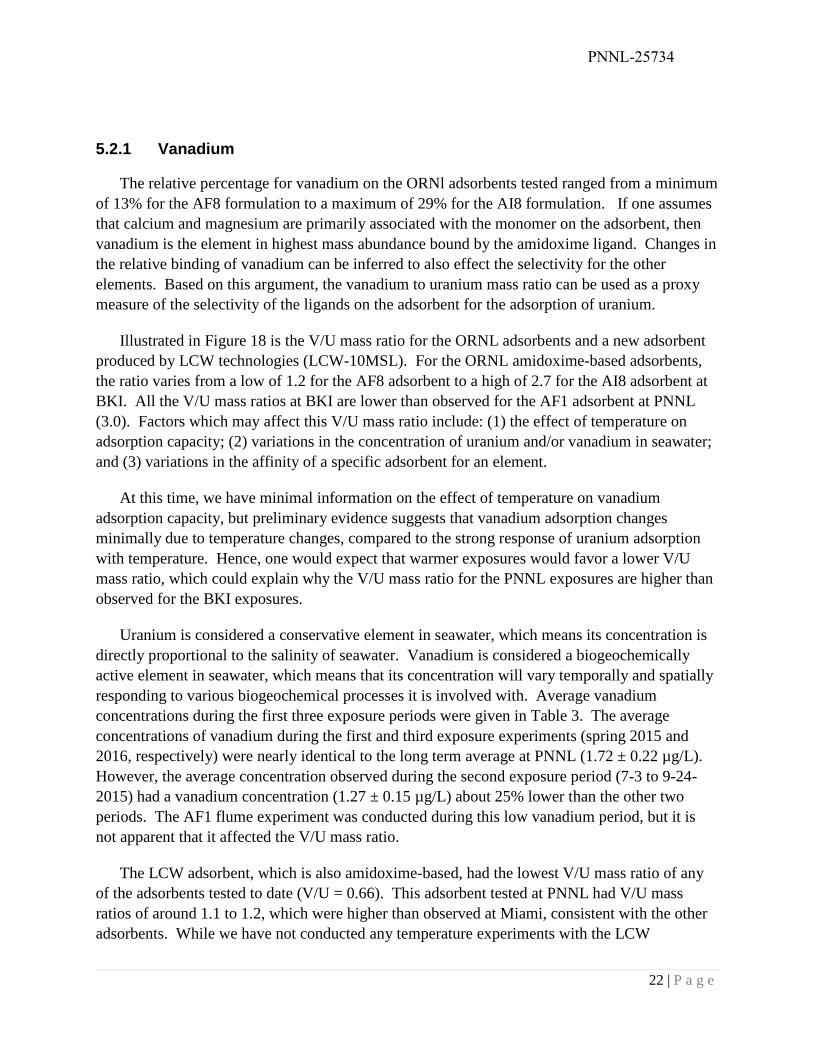
Figure 17. Relative percentage of the major elements adsorbed onto four different formulations of amidoxime-based adsorbents produced by ORNL from 56-day exposures at Broad Key Island, FL. Also included for comparison is the AF1 adsorbent elemental distribution determined at PNNL in Sequim Bay seawater.......................................................................... 23
Figure 18. Vanadium to uranium mass ratio for five formulations of amidoxime-based adsorbent materials after 56-day day exposures at BKI. Also shown for comparison is the V/U ratio for the AF1 adsorbent for a 56-day exposure at Sequim Bay, WA. ......................................... 24
PNNL-25734
viii | P a g e
Figure 19. Comparison of an ambient seawater deployment off the dock at Broad Key Island with a flume exposure using the ORNL AF1-AO-DMSO adsorbent. Data represent adsorption capacities at ambient temperature and salinity. ....................................................... 25
Tables
Table 1. Summary of Marine Testing at Broad Key Island in FY 2015 and FY 2016. ..................... 5 Table 2. Summary of average water quality parameters at Broad Key Island during four
experimental periods. .................................................................................................................. 8 Table 3. Mean and standard deviation of selected trace element concentrations in ambient
seawater at Broad Key Island for three different experimental periods. Data for ambient seawater in Sequim Bay are given for comparison. .................................................................... 9
Table 4. One-site ligand saturation modelling of the time series adsorption capacity measurements at Broad key Island for uranium and selected trace elements with the ORNL AF1 adsorbent determined using a flow-through column exposure at ambient temperature and salinity ................................................................................................................................ 12
Table 5. One-site ligand saturation modelling of uranium and selected trace elements for the Broad Key Island flume experiment with the ORNL AF1 adsorbent. Data represent modelling parameters for ambient temperature and ambient salinity. ...................................... 13
Table 6. One-site ligand saturation modelling of uranium and selected trace elements for the Broad Key Island flume experiment with the ORNL AI8 adsorbent. Data represent modelling parameters for ambient temperature and ambient salinity. ...................................... 14
Table 7. One-site ligand saturation modelling of uranium and selected trace elements for the Broad Key Island flume experiment with the ORNL AF8 adsorbent. Data represent modelling parameters for ambient temperature and ambient salinity. ...................................... 15
Table 8. One-Site Ligand saturation modelling parameters for uranium and vanadium determined for the ORNL AF8 and AI8 adsorbent deployments off the dock at Broad Key Island ........... 17
Table 9. One-Site ligand saturation modelling parameters for the Broad Key Island flow-through column experiment with the LCW adsorbent LCW-10MSL at ambient temperature and salinity. ...................................................................................................................................... 18
Table 10. One-Site ligand saturation modelling parameters for the BKI recirculating flume experiment and mini braid deployment of the dock using the ORNL adsorbent AF1-AO-DMSO at ambient temperature and salinity. ............................................................................. 20
Table 11. Comparison of 56-day uranium adsorption capacities with ORNL amidoxime-based adsorbents and half-saturation times for flume experiments conducted at Broad Key Island and at PNNL ............................................................................................................................. 21
1 | P a g e
1.0 Background
The Fuel Resources Program at the U.S. Department of Energy’s (DOE), Office of Nuclear Energy (DOE-NE) is developing adsorbent technology to extract uranium from seawater. This technology is being developed to provide a sustainable and economically viable supply of uranium fuel for nuclear reactors (DOE, 2010). A major effort for this program is determination of the adsorbent capacity and saturation kinetics of the adsorbent materials developed by program participants for uranium and selected other elements (e.g. vanadium, iron, copper, nickel, and zinc) using natural seawater under realistic conditions. This marine testing program is being conducted at the Pacific Northwest National Laboratories (PNNL), Marine Sciences Laboratory (MSL) in Sequim, Washington using ambient seawater from Sequim Bay. Details on the marine testing program and a summary of the testing results to date have been reported in the peer-reviewed literature (Gill et al., 2016, Kuo et al, 2016; Park et al., 2016). This report describes the marine testing of amidoxime-based adsorbent materials produced by Oak Ridge National Laboratory (ORNL) at Broad Key Island (BKI) using ambient seawater from the coast of Florida.
2.0 Objective
Marine testing at Broad Key Island, FL was conducted to validate adsorption capacity and adsorption kinetics results obtained for several formulations of the ORNL amidoxime-based polymeric adsorbents in Sequim Bay, WA in another location with different oceanographic and water quality conditions (e.g. temperature, dissolved organic carbon, salinity and trace element content).
3.0 Experimental Approach
3.1 Broad Key Island
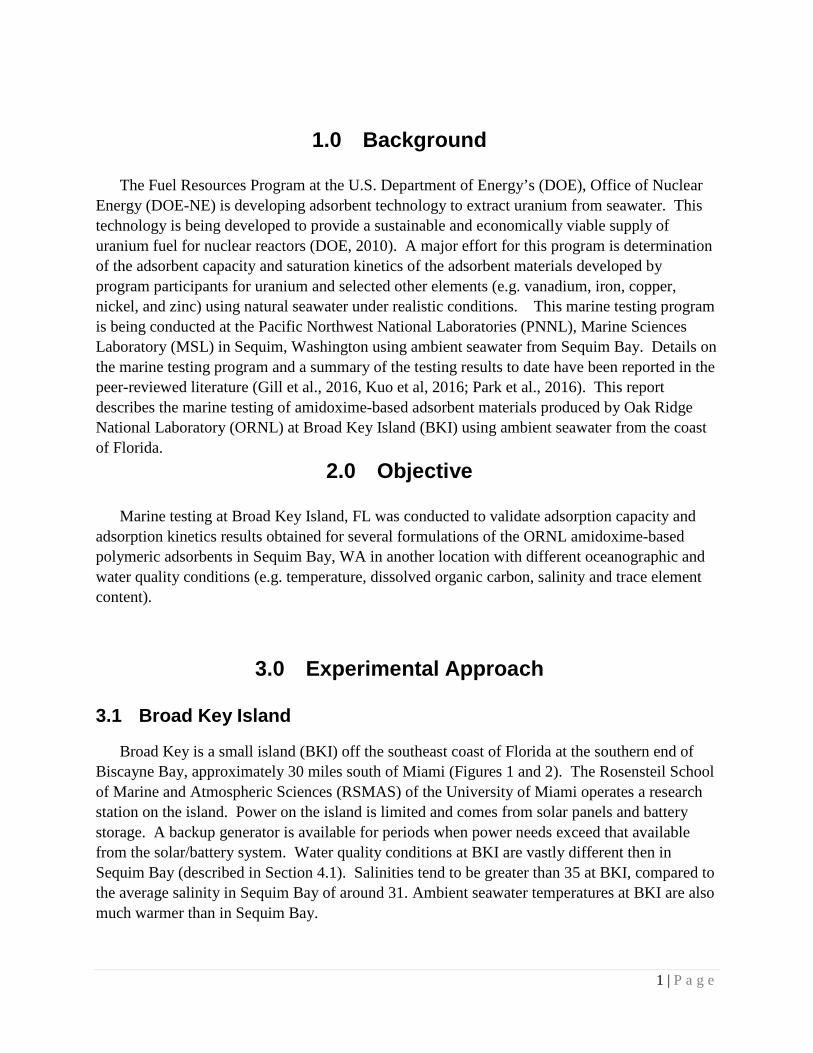
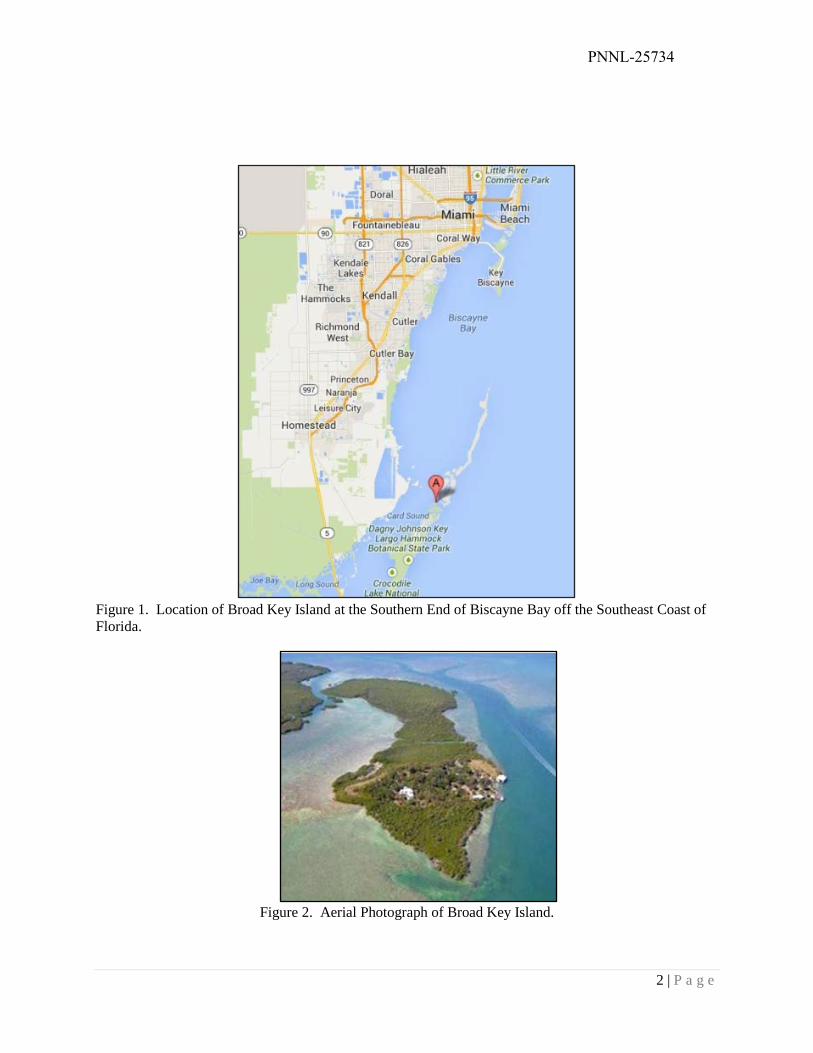
Broad Key is a small island (BKI) off the southeast coast of Florida at the southern end of Biscayne Bay, approximately 30 miles south of Miami (Figures 1 and 2). The Rosensteil School of Marine and Atmospheric Sciences (RSMAS) of the University of Miami operates a research station on the island. Power on the island is limited and comes from solar panels and battery storage. A backup generator is available for periods when power needs exceed that available from the solar/battery system. Water quality conditions at BKI are vastly different then in Sequim Bay (described in Section 4.1). Salinities tend to be greater than 35 at BKI, compared to the average salinity in Sequim Bay of around 31. Ambient seawater temperatures at BKI are also much warmer than in Sequim Bay.
PNNL-25734
2 | P a g e
Figure 1. Location of Broad Key Island at the Southern End of Biscayne Bay off the Southeast Coast of Florida.
Figure 2. Aerial Photograph of Broad Key Island.
PNNL-25734
3 | P a g e
3.2 Ambient Seawater Exposure System
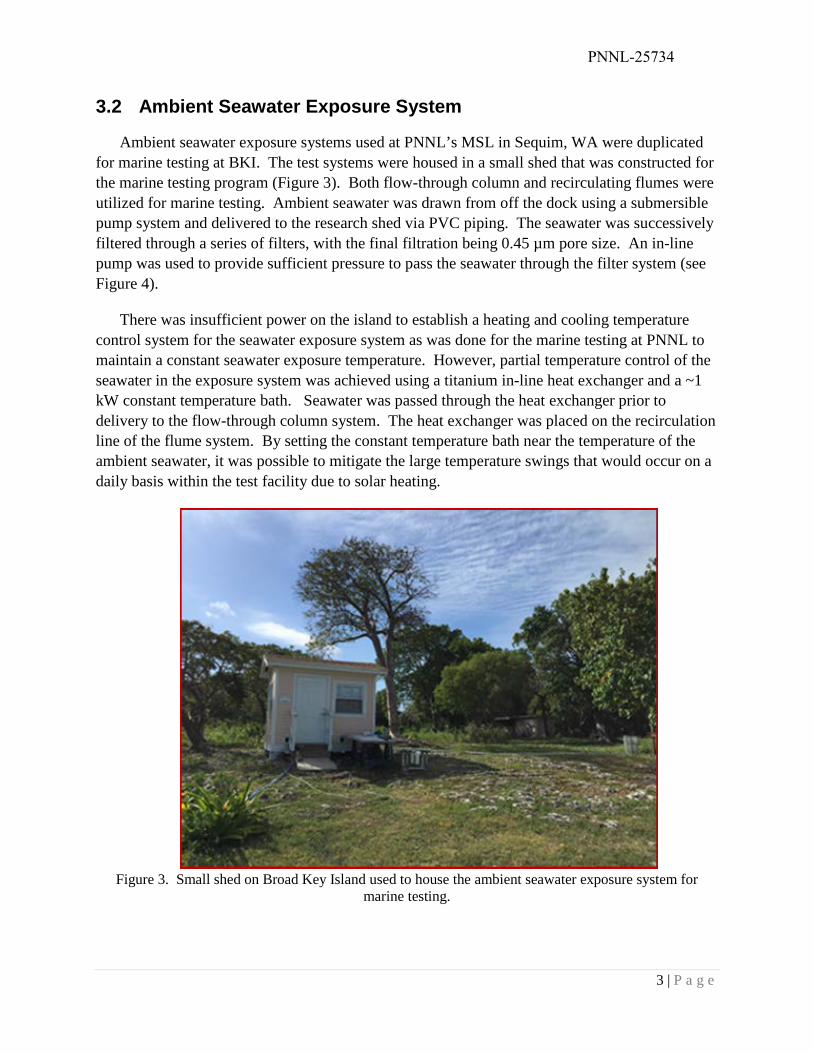
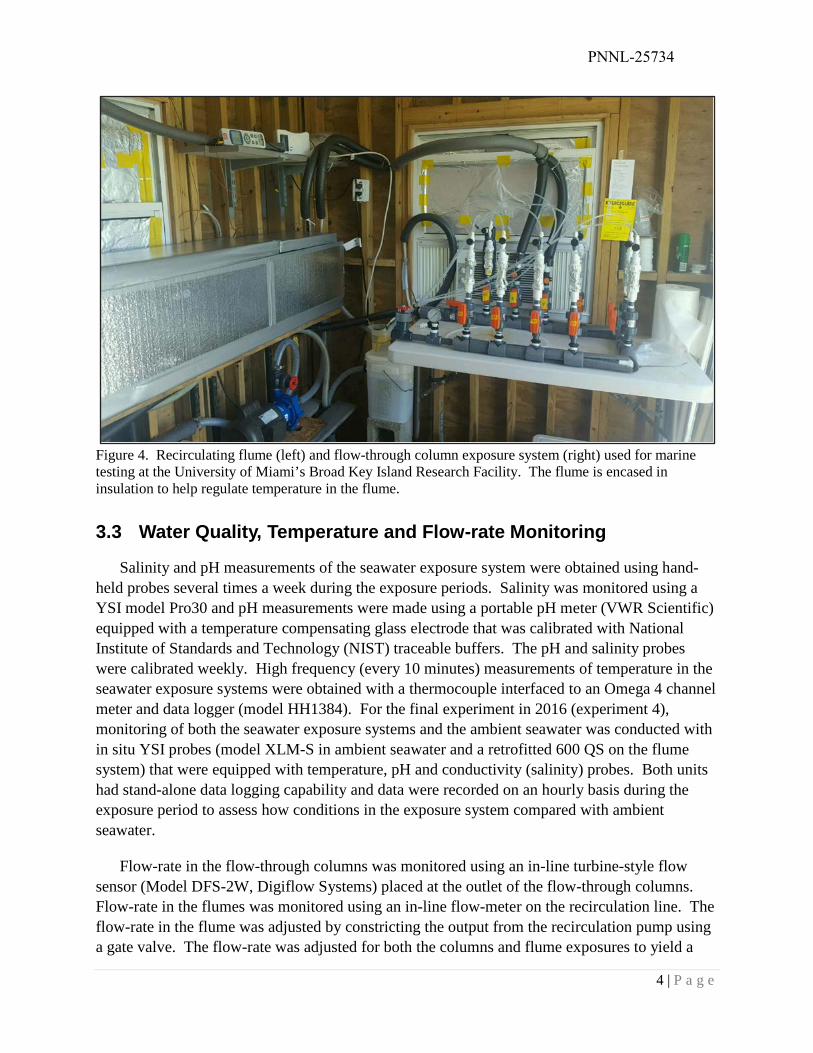
Ambient seawater exposure systems used at PNNL’s MSL in Sequim, WA were duplicated for marine testing at BKI. The test systems were housed in a small shed that was constructed for the marine testing program (Figure 3). Both flow-through column and recirculating flumes were utilized for marine testing. Ambient seawater was drawn from off the dock using a submersible pump system and delivered to the research shed via PVC piping. The seawater was successively filtered through a series of filters, with the final filtration being 0.45 µm pore size. An in-line pump was used to provide sufficient pressure to pass the seawater through the filter system (see Figure 4).
There was insufficient power on the island to establish a heating and cooling temperature control system for the seawater exposure system as was done for the marine testing at PNNL to maintain a constant seawater exposure temperature. However, partial temperature control of the seawater in the exposure system was achieved using a titanium in-line heat exchanger and a ~1 kW constant temperature bath. Seawater was passed through the heat exchanger prior to delivery to the flow-through column system. The heat exchanger was placed on the recirculation line of the flume system. By setting the constant temperature bath near the temperature of the ambient seawater, it was possible to mitigate the large temperature swings that would occur on a daily basis within the test facility due to solar heating.
Figure 3. Small shed on Broad Key Island used to house the ambient seawater exposure system for marine testing.
PNNL-25734
4 | P a g e
Figure 4. Recirculating flume (left) and flow-through column exposure system (right) used for marine testing at the University of Miami’s Broad Key Island Research Facility. The flume is encased in insulation to help regulate temperature in the flume.
3.3 Water Quality, Temperature and Flow-rate Monitoring
Salinity and pH measurements of the seawater exposure system were obtained using hand-held probes several times a week during the exposure periods. Salinity was monitored using a YSI model Pro30 and pH measurements were made using a portable pH meter (VWR Scientific) equipped with a temperature compensating glass electrode that was calibrated with National Institute of Standards and Technology (NIST) traceable buffers. The pH and salinity probes were calibrated weekly. High frequency (every 10 minutes) measurements of temperature in the seawater exposure systems were obtained with a thermocouple interfaced to an Omega 4 channel meter and data logger (model HH1384). For the final experiment in 2016 (experiment 4), monitoring of both the seawater exposure systems and the ambient seawater was conducted with in situ YSI probes (model XLM-S in ambient seawater and a retrofitted 600 QS on the flume system) that were equipped with temperature, pH and conductivity (salinity) probes. Both units had stand-alone data logging capability and data were recorded on an hourly basis during the exposure period to assess how conditions in the exposure system compared with ambient seawater.
Flow-rate in the flow-through columns was monitored using an in-line turbine-style flow sensor (Model DFS-2W, Digiflow Systems) placed at the outlet of the flow-through columns. Flow-rate in the flumes was monitored using an in-line flow-meter on the recirculation line. The flow-rate in the flume was adjusted by constricting the output from the recirculation pump using a gate valve. The flow-rate was adjusted for both the columns and flume exposures to yield a
PNNL-25734
5 | P a g e
linear velocity of 2 cm/sec, consistent with the flows used for seawater exposures at PNNL (Gill et al., 2016).
3.4 Marine Testing
A summary of the marine testing conducted at BKI in FY 2015 and FY 2016 is given in Table 1. Marine testing was conducted with five different adsorbent materials, four produced by ORNL (AF1, AI8, AF8, and AF1-DMSO) and one by LCW technologies (LCW-10MSL). The AF1, AF8 and AI8 adsorbents have been described in the peer-reviewed literature (Das et al., 2016a, 2016b). The AF1-DMSO adsorbent is the AF1 material described in the literature, but uses dimethylsulfoxide (DMSO) in the amidoxamation reaction. The LCW adsorbent was produced by Dr. Chien Wai and Dr. Horng-Bin Pan of LCW technologies and the University of Idaho. The adsorbent is an amidoxime-based adsorbent on acrylic fiber that has recently been submitted for patent application (US Pat. Appl. Ser. No. 15/179,766).
Table 1. Summary of Marine Testing at Broad Key Island in FY 2015 and FY 2016.
Start Date End Date Exposure Type Adsorbent 3/12/2015 5/7/2015 Flow-through Column AF1 7/29/2015 9/23/2015 Flume AF1 3/30/2016 5/25/2016 Flume AI8 and AF8 3/30/2016 5/25/2016 Dock (mini braids) AI8 and AF8 6/3/2016 8/12/2016 Flow-through Column LCW-10MSL 6/3/2016 8/12/2016 Flume AF1-DMSO 6/3/2016 8/12/2016 Dock (mini braids) AF1-DMSO
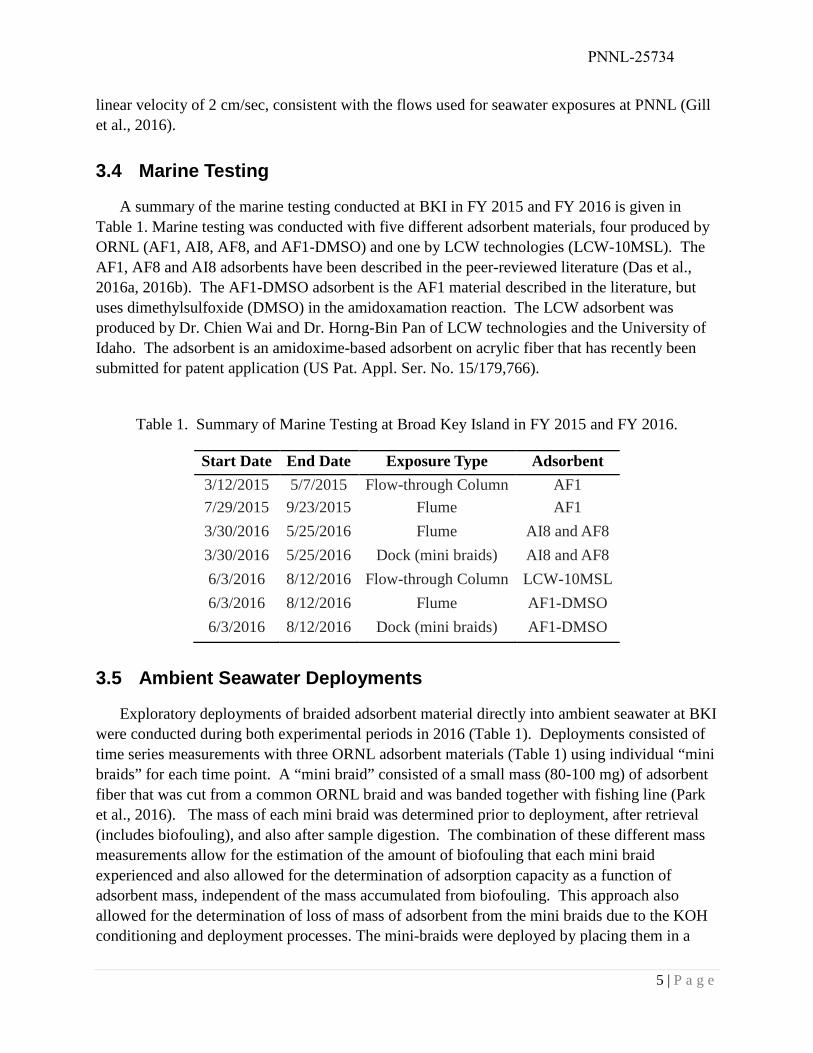
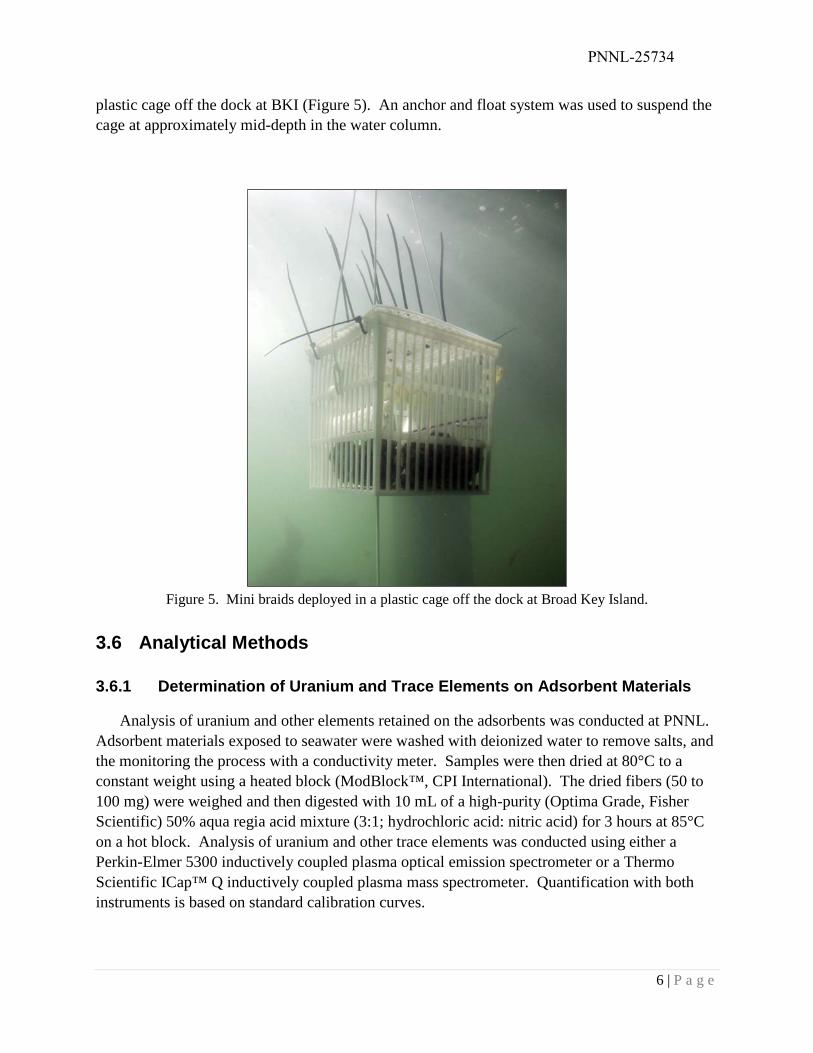
3.5 Ambient Seawater Deployments
Exploratory deployments of braided adsorbent material directly into ambient seawater at BKI were conducted during both experimental periods in 2016 (Table 1). Deployments consisted of time series measurements with three ORNL adsorbent materials (Table 1) using individual “mini braids” for each time point. A “mini braid” consisted of a small mass (80-100 mg) of adsorbent fiber that was cut from a common ORNL braid and was banded together with fishing line (Park et al., 2016). The mass of each mini braid was determined prior to deployment, after retrieval (includes biofouling), and also after sample digestion. The combination of these different mass measurements allow for the estimation of the amount of biofouling that each mini braid experienced and also allowed for the determination of adsorption capacity as a function of adsorbent mass, independent of the mass accumulated from biofouling. This approach also allowed for the determination of loss of mass of adsorbent from the mini braids due to the KOH conditioning and deployment processes. The mini-braids were deployed by placing them in a
PNNL-25734
6 | P a g e
plastic cage off the dock at BKI (Figure 5). An anchor and float system was used to suspend the cage at approximately mid-depth in the water column.
Figure 5. Mini braids deployed in a plastic cage off the dock at Broad Key Island.
3.6 Analytical Methods
3.6.1 Determination of Uranium and Trace Elements on Adsorbent Materials
Analysis of uranium and other elements retained on the adsorbents was conducted at PNNL. Adsorbent materials exposed to seawater were washed with deionized water to remove salts, and the monitoring the process with a conductivity meter. Samples were then dried at 80°C to a constant weight using a heated block (ModBlock™, CPI International). The dried fibers (50 to 100 mg) were weighed and then digested with 10 mL of a high-purity (Optima Grade, Fisher Scientific) 50% aqua regia acid mixture (3:1; hydrochloric acid: nitric acid) for 3 hours at 85°C on a hot block. Analysis of uranium and other trace elements was conducted using either a Perkin-Elmer 5300 inductively coupled plasma optical emission spectrometer or a Thermo Scientific ICap™ Q inductively coupled plasma mass spectrometer. Quantification with both instruments is based on standard calibration curves.
PNNL-25734
7 | P a g e
Analysis of uranium and trace elements on the mini-braid deployments which have biofouling were processed using a variation of the procedure used for braided adsorbents without biofouling. The mini braids were rinsed in deionized water and were then digested without trying to remove the biofouling. After the digestion, the fibers were rinsed to remove acid and were dried and weighed. This weight was then corrected for loss of the amidoxime and co-monomer functional groups mass due to the strong acid digestion. A correction term was determined using a separate set of new fibers (of the formulation deployed) which were conditioned, but were not exposed to seawater, carried through the digestion process, dried and weighed, and they were then compared to their initial dry weight before the conditioning step.
3.6.2 Determination of Uranium and Other Elements in Seawater
Determination of uranium and other elements in natural seawater samples was conducted at PNNL’s Marine Sciences Laboratory using ICP-MS and either the method of standard addition calibrations or the samples were preconcentrated onto a chelating ion exchange resin to minimize the seawater matrix, followed by acid elution with quantification against a standard calibration curve prepared using on-line pre-concentration (Wood et al., 2016). On-line pre-concentration of uranium was conducted using the seaFAST S2™ automated sample introduction system (Elemental Scientific) utilizing a seaFAST PFA chelation column packed with iminodiacetic acid chelating ion exchange resin (ESI, Seawater Concentrator Column CF-N-0200). Analytes were eluted off the column using 10% HNO3 and detected using a Thermo Elemental ICapQ ICP-MS.
3.7 One-Site Ligand Saturation Modeling
Measurements of the adsorption of uranium and other elements from seawater as a function of time onto the adsorbent materials were used to determine the adsorbent capacity and adsorption rate (kinetics) of uranium and other elements. Determination of adsorption capacity and kinetics was conducted using one-site ligand saturation modeling, which was parameterized using the software graphics program SigmaPlot©. The best-fit line representing the time series adsorption of uranium is given by:
(1)
Where u is uranium capacity (g U/kg adsorbent), t is exposure time (days), βmax is the adsorption capacity at saturation (g U/kg adsorbent), and Kd is the half-saturation time (days).
Prior to determination of adsorption capacity and kinetics, the individual capacity determinations were normalized to a salinity of 35 psu using simple proportional relationships. This normalization removes the differences that result from exposures in seawater with varying salinity and hence uranium concentrations. This salinity normalization is also done for the other
tKtu
d += maxβ
PNNL-25734
8 | P a g e
elements as well, but the normalization is less well defined for non-conservative elements in seawater.
4.0 Results
The uranium and trace element data obtained on the adsorbent materilas for all the BKI experiments are tabulated in the appendix. Adsorption capacity data are tabulated for each test in two forms: (1) at ambient temperature and salinity; and (2) corrected to a salinity of 35. Note that the results for the ambient seawater deployments for the mini-braids off the dock represent contributions from both the adsorbent and the attached biofouling as the biofouling could not be removed prior to analysis. This will affect several elements that are components of primary production, most notably Ca, Sr, Fe, Mn, and Zn. Uranium concentrations in biofouling are not expected to be significant because uranium is not required for growth and it is in low concentrations in particulate matter in marine systems. The impact of biofouling on Zn concentrations is not known.
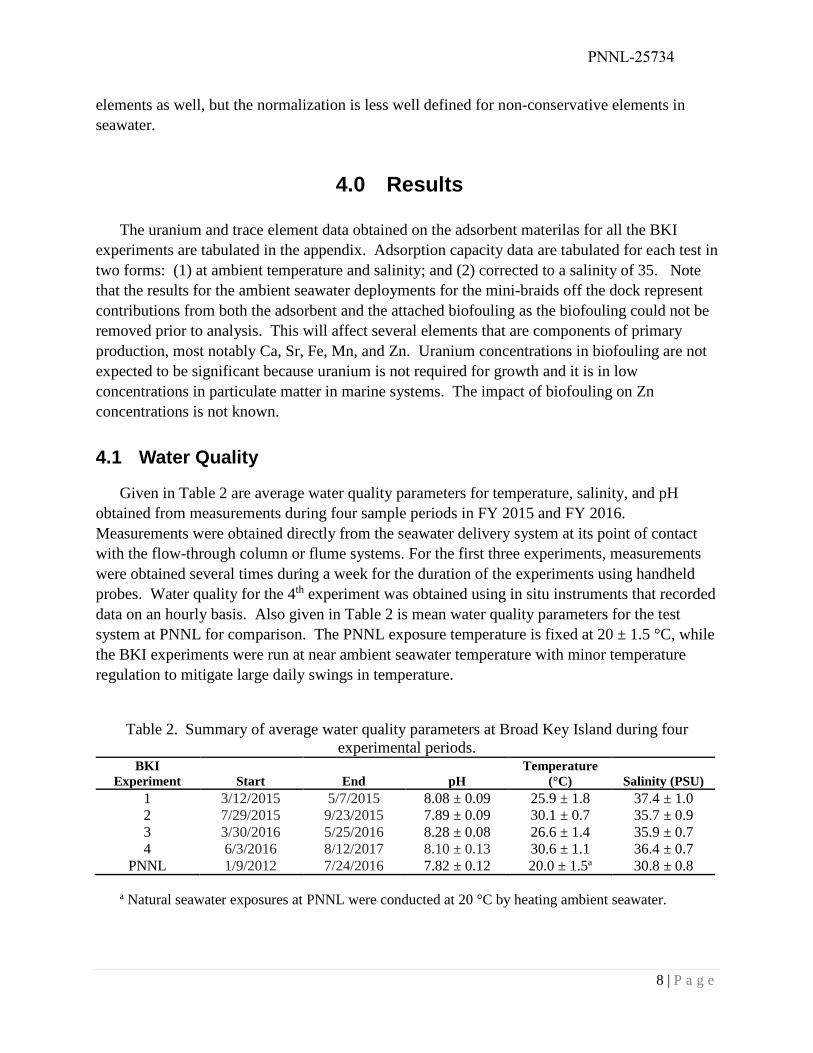
4.1 Water Quality
Given in Table 2 are average water quality parameters for temperature, salinity, and pH obtained from measurements during four sample periods in FY 2015 and FY 2016. Measurements were obtained directly from the seawater delivery system at its point of contact with the flow-through column or flume systems. For the first three experiments, measurements were obtained several times during a week for the duration of the experiments using handheld probes. Water quality for the 4th experiment was obtained using in situ instruments that recorded data on an hourly basis. Also given in Table 2 is mean water quality parameters for the test system at PNNL for comparison. The PNNL exposure temperature is fixed at 20 ± 1.5 °C, while the BKI experiments were run at near ambient seawater temperature with minor temperature regulation to mitigate large daily swings in temperature.
Table 2. Summary of average water quality parameters at Broad Key Island during four experimental periods.
BKI Experiment Start End pH
Temperature (°C) Salinity (PSU)
1 3/12/2015 5/7/2015 8.08 ± 0.09 25.9 ± 1.8 37.4 ± 1.0 2 7/29/2015 9/23/2015 7.89 ± 0.09 30.1 ± 0.7 35.7 ± 0.9 3 3/30/2016 5/25/2016 8.28 ± 0.08 26.6 ± 1.4 35.9 ± 0.7 4 6/3/2016 8/12/2017 8.10 ± 0.13 30.6 ± 1.1 36.4 ± 0.7
PNNL 1/9/2012 7/24/2016 7.82 ± 0.12 20.0 ± 1.5a 30.8 ± 0.8
a Natural seawater exposures at PNNL were conducted at 20 °C by heating ambient seawater.
PNNL-25734
9 | P a g e
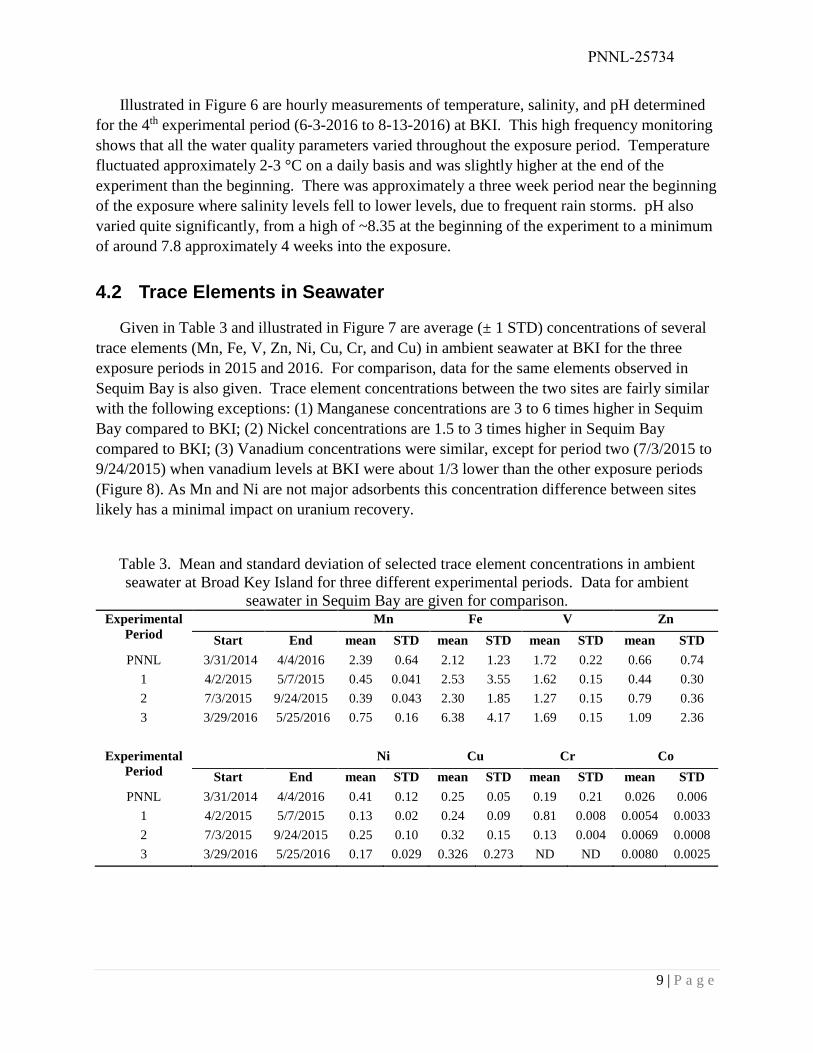
Illustrated in Figure 6 are hourly measurements of temperature, salinity, and pH determined for the 4th experimental period (6-3-2016 to 8-13-2016) at BKI. This high frequency monitoring shows that all the water quality parameters varied throughout the exposure period. Temperature fluctuated approximately 2-3 °C on a daily basis and was slightly higher at the end of the experiment than the beginning. There was approximately a three week period near the beginning of the exposure where salinity levels fell to lower levels, due to frequent rain storms. pH also varied quite significantly, from a high of ~8.35 at the beginning of the experiment to a minimum of around 7.8 approximately 4 weeks into the exposure.
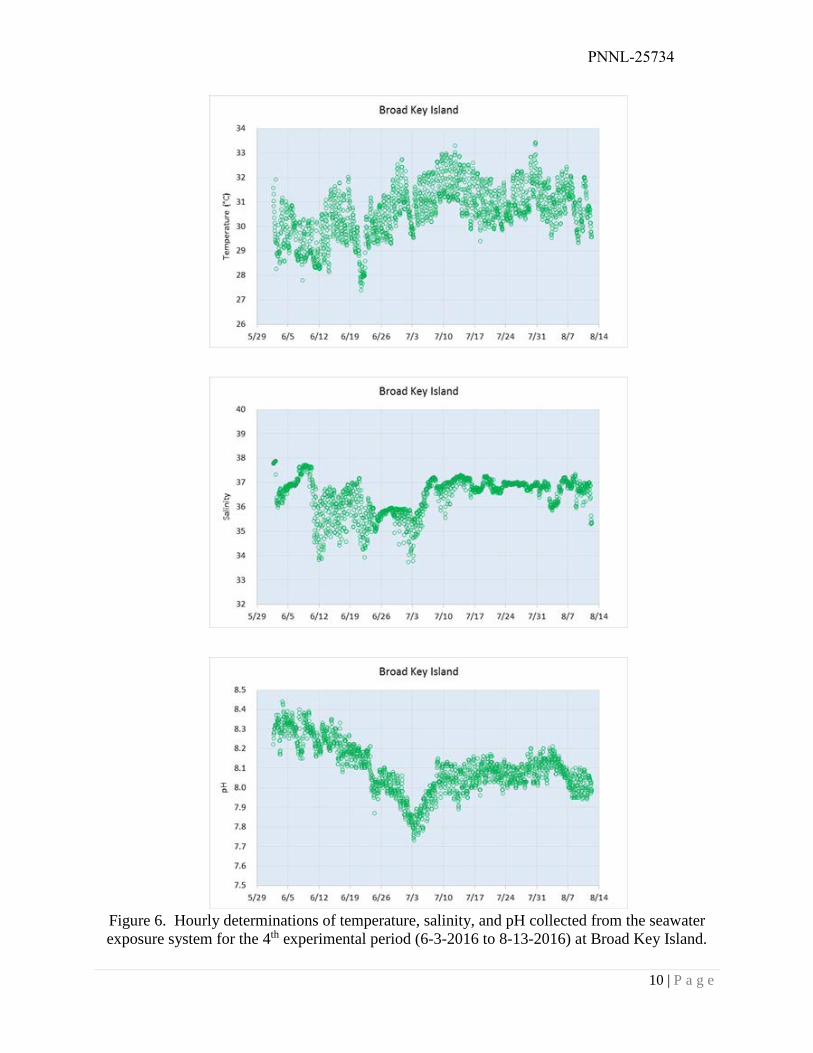
4.2 Trace Elements in Seawater
Given in Table 3 and illustrated in Figure 7 are average (± 1 STD) concentrations of several trace elements (Mn, Fe, V, Zn, Ni, Cu, Cr, and Cu) in ambient seawater at BKI for the three exposure periods in 2015 and 2016. For comparison, data for the same elements observed in Sequim Bay is also given. Trace element concentrations between the two sites are fairly similar with the following exceptions: (1) Manganese concentrations are 3 to 6 times higher in Sequim Bay compared to BKI; (2) Nickel concentrations are 1.5 to 3 times higher in Sequim Bay compared to BKI; (3) Vanadium concentrations were similar, except for period two (7/3/2015 to 9/24/2015) when vanadium levels at BKI were about 1/3 lower than the other exposure periods (Figure 8). As Mn and Ni are not major adsorbents this concentration difference between sites likely has a minimal impact on uranium recovery.
Table 3. Mean and standard deviation of selected trace element concentrations in ambient seawater at Broad Key Island for three different experimental periods. Data for ambient
seawater in Sequim Bay are given for comparison. Experimental
Period Mn Fe V Zn
Start End mean STD mean STD mean STD mean STD PNNL 3/31/2014 4/4/2016 2.39 0.64 2.12 1.23 1.72 0.22 0.66 0.74
1 4/2/2015 5/7/2015 0.45 0.041 2.53 3.55 1.62 0.15 0.44 0.30 2 7/3/2015 9/24/2015 0.39 0.043 2.30 1.85 1.27 0.15 0.79 0.36 3 3/29/2016 5/25/2016 0.75 0.16 6.38 4.17 1.69 0.15 1.09 2.36
Experimental Period
Ni Cu Cr Co Start End mean STD mean STD mean STD mean STD
PNNL 3/31/2014 4/4/2016 0.41 0.12 0.25 0.05 0.19 0.21 0.026 0.006 1 4/2/2015 5/7/2015 0.13 0.02 0.24 0.09 0.81 0.008 0.0054 0.0033 2 7/3/2015 9/24/2015 0.25 0.10 0.32 0.15 0.13 0.004 0.0069 0.0008 3 3/29/2016 5/25/2016 0.17 0.029 0.326 0.273 ND ND 0.0080 0.0025
PNNL-25734
10 | P a g e
Figure 6. Hourly determinations of temperature, salinity, and pH collected from the seawater exposure system for the 4th experimental period (6-3-2016 to 8-13-2016) at Broad Key Island.
PNNL-25734
11 | P a g e
Figure 7. Trace Elements in seawater at Broad Key Island for 3 different sampling periods. Also shown for comparison is trace element concentrations for Sequim Bay (PNNL).
Figure 8. Vanadium concentrations in ambient seawater at Broad Key Island for three experimental time periods compared to average concentrations in Sequim Bay (PNNL). Date were normalized to a salinity of 35 psu.
Mn Fe V Zn Ni Cu Cr Co
Con
cent
ratio
n (µ
g/L)
0
2
4
6
8
10
12
PNNLBKI Period 1BKI Period 2BKI Period 3
PNNL BKI Period 1 BKI Period 2 BKI Period 3
Van
adiu
m (µ
g/L)
0.0
0.5
1.0
1.5
2.0
2.5

PNNL-25734
12 | P a g e
4.3 Flow-Through Column Experiment with the ORNL AF1 adsorbent
Shown in Figure 9 are time series measurements of uranium and selected trace elements (V, Cu, Fe, and Zn) adsorption capacity for the ORNL AF1 adsorbent determined by flow-through column testing at ambient temperature (25.9 °C) and ambient salinity (37.4). One-site ligand saturation modelling of this data are shown in Table 4. The experiment was conducted between March 12 and May 7, 2015.
Figure 9. Time series measurements of uranium and selected trace elements (V, Cu, Fe, and Zn) adsorption capacity for the ORNL AF1 adsorbent determined using flow-through column testing at ambient temperature (25.9 °C) and ambient salinity (37.4).
Table 4. One-site ligand saturation modelling of the time series adsorption capacity measurements at Broad key Island for uranium and selected trace elements with the ORNL AF1 adsorbent determined using a flow-through column exposure at ambient temperature and salinity
( p y)
Exposure Time (days)
0 7 14 21 28 35 42 49 56 63
Ads
orpt
ion
Cap
acity
(g/k
g ad
sorb
ent)
0
2
4
6
8
10
12
14
16
UraniumVanadiumIronZincCopper
Modelling Parameter U V Cu Fe Zn Saturation Capacity (g/kg adsorbent) 4.86 ± 0.12 21.5 ± 1.7 9.96 ± 4.98 7.36 ± 1.03 1.01 ± 0.14
56-day Adsorption Capacity (g/kg adsorbent) 3.97 ± 0.10 13.1 ± 1.0 4.87 ± 2.43 3.59 ± 0.50 0.90 ± 0.12
Half-saturation Time (days) 12.6 ± 1.1 36 ± 5.7 59 ± 50 59 ± 14 6.5 ± 4.5
PNNL-25734
13 | P a g e
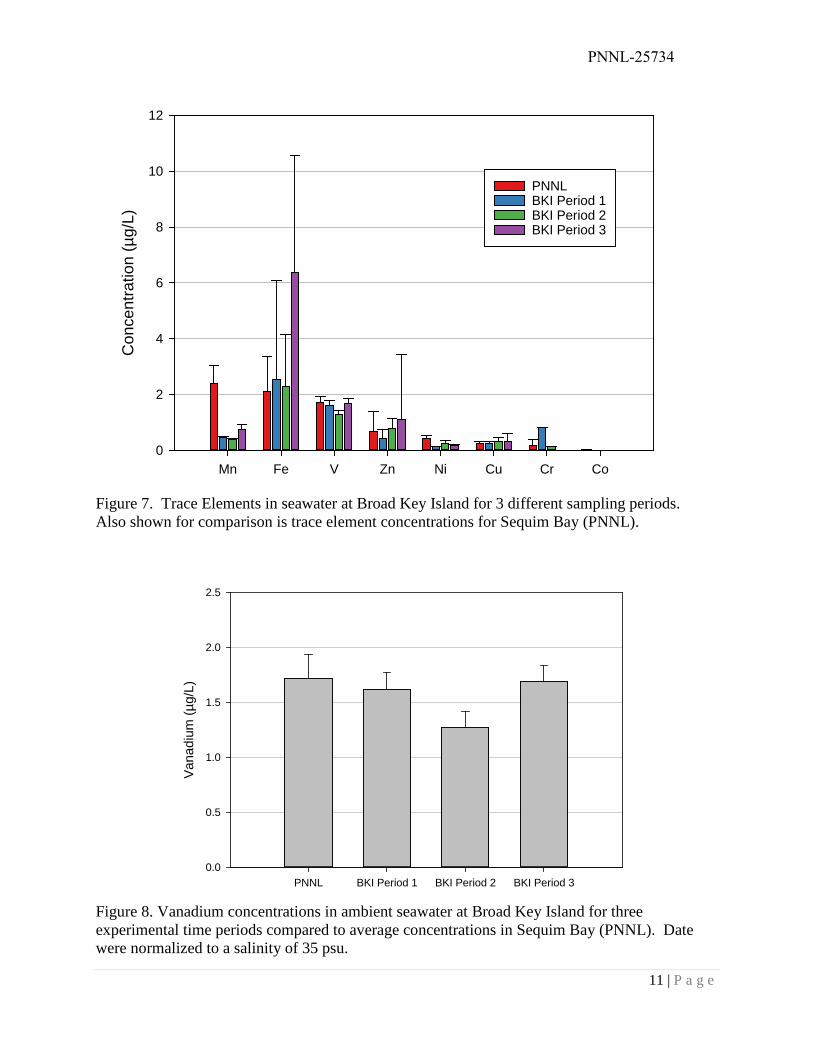
4.4 Recirculating Flume Experiment with the ORNL AF1 Adsorbent
Shown in Figure 10 are time series measurements of uranium and selected trace elements (V, Cu, Fe, and Zn) adsorption capacity for the ORNL AF1 adsorbent determined by recirculating flume exposure testing at ambient temperature (30.1 ± 0.7 °C) and ambient salinity (35.7 ± 0.9). One-site ligand saturation modelling of this data are shown in Table 5. The experiment was conducted between June 29 and May 7, 2015.
Figure 10. Broad Key Island Flume Experiment with ORNL AF1 Adsorbent. Data represent adsorption capacities at ambient temperature and ambient salinity.
Table 5. One-site ligand saturation modelling of uranium and selected trace elements for the Broad Key Island flume experiment with the ORNL AF1 adsorbent. Data represent modelling
parameters for ambient temperature and ambient salinity.
Exposure Time (days)
0 7 14 21 28 35 42 49 56 63
Ads
orpt
ion
Cap
acity
(g/k
g ad
sorb
ent)
0
2
4
6
8
10
12
14
UraniumVanadiumIronZincCopper
Modelling Parameter U V Cu Fe Zn Saturation Capacity (g/kg adsorbent) 9.14 ± 0.14 15.3 ± 1.4 9.31 ± 4.7 1.94 ± 0.19 1.05 ± 0.02 56-day Adsorption Capacity (g/kg adsorbent) 6.35 ± 0.10 10.6 ± 0.97 4.57 ± 2.31 1.52 ± 0.15 1.01 ± 0.02 Half-saturation Time (days) 25 ± 0.96 25 ± 5.7 58 ± 50 16 ± 4.8 2.0 ± 0.53
PNNL-25734
14 | P a g e
4.5 Recirculating Flume Experiment with the ORNL AI8 Adsorbent
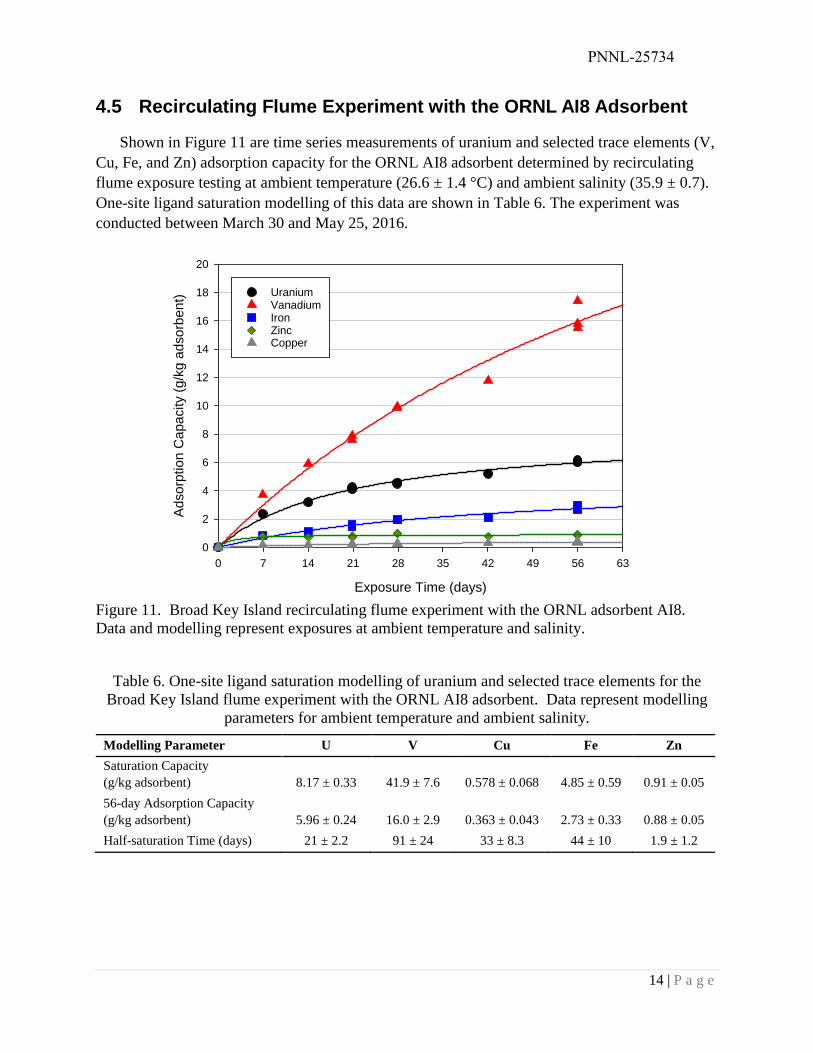
Shown in Figure 11 are time series measurements of uranium and selected trace elements (V, Cu, Fe, and Zn) adsorption capacity for the ORNL AI8 adsorbent determined by recirculating flume exposure testing at ambient temperature (26.6 ± 1.4 °C) and ambient salinity (35.9 ± 0.7). One-site ligand saturation modelling of this data are shown in Table 6. The experiment was conducted between March 30 and May 25, 2016.
Figure 11. Broad Key Island recirculating flume experiment with the ORNL adsorbent AI8. Data and modelling represent exposures at ambient temperature and salinity.
Table 6. One-site ligand saturation modelling of uranium and selected trace elements for the Broad Key Island flume experiment with the ORNL AI8 adsorbent. Data represent modelling
parameters for ambient temperature and ambient salinity.
Exposure Time (days)
0 7 14 21 28 35 42 49 56 63
Ads
orpt
ion
Cap
acity
(g/k
g ad
sorb
ent)
0
2
4
6
8
10
12
14
16
18
20
UraniumVanadiumIronZincCopper
Modelling Parameter U V Cu Fe Zn Saturation Capacity (g/kg adsorbent) 8.17 ± 0.33 41.9 ± 7.6 0.578 ± 0.068 4.85 ± 0.59 0.91 ± 0.05 56-day Adsorption Capacity (g/kg adsorbent) 5.96 ± 0.24 16.0 ± 2.9 0.363 ± 0.043 2.73 ± 0.33 0.88 ± 0.05 Half-saturation Time (days) 21 ± 2.2 91 ± 24 33 ± 8.3 44 ± 10 1.9 ± 1.2
PNNL-25734
15 | P a g e
4.6 Recirculating Flume Experiment with the ORNL AF8 Adsorbent
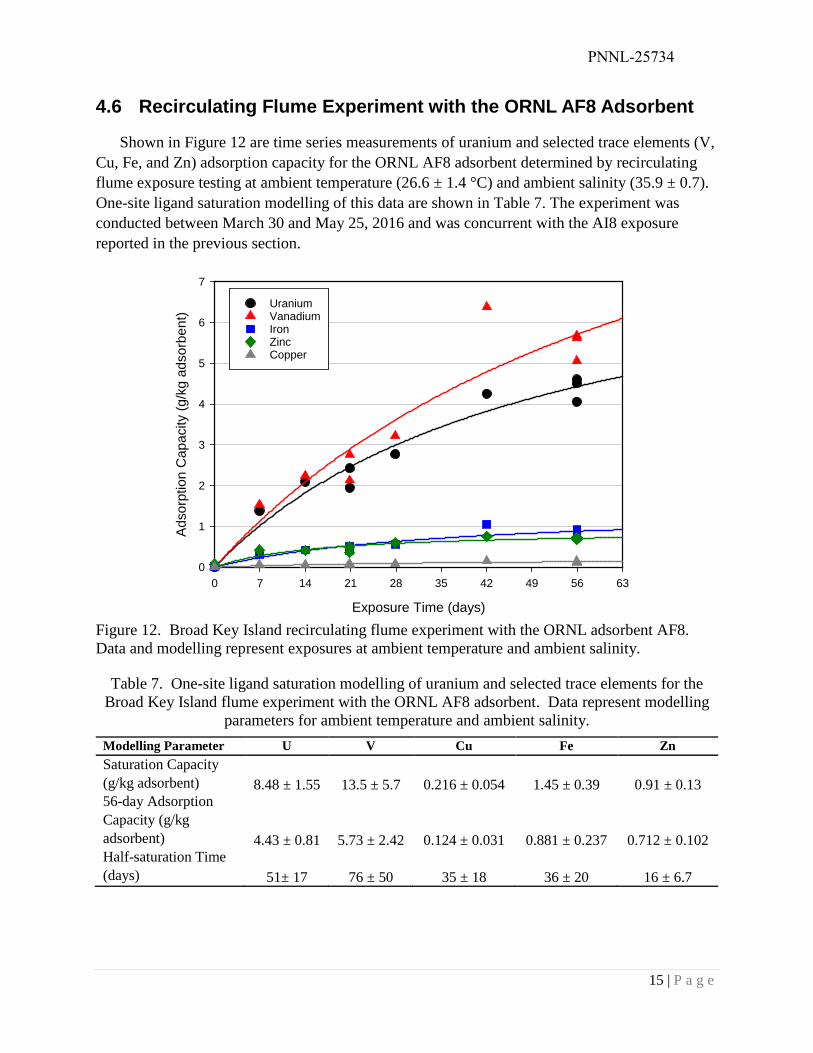
Shown in Figure 12 are time series measurements of uranium and selected trace elements (V, Cu, Fe, and Zn) adsorption capacity for the ORNL AF8 adsorbent determined by recirculating flume exposure testing at ambient temperature (26.6 ± 1.4 °C) and ambient salinity (35.9 ± 0.7). One-site ligand saturation modelling of this data are shown in Table 7. The experiment was conducted between March 30 and May 25, 2016 and was concurrent with the AI8 exposure reported in the previous section.
Figure 12. Broad Key Island recirculating flume experiment with the ORNL adsorbent AF8. Data and modelling represent exposures at ambient temperature and ambient salinity.
Table 7. One-site ligand saturation modelling of uranium and selected trace elements for the Broad Key Island flume experiment with the ORNL AF8 adsorbent. Data represent modelling
parameters for ambient temperature and ambient salinity.
Exposure Time (days)
0 7 14 21 28 35 42 49 56 63
Ads
orpt
ion
Cap
acity
(g/k
g ad
sorb
ent)
0
1
2
3
4
5
6
7
UraniumVanadiumIronZincCopper
Modelling Parameter U V Cu Fe Zn Saturation Capacity (g/kg adsorbent) 8.48 ± 1.55 13.5 ± 5.7 0.216 ± 0.054 1.45 ± 0.39 0.91 ± 0.13 56-day Adsorption Capacity (g/kg adsorbent) 4.43 ± 0.81 5.73 ± 2.42 0.124 ± 0.031 0.881 ± 0.237 0.712 ± 0.102 Half-saturation Time (days) 51± 17 76 ± 50 35 ± 18 36 ± 20 16 ± 6.7
PNNL-25734
16 | P a g e
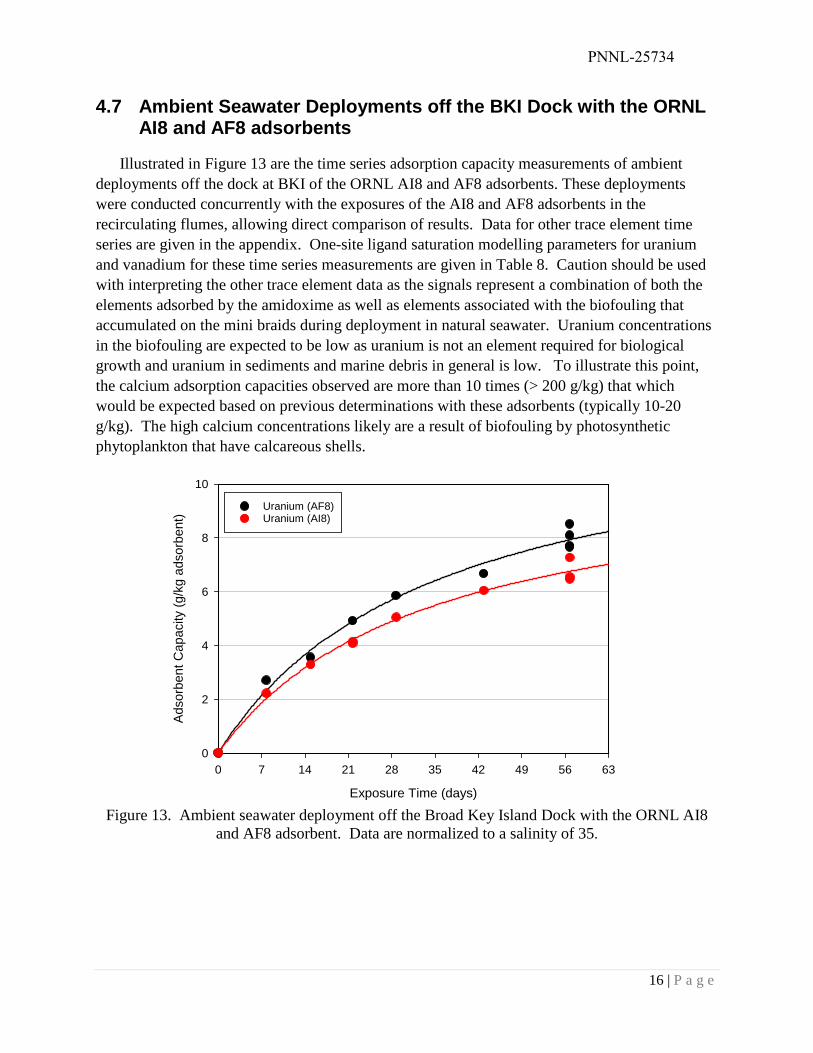
4.7 Ambient Seawater Deployments off the BKI Dock with the ORNL AI8 and AF8 adsorbents
Illustrated in Figure 13 are the time series adsorption capacity measurements of ambient deployments off the dock at BKI of the ORNL AI8 and AF8 adsorbents. These deployments were conducted concurrently with the exposures of the AI8 and AF8 adsorbents in the recirculating flumes, allowing direct comparison of results. Data for other trace element time series are given in the appendix. One-site ligand saturation modelling parameters for uranium and vanadium for these time series measurements are given in Table 8. Caution should be used with interpreting the other trace element data as the signals represent a combination of both the elements adsorbed by the amidoxime as well as elements associated with the biofouling that accumulated on the mini braids during deployment in natural seawater. Uranium concentrations in the biofouling are expected to be low as uranium is not an element required for biological growth and uranium in sediments and marine debris in general is low. To illustrate this point, the calcium adsorption capacities observed are more than 10 times (> 200 g/kg) that which would be expected based on previous determinations with these adsorbents (typically 10-20 g/kg). The high calcium concentrations likely are a result of biofouling by photosynthetic phytoplankton that have calcareous shells.
Figure 13. Ambient seawater deployment off the Broad Key Island Dock with the ORNL AI8 and AF8 adsorbent. Data are normalized to a salinity of 35.
Exposure Time (days)
0 7 14 21 28 35 42 49 56 63
Adso
rben
t Cap
acity
(g/k
g ad
sorb
ent)
0
2
4
6
8
10
Uranium (AF8)Uranium (AI8)
PNNL-25734
17 | P a g e
Table 8. One-Site Ligand saturation modelling parameters for uranium and vanadium determined for the ORNL AF8 and AI8 adsorbent deployments off the dock at Broad Key Island
Modelling Parameter U V AF8 Saturation Capacity (g/kg adsorbent)
13 ± 1.0 25 ± 6.3
56-day Adsorption Capacity (g/kg adsorbent)
8.3 ± 0.6 15 ± 3.7
Half-saturation Time (days) 35 ± 5.9 40 ± 21
AI8 Saturation Capacity (g/kg adsorbent)
11 ± 0.7 16 ± 2.7
56-day Adsorption Capacity (g/kg adsorbent)
6.7 ± 0.4 10 ± 1.7
Half-saturation Time (days) 33 ± 4.6 34 ± 12
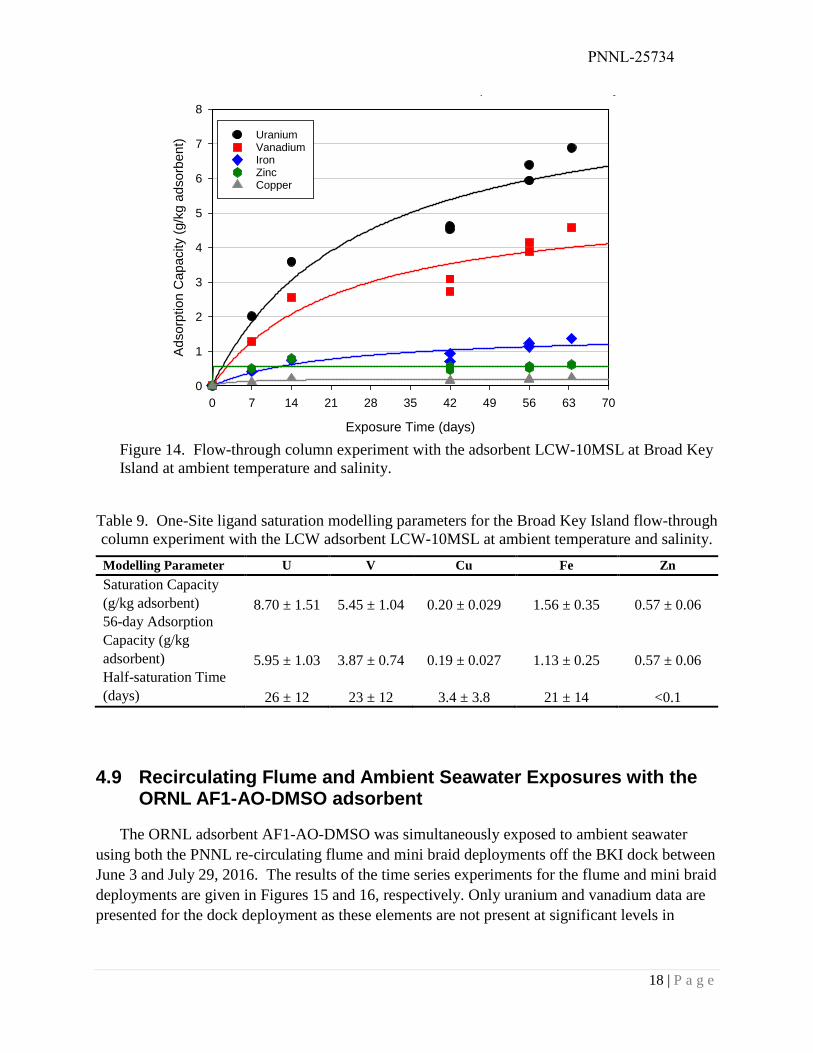
4.8 Flow-Through Column Exposure with the LCW-10MSL Adsorbent
Shown in Figure 14 are time series measurements of uranium and selected trace elements (V, Cu, Fe, and Zn) adsorption capacity for the ORNL AF8 adsorbent determined by flow-through column exposure testing at ambient temperature (30.6 ± 1.1 °C) and ambient salinity (36.4 ± 0.7). One-site ligand saturation modelling of this data are shown in Table 9. The experiment was conducted between June 3 and August 12, 2016 and was concurrent with the AF1-AO-DMSO exposure reported in the next section.
PNNL-25734
18 | P a g e
Figure 14. Flow-through column experiment with the adsorbent LCW-10MSL at Broad Key Island at ambient temperature and salinity.
Table 9. One-Site ligand saturation modelling parameters for the Broad Key Island flow-through column experiment with the LCW adsorbent LCW-10MSL at ambient temperature and salinity.
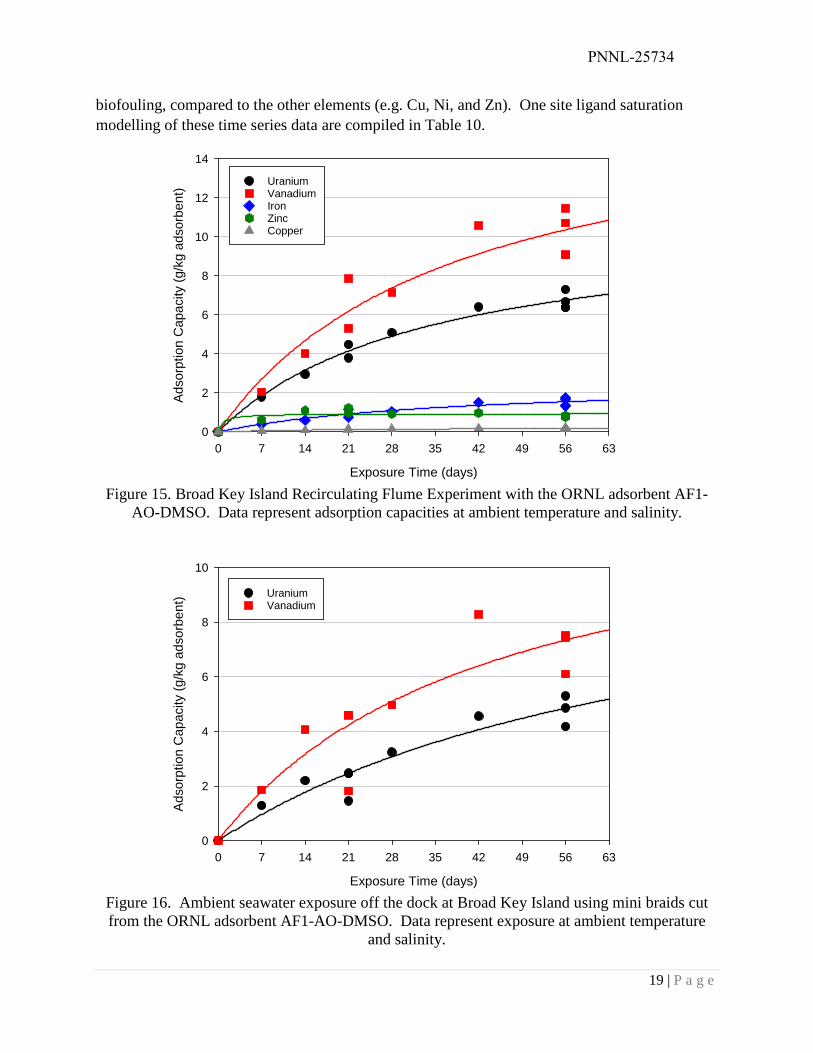
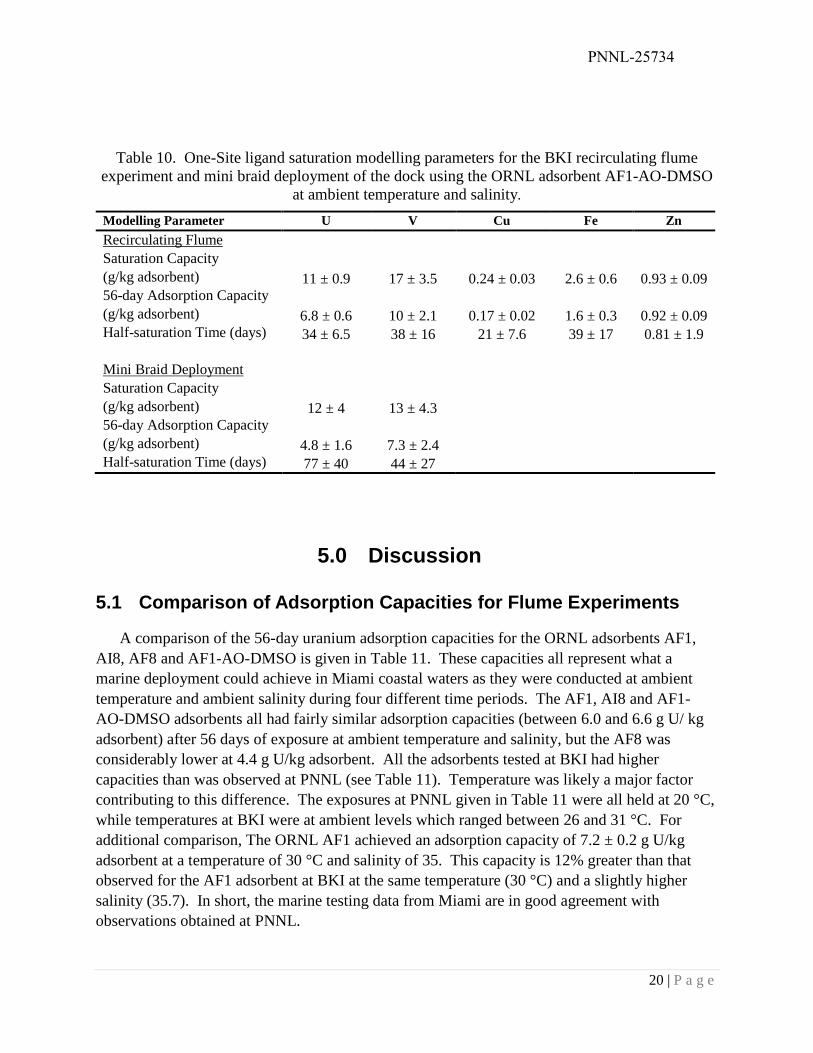
4.9 Recirculating Flume and Ambient Seawater Exposures with the ORNL AF1-AO-DMSO adsorbent
The ORNL adsorbent AF1-AO-DMSO was simultaneously exposed to ambient seawater using both the PNNL re-circulating flume and mini braid deployments off the BKI dock between June 3 and July 29, 2016. The results of the time series experiments for the flume and mini braid deployments are given in Figures 15 and 16, respectively. Only uranium and vanadium data are presented for the dock deployment as these elements are not present at significant levels in
p y
Exposure Time (days)
0 7 14 21 28 35 42 49 56 63 70
Ads
orpt
ion
Cap
acity
(g/k
g ad
sorb
ent)
0
1
2
3
4
5
6
7
8
UraniumVanadiumIronZincCopper
Modelling Parameter U V Cu Fe Zn Saturation Capacity (g/kg adsorbent) 8.70 ± 1.51 5.45 ± 1.04 0.20 ± 0.029 1.56 ± 0.35 0.57 ± 0.06 56-day Adsorption Capacity (g/kg adsorbent) 5.95 ± 1.03 3.87 ± 0.74 0.19 ± 0.027 1.13 ± 0.25 0.57 ± 0.06 Half-saturation Time (days) 26 ± 12 23 ± 12 3.4 ± 3.8 21 ± 14 <0.1
PNNL-25734
19 | P a g e
biofouling, compared to the other elements (e.g. Cu, Ni, and Zn). One site ligand saturation modelling of these time series data are compiled in Table 10.
Figure 15. Broad Key Island Recirculating Flume Experiment with the ORNL adsorbent AF1-AO-DMSO. Data represent adsorption capacities at ambient temperature and salinity.
Figure 16. Ambient seawater exposure off the dock at Broad Key Island using mini braids cut from the ORNL adsorbent AF1-AO-DMSO. Data represent exposure at ambient temperature
and salinity.
Exposure Time (days)
0 7 14 21 28 35 42 49 56 63
Ads
orpt
ion
Cap
acity
(g/k
g ad
sorb
ent)
0
2
4
6
8
10
12
14
UraniumVanadiumIronZincCopper
Exposure Time (days)
0 7 14 21 28 35 42 49 56 63
Ads
orpt
ion
Cap
acity
(g/k
g ad
sorb
ent)
0
2
4
6
8
10
UraniumVanadium
PNNL-25734
20 | P a g e
Table 10. One-Site ligand saturation modelling parameters for the BKI recirculating flume experiment and mini braid deployment of the dock using the ORNL adsorbent AF1-AO-DMSO
at ambient temperature and salinity.
5.0 Discussion
5.1 Comparison of Adsorption Capacities for Flume Experiments
A comparison of the 56-day uranium adsorption capacities for the ORNL adsorbents AF1, AI8, AF8 and AF1-AO-DMSO is given in Table 11. These capacities all represent what a marine deployment could achieve in Miami coastal waters as they were conducted at ambient temperature and ambient salinity during four different time periods. The AF1, AI8 and AF1-AO-DMSO adsorbents all had fairly similar adsorption capacities (between 6.0 and 6.6 g U/ kg adsorbent) after 56 days of exposure at ambient temperature and salinity, but the AF8 was considerably lower at 4.4 g U/kg adsorbent. All the adsorbents tested at BKI had higher capacities than was observed at PNNL (see Table 11). Temperature was likely a major factor contributing to this difference. The exposures at PNNL given in Table 11 were all held at 20 °C, while temperatures at BKI were at ambient levels which ranged between 26 and 31 °C. For additional comparison, The ORNL AF1 achieved an adsorption capacity of 7.2 ± 0.2 g U/kg adsorbent at a temperature of 30 °C and salinity of 35. This capacity is 12% greater than that observed for the AF1 adsorbent at BKI at the same temperature (30 °C) and a slightly higher salinity (35.7). In short, the marine testing data from Miami are in good agreement with observations obtained at PNNL.
Modelling Parameter U V Cu Fe Zn Recirculating Flume Saturation Capacity (g/kg adsorbent) 11 ± 0.9 17 ± 3.5 0.24 ± 0.03 2.6 ± 0.6 0.93 ± 0.09 56-day Adsorption Capacity (g/kg adsorbent) 6.8 ± 0.6 10 ± 2.1 0.17 ± 0.02 1.6 ± 0.3 0.92 ± 0.09 Half-saturation Time (days) 34 ± 6.5 38 ± 16 21 ± 7.6 39 ± 17 0.81 ± 1.9
Mini Braid Deployment Saturation Capacity (g/kg adsorbent) 12 ± 4 13 ± 4.3 56-day Adsorption Capacity (g/kg adsorbent) 4.8 ± 1.6 7.3 ± 2.4 Half-saturation Time (days) 77 ± 40 44 ± 27
PNNL-25734
21 | P a g e
Table 11. Comparison of 56-day uranium adsorption capacities with ORNL amidoxime-based adsorbents and half-saturation times for flume experiments conducted at Broad Key Island and at PNNL
PNNL Broad Key Island
Adsorbent
56-day Adsorption Capacity1
(g U/kg adsorbent)
Half Saturation
Time (days)
Average Temperature
(°C) Average Salinity
56-day Adsorption Capacity2
(g U/kg adsorbent)
Half Saturation
Time (days)
ORNL AF1 3.86 ± 0.18 22.8 ± 1.0 30.1 ± 0.7 35.7 ± 0.9 6.35 ± 0.10 25 ± 1.0 ORNL AI8 3.54 ± 0.17 25.8 ± 2.1 26.6 ± 1.4 35.9 ± 0.7 5.96 ± 0.24 21 ± 2.2 ORNL AF8 26.6 ± 1.4 35.9 ± 0.7 4.43 ± 0.81 51 ± 17 ORNL AF1-AO-DMSO 5.04 ± 0.16 18 ± 1.6 30.6 ± 1.1 36.4 ± 0.7 6.56 ± 0.24 21 ± 2.2
1 Determined from one-site ligand saturation modelling of time series data obtained at a temperature of 20 °C, and normalized to a salinity of 35. 2 Determined from one-site ligand saturation modelling of time series data obtained at the ambient temperature and ambient salinity given in the table.
5.2 Elemental Composition on ORNL Adsorbents at BKI
Given in Figure 17 is the relative percentage of the major elements adsorbed on four different formulations of ORNL’s amidoxime-based adsorbents (AF1, AF8, AI8, and AF1-AO-DMSO) after a 56-day exposure at BKI. For comparison, the AF1 elemental distribution determined at PNNL in Sequim Bay seawater (based on 7 separate kinetic experiments) is also given (data taken from Kuo et al., 2016, Figure 8). Note that the PNNL elemental distribution was determined at 20 °C, while the exposures at BKI were determined at higher temperatures. Because the adsorption capacity of uranium is a function of temperature (higher exposure temperatures have higher uranium capacities), this explains why the uranium distribution levels at BKI are higher than at PNNL. At this time, we do not have information on the effect of temperature on the adsorption capacity of other elements adsorbed on the amidoxime-based adsorbent with which to compare with adsorption capacities at PNNL. While there are a few notable exceptions, in general, the relative percentage of the elemental distribution observed on all the adsorbents agrees well, including good agreement with the AF1 adsorbent exposed at PNNL.
The most notable exception to a uniform elemental distributional pattern across the various adsorbents occurs with vanadium (discussed below). Other notable exceptions include: (1) The AF8 adsorbent had elevated concentrations of vanadium and iron; (2) The AI8 and AF8 adsorbents have a higher % of Mn compared to that for the AF1 adsorbent. This could be due either to a higher affinity of the adsorbents for Mn or it could be due to the higher concentration of Mn observed during the AI8 and AF8 exposure period (see Table 3).
PNNL-25734
22 | P a g e
5.2.1 Vanadium
The relative percentage for vanadium on the ORNl adsorbents tested ranged from a minimum of 13% for the AF8 formulation to a maximum of 29% for the AI8 formulation. If one assumes that calcium and magnesium are primarily associated with the monomer on the adsorbent, then vanadium is the element in highest mass abundance bound by the amidoxime ligand. Changes in the relative binding of vanadium can be inferred to also effect the selectivity for the other elements. Based on this argument, the vanadium to uranium mass ratio can be used as a proxy measure of the selectivity of the ligands on the adsorbent for the adsorption of uranium.
Illustrated in Figure 18 is the V/U mass ratio for the ORNL adsorbents and a new adsorbent produced by LCW technologies (LCW-10MSL). For the ORNL amidoxime-based adsorbents, the ratio varies from a low of 1.2 for the AF8 adsorbent to a high of 2.7 for the AI8 adsorbent at BKI. All the V/U mass ratios at BKI are lower than observed for the AF1 adsorbent at PNNL (3.0). Factors which may affect this V/U mass ratio include: (1) the effect of temperature on adsorption capacity; (2) variations in the concentration of uranium and/or vanadium in seawater; and (3) variations in the affinity of a specific adsorbent for an element.
At this time, we have minimal information on the effect of temperature on vanadium adsorption capacity, but preliminary evidence suggests that vanadium adsorption changes minimally due to temperature changes, compared to the strong response of uranium adsorption with temperature. Hence, one would expect that warmer exposures would favor a lower V/U mass ratio, which could explain why the V/U mass ratio for the PNNL exposures are higher than observed for the BKI exposures.
Uranium is considered a conservative element in seawater, which means its concentration is directly proportional to the salinity of seawater. Vanadium is considered a biogeochemically active element in seawater, which means that its concentration will vary temporally and spatially responding to various biogeochemical processes it is involved with. Average vanadium concentrations during the first three exposure periods were given in Table 3. The average concentrations of vanadium during the first and third exposure experiments (spring 2015 and 2016, respectively) were nearly identical to the long term average at PNNL (1.72 ± 0.22 µg/L). However, the average concentration observed during the second exposure period (7-3 to 9-24-2015) had a vanadium concentration (1.27 ± 0.15 µg/L) about 25% lower than the other two periods. The AF1 flume experiment was conducted during this low vanadium period, but it is not apparent that it affected the V/U mass ratio.
The LCW adsorbent, which is also amidoxime-based, had the lowest V/U mass ratio of any of the adsorbents tested to date (V/U = 0.66). This adsorbent tested at PNNL had V/U mass ratios of around 1.1 to 1.2, which were higher than observed at Miami, consistent with the other adsorbents. While we have not conducted any temperature experiments with the LCW
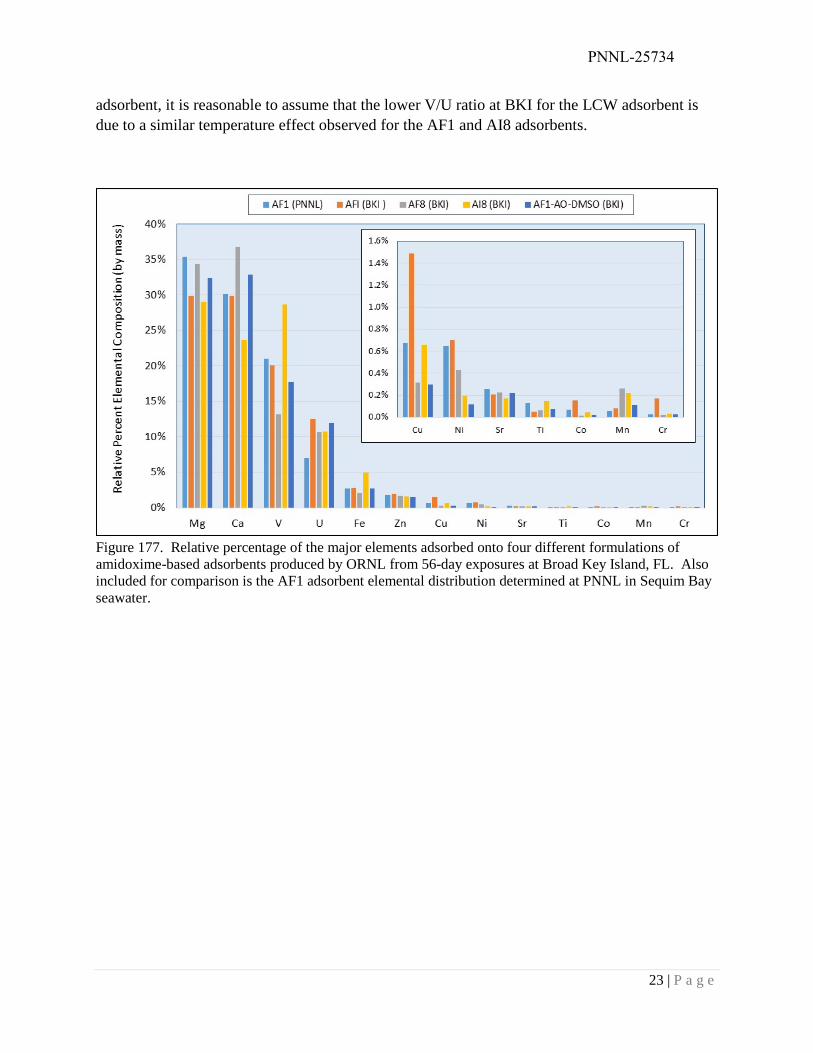
PNNL-25734
23 | P a g e
adsorbent, it is reasonable to assume that the lower V/U ratio at BKI for the LCW adsorbent is due to a similar temperature effect observed for the AF1 and AI8 adsorbents.
Figure 177. Relative percentage of the major elements adsorbed onto four different formulations of amidoxime-based adsorbents produced by ORNL from 56-day exposures at Broad Key Island, FL. Also included for comparison is the AF1 adsorbent elemental distribution determined at PNNL in Sequim Bay seawater.
PNNL-25734
24 | P a g e
Figure 188. Vanadium to uranium mass ratio for five formulations of amidoxime-based adsorbent materials after 56-day day exposures at BKI. Also shown for comparison is the V/U ratio for the AF1 adsorbent for a 56-day exposure at Sequim Bay, WA.
5.3 Assessment of biofouling Impacts on adsorption capacity with the ORNL adsorbent AF1-AO-DMSO
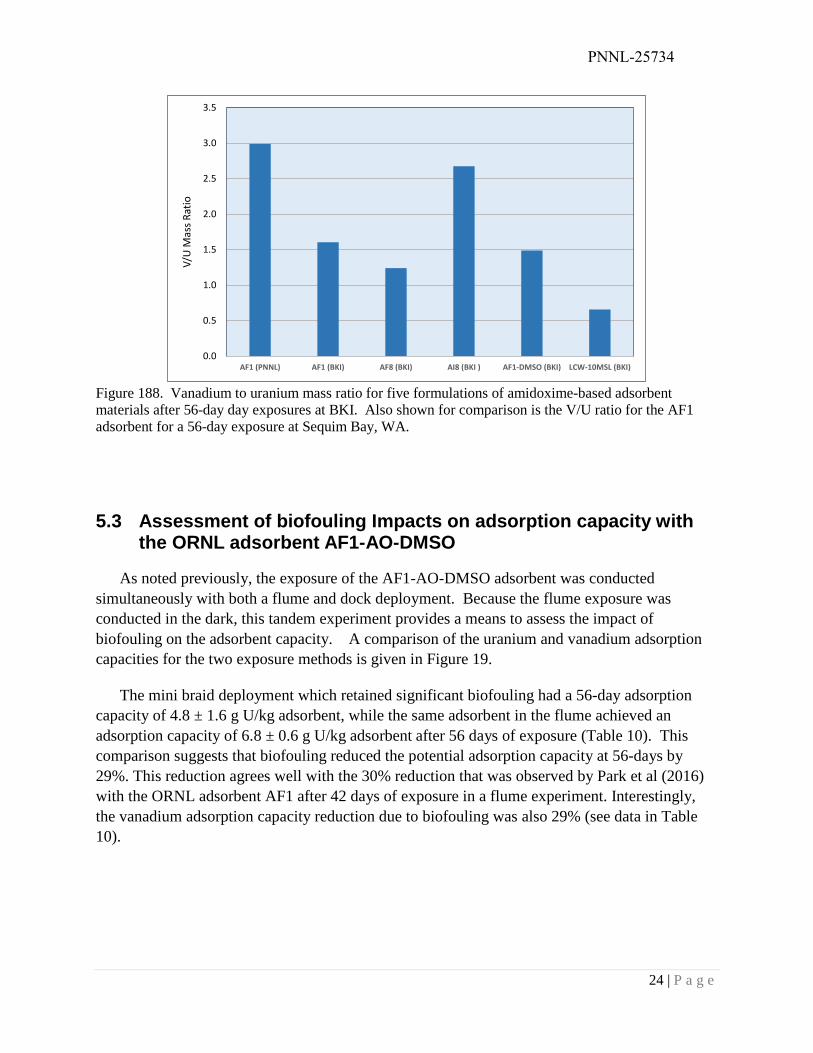
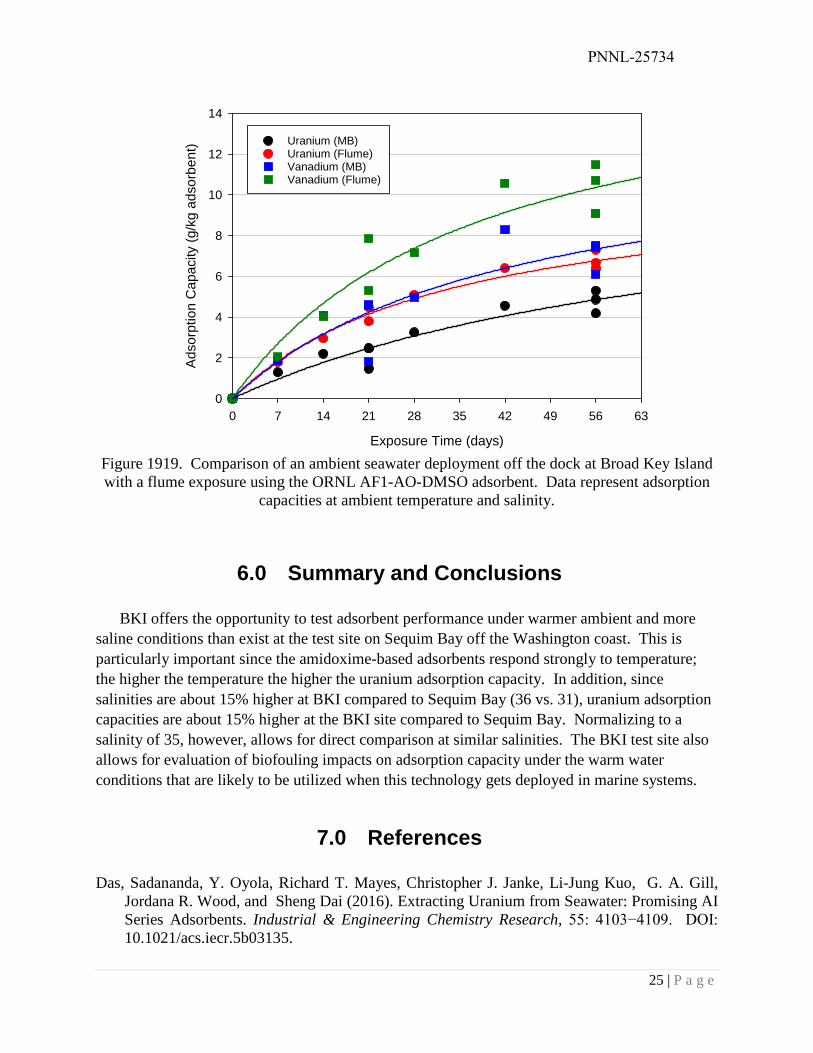
As noted previously, the exposure of the AF1-AO-DMSO adsorbent was conducted simultaneously with both a flume and dock deployment. Because the flume exposure was conducted in the dark, this tandem experiment provides a means to assess the impact of biofouling on the adsorbent capacity. A comparison of the uranium and vanadium adsorption capacities for the two exposure methods is given in Figure 19.
The mini braid deployment which retained significant biofouling had a 56-day adsorption capacity of 4.8 ± 1.6 g U/kg adsorbent, while the same adsorbent in the flume achieved an adsorption capacity of 6.8 ± 0.6 g U/kg adsorbent after 56 days of exposure (Table 10). This comparison suggests that biofouling reduced the potential adsorption capacity at 56-days by 29%. This reduction agrees well with the 30% reduction that was observed by Park et al (2016) with the ORNL adsorbent AF1 after 42 days of exposure in a flume experiment. Interestingly, the vanadium adsorption capacity reduction due to biofouling was also 29% (see data in Table 10).
0.0
0.5
1.0
1.5
2.0
2.5
3.0
3.5
AF1 (PNNL) AF1 (BKI) AF8 (BKI) AI8 (BKI ) AF1-DMSO (BKI) LCW-10MSL (BKI)
V/U
Mas
s Rat
io
PNNL-25734
25 | P a g e
Figure 1919. Comparison of an ambient seawater deployment off the dock at Broad Key Island with a flume exposure using the ORNL AF1-AO-DMSO adsorbent. Data represent adsorption
capacities at ambient temperature and salinity.
6.0 Summary and Conclusions
BKI offers the opportunity to test adsorbent performance under warmer ambient and more saline conditions than exist at the test site on Sequim Bay off the Washington coast. This is particularly important since the amidoxime-based adsorbents respond strongly to temperature; the higher the temperature the higher the uranium adsorption capacity. In addition, since salinities are about 15% higher at BKI compared to Sequim Bay (36 vs. 31), uranium adsorption capacities are about 15% higher at the BKI site compared to Sequim Bay. Normalizing to a salinity of 35, however, allows for direct comparison at similar salinities. The BKI test site also allows for evaluation of biofouling impacts on adsorption capacity under the warm water conditions that are likely to be utilized when this technology gets deployed in marine systems.
7.0 References
Das, Sadananda, Y. Oyola, Richard T. Mayes, Christopher J. Janke, Li-Jung Kuo, G. A. Gill, Jordana R. Wood, and Sheng Dai (2016). Extracting Uranium from Seawater: Promising AI Series Adsorbents. Industrial & Engineering Chemistry Research, 55: 4103−4109. DOI: 10.1021/acs.iecr.5b03135.
Exposure Time (days)
0 7 14 21 28 35 42 49 56 63
Ads
orpt
ion
Cap
acity
(g/k
g ad
sorb
ent)
0
2
4
6
8
10
12
14
Uranium (MB)Uranium (Flume)Vanadium (MB)Vanadium (Flume)
PNNL-25734
26 | P a g e
Das, Sadananda; Y. Oyola, Richard T. Mayes, Christopher J. Janke, Li-Jung Kuo, G. A. Gill, Jordana R. Wood, and Sheng Dai (2016). Extracting Uranium from Seawater: Promising AF Series Adsorbents. Industrial & Engineering Chemistry Research, 55: 4110−4117. DOI: 10.1021/acs.iecr.5b03136.
DOE (2010). Nuclear Energy Research and Development Roadmap: Report to Congress; U.S. Department of Energy: Washington, D. C., 2010. Report available at: http://www.energy.gov/ne/downloads/nuclear-energy-research-and-development-roadmap
Gill, Gary A., Li-Jung Kuo, Chris J. Janke, Jordana R. Wood, Richard T. Mayes, Costas Tsouris, Yatsandra Oyola, Jonathan E. Strivens, Michael Cobb , George Bonheyo , Robert Jeters, Jiyeon Park, Tarang Khangaonkar, R. Shane Addleman, Wilaiwan Chouyyok, Marvin Warner , Sonja Peterson, David G. Abrecht, Sadananda Das, Ken Buesseler, Crystal Breier, Evan D'Alessandro, Horng-Bin Pan and Chien Wai (2016). The Uranium from Seawater Program at PNNL: Overview of Marine Testing, Adsorbent Characterization, Adsorbent Durability, Adsorbent Toxicity, and Deployment Studies. Industrial & Engineering Chemistry Research. 55: 4264-4277. DOI: 10.1021/acs.iecr.5b03649.
Kuo, Li-Jung, Christopher Janke, Jordana R. Wood, Jonathan E. Strivens, and Gary A. Gill (2016). Characterization and Testing of Amidoxime-Based Adsorbent Materials to Extract Uranium from Natural Seawater. Industrial & Engineering Chemistry Research, 55 (15), 4285–4293; DOI: 10.1021/acs.iecr.5b03267.
Park, Jiyeon, Gary A. Gill, Jonathan E. Strivens, Li-Jung Kuo, Robert T. Jeters, Andrew Avila, Jordana R. Wood, Nicholas J. Schlafer, Christopher J. Janke, Erin A. Miller, Matthew Thomas, R. Shane Addleman and George T. Bonheyo (2016). Effect of biofouling on the performance of amidoxime-based polymeric uranium adsorbents. Industrial & Engineering Chemistry Research, 55, 4328−4338, DOI: 10.1021/acs.iecr.5b03457.
Wood, Jordana, R., Gary A. Gill, Li-Jung Kuo, Jonathan E. Strivens and Key-Young Choe (2016). Comparison of Analytical Methods for the Determination of Uranium in Seawater using Inductively Coupled Plasma Mass Spectrometry. Industrial & Engineering Chemistry Research, 55: 4344−4350, DOI: 10.1021/acs.iecr.5b03680.

PNNL-25734
27 | P a g e
8.0 Appendix
Given in the following tables are the trace element data for time series adsorption capacity measurements of several ORNL adsorbents obtained during four experimental time periods at Broad Key Island, Florida.
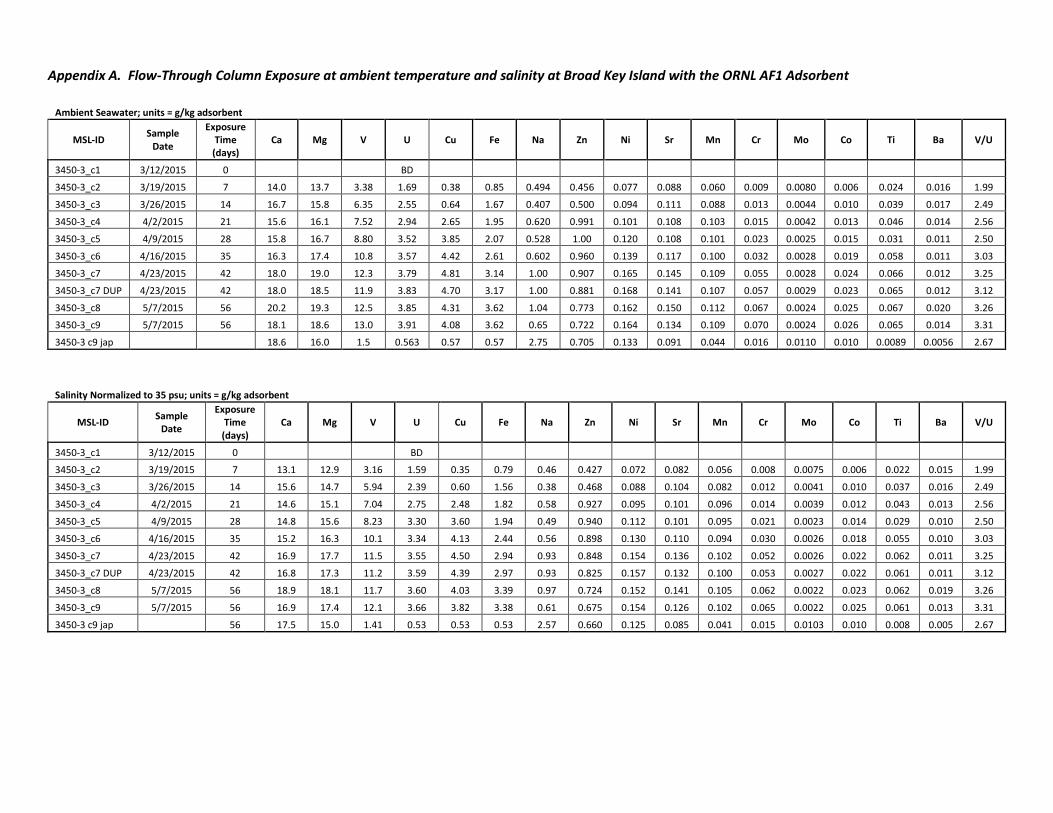
Appendix A. Flow-Through Column Exposure at ambient temperature and salinity at Broad Key Island with the ORNL AF1 Adsorbent
Ambient Seawater; units = g/kg adsorbent
MSL-ID Sample Date
Exposure Time (days)
Ca Mg V U Cu Fe Na Zn Ni Sr Mn Cr Mo Co Ti Ba V/U
3450-3_c1 3/12/2015 0 BD
3450-3_c2 3/19/2015 7 14.0 13.7 3.38 1.69 0.38 0.85 0.494 0.456 0.077 0.088 0.060 0.009 0.0080 0.006 0.024 0.016 1.99
3450-3_c3 3/26/2015 14 16.7 15.8 6.35 2.55 0.64 1.67 0.407 0.500 0.094 0.111 0.088 0.013 0.0044 0.010 0.039 0.017 2.49
3450-3_c4 4/2/2015 21 15.6 16.1 7.52 2.94 2.65 1.95 0.620 0.991 0.101 0.108 0.103 0.015 0.0042 0.013 0.046 0.014 2.56
3450-3_c5 4/9/2015 28 15.8 16.7 8.80 3.52 3.85 2.07 0.528 1.00 0.120 0.108 0.101 0.023 0.0025 0.015 0.031 0.011 2.50
3450-3_c6 4/16/2015 35 16.3 17.4 10.8 3.57 4.42 2.61 0.602 0.960 0.139 0.117 0.100 0.032 0.0028 0.019 0.058 0.011 3.03
3450-3_c7 4/23/2015 42 18.0 19.0 12.3 3.79 4.81 3.14 1.00 0.907 0.165 0.145 0.109 0.055 0.0028 0.024 0.066 0.012 3.25
3450-3_c7 DUP 4/23/2015 42 18.0 18.5 11.9 3.83 4.70 3.17 1.00 0.881 0.168 0.141 0.107 0.057 0.0029 0.023 0.065 0.012 3.12
3450-3_c8 5/7/2015 56 20.2 19.3 12.5 3.85 4.31 3.62 1.04 0.773 0.162 0.150 0.112 0.067 0.0024 0.025 0.067 0.020 3.26
3450-3_c9 5/7/2015 56 18.1 18.6 13.0 3.91 4.08 3.62 0.65 0.722 0.164 0.134 0.109 0.070 0.0024 0.026 0.065 0.014 3.31
3450-3 c9 jap 18.6 16.0 1.5 0.563 0.57 0.57 2.75 0.705 0.133 0.091 0.044 0.016 0.0110 0.010 0.0089 0.0056 2.67
Salinity Normalized to 35 psu; units = g/kg adsorbent
MSL-ID Sample Date
Exposure Time (days)
Ca Mg V U Cu Fe Na Zn Ni Sr Mn Cr Mo Co Ti Ba V/U
3450-3_c1 3/12/2015 0 BD
3450-3_c2 3/19/2015 7 13.1 12.9 3.16 1.59 0.35 0.79 0.46 0.427 0.072 0.082 0.056 0.008 0.0075 0.006 0.022 0.015 1.99
3450-3_c3 3/26/2015 14 15.6 14.7 5.94 2.39 0.60 1.56 0.38 0.468 0.088 0.104 0.082 0.012 0.0041 0.010 0.037 0.016 2.49
3450-3_c4 4/2/2015 21 14.6 15.1 7.04 2.75 2.48 1.82 0.58 0.927 0.095 0.101 0.096 0.014 0.0039 0.012 0.043 0.013 2.56
3450-3_c5 4/9/2015 28 14.8 15.6 8.23 3.30 3.60 1.94 0.49 0.940 0.112 0.101 0.095 0.021 0.0023 0.014 0.029 0.010 2.50
3450-3_c6 4/16/2015 35 15.2 16.3 10.1 3.34 4.13 2.44 0.56 0.898 0.130 0.110 0.094 0.030 0.0026 0.018 0.055 0.010 3.03
3450-3_c7 4/23/2015 42 16.9 17.7 11.5 3.55 4.50 2.94 0.93 0.848 0.154 0.136 0.102 0.052 0.0026 0.022 0.062 0.011 3.25
3450-3_c7 DUP 4/23/2015 42 16.8 17.3 11.2 3.59 4.39 2.97 0.93 0.825 0.157 0.132 0.100 0.053 0.0027 0.022 0.061 0.011 3.12
3450-3_c8 5/7/2015 56 18.9 18.1 11.7 3.60 4.03 3.39 0.97 0.724 0.152 0.141 0.105 0.062 0.0022 0.023 0.062 0.019 3.26
3450-3_c9 5/7/2015 56 16.9 17.4 12.1 3.66 3.82 3.38 0.61 0.675 0.154 0.126 0.102 0.065 0.0022 0.025 0.061 0.013 3.31
3450-3 c9 jap 56 17.5 15.0 1.41 0.53 0.53 0.53 2.57 0.660 0.125 0.085 0.041 0.015 0.0103 0.010 0.008 0.005 2.67
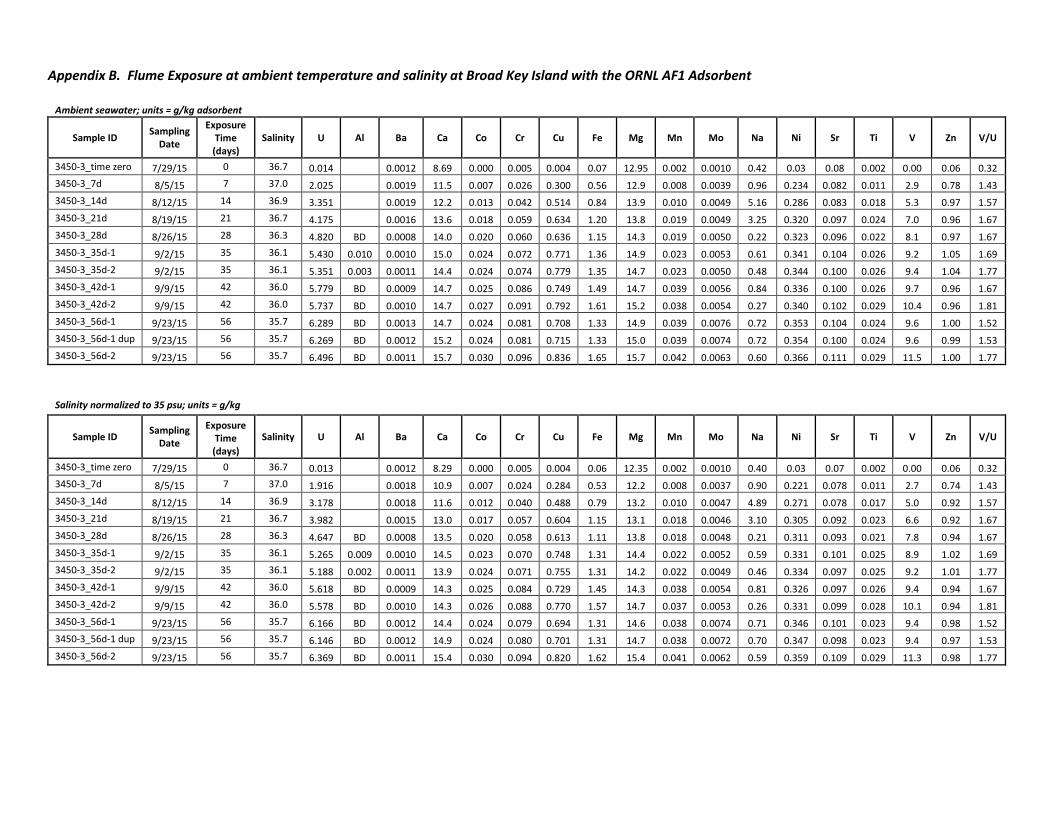
Appendix B. Flume Exposure at ambient temperature and salinity at Broad Key Island with the ORNL AF1 Adsorbent
Ambient seawater; units = g/kg adsorbent
Sample ID Sampling Date
Exposure Time (days)
Salinity U Al Ba Ca Co Cr Cu Fe Mg Mn Mo Na Ni Sr Ti V Zn V/U
3450-3_time zero 7/29/15 0 36.7 0.014 0.0012 8.69 0.000 0.005 0.004 0.07 12.95 0.002 0.0010 0.42 0.03 0.08 0.002 0.00 0.06 0.32 3450-3_7d 8/5/15 7 37.0 2.025 0.0019 11.5 0.007 0.026 0.300 0.56 12.9 0.008 0.0039 0.96 0.234 0.082 0.011 2.9 0.78 1.43 3450-3_14d 8/12/15 14 36.9 3.351 0.0019 12.2 0.013 0.042 0.514 0.84 13.9 0.010 0.0049 5.16 0.286 0.083 0.018 5.3 0.97 1.57 3450-3_21d 8/19/15 21 36.7 4.175 0.0016 13.6 0.018 0.059 0.634 1.20 13.8 0.019 0.0049 3.25 0.320 0.097 0.024 7.0 0.96 1.67 3450-3_28d 8/26/15 28 36.3 4.820 BD 0.0008 14.0 0.020 0.060 0.636 1.15 14.3 0.019 0.0050 0.22 0.323 0.096 0.022 8.1 0.97 1.67 3450-3_35d-1 9/2/15 35 36.1 5.430 0.010 0.0010 15.0 0.024 0.072 0.771 1.36 14.9 0.023 0.0053 0.61 0.341 0.104 0.026 9.2 1.05 1.69 3450-3_35d-2 9/2/15 35 36.1 5.351 0.003 0.0011 14.4 0.024 0.074 0.779 1.35 14.7 0.023 0.0050 0.48 0.344 0.100 0.026 9.4 1.04 1.77 3450-3_42d-1 9/9/15 42 36.0 5.779 BD 0.0009 14.7 0.025 0.086 0.749 1.49 14.7 0.039 0.0056 0.84 0.336 0.100 0.026 9.7 0.96 1.67 3450-3_42d-2 9/9/15 42 36.0 5.737 BD 0.0010 14.7 0.027 0.091 0.792 1.61 15.2 0.038 0.0054 0.27 0.340 0.102 0.029 10.4 0.96 1.81 3450-3_56d-1 9/23/15 56 35.7 6.289 BD 0.0013 14.7 0.024 0.081 0.708 1.33 14.9 0.039 0.0076 0.72 0.353 0.104 0.024 9.6 1.00 1.52 3450-3_56d-1 dup 9/23/15 56 35.7 6.269 BD 0.0012 15.2 0.024 0.081 0.715 1.33 15.0 0.039 0.0074 0.72 0.354 0.100 0.024 9.6 0.99 1.53 3450-3_56d-2 9/23/15 56 35.7 6.496 BD 0.0011 15.7 0.030 0.096 0.836 1.65 15.7 0.042 0.0063 0.60 0.366 0.111 0.029 11.5 1.00 1.77
Salinity normalized to 35 psu; units = g/kg
Sample ID Sampling Date
Exposure Time (days)
Salinity U Al Ba Ca Co Cr Cu Fe Mg Mn Mo Na Ni Sr Ti V Zn V/U
3450-3_time zero 7/29/15 0 36.7 0.013 0.0012 8.29 0.000 0.005 0.004 0.06 12.35 0.002 0.0010 0.40 0.03 0.07 0.002 0.00 0.06 0.32 3450-3_7d 8/5/15 7 37.0 1.916 0.0018 10.9 0.007 0.024 0.284 0.53 12.2 0.008 0.0037 0.90 0.221 0.078 0.011 2.7 0.74 1.43 3450-3_14d 8/12/15 14 36.9 3.178 0.0018 11.6 0.012 0.040 0.488 0.79 13.2 0.010 0.0047 4.89 0.271 0.078 0.017 5.0 0.92 1.57 3450-3_21d 8/19/15 21 36.7 3.982 0.0015 13.0 0.017 0.057 0.604 1.15 13.1 0.018 0.0046 3.10 0.305 0.092 0.023 6.6 0.92 1.67 3450-3_28d 8/26/15 28 36.3 4.647 BD 0.0008 13.5 0.020 0.058 0.613 1.11 13.8 0.018 0.0048 0.21 0.311 0.093 0.021 7.8 0.94 1.67 3450-3_35d-1 9/2/15 35 36.1 5.265 0.009 0.0010 14.5 0.023 0.070 0.748 1.31 14.4 0.022 0.0052 0.59 0.331 0.101 0.025 8.9 1.02 1.69 3450-3_35d-2 9/2/15 35 36.1 5.188 0.002 0.0011 13.9 0.024 0.071 0.755 1.31 14.2 0.022 0.0049 0.46 0.334 0.097 0.025 9.2 1.01 1.77 3450-3_42d-1 9/9/15 42 36.0 5.618 BD 0.0009 14.3 0.025 0.084 0.729 1.45 14.3 0.038 0.0054 0.81 0.326 0.097 0.026 9.4 0.94 1.67 3450-3_42d-2 9/9/15 42 36.0 5.578 BD 0.0010 14.3 0.026 0.088 0.770 1.57 14.7 0.037 0.0053 0.26 0.331 0.099 0.028 10.1 0.94 1.81 3450-3_56d-1 9/23/15 56 35.7 6.166 BD 0.0012 14.4 0.024 0.079 0.694 1.31 14.6 0.038 0.0074 0.71 0.346 0.101 0.023 9.4 0.98 1.52 3450-3_56d-1 dup 9/23/15 56 35.7 6.146 BD 0.0012 14.9 0.024 0.080 0.701 1.31 14.7 0.038 0.0072 0.70 0.347 0.098 0.023 9.4 0.97 1.53 3450-3_56d-2 9/23/15 56 35.7 6.369 BD 0.0011 15.4 0.030 0.094 0.820 1.62 15.4 0.041 0.0062 0.59 0.359 0.109 0.029 11.3 0.98 1.77
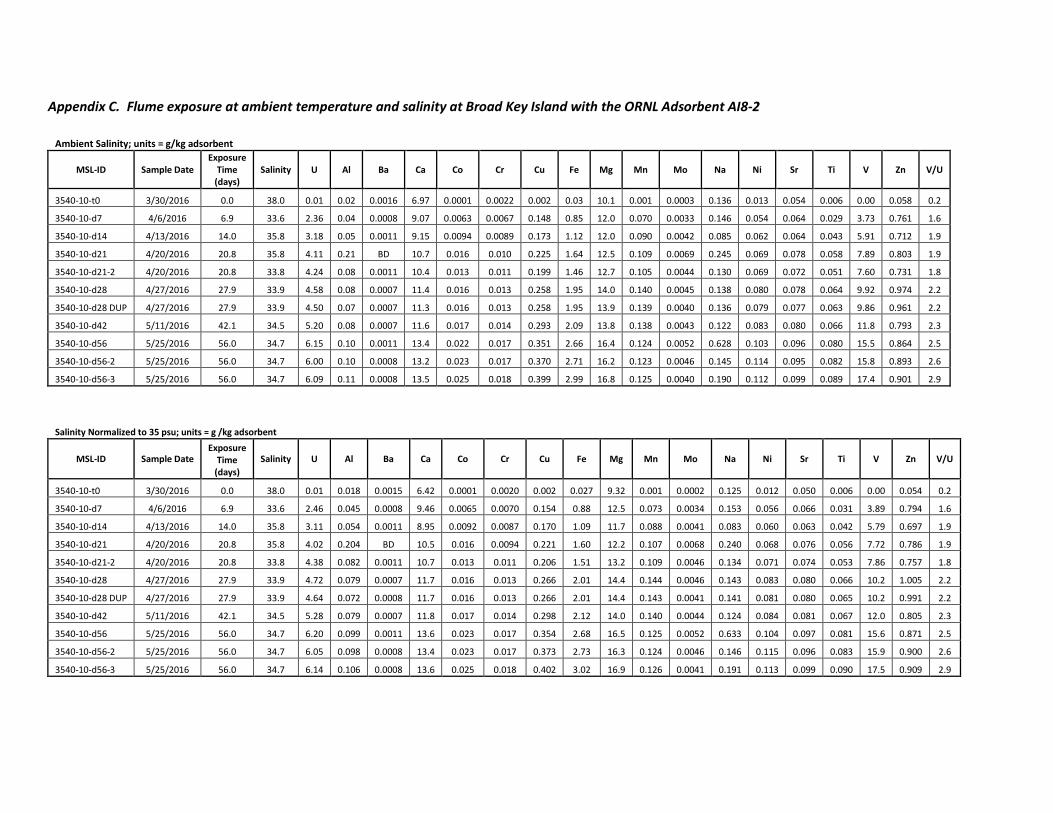
Appendix C. Flume exposure at ambient temperature and salinity at Broad Key Island with the ORNL Adsorbent AI8-2
Ambient Salinity; units = g/kg adsorbent
MSL-ID Sample Date Exposure
Time (days)
Salinity U Al Ba Ca Co Cr Cu Fe Mg Mn Mo Na Ni Sr Ti V Zn V/U
3540-10-t0 3/30/2016 0.0 38.0 0.01 0.02 0.0016 6.97 0.0001 0.0022 0.002 0.03 10.1 0.001 0.0003 0.136 0.013 0.054 0.006 0.00 0.058 0.2
3540-10-d7 4/6/2016 6.9 33.6 2.36 0.04 0.0008 9.07 0.0063 0.0067 0.148 0.85 12.0 0.070 0.0033 0.146 0.054 0.064 0.029 3.73 0.761 1.6
3540-10-d14 4/13/2016 14.0 35.8 3.18 0.05 0.0011 9.15 0.0094 0.0089 0.173 1.12 12.0 0.090 0.0042 0.085 0.062 0.064 0.043 5.91 0.712 1.9
3540-10-d21 4/20/2016 20.8 35.8 4.11 0.21 BD 10.7 0.016 0.010 0.225 1.64 12.5 0.109 0.0069 0.245 0.069 0.078 0.058 7.89 0.803 1.9
3540-10-d21-2 4/20/2016 20.8 33.8 4.24 0.08 0.0011 10.4 0.013 0.011 0.199 1.46 12.7 0.105 0.0044 0.130 0.069 0.072 0.051 7.60 0.731 1.8
3540-10-d28 4/27/2016 27.9 33.9 4.58 0.08 0.0007 11.4 0.016 0.013 0.258 1.95 14.0 0.140 0.0045 0.138 0.080 0.078 0.064 9.92 0.974 2.2
3540-10-d28 DUP 4/27/2016 27.9 33.9 4.50 0.07 0.0007 11.3 0.016 0.013 0.258 1.95 13.9 0.139 0.0040 0.136 0.079 0.077 0.063 9.86 0.961 2.2
3540-10-d42 5/11/2016 42.1 34.5 5.20 0.08 0.0007 11.6 0.017 0.014 0.293 2.09 13.8 0.138 0.0043 0.122 0.083 0.080 0.066 11.8 0.793 2.3
3540-10-d56 5/25/2016 56.0 34.7 6.15 0.10 0.0011 13.4 0.022 0.017 0.351 2.66 16.4 0.124 0.0052 0.628 0.103 0.096 0.080 15.5 0.864 2.5
3540-10-d56-2 5/25/2016 56.0 34.7 6.00 0.10 0.0008 13.2 0.023 0.017 0.370 2.71 16.2 0.123 0.0046 0.145 0.114 0.095 0.082 15.8 0.893 2.6
3540-10-d56-3 5/25/2016 56.0 34.7 6.09 0.11 0.0008 13.5 0.025 0.018 0.399 2.99 16.8 0.125 0.0040 0.190 0.112 0.099 0.089 17.4 0.901 2.9
Salinity Normalized to 35 psu; units = g /kg adsorbent
MSL-ID Sample Date Exposure
Time (days)
Salinity U Al Ba Ca Co Cr Cu Fe Mg Mn Mo Na Ni Sr Ti V Zn V/U
3540-10-t0 3/30/2016 0.0 38.0 0.01 0.018 0.0015 6.42 0.0001 0.0020 0.002 0.027 9.32 0.001 0.0002 0.125 0.012 0.050 0.006 0.00 0.054 0.2
3540-10-d7 4/6/2016 6.9 33.6 2.46 0.045 0.0008 9.46 0.0065 0.0070 0.154 0.88 12.5 0.073 0.0034 0.153 0.056 0.066 0.031 3.89 0.794 1.6
3540-10-d14 4/13/2016 14.0 35.8 3.11 0.054 0.0011 8.95 0.0092 0.0087 0.170 1.09 11.7 0.088 0.0041 0.083 0.060 0.063 0.042 5.79 0.697 1.9
3540-10-d21 4/20/2016 20.8 35.8 4.02 0.204 BD 10.5 0.016 0.0094 0.221 1.60 12.2 0.107 0.0068 0.240 0.068 0.076 0.056 7.72 0.786 1.9
3540-10-d21-2 4/20/2016 20.8 33.8 4.38 0.082 0.0011 10.7 0.013 0.011 0.206 1.51 13.2 0.109 0.0046 0.134 0.071 0.074 0.053 7.86 0.757 1.8
3540-10-d28 4/27/2016 27.9 33.9 4.72 0.079 0.0007 11.7 0.016 0.013 0.266 2.01 14.4 0.144 0.0046 0.143 0.083 0.080 0.066 10.2 1.005 2.2
3540-10-d28 DUP 4/27/2016 27.9 33.9 4.64 0.072 0.0008 11.7 0.016 0.013 0.266 2.01 14.4 0.143 0.0041 0.141 0.081 0.080 0.065 10.2 0.991 2.2
3540-10-d42 5/11/2016 42.1 34.5 5.28 0.079 0.0007 11.8 0.017 0.014 0.298 2.12 14.0 0.140 0.0044 0.124 0.084 0.081 0.067 12.0 0.805 2.3
3540-10-d56 5/25/2016 56.0 34.7 6.20 0.099 0.0011 13.6 0.023 0.017 0.354 2.68 16.5 0.125 0.0052 0.633 0.104 0.097 0.081 15.6 0.871 2.5
3540-10-d56-2 5/25/2016 56.0 34.7 6.05 0.098 0.0008 13.4 0.023 0.017 0.373 2.73 16.3 0.124 0.0046 0.146 0.115 0.096 0.083 15.9 0.900 2.6
3540-10-d56-3 5/25/2016 56.0 34.7 6.14 0.106 0.0008 13.6 0.025 0.018 0.402 3.02 16.9 0.126 0.0041 0.191 0.113 0.099 0.090 17.5 0.909 2.9
Appendix D. Flume Exposure at ambient temperature and salinity at Broad Key Island with the ORNL Adsorbent AF8
Ambient Salinity; units = g/kg adsorbent
MSL-ID Sample Date
Exposure Time (days)
Salinity U Al Ba Ca Co Cr Cu Fe Mg Mn Mo Na Ni Sr Ti V Zn V/U
3540-24-t0 3/30/2016 0.0 38.0 BD 0.017 0.0019 9.34 0.0002 0.0013 0.002 0.019 12.7 0.001 0.0000 1.39 0.008 0.080 0.001 0.00 0.07
3540-24-d7 4/6/2016 6.9 33.6 1.38 0.028 0.0016 11.2 0.0027 0.0036 0.063 0.321 13.4 0.057 0.0042 0.75 0.031 0.079 0.011 1.53 0.42 1.11
3540-24-d14 4/13/2016 14.0 35.8 2.09 0.034 0.0015 11.9 0.0041 0.0047 0.067 0.420 12.7 0.069 0.0056 1.51 0.036 0.080 0.015 2.25 0.41 1.08
3540-24-d21 4/20/2016 20.8 35.8 2.43 0.071 0.0017 12.7 0.0044 0.0055 0.076 0.514 13.1 0.085 0.0072 0.95 0.039 0.085 0.018 2.76 0.49 1.14
3540-24-d21-2 4/20/2016 20.8 33.8 1.95 0.054 0.0013 13.0 0.0035 0.0061 0.057 0.397 13.0 0.063 0.0081 1.52 0.032 0.082 0.014 2.13 0.36 1.09
3540-24-d28 4/27/2016 27.9 33.9 2.77 0.048 0.0016 13.1 0.0046 0.0063 0.085 0.567 12.6 0.103 0.0073 0.28 0.043 0.087 0.020 3.22 0.59 1.16
3540-24-d42 5/11/2016 42.1 33.9 4.25 0.053 0.0014 14.4 0.0091 0.0092 0.148 1.056 14.4 0.126 0.0072 0.74 0.062 0.093 0.032 6.38 0.76 1.50
3540-24-d56 5/25/2016 55.9 34.5 4.06 0.042 0.0014 14.6 0.0063 0.0080 0.119 0.755 13.7 0.098 0.0097 1.69 0.057 0.092 0.022 5.05 0.68 1.25
3540-24-d56-2 5/25/2016 55.9 34.7 4.60 0.046 0.0012 15.6 0.0074 0.0091 0.142 0.918 14.4 0.119 0.0085 1.23 0.063 0.095 0.027 5.68 0.72 1.23
3540-24-d56-3 5/25/2016 55.9 34.7 4.51 0.040 0.0016 15.4 0.0071 0.0083 0.130 0.831 14.6 0.109 0.0103 1.34 0.058 0.095 0.024 5.62 0.73 1.25
Salinity Normalized to 35 psu; units = g /kg adsorbent
MSL-ID Sample Date
Exposure Time (days)
Salinity U Al Ba Ca Co Cr Cu Fe Mg Mn Mo Na Ni Sr Ti V Zn V/U
3540-24-t0 3/30/2016 0.0 38.0 BD 0.015 0.0017 8.61 0.0002 0.0012 0.002 0.018 11.7 0.001 0.0000 1.28 0.007 0.074 0.001 0.00 0.07
3540-24-d7 4/6/2016 6.9 33.6 1.44 0.029 0.0016 11.7 0.0029 0.0038 0.065 0.335 14.0 0.060 0.0044 0.78 0.032 0.082 0.012 1.60 0.44 1.11
3540-24-d14 4/13/2016 14.0 35.8 2.04 0.033 0.0015 11.6 0.0040 0.0046 0.065 0.411 12.4 0.067 0.0055 1.48 0.035 0.078 0.015 2.20 0.40 1.08
3540-24-d21 4/20/2016 20.8 35.8 2.38 0.069 0.0016 12.5 0.0043 0.0054 0.074 0.503 12.8 0.084 0.0070 0.93 0.038 0.083 0.018 2.71 0.48 1.14
3540-24-d21-2 4/20/2016 20.8 33.8 2.02 0.056 0.0013 13.4 0.0036 0.0064 0.059 0.411 13.5 0.065 0.0084 1.57 0.033 0.085 0.014 2.20 0.37 1.09
3540-24-d28 4/27/2016 27.9 33.9 2.86 0.049 0.0017 13.5 0.0048 0.0065 0.087 0.585 13.0 0.106 0.0076 0.29 0.044 0.089 0.020 3.32 0.61 1.16
3540-24-d42 5/11/2016 42.1 33.9 4.38 0.054 0.0014 14.8 0.0094 0.0095 0.153 1.089 14.8 0.130 0.0075 0.76 0.064 0.096 0.033 6.58 0.78 1.50
3540-24-d56 5/25/2016 55.9 34.5 4.12 0.042 0.0014 14.8 0.0064 0.0081 0.120 0.767 13.9 0.100 0.0098 1.71 0.058 0.093 0.022 5.13 0.69 1.25
3540-24-d56-2 5/25/2016 55.9 34.7 4.64 0.046 0.0013 15.8 0.0075 0.0091 0.143 0.926 14.5 0.120 0.0085 1.24 0.063 0.096 0.028 5.73 0.73 1.23
3540-24-d56-3 5/25/2016 55.9 34.7 4.55 0.041 0.0016 15.5 0.0072 0.0083 0.131 0.838 14.7 0.110 0.0104 1.35 0.059 0.095 0.024 5.67 0.74 1.25
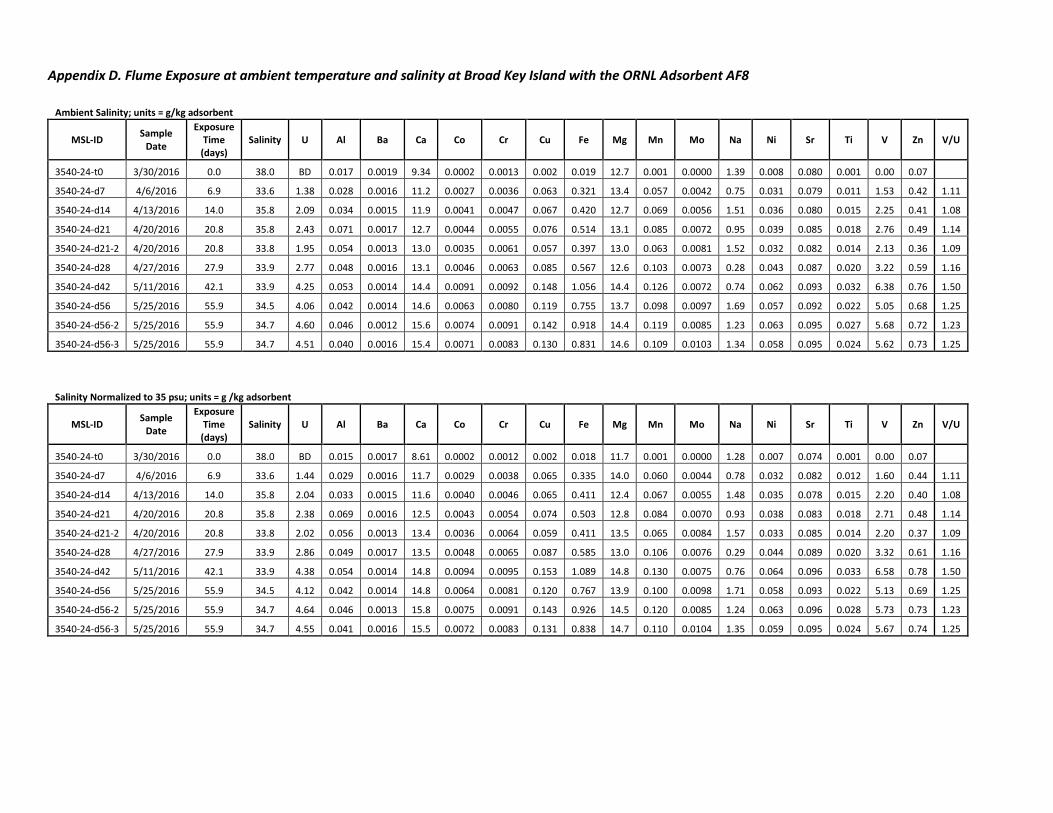
Appendix E. Mini Braid deployment of the dock at Broad Key Island with the ORNL adsorbent AF8
Ambient Salinity; units = g/kg adsorbent
MSL-ID Sample Date
Duration (days) Salinity U Al Ba Ca Co Cr Cu Fe Mg Mn Mo Na Ni Sr Ti V Zn V/U
AF8 (3540-1MB1) 3/29/2016 0.0 38.0 0.004 0.010 0.003 11.1 0.001 0.002 0.002 0.03 13.1 0.00 0.001 0.62 0.01 0.09 0.007 0.00 0.10 0.30
AF8 (3540-1MB2) 4/6/2016 7.7 33.6 2.60 0.17 0.005 48 0.008 0.011 0.058 2.44 17.3 0.28 0.006 0.38 0.07 0.53 0.051 4.07 0.23 1.57
AF8 (3540-1MB3) 4/13/2016 14.9 35.8 3.64 0.57 0.011 154 0.012 0.017 0.082 3.68 20.9 0.49 0.008 0.98 0.09 1.93 0.073 6.28 0.23 1.73
AF8 (3540-1MB4) 4/20/2016 21.7 35.8 3.36 0.43 0.009 106 0.011 0.016 0.091 3.29 19.6 0.56 0.009 0.60 0.08 1.30 0.067 5.84 0.23 1.74
AF8 (3540-1MB8) 4/20/2016 21.7 33.8 4.76 0.61 0.013 162 0.014 0.021 0.121 4.41 25.2 0.72 0.013 0.94 0.11 1.99 0.085 7.62 0.31 1.60
AF8 (3540-1MB5) 4/27/2016 28.7 33.9 5.69 0.65 0.012 160 0.021 0.028 0.166 6.05 24.1 1.04 0.014 1.46 0.13 1.97 0.116 10.8 0.46 1.90
AF8 (3540-1MB6) 5/11/2016 42.9 33.9 6.47 0.93 0.017 239 0.028 0.035 0.210 8.12 31.7 1.57 0.013 2.74 0.16 2.87 0.148 14.9 0.45 2.31
AF8 (3540-1MB7) 5/25/2016 56.7 34.5 8.39 1.19 0.022 333 0.027 0.043 0.261 8.45 36.2 1.73 0.017 2.47 0.16 4.23 0.154 15.5 0.66 1.85
AF8 (3540-1MB9) 5/25/2016 56.7 34.7 8.04 0.98 0.023 314 0.030 0.041 0.271 9.15 35.7 1.93 0.010 2.53 0.16 3.79 0.162 17.1 0.54 2.13
AF8 (3540-1MB10) 5/25/2016 56.7 34.7 7.64 0.71 0.016 203 0.021 0.033 0.207 6.71 26.5 1.57 0.014 1.81 0.13 2.62 0.119 12.3 0.41 1.61 AF8 (3540-1MB10) DUP 5/25/2016 56.7 34.7 7.60 0.76 0.016 203 0.022 0.034 0.212 6.74 26.8 1.57 0.015 1.81 0.13 2.61 0.121 12.3 0.42 1.61
exclude from time series
Normalized to Salinity = 35; units = g/kg adsorbent
MSL-ID Sample Date
Duration (days) Salinity U Al Ba Ca Co Cr Cu Fe Mg Mn Mo Na Ni Sr Ti V Zn V/U
AF8 (3540-1MB1) 3/29/2016 0.0 38.0 0.004 0.010 0.003 11.1 0.0005 0.002 0.002 0.032 12.1 0.00
3 0.0005 0.571 0.013 0.079 0.007 0.001 0.090 0.30
AF8 (3540-1MB2) 4/6/2016 7.7 33.6 2.71 0.18 0.005 50.3 0.009 0.012 0.06 2.54 18.1 0.29 0.006 0.40 0.078 0.55 0.053 4.25 0.24 1.57
AF8 (3540-1MB3) 4/13/2016 14.9 35.8 3.56 0.56 0.010 150 0.012 0.017 0.08 3.60 20.5 0.48 0.008 0.96 0.088 1.88 0.071 6.15 0.22 1.73
AF8 (3540-1MB4) 4/20/2016 21.7 35.8 3.29 0.42 0.009 103 0.011 0.016 0.09 3.22 19.1 0.55 0.009 0.58 0.082 1.28 0.065 5.71 0.22 1.74
AF8 (3540-1MB8) 4/20/2016 21.7 33.8 4.92 0.63 0.013 167 0.015 0.022 0.13 4.56 26.1 0.74 0.013 0.97 0.11 2.06 0.088 7.88 0.32 1.60
AF8 (3540-1MB5) 4/27/2016 28.7 33.9 5.87 0.67 0.012 165 0.021 0.029 0.17 6.24 24.8 1.07 0.015 1.50 0.14 2.03 0.12 11.2 0.48 1.90
AF8 (3540-1MB6) 5/11/2016 42.9 33.9 6.68 0.95 0.017 246 0.029 0.036 0.22 8.38 32.7 1.62 0.014 2.82 0.16 2.96 0.15 15.4 0.46 2.31
AF8 (3540-1MB7) 5/25/2016 56.7 34.5 8.51 1.21 0.023 338 0.027 0.043 0.27 8.58 36.7 1.75 0.017 2.51 0.16 4.30 0.16 15.7 0.67 1.85
AF8 (3540-1MB9) 5/25/2016 56.7 34.7 8.10 0.99 0.023 317 0.030 0.041 0.27 9.22 36.0 1.95 0.011 2.56 0.16 3.82 0.16 17.2 0.55 2.13
AF8 (3540-1MB10) 5/25/2016 56.7 34.7 7.70 0.72 0.016 204 0.021 0.034 0.21 6.77 26.7 1.58 0.014 1.83 0.13 2.64 0.12 12.4 0.42 1.61 AF8 (3540-1MB10)
DUP 5/25/2016 56.7 34.7 7.66 0.77 0.016 204 0.022 0.035 0.21 6.79 27.0 1.59 0.015 1.83 0.14 2.63 0.12 12.4 0.43 1.61
exclude from time series
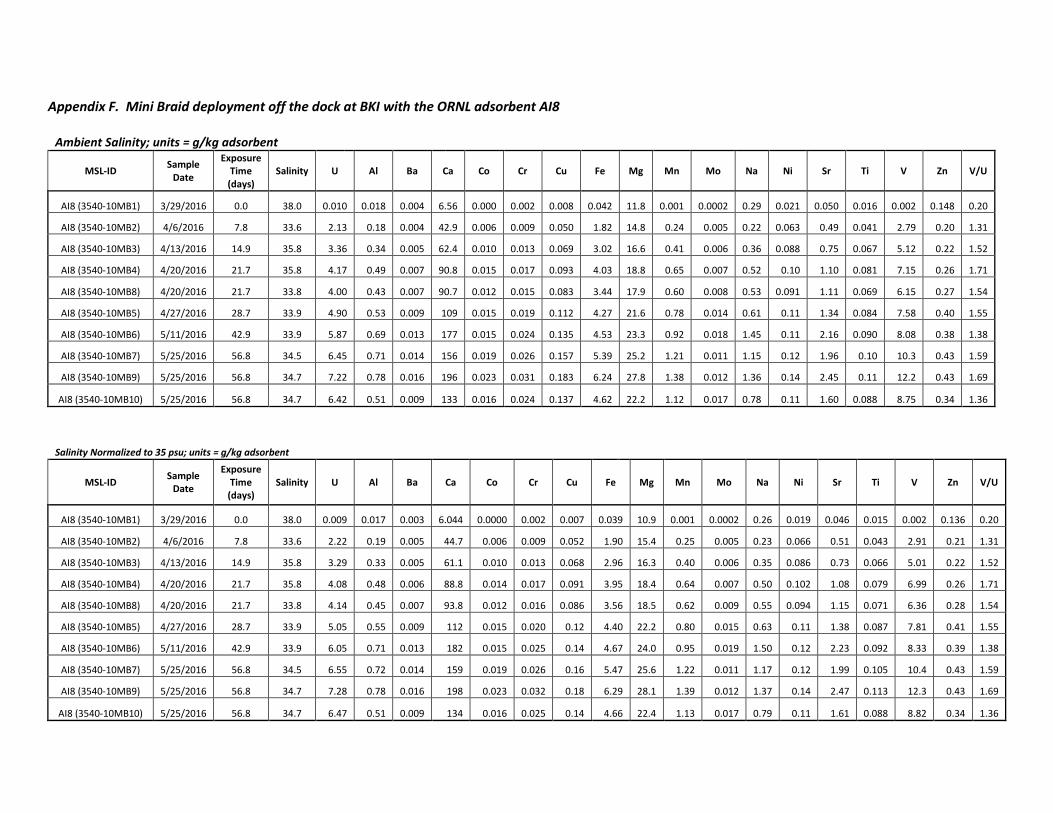
Appendix F. Mini Braid deployment off the dock at BKI with the ORNL adsorbent AI8
Ambient Salinity; units = g/kg adsorbent
MSL-ID Sample Date
Exposure Time (days)
Salinity U Al Ba Ca Co Cr Cu Fe Mg Mn Mo Na Ni Sr Ti V Zn V/U
AI8 (3540-10MB1) 3/29/2016 0.0 38.0 0.010 0.018 0.004 6.56 0.000 0.002 0.008 0.042 11.8 0.001 0.0002 0.29 0.021 0.050 0.016 0.002 0.148 0.20
AI8 (3540-10MB2) 4/6/2016 7.8 33.6 2.13 0.18 0.004 42.9 0.006 0.009 0.050 1.82 14.8 0.24 0.005 0.22 0.063 0.49 0.041 2.79 0.20 1.31
AI8 (3540-10MB3) 4/13/2016 14.9 35.8 3.36 0.34 0.005 62.4 0.010 0.013 0.069 3.02 16.6 0.41 0.006 0.36 0.088 0.75 0.067 5.12 0.22 1.52
AI8 (3540-10MB4) 4/20/2016 21.7 35.8 4.17 0.49 0.007 90.8 0.015 0.017 0.093 4.03 18.8 0.65 0.007 0.52 0.10 1.10 0.081 7.15 0.26 1.71
AI8 (3540-10MB8) 4/20/2016 21.7 33.8 4.00 0.43 0.007 90.7 0.012 0.015 0.083 3.44 17.9 0.60 0.008 0.53 0.091 1.11 0.069 6.15 0.27 1.54
AI8 (3540-10MB5) 4/27/2016 28.7 33.9 4.90 0.53 0.009 109 0.015 0.019 0.112 4.27 21.6 0.78 0.014 0.61 0.11 1.34 0.084 7.58 0.40 1.55
AI8 (3540-10MB6) 5/11/2016 42.9 33.9 5.87 0.69 0.013 177 0.015 0.024 0.135 4.53 23.3 0.92 0.018 1.45 0.11 2.16 0.090 8.08 0.38 1.38
AI8 (3540-10MB7) 5/25/2016 56.8 34.5 6.45 0.71 0.014 156 0.019 0.026 0.157 5.39 25.2 1.21 0.011 1.15 0.12 1.96 0.10 10.3 0.43 1.59
AI8 (3540-10MB9) 5/25/2016 56.8 34.7 7.22 0.78 0.016 196 0.023 0.031 0.183 6.24 27.8 1.38 0.012 1.36 0.14 2.45 0.11 12.2 0.43 1.69
AI8 (3540-10MB10) 5/25/2016 56.8 34.7 6.42 0.51 0.009 133 0.016 0.024 0.137 4.62 22.2 1.12 0.017 0.78 0.11 1.60 0.088 8.75 0.34 1.36
Salinity Normalized to 35 psu; units = g/kg adsorbent
MSL-ID Sample Date
Exposure Time (days)
Salinity U Al Ba Ca Co Cr Cu Fe Mg Mn Mo Na Ni Sr Ti V Zn V/U
AI8 (3540-10MB1) 3/29/2016 0.0 38.0 0.009 0.017 0.003 6.044 0.0000 0.002 0.007 0.039 10.9 0.001 0.0002 0.26 0.019 0.046 0.015 0.002 0.136 0.20
AI8 (3540-10MB2) 4/6/2016 7.8 33.6 2.22 0.19 0.005 44.7 0.006 0.009 0.052 1.90 15.4 0.25 0.005 0.23 0.066 0.51 0.043 2.91 0.21 1.31
AI8 (3540-10MB3) 4/13/2016 14.9 35.8 3.29 0.33 0.005 61.1 0.010 0.013 0.068 2.96 16.3 0.40 0.006 0.35 0.086 0.73 0.066 5.01 0.22 1.52
AI8 (3540-10MB4) 4/20/2016 21.7 35.8 4.08 0.48 0.006 88.8 0.014 0.017 0.091 3.95 18.4 0.64 0.007 0.50 0.102 1.08 0.079 6.99 0.26 1.71
AI8 (3540-10MB8) 4/20/2016 21.7 33.8 4.14 0.45 0.007 93.8 0.012 0.016 0.086 3.56 18.5 0.62 0.009 0.55 0.094 1.15 0.071 6.36 0.28 1.54
AI8 (3540-10MB5) 4/27/2016 28.7 33.9 5.05 0.55 0.009 112 0.015 0.020 0.12 4.40 22.2 0.80 0.015 0.63 0.11 1.38 0.087 7.81 0.41 1.55
AI8 (3540-10MB6) 5/11/2016 42.9 33.9 6.05 0.71 0.013 182 0.015 0.025 0.14 4.67 24.0 0.95 0.019 1.50 0.12 2.23 0.092 8.33 0.39 1.38
AI8 (3540-10MB7) 5/25/2016 56.8 34.5 6.55 0.72 0.014 159 0.019 0.026 0.16 5.47 25.6 1.22 0.011 1.17 0.12 1.99 0.105 10.4 0.43 1.59
AI8 (3540-10MB9) 5/25/2016 56.8 34.7 7.28 0.78 0.016 198 0.023 0.032 0.18 6.29 28.1 1.39 0.012 1.37 0.14 2.47 0.113 12.3 0.43 1.69
AI8 (3540-10MB10) 5/25/2016 56.8 34.7 6.47 0.51 0.009 134 0.016 0.025 0.14 4.66 22.4 1.13 0.017 0.79 0.11 1.61 0.088 8.82 0.34 1.36
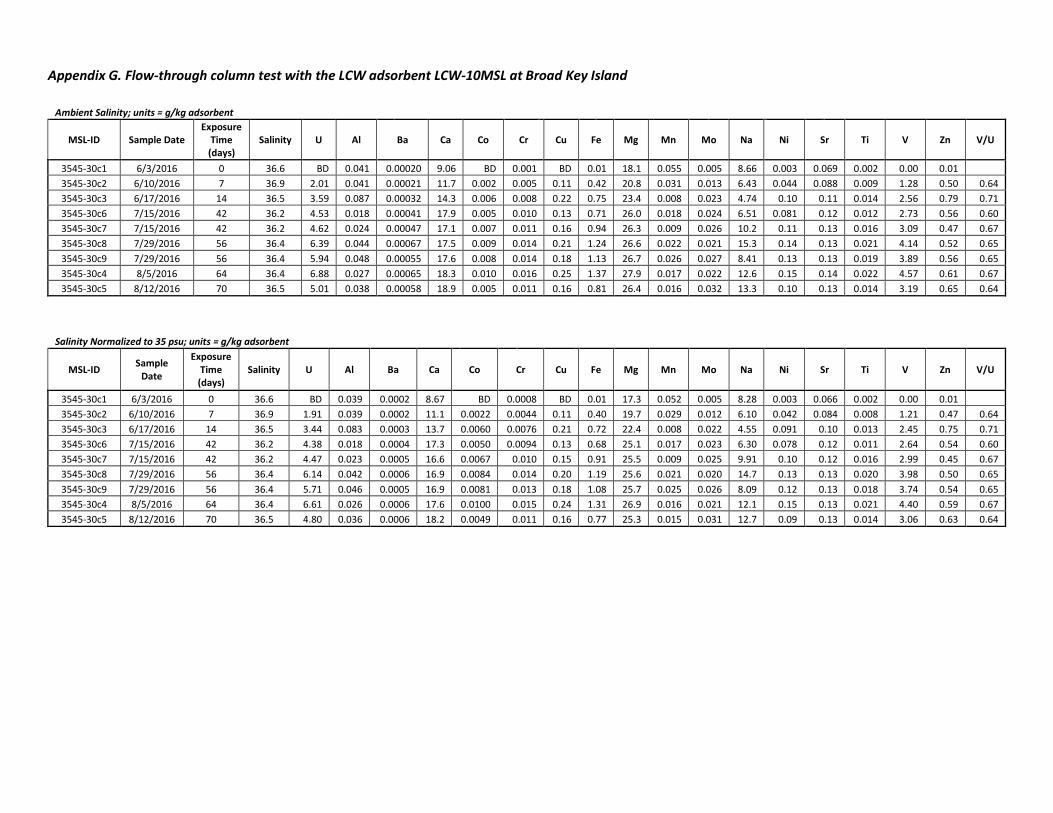
Appendix G. Flow-through column test with the LCW adsorbent LCW-10MSL at Broad Key Island
Ambient Salinity; units = g/kg adsorbent
MSL-ID Sample Date Exposure
Time (days)
Salinity U Al Ba Ca Co Cr Cu Fe Mg Mn Mo Na Ni Sr Ti V Zn V/U
3545-30c1 6/3/2016 0 36.6 BD 0.041 0.00020 9.06 BD 0.001 BD 0.01 18.1 0.055 0.005 8.66 0.003 0.069 0.002 0.00 0.01 3545-30c2 6/10/2016 7 36.9 2.01 0.041 0.00021 11.7 0.002 0.005 0.11 0.42 20.8 0.031 0.013 6.43 0.044 0.088 0.009 1.28 0.50 0.64 3545-30c3 6/17/2016 14 36.5 3.59 0.087 0.00032 14.3 0.006 0.008 0.22 0.75 23.4 0.008 0.023 4.74 0.10 0.11 0.014 2.56 0.79 0.71 3545-30c6 7/15/2016 42 36.2 4.53 0.018 0.00041 17.9 0.005 0.010 0.13 0.71 26.0 0.018 0.024 6.51 0.081 0.12 0.012 2.73 0.56 0.60 3545-30c7 7/15/2016 42 36.2 4.62 0.024 0.00047 17.1 0.007 0.011 0.16 0.94 26.3 0.009 0.026 10.2 0.11 0.13 0.016 3.09 0.47 0.67 3545-30c8 7/29/2016 56 36.4 6.39 0.044 0.00067 17.5 0.009 0.014 0.21 1.24 26.6 0.022 0.021 15.3 0.14 0.13 0.021 4.14 0.52 0.65 3545-30c9 7/29/2016 56 36.4 5.94 0.048 0.00055 17.6 0.008 0.014 0.18 1.13 26.7 0.026 0.027 8.41 0.13 0.13 0.019 3.89 0.56 0.65 3545-30c4 8/5/2016 64 36.4 6.88 0.027 0.00065 18.3 0.010 0.016 0.25 1.37 27.9 0.017 0.022 12.6 0.15 0.14 0.022 4.57 0.61 0.67 3545-30c5 8/12/2016 70 36.5 5.01 0.038 0.00058 18.9 0.005 0.011 0.16 0.81 26.4 0.016 0.032 13.3 0.10 0.13 0.014 3.19 0.65 0.64
Salinity Normalized to 35 psu; units = g/kg adsorbent
MSL-ID Sample Date
Exposure Time (days)
Salinity U Al Ba Ca Co Cr Cu Fe Mg Mn Mo Na Ni Sr Ti V Zn V/U
3545-30c1 6/3/2016 0 36.6 BD 0.039 0.0002 8.67 BD 0.0008 BD 0.01 17.3 0.052 0.005 8.28 0.003 0.066 0.002 0.00 0.01 3545-30c2 6/10/2016 7 36.9 1.91 0.039 0.0002 11.1 0.0022 0.0044 0.11 0.40 19.7 0.029 0.012 6.10 0.042 0.084 0.008 1.21 0.47 0.64 3545-30c3 6/17/2016 14 36.5 3.44 0.083 0.0003 13.7 0.0060 0.0076 0.21 0.72 22.4 0.008 0.022 4.55 0.091 0.10 0.013 2.45 0.75 0.71 3545-30c6 7/15/2016 42 36.2 4.38 0.018 0.0004 17.3 0.0050 0.0094 0.13 0.68 25.1 0.017 0.023 6.30 0.078 0.12 0.011 2.64 0.54 0.60 3545-30c7 7/15/2016 42 36.2 4.47 0.023 0.0005 16.6 0.0067 0.010 0.15 0.91 25.5 0.009 0.025 9.91 0.10 0.12 0.016 2.99 0.45 0.67 3545-30c8 7/29/2016 56 36.4 6.14 0.042 0.0006 16.9 0.0084 0.014 0.20 1.19 25.6 0.021 0.020 14.7 0.13 0.13 0.020 3.98 0.50 0.65 3545-30c9 7/29/2016 56 36.4 5.71 0.046 0.0005 16.9 0.0081 0.013 0.18 1.08 25.7 0.025 0.026 8.09 0.12 0.13 0.018 3.74 0.54 0.65 3545-30c4 8/5/2016 64 36.4 6.61 0.026 0.0006 17.6 0.0100 0.015 0.24 1.31 26.9 0.016 0.021 12.1 0.15 0.13 0.021 4.40 0.59 0.67 3545-30c5 8/12/2016 70 36.5 4.80 0.036 0.0006 18.2 0.0049 0.011 0.16 0.77 25.3 0.015 0.031 12.7 0.09 0.13 0.014 3.06 0.63 0.64
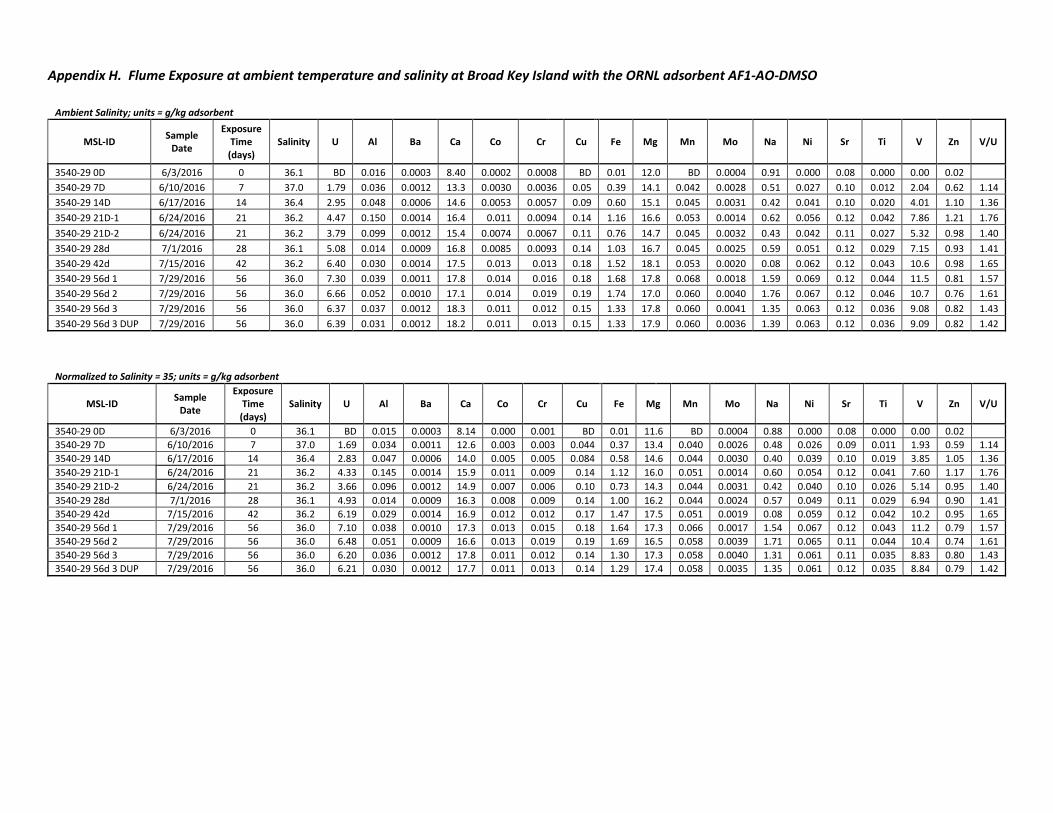
Appendix H. Flume Exposure at ambient temperature and salinity at Broad Key Island with the ORNL adsorbent AF1-AO-DMSO
Ambient Salinity; units = g/kg adsorbent
MSL-ID Sample Date
Exposure Time (days)
Salinity U Al Ba Ca Co Cr Cu Fe Mg Mn Mo Na Ni Sr Ti V Zn V/U
3540-29 0D 6/3/2016 0 36.1 BD 0.016 0.0003 8.40 0.0002 0.0008 BD 0.01 12.0 BD 0.0004 0.91 0.000 0.08 0.000 0.00 0.02 3540-29 7D 6/10/2016 7 37.0 1.79 0.036 0.0012 13.3 0.0030 0.0036 0.05 0.39 14.1 0.042 0.0028 0.51 0.027 0.10 0.012 2.04 0.62 1.14 3540-29 14D 6/17/2016 14 36.4 2.95 0.048 0.0006 14.6 0.0053 0.0057 0.09 0.60 15.1 0.045 0.0031 0.42 0.041 0.10 0.020 4.01 1.10 1.36 3540-29 21D-1 6/24/2016 21 36.2 4.47 0.150 0.0014 16.4 0.011 0.0094 0.14 1.16 16.6 0.053 0.0014 0.62 0.056 0.12 0.042 7.86 1.21 1.76 3540-29 21D-2 6/24/2016 21 36.2 3.79 0.099 0.0012 15.4 0.0074 0.0067 0.11 0.76 14.7 0.045 0.0032 0.43 0.042 0.11 0.027 5.32 0.98 1.40 3540-29 28d 7/1/2016 28 36.1 5.08 0.014 0.0009 16.8 0.0085 0.0093 0.14 1.03 16.7 0.045 0.0025 0.59 0.051 0.12 0.029 7.15 0.93 1.41 3540-29 42d 7/15/2016 42 36.2 6.40 0.030 0.0014 17.5 0.013 0.013 0.18 1.52 18.1 0.053 0.0020 0.08 0.062 0.12 0.043 10.6 0.98 1.65 3540-29 56d 1 7/29/2016 56 36.0 7.30 0.039 0.0011 17.8 0.014 0.016 0.18 1.68 17.8 0.068 0.0018 1.59 0.069 0.12 0.044 11.5 0.81 1.57 3540-29 56d 2 7/29/2016 56 36.0 6.66 0.052 0.0010 17.1 0.014 0.019 0.19 1.74 17.0 0.060 0.0040 1.76 0.067 0.12 0.046 10.7 0.76 1.61 3540-29 56d 3 7/29/2016 56 36.0 6.37 0.037 0.0012 18.3 0.011 0.012 0.15 1.33 17.8 0.060 0.0041 1.35 0.063 0.12 0.036 9.08 0.82 1.43 3540-29 56d 3 DUP 7/29/2016 56 36.0 6.39 0.031 0.0012 18.2 0.011 0.013 0.15 1.33 17.9 0.060 0.0036 1.39 0.063 0.12 0.036 9.09 0.82 1.42
Normalized to Salinity = 35; units = g/kg adsorbent
MSL-ID Sample Date
Exposure Time (days)
Salinity U Al Ba Ca Co Cr Cu Fe Mg Mn Mo Na Ni Sr Ti V Zn V/U
3540-29 0D 6/3/2016 0 36.1 BD 0.015 0.0003 8.14 0.000 0.001 BD 0.01 11.6 BD 0.0004 0.88 0.000 0.08 0.000 0.00 0.02 3540-29 7D 6/10/2016 7 37.0 1.69 0.034 0.0011 12.6 0.003 0.003 0.044 0.37 13.4 0.040 0.0026 0.48 0.026 0.09 0.011 1.93 0.59 1.14 3540-29 14D 6/17/2016 14 36.4 2.83 0.047 0.0006 14.0 0.005 0.005 0.084 0.58 14.6 0.044 0.0030 0.40 0.039 0.10 0.019 3.85 1.05 1.36 3540-29 21D-1 6/24/2016 21 36.2 4.33 0.145 0.0014 15.9 0.011 0.009 0.14 1.12 16.0 0.051 0.0014 0.60 0.054 0.12 0.041 7.60 1.17 1.76 3540-29 21D-2 6/24/2016 21 36.2 3.66 0.096 0.0012 14.9 0.007 0.006 0.10 0.73 14.3 0.044 0.0031 0.42 0.040 0.10 0.026 5.14 0.95 1.40 3540-29 28d 7/1/2016 28 36.1 4.93 0.014 0.0009 16.3 0.008 0.009 0.14 1.00 16.2 0.044 0.0024 0.57 0.049 0.11 0.029 6.94 0.90 1.41 3540-29 42d 7/15/2016 42 36.2 6.19 0.029 0.0014 16.9 0.012 0.012 0.17 1.47 17.5 0.051 0.0019 0.08 0.059 0.12 0.042 10.2 0.95 1.65 3540-29 56d 1 7/29/2016 56 36.0 7.10 0.038 0.0010 17.3 0.013 0.015 0.18 1.64 17.3 0.066 0.0017 1.54 0.067 0.12 0.043 11.2 0.79 1.57 3540-29 56d 2 7/29/2016 56 36.0 6.48 0.051 0.0009 16.6 0.013 0.019 0.19 1.69 16.5 0.058 0.0039 1.71 0.065 0.11 0.044 10.4 0.74 1.61 3540-29 56d 3 7/29/2016 56 36.0 6.20 0.036 0.0012 17.8 0.011 0.012 0.14 1.30 17.3 0.058 0.0040 1.31 0.061 0.11 0.035 8.83 0.80 1.43 3540-29 56d 3 DUP 7/29/2016 56 36.0 6.21 0.030 0.0012 17.7 0.011 0.013 0.14 1.29 17.4 0.058 0.0035 1.35 0.061 0.12 0.035 8.84 0.79 1.42
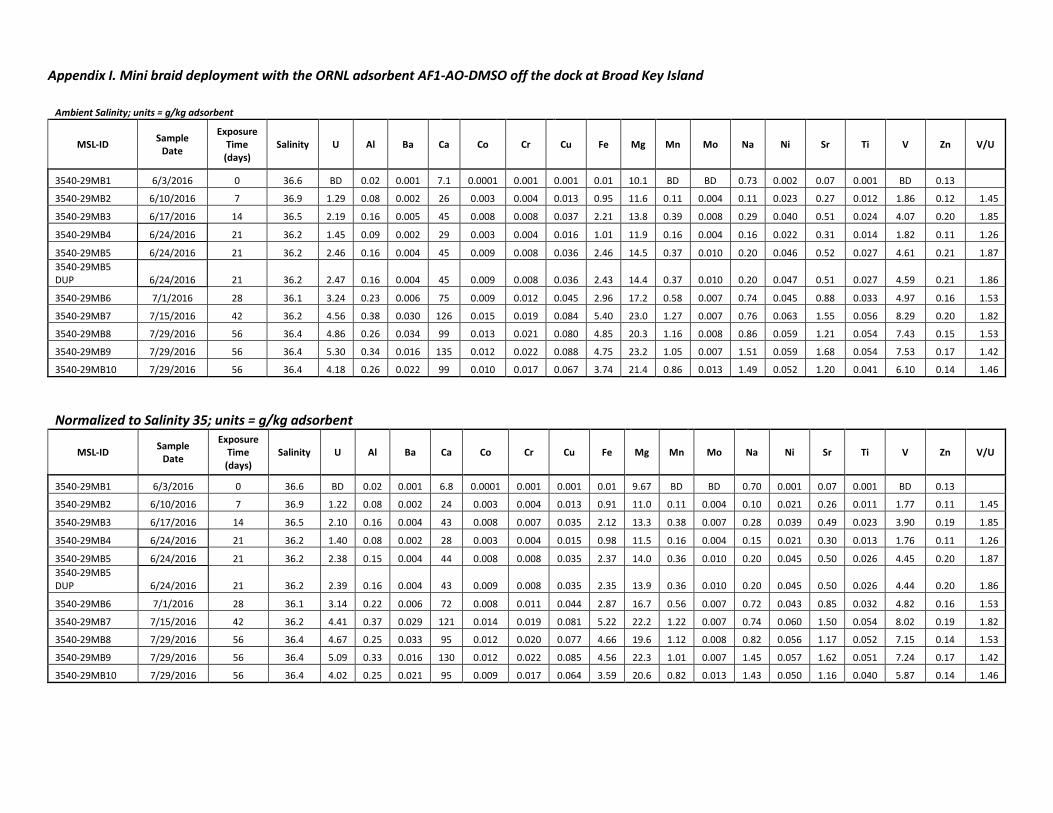
Appendix I. Mini braid deployment with the ORNL adsorbent AF1-AO-DMSO off the dock at Broad Key Island
Ambient Salinity; units = g/kg adsorbent
MSL-ID Sample Date
Exposure Time (days)
Salinity U Al Ba Ca Co Cr Cu Fe Mg Mn Mo Na Ni Sr Ti V Zn V/U
3540-29MB1 6/3/2016 0 36.6 BD 0.02 0.001 7.1 0.0001 0.001 0.001 0.01 10.1 BD BD 0.73 0.002 0.07 0.001 BD 0.13
3540-29MB2 6/10/2016 7 36.9 1.29 0.08 0.002 26 0.003 0.004 0.013 0.95 11.6 0.11 0.004 0.11 0.023 0.27 0.012 1.86 0.12 1.45
3540-29MB3 6/17/2016 14 36.5 2.19 0.16 0.005 45 0.008 0.008 0.037 2.21 13.8 0.39 0.008 0.29 0.040 0.51 0.024 4.07 0.20 1.85
3540-29MB4 6/24/2016 21 36.2 1.45 0.09 0.002 29 0.003 0.004 0.016 1.01 11.9 0.16 0.004 0.16 0.022 0.31 0.014 1.82 0.11 1.26
3540-29MB5 6/24/2016 21 36.2 2.46 0.16 0.004 45 0.009 0.008 0.036 2.46 14.5 0.37 0.010 0.20 0.046 0.52 0.027 4.61 0.21 1.87 3540-29MB5 DUP 6/24/2016 21 36.2 2.47 0.16 0.004 45 0.009 0.008 0.036 2.43 14.4 0.37 0.010 0.20 0.047 0.51 0.027 4.59 0.21 1.86
3540-29MB6 7/1/2016 28 36.1 3.24 0.23 0.006 75 0.009 0.012 0.045 2.96 17.2 0.58 0.007 0.74 0.045 0.88 0.033 4.97 0.16 1.53
3540-29MB7 7/15/2016 42 36.2 4.56 0.38 0.030 126 0.015 0.019 0.084 5.40 23.0 1.27 0.007 0.76 0.063 1.55 0.056 8.29 0.20 1.82
3540-29MB8 7/29/2016 56 36.4 4.86 0.26 0.034 99 0.013 0.021 0.080 4.85 20.3 1.16 0.008 0.86 0.059 1.21 0.054 7.43 0.15 1.53
3540-29MB9 7/29/2016 56 36.4 5.30 0.34 0.016 135 0.012 0.022 0.088 4.75 23.2 1.05 0.007 1.51 0.059 1.68 0.054 7.53 0.17 1.42
3540-29MB10 7/29/2016 56 36.4 4.18 0.26 0.022 99 0.010 0.017 0.067 3.74 21.4 0.86 0.013 1.49 0.052 1.20 0.041 6.10 0.14 1.46
Normalized to Salinity 35; units = g/kg adsorbent
MSL-ID Sample Date
Exposure Time (days)
Salinity U Al Ba Ca Co Cr Cu Fe Mg Mn Mo Na Ni Sr Ti V Zn V/U
3540-29MB1 6/3/2016 0 36.6 BD 0.02 0.001 6.8 0.0001 0.001 0.001 0.01 9.67 BD BD 0.70 0.001 0.07 0.001 BD 0.13
3540-29MB2 6/10/2016 7 36.9 1.22 0.08 0.002 24 0.003 0.004 0.013 0.91 11.0 0.11 0.004 0.10 0.021 0.26 0.011 1.77 0.11 1.45
3540-29MB3 6/17/2016 14 36.5 2.10 0.16 0.004 43 0.008 0.007 0.035 2.12 13.3 0.38 0.007 0.28 0.039 0.49 0.023 3.90 0.19 1.85
3540-29MB4 6/24/2016 21 36.2 1.40 0.08 0.002 28 0.003 0.004 0.015 0.98 11.5 0.16 0.004 0.15 0.021 0.30 0.013 1.76 0.11 1.26
3540-29MB5 6/24/2016 21 36.2 2.38 0.15 0.004 44 0.008 0.008 0.035 2.37 14.0 0.36 0.010 0.20 0.045 0.50 0.026 4.45 0.20 1.87 3540-29MB5 DUP 6/24/2016 21 36.2 2.39 0.16 0.004 43 0.009 0.008 0.035 2.35 13.9 0.36 0.010 0.20 0.045 0.50 0.026 4.44 0.20 1.86
3540-29MB6 7/1/2016 28 36.1 3.14 0.22 0.006 72 0.008 0.011 0.044 2.87 16.7 0.56 0.007 0.72 0.043 0.85 0.032 4.82 0.16 1.53
3540-29MB7 7/15/2016 42 36.2 4.41 0.37 0.029 121 0.014 0.019 0.081 5.22 22.2 1.22 0.007 0.74 0.060 1.50 0.054 8.02 0.19 1.82
3540-29MB8 7/29/2016 56 36.4 4.67 0.25 0.033 95 0.012 0.020 0.077 4.66 19.6 1.12 0.008 0.82 0.056 1.17 0.052 7.15 0.14 1.53
3540-29MB9 7/29/2016 56 36.4 5.09 0.33 0.016 130 0.012 0.022 0.085 4.56 22.3 1.01 0.007 1.45 0.057 1.62 0.051 7.24 0.17 1.42
3540-29MB10 7/29/2016 56 36.4 4.02 0.25 0.021 95 0.009 0.017 0.064 3.59 20.6 0.82 0.013 1.43 0.050 1.16 0.040 5.87 0.14 1.46