Embed Size (px)
Citation preview
Naturally occurring radionuclides in the marine environment – an overview of current knowledge with emphasis the North Sea area
ND/E-19/03

Foreword The purpose of this project has been procuring and documenting existing knowledge of natural radionuclides in the marine environment, anthropogenic and natural sources, with special emphasis on the North Sea area.
The project is part of the Research Council of Norway's programme “Long-term impact of discharges to sea from the petroleum industry” (Proof).
The report contains an overview of background data for water concentrations and contributions from natural and anthropogenic sources (Chapters 4 and 5). Levels, effects and doses for marine biota are considered in chapter 7, and radiological doses for humans in chapter 8. There is also a discussion of the MARINA II study in relation to discharges of natural radionuclides from oil and gas production on the Norwegian Shelf (Chapter 6). An identification of knowledge gaps and suggestions of priority areas for future research are found in Chapter 9.
The Norwegian Oil Industry Association has provided substantial assistance in obtaining specific discharge data for produced water on the Norwegian Shelf.
The work has been carried out with contributions from cand.scient. Elisabeth Strålberg (authoring Chapters 2 - 6) and cand.scient. Aud Raaum (authoring Chapter 8), both of the Norwegian Institute for Energy Technology (IFE) and Dr.philos. Anita Th. Smith Varskog (authoring Chapter 7) of Yera AS.
This report is a translation of report ND/E-17/03. Ellen Crocker of TranslatørXpress AS has translated Chapters 2 – 8 from Norwegian.
Kjeller, 28 November 03 Per Varskog, Dr. Scient. Editor

Naturally occurring radionuclides in the marine environment –
an overview of current knowledge with emphasis on the North Sea area
Edited by: Per Varskog
Norse Decom AS, 2003
ISBN 82-92538-01-1
Table of Content 1 Summary ............................................................................................................................ 1 2 Introduction ....................................................................................................................... 4 3 The North Sea .................................................................................................................... 6 4 Natural sources of natural radioactivity in the ocean .................................................... 7
4.1 Radium in ocean water.................................................................................................. 7 4.1.1 Radium in the North Sea ...................................................................................... 10
4.2 Lead-210 and Polonium-210 in seawater ......................................................................... 11 4.2.1 Lead-210 and polonium-210 in the North Sea ........................................................... 13
4.3 Uranium and thorium in seawater............................................................................... 13 5 Anthropogenic sources of natural radioactivity in the sea .......................................... 14
5.1 The oil and gas industry ................................................................................................. 14 5.1.1 The Norwegian Continental Shelf ............................................................................ 16 5.1.2 The British Continental Shelf............................................................................... 19 5.1.3 The Danish Continental Shelf .............................................................................. 19 5.1.4 The Dutch Continental Shelf................................................................................ 20 5.1.5 Summary, discharges from the oil and gas industry ............................................ 21
5.2 Other industries/activities ........................................................................................... 22 5.2.1 The Netherlands...................................................................................................... 22 5.2.2 The United Kingdom............................................................................................... 23 5.2.3 Belgium ................................................................................................................. 23 5.2.4 Denmark ................................................................................................................ 23 5.2.5 Germany ................................................................................................................ 23
6 The MARINA II study .................................................................................................... 24 7 Natural radioactivity in marine biota............................................................................ 26
7.1 Introduction................................................................................................................. 26 7.2 Relevant natural radionuclides.................................................................................... 26 7.3 Relevant marine organisms......................................................................................... 27 7.4 Exposure ..................................................................................................................... 27 7.5 Effects ......................................................................................................................... 28 7.6 Biokinetics and doses.................................................................................................. 29
7.6.1 Potassium-40 ........................................................................................................ 32 7.6.2 Uranium-238 ........................................................................................................ 32 7.6.3 Thorium 232........................................................................................................... 33 7.6.4 Radium-228 and radium-226 ................................................................................... 34 7.6.5 Lead 210............................................................................................................... 38 7.6.6 Polonium 210 ....................................................................................................... 40
8 Doses from natural radionuclides in the marine environment.................................... 42 8.1 Doses from natural radioactivity................................................................................. 43 8.2 Doses from discharges of produced water .................................................................. 44 8.3 Doses from other non-nuclear industries .................................................................... 45
9 Knowledge gaps and suggestions for priority areas for further research.................. 47 10 References ..................................................................................................................... 50 Appendix A ............................................................................................................................. 56
ND/E-19/03: Naturally occurring radionuclides in the marine environment
1 Summary This report contains a compilation of existing knowledge on naturally occurring radionuclides in the marine environment with emphasis on the North Sea area.
Naturally occurring radionuclides have, as indicated by the term, a natural origin and has always been present on earth. The naturally occurring radionuclides belongs to the lithosphere, but are entered into the marine environment by natural processes like erosion, river transport, dissolution and diffusion. The radionuclides in focus in this report (226Ra, 228Ra, 210Pb and 210Po) belong to the two radioactive series starting with 238U or 232Th. This is more thoroughly described in Chapter 2 and 3.
Chapter 4 contains an overview of background levels for relevant naturally occurring radionuclides and quantification the major sources and sinks. As evident from the chapter the data material for the North Sea is quite sparse. It has not been found any data that documents eventual variations in the concentration of said radionuclides neither with respect to geographical distribution or in the water column. Suggested values for the background concentration of 226Ra, 210Pb and 210Po that may be used while waiting for more complementary data are given in Table A.
Table A: A suggestion of background concentration values in the
North Sea for three nuclides in the 238U-serien.
Nuklide Suggested value Radium-226 5 mBq/L Lead-210 0,8 mBq/L Polonium-210 0,8 mBq/L
A quantification of activity amounts, sources and sink for 226Ra are given in Table B. It should be noted that due to the lack of comprehensive studies of naturally occurring radionuclides in the North Sea area the given quantifications should be regarded to contain large uncertainties.
Table B: Inventory, sources and sinks for 226Ra in the North Sea.
Ra-226 (Bq) Inventory 3 × 10¹⁴ Bq Sources Ingrowth from uranium 9 × 10¹¹ Bq/year Leakage from sediments 6 × 10¹¹ Bq/year Contribution from rivers 6 × 10¹¹ Bq/year Emissions from the Norwegian oil industry 3 × 10¹¹ Bq/year Emissions from the oil industry in other N.S. countries* 8 × 10¹¹ Bq/year Sinks Radioactive decay 1 × 10¹¹ Bq/year * - estimated by combination of av activity measurements fromNorwegian
installations and data for produced water quantities for the different North Sea countries.
Norse Decom AS 1
ND/E-19/03: Naturally occurring radionuclides in the marine environment
During production of oil and gas there is also produced large quantities of water. This water, hereafter denoted as “produced water”, contains radionuclides, primarily 226Ra (from the 238U series) and 228Ra (from the 232Th series). Chapter 5 contains a compilation of data from measurements of 226Ra in produced water from the North Sea area. The estimate for the total emission of 226Ra in produced water from the Norwegian Continental Shelf is based on a survey of the activity concentration of 226Ra in samples from all installations with emissions of produced water collected in 2002.
In Chapter 6 the data for emissions of radioactivity in produced water (Chapter 5) is discussed in relation to a similar compilation performed in the MARINA II report. The comparison shows a large discrepancy between the two assessments (this report and MARINA II). The total emission of 226Ra as calculated from the survey from 2002 indicates a released quantity of 226Ra of about one tenth of what is projected in the MARINA II report.
Chapter 7 provides an overview of uptake, concentration factors, concentration levels and effects of natural radioactive nuclides in marine biota from anthropogenic and natural sources. A comprehensive review prepared by Aarkrog et al. (1997) demonstrated that the differences between uptake and concentrations of natural radioactive nuclides were much greater between different species than between different geographical regions. The existing literature can therefore most likely be extrapolated to North Sea conditions even though there are few reported studies from this specific area.
Radioactive nuclides have the characteristics of their respective elements. Thus, the fate of a specific nuclide is determined by the chemical properties of the elements. A radioactive element is not being broken down in the environment, and the element continues to emit radiation completely independent of which chemical compound the element is a part.
Radioactive substances emit particles that ionises atoms and molecules of biological organisms, i.e. the electrons are detached from the atoms. The energy of ionising radiation is deposited in the material it is penetrating. Ionising radiation initiates the decomposition of several organic components, it causes mutation in the DNA and the cell nucleus and it causes damage in proteins, amino acids, tissue and bone marrow. Ionising radiation may cause biological harm in tissues due to cell death or development of cancer cells. Mutation in DNA and subsequent effects in future generations is also a known effect of ionising radiation.
The actual risk to biota is dependent on several factors: Type of radiation (α, β, γ), the radiation energy, the level of activity, the chemical properties of the element, the physical and chemical properties of the contaminated material and the environment, co-exposure to other substances and species-specific properties.
IAEA (1995) proposes the following marine food chain for research purposes and for the calculation of doses and effects of radionuclides: Phytoplankton, macro algae, zooplankton, molluscs, crustaceae, fish and mammals. The most important and potential exposure routes for marine organisms are: Internal exposure through intake of water, feed, inorganic or organic particles, internal exposure through previously acquired radionuclides that are deposited in the organisms, and external exposure via skin, gills or other surfaces. Sedimentation of organic materials is most significant in coastal areas. Thus, the highest concentrations of radionuclides are found here. These areas are also the most biologically productive areas as well as important habitats for mussels, shellfish, fish and birds.
In general, radium is mainly deposited in shell and osseous tissue whereas lead and polonium are present in the soft tissue (i.e. the edible parts) of fish and shellfish. Thus, 210Pb and 210Po
Norse Decom AS 2

ND/E-19/03: Naturally occurring radionuclides in the marine environment
contribute to human doses from seafood to a much larger extent than 226Ra and 228Ra do. According to Dahlgaard (1996) and Cherry and Heyraud (1988), on the global scale 210Po is responsible for the bulk of the radiation dose to human beings from the marine environment (approximately 80 %). On the whole, the marine exposure route is responsible for only 2 – 10 % of the total dose load from natural background radiation.
In the literature there are significant amounts of documentation on the relationship between exposure, doses and effects in marine organisms. A collection of the available data is presented in Chapter 7. From the collected numbers and figures that are presented in this report it is rather evident that the discharge of natural radionuclides from produced water adds on a share which gives a total radiation exposure that are relatively far from the effect levels that have been documented in the literature so far.
Chapter 8 provides an overview of radiation doses to man from naturally occurring radionuclides in the marine environment. According to the MARINA II report consumption of seafood is the major source and adds up to more than 95 % of the total contribution from “marine radionuclides”. The average individual dose rate from the marine environment is estimated to 15 – 100 µSv/year. This compares to 0.4 – 2.5 % of the background dose rate for a person living in Norway where the normal background adds up to a dose rate of 4 mSv/year. The calculated collective dose from emissions of produced water to the population in the EU countries corresponds to 0.5 % of the calculated background dose to the same population (MARINA II report).
Norse Decom AS 3
ND/E-19/03: Naturally occurring radionuclides in the marine environment
2 Introduction Radioactivity has been present on earth ever since the globe was formed between 4.5 and 5 billion years ago. However, radioactivity was first discovered in 1895 when W. Röntgen discovered x-rays. In 1898 Marie and Pierre Curie postulated the existence of two new elements, polonium and radium. A further few years were to elapse until Marie Curie in 1903 succeeded in producing pure radium salt from tonnes of pitchblende. Radium gradually became extremely popular in a number of industries. It was used in luminescent paint and was considered beneficial to health in drinking water; radium was also used as an additive in toothpaste and sweets. A number of unprotected workers died as a result of these developments. In 1935 Marie Curie died of leukaemia.
Natural radioactivity is divided into primordial and cosmogenic radionuclides. The primordial nuclides have been present in nature since the beginning of time, and consist primarily of radionuclides in the three series beginning with 238U (uranium-238), 232Th (thorium-232) and 235U (uranium-235) (Fig. 1), and in addition 40K (potassium-40), which is a radioactive potassium isotope. Cosmogenic nuclides are formed continually in the atmosphere due to cosmic radiation from outer space. 3H (tritium), 7Be (beryllium-7) and 14C (carbon-14) are some important cosmogenic nuclides.
A number of human activities contribute to our natural radiation environment, and a number of non-nuclear industries will, due to their activities, “move” and possibly also further concentrate some of the natural radioactive substances that can be found in the earth’s crust. This includes activities such as
- the phosphate industry. - the oil and gas industry. - the metal industry. - the combustion of fossil fuel.
In addition, natural processes in rivers, in the oceans and on land “move around” the different radioactive substances. This report provides a summary of the existing data on natural radioactivity in the marine environment. Much has been published in this field, and the summary will in no sense of the word encompass everything. The main focus in this work has primarily been on the North Sea, but as the amount of data from this area is limited, a number of studies from other oceans are presented here in order to shed light on general processes. Both natural and industrial sources of radionuclides are described, with the oil and gas industry being covered specifically. The main focus will be on radium-226, radium-228, lead-210 and polonium-210 (226Ra, 210Ra, 210Pb and 210 Po), but a number of other nuclides will also be referred to.
Norse Decom AS 4

ND/E-19/03: Naturally occurring radionuclides in the marine environment
232Th-series
228Ra 5,7 y β
α 232Th 1,4.1010 y
228Ac 6,13 h β
212Pb 10,6 h β
α 216Po 0,15 s
α 220Rn 55,6 s
α 224Ra 3,64 d
α 228Th 1,9 y
208Tl 3,1 m β
α 212Bi 60,6 m β
208Pb stabil
α 212Po 0,3 µs
235U-series 231Th 25,6 h β
α 235U 7.108 y
215Bi 7,4 m β
α 219At 0,9 m β
α 223Fr 22 m β
α 227Ac 22 y β
α 231Pa 3,3.104 y
211Pb 36,1 m β
α 215Po 1,8 ms β
α 219Rn 3,9 s
α 223Ra 11,4 d
α 227Th 18,7 d
207Tl 4,8 m β
α 211Bi 2,15 m β
α 215At ∼100 µs
207Pb sTable
α 211Po 0,52 s
238U-series 234Th 24,1 d β
α 238U 4,5.109 y
234Pa 1,2m (6,7h)
β
214Pb 26,8 m β
α 218Po 3,05 m β
α 222Rn 3,8 d
α 226Ra 1600 y
α 230Th 8.104 y
α 234U 2,5.105 y
210Tl 1,3 m β
α 214Bi 19,8 m β
α 218At ∼2 µs
206Hg 8,1 m β
α 210Pb 22 y β
α 214Po 162 µs
206Tl 4,3 m β
α 210Bi 5,0 d β
206Pb stabil
α 210Po 138,4 d
Fig. 1: The three series of natural radionuclides. The most important ones for the purposes of this report are marked in bold.
Norse Decom AS 5
ND/E-19/03: Naturally occurring radionuclides in the marine environment
3 The North Sea The North Sea is a sea bordering on Norway, the United Kingdom and the Continent. The North Sea extends to the 61st degree of latitude in the North, from 0° 53” west to the Norwegian Coast, forming a line from Lindesnes to Hanstholm on Jylland the boundary towards the Skagerak in the east. In the south and the west the North Sea borders on the Atlantic Ocean through the Dover straits and the straits between Scotland, the Orkney Islands and the Shetland Islands (Source: Store norske leksikon). The North Sea is a relatively shallow sea; maximum depth is a mere 400 metres (in the Norwegian trench). Some key data on the North Sea and the great oceans are given in Table 1 (van der Leden et al., 1990).
Table 1: Key data for the large oceans and the North Sea (van der Leden et
al., 1990)
Ocean Area (109m2)
Average depth(m)
Volume (1015m3)
The Arctic 14090 1205 17.0 The Northern Pacific Ocean 83462 3858 322.0 The Southern Pacific Ocean 65521 3891 254.9 The Northern Atlantic 46772 3285 153.6 The Southern Atlantic 37364 4091 152.8 The Indian Ocean 81602 4284 349.6 The Antarctic 32249 3730 120.3 The North Sea 600 91 0.055
The temperature conditions in the North Sea vary greatly depending on location and time of year. Salinity varies from 35 ‰ in the west where the Atlantic ocean seeps in, to 34 ‰ or even lower in the eastern parts (Source: Store norske leksikon).
The North Sea has much of the same bedrock as the tracts of land in the south and south-west, which is different from the bedrock on land in Norway. The North Sea consists of two large sediment basins. The southern has, among others, sediments from the carbon period. The carboniferous sandstone from this period is an important source rock species for a number of natural gas deposits. In the northern basin, Kimmeridge slate is an important source rock species for both oil and natural gas (Source: Store norske leksikon).
The oil adventure in the North Sea began with the discovery of the Balder oil field in 1967. In 1969 the Ekofisk oil field was identified, and North Sea oil production began in the North Sea in 1971 (OED, 2002). An overview of all the oil fields in production as well as all oil fields where production has ceased, can be found in OED (2002). Total production of oil/natural gas liquids on the Norwegian Shelf was 185 million Sm3 o.e. (standard cubic metre oil equivalents) in 2002. Natural gas production in the same year was 105.5 million Sm3 o.e. . Of this, 65.4 million Sm3 o.e. natural gas were delivered, while the remainder was injected, torched or used as fuel (OLF, 2003). An “oil equivalent” is a measuring unit for petroleum resources that is based on the energy content of hydrocarbons. The unit has been defined by the Norwegian Oil Directorate (OD, 2003).
Norse Decom AS 6

ND/E-19/03: Naturally occurring radionuclides in the marine environment
4 Natural sources of natural radioactivity in the ocean The ocean itself contains large amounts of radioactivity. The average activity (both natural and anthropogenic) for the world’s oceans is 13.6 Bq/kg1 water. More than 88 % of this activity is due to the naturally occurring potassium isotope 40K. Only 7 % of the rest is due to fallout from atmospheric nuclear tests, which are the largest source of the global dispersion of anthropogenic radionuclides. Average concentration of naturally occurring radioactive nuclides is 12.5 Bq/kg1 water. The highest activity (average 178 Bq/kg) has been found in the Dead Sea and is due to a high concentration of both non-radioactive and radioactive nuclides (high salinity). In the open sea areas activity varies less. The highest levels can be found in the Persian Gulf (22 Bq/kg), the Red Sea (15 Bq/kg), and the eastern Mediterranean (14.6 Bq/kg). The Baltic Sea has an extremely low concentration of radioactive nuclides (4 Bq/kg). This is due to the considerable dilution with freshwater (Walker, 1990).
A number of studies of the occurrence of natural radioactivity in seawater have been carried out, but there is little data available on the North Sea. Available data for the North Sea is summarised in Table 2. An overview of some relevant studies for other oceans is given in appendix A.
Table 2: Concentration of naturally occurring radionuclides in the North Sea
Nuclide Concentration Location Reference 226Ra 6.7 - 8.5 mBq/L Not given IAEA, 1990 2.8 ± 0.67 mBq/kg The Wash, river mouth, England Plaster et al., 1995 5.3 mBq/L 30 km from the coast, the Netherlands Köster et al., 1992 5.0 mBq/L Coast, the Netherlands Köster et al., 1992 210Pb 0.72 ± 0.42 mBq/L Not given Cherrry and Heyraud, 1988 0.8 mBq/L 30 km from the coast, the Netherlands Köster et al., 1992 210Po 0.80 ± 0.23 mBq/L Not given Cherrry and Heyraud, 1988 0.7 mBq/L 30 km from the coast, the Netherlands Köster et al., 1992 0.5 mBq/L Coast, the Netherlands Köster et al., 1992
4.1 Radium in ocean water
As is indicated by figure 1, radium comes into being as a result of radioactive fallout of 238U (226Ra, half-life 1600 years) and 232Th (228Ra, half-life 5.75 years). There is a good deal of uranium in the ocean, and most of the radium in the ocean is formed from this, approximately 2 × 10¹⁶ Bq every year (IAEA, 1990). The total amount of uranium, thorium and radium in the ocean is shown in Table 3.
Table 3: Overview of amounts of radium, uranium and thorium in the ocean and in the earth crust (IAEA, 1990).
Ocean Earth crust (land)
Earth crust (under the ocean)
Uranium 6 × 10¹⁹Bq 5.7 × 10²³Bq 4.4 × 10²²Bq 226Ra 5 × 10¹⁸Bq 5.7 × 10²³Bq 4.4 × 10²²Bq Thorium 5 × 10¹⁵Bq 6.1 × 10²³Bq 5.1 × 10²²Bq 228Ra 5 × 10¹⁵Bq 6.1 × 10²³Bq 5.1 × 10²²Bq
Norse Decom AS 7

ND/E-19/03: Naturally occurring radionuclides in the marine environment
As the Table shows, there is less 226Ra than there is uranium in the sea. This is due to the fact that the link before 226Ra in the chain, 230Th, is continually removed from the water masses via adsorption onto sedimenting particles. Radium in turn is more soluble in water than thorium, and will leak from the floor sediments. There is therefore a higher concentration of 226Ra near the ocean floor than near the surface of the water. In addition, the amount of 226Ra in seawater is ten times higher than the amount of 230Th. Calculations show that the contribution of 226Ra from sediments to the total amount of 226Ra in the water masses does not exceed 15 % (IAEA, 1990). A summary of the radium concentrations at different depths in the major oceans is given in Table 4.
Table 4: Radium at different depths in the major oceans (IAEA, 1990)
Ocean 226Ra [mBq/L] 228Ra [mBq/L] 0-500 m 200-2000 m 2000-4000 m or
more surface depth
The Atlantic Ocean 0.74 - 2.96 1.35 - 3.33 1.60 - 4.44 0.13 - 3.40 0.017 - 0.925 The Pacific Ocean 0.74 - 3.70 1.48 - 5.55 2.22 - 54.4 0.015 - 0.333 0.03 - 0.28 The Indian Ocean 1.11 - 2.22 1.85 - 3.33 2.22 - 4.44 N.D. -1.12 - The Arctic - - - 0.43 - The Antarctic - - 3.59 0.017 - 0.48* - N.D. = not detected * not stated whether deepwater or surface water
In coastal areas the concentration of radium is higher than in the open sea. This is primarily due to the seepage from coastal sediments. An overview of radium in different coastal areas is given in Table 5.
Table 5: Radium in seawater, coastal areas (IAEA, 1990)
Area 226Ra [mBq/L] 228Ra [mBq/L]The Mediterranean Sea 1.84 - 4.44 0.052 - 0.63 The Caribbean Sea 0.74 - 2.96 0.62 - 1.15 The Black Sea 2.59 - 4.44 0.11 - 1.52 The Red Sea 1.48 - 2.22 0.58 The Indonesian Sea 1.38 - 2.77 0.38 - 10.5 New York Bight - 0.63 - 3.32 The Gulf of Mexico 0.97 - 1.92 0.77 - 1.50 The Baltic Sea 1.11 - 5.55 -
Moore (1969) asserts that due to its half-life, the radium isotope 228Ra (5.75 years) can be used to study marine processes with a time perspective of three to thirty years. In waters near the coast, where water is in near contact with sediments and has little circulation with the open sea, the isotope ratio 228Ra/226Ra is the highest. When coastal waters are mixed with seawater, the isotope ratio is the highest. There are great variations in the isotope ratio in surface water. There is for instance a lot more 228Ra in the Atlantic than the Pacific ocean. Near the ocean floor the concentration of 228Ra is high, while it is near the detection limit in the intermediate depths. Legeleux and Reyss (1996) have found that even though the isotope ratio varies with the depth of the water column, the ratio is almost constant in sedimenting
Norse Decom AS 8
ND/E-19/03: Naturally occurring radionuclides in the marine environment
particles. The isotope ratio in the particles resembles that found in water of the upper 250 metres of the water column, indicating that the particles “collect” radium in the upper water masses, and that there is little exchange with radium dissolved in the water as the particles sink.
IAEA (1990) has summarised the data on leakage of radium from the floor sediments. These, together with data from Bojanowski (1988) and Cochran (1980), are given in Table 6. Cochran (1980) has discovered that the rate of leakage does not vary according to sediment type. Bojanowski (1988) has estimated the total amount of radium in the different ocean areas, as well as other sources and outflows for radium. These are summarised in Table 7. Recommended Kd values (the ratio between concentration in sediment (Bq/kg) and water (Bq/L) for radium are supplied by IAEA (1985) for both open sea (3 × 10⁴) and for coastal areas (5 × 10³).
Table 6: Rate of leakage for 226Ra from the ocean floor. All data in Bq/m2 year.
Area IAEA (1990) Bojanowski (1988) Cochran (1980) The Atlantic Ocean 0.4 - 2 0.3 - 0.4 0.25 - 0.37 The Pacific Ocean 14 - 36 1.5 - 68 13.5 - 35 The Indian Ocean 4 - 6 1.8 - 5.8 4.3 - 5.8 Antarctic 2 - 3 - 1.8 - 3.2 Average: 6 - - Coastal areas 2 - 330 - -
Table 7: Amounts, sources and outflows for 226Ra in the major oceans (Bojanowski, 1988). Rate of leakage
from the ocean floor is shown in Table 6.
The Atlantic Ocean
The Pacific Ocean
The Indian Ocean
Sum
Amount of radium (1018Bq) 0.84 ± 0.10* 2.92 ± 0.16 1.02 ± 0.09 4.78 ± 0.27 Loss due to radioactive fallout (1012Bq) 360 1250 436 2046 ---”--- (Bq/m2 year) 3.38 7.02 5.72 - ---”--- (103 Bq/m3) 1.04 1.77 1.54 - Loss from surface due to wind (Bq/year) - - - 1·1010
Contribution from rivers (1015 Bq/year) 0.07 ± 0.02 0.17 ± 0.08 0.18 ± 0.08 0.42 ± 0.15 Contribution from ground water (1013 Bq/year) 1 - 10 1 - 7 1 - 5 3 - 22
Little data on radium in rivers with outlets in the North Sea has been published. Some data has been published by IAEA (1990), and these are summarised in Table 8, together with data from Plater et al. (1995). In a review article by Coward and Burnett (1994) an article by Key et al. (1985) is cited, where the authors have described how radium, which is often associated with particles in the river water, are desorbed when particles come into contact with seawater with higher salinity. In case of salinity of less than 5 ‰ , approximately 12 % of 226Ra will be dissolved in water while the remainder continues on particles. If the salinity rises to 50 ‰, more than 80 % will be dissolved in water (Moore, 1981; cited in IAEA, 1990).
Norse Decom AS 9
ND/E-19/03: Naturally occurring radionuclides in the marine environment
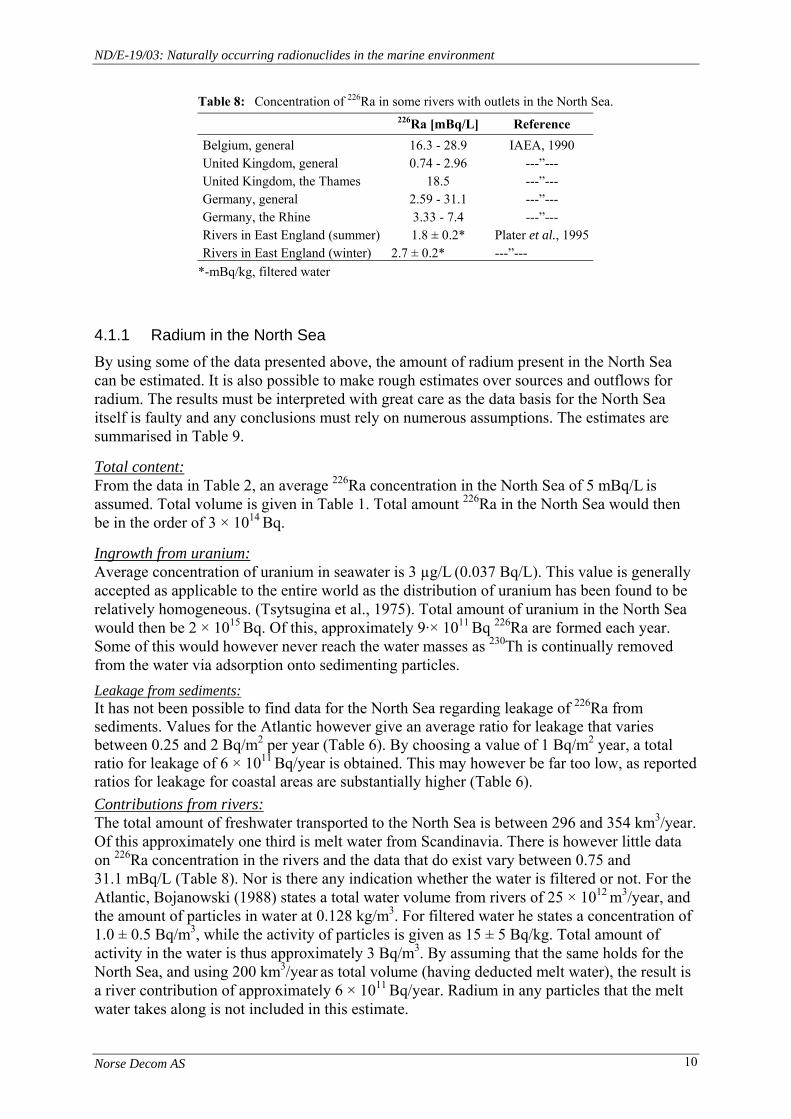
Table 8: Concentration of 226Ra in some rivers with outlets in the North Sea.
226Ra [mBq/L] Reference Belgium, general 16.3 - 28.9 IAEA, 1990 United Kingdom, general 0.74 - 2.96 ---”--- United Kingdom, the Thames 18.5 ---”--- Germany, general 2.59 - 31.1 ---”--- Germany, the Rhine 3.33 - 7.4 ---”--- Rivers in East England (summer) 1.8 ± 0.2* Plater et al., 1995 Rivers in East England (winter) 2.7 ± 0.2* ---”---
*-mBq/kg, filtered water
4.1.1 Radium in the North Sea By using some of the data presented above, the amount of radium present in the North Sea can be estimated. It is also possible to make rough estimates over sources and outflows for radium. The results must be interpreted with great care as the data basis for the North Sea itself is faulty and any conclusions must rely on numerous assumptions. The estimates are summarised in Table 9.
Total content: From the data in Table 2, an average 226Ra concentration in the North Sea of 5 mBq/L is assumed. Total volume is given in Table 1. Total amount 226Ra in the North Sea would then be in the order of 3 × 10¹⁴ Bq.
Ingrowth from uranium: Average concentration of uranium in seawater is 3 µg/L (0.037 Bq/L). This value is generally accepted as applicable to the entire world as the distribution of uranium has been found to be relatively homogeneous. (Tsytsugina et al., 1975). Total amount of uranium in the North Sea would then be 2 × 10¹⁵ Bq. Of this, approximately 9·× 1011 Bq 226Ra are formed each year. Some of this would however never reach the water masses as 230Th is continually removed from the water via adsorption onto sedimenting particles. Leakage from sediments: It has not been possible to find data for the North Sea regarding leakage of 226Ra from sediments. Values for the Atlantic however give an average ratio for leakage that varies between 0.25 and 2 Bq/m2 per year (Table 6). By choosing a value of 1 Bq/m2 year, a total ratio for leakage of 6 × 10¹¹ Bq/year is obtained. This may however be far too low, as reported ratios for leakage for coastal areas are substantially higher (Table 6). Contributions from rivers: The total amount of freshwater transported to the North Sea is between 296 and 354 km3/year. Of this approximately one third is melt water from Scandinavia. There is however little data on 226Ra concentration in the rivers and the data that do exist vary between 0.75 and 31.1 mBq/L (Table 8). Nor is there any indication whether the water is filtered or not. For the Atlantic, Bojanowski (1988) states a total water volume from rivers of 25 × 1012 m3/year, and the amount of particles in water at 0.128 kg/m3. For filtered water he states a concentration of 1.0 ± 0.5 Bq/m3, while the activity of particles is given as 15 ± 5 Bq/kg. Total amount of activity in the water is thus approximately 3 Bq/m3. By assuming that the same holds for the North Sea, and using 200 km3/year as total volume (having deducted melt water), the result is a river contribution of approximately 6 × 10¹¹ Bq/year. Radium in any particles that the melt water takes along is not included in this estimate.
Norse Decom AS 10

ND/E-19/03: Naturally occurring radionuclides in the marine environment
Radioactive fallout: With a total 226Ra amount of 3 × 10¹⁴ Bq in the North Sea, each year 1 × 10¹¹ Bq will be eliminated due to radioactive fallout.
Other sources and outflows: Other sources include contributions from groundwater and surrounding oceans. Table 6 appears to indicate that the contribution of groundwater is between 0.1 to 1 times the contribution from rivers. Data for the Atlantic ocean and the Baltic Sea in Tables 4 and 5 show that the 226Ra concentration in these areas is lower than in the North Sea. We can therefore assume that net contribution from the surrounding oceans is negative. We have however not attempted to estimate this in Table 9.
As the data basis for 228Ra is even more uncertain than for 226Ra, no attempt has been made to produce parallel estimates for 228Ra.
Table 9: 226Ra in the North Sea, estimates. The values must be interpreted with
caution as the basis for calculations is faulty. The lacking balance between sources and outflows is probably due to not having considered the contributions from surrounding oceans, which is probably negative. See text for comments.
226Ra Concentration ~5 mBq/L Total amount 3 × 10¹⁴ Bq Sources:
Ingrowing from uranium 9 × 10¹¹ Bq/year Leakage from sediments 6 × 10¹¹ Bq/year Contributions from rivers 6 × 10¹¹ Bq/year
Sinks: Radioactive fallout 1 × 10¹¹ Bq/year
4.2 Lead-210 and Polonium-210 in seawater
When 226Ra disintegrates (Fig. 1), a number of short-lived daughter nuclides (222Rn, 218Po, 214Pb, 214Bi, 214Po) are formed, before 210Pb (half-life 22.3 years) is formed. This is also the origin of 210Bi (half-life 5.013 days) and 210Po (half-life 138.38 days). The information in the next paragraph is taken from Cherry and Heyraud (1988) unless otherwise stated. 222Rn (radon-222), which is formed from 226Ra, is a rare gas that is continually emitted from the earth’s surface. The daughter products of 222Ra however are isotopes of metallic elements that are easily associated with particles and washed out of the atmosphere, ending on the earth’s ground or in the sea. The fallout rate of 210Pb varies both according to longitude and latitude, with the highest rate in the northern hemisphere, where most of the landmass is. The fallout rate is also higher in the east of Asia than in the west of Europe. In Western Europe the fallout rate varies between 16 and 22 atoms per cm2 and minute, which equals 8.3- 11.4 mBq/cm2 year. 210Pb in the ocean comes both from atmospheric fallout and from the ingrowing of 226Ra already present in the water. On the ocean surface atmospheric 210Pb is the most important source, while ingrowing of 226Ra is the most important source in the deeper water masses. The contribution from rivers has been considered non-significant. 210Po in the sea is formed
Norse Decom AS 11

ND/E-19/03: Naturally occurring radionuclides in the marine environment
exclusively from the ingrowing of 210Pb. Direct deposition of 210Po from the atmosphere is not even significant for surface water. Direct fallout of 210Po from the atmosphere has been calculated to amount to 10 % of the fallout of 210Pb (Bacon et al., 1976). Cherry and Heyraud claim that both 210Pb and 210Po are mainly dissolved in water (90 % and 80 % respectively) and not associated with particles larger than 0.4 µm. In coastal areas there is often, but not always, less 210Pb than in the open sea. This indicates that 210Pb is removed more rapidly from the water masses in the coastal areas. The concentration of 210Po on the other hand is approximately the same as in the open sea. This is also evident in the ratio between the two (210Po/210Pb), which can often be >1 near the coast.
Considering the water columns together, the ratio between 210Po and 210Pb approximately equal to 1. In the surface water the ratio is typically 0.6, which indicates that 210Po, is, overall, removed more rapidly from the water column than 210Pb. Between 100 and 300 metres the ratio can be larger than 1, probably due to recycling of 210Po. Under 300 metres the ratio is usually equal to 1, all the way to the ocean floor. 210Po is removed from the water masses via adsorption on particle surfaces (organic as opposed to inorganic) and through uptake in phytoplankton and zooplankton. 210Pb is removed via adsorption on particles, inorganic rather than organic ones (IAEA, 1995).
From the ocean floor and approximately one hundred metres upwards, there is a substantial surplus of 222Rn, which is diffused to the water masses through interstitial water in the ocean floor sediments. Despite a clear concentration gradient for 222Rn, the 210Pb concentration is near constant with the depth for the bottom 250 metres. This is primarily due to rapid vertical mixing in the water columns, but also to some degree to washing out to the sediments. (Nozaki, 1986)
There is often an excess of 210Pb in relation to 226Ra in the surface water and down to a depth of approximately 500 metres. This is due to the deposit of 210Pb from the atmosphere. Further down, more 210Pb is removed than 226Ra, and the ratio is reduced to below 1. Chung (1981) has studied the distribution of 226Ra and 210Pb in the Antarctic. They found that 226Ra was evenly distributed in the entire area with somewhat lower concentration in the surface water, while the 210Pb concentration varied both according to depth and location. They found the highest concentration in depths where the oxygen content was the lowest and the temperature and salinity the highest.
Both lead and polonium show a higher affinity towards particles than radium. Recommended Kd values are given by IAEA (1985) both for the open sea and for coastal areas. These are 1 × 10⁷ and 2 × 10⁵ respectively for lead, and 2 × 10⁷ and 2 × 10⁷ for polonium.
The total amount of 210Pb in the different ocean areas is given in Table 10. The total amount (globally) equals 61 ± 11% of the amount of 226Ra. The data on 210Po is limited, but the concentration is assumed to be approximately the same as for 210Pb as the ratio between these two, considering the water column as one, is approximately equal to 1 in all three oceans. In a data collection carried out by IAEA (1995) a value of 1.0 ± 0.5 Bq/m3 for 210Po is recommended for seawater.
Norse Decom AS 12

ND/E-19/03: Naturally occurring radionuclides in the marine environment
Table 10: Concentrations and amounts of 210Pb in different oceans. (Cherry and Heyraud, 1988)
Area 210Pb [mBq/L] 210Pb [PBq]*The Atlantic Ocean 1.57 ± 0.35 544 ± 121 The Pacific Ocean 2.59 ± 0.69 1831 ± 488 The Indian Ocean 1.84 ± 0.43 520 ± 122 Total: 2895 ± 517
*PBq = 1015 Bq
4.2.1 Lead-210 and polonium-210 in the North Sea
Cherry and Heyraud (1988) have, based on data published by Spencer et al., (1980), described the North Sea as an atypical area with regard to 210Pb and 210Po. Almost all measured 210Po/210Pb ratios are larger than 1, which is due to unusually low 210Pb concentrations (as coastal areas), while the concentration of 210Po is above the norm. It has been suggested that 210Pb in the North Sea is removed via biological processes as well as adsorption to particles. Similarly, it has been suggested that 210Po is recovered from the ocean floor.
The total amount of 210Pb and 210Po in the North Sea has, from the data shown in Table 2, been calculated by Cherry and Heyraud (1988) as 40 ± 23 and 44 ± 13 TBq respectively (TBq = 1012 Bq).
4.3 Uranium and thorium in seawater.
The distribution of uranium in seawater has been found to be relatively homogenous (Tsytsugina et al., 1975). The average concentration for all the world’s oceans is thus generally considered to be 3µg/L (0.037 Bq/L). The concentration of thorium is much lower, a mere 0.05 µg/L (0.0002 Bq/L). An overview of the total amount of uranium and thorium in seawater is shown in Table 3. Based on the total volume of the North Sea basin the total amounts of uranium and thorium in the North Sea are calculated at 2 × 10¹⁵ and 1 × 10¹³ Bq, respectively.
Thorium is much less soluble than uranium in water, as is evident from recommended Kd values from IAEA (1985). For the open sea these are 5 × 10² and 5 × 10⁶ for uranium and thorium respectively, while corresponding values for the coastal areas are 1 × 10³ and 2 × 10⁶.
The amount of thorium in rivers is low, but some thorium is transported to the sea with particles transported by the rivers and then deposited on the ocean floor. (Coward and Burnett, 1994). The same authors give the concentration of dissolved uranium in rivers as between 0.083 and 4.8 mBq/L. Windom et al. (2000) has calculated total fluvial transport of uranium to the sea to amount to 3.3 × 10⁷ mol/year (9.8 × 10¹³ Bq/year). The same authors have also calculated the amount of uranium that is removed from river water by the time it reaches its outlet to be 2.7 × 10⁷ mol/year (8.0 × 10¹³ Bq/year).
Nicholson and Stuart (1986) have studied uranium in North Sea sediments. The area of study was the British part of the North Sea, and the highest concentration was found in the sediments off the coast of East Anglia, nearly 15 ppm uranium (185 Bq/kg). Average concentration was 1.1 ppm (13.6 Bq/kg). The authors found the highest concentration in sediments rich in organic material.
Norse Decom AS 13

ND/E-19/03: Naturally occurring radionuclides in the marine environment
5 Anthropogenic sources of natural radioactivity in the sea
5.1 The oil and gas industry
Both uranium and thorium occur naturally in varying concentrations in the bedrock. Through radioactive fallout they continually give rise to the radium isotopes 226Ra and 228Ra. Radium is more soluble in the formation water than either uranium or thorium, and will therefore leak into the formation water and be transported upwards in the production equipment. Furthermore, radium has chemical properties corresponding to those of barium and strontium, and will therefore be precipitated together with these as carbonates or sulphates when the pressure and temperature conditions in the production equipment change. These deposits are often called LSA scale (Low Specific Activity scale) or NORM (Naturally Occurring Radioactive Material). NORM is a more ample term than the two former terms, and LSA scale is considered to be a type of NORM. The term TENORM (technologically enhanced NORM) is also used occasionally. These deposits are primarily a waste problem, as they must be treated as radioactive waste if the activity concentrations exceed the limits set by the authorities. In Norway these limits are set at 10 Bq/g for each of the three nuclides 226Ra, 228Ra and 210Pb (NRPA, 1997).
Produced water is a mixture of the formation water that is present in the reservoir prior to production, and seawater that is pumped into the reservoir to maintain pressure. This water also contains some dissolved radium. On the Norwegian Shelf most of the produced water is discharged into the sea, and in 2002 only 12.2 % of water was re-injected into the reservoirs. The percentage that is re-injected has, however, risen from 10.1 % in 2001. Since 1993 water production in relation to oil production has risen. In 1993 the ratio between produced water and produced oil was 0.19. By 2002 this ratio had risen to 0.74, and is expected to continue to rise in future years. The reason is that several of the large oil fields on the Norwegian Shelf have reached a mature production phase with an ever increasing water share. The share of water in percent of the total production is therefore rising. (OLF, 2003).
The OSPAR convention’s recommendation on handling water produced from offshore installations (OSPAR 2001) states:
3.1 The overall goal of this Recommendation is to: a. reduce the input of oil and other substances into the sea resulting from produced water from offshore installations, with the ultimate aim of eliminating pollution from those sources;
….
3.5 By 2020, Contracting Parties should achieve: b. in accordance with the objective and the timeframe of the OSPAR Strategy with regard to Hazardous Substances, a continuous reduction in discharges of hazardous substances via produced water, by making every endeavour to move towards the target of cessation of discharges of hazardous substances with the ultimate aim of achieving concentrations in the marine environment near background values for naturally occurring substances and close to zero for man-made synthetic substances
…
Norse Decom AS 14

ND/E-19/03: Naturally occurring radionuclides in the marine environment
4.1.2. The prevention and elimination of pollution by oil and other substances caused by discharges of produced water into the sea should be achieved by a reduction of the volume of produced water discharged into the sea (e.g. by injection, downhole separation or water shutoff) and/or a reduction of concentrations of oil and other substances in produced water.
A summary of existing data on produced water and radioactivity was carried out in 2002 and is presented in the report “Produsert vann og radioaktivitet - sammenfatning av eksisterende data (Produced water and radioactivity - a summary of existing data)” (Strålberg et al., 2002). The report concludes that typical concentrations of radioactivity in produced water lie in the region of 3.8 - 4.8 Bq/L for 226Ra and in the region of 2.1 - 4.2 Bq/L for 228Ra. No values for 210Pb in produced water were reported. The discharge of 226Ra from the Norwegian Shelf was estimated to lie between 0.07 and 2.3 TBq/year. The data presented in the report was principally based on measurements that were made without reference to source information. Only the measurements given by Strand et al. (1997) gave platform-specific data (11 platforms). Strålberg et al. (2002) has also summarised some data for produced water from different locations in the world. Most of these measurements lie below 10 Bq/L. However, values significantly above this were measured in some sites, with the highest concentration reported being 59.9 Bq/L in produced water from Oklahoma.
In his synthesising study (which primarily considers fields in the USA, but some other locations are also named) Fisher (1998) reports that 48.4 % of all samples included in the study had 226Ra concentrations below 100 pCi/L (3.7 Bq/L), 74.9 % contained less than 300 pCi/L (11.1 Bq/L), and only 10.7 % contained more than 1000 pCi/L (37 Bq/L). Fisher also reported that there did not appear to be any correlation between radium in the produced water and the type of reservoir or location. Kraemer and Reid (1984) found, in their study of radium in salty formation water, a clear correlation between the radium content in the water and salinity. The higher the salinity, the higher they found the radium concentration in the water to be.
Vegueria et al. (2002 a, b) has measured the concentration of radium in a number of samples of produced water from platforms in the Bacia de Campos field off the coast of Brazil. The concentration varied between < 0.01 and 6.0 Bq/L and < 0.05 and 12.0 Bq/L for 226Ra and 228Ra respectively. The authors observed a clear correlation between radium and barium contents in the samples. The emission of 226Ra and 228Ra from one of the platforms were 30 and 41 MBq/day respectively.
In order to study whether the discharges of produced water affected the concentration of radium in the environment, samples of seawater and sediments were collected from different distances to two of the platforms, and analysed for both radium isotopes. Even at the shortest of the distances (250 m) it was impossible to observe an increase in the radium concentration in the seawater or in the sediments.
The model calculations described by Strand et al. (1997) state dilution factors for discharges of produced water as summarised in Table 11.
Norse Decom AS 15

ND/E-19/03: Naturally occurring radionuclides in the marine environment
Table 11: Results of calculations for concentrations of water masses (given as dilution) as a result of discharge of radioactive material in production water. Water amount: 258 L/s (Strand et al., 1997)
Ratio Dilution (production water in the seawater) Distance 10-20 km Distance 200-250 km Discharge in summer conditions 1:2 000-1:20 000 1:200 000 Discharge in winter conditions 1:20 000-1:200 000 1:1 000 000
In 1995 and 1996 studies of the chemical composition of produced water from Oseberg field centre, Oseberg C, Brage and Troll B in the North Sea were carried out (Utvik, 1999). Measurements of radium isotopes were included in the study. Some of the results from the study are summarised in Table 12.
By using the given activity concentrations together with the emissions data, it is possible to calculate the emissions of 226Ra in 1996 from each of these three platforms to lie between 25 and 72 MBq/day. These numbers are in the same range as the emissions detailed by Vegueria et al. (2002b). We can therefore assume that no radium concentrations deviating significantly from the background values in the areas will be found in distances from 250 metres surrounding these platforms, providing that the background values are comparable with the background level in the study of Vegueria et al. (2002b).
Table 12: Results from studies of produced water from platforms in the North Sea (data from
1996). The uncertainty in the activity concentration is given as 10% (one significant deviation) (Utvik, 1999).
Field Oil production [m3/year]
Discharge of produced water [m3/year]
226Ra [Bq/L]
228Ra [Bq/L]
Oseberg 29 000 000 1 432 000 6 - 7 < 2 - 11 Brage 7 000 000 1 856 000 9 17 Troll 14 500 000 4 382 000 6 7
There is little data on other nuclides in produced water. Landa and Reid (1982) have, however, measured both 226Ra and uranium in produced water and compared these values with background concentrations in marsh water in the vicinity of the installation. As expected, there was much more 226Ra in the produced water (176 pCi/L = 6.5 Bq/L) than in the marsh water (0.16 pCi/L = 0.006 Bq/L). The reverse was the case for uranium: 0.13 µg/L (0.0016 Bq/L) in the produced water and 1.4 µg/L (0.017 Bq/L) in the marsh water. This reflects the fact that radium is generally much more soluble in the salty production water than uranium.
5.1.1 The Norwegian Continental Shelf
An overview of the total oil, gas and water production on the Norwegian Continental Shelf in the last four years is given in Table 13.
Norse Decom AS 16

ND/E-19/03: Naturally occurring radionuclides in the marine environment
Table 13: Overview of total oil, gas and water production on the Norwegian Shelf, o.e. = oil equivalent (OLF 2000, 2001, 2002, 2003).
Year Produced oil and condensate #
Produced water Amounts of water re-injected
Water/oil ratio
Produced gas
[million Sm3 o.e.] [mill.m3] [%] [mill. Sm3 o.e.] 1999 183.2 108.0 8.4 0.60 80.8 2000 190.0 116.1 8 0.61 91.8 2001 187.9 130.0 10.1 0.69 93.5 2002 185.2 136.3 12.2 0.74 105.5
Sm3 = standard m3 at 15º C and 1.01325 bar Definitions supplied by the Norwegian Petroleum Directorate (NPD, 2003): # 1.3 Sm3 o.e. condensate = 1 tonne condensate * 1 Sm3 o.e. gas = 1000 Sm3 gas
With help from OLF, it has been possible to collect platform-specific data on discharge of produced water and the activity concentration in the water. The oil companies were asked to supply values for 226Ra and, where possible, 228Ra and 210Pb. It was expected that most companies had merely measured 226Ra in the produced water.
The information supplied by the oil companies on radioactivity in produced water is summarised in Table 14. As expected, none had reported results for nuclides other than 226Ra.
Based on the data in Table 14 the average for 226Ra in produced water (weighted with regard to the amount of produced water per installation) is calculated at 2.49 Bq/L for 2002. The same year a total of 136.3 million m3 was produced, of which 12.2 % were re-injected.
By looking more closely at Table 14, we see that only a few installations are responsible for most of the discharge in terms of activity. The two installations 34 and 35 only discharged 14 % of the total amount of water discharged in 2002, while 52 % of the activity came from these installations. Together with 5, 16 and 23, these five installations were responsible for 78 % of the amount of activity.
On the background of data from Strand et al. (1997), we can also assume that the activity of 228Ra in produced water is in the same range of the activity as 226Ra. It has not been possible to obtain data for 210Pb in produced water.
Norse Decom AS 17

ND/E-19/03: Naturally occurring radionuclides in the marine environment
Table 14: 226Ra in produced water from Norwegian installations. Most of the stated activity concentrations are an average of two or three measurements.
Installation 2000 2001 2002
No. Discharge[m3]
226Ra [Bq/L]
226Ra [GBq]
Discharge[m3]
226Ra[Bq/L]
226Ra[GBq]
Discharge [m3]
226Ra [Bq/L]
226Ra[GBq]
1 371,282 4.8 1.8 679,311 2.2 1.5 2 934,840 0.93 0.87 1,243,000 0.33 0.41 3 308,398 7.0 2.1 320,768 5.2 1.7 4 188,223 3.0 0.56 397,753 4.2 1.7 818,334 2.7 2.2 5 821,409 6.4 5.3 4,507,658 6.4 29 6,791,800 6.4 43 6 105,200 3.7 0.39 7 92,600 2.1 0.19 8 464,300 7.7 3.6 9 6,637,677 0.16 1.1 10 12,305,187 0.42 5.1 11 6,913,135 0.97 6.7 12 4,707,850 0.59 2.8 13 12,694,927 0.19 2.4 14 13,241,243 0.067 0.89 15 14,964,402 0.32 4.8 16 1,351,031 14 19 17 43,728 0.043 0.0019 18 203,583 1.6 0.33 19 48,207 0.083 0.0040 20 973,747 0.12 0.12 21 464,340 7.9 3.7 22 561,512 7.7 4.3 504,783 7.5 3.8 23 2,008,960 8.4 17 24 * 3.9 25 498,215 0.60 0.30 1,599,000 0.23 0.37 26 55,016 3.8 0.21 100,959 9.5 1.0 27 1,295,625 0.50 0.65 726,581 0.63 0.46 28 1,694,244 4.1 6.9 1,317,771 11 15 29 749 15 0.011 30 2,022 < 0.1 < 0.00020 1,999 7.4 0.015 31 396,500 8.3 3.3 32 7,224,340 0.40 2.9 6918,900 0.30 2.1 33 304,675 0.93 0.28 34 8,041,537 7.0 56.3 10,014,474 9.5 95 35 8,109,258 9.8 79.5 7,640,358 8.3 63 36 3,213,000 0.6 1.9 37 495,000 0.9 0.45 38 1,835,000 1.1 2.0 39 343,000 0.2 0.069 40 168,000 0.2 0.034 41 377,000 1.4 0.53 Total: 123,000,000 306 Weighted average 2.49 *Year of measurement or volume of water discharged not given. GBq = 109Bq
Norse Decom AS 18
ND/E-19/03: Naturally occurring radionuclides in the marine environment
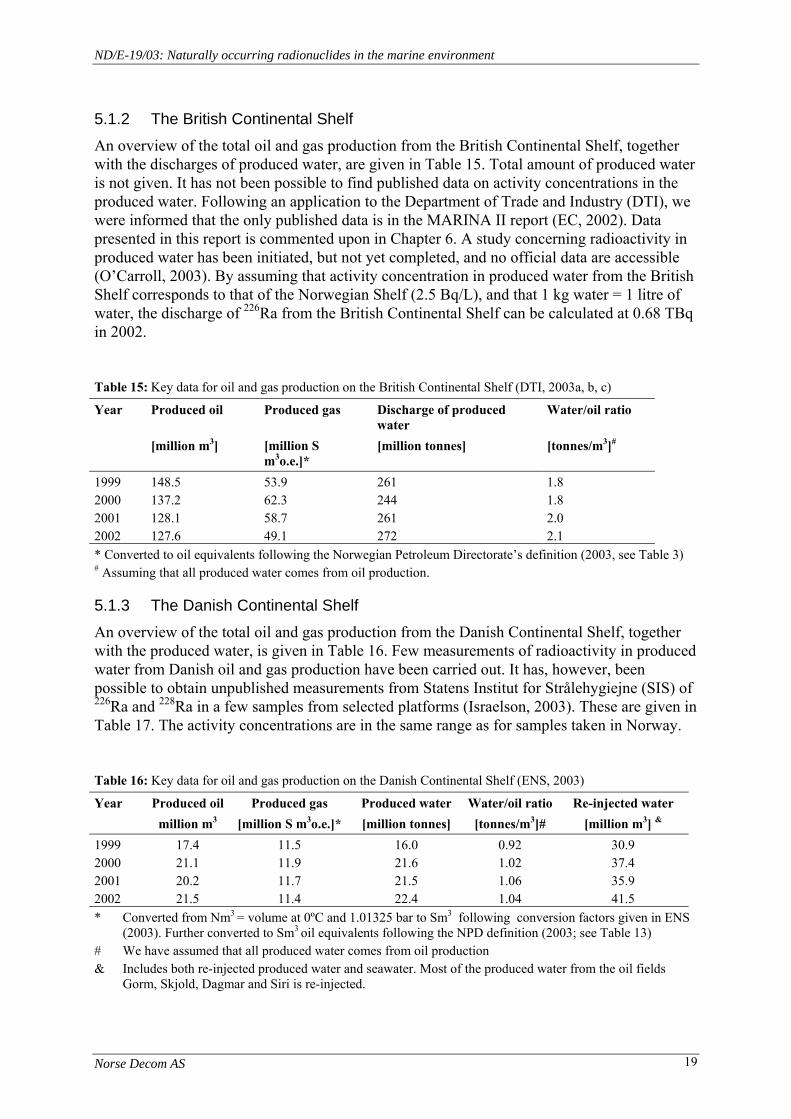
5.1.2 The British Continental Shelf An overview of the total oil and gas production from the British Continental Shelf, together with the discharges of produced water, are given in Table 15. Total amount of produced water is not given. It has not been possible to find published data on activity concentrations in the produced water. Following an application to the Department of Trade and Industry (DTI), we were informed that the only published data is in the MARINA II report (EC, 2002). Data presented in this report is commented upon in Chapter 6. A study concerning radioactivity in produced water has been initiated, but not yet completed, and no official data are accessible (O’Carroll, 2003). By assuming that activity concentration in produced water from the British Shelf corresponds to that of the Norwegian Shelf (2.5 Bq/L), and that 1 kg water = 1 litre of water, the discharge of 226Ra from the British Continental Shelf can be calculated at 0.68 TBq in 2002.
Table 15: Key data for oil and gas production on the British Continental Shelf (DTI, 2003a, b, c)
Year Produced oil Produced gas Discharge of produced water
Water/oil ratio
[million m3] [million S m3o.e.]*
[million tonnes] [tonnes/m3]#
1999 148.5 53.9 261 1.8 2000 137.2 62.3 244 1.8 2001 128.1 58.7 261 2.0 2002 127.6 49.1 272 2.1 * Converted to oil equivalents following the Norwegian Petroleum Directorate’s definition (2003, see Table 3) # Assuming that all produced water comes from oil production.
5.1.3 The Danish Continental Shelf An overview of the total oil and gas production from the Danish Continental Shelf, together with the produced water, is given in Table 16. Few measurements of radioactivity in produced water from Danish oil and gas production have been carried out. It has, however, been possible to obtain unpublished measurements from Statens Institut for Strålehygiejne (SIS) of 226Ra and 228Ra in a few samples from selected platforms (Israelson, 2003). These are given in Table 17. The activity concentrations are in the same range as for samples taken in Norway.
Table 16: Key data for oil and gas production on the Danish Continental Shelf (ENS, 2003)
Year Produced oil Produced gas Produced water Water/oil ratio Re-injected water million m3 [million S m3o.e.]* [million tonnes] [tonnes/m3]# [million m3] &
1999 17.4 11.5 16.0 0.92 30.9 2000 21.1 11.9 21.6 1.02 37.4 2001 20.2 11.7 21.5 1.06 35.9 2002 21.5 11.4 22.4 1.04 41.5 * Converted from Nm3 = volume at 0ºC and 1.01325 bar to Sm3 following conversion factors given in ENS
(2003). Further converted to Sm3 oil equivalents following the NPD definition (2003; see Table 13) # We have assumed that all produced water comes from oil production & Includes both re-injected produced water and seawater. Most of the produced water from the oil fields
Gorm, Skjold, Dagmar and Siri is re-injected.
Norse Decom AS 19

ND/E-19/03: Naturally occurring radionuclides in the marine environment
In the report from ENS (2003) there are no figures for discharge of produced water, and as the volume of re-injected water also includes seawater, it is impossible to calculate how much of the water is actually discharged. However, the amount of water is much smaller than that from the Norwegian and British shelves. By assuming that all water is discharged and all average activity in the water is as for the Norwegian Continental Shelf (2.5 Bq/L), we obtain a maximum value for discharges of 226Ra of 0.06 TBq/year in 2002.
Table 17: Data concerning radioactivity in produced water
from the Danish Shelf (Israelsson, 2003)
Field Year 226Ra (Bq/kg) Dan 2000 b.d.l. Syd Arne 2001 1.11 (± 20%) Syd Arne SA04 2001 9.5 (± approx. 10%) Syd Arne degaser 2001 4.3 (± approx. 10%)
b.d.l. = below detection level
5.1.4 The Dutch Continental Shelf In previous years installations on the Dutch Shelf required permission for discharges of radioactivity via produced water. As a result of the introduction of less strict requirements this is no longer necessary, providing the discharges are below the level permitted by the new discharge limits. These discharge limits are as follows (Staatblad, 2001):
226Ra 10 GBq/year 228Ra 100 GBq/year 210Pb 10 GBq/year 228Th 1000 GBq/year
If an installation wishes to discharge more than is permitted by the above limits, it requires a discharge permit for this. If more than one of the nuclides is released, the following conditions must be fulfilled:
1<∑Nuclides Permitted
Emission
An overview of the total oil and gas production from the Dutch Shelf, together with the amount of produced water, is given in Tables 18 and 19. The amount of produced water is not given; the data only indicates how much is released.
Norse Decom AS 20
ND/E-19/03: Naturally occurring radionuclides in the marine environment
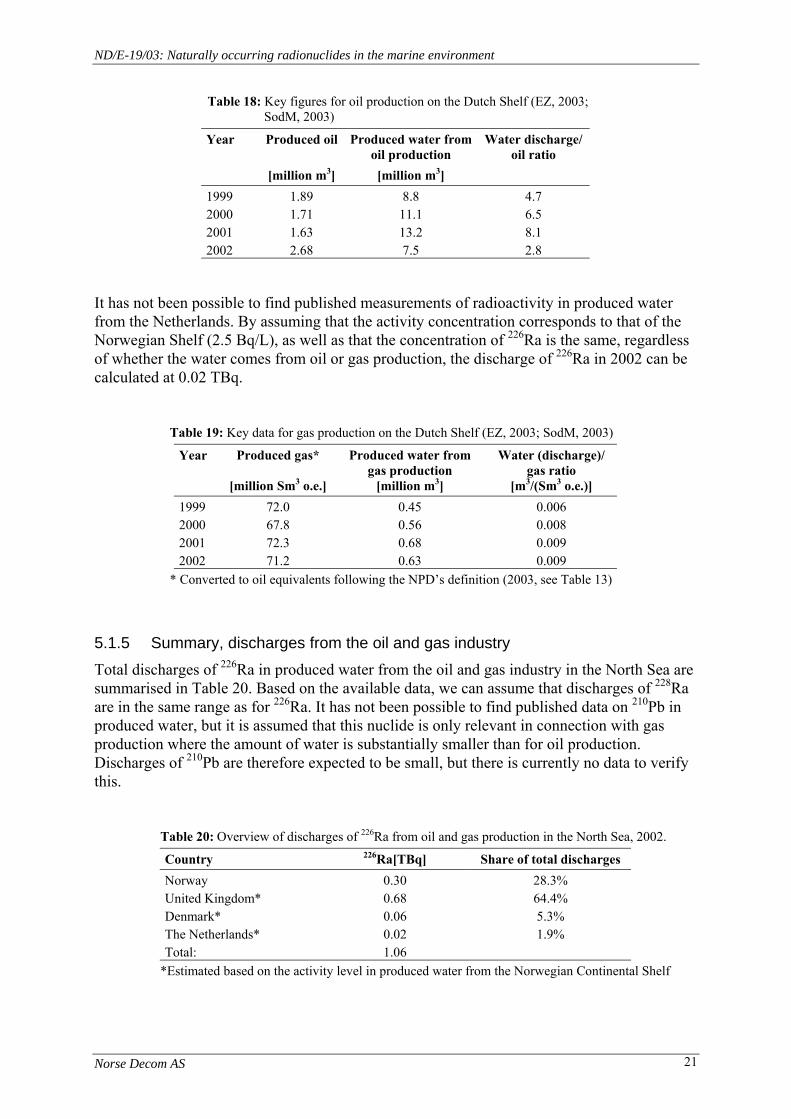
Table 18: Key figures for oil production on the Dutch Shelf (EZ, 2003; SodM, 2003)
Year Produced oil Produced water from oil production
Water discharge/ oil ratio
[million m3] [million m3] 1999 1.89 8.8 4.7 2000 1.71 11.1 6.5 2001 1.63 13.2 8.1 2002 2.68 7.5 2.8
It has not been possible to find published measurements of radioactivity in produced water from the Netherlands. By assuming that the activity concentration corresponds to that of the Norwegian Shelf (2.5 Bq/L), as well as that the concentration of 226Ra is the same, regardless of whether the water comes from oil or gas production, the discharge of 226Ra in 2002 can be calculated at 0.02 TBq.
Table 19: Key data for gas production on the Dutch Shelf (EZ, 2003; SodM, 2003)
Year Produced gas*
[million Sm3 o.e.]
Produced water from gas production
[million m3]
Water (discharge)/ gas ratio
[m3/(Sm3 o.e.)] 1999 72.0 0.45 0.006 2000 67.8 0.56 0.008 2001 72.3 0.68 0.009 2002 71.2 0.63 0.009
* Converted to oil equivalents following the NPD’s definition (2003, see Table 13)
5.1.5 Summary, discharges from the oil and gas industry Total discharges of 226Ra in produced water from the oil and gas industry in the North Sea are summarised in Table 20. Based on the available data, we can assume that discharges of 228Ra are in the same range as for 226Ra. It has not been possible to find published data on 210Pb in produced water, but it is assumed that this nuclide is only relevant in connection with gas production where the amount of water is substantially smaller than for oil production. Discharges of 210Pb are therefore expected to be small, but there is currently no data to verify this.
Table 20: Overview of discharges of 226Ra from oil and gas production in the North Sea, 2002.
Country 226Ra[TBq] Share of total discharges Norway 0.30 28.3% United Kingdom* 0.68 64.4% Denmark* 0.06 5.3% The Netherlands* 0.02 1.9% Total: 1.06
*Estimated based on the activity level in produced water from the Norwegian Continental Shelf
Norse Decom AS 21
ND/E-19/03: Naturally occurring radionuclides in the marine environment
5.2 Other industries/activities
Concentration and discharges of natural radioactivity will also occur in a series of other industries/activities, including:
- the phosphate industry (production of artificial fertiliser). - the mineral sand industry. - production of thorium products. - the ceramic industry. - the combustion of fossil fuels. - mining activities (not uranium). UNSCEAR (2000) considers the phosphate industry as the most important industry with regard to discharges to water of naturally occurring radionuclides. The oil and gas industry comes in second place. The principal source for discharges from the phosphate industry is from the production of phosphoric acid using sulphuric acid, where natural radionuclides come with the by-product phosphorous gypsum (phosphogypsym), which is often discharged into water.
The discharges to the North Sea from the phosphate industry have been significantly reduced the last few years. This is among other factors owing to the fact that more installations have begun to import phosphoric acid from other places in the world instead of producing it themselves; improved treatment of discharged water; changes in the processes or storage of the phosphorous gypsum on shore.
A thorough overview and description of non-nuclear industries that can lead to increased exposure to natural radioactivity is supplied by Gäfvert (2002).
5.2.1 The Netherlands
Two large facilities at Vlaardingen and Vondelingplaat for the production of phosphoric acid were closed in 1999 and 2000. In 1990 these two emitted 1.74 TBq 226Ra into the mouth of the Rhine. In 1993 - 1994 discharges were reduced to 0.6 - 0.8 TBq. Discharges of 210Pb and 210Po were reduced correspondingly in the same period. A facility near Vlissingen is still in operation, but discharges from this facility have always been much lower than discharges from the other two facilities. This facility only discharges 210Pb and 210Po, and these discharges were 166 and 24 GBq, respectively in 1992. In 1999 they were correspondingly reduced to 2.4 and 1.8 GBq (OSPAR, 2002).
Köster et al. (1985) has estimated that a discharge of 2 × 10¹² g phosphorous gypsum to the Rhine every year would lead to a relative increase in the coastal zone of 0.5 to 2 times the natural background for a number of nuclides in the 238U series.
Other industries in The Netherlands emitting natural radioactivity to the North Sea include a facility for titanium pigment production. In 1991 this emitted 0.5 and 0.07 GBq of 210Pb and 210Po respectively. An iron and steel works in The Netherlands emitted 3.3 and 0.5 GBq of the same nuclides in 1999 (OSPAR, 2002).
Norse Decom AS 22

ND/E-19/03: Naturally occurring radionuclides in the marine environment
5.2.2 The United Kingdom
There is a large phosphate facility in Whitehaven by the Irish Sea. Discharges from this facility will be transported with the ocean currents to the North Sea. Emissions of 226Ra reached their apex in 1983 with 0.86 TBq. Emissions of 210Pb and 210Po in the same year were 0.54 and 0.55 TBq respectively (Camplin et al., 1996). In 1992 the installation began to import phosphorous acid instead of producing it, and emissions of 226Ra were drastically reduced to 0.0011 TBq in 1993 (Poole et al., 1995; Camplin et al., 1996)
There is a facility at Aberdeen that, among other things, removes LRA from components from the oil industry. In 1999 emissions of 226Ra and 228Ra with their daughters were 2.4 and 2.1 GBq (OSPAR, 2002).
At Blackhall, gravel from coal mining is dumped directly into the North Sea. Due to this, higher concentrations of naturally occurring radionuclides are observed in the surroundings (McDonald et al., 1992).
Baxter et al. (1996) has studied literature that describes the occurrence of naturally occurring radioactivity in the vicinity of a tin smelting plant in north-east England. The smelting plant emitted 4·106 litres of liquid waste each day. Monitoring of the waste indicated a concentration of 210Po and other radionuclides were below the detection limit. Maximum concentration of 210Po was 1 Bq/L.
5.2.3 Belgium
Emissions of radioactivity from an inorganic fertiliser plant in Antwerpen were substantially reduced when the plant began using nitric acid instead of sulphuric acid in 1992. In this manner the production and discharge of phosphogypsum was avoided (EC, 2002).
5.2.4 Denmark
No data for discharges of phosphogypsum have been found, but the MARINA II report (EC, 2002) mentions a number of such plants in Denmark (Fredericia, Aalborg and Kattegat). On the basis of results presented in the report, it appears that discharges were much reduced in 1993 and 1994, and that discharges after these dates have been close to zero.
5.2.5 Germany
The exploitation of uranium from the Wismut area in Germany ceased in 1990, and the area is now recovering (Diehl, 2003). Some natural radioactivity however oozes out to rivers in the area and is transported on via the river Elbe into the North Sea. In 1999 this “discharge” of 226Ra was 2.7 GBq. Increased levels of this natural radioactivity have been found in some minor rivers in the area, but no increased levels have been detected in the river Elbe (OSPAR, 2002).
Norse Decom AS 23
ND/E-19/03: Naturally occurring radionuclides in the marine environment
6 The MARINA II study The original MARINA study (CEC, 1990) summarised data on emissions from nuclear industry and research in the United Kingdom, Germany, the Netherlands, Belgium, France, Denmark, Switzerland, Finland and Sweden to the middle of the 1980’s. The MARINA II study continued this work but also included emissions from radioactivity from non-nuclear industries.
The authors of the MARINA II report (EC, 2002) have collected data on the amount of oil and gas produced from the four countries the United Kingdom, Norway, Denmark and The Netherlands , but have not so far succeeded in obtaining data on discharges of produced water and concentrations of radioactivity in the water. Nor has it been possible in this study to obtain much data on radioactivity in produced water other than for the Norwegian Shelf, but the data on the amount of produced water for the other countries is easily available on the Internet. (See Chapter 5.1)
In order to make estimates on the amount of radioactivity discharged via produced water without knowledge either on the amount of produced water discharged or on the concentrations of radioactivity in the water, the authors have based themselves on production figures for oil and gas production in the four countries. Furthermore, reference is made to a rather extensive set of unpublished and confidential data from the Netherlands that has been used to deduce a normalised ratio for the emission of radionuclides per volume unit of produced oil and gas. The authors emphasise that this only provides a basis for rough estimates due to great variation in the concentration of activity and volume produced water between different platforms and over time.
The authors have assumed a fixed ratio of 3:1 between volume produced water and volume produced oil (3m3 water for every m3 oil) and a ratio of 5 × 10⁻⁵:1 between volume produced water and volume produced gas (50 m3 water for every million Sm3 gas). The ratios are intended as reference values, that is, average values for all the platforms in the area concerned throughout their time of use. The authors of the MARINA II report also suggest that a ratio of 3:1 between water and oil is too optimistic, i.e. that this figure underestimates water production. The ratio for the Dutch Shelf (Table 18) was 2.8 in 2002, but as high as 8.1 in 2001, and it is possible that it is these figures the authors have used as a basis for their choices.
The book “Bioaccumulation in marine organisms. Effects of contaminants from oil well produced water” (Neff, 2002) provides a brief description of the production of water from an oil or gas field. Early on in the production phase relatively little water is produced, but as production continues, the amount rises. In an old, nearly emptied oil field as much as 95 % water and only 5 % fossil fuel may be produced. Throughout the entire oil field’s lifetime the amount of produced water can be as much as 10 times the amount of fossil fuel produced. Gas fields generally produce less water than oil fields.
Based on this knowledge, a ratio of 3:1 between produced water and oil appears probable. However, as indicated by Table 20, the oil and gas production of Norway and the United Kingdom are responsible for the bulk of these discharges. In 2002 the ratio between water and oil in these countries was 0.74 (produced water) and 2.1 (discharge of produced water) respectively. Although these figures are likely to rise further in future years, assuming that the volume of water is three times the volume of oil would be overestimating the discharge of produced water.
Norse Decom AS 24
ND/E-19/03: Naturally occurring radionuclides in the marine environment
With regard to the concentration of radionuclides in the produced water, the MARINA II authors refer to data presented by Strand and Lysebo (available in Strand et al., 1997), as well as a set of unpublished and confidential data from the Netherlands. Most measurements of produced water from the North Sea reported by Strand et al. (1997) vary from below the detection limit to approximately 10 Bq/L for both 226Ra and 228Ra. The authors of the MARINA II report, however, refer to a concentration interval from below 0.1 to approximately 200 Bq/L for all three nuclides 226Ra, 228Ra and 210Pb. Finally, they estimate average 226Ra and 228Ra concentrations of produced water from all oil producing platforms to 10 Bq/L throughout the platforms’ entire lifetime. Concentrations of 226Ra, 228Ra, and 210Pb are estimated at respectively 10, 3 Bq/L and 5 Bq/L.
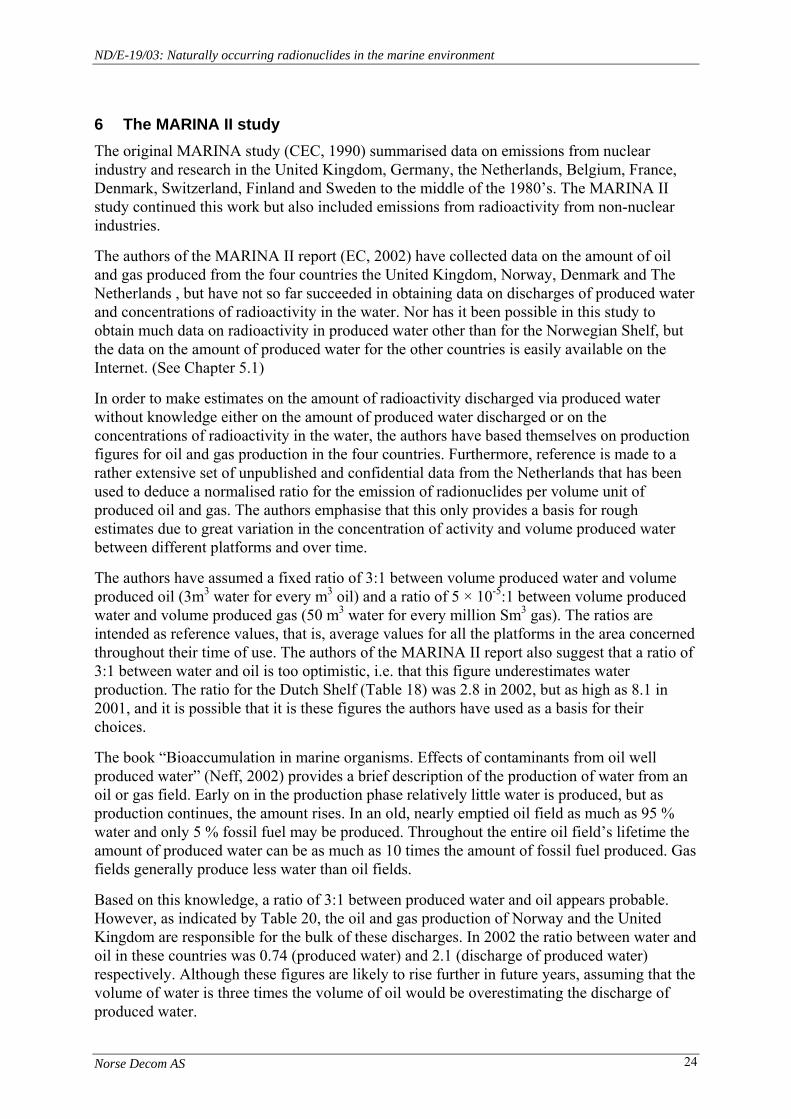
Table 21: Calculated discharges of 226Ra from the MARINA II report. Calculated discharges (2002)
for this study are included for purposes of comparison.
Country MARINA II This study (2002) Max. emission of
226Ra Emissions of 226Ra
in 1999 Emissions of 226Ra
TBq Year TBq TBq Norway 5.5 1997 5.2* 0.30 United Kingdom 4.6 1999 4.6 0.68 Denmark 0.5 1999 0.5 0.06 The Netherlands 0.1 1986 0.05* 0.02 Total: 10.8 1.06
* Read from diagram
None of the data from the Norwegian and Danish Shelves (Tables 14 and 17) support such a high average activity concentration of 226Ra in the produced water. Based on the Norwegian data from 2002 the average concentration of 226Ra in produced water from the Norwegian Shelf was 2.5 Bq/L. Table 21 provides a summary of discharges estimated in the MARINA II report together with the results from the study.
The MARINA II report concluded that the discharges of alpha emitters from oil and gas production in the North Sea stabilised at approximately 10 TBq/year in the course of the latter half of the 1990’s. However, this estimate is associated with great insecurity, as “… most European countries to not report discharges of radioactivity with the produced water from the oil extraction. This results in significant underestimation in the reported radioactivity discharged in the OSPAR area.” As the figures from this study show, the lack of data may have led to a significant overestimation of the discharges from the oil and gas industry. This is beyond a doubt correct for the Norwegian Shelf, for which data has now been made available. The discharges from the Norwegian Continental Shelf are about 1/10 of the estimated discharges in the MARINA II report.
Norse Decom AS 25
ND/E-19/03: Naturally occurring radionuclides in the marine environment
7 Natural radioactivity in marine biota
7.1 Introduction
This chapter deals with uptake, concentration levels and the effects of natural radionuclides in marine biota from anthropogenic and natural sources.
Knowledge on many of the related processes and mechanisms continues to be relatively scanty. From a more pragmatic point of view, however, we can formulate three main questions that are important with regard to governing further discharges of natural radionuclides from anthropogenic sources:
1. What are safe doses for different marine species?
2. What are safe doses for the protection of the marine environment’s functions?
3. What contribution to radioactive doses does consumption of seafood by humans constitute in relation to other sources of radioactivity?
This chapter gives an overall overview of the status of knowledge for questions 1 and 2. There is relatively little specific data for the North Sea, and it has been necessary to analyse the literature that deals with other oceans and species than those that live in the North Sea. A comprehensive international study carried out by Aarkrog et al. (1997) found that the difference in the uptake and concentrations of natural radionuclides was much larger between different species and trophic levels in the food chain than between different geographic regions. Much of the existing literature in this field can therefore in all likelihood be extrapolated to conditions in the North Sea.
Question 3 is considered in greater detail in chapter 8.
7.2 Relevant natural radionuclides
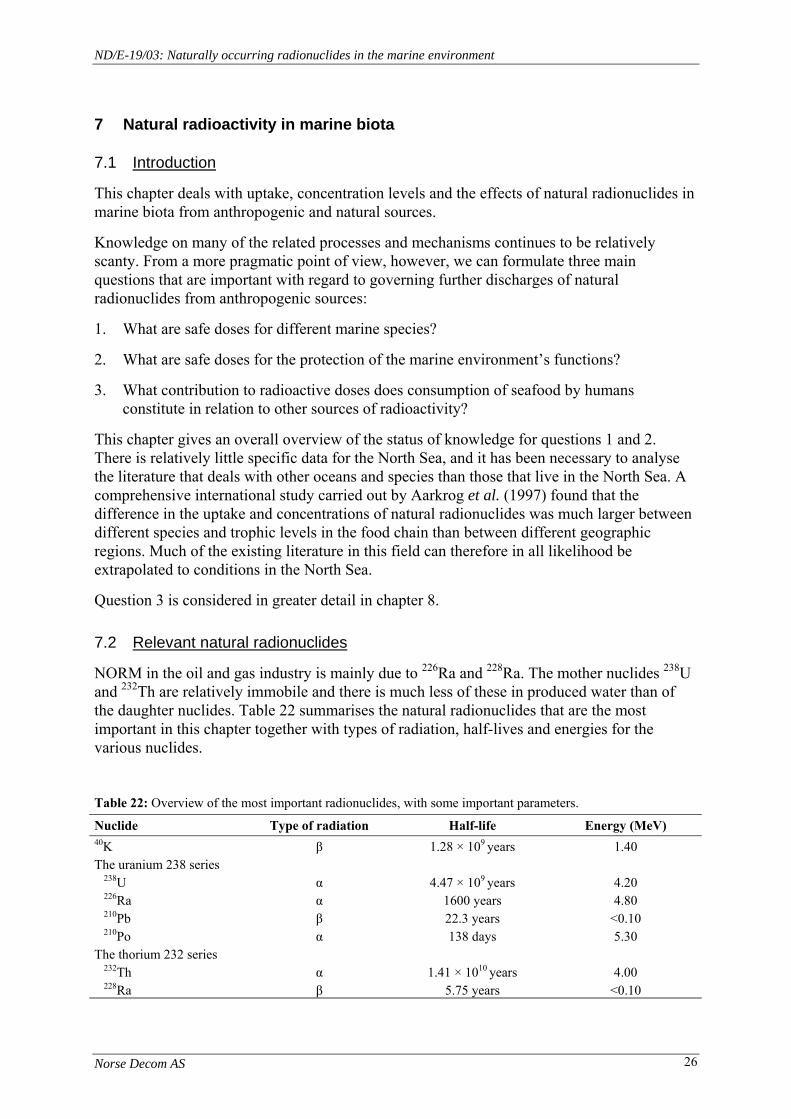
NORM in the oil and gas industry is mainly due to 226Ra and 228Ra. The mother nuclides 238U and 232Th are relatively immobile and there is much less of these in produced water than of the daughter nuclides. Table 22 summarises the natural radionuclides that are the most important in this chapter together with types of radiation, half-lives and energies for the various nuclides.
Table 22: Overview of the most important radionuclides, with some important parameters.
Nuclide Type of radiation Half-life Energy (MeV) 40K β 1.28 × 10⁹ years 1.40 The uranium 238 series
238U α 4.47 × 10⁹ years 4.20 226Ra α 1600 years 4.80 210Pb β 22.3 years <0.10 210Po α 138 days 5.30
The thorium 232 series 232Th α 1.41 × 10¹⁰ years 4.00 228Ra β 5.75 years <0.10
Norse Decom AS 26
ND/E-19/03: Naturally occurring radionuclides in the marine environment
Radiation is emission and propagation of energy through a medium in the form of waves or a stream of particles. Radioactive substances emit particles that have the ability to ionise biological atoms and molecules. This type of radiation is called “ionising radiation”.
Material that is exposed to radiation will have their atoms and molecules ionised. This means that the electrons in the atoms break away. The fact that radiation ionises also implies that the energy of the radiation is deposited in the matter that it penetrates.
Alpha radiation (α) has a positive charge, short range, and only penetrates organisms from their outside to a small degree. Internal alpha radiation may cause damage. Alpha particles are characterised by high energy loss in relation to transport distance, and therefore give high ionisation density along the path the particle is moving. Alpha particles have high linear energy transfer (LET) and therefore have greater potential to damage cells and tissue structure in living organisms than types of radiation with low LET.
Beta radiation (β) consists of free electrons with high velocity and energy. Beta radiation has a greater range than alpha particles, and can penetrate skin, but this type of radiation has a much lower LET than alpha radiation.
Radioactive elements are not degraded in the environment and will emit radiation regardless of which other chemical components are being formed by the radioactive element. The duration of the radiation is given by the radionuclide’s so-called physical life-time.
Radioactive nuclides possess the chemical properties characteristic for each individual element, and the fate of an individual nuclide will thus be determined by the element's chemical properties.
7.3 Relevant marine organisms
When evaluating exposure, effects and risk for living organisms, it is useful to reduce the great diversity of species to a lesser number of organism groups with certain fundamental common traits.
Because exposure is a precondition for an effect to occur, it is useful to divide the organisms into groups based primarily on knowledge of their trophic levels in the food chain, as well as their habitat and behaviour in the marine environment. In addition it is often useful to group species according to their use in the human diet.
IAEA (1990) has suggested the following food chain: plant plankton, macroalgae, animal plankton, molluscs, crustacea, fish and mammals. In the overviews that follow in this chapter this classification has, on the whole, been followed.
7.4 Exposure
Average activity (natural and anthropogenic) for the world’s oceans is 13.6 mBq/L. More than 88% of this, i.e. close to 12 mBq/L is due to naturally occurring 40K. The average concentration of naturally occurring radioactive nuclides in the ocean is 12.5 mBq/L.
Important possible routes of exposure for marine organisms are internal exposure through the uptake of water, feed, inorganic or organic particles, internal exposure from previously acquired radionuclides that are stored in the organism and external exposure via surface and gills.
Norse Decom AS 27

ND/E-19/03: Naturally occurring radionuclides in the marine environment
Areas in proximity to the coast are the most important deposition areas for organic material. Here radionuclides will typically be concentrated in the sediments. These areas are the most biologically productive and important growing areas and habitats for mussels, crustacea, fish and birds. Table 23 summarises typical activity levels and phase distribution coefficients for the various natural radionuclides. The phase distribution coefficient Kd is the ratio between the concentration of an element in sediment and concentration of the same element in water.
Elements with high affinity to organic or inorganic particles in the water will typically be concentrated in the sediment, from which they can, in turn, be re-mobilised and re-suspended in the water column. Elements with high affinity to particles will result in even higher exposure of organisms that filter water for the uptake of feed particles. Examples of organisms that filter water are animal plankton and mussels.
Table 23: Overview of typical activities and phase distribution coefficients for natural radionuclides in the sea.
Nuclide Ocean Activity (mBq/L) Kd
Total The world’s oceans 12.5 - 40K The world’s oceans ~ 12 - 238U The world’s oceans 37 5 × 10² (open sea) -1·103 (coast) 226Ra The North Sea 2.8 - 8.5 3 × 10⁴ (open sea) -5·103 (coast) 210Pb The North Sea ~ 0.8 1 × 10⁷ (open sea) -2·105 (coast) 210Po The North Sea 0.5 - 0.8 2·107 232Th The world’s oceans 0 - 2 5 × 10⁶ (open sea) -2·103 (coast) 228Ra The world’s oceans 0.6 3 × 10⁴ (open sea) -5·103 (coast)
7.5 Effects
The risk of impact on biota depends on a number of factors: type of radiation (a, β, γ), the energy of the radiation, the level of activity, the element’s chemical properties, chemical and physical properties of the contaminated materials and the surroundings as well as properties relating to the species.
Radioactive materials emit particles that have the ability to ionise biological atoms and molecules. This type of radiation is called “ionising radiation”. Material that is exposed to this type of radiation will have its atoms and molecules ionised. This means that the electrons in the atoms break away. The fact that radiation ionises also means that the radiation’s energy is deposited in the matter it penetrates. Ionising radiation has extremely short wavelength and high energy. Ionising radiation initiates decomposition of many organic components, and causes mutation in DNA and cell nuclei. Ionising radiation also damages proteins and amino acids, tissue and bone marrow.
Ionising radiation can result in biological damage to tissue by cells dying or developing into cancer cells, but also by damaging DNA, thus entailing consequences for future generations. These are the sorts of effects of ionising radiation that have been identified to date.
Radioactivity is a form of energy that is emitted from the radioactive element. The potential for biological damage depends on the amount of energy that is absorbed by the organism, that is, the dose that is absorbed. This is measured in the unit Gray (Gy). The absorbed dose is determined by: which radionuclide this is, the type of radioactivity, its chemical form, the route of exposure and the organism’s biochemistry. In order to compare absorbed doses from
Norse Decom AS 28

ND/E-19/03: Naturally occurring radionuclides in the marine environment
different radionuclides, it is common to convert the estimate in Gray using a quality factor to a dose equivalent measured in Sievert (Sv). In this way it is possible to take into consideration the different biological effects of different types of radiation. See chapter 7.6
The lowest dose rate that is found to give physiological and metabolic disturbances is 400 µSv/hour (Kershaw et al., 1992).
In a comprehensive study of literature carried out by Parret (1998), the following conclusions were reached:
• Lethal dose for adult fish at 3.75 - 100 Gy
• Lethal dose for fish embryo at 0.16 Gy
• Lethal dose for invertebrate animals at 0.2 - 500 Gy.
• Impact on reproduction for invertebrate animals and fish at 0.25 mGy/hour.
Individuals have been found to be affected in laboratory studies. A dose rate of 10 mGy/hour is considered to give adequate protection at the population level in the environment.
Polikarpov (1998) has suggested a conceptual model for radiation effects on environments. This relates doses to their impact on levels of the individual, population and ecosystem. The model consists of four “zones”:
1. Zone of well-being: natural background levels up to 0.005 Gy/year.
2. Zone of physiological masking: minor radiation impact at the individual level occurs at doses of 0.005 to 0.05 Gy/year.
3. Zone of ecological masking: effects at population level occur at 0.05-4 Gy/year.
4. Zone of damage to the ecosystem: impact at system level (for instance reduced number of organisms, extinction of radiosensitive species and weakening of the ecosystem) at doses > 4 Gy/year.
7.6 Biokinetics and doses
In this section we focus on data concerning biokinetics and doses of natural radionuclides. A comprehensive, but not exhaustive, overview of available concentration factors and concentrations of the different nuclides in marine organisms is supplied. No calculations or comparisons of absorbed doses with the impact levels given in chapter 7.5 have been made.
All radioactive substances have their own paths once they enter an organism. Knowledge of the processes involved in the uptake and regulation of radionuclides is insufficient for a number of areas. Nevertheless, there is a fair amount of research that can be used in connection with the regulation of the discharges of natural radionuclides from anthropogenic sources.
Generally, we know that radium and thorium are deposited primarily in the shell and bone tissue, while lead and polonium are found in the soft tissue of fish and crustacea. 210Pb and 210Po therefore contribute to a greater degree to doses for humans who consume these as part of their diet than 226Ra and 228Ra. According to Dahlgaard (1996), 210Po is responsible for the highest radioactive dose from the marine environment at the global level. A study by Cherry and Heyraud (1988) reveals that 210Po is responsible for more than 80 % of the total “marine
Norse Decom AS 29

ND/E-19/03: Naturally occurring radionuclides in the marine environment
dose” of humans from natural radionuclides. This is due to high concentration factors for 210Po in fish, crustaceous animals, and molluscs, and a high dose factor at intake of 210Po compared with the other natural radionuclides. 238U, 232Th and 228Th contribute relatively little to the total dose. The level of potassium is regulated homostatically, and the level of the radioactive isotope 40K is therefore relatively stable in higher organisms.
Radiation doses to humans due to radioactive pollution of the oceans will primarily depend on the content of radioactivity in fish and to some degree mussels and crustacea. Nevertheless, the marine route of exposure accounts for a mere 2 - 10 % of the total radiation burden from natural background radiation. The content of anthropogenic radioactivity in fish from the Barents Sea is at approximately 1 Bq/kg. The limit for permitted activity levels in fish is 600 Bq/kg. IAEA (1985) has given recommended concentration factors for natural radionuclides for humans. These are cited in chapter 8.
In Table 24 we examine some important terms and definitions, while a more specific mention and status for each radionuclide is given in chapters 7.6.1-7.6.6.
Norse Decom AS 30

ND/E-19/03: Naturally occurring radionuclides in the marine environment
Table 24: Overview of dose relevant terms and definitions given on a general form. It should be noted that there currently are several EU projects and work in connection with the IAEA that is expected to result in an agreed set of terms defining doses for individuals, populations and ecosystems.
Term Definition 1 Activity Activity is indicated by the number of disintegrations per time unit. This is measured
in the unit Becquerel. 1 Becquerel = 1 disintegration s-1 2 Specific activity The specific activity is given by the activity divided by the mass. 3 Absorbed dose Absorbed dose is defined by:
D = e/m where D = absorbed dose; e = average energy deposited in mass; m = mass The unit for absorbed dose is Gray (Gy), and 1 Gy = 1 J kg-1
4 Internal and external dose
The radiation dose (D) from a radionuclide is the sum of the dose from external exposure (De) and dose from internal exposure (Di):
D = De +Di
External exposure: De= Ke·T
where Ke = radiation level in the environment; T = the time the organism is exposed to radiation Internal exposure:
Di = Kf·M where Kf = concentration in feed, water, etc.; M = intake amount Total dose is obtained by taking into account the dose from all radionuclides. For higher organisms it may be useful to carry out calculations for different organs by using so-called dose factors/dose equivalent rates for different organs.
5 Dose rate The dose rate is absorbed dose per time unit 6 Dose equivalent The linear energy transfer is different for the different types of radiation, and a quality
factor (Q) has therefore been defined in order to calculate normalised doses or so-called dose equivalents. The unit for dose equivalents is Sievert (Sv). 1 Sv = J kg-1. The dose equivalent is given by:
H = D·Q where H = dose equivalent in Sievert; D = dose in Gray; Q = the quality factor, which is 1 for beta particles and 20 for alpha particles.
7 Effective dose equivalent
The effective dose equivalent is used to summarise cancer risk for doses from different organs to a risk for the entire organism, and in order to compare cancer risks for different organs. The effective dose equivalent is given by:
He=wt·D·Q Where He is the effective dose equivalent, and the weighting factor wt is organ specific. D and Q are defined as above.
8 Acquired dose Radionuclides that are ingested into the body via water or feed give an internal dose that is irreversible. Further transport and the distribution of the element is governed by the element’s biokinetics. The absorbed dose depends on the physical and biological half-life of the element. Acquired dose equivalent or acquired effective dose equivalent is used to express the potential dose that may be delivered over a long stretch of time and a long time after the element has entered the organism.
9 Concentration factor (CF)
The ability of an organism or a culture of living organisms to accumulate a component such as for instance radium from water can be expressed using the concentration factor CF. This is defined as the relation between the concentration of radium in the organism/the tissue in Bq kg-1 wet weight and concentrations of radium in water given in Bq L-1.
Norse Decom AS 31

ND/E-19/03: Naturally occurring radionuclides in the marine environment
7.6.1 Potassium-40 Potassium is a group IA element in the periodical Table. Radioactive 40K is a constant component of all natural potassium and constitutes approximately 0.012 % of the total amount of potassium. The isotope emits beta radiation with relatively low energy.
Potassium is an essential element for plant growth. Uptake of potassium is regulated homostatically in higher organisms, and doses of 40K are therefore relatively independent of occurrence and exposure, as indicated by Table 25.
Table 25: Concentration factors and concentrations of 40K in marine organisms
Species/ species category
CF-WW CF-DW Konc. WW mBq/kg
Konc. DWmBq/kg
Reference
Echinoderms Asteroidea* 11 000 NRPA, 2001
Molluscs Batillus cornutus 78 800 Yamamota et al., 1994Octopus vulgaris 62 900 Yamamota et al., 1994Mytilidae* 66 000 - 200 000 NRPA, 2001 Todarodes pacificus 102 000 Yamamota et al., 1994
Crustacea Brachyura* 46 000 - 66 000 NRPA, 2001 Caridea* 25 000 NRPA, 2001 Cancer pagurus, bløtdel* 50 000 - 100 000 NRPA, 2001 Cancer pagurus, skall* 150 000 NRPA, 2001 Homarus gammarus, skall* 70 000 - 150 000 NRPA, 2001 Kamchatca crab* 77 000 - 82 000 NRPA, 2001 Pandalus borealis* 77 000 - 94 000 NRPA, 2001
Fish Sillago sihama 90 000 Yamamota et al., 1994
CF=concentration factor; WW=wet weight. DW=dry weight. *-Samples from the Norwegian Coast and the Barents Sea. NRPA-Norwegian Radiation Protection Authority
7.6.2 Uranium-238 Uranium is a group IIIB element in the periodical Table. 238U constitutes more than 99 % of all natural uranium. The element is highly chemical and radiologically toxic. The isotope emits alpha particles with relatively high energy, but there is relatively little of this isotope in seawater.
Norse Decom AS 32

ND/E-19/03: Naturally occurring radionuclides in the marine environment
Table 26: Concentration factors and concentrations of 238U in marine organisms.
Species/ species category
CF-WW CF-DW Conc. WWmBq/kg
Conc. DW mBq/kg
Reference
Multicellular algae Sea weed 21 - 130 McDonalds et al., 1992 Sea weed 4,000 -12,000 McCartney et al., 2000
Molluscs Austrocochlea constricta, soft part
4.4 Asanullah & Williams, 1989
Austrocochlea constricta, shell
2.4 Asanullah & Williams, 1989
Batillus cornutus 1,030 Yamamota et al., 1994 Molluscs 60 Camplin et al., 1996 Octopus vulgaris 23 Yamamota et al., 1994 Mussel 4 - 83 McDonalds et al., 1992 Mussel 1,000 - 4,000 McCartney et al., 2000 Snail 12 - 82 McDonalds et al., 1992 Snail 1,000 - 4,000 McCartney et al., 2000 Todarodes pacificus 7 Yamamota et al., 1994
Crustacea Pachygrapsus laevimanus, the entire organism
6.8 - 17.8 Asanullah & Williams, 1989
Crustacea 10 Camplin et al., 1996 Fish
Sillago sihama 7 Yamamota et al., 1994 CF=concentration factor; WW=wet weight. DW=dry weight.
Uranium is transported through the higher organisms relatively quickly, and the chemical toxicity is mainly related to impact on the kidneys.
As emerges from Table 26, the concentration factors and the concentration levels for 238U in different marine organisms are relatively low.
7.6.3 Thorium 232
Thorium is a group IA element in the periodical Table. The isotope emits alpha particles with relatively high energy, but there is relatively little of this isotope in seawater. The element has high affinity to particles and is therefore to a large degree associated with sediments and organisms living on the ocean floor. Thorium concentration in the water column is approximately 10 % of the radium concentration. 232Th is primarily deposited in the bone tissue of living organisms. Relatively little relevant data was found for concentration factors and concentrations in marine biota. As emerges from Table 26, concentration factors and concentration levels for 232Th are relatively low.
Norse Decom AS 33

ND/E-19/03: Naturally occurring radionuclides in the marine environment
Table 27: Concentration factors and concentrations of 232Th in marine organisms.
Species/ species category
CF-WW CF-DW Conc. WWmBq/kg
Conc. DW mBq/kg
Reference
Molluscs Molluscs 1,000 Camplin et al., 1996 Batillus cornutus 73 Yamamota et al.,1994
Crustacea Crustacea 100 Camplin et al., 1996
CF=factor of concentration. WW=wet weight. DW=dry weight.
7.6.4 Radium-228 and radium-226
Radium is a group IIA element in the periodic Table. In solution it is found as Ra2+. The element is expected to behave like other earth alkaline metals, such as potassium, barium, strontium and magnesium. One gram 226Ra produces 3.7 × 10¹⁰ disintegrations per second.
IAEA in 1990 published a relatively comprehensive study of radium in the environment. Where no other source is explicitly named, the information on radium is drawn from this study.
The content of radium in seawater is constant. The concentration of radium is higher in coastal waters than in water further removed from shore. This is due to the re-mobilisation of sediments (Yamamoto, 1994). For practical reasons 226Ra is often determined analytically, while the occurrence of 228Ra correlates well and can therefore usually be predicted on the basis of 226Ra measurements.
Radium is generally absorbed by both plants and animals, but is only transferred to a small degree between the different levels of the food chain. Radium follows potassium and is primarily deposited in shell and bone tissue. Secretion from these is extremely slow, and in general the deposited radium will remain there throughout the organism’s lifetime. Radium replaces calcium in the bone structure and is thus a source for the radiation of blood-creating organs.
Factors that have been proven to have an effect on the uptake of radium are the chemical form and ability to form organic complexes, salinity, temperature, pH value, light, ion effects and species-related effects.
Radium in the sea can give humans radiation doses through plankton to fish, and from fish to humans. Radium can also be transferred to marine foodstuffs such as shrimp, crawfish and lobsters. Radium is mainly deposited in the bone tissue and shell, which are not consumed by humans. Only a fraction of the radium in the sea therefore reaches humans. Nevertheless, radium is concentrated in fish, molluscs and crustacea in relation to its level in seawater. In the literature a concentration factor of 100 is used for this, implying that the amount of radium per gram in fish or crustacea (wet weight) is 100 times the amount in seawater. 226Ra emits alpha particles with relatively high energy, while 228Ra emits beta radiation with low energy and relatively low ionisation capacity.
Radium is an important element in connection with radiation protection because of its long retention time in the human body.
Norse Decom AS 34

ND/E-19/03: Naturally occurring radionuclides in the marine environment
Uptake mechanisms in marine plants Knowledge of uptake mechanisms for radium is scanty. Williams (1984) suggests three primary physiochemical mechanisms: absorption, adsorption and association.
Radium and other earth alkaline metals are absorbed via the calcium pump. In the case of plant plankton, most of the uptake probably takes place through passive adsorption (Fisher et al., 1983). In the case of macroalgae, adsorption and ion change processes are important. According to Edgington et al. (1970), the concentration of radium in marine algae is governed by:
1. Ion exchange or ion precipitation together with the calcium-carbonate matrix. 2. Complex formation either with protein nitrogen or other organic components.
There is as yet limited knowledge of the degree to which marine plants are able to discriminate between the uptake of calcium and other earth alkaline metals (such as for instance radium, barium and strontium). Experimental studies show that different species have different abilities with regard to discriminating between calcium and other earth alkaline metals. Some species favour uptake of radium in competition with calcium. Internal distribution of radium in marine plants is another field where knowledge continues limited.
Monocellular algae: for freshwater algae, a linear relationship between the concentration of radium in the cells and the water surrounding the cells has been found. Radium does not generally become highly concentrated in monocellular algae, but high accumulations have been found in some species.
Multicellular algae: Both field studies and laboratory studies have shown that a number of multicellular algae accumulate radium. The concentration factors vary considerably from species to species and from location to location.
Other plants: there is currently little knowledge on how radium is taken up and accumulated in other marine plants.
Uptake mechanisms in marine animals IAEA (1990) describes three main processes for the uptake of radium in marine animals: adsorption, absorption and intake through water or feed.
While adsorption is an important process for phytoplankton with its large surface in relation to volume, intake via feed and water is more important in filtering organisms. It is difficult to distinguish between the relative contributions of water and feed in practice. To date, insufficient experiments have been made to quantify the uptake via different uptake routes under controlled laboratory conditions. Compared to information on anthropogenic fission and activation products, there is relatively little information on radium in biota.
Radium is accumulated in virtually all groups of marine organisms. Marine plants accumulate radium to higher concentrations than organisms higher up the food chain. In shells, crustacea and fish, radium is accumulated particularly in the hard tissue, such as shell, teeth, cartilage and bone. This is as might be expected, based on the knowledge that radium is taken up by the organism via the calcium pump. The concentration factors for radium typically vary from approximately 10 to 1,000. The lowest level in the food chain, plant plankton, concentrates to higher radium levels than organisms higher up the food chain. There appears to be relatively little transport of radium upwards the food chain, but knowledge in this field continues limited. Heldal et al. (2003) has applied a food chain model by studying bioaccumulation of
Norse Decom AS 35

ND/E-19/03: Naturally occurring radionuclides in the marine environment
radioactive caesium in the Norwegian Sea and the Barents Sea. There are however few studies on the transport of natural radionuclides in marine food chains.
IAEA (1985) has suggested the following concentration factors for radium: phytoplankton (monocellular plants): 2,000; macroalgae (multicellular plants): 100; animal plankton: 100; mussels, soft part: 1,000; crustacea, soft part: 1,000; fish, muscle tissue: 500.
In Table 28 a summary of a number of concentration factors and concentrations of radium in marine organisms from the literature is provided.
Table 28: Concentration factors and concentrations of 226Ra and 226Ra in marine organisms.
Species/species category CF-WW CF-DW Conc. WWmBq/kg
Conc. DWmBq/kg
Reference
Monocellular algae Mixed algae culture 1,800 Szabo, 1967 Mixed algae culture 7,000 Knauss and Ku, 1983 Mixed algae culture 825 Iyengar, 1984 Phytoplankton 12,000 Lowman et al., 1971 Phytoplankton 2,000 Cherry & Shannon, 1974 Phytoplankton 160 - 930 Iyengar, 1984 Phytoplankton 100 IAEA, 1978 Phytoplankton 190 - 66,600 IAEA, 1990 Emiliania huxleyi 900 Fisher et al., 1987 Oscillatoria woronichinii 100 Fisher et al., 1987 Thalassiosira pseudomona
800 Fisher et al., 1987
Multicellular algea Macroalgae 1,400 Lowman et al., 1971 Macroalgae 133 Cherry & Shannon, 1974 Macroalgae 30 - 210 Iyengar, 1984 Macroalgae 100 IAEA, 1978 Macroalgae 200 - 20,400 IAEA, 1990 Acanthophora spicifera 1,313 3,400 Edgington et al., 1970 Ascophyllum nodosuma 87 700 Kirchmann et al., 1974 Ascophyllum nodosuma 99 Bonotto et al., 1981 Avrainvillea rawsoni 1,467 4,400 Edgington et al., 1970 Bryothamnion triquetrum 500 1,500 Edgington et al., 1970 Caulerpa racemosa 633 1,900 Edgington et al., 1970 Ceramium nitens 367 1,100 Edgington et al., 1970 Codium isthmocladium 500 1,500 Edgington et al., 1970 Cympolia barbata 233 700 Edgington et al., 1970 Dictyota divaricata 1,133 3,400 Edgington et al., 1970 Diginea simplex 900 2,700 Edgington et al., 1970 Fucus vesicolusa 136 1,000 Kirchmann et al., 1974 Fucus vesicolusa 90 Bonotto et al., 1981 Galaxaura cylindrica 233 700 Edgington et al., 1970 Gracilaria cornea 200 600 Edgington et al., 1970 Halidrys siliquosaa 256 Kirchmann et al., 1974 Halidrys siliquosaa 60 Bonotto et al., 1981 Halimeda opuntia 600 1,800 Edgington et al., 1970
Norse Decom AS 36

ND/E-19/03: Naturally occurring radionuclides in the marine environment
Species/species category CF-WW CF-DW Conc. WW
mBq/kg Conc. DW
mBq/kg Reference
Himanthalia lorea (elongata)a
88 700 Kirchmann et al., 1974
Himanthalia lorea (elongata)a
79 Bonotto et al., 1981
Hypnea musciformis 633 1,900 Edgington et al., 1970 Laurencia papillosa 767 2,300 Edgington et al., 1970 Padina gymnospora 833 2,500 Edgington et al., 1970 Penicillus capitatus 633 1,900 Edgington et al., 1970 Porphyra sp.a 7 50 Kirchmann et al., 1974 Sargassum polyceratium 1,233 3,700 Edgington et al., 1970 Spyridia filamentosa 500 1,500 Edgington et al., 1970 Turbinaria turbinate 1,467 4,400 Edgington et al., 1970 Ulva lactuca 167 500 Edgington et al., 1970 Zooplankton Zooplankton 190 Lowman et al., 1971 Zooplankton 100 Cherry & Shannon, 1974 Zooplankton 50 -5,220 Iyengar, 1983 Zooplankton 100 IAEA, 1978 Zooplankton 80 - 9,030 IAEA, 1990 Mollsuscs Batillus cornutus 53 - 280 Yamamota et al., 1994 Molluscs 180 Camplin et al., 1996 Mussels, soft part 1,300 Lowman et al., 1971 Mussels, soft part 50 - 64 Iyengar, 1983 Mussels, soft part 100 IAEA, 1978 Mussels, soft part 80 - 2,200 IAEA, 1990 Mussels, shell 260 - 510 Iyengar, 1983 Mussels, shell 111 - 12,000 Crustacea Crustacea 30 Camplin et al., 1996 Crustacea, soft part 140 Lowman et al., 1971 Crustacea, soft part 4 - 170 Iyengar, 1983 Crustacea, soft part 100 IAEA, 1978 Crustacea, soft part 120 - 770 IAEA, 1990 Crustacea, shell 520 - 950 Iyengar, 1983 Crustacea, shell 530 - 17,500 IAEA, 1990 Crustacea, gills 120-10,400 Iyengar, 1983 Fish Fish, entire 200 - 2,630 IAEA, 1990 Fish, muscle tissue 130 Lowman et al., 1971 Fish, muscle tissue 50 Cherry & Shannon, 1974 Fish, muscle tissue 20 - 130 Iyengar, 1983 Fish, muscle tissue 100 IAEA, 1978 Fish, muscle tissue 270 - 2,150 IAEA, 1990 Fish, bone tissue 140-2,980 Iyengar, 1983 Fish, bone tissue 240 - 33,300 IAEA, 1990 Sillago sihama 8 Yamamota et al., 1994 Mammals Seal, bone 960 - 1,110 Whale, teeth 1,480-11,100 CF= Concentration factor. WW=wet weight. DW=dry weight. aOrganisms from the North Sea
Norse Decom AS 37

ND/E-19/03: Naturally occurring radionuclides in the marine environment
7.6.5 Lead 210 Lead is a group IV A element in the periodic Table. In the marine environment, lead is primarily present dissolved in water (90 %). Lead is removed from the water column via adsorption onto particles, primarily inorganic particles that are smaller than 0.4 µg in diameter.
Marine organisms have considerable lead-accumulating ability, and the element is highly chemically toxic. Lead affects the nervous system, the circulation and the kidneys and is, in high doses, acutely toxic for organisms living in water. Lead can also cause chronic toxic results in many organisms, even in small concentrations. In case of chronic lead poisoning, typical neurotoxical and immunological effects and damage to the blood producing system in warm-blooded animals are observed. Lead compounds can cause damage to embryos and is thought to threaten the capacity for reproduction. Research has also been carried out on children’s exposure to lead in low concentrations. It is suspected that exposure to lead may affect children’s intellectual development.
Lead is bioaccumulated in molluscs, crustacea, fish and mammals. Uptake of lead often takes place slowly and under long-lasting chronical exposure. Mammals accumulate lead in their soft tissue and in the skeleton, where secretion time is more than 20 years. 210Pb is important because of ingrowth of 210Po from 210Pb.
Norse Decom AS 38
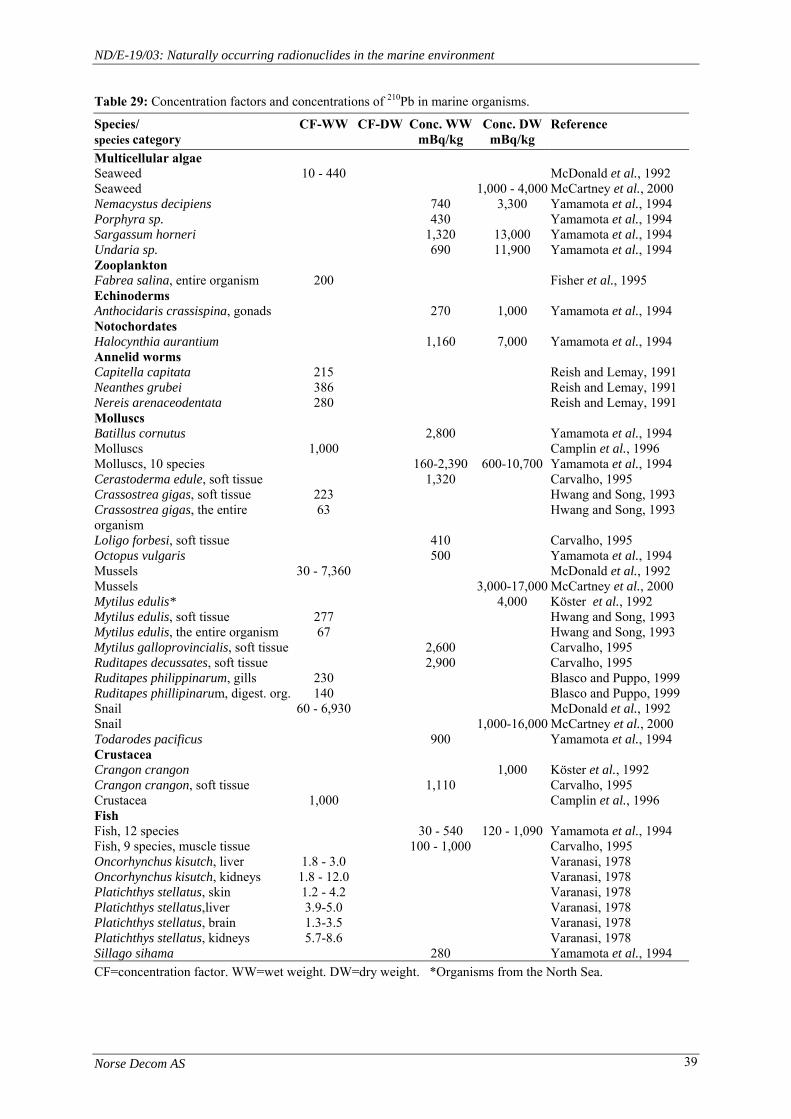
ND/E-19/03: Naturally occurring radionuclides in the marine environment
Table 29: Concentration factors and concentrations of 210Pb in marine organisms.
Species/ species category
CF-WW CF-DW Conc. WWmBq/kg
Conc. DWmBq/kg
Reference
Multicellular algae Seaweed 10 - 440 McDonald et al., 1992 Seaweed 1,000 - 4,000 McCartney et al., 2000 Nemacystus decipiens 740 3,300 Yamamota et al., 1994 Porphyra sp. 430 Yamamota et al., 1994 Sargassum horneri 1,320 13,000 Yamamota et al., 1994 Undaria sp. 690 11,900 Yamamota et al., 1994 Zooplankton Fabrea salina, entire organism 200 Fisher et al., 1995 Echinoderms Anthocidaris crassispina, gonads 270 1,000 Yamamota et al., 1994 Notochordates Halocynthia aurantium 1,160 7,000 Yamamota et al., 1994 Annelid worms Capitella capitata 215 Reish and Lemay, 1991 Neanthes grubei 386 Reish and Lemay, 1991 Nereis arenaceodentata 280 Reish and Lemay, 1991 Molluscs Batillus cornutus 2,800 Yamamota et al., 1994 Molluscs 1,000 Camplin et al., 1996 Molluscs, 10 species 160-2,390 600-10,700 Yamamota et al., 1994 Cerastoderma edule, soft tissue 1,320 Carvalho, 1995 Crassostrea gigas, soft tissue 223 Hwang and Song, 1993 Crassostrea gigas, the entire organism
63 Hwang and Song, 1993
Loligo forbesi, soft tissue 410 Carvalho, 1995 Octopus vulgaris 500 Yamamota et al., 1994 Mussels 30 - 7,360 McDonald et al., 1992 Mussels 3,000-17,000 McCartney et al., 2000 Mytilus edulis* 4,000 Köster et al., 1992 Mytilus edulis, soft tissue 277 Hwang and Song, 1993 Mytilus edulis, the entire organism 67 Hwang and Song, 1993 Mytilus galloprovincialis, soft tissue 2,600 Carvalho, 1995 Ruditapes decussates, soft tissue 2,900 Carvalho, 1995 Ruditapes philippinarum, gills 230 Blasco and Puppo, 1999 Ruditapes phillipinarum, digest. org. 140 Blasco and Puppo, 1999 Snail 60 - 6,930 McDonald et al., 1992 Snail 1,000-16,000 McCartney et al., 2000 Todarodes pacificus 900 Yamamota et al., 1994 Crustacea Crangon crangon 1,000 Köster et al., 1992 Crangon crangon, soft tissue 1,110 Carvalho, 1995 Crustacea 1,000 Camplin et al., 1996 Fish Fish, 12 species 30 - 540 120 - 1,090 Yamamota et al., 1994 Fish, 9 species, muscle tissue 100 - 1,000 Carvalho, 1995 Oncorhynchus kisutch, liver 1.8 - 3.0 Varanasi, 1978 Oncorhynchus kisutch, kidneys 1.8 - 12.0 Varanasi, 1978 Platichthys stellatus, skin 1.2 - 4.2 Varanasi, 1978 Platichthys stellatus,liver 3.9-5.0 Varanasi, 1978 Platichthys stellatus, brain 1.3-3.5 Varanasi, 1978 Platichthys stellatus, kidneys 5.7-8.6 Varanasi, 1978 Sillago sihama 280 Yamamota et al., 1994 CF=concentration factor. WW=wet weight. DW=dry weight. *Organisms from the North Sea.
Norse Decom AS 39

ND/E-19/03: Naturally occurring radionuclides in the marine environment
7.6.6 Polonium 210 Polonium is a group VI A element in the periodical Table. 1 mg 210Po emits as many alpha particles as 5 g 226Ra; these alpha particles are charged with high energy. The isotope is highly chemically and radiologically toxic. Radiation from 210Po inflicts relatively large biological damage due to the complete absorption of the alpha particles’ energy in the tissue.
Table 30: Concentration factors and concentrations of 210Po in marine organisms.
Species/ species category
CF-WW CF-DW Cons. WWmBq/kg
Cons. DW mBq/kg
Reference
Multicellular algae Seaweed 70-2,585 McDonald et al., 1992 Seaweed 3,000-30,000 McCartney et al., 2000 Nemacystus decipiens 2,800 12,200 Yamamota et al., 1994 Porphyra sp. 3,900 Yamamota et al., 1994 Sargassum horneri 4,300 42,000 Yamamota et al., 1994 Undaria sp. 3,900 51,600 Yamamota et al., 1994 Echinoderms Anthocidaris crassispina, gonads 6,400 22,800 Yamamota et al., 1994 Notochordates Halocynthia aurantium 4,000 24,300 Yamamota et al., 1994 Molluscs Batillus cornutus 36,000 Yamamota et al., 1994 Molluscs 20,000 Camplin et al., 1996 Molluscs, 10 species 500-54,000 1,900-348,000 Yamamota et al., 1994 Cerastoderma edule, s.t 94,000 Carvalho, 1995 Loligo forbesi, s.t 1,610 Carvalho, 1995 Octopus vulgaris 530 Yamamota et al., 1994 Mussels 2,200-74,260 McDonald et al., 1992 Mussels 60,000-300,000 McCartney et al., 2000 Mytilus edulis* 300,000 Köster et al., 1992 Mytilus edulis, s.t * 149,000 Dahlgaard, 1996 Mytilus galloprovincialis, s.t 132,000 Carvalho, 1995 Ruditapes decussates, s.t 152,000 Carvalho, 1995 Snail 2,410-31,590 10,000-100,00 McDonald et al., 1992 Snail McCartney et al., 2000 Todarodes pacificus 1,920 Yamamota et al., 1994 Crustacea Crangon crangon* 270,000 Köster et al., 1992 Crangon crangon, s.t 49,000 Carvalho, 1995 Crustacea 4,000 Camplin et al., 1996 Palaemon serratus, s.t. 9.5 Carvalho & Fowler, 1994Fish Fish, 12 species 600-25,800 3,000-91,200 Yamamota et al., 1994 Fish, 9 species, muscle tissue 730-66,000 Carvalho, 1995 Serranus scriba 4 Carvalho & Fowler, 1994Plaice* 960 Dahlgaard, 1996 Herring* 650 Dahlgaard, 1996 Sillago Sihama 6,920 Yamamota et al., 1994 Cod* 350 Dahlgaard, 1996 CF=concentration factor. WW=wet weight. DW=dry weight. s.t.=soft tissue *Organisms from the North Sea.
Norse Decom AS 40
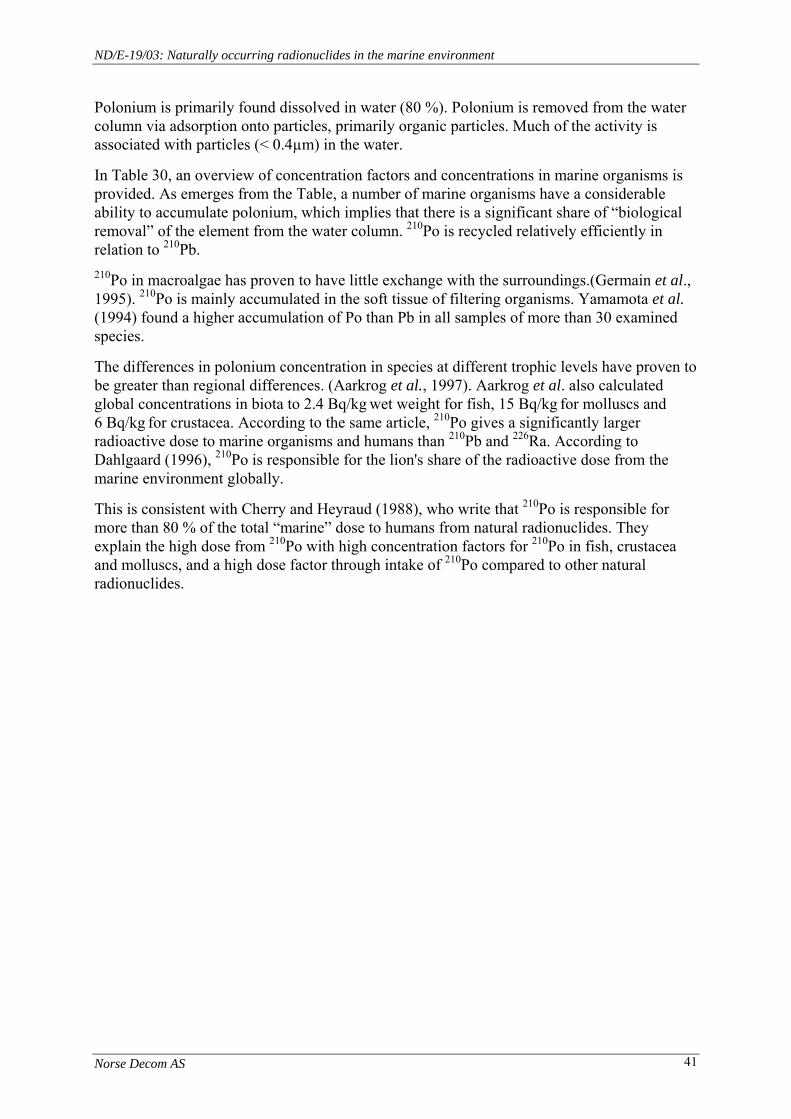
ND/E-19/03: Naturally occurring radionuclides in the marine environment
Polonium is primarily found dissolved in water (80 %). Polonium is removed from the water column via adsorption onto particles, primarily organic particles. Much of the activity is associated with particles (< 0.4µm) in the water.
In Table 30, an overview of concentration factors and concentrations in marine organisms is provided. As emerges from the Table, a number of marine organisms have a considerable ability to accumulate polonium, which implies that there is a significant share of “biological removal” of the element from the water column. 210Po is recycled relatively efficiently in relation to 210Pb. 210Po in macroalgae has proven to have little exchange with the surroundings.(Germain et al., 1995). 210Po is mainly accumulated in the soft tissue of filtering organisms. Yamamota et al. (1994) found a higher accumulation of Po than Pb in all samples of more than 30 examined species.
The differences in polonium concentration in species at different trophic levels have proven to be greater than regional differences. (Aarkrog et al., 1997). Aarkrog et al. also calculated global concentrations in biota to 2.4 Bq/kg wet weight for fish, 15 Bq/kg for molluscs and 6 Bq/kg for crustacea. According to the same article, 210Po gives a significantly larger radioactive dose to marine organisms and humans than 210Pb and 226Ra. According to Dahlgaard (1996), 210Po is responsible for the lion's share of the radioactive dose from the marine environment globally.
This is consistent with Cherry and Heyraud (1988), who write that 210Po is responsible for more than 80 % of the total “marine” dose to humans from natural radionuclides. They explain the high dose from 210Po with high concentration factors for 210Po in fish, crustacea and molluscs, and a high dose factor through intake of 210Po compared to other natural radionuclides.
Norse Decom AS 41
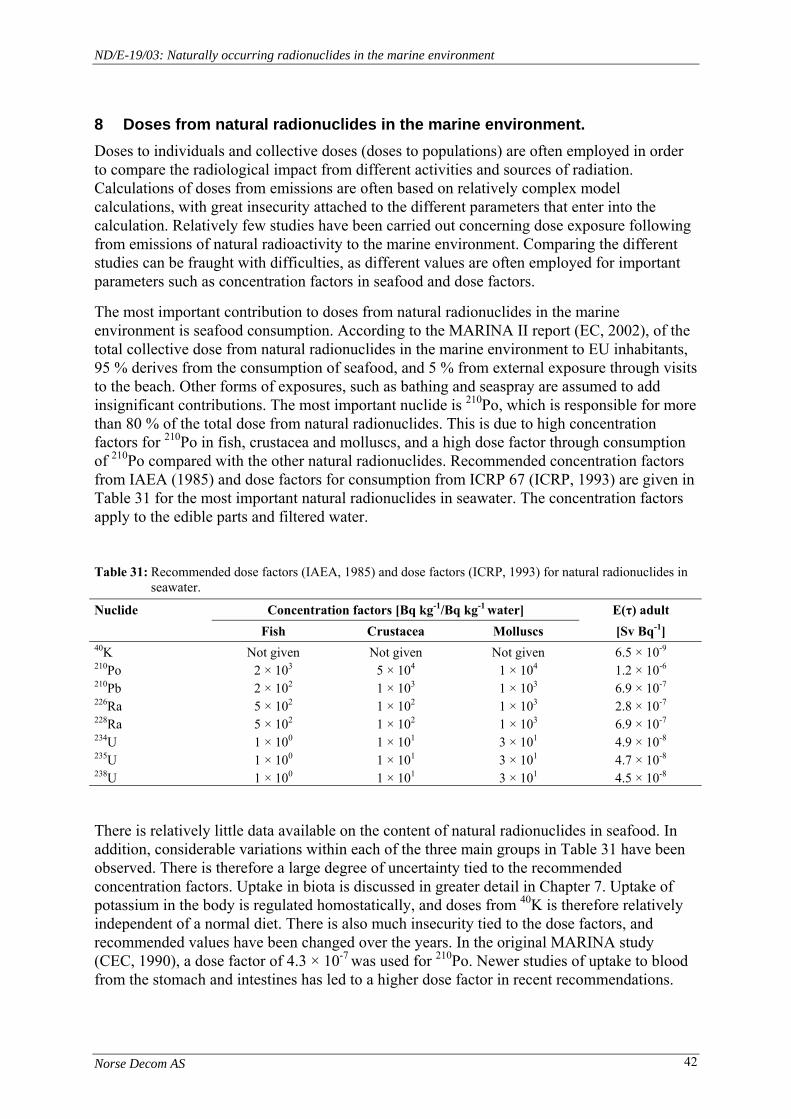
ND/E-19/03: Naturally occurring radionuclides in the marine environment
8 Doses from natural radionuclides in the marine environment. Doses to individuals and collective doses (doses to populations) are often employed in order to compare the radiological impact from different activities and sources of radiation. Calculations of doses from emissions are often based on relatively complex model calculations, with great insecurity attached to the different parameters that enter into the calculation. Relatively few studies have been carried out concerning dose exposure following from emissions of natural radioactivity to the marine environment. Comparing the different studies can be fraught with difficulties, as different values are often employed for important parameters such as concentration factors in seafood and dose factors.
The most important contribution to doses from natural radionuclides in the marine environment is seafood consumption. According to the MARINA II report (EC, 2002), of the total collective dose from natural radionuclides in the marine environment to EU inhabitants, 95 % derives from the consumption of seafood, and 5 % from external exposure through visits to the beach. Other forms of exposures, such as bathing and seaspray are assumed to add insignificant contributions. The most important nuclide is 210Po, which is responsible for more than 80 % of the total dose from natural radionuclides. This is due to high concentration factors for 210Po in fish, crustacea and molluscs, and a high dose factor through consumption of 210Po compared with the other natural radionuclides. Recommended concentration factors from IAEA (1985) and dose factors for consumption from ICRP 67 (ICRP, 1993) are given in Table 31 for the most important natural radionuclides in seawater. The concentration factors apply to the edible parts and filtered water.
Table 31: Recommended dose factors (IAEA, 1985) and dose factors (ICRP, 1993) for natural radionuclides in
seawater.
Nuclide Concentration factors [Bq kg-1/Bq kg-1 water] E(τ) adult Fish Crustacea Molluscs [Sv Bq-1] 40K Not given Not given Not given 6.5 × 10⁻⁹ 210Po 2 × 10³ 5 × 10⁴ 1 × 10⁴ 1.2 × 10⁻⁶ 210Pb 2 × 10² 1 × 10³ 1 × 10³ 6.9 × 10⁻⁷ 226Ra 5 × 10² 1 × 10² 1 × 10³ 2.8 × 10⁻⁷ 228Ra 5 × 10² 1 × 10² 1 × 10³ 6.9 × 10⁻⁷ 234U 1 × 100 1 × 101 3 × 101 4.9 × 10⁻⁸ 235U 1 × 100 1 × 101 3 × 101 4.7 × 10⁻⁸ 238U 1 × 100 1 × 101 3 × 101 4.5 × 10⁻⁸
There is relatively little data available on the content of natural radionuclides in seafood. In addition, considerable variations within each of the three main groups in Table 31 have been observed. There is therefore a large degree of uncertainty tied to the recommended concentration factors. Uptake in biota is discussed in greater detail in Chapter 7. Uptake of potassium in the body is regulated homostatically, and doses from 40K is therefore relatively independent of a normal diet. There is also much insecurity tied to the dose factors, and recommended values have been changed over the years. In the original MARINA study (CEC, 1990), a dose factor of 4.3 × 10⁻⁷ was used for 210Po. Newer studies of uptake to blood from the stomach and intestines has led to a higher dose factor in recent recommendations.
Norse Decom AS 42
ND/E-19/03: Naturally occurring radionuclides in the marine environment
8.1 Doses from natural radioactivity
As previously mentioned, the uptake of 210Po through the consumption of seafood is the most important source of doses from natural radionuclides in the marine environment. Comprehensive calculcations of doses from 137Cs and 210Po in seafood have been carried out by Aarkrog et al. (1997) for all FAO (Food and Agriculture Organisation of the EU) fishing areas. The 210Po collective dose rate for the entire world’s population was estimated at 30000 manSv/year, with an uncertainty factor of 5. For purposes of comparison, the collective dose of 137Cs was calculated at 160 manSv/year, with an uncertainty of 50 %. The collective dose of 30000 manSv from 210Po corresponded to an average individual dose of 5.7µSv/year. Two different methods were used to calculate doses from consumption of seafood. Concentrations in seafood were calculated from estimated concentrations in seawater by using recommended concentration factors (Method 1), and by estimating concentrations in marine animals directly based on available data (Method 2). For calculations in Method 1, a concentration of 210Po of 2 × 10³ for fish and of 3 × 10⁴ for crustacea and molluscs was used. For Method 2 the following concentrations were used: 2.4 Bq/kg fresh weight for fish, 6 Bq/kg in crustacea and 15 Bq/kg in molluscs. Consumption of seafood was based on catch statistics from FAO for 1990. Allowances were made for the disintegration from catch to consumption for 210Po. A dose factor of 4.3 × 10⁻⁷ Sv/Bq was used for 210Po. This was the same dose co-efficient as was used in the MARINA study (CEC, 1990), but is lower by a factor of 2.8 compared with the current ICRP recommendation (Table 31). The dose from consumption of seafood is directly proportional with the dose co-efficient. By using the dose factor in ICRP 67 the calculated doses for 210Po would be 2.8 times higher.
Pollard et al. (1998) has carried out calculations of doses from 210Po in seafood for the Irish population. The calculated effective dose per inhabitant was 19µSv/year. Calculations were based on average measured concentrations of different types of fish and seafood caught in Ireland, and consumer statistics for consumption. Used dose factor was 1.2 × 10⁻⁶ Sv/Bq, i.e. 2.8 times higher than in the study carried out by Aarkrog et al. (1997). Taking into consideration the difference in the dose factor for 210Po, the calculated effective dose to the Irish inhabitants is practically like the average dose on a global basis calculated by Aarkrog et al. (1997).
In a study of the intake of 210Po and 210Pb from food for the Portuguese population (Carvalho, 1995), individual doses from 210Po of 85 µSv/year were estimated, of which 70 % (60 µSv/year) were due to the consumption of seafood. The dose calculations were based on measurements of concentrations in seafood from the North Atlantic coast of Portugal. A dose factor of 2 × 10⁻⁷ Sv/Bq was used, that is 1/6 of the factor given in ICRP 67. If the dose co-efficient in ICRP 67 had been used, the dose would have been 360 µSv/year, which is significantly higher than the dose rate given in the studies referred to above. This can be partly explained by the fact that the Portuguese consume more seafood than is common in other countries.
In a report on sources of and effects of ionising radiation, UNSCEAR (1993) estimated the average dose rate for members of the population to be 11 µSv/year from the intake of 210Po. The most important source was the consumption of fish, but “all other” foodstuffs were included in the calculations. Calculations were based on activity concentrations in food and a normalised average consumption rate based on data from FAO. An activity concentration in fish for 210Po of 2.0 Bq/kg was assumed, and a dose co-efficient for 210Po of 2.0 × 10⁻⁷ Sv/Bq. If we correct the calculations by using the dose co-efficient given in ICRP 67 (1995), this
Norse Decom AS 43

ND/E-19/03: Naturally occurring radionuclides in the marine environment
corresponds to a dose rate of 66 µSv/year. No new calculations have been carried out in the corresponding UNSCEAR report for 2000 (UNSCEAR, 2000).
In the MARINA II report the collective dose to the population in EU countries for typical levels of natural radionuclides in Northern European seas was calculated at 1.7 × 10⁴ man Sv/year. The calculations are based on the following concentrations of 210Po in seafood: 1.5 Bq/kg fresh weight in fish, 25 Bq/kg in crustacea and 50 Bq/kg in molluscs, and on statistics for catch and trade of seafood. Dose factors from ICRP 67 (Table 31) were used. By dividing the collective doses by the number of inhabitants in the EU area, 379.6 million as of 1 January 2002 (Eurostat, 2003), an average individual dose of 45 µSv/year can be calculated. This is at the same level as in UNSCEAR 1993, when corrections for the use in different dose factors are carried out. The calculated collective dose from natural radionuclides in the marine environment is compared with an estimated value of 8.44 × 10⁵ manSv/year for the same population from all natural sources (corresponding to 2.22 mSv per inhabitant). The marine route of exposure is according to this only responsible for 2 % of the total dose from natural background radiation.
Table 32: Average individual dose rate from natural radionuclides
in the marine environment, and overall.
Marine environment Total 0.015-0.10 mSv/year 2.3 mSv/year
Based on the above studies, the average effective dose from natural radionuclides in the marine environment lays around 15 - 100 µSv/year (Table 32). There may, however, be large individual differences based on different diets. In the MARINA II report, a summary of literature for dose estimates for critical groups is provided. Most studies deal with anthropogenic radionuclides, but a maximum dose rate from natural radionuclides in the marine environment to individual in critical groups in Northern Europe of 2 mSv/year. The deviation in the average dose is assumed to be the result of deviations in the diet, and not an increase in the concentration as a result of emissions.
8.2 Doses from discharges of produced water
With the exception of the MARINA II study, we have not found any data on doses from discharges of produced water from oil and gas exploitation. The authors of the MARINA II report have calculated collective dose rates for the population in EU countries from discharges of both anthropogenic and natural radionuclides to the Northern European sea areas for the years 1980 - 2000. Calculations of future dose rates assuming that all discharges cease after 2000 have also been carried out, and if discharge rates remain the same as in 2000. For the year 2000 the calculated collective dose from discharges of produced water was 78 manSv/year. This corresponds to 39 % of the dose from non-nuclear industries. The calculations were based on extremely faulty data both for discharge amounts and radionuclide content in produced water. In Chapter 6, the authors conclude that the genuine level of discharges is much lower than is assumed in the MARINA II study, certainly for the Norwegian Continental Shelf, which indicates that doses from discharges of produced water will also be lower than stated. The calculations were based on the following concentration factors for 210Po; 2 × 10⁴ for fish, 5 × 10⁴ for crustacea and 1 × 10⁴ for molluscs. These concentration factors are significantly different from recommended values from IAEA (1985),
Norse Decom AS 44

ND/E-19/03: Naturally occurring radionuclides in the marine environment
and are 10 times higher for fish than the IAEA recommendation. These concentration factors are defended on the basis of more recent studies by Swift and Kershaw (1999), indicating higher concentrations of 210Po in large fish. Calculations have also been carried out, using a concentration factor for fish of 2 × 10³. This reduces the doses to 1/3. When calculating background doses (see Chapter 8.1), a concentration in fish of 1.5 Bq/kg fresh weight was used. If we assume that the concentration in seawater is 1 mBq/L (see Chapter 4.2) we can calculate a concentration factor for fish of 1.5 × 10³. There is thus no correspondence between the concentration factor used when calculating doses from discharges of natural radionuclides and background doses. On the basis of these considerations it is reasonable to assume that the doses given in the MARINA II report from the discharge of produced water correspond to an upper limit rather than the best estimate on the basis of available data.
The calculated collective dose to the population of the EU countries from the discharge of produced water corresponds to a mere 0.5 % of the calculated background dose of the same population!
8.3 Doses from other non-nuclear industries
Köster et al. (1985) calculates a maximum individual dose and collective dose for the Dutch population caused by increased activity concentration in seafood as a result of discharges of phosphorous gypsum to the Rhine. The calculated maximum dose rate was 150 µSv/year, while the collective dose for the Dutch population was 170 manSv/year at a discharge of 2 Tg/year of phosphorous gypsum. A dose factor for 210Po from ICRP 30 (ICRP 1978), which is 4.4 × 10⁻⁷ was used. In a subsequent study by Köster et al. (1992), he calculates that high consumption of seafood from areas that have been affected by discharges from the phosphate industry can give an increase in effective dose rate of 0.1 - 0.3 mSv/year. This is assumed to apply to a group of fewer than 1,000 fishermen and for an unknown number of large-scale consumers of mussels, clams and shrimp.
W.C. Camplin et al. (1996) has studied the radiological significance of discharges from a phosphate factory in Whitehaven in Cumbria in the United Kingdom. The authors have used an oceanographic model for calculating exposures from 1954 to 1995, as well as future exposure. According to calculations, the effective dose rate for local seafood consumers increased to 3 mSv/year in 1963, and reached a maximum value of 6 mSv/year in 1983, before falling to 0.04 mSv/year following a reduction in discharges in the early 1990’s. The dose factor used for 210Po was 1.92 × 10⁻⁶ Sv/Bq, which is close to the one given in ICRP 67. Calculated dose for the same group as a result of normal levels of radionuclides in crustacea was 0.3 mSv/year. The authors state the calculations are conservative. In a subsequent study by McCartney et al. (2000), a reduction in the effective dose for a local group of seafood consumers of 1.0 mSv/year is reported in 1997. This study was based on measurements of concentrations in seafood.
Norse Decom AS 45

ND/E-19/03: Naturally occurring radionuclides in the marine environment
Table 33: Maximum effective dose rate in case of discharge to water of natural radionuclides for typical industries or operations (UNSCEAR, 2000).
Industry Maximum effective dose rate [µSv year-1] through
discharges to water Elementary phosphate production < 0.4 Phosphoric acid production 2 Fertiliser production 15 Primary iron and steel production 3 Coal processing Coke production Coal power station 4 Gas power station - Cement production Ceramic industry Treatment of mineral sand 320 Titanium pigment production 1
UNSCEAR (2000) has estimated the maximum effective dose rate through discharge of natural radionuclides for different routes of exposure from typical installations or operations within the mineral processing industry. A summary is provided in Table 33 for discharges to water. The highest maximum dose rate is 320 µSv/year and is due to the treatment of mineral sand. Lacking values for some of the sources is thought to be due to lacking data material. We wish to emphasise that the values in the Table are maximum dose rates, and can therefore not be simply compared with the average dose rates supplied above. The values apply globally, and are thus not necessarily representative for the North Sea.
In the MARINA II report a total collective dose rate for the population in the EU countries from discharges from non-nuclear activities/industries to the marine environment of 195 manSv (including discharges of produced water) was calculated for 2000. This can be compared with the dose rates for the population in the EU from natural radionuclides in the marine environment of 17000 manSv, and from all other natural sources of radiation of 844,000 manSv. The most important source for the collective dose was the phosphate industry, which was responsible for 119 manSv. Maximum collective dose rate from all discharges to the marine environment was 760 manSv in 1981. Since then, the dose has been declining due to reductions in the discharges of the phosphate industry.
Norse Decom AS 46

ND/E-19/03: Naturally occurring radionuclides in the marine environment
9 Knowledge gaps and suggestions for priority areas for further research In the following it is focussed on relations towards NFR’s research program Proof.
As a starting point 5 questions essential in relation to management of future emissions of radionuclides in produced water could be formulated. These questions could point the direction for determination of the priority areas for further research.
1. What are safe radiation doses for marine species?
2. What are safe radiation doses for the protection of the functions of the marine ecosystem?
3. How large is the contribution from the oil and gas industry to water and sediments including the resulting doses to biota compared to the background levels?
4. What is the contribution from consumption of seafood to radiation doses to man compared to other sources?
5. Does emissions of produced water give a significant contribution to radiation doses to man?
Based on the present data material in this report it can be concluded that it is not likely that there may be found any effects or that there exist a significant environmental risk in connection with the emissions of naturally occurring radionuclides (contained in the produced water).
The following is an overview of the most important knowledge gaps and suggestions of priority areas for further research:
a. Background levels.
The data for the levels of 226Ra, 228Ra, 210Pb and 210Po in the North Sea in general is quite sparse. It should be performed a survey to determine the current background levels for these radionuclides in sediment and the water column and a number of selected marine species (the selection is performed after the data requested in b and c have been obtained).
b. Physical and chemical characterisation.
The knowledge on the concentration levels of 226Ra, 228Ra, 210Pb and 210Po in produced water is limited, and further analyses should be performed to collect data for new calculations of emissions, dispersion and exposure of marine organisms. In this connection it is important to obtain a a physical and chemical speciation of the radionuclides. Knowledge of the physical and chemical form is important to be able to predict how the nuclides are spread in the environment and how they eventually are taken up in marine organisms and transported further in the marine food chain.
c. Dispersion and transport.
Based on new analytical data and knowledge on physical and chemical form, model simulations of dispersion and transport of the relevant radionuclides should be performed.
Norse Decom AS 47
ND/E-19/03: Naturally occurring radionuclides in the marine environment
The simulations should form the basis for the selection of monitoring stations, design of eventual experiments under controlled laboratory conditions and/or in the field and in the selection of relevant marine species for biological studies. The simulations will also give important input in connection with effect and risk calculations (g). The simulations of dispersion and transport should be verified by the means of a monitoring programme (h).
d. Mechanisms.
The knowledge of the factual processes and mechanisms involved in connection with uptake, distribution, secretion, and the effects of the relevant radionuclides on organisms naturally found in the North Se is sparse. To obtain such knowledge may however be viewed as basic research (and therefore outside the scope of Proof). This knowledge is important in order to understand what is going on, and is essential in order to develop mechanistic models. This knowledge is not essential in order to develop tools for risk analysis and management of the radionuclides.
e. Transfer factors.
The present data indicates that the radionuclides of interest mainly are taken up directly from the water phase and only to a minor degree trough the diet of most marine species. With other words: biomagnification trough the food chain is not regarded to be a problem. There are however only little data procured through experiments conducted in controlled exposure conditions, and it is important to verify this assumption trough laboratory experiments. The physical and chemical form of the radionuclides is important for uptake and transfer between the water phase and the different biological phases, and the transfer throughout the food chain. The experiments should therefore be based on the results obtained in priority area b. If it can be verified that biomagnification is of relatively less importance, there is probably enough data regarding bioconcentration factors for these radionuclides and the relevant marine species already present in the literature. It can nevertheless be deemed useful to establish bioconcentration factors from experiments where selected species from different levels of the marine food chain are exposed to several produced water components simultaneously.
f. Preparations for a unified dose term.
A radiation dose is defined in the contexts of radiation protection and relates exclusively to man. The radiation dose term is essential because it can be used to express the combined or total exposure from different radionuclides. There is a need for an assessment and a clarification or rephrasing/extension of the definitions connected to the radiation dose term in order to make it suitable for use in assessments and quantifications used on the marine food chain.
g. Development of model for effect and risk analyses.
Based on knowledge obtained through priority areas a – f, a model should be developed for quantification of field specific effects and environmental risks related to the relevant radionuclides in produced water. The data should be compared with similar quantifications of risks and effects for different other parts of the North Sea throughout a time period.
Norse Decom AS 48
ND/E-19/03: Naturally occurring radionuclides in the marine environment
h. Optimisation of an environmental monitoring programme.
After closure of the knowledge gaps identified in priority areas a – g, it would be beneficial to reassess the existing monitoring programme for optimisation with respect to the new knowledge.
Norse Decom AS 49
ND/E-19/03: Naturally occurring radionuclides in the marine environment
10 References Aarkrog, A (1997). A Comparison of Doses from 137Cs and 210Po in Marine Food: A Major
International Study. Journal of Environmental Radioactivity 43(1): 69-90.
Ahsanulla, M. and A. R. Williams (1989). "Kinetics of uranium uptake by the crab Pachygrapsus laevimanus and the zebra winkle Austrocochlea constricta." Mar. Biol. 101(3): 323-327.
Amdour, M. O., J. Doull, et al. (1992). Casarett and Doull's Toxicology: The basic science of poisons, Pergamon Press.Bacon, M. P., Spencer, D. W. and Brewer, P. G. (1976). 210Pb/226Ra and 210Po/210Pb disequilibria in seawater and suspended particulate matter. Earth and Planetary Science Letters 32(2): 277-296.
Baxter, M. S., MacKenzie, A. B., East, B. W. (1996). Natural decay series radionuclides in and around a large metal refinery. Journal of Environmental Radioactivity 32(1-2): 115-133.
Blasco, J. and J. Puppo (1999). "Effect of heavy metals (Cu, Cd and Pb) on aspartate and alanine aminotransferase in ruditapes phillippinarum (Mollusca: Bivalvia)." Comp. Biochem. Physiol. C. 122(2): 253-263.
Bojanowski, R. (1988). Inventory of radium isotopes in the oceans. In Inventories of selected radionuclides in the oceans, IAEA. IAEA-TECDOC-481. International Atomic Energy Agency.
Bonotto, S. (1981). Ten years of investigation on radioactive contamination of the marine environment. Incorporation, by marine algae and animals, of hydrogen-3 and other radionuclides present in effluents of nuclear or industrial origin. Impacts of radionuclide releases into the marine environment, Vienna, IAEA.
Camplin, V. C., Baxter, A. J. and Round, G. D. (1996). The radiological impact of discharges of natural radionuclides from a phosphate plant in the United Kingdom. Environment International 22: S259-S270.
Carvalho, F. P. and S. W. Fowler (1994). "A double-tracer technique to determine the relative importance of water and food as sources of polonium-210 to marine prawns and fish. " Mar. Ecol. Prog. Ser. 103(3): 251-264.
Carvalho, F. P. (1995). 210Po and 210Pb intake by the Portuguese Population: The contribution of seafood in the diatery intake of 210Po and 210Pb. Health Physics 69(4): 469-480.
Cherry, R. D. and L. V. Shannon (1974). "The alpha radioactivity of marine organisms." At. Energy Rev. 12: 3-45.
Cherry, R. D. and Heyraud, M. (1988). Lead-210 and polonium-210 in the world’s oceans. In Inventories of selected radionuclides in the oceans, IAEA-TECDOC-481. International Atomic Energy Agency.
Chung, Y. (1981). 210Pb and 226Ra distributions in the Circumpolar waters. Earth and Planetary Science Letters 55(2): 205-216.
Cochran, J. K. (1980). The Flux of 226Ra from deep-sea sediments. Earth and Planetary Science Letters 49(2): 381-392.
Norse Decom AS 50
ND/E-19/03: Naturally occurring radionuclides in the marine environment
CEC (1990). The radiological exposure of the population of the European Community from radioactivity in North European marine waters. Project “MARINA”. EUR report 12483EN. Commision of the European Communities.
Cowart, J. B. and Burnett, W. C. (1994). The distribution of uranium and thorium decay-series radionuclides in the environment - a review. Journal of Environmental Quality 23(4): 651-662.
Dahlgaard, H. (1996). "Polonium-210 in Mussels and Fish from the Baltic-North Sea Estuary." 32(1-2): 91-96.
Diehl, P. (2003). Uranium mining in Eastern Germany: The WISMUT Legacy. Updated 2 September 2003. http://www.antenna.nl/wise/uranium/uwis.html. WISE UraniumProject.
DTI (2003a). Oil discharged with produced water 1991-2002. Updated May 2003.http://www.og.dti.gov.uk/information/bb_updates/chapters/Table3_2.htm Department of Trade and industry.
DTI (2003b). UK annual oil production. Updated 30 August 2003. http://www.og.dti.gov.uk/pprs/full_production/annual_oil_production_sorted_by_field/annual_oil_production_sorted_by_field.htm Department of Trade and industry.
DTI (2003c). UK annual dry gas production. Updated 30 August 2003. http://www.og.dti.gov.uk/pprs/full_production/annual_dry_gas_production_sorted_by_field/ annual_dry_gas_production_sorted_by_field.htm. Department of Trade and industry.
Ducrotoy, J.-P., Elliott, M and de Jonges, V. N. (2000). The North Sea. Marine Pollution Bulletin 41(1-6): 5-23.
EC (2002). MARINA II – Update of the MARINA project on the radiological exposure of the European Community from radioactivity in North European marine waters. Radiation Protection 132. European Commission.
Edgington, D. N., S. A. Gordon, et al. (1970). "The concentration of radium, thorium and uranium by tropical marine algae." Limnol. Oceanogr. 15: 945-955.
ENS (2003). Danmarks olie- og gasproduktion 2002. Energistyrelsen.
EUROSTAT (2003). Eurostat yearbook 2003 - People in Europe
EZ (2003). Oil and gas in the Netherlands - Exploration and production 2002. Ministry of Economic Affairs.
Fisher, N. S., K. A. Burns, et al. (1983). "Accumulation and cellular distribution og 241 Am, 210Po and 210Pb in two marine algae." Mar. Ecol. Prog. Ser. 11: 233-237.
Fisher, N. S., V. T. Breslin, et al. (1995). "Accumulation of silver and lead in estuarine microzooplankton." Mar. Ecol. Prog. Ser. 116(1-3): 207-215.
Fisher, R. S. (1998). Geologic and geochemical controls on naturally occurring radioactive materials (NORM) in produced water from oil, gas and geothermal operations. Environmental Geosciences 5(3): 139-150.
Gäfvert, T. (2002). The prevalence of radioactivity in a number of non-nuclear industries. Doctoral dissertation. Department of Radiation Physics The Jubileum Institute. Lund, Lund University.
Norse Decom AS 51
ND/E-19/03: Naturally occurring radionuclides in the marine environment
Germain, P., G. Leclerc, et al. (1995). "Transfer of polonium-210 into Mytilus edulis (L.) and Fucus vesiculosus (L.) from the baie de Seine (Channel coast of France)." The Science of the Total Environment 164: 109-123.
Heldal, H. E., L. Føyn, et al. (2003). "Bioaccumulation of 137Cs in pelagic food webs in the Norwegian and Barents Sea." Journal of Environmental Radioactivity 65: 177-185.
Hwang, G. C., K. C. Song, et al. (1993). "Heavy metal concentration of sea water and shellfish in Charanman-Saryangdo and Mirukdo area." Bull. Natl. Fish. Res. Dev. Agency (Korea) 48: 217-225.
IAEA (1978). The radiological basis of the IAEA revised definition and recommendations concerning high-level radioactive waste unsuitable for dumping av sea. Vienna, IAEA: 1-58.
IAEA (1985). Sediments Kds and concentration factors for radionuclides in the marine environment. IAEA-TECDOC-247. International Atomic Energy Agency.
IAEA (1990). The environmental behaviour of radium, Vol. 1-II. Technical report series no. 310. International Atomic Energy Agency.
IAEA (1995). Sources of radioactivity in the marine environment and their relative contributions to overall dose assessment from marine radioactivity (MRADOS). IAEA-TECDOC-838. International Atomic Energy Agency.
ICRP (1978). Limits for intakes of radionuclides by workers. ICRP Publication 30. International Commission on Radiological Protection.
ICRP (1993). Age-dependent doses to members of the public from intake of radionuclides: Part 2 Ingestion dose coefficients. ICRP Publication 67. International Commission on Radiological Protection.
Israelson, C. (2003). SIS, Danmark. Personlig meddelelse
Iyengar, M. A. R. (1983). Studies on the distribution of natural radioactivity in marine organisms, University of Bombay.
Kershaw, P. J., R. J. Pentreath, et al. (1992). A review of radioactivity in the Irish Sea. A report prepared for the Marine Pollution Monitoring Management Group. Lowestoft, MAFF.
Key, R. M, Sarmiento, J. L, og Moore, W. S. (1985). Distribution and flux of 226Ra and 228Ra in the Amazon River estuary. J. Geophys. Res, 90: 6995-7004.
Kirchmann, R., S. Bonotto, et al. (1973). Contamination des organismes vivants d'un estuaire par le radium-226 provenant d'effluents liquides d'origine industrielle. International Symposium, Warsawa, IAEA.
Kraemer, T. F. and Reid, D. F. (1984). The occurrence and behavior of radium in saline formation water of the United-States Gulf-Coast Region. Isotope Geoscience 2(2): 153-174.
Köster, H. W., Leenhouts, H. P., van Weers, A. W. and Frissel, M. J. (1985). Radioecological model calculations for natural radionuclides released into the environment by disposal of dhosphogypsum. Science of the Total Environment 45(OCT): 47-53.
Köster, H. W., Marwitz, P. A., Berger G. W., van Weers A. W., Hagel, P. and Nieuwenhuize, J. (1992). 210Po, 210Pb, 226Ra in aquatic ecosystems and polders, anthropogenic sources, distribution
Norse Decom AS 52

ND/E-19/03: Naturally occurring radionuclides in the marine environment
and enhanced radiation doses in the Netherlands. Radiation Protection Dosimetry 45(1-4): 715-719.
Landa, E. R. and Reid, D. F. (1982). Sorption of radium-226 from oil-production brine by sediments and soils. Environ Geol 5(1): 1-8.
Legeleux, F. and Reyss, J. L. (1996). 228Ra/226Ra activity ratio in oceanic settling particles: Implications regarding the use of barium as a proxy for paleoproductivity reconstruction. Deep-Sea Research Part I-Oceanographic Research Papers 43(11-12): 1857-1863.
Lewis, R. J. (2000). SAX'S Dangerous properties of industrial materials, John Wiley & Sons, Inc. Lowman, F. G., T. R. Rice, et al. (1971). Accumulation and redistribution of radionuclides by marine organisms. Radioactivity in the marine environment. Washington DC, United States National Academy of Sciences: 161-199.
McCartney, M., Davidson, C. M., Howe, S. E. and Keating, G. E. (2000). Temporal changes in the distribution of natural radionuclides along the Cumbrian coast following the reduction of discharges from a phosphoric acid production plant. Journal of Environmental Radioactivity. 49(3): 279-291.
McDonald, P., Cook, G. T. and Baxter, M. S. (1992). Natural and anthropogenic radioactivity in coastal regions of the UK. Radiation Protection Dosimetry 45(1-4): 707-710.
Merck (2001). The Merck Index: An encyclopedia of chemicals, drugs, and biologicals. Whithehouse Statio, NJ, USA, Merck & Co, Inc.
Moore, W. S. (1969). Oceanic concentrations of 228Radium. Earth and Planetary Science Letters 6(6): 437-&.
Moore, W. S. (1981). Radium isotopes in the Chesapeake Bay. Estuar. Coast. Shelf Sci. 12: 713-723.
Nicholson, R. A. and Stuart, M. E. (1986). Uranium in the superficial sediments of the North-Sea. Marine Environmental Research 19(3): 177-183.
Neff, J. M. (2002). Bioaccumulation in marine organisms. Effect of contaminants from oil well produced water. First edition. Elsevier Science. ISBN 0-080-43716-8.
Nozaki, Y. (1986). 226Ra-222Rn-210Pb Systematics in seawater near the bottom of the ocean. Earth and Planetary Science Letters 80(1-2): 36-40.
NRPA (1997). Avleiring av naturlig radioaktive stoffer i olje- og gassproduksjon. StrålevernHefte 12. Statens strålevern.
O’Carroll, K. (2003). DTI, UK. Personlig meddelelse.
OD (2003). Måleenheter for olje og gass. http://www.npd.no/Norsk/Om+OD/Nyttig/Olje-ABC/maaleenheter_oljeoggass.htm. Oljedirektoratet.
OED (2002). Faktaheftet 2002 - Norsk Petroleumsvirksomhet. Olje- og energidepartementet.
OLF (2000). Utslipp fra olje- og gassvirksomheten 1999. Oljeindustriens landsforening.
OLF (2001). Utslipp fra olje- og gassvirksomheten 2000. Oljeindustriens landsforening.
OLF (2002). Utslipp fra olje- og gassvirksomheten 2001. Oljeindustriens landsforening.
Norse Decom AS 53
ND/E-19/03: Naturally occurring radionuclides in the marine environment
OLF (2003). Utslipp fra olje- og gassvirksomheten 2002. Oljeindustriens landsforening.
OSPAR (2001). OSPAR Recommendation 2001/1 for the Management of Produced Water from Offshore Installations. OSPAR Commission.
OSPAR (2002). Discharges of radioactive substances into the maritime area by non-nuclear industry. Radioactive Substance Series. OSPAR Commission.
Parrett, A. (1998). Pollution Impacts on North Sea Fish Stocks.
Plater, A. J., Ivanovich, M. and Dugdale, R. E. (1995). 226Ra contents and 228Ra/226Ra activity ratios of the Fenland rivers and the Wash, Eastern England: spatial and seasonal trends. Chemical Geology 119(1-4): 275-292.
Poole, A. J., Allington, D. J. and Denoon, D. C. (1995). Temporal and spatial survey of dissolved 226Ra in Coastal Waters of the Eastern Irish Sea. Science of the Total Environment 168(3): 233-247.
Polikarpov (1998). "Conceptual model of responses of organisms, populations and ecosystems to all possible dose rates of ionising radiation in the environment." Radiat. Prot. Dosim. 75(1-4): 181-185.
Pollard, D., Ryan, T. P. og Dowdall, A (1998). The Dose to Irish Seafood Consumers from 210Po. Radiation Protection Dosimetry. 75(1-4): 139-142
Reish, D. J. and J. A. Lemay (1991). "Toxicity and bioconcentration of metals and organic compounds by polychaeta." Ophelia (Suppl.) 5: 653-660.
SodM (2003). Jaarverslag 2002, Staatstoezicht op de mijnen. (på nederlandsk) Staatstoezicht op de mijnen.
Spencer, D. W., Bacon, M. P. and Brewer, P. G. (1980). The distribution of 210Pb and 210Po in the North Sea. Thalassia jugosl. 16, 125-154.
Staatsblad (2001). Staatsblad van het Koninkrijk der Nederlanden. 397 Besluit van 16 juli 2001, houdende vaststelling van het Besluit stralingsbescherming (på nederlandsk). Ministry of Social Affairs and Ministry of Housing, Spatial Planning and Environment in consultation with the Ministry of Economic Affairs
Store norske leksikon, Aschehoug & Gyldendal, http://storenorskeleksikon.no.
Strand, T., Lysebo, I., Kristensen, D. and Birovljev, A. (1997). Radioaktive avleiringer i olje- og gassproduksjon. Strålevern Rapport 1997:1. Statens strålevern.
Strålberg, E., Sidhu, R. S. and Varskog, P. (2002). Produsert vann og radioaktivitet - sammenfatning av eksisterende data, ND/E-05/02, Norse Decom.
Swift, D. J. and Kershaw, P. J. (1999). Generic parameters for modelling marine and freshwater systems. MAFF R&D and surveillance report 443.
Tsytsugina, V. G., Risik, N. S. and Lazorenko G. E. (1973). Artificial and natural radionuclides in marine life. Edited by Polikarpov, G. G.
UNSCEAR (1993). Sourses and effects of ionizing radiation. United Nations Scientific Committee on the Effects of Atomic Radiation. Report to the General Assembly, with scientific annexes.UNSCEAR (2000). Sources and effects of ionizing radiation, United Nations Scientific
Norse Decom AS 54

ND/E-19/03: Naturally occurring radionuclides in the marine environment
Commitee on the Effects on Atomic Radiation. Report to the General Assembly, with scientific annexes. Vol. 1: Sources.
Utvik, T. I. R. (1999). Chemical characterisation of produced water from four offshore oil production platforms in the North Sea. Chemosphere 39(15): 2593-2606.
van der Leden, F., Troise, F. L. and Todd, D. K. (1990). The water encyclopedia, Second edition, ISBN 0-87371-120-3. Lewis Publishers, INC.
Varanasi, U. (1978). Biological fate of metals in fish. Marine biological effects of OCS petroleum development. D. A. Wolfe. Boulder, CO, NOAA ERL: 41-53.
Vegueria, S. F. J., Godoy, J. M. and Miekeley, N. (2002a). Environmental impact in sediments and seawater due to discharges of Ba, 226Ra, 228Ra, V, Ni and Pb by produced water from the Bacia de Campos oil field offshore platforms. Environmental Forensics 3(2): 115-123.
Vegueria, S. F. J., Godoy, J. M. and Miekeley, N. (2002b). Environmental impact studies of barium and radium discharges by produced waters from the “Bacia de Campos” oil-field offshore platforms, Brazil. Journal of Environmental Radioactivity 62(1): 29-38.
Walker, M. I. and Rose, K. S. B. (1990). The radioactivity of the sea. Nuclear Energy 29(4): 267-278.
Weast, R. C. (1978). CRC Handbook of chemistry and physics, CRC Press, Inc.
Williams, A. R. (1984). Biological uptake and transport. The behaviour of radium in waterways and aquifers. Vienna, IAEA. TECDOC-301: 175-202.
Windom, H., Smith, R., Niencheski, F. and Alexander, C. (2000). Uranium in rivers and estuaries of globally diverse, smaller watersheds. Marine Chemistry 68(4): 307-321.
Yamamoto, M., T. Abe, et al. (1994). "Polonium-210 and lead-210 in marine organisms: intake levels for Japanese." Journal of Radioanalytical and Nuclear Chemistry, Articles 178(1): 81-90.
Norse Decom AS 55

ND/E-19/03: Naturally occurring radionuclides in the marine environment
Appendix A Summary of studies of natural radioactivity in ocean areas that are not directly referred to in the main text. Referense Sea or Ocean Nuklide(s)
Bacon, M. P., Belastock, R. A., Tecotzky, M., Turekian, K. K. and Spencer, D. W. (1988). Lead-210 and polonium-210 in ocean water profiles of the continental shelf and slope south of New-England. Continental Shelf Research 8(5-7): 841-853.
Outside New-England 210Pb, 210Po
Broecker, W. S., Li, Y. H. and Cromwell, J. (1967). Radium-226 and radon-222: Concentration in Atlantic and Pacific Oceans. Science 158(3806): 1307-&.
Atlantic Ocean and Pacific Ocean
226Ra, 222Rn
Broecker, W. S., Goddard, J. and Sarmiento, J. L. (1976). Distribution of 226Ra in Atlantic Ocean. Earth and Planetary Science Letters 32(2): 220-235.
Atlantic Ocean 226Ra
Chan, L. H., Edmond, J. M., Stallard, R. F., Broecker, W. S., Chung, Y. C., Weiss, R. F. and Ku, T. L. (1976). Radium and barium at Geosecs stations in the Atlantic and Pacific. Earth and Planetary Science Letters 32(2): 258-267.
Atlantic Ocean and Pacific Ocean
226Ra
Chen, H. Y. and Huh, C. A. (1999). 232Th - 228Ra - 228Th disequilibrium in East China Sea sediments. Journal of Environmental Radioactivity 42: 93-100.
East China Sea 232Th, 228Ra, 228Th
Farley, K. A. and Turekian, K. K. (1990). Lead-210 in the Circumpolar South-Atlantic. Deep-Sea Research Part a-Oceanographic Research Papers 37(12): 1849-1860.
Antarctic Ocean 210Pb (226Ra)
Huh, C. A. and Ku, T. L. (1998). A 2-D section of 228Ra and 226Ra in the Northeast Pacific. Oceanologica Acta 21(4): 533-542.
North-East Pacific Ocean 226Ra, 228Ra
Kaufman, A., Trier, R. M., Broecker, W. S. and Feely, H. W. (1973). Distribution of 228Ra in world ocean. Journal of Geophysical Research 78(36): 8827-8848.
Atlantic Ocean, Arctic Ocean, Indian Ocean, Pacific Ocean og Antarctic Ocean
228Ra
Klinkhammer, G. P. and Palmer, M. R. (1991). Uranium in the oceans - Where it goes and why. Geochimica et Cosmochimica Acta 55(7): 1799-1806.
All 238U
Li, Y. H., Mathieu, G. Biscaye, P. and Simpson, H. J. (1977). Flux of 226Ra from estuarine and continental shelf sediments. Earth and Planetary Science Letters 37(2): 237-241.
Hudson, river mouth 226Ra
Mackenzie, A. B., Baxter, M. S. McKinley, I. G., Swan, D. S. and Jack, W. (1979). Determination of 134Cs, 137Cs, 210Pb, 226Ra and 228Ra concentrations in nearshore marine sediments and seawater. Journal of Radioanalytical Chemistry 48(1-2): 29-47.
Clyde Sea (west of Scotland) 226Ra, 228Ra, 210Pb
Moore, W. S., Key, R. M. and Sarmiento, J. L. (1985). Techniques for precise mapping of 226Ra and 228Ra in the ocean. Journal of Geophysical Research-Oceans 90(NC4): 6983-6994.
Atlantic Ocean 226Ra, 228Ra
Moore, W. S. (1996). Large groundwater inputs to coastal waters revealed by 226Ra enrichments. Nature 380(6575): 612-614.
South Atlantic Bight 226Ra
Norse Decom AS 56
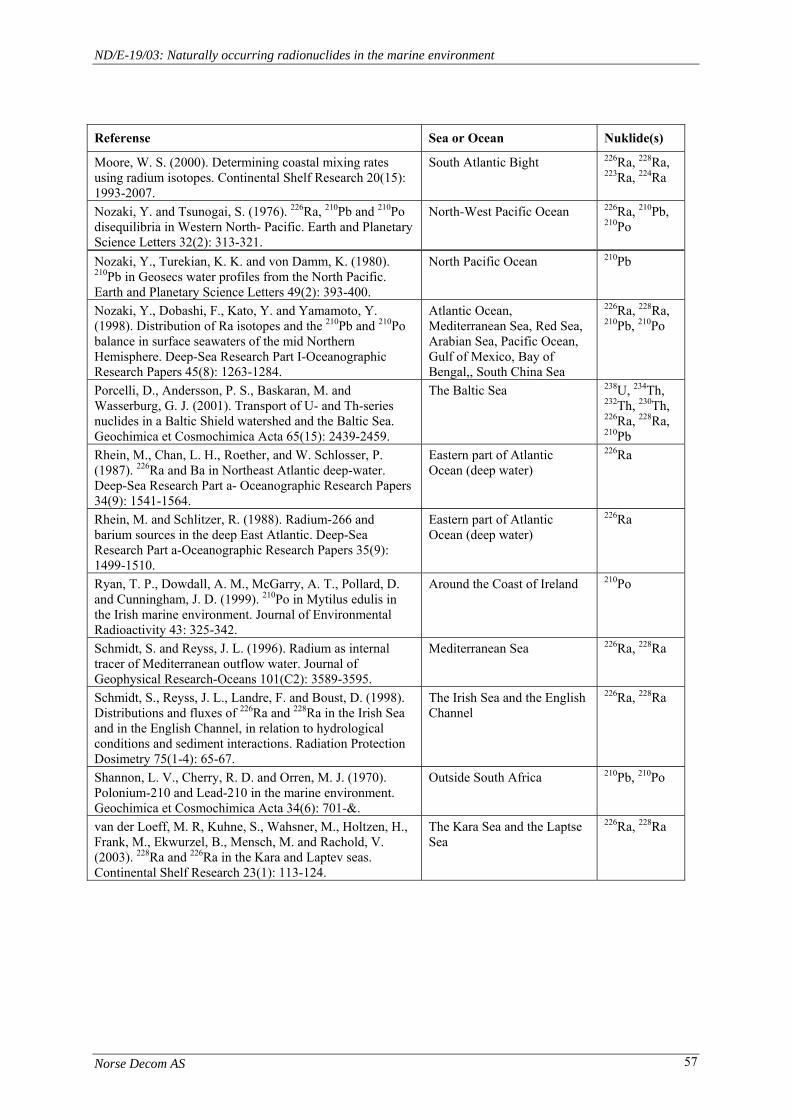
ND/E-19/03: Naturally occurring radionuclides in the marine environment
Referense Sea or Ocean Nuklide(s)
Moore, W. S. (2000). Determining coastal mixing rates using radium isotopes. Continental Shelf Research 20(15): 1993-2007.
South Atlantic Bight 226Ra, 228Ra, 223Ra, 224Ra
Nozaki, Y. and Tsunogai, S. (1976). 226Ra, 210Pb and 210Po disequilibria in Western North- Pacific. Earth and Planetary Science Letters 32(2): 313-321.
North-West Pacific Ocean 226Ra, 210Pb, 210Po
Nozaki, Y., Turekian, K. K. and von Damm, K. (1980). 210Pb in Geosecs water profiles from the North Pacific. Earth and Planetary Science Letters 49(2): 393-400.
North Pacific Ocean 210Pb
Nozaki, Y., Dobashi, F., Kato, Y. and Yamamoto, Y. (1998). Distribution of Ra isotopes and the 210Pb and 210Po balance in surface seawaters of the mid Northern Hemisphere. Deep-Sea Research Part I-Oceanographic Research Papers 45(8): 1263-1284.
Atlantic Ocean, Mediterranean Sea, Red Sea, Arabian Sea, Pacific Ocean, Gulf of Mexico, Bay of Bengal,, South China Sea
226Ra, 228Ra, 210Pb, 210Po
Porcelli, D., Andersson, P. S., Baskaran, M. and Wasserburg, G. J. (2001). Transport of U- and Th-series nuclides in a Baltic Shield watershed and the Baltic Sea. Geochimica et Cosmochimica Acta 65(15): 2439-2459.
The Baltic Sea 238U, 234Th, 232Th, 230Th, 226Ra, 228Ra, 210Pb
Rhein, M., Chan, L. H., Roether, and W. Schlosser, P. (1987). 226Ra and Ba in Northeast Atlantic deep-water. Deep-Sea Research Part a- Oceanographic Research Papers 34(9): 1541-1564.
Eastern part of Atlantic Ocean (deep water)
226Ra
Rhein, M. and Schlitzer, R. (1988). Radium-266 and barium sources in the deep East Atlantic. Deep-Sea Research Part a-Oceanographic Research Papers 35(9): 1499-1510.
Eastern part of Atlantic Ocean (deep water)
226Ra
Ryan, T. P., Dowdall, A. M., McGarry, A. T., Pollard, D. and Cunningham, J. D. (1999). 210Po in Mytilus edulis in the Irish marine environment. Journal of Environmental Radioactivity 43: 325-342.
Around the Coast of Ireland 210Po
Schmidt, S. and Reyss, J. L. (1996). Radium as internal tracer of Mediterranean outflow water. Journal of Geophysical Research-Oceans 101(C2): 3589-3595.
Mediterranean Sea 226Ra, 228Ra
Schmidt, S., Reyss, J. L., Landre, F. and Boust, D. (1998). Distributions and fluxes of 226Ra and 228Ra in the Irish Sea and in the English Channel, in relation to hydrological conditions and sediment interactions. Radiation Protection Dosimetry 75(1-4): 65-67.
The Irish Sea and the English Channel
226Ra, 228Ra
Shannon, L. V., Cherry, R. D. and Orren, M. J. (1970). Polonium-210 and Lead-210 in the marine environment. Geochimica et Cosmochimica Acta 34(6): 701-&.
Outside South Africa 210Pb, 210Po
van der Loeff, M. R, Kuhne, S., Wahsner, M., Holtzen, H., Frank, M., Ekwurzel, B., Mensch, M. and Rachold, V. (2003). 228Ra and 226Ra in the Kara and Laptev seas. Continental Shelf Research 23(1): 113-124.
The Kara Sea and the Laptse Sea
226Ra, 228Ra
Norse Decom AS 57