Embed Size (px)
Citation preview

Systech WaterResources, Inc.
Upstream Sources of Ammonia and Nutrient Dynamics in the Watershed
CWEMF Ammonia Technical BriefingOctober 28, 2011
Carl Chen and Joel HerrSystech Water Resources, Inc.

Systech WaterResources, Inc.
Why Ammonia Is Important
Nutrients N(NH4, NO3), P, K
Algae
Dissolved Oxygen
Fish Food -Detritus ZooplanktonNeomysis
SalmonDelta smeltStriped bass
AmmoniaNitrification
NH4OH Toxicity

Systech WaterResources, Inc.
Model Used
Systech WaterResources, Inc.
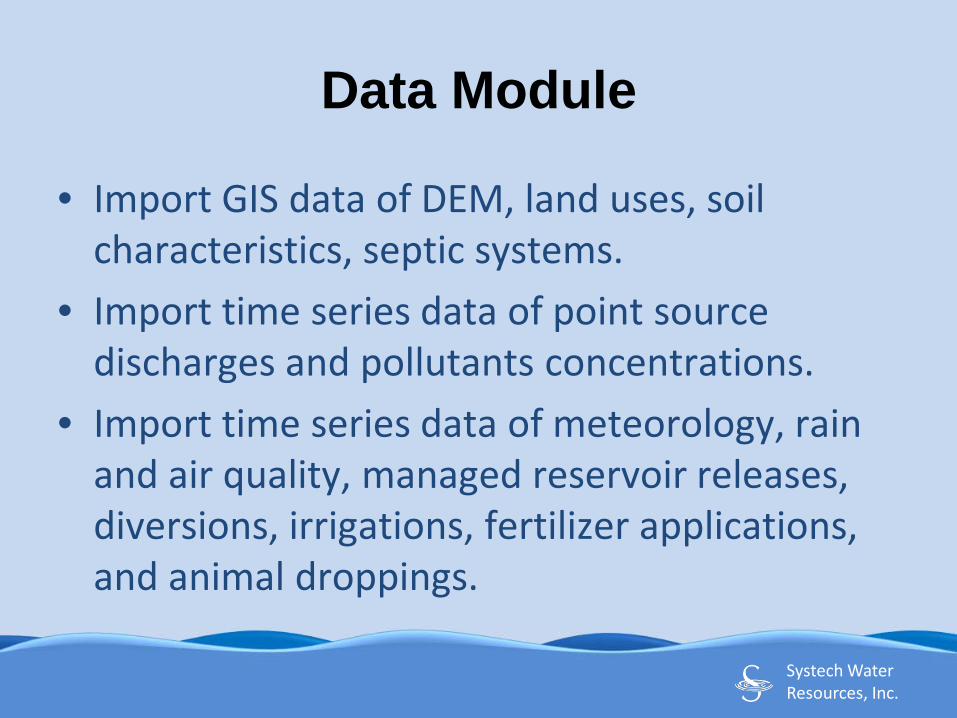
Data Module
• Import GIS data of DEM, land uses, soil characteristics, septic systems.
• Import time series data of point source discharges and pollutants concentrations.
• Import time series data of meteorology, rain and air quality, managed reservoir releases, diversions, irrigations, fertilizer applications, and animal droppings.

Systech WaterResources, Inc.
Dynamic Watershed Model• Use DEM data to delineate land catchments and stream
segments and form a network for flow and pollutant routing.
• Input land uses (crop types) and soil data (layers).
• Apply daily irrigation water and fertilizer to crop land.
• Simulate hourly surface and groundwater hydrology resulting from rainfalls, man-made irrigation and flow diversions.
• Simulate hourly water quality by accounting for atmospheric deposition, cation exchange, wash off, leaching, nutrient uptake (plants and alga), and chemical transformation.
• Calibrate model coefficients to match the simulated flow and water quality to available observed data.

Systech WaterResources, Inc.
Knowledge Module• Scientific definitions of model coefficients and
their default values.
• Documents of rule and regulations.
• Documents of research findings.
• Documents of knowledge gained in current study.

Systech WaterResources, Inc.
Modules for Stakeholder Process
• TMDL module – road map to calculate total maximum daily load of point and nonpoint source pollution to meet the water quality criteria of intended beneficial uses.
• Consensus module – road map to formulate alternatives, run model, identify scientifically feasible alternatives, refine and vote for a politically acceptable cost-effective plan.

Systech WaterResources, Inc.
San Joaquin River Basin

Systech WaterResources, Inc.
Sacramento River Basin

Systech WaterResources, Inc.
Nonpoint Source Simulation
Wet depositionDry depositionIrrigationFertilizer, animal droppings
Soil erosion & wash off
Mineral weathering Organic matter decayNitrificationCation exchangePlant uptake

Systech WaterResources, Inc.
San Joaquin Watershed Land Use
GrasslandForestScrublandBarrenMarshOrchards & VinesPerennial foragesWinter grains and safflowerWarm season cereals and foragesCottonOther Row CropsRiceDairy Land ApplicationConfined FeedingOther AgriculturalUrban residentialUrban landscape and open spaceUrban commercialUrban industrialWater

Systech WaterResources, Inc.
Sacramento Watershed Land Use
GrasslandForestScrublandBarrenMarshOrchards & VinesPerennial foragesWinter grains and safflowerWarm season cereals and foragesCottonOther Row CropsRiceDairy Land ApplicationConfined FeedingOther AgriculturalUrban residentialUrban landscape and open spaceUrban commercialUrban industrialWater

Systech WaterResources, Inc.
San Joaquin Ammonia Load

Systech WaterResources, Inc.
Sacramento Ammonia Load

Systech WaterResources, Inc.
San Jaoquin Nitrate Load

Systech WaterResources, Inc.
Sacramento Nitrate Load
Systech WaterResources, Inc.
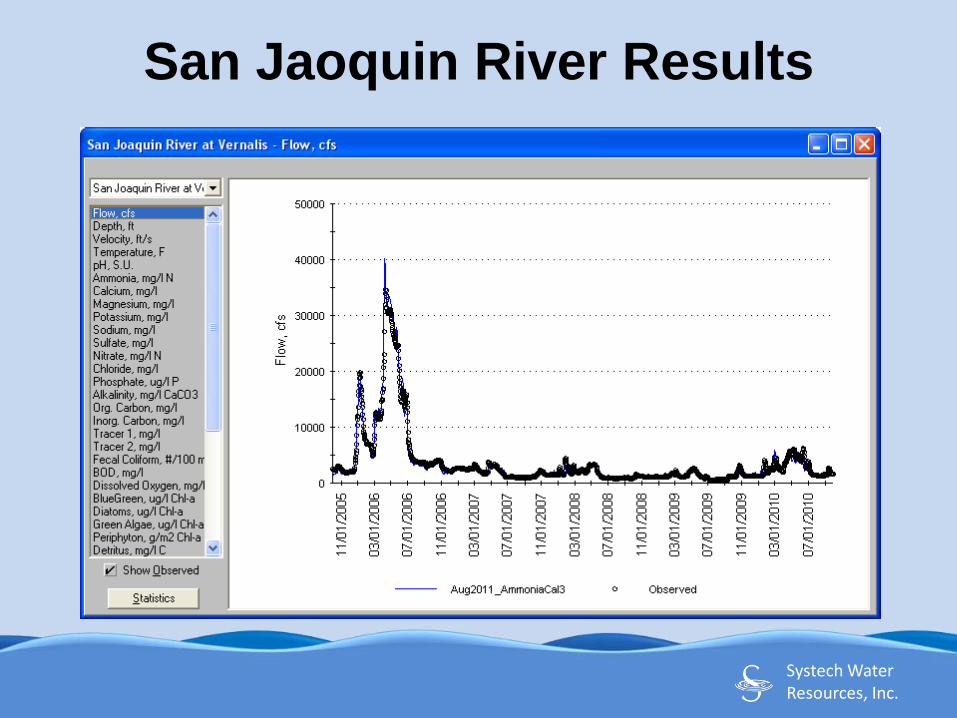
San Jaoquin River Results
Systech WaterResources, Inc.
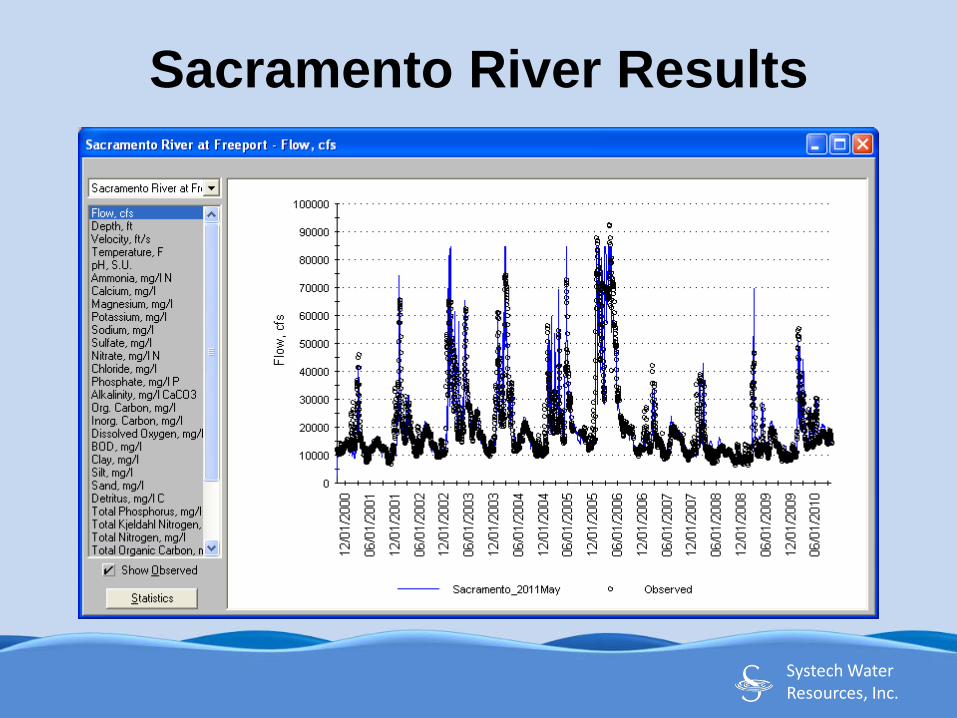
Sacramento River Results

Systech WaterResources, Inc.
San Joaquin River Results

Systech WaterResources, Inc.
Sacramento River Results

Systech WaterResources, Inc.
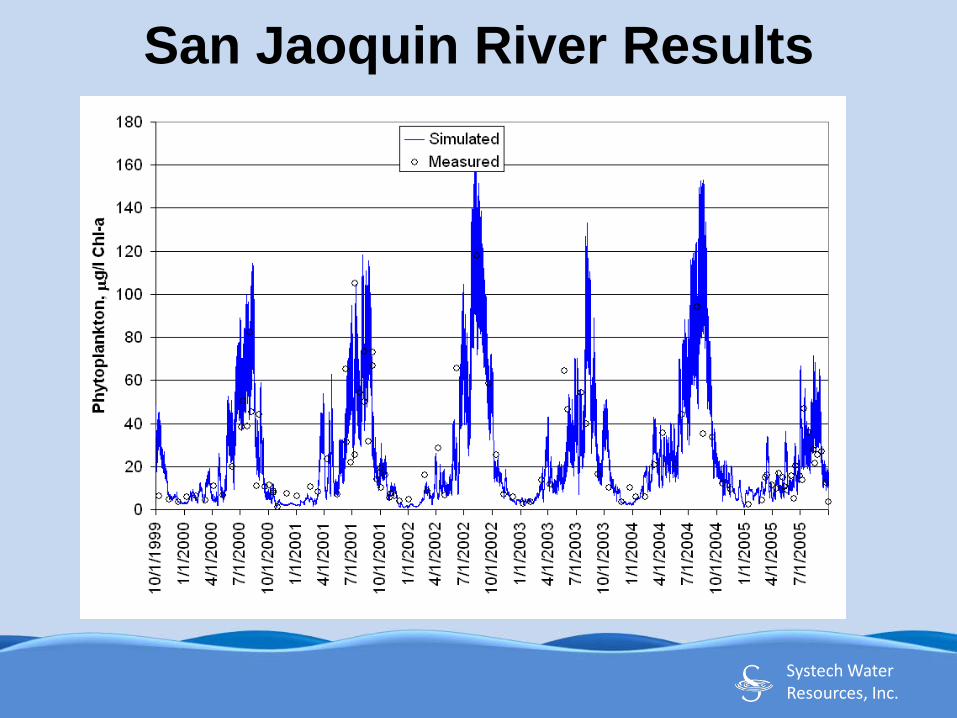
San Jaoquin River Results

Systech WaterResources, Inc.
Sacramento River Results
Systech WaterResources, Inc.
San Jaoquin River Results

Systech WaterResources, Inc.
San Jaoquin Ammonia Loadkg/d kg/ha/yr
Natural Land Cover 32 0.04Orchards 85 0.56Grains and Forages 66 0.27Row Crops 106 0.45Dairy Lands 1,611 16.10Farmsteads 118 3.16Urban 86 0.92TOTAL 2,103 1.23

Systech WaterResources, Inc.
Sacramento Ammonia Loadlb/d lb/acre/yr
Natural Land Cover 1,502 0.15
Orchards 2,157 2.15
Grains & Forages 736 0.58
Row Crops 1,419 4.73
Rice 6,483 4.19
Dairy Land App 401 14.65
Farmsteads 314 0.64
Urban 2,491 2.13
TOTAL 15,502 0.96
Systech WaterResources, Inc.
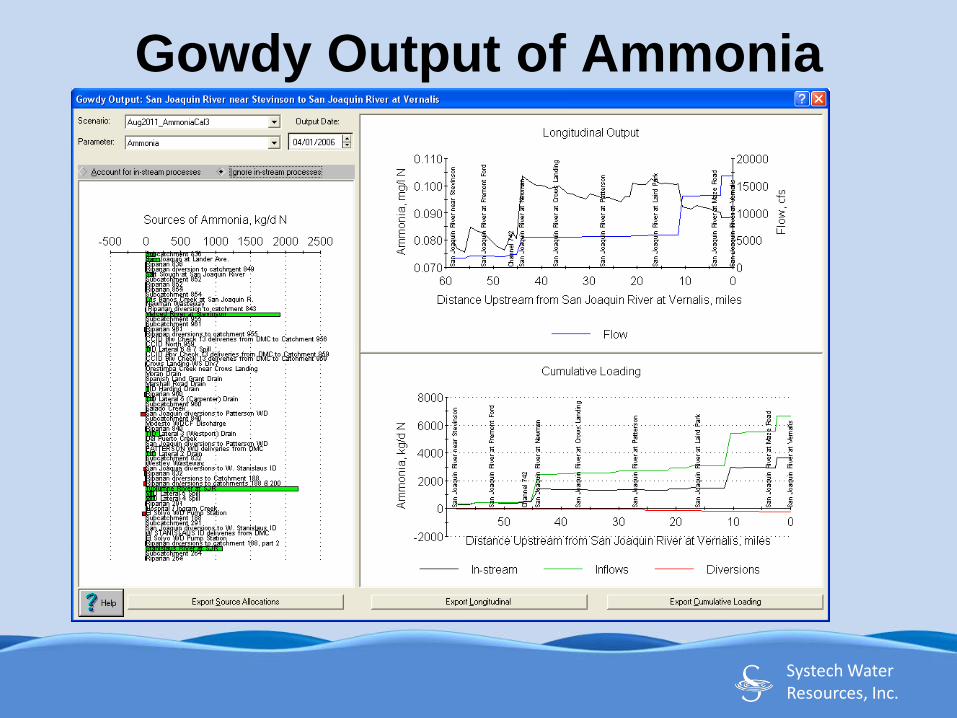
Gowdy Output of Ammonia

Systech WaterResources, Inc.
Gowdy Ammonia Output 2006-2010
Systech WaterResources, Inc.
Nutrients Effects on DWSC

Systech WaterResources, Inc.
Ammonia in Stockton Discharge

Systech WaterResources, Inc.
Observed Ammonia in DWSC

Systech WaterResources, Inc.
DO Deficit at 250 cfs (yr 2000)
100% Stockton load and 100% river load100% Stockton load and 75% river load100% Stockton load and 50% river load100% Stockton load and 25% river load100% river load and 75% Stockton load100% river load and 50% Stockton load100% river load and 25% Stockton load
DO Deficit inDWSC, kg O2
136060020060640430300
Alternative Loading Condition

Systech WaterResources, Inc.
DO Deficit at 1000 cfs (yr 2000)
Alternative Loading Condition
100% Stockton load and 100% river load100% Stockton load and 75% river load100% Stockton load and 50% river load100% Stockton load and 25% river load100% river load and 75% Stockton load100% river load and 50% Stockton load100% river load and 25% Stockton load
DO Deficit inDWSC, kg O2
300001671

Systech WaterResources, Inc.
DO Deficit Without DWSCYR 2000 River and Stockton Loads
UVM Flow At Stockton
250 cfs500750100015002000
DO Deficit inDWSC, kg O2
120490000

Systech WaterResources, Inc.
Nutrients Effects on Delta Fish• Toxicity to fish is a function NH4OH at high
pH, both simulated by WARMF.
• Nutrients help produce food for fish to grow faster and bigger, which can compensate for the loss of their young to fresh water diversions from the Delta.
• How do we manage nutrients and diversions to prevent fish decline and extinction?

Systech WaterResources, Inc.
Extension To Model Fish! • Use monthly cohort fish life cycle model to simulate the
number, fork length, and weight of the monthly cohorts of salmons, delta smelt and striper bass.
• Use WARMF watershed model to simulate Q, T, DO, TDS, TSS of spawning river segments (SJR & Sacramento), and to affect the success of eggs to become first month cohort.
• Use link-node model to simulate T, TDS, algal productivity per fish of nursery delta “nodes” and to affect the distribution, growth, predation and entrainment loss of juveniles to the diversion pumps.
• Use WARMF graphical user interface to integrate the three models into a DSS to facilitate the stakeholder process.

Systech WaterResources, Inc.
Monthly Cohorts Life Cycle Model
1 2 3 4 12 24 36 48
Emigration runs
Spawning runs
San Joaquin Sacramento Rivers spawning ground
Deltanursery ground
Suisun San Pablo North Bays
Pacific Ocean

Systech WaterResources, Inc.
Engineering
Data Knowledge
Stakeholder Process
TMDFD CONSENSUS
Systech WaterResources, Inc.
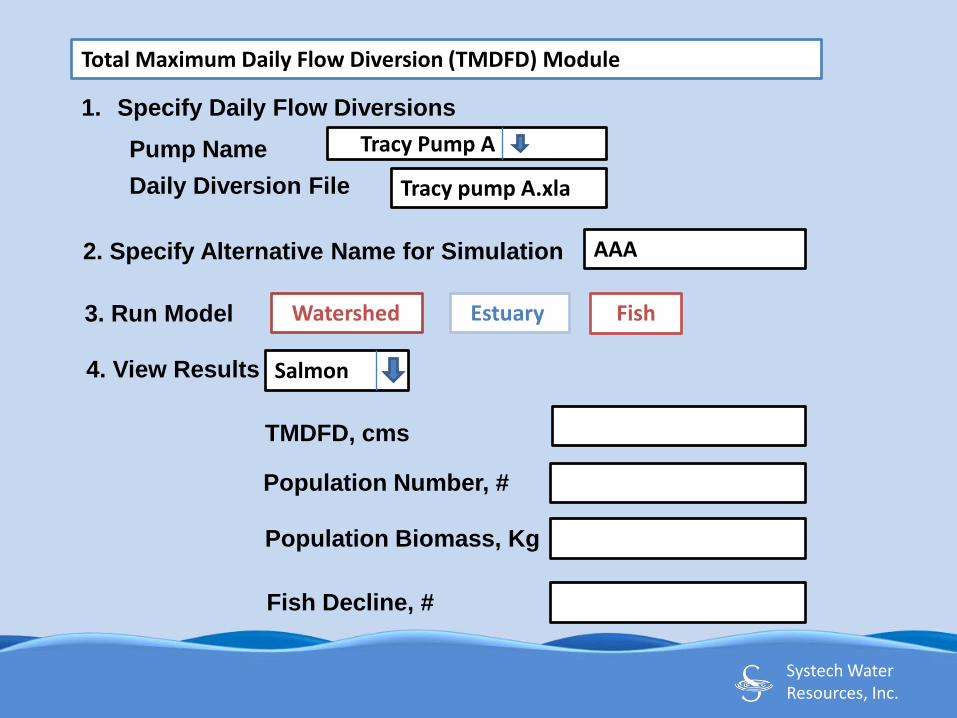
Tracy Pump Amp APP
Total Maximum Daily Flow Diversion (TMDFD) Module
1. Specify Daily Flow Diversions
Pump NameDaily Diversion File Tracy pump A.xla
2. Specify Alternative Name for Simulation AAA
3. Run Model Watershed Estuary Fish
4. View Results Salmon
Population Number, #
Population Biomass, Kg
Fish Decline, #
TMDFD, cms

Systech WaterResources, Inc.
CONSENSUS Module
Alternative Name
Ave Annual Export, cms
TMDFD, cms
Fish Number
Fish Decline
Vote yes/no
Salmon

Systech WaterResources, Inc.
Conclusions• Plants consume almost all ammonia in the fertilizer
applied to crop land.
• Dairy lands contribute the highest nonpoint source load of ammonia per unit area.
• Major point source loads of ammonia are from Modesto and tributary inflows to the SJR basin.
• Most ammonia are transformed to nitrate and organics (algae & detritus) in the SJR before reaching Vernalis for outflow to the Lower SJR estuary.

Systech WaterResources, Inc.
Conclusions• Elevated NH4 in DWSC was from Stockton
discharge, not from river load of NH4 & organics (algae, detritus).
• DO deficit in DWSC was caused by reduced river inflow, increased water depth (DWSC), river load of organics, and Stockton discharge (nitrification upgrade in 2007).
• WARMF can be extended to address the fish decline and extinction issues by stakeholders.

Systech WaterResources, Inc.
Thank you very much