Embed Size (px)
Citation preview
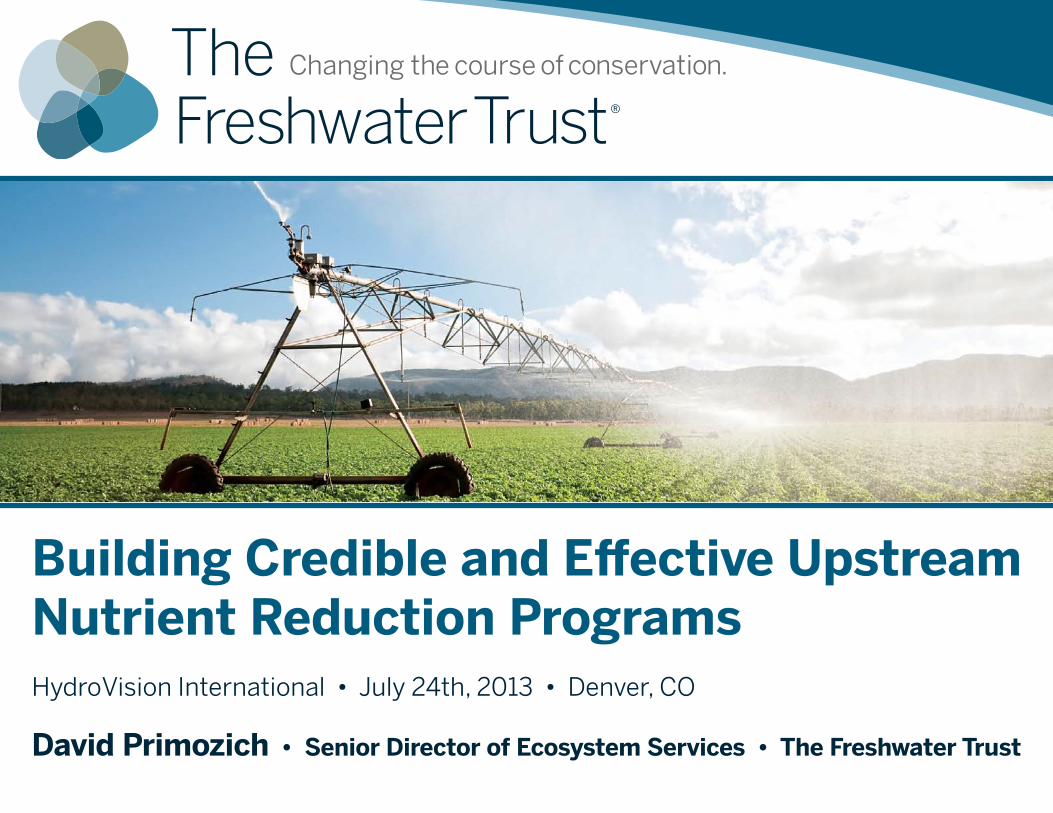
Building Credible and Effective Upstream Nutrient Reduction ProgramsHydroVision International • July 24th, 2013 • Denver, CO
David Primozich • Senior Director of Ecosystem Services • The Freshwater Trust
Title of the slide here
www.thefreshwatertrust.org
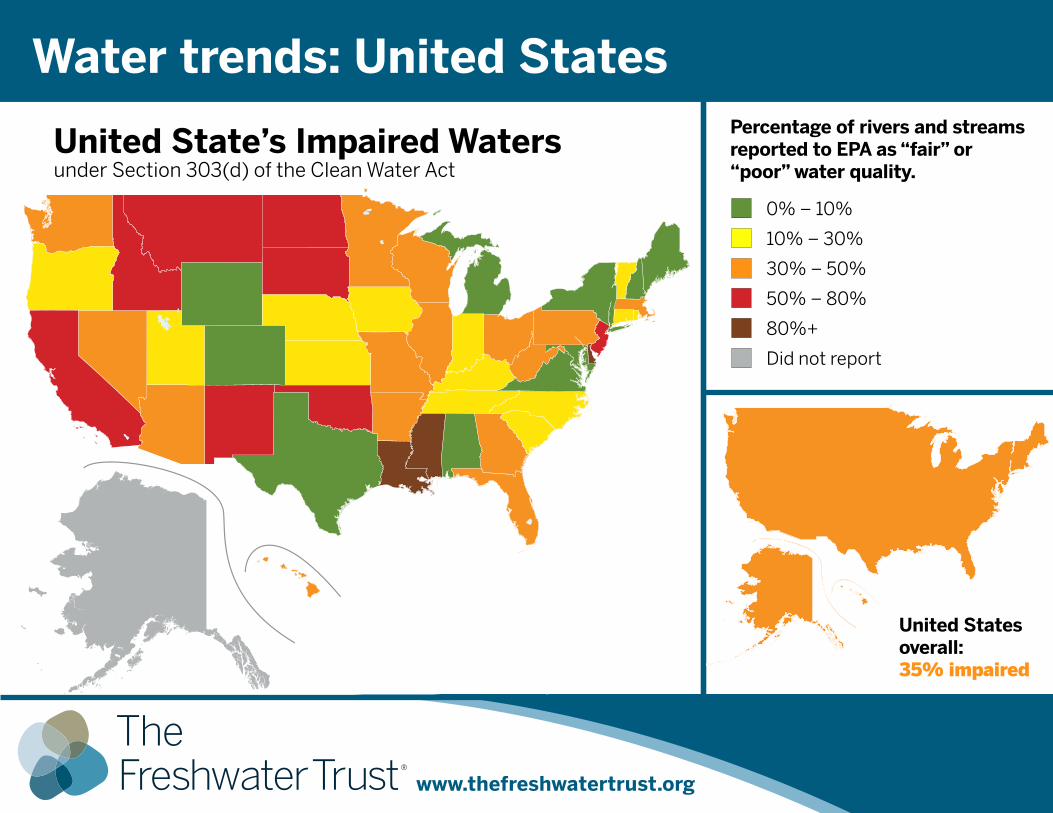
Water trends: United States
United State’s Impaired Watersunder Section 303(d) of the Clean Water Act
Percentage of rivers and streams reported to EPA as “fair” or “poor” water quality.
0% – 10%
10% – 30%
30% – 50%
50% – 80%
80%+
Did not report
United States overall:35% impaired
www.thefreshwatertrust.org
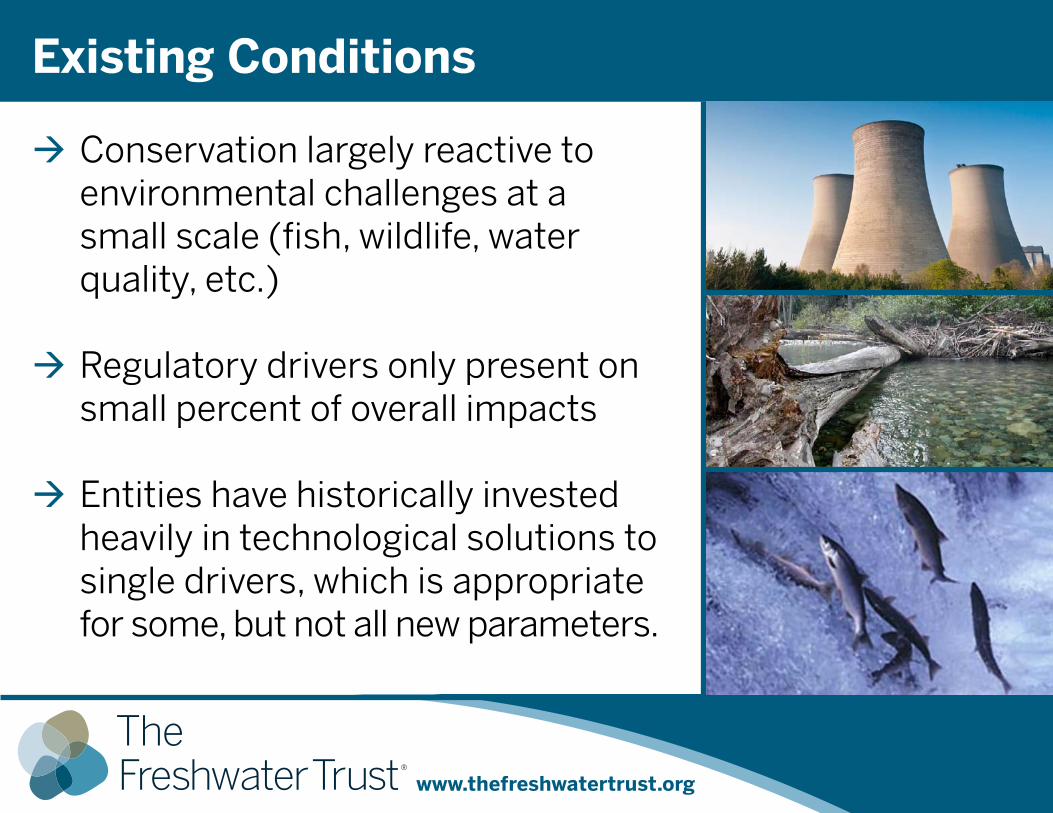
Existing Conditions
Æ Conservation largely reactive to environmental challenges at a small scale (fish, wildlife, water quality, etc.)
Æ Regulatory drivers only present on small percent of overall impacts
Æ Entities have historically invested heavily in technological solutions to single drivers, which is appropriate for some, but not all new parameters.
www.thefreshwatertrust.org
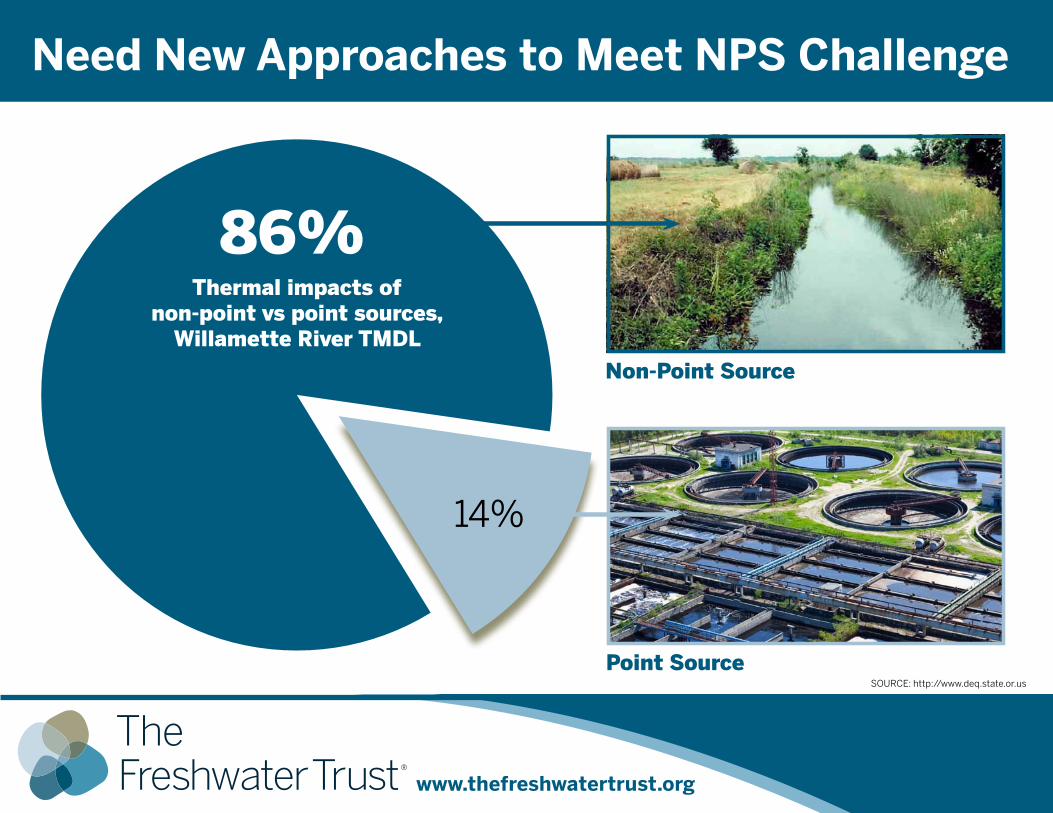
Need New Approaches to Meet NPS Challenge
SOURCE: http://www.deq.state.or.us
Point Source
Non-Point Source
86%
14%
Thermal impacts of non-point vs point sources,
Willamette River TMDL
www.thefreshwatertrust.org
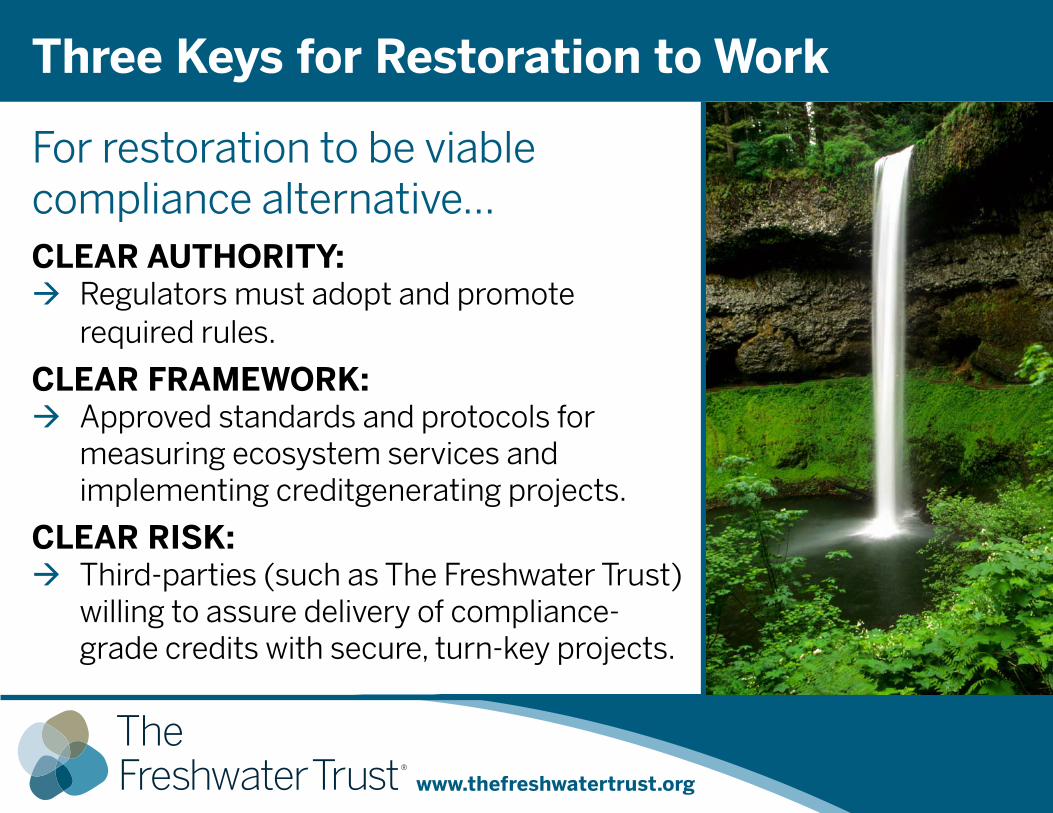
For restoration to be viable compliance alternative...
ClEAr AUThorITy: Æ Regulators must adopt and promote
required rules.
ClEAr FrAMEWorK: Æ Approved standards and protocols for
measuring ecosystem services and implementing creditgenerating projects.
ClEAr rISK: Æ Third-parties (such as The Freshwater Trust)
willing to assure delivery of compliance-grade credits with secure, turn-key projects.
Three Keys for restoration to Work
Title of the slide here
www.thefreshwatertrust.org
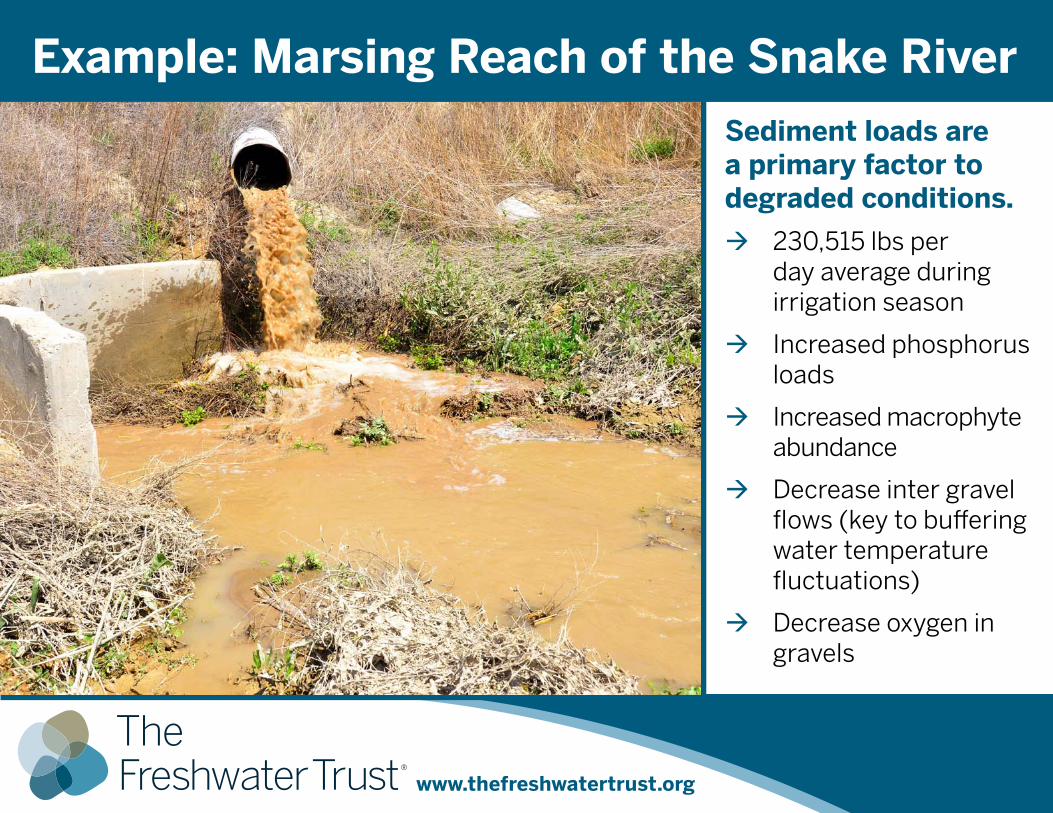
Example: Marsing reach of the Snake river
Sediment loads are a primary factor to degraded conditions.
Æ 230,515 lbs per day average during irrigation season
Æ Increased phosphorus loads
Æ Increased macrophyte abundance
Æ Decrease inter gravel flows (key to buffering water temperature fluctuations)
Æ Decrease oxygen in gravels
Title of the slide here
www.thefreshwatertrust.org
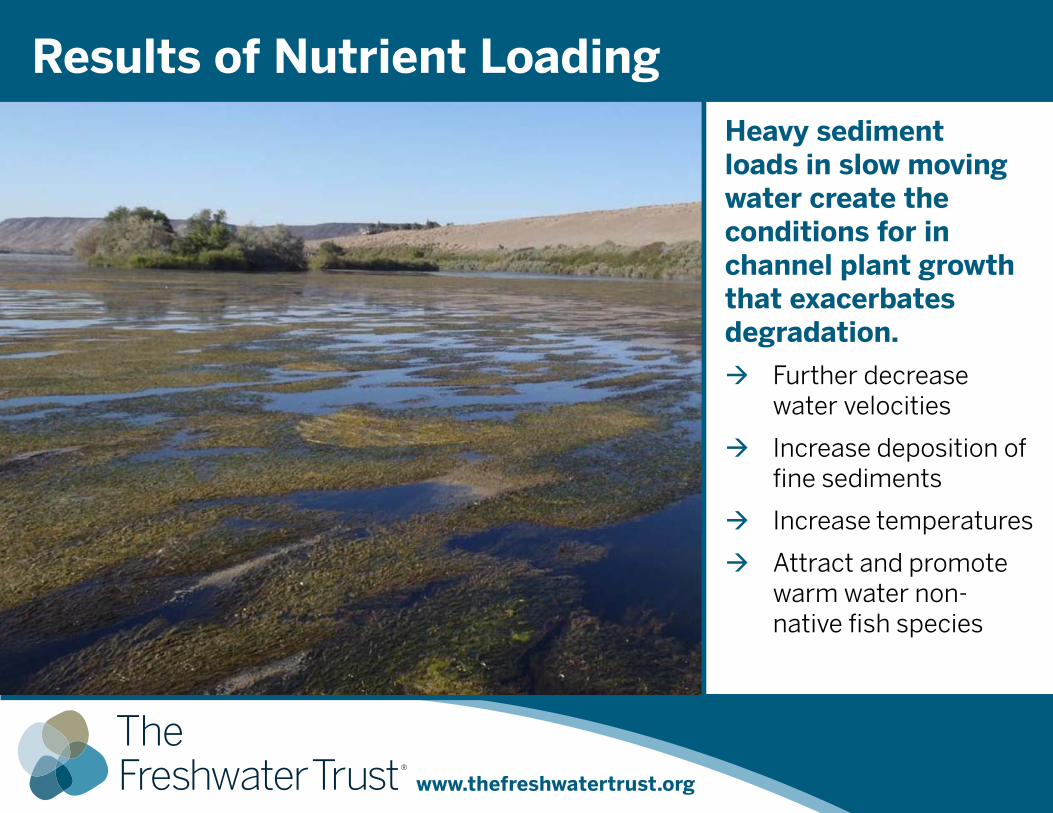
results of Nutrient loading
heavy sediment loads in slow moving water create the conditions for in channel plant growth that exacerbates degradation.
Æ Further decrease water velocities
Æ Increase deposition of fine sediments
Æ Increase temperatures
Æ Attract and promote warm water non-native fish species
Title of the slide here
www.thefreshwatertrust.org
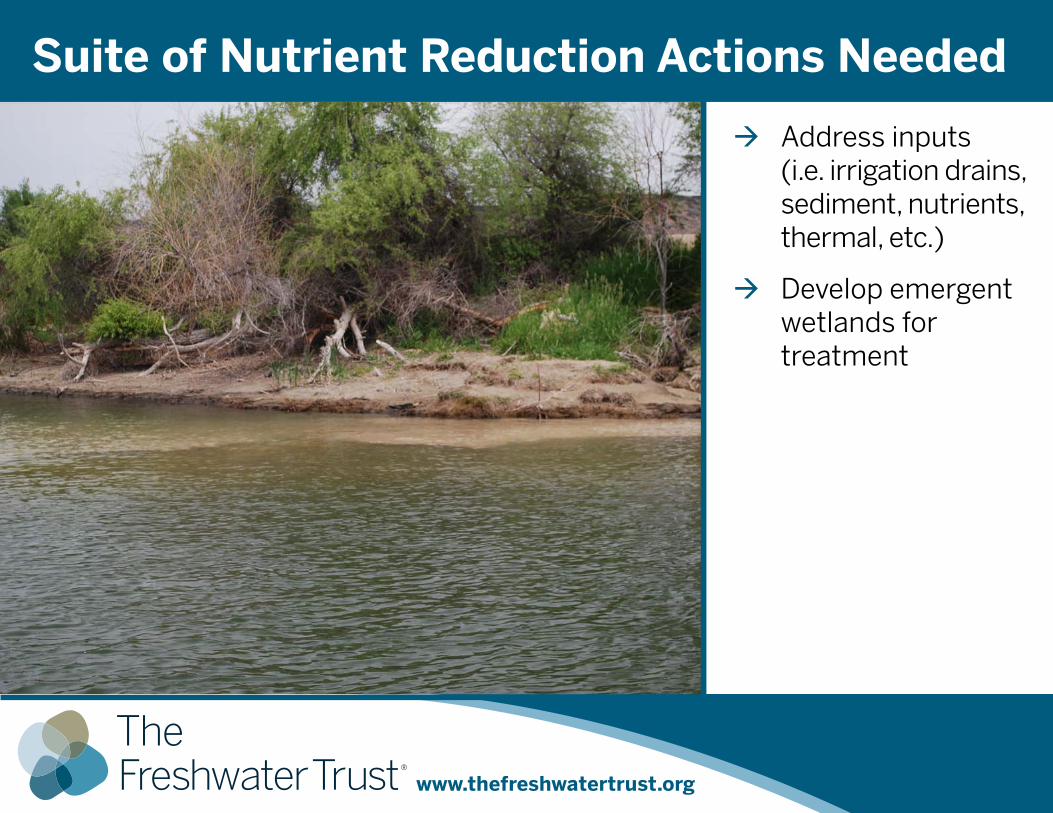
Suite of Nutrient reduction Actions Needed
Æ Address inputs (i.e. irrigation drains, sediment, nutrients, thermal, etc.)
Æ Develop emergent wetlands for treatment
Title of the slide here
www.thefreshwatertrust.org
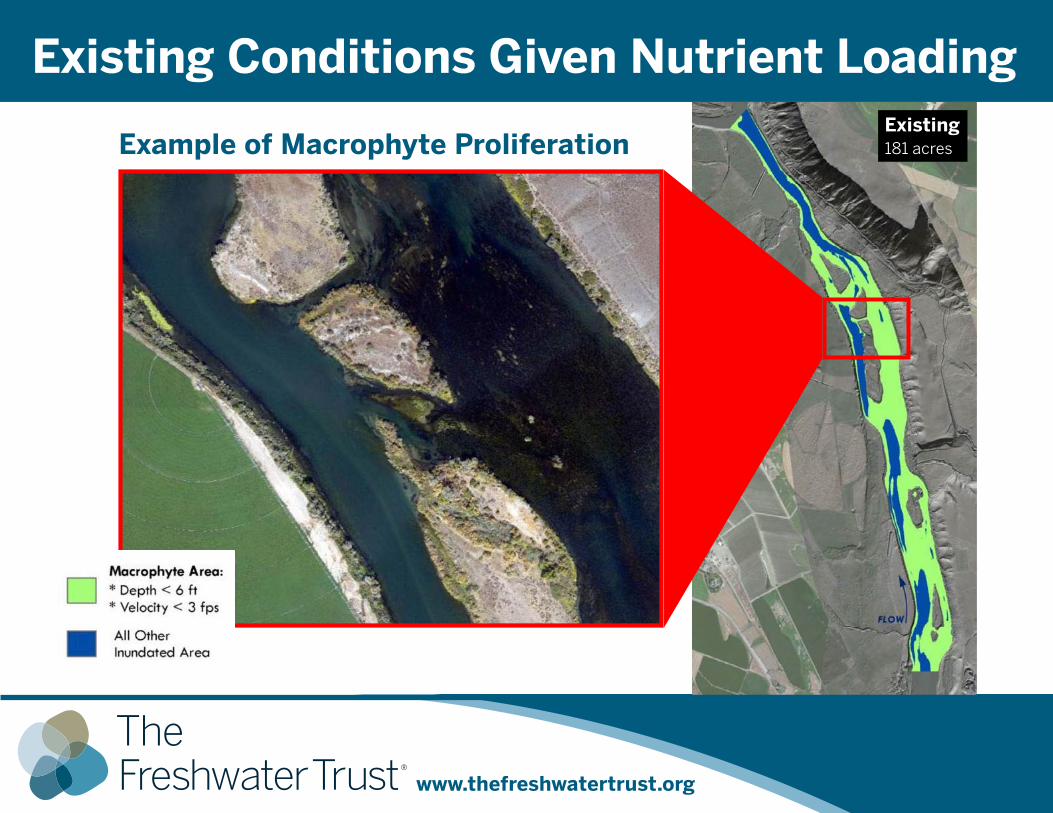
Existing Conditions Given Nutrient LoadingExisting181 acresExample of Macrophyte Proliferation
Title of the slide here
www.thefreshwatertrust.org
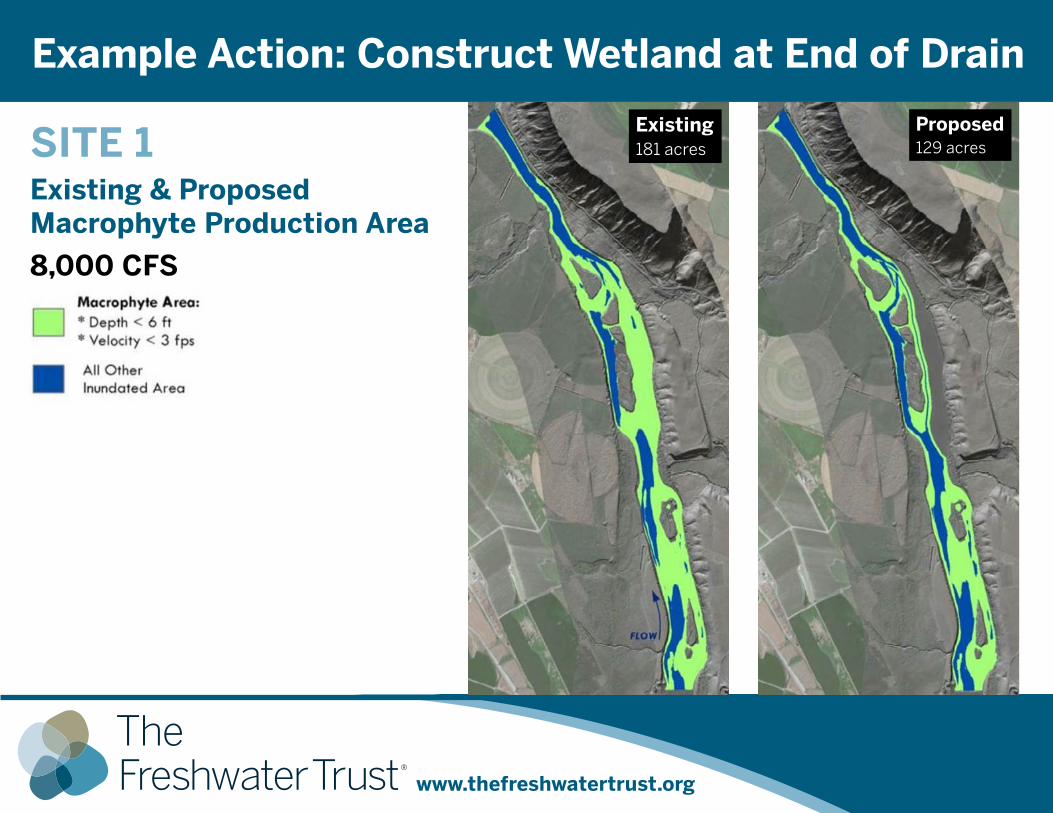
Example Action: Construct Wetland at End of Drain
Existing181 acres
Proposed 129 acresSITE 1
Existing & Proposed Macrophyte Production Area
8,000 CFS
Title of the slide here
www.thefreshwatertrust.org
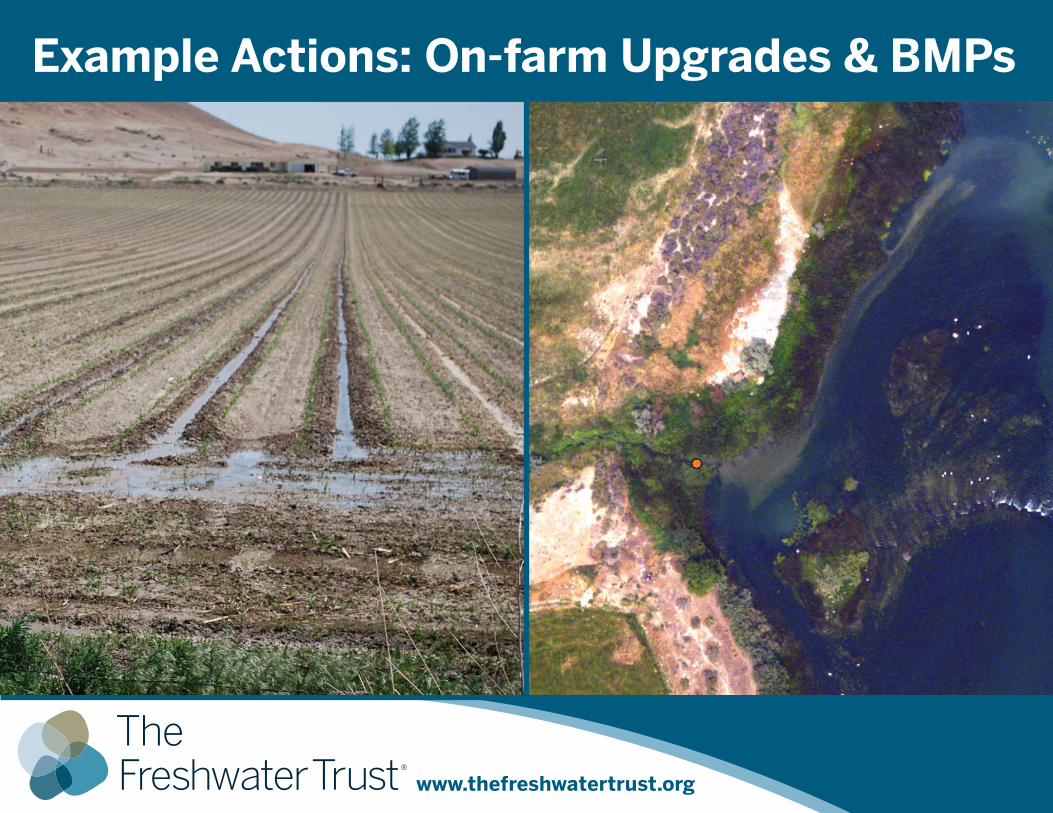
Example Actions: on-farm Upgrades & BMPs
Title of the slide here
www.thefreshwatertrust.org
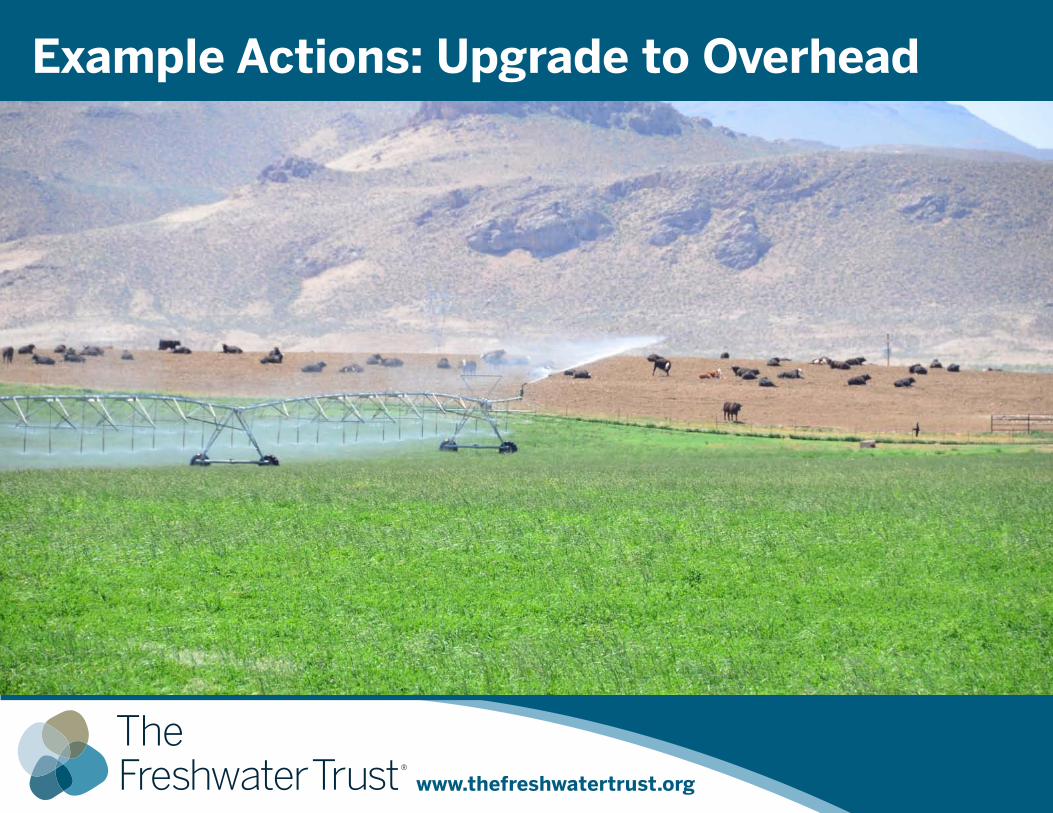
Example Actions: Upgrade to overhead
Title of the slide here
www.thefreshwatertrust.org
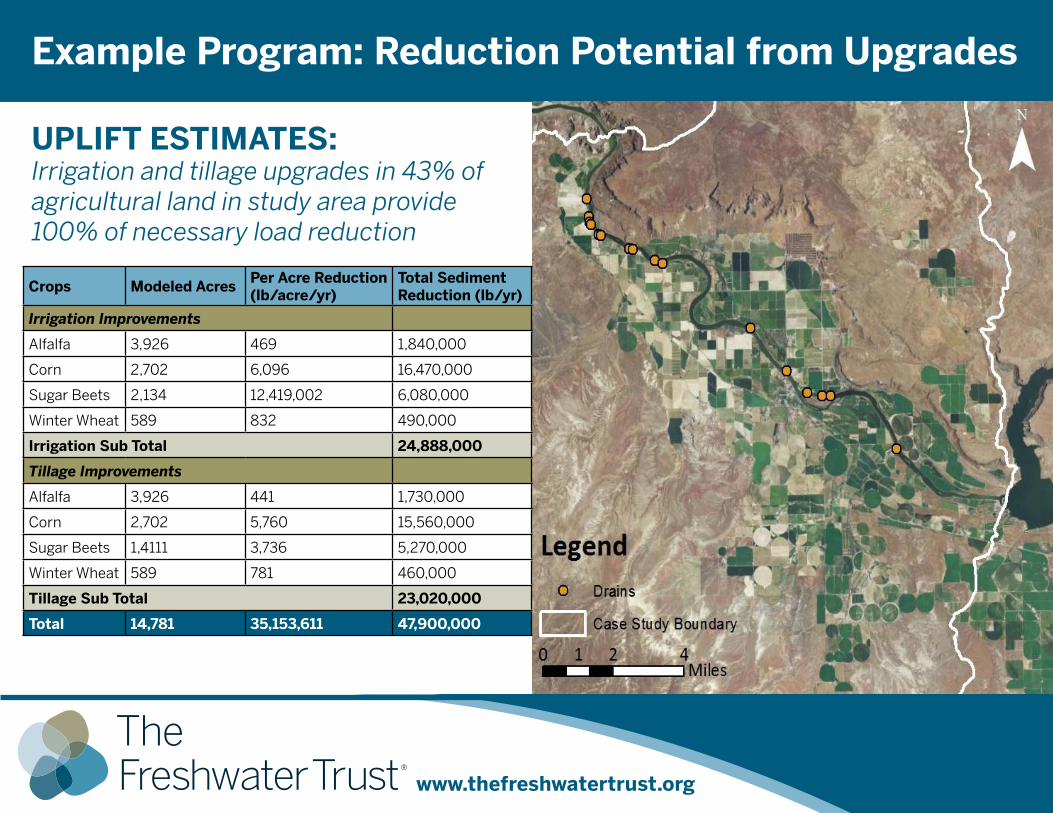
Example Program: reduction Potential from Upgrades
UPlIFT ESTIMATES: Irrigation and tillage upgrades in 43% of agricultural land in study area provide 100% of necessary load reduction
Crops Modeled AcresPer Acre Reduction (lb/acre/yr)
Total Sediment reduction (lb/yr)
Irrigation Improvements
Alfalfa 3,926 469 1,840,000
Corn 2,702 6,096 16,470,000
Sugar Beets 2,134 12,419,002 6,080,000
Winter Wheat 589 832 490,000
Irrigation Sub Total 24,888,000
Tillage Improvements
Alfalfa 3,926 441 1,730,000
Corn 2,702 5,760 15,560,000
Sugar Beets 1,4111 3,736 5,270,000
Winter Wheat 589 781 460,000
Tillage Sub Total 23,020,000
Total 14,781 35,153,611 47,900,000
Title of the slide here
www.thefreshwatertrust.org
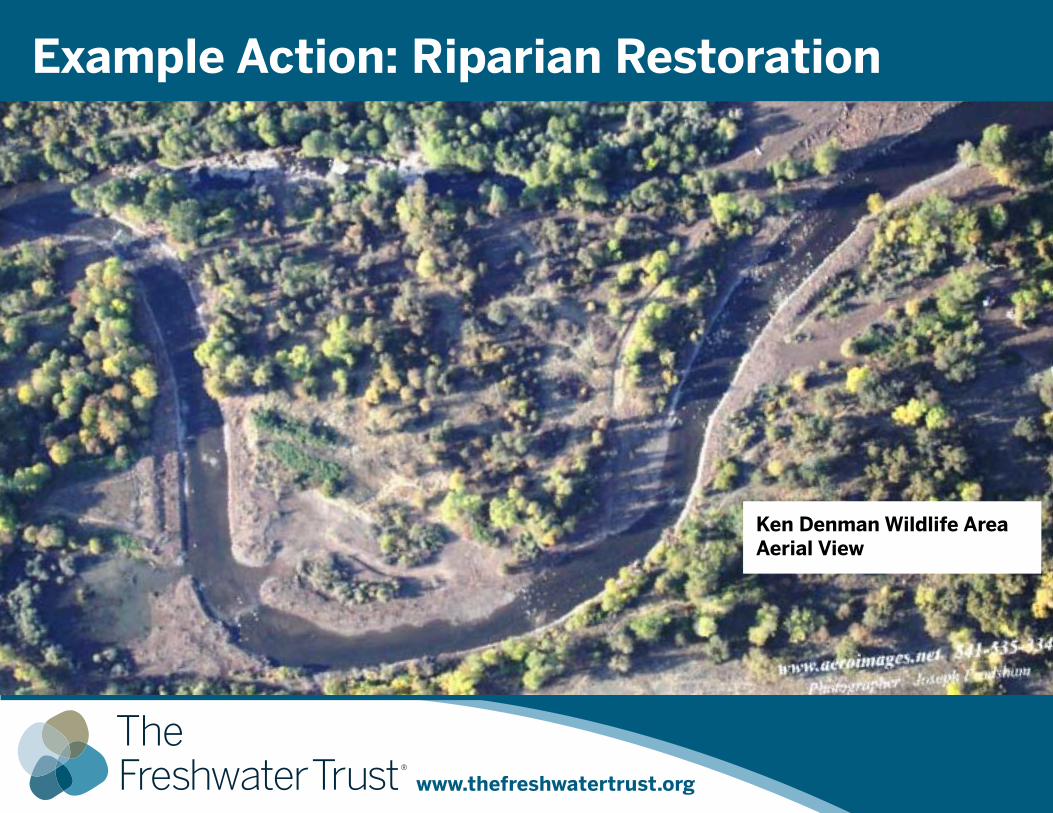
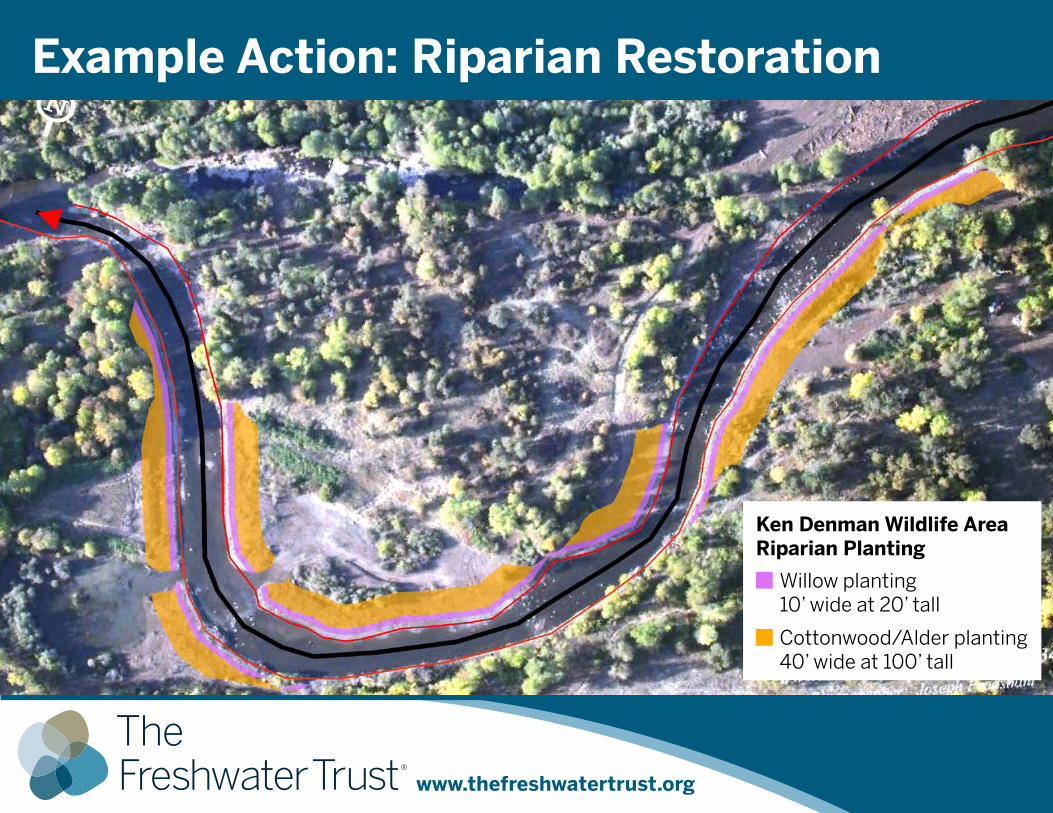
Example Action: Riparian Restoration
Ken Denman Wildlife Area Aerial View
Title of the slide here
www.thefreshwatertrust.org
Willow planting 10’ wide at 20’ tall
Cottonwood/Alder planting 40’ wide at 100’ tall
Ken Denman Wildlife Area Riparian Planting
Example Action: Riparian Restoration
www.thefreshwatertrust.org
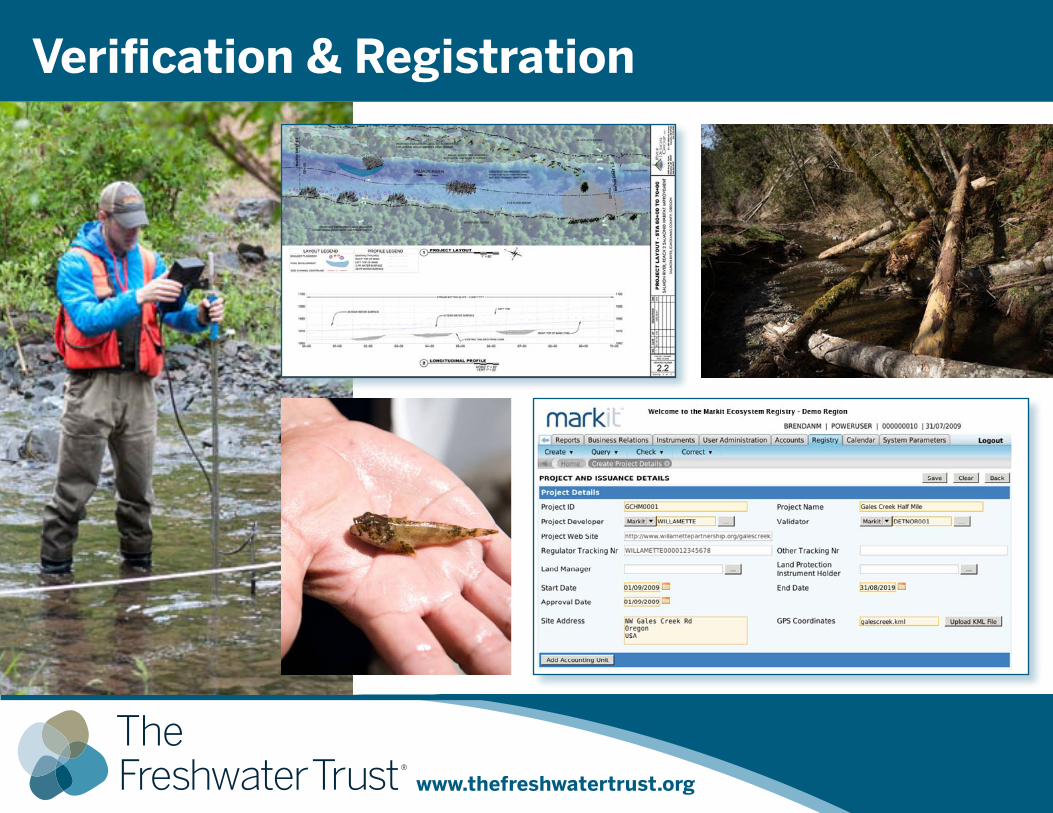
Verification & Registration
www.thefreshwatertrust.org
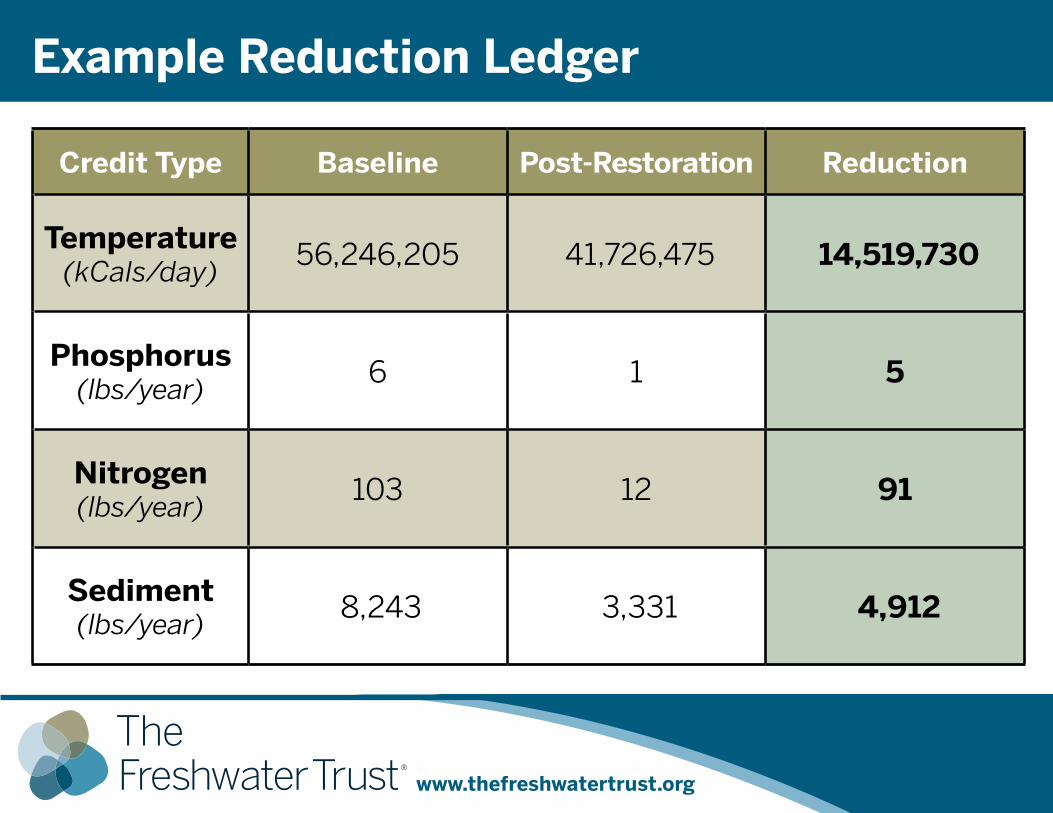
Example Reduction Ledger
Credit Type Baseline Post-restoration Reduction
Temperature (kCals/day)
56,246,205 41,726,475 14,519,730
Phosphorus(lbs/year)
6 1 5
Nitrogen(lbs/year)
103 12 91
Sediment(lbs/year)
8,243 3,331 4,912
Title of the slide here
www.thefreshwatertrust.org
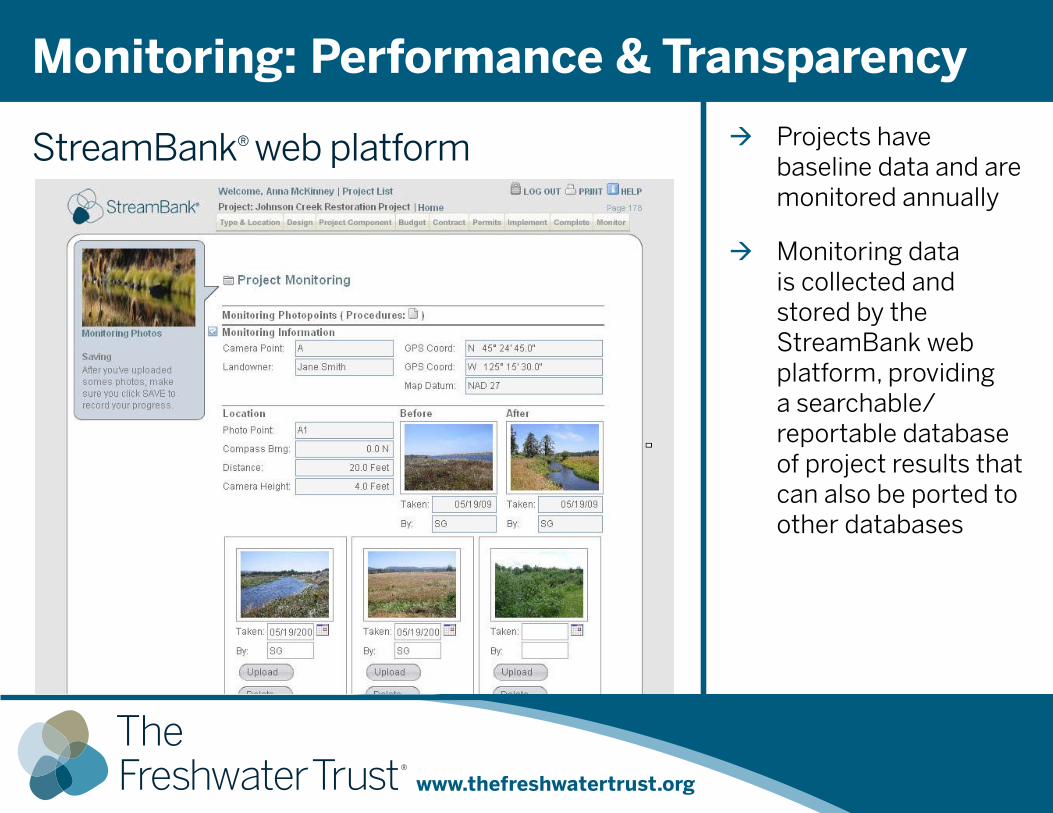
Æ Projects have baseline data and are monitored annually
Æ Monitoring data is collected and stored by the StreamBank web platform, providing a searchable/reportable database of project results that can also be ported to other databases
StreamBank® web platform
Monitoring: Performance & Transparency
www.thefreshwatertrust.org
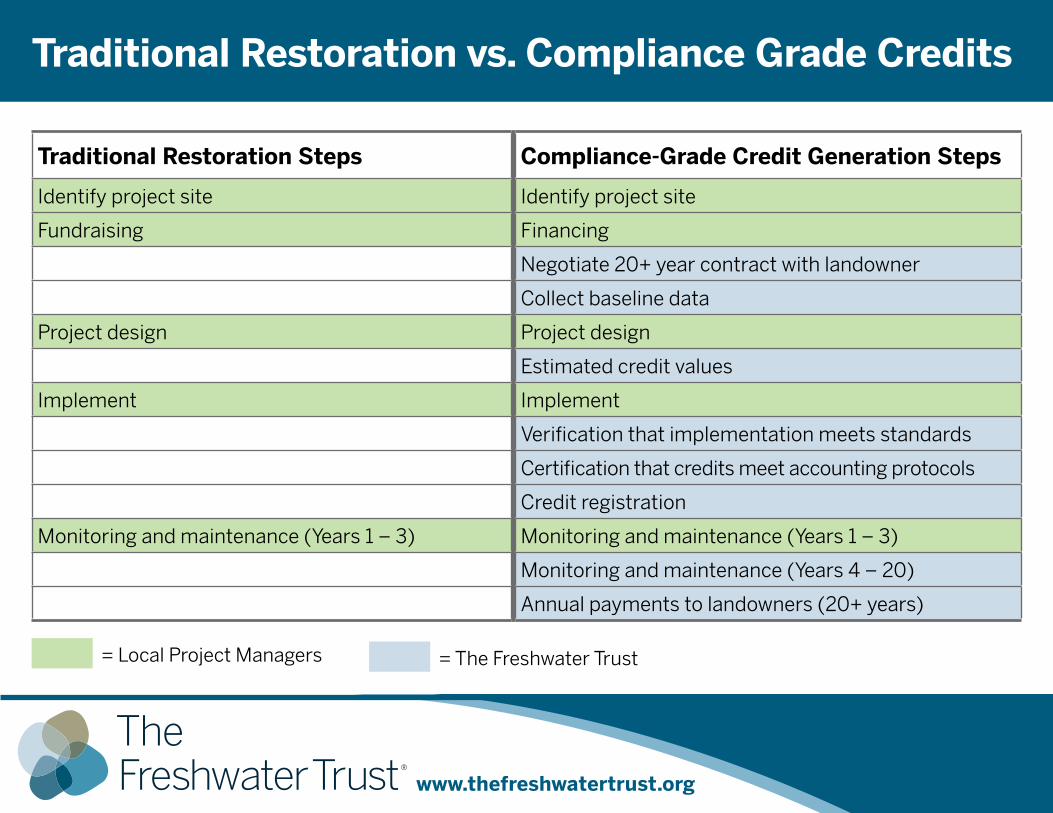
Traditional restoration vs. Compliance Grade Credits
Traditional restoration Steps Compliance-Grade Credit Generation Steps
Identify project site Identify project site
Fundraising Financing
Negotiate 20+ year contract with landowner
Collect baseline data
Project design Project design
Estimated credit values
Implement Implement
Verification that implementation meets standards
Certification that credits meet accounting protocols
Credit registration
Monitoring and maintenance (Years 1 – 3) Monitoring and maintenance (Years 1 – 3)
Monitoring and maintenance (Years 4 – 20)
Annual payments to landowners (20+ years)
= Local Project Managers = The Freshwater Trust
www.thefreshwatertrust.org
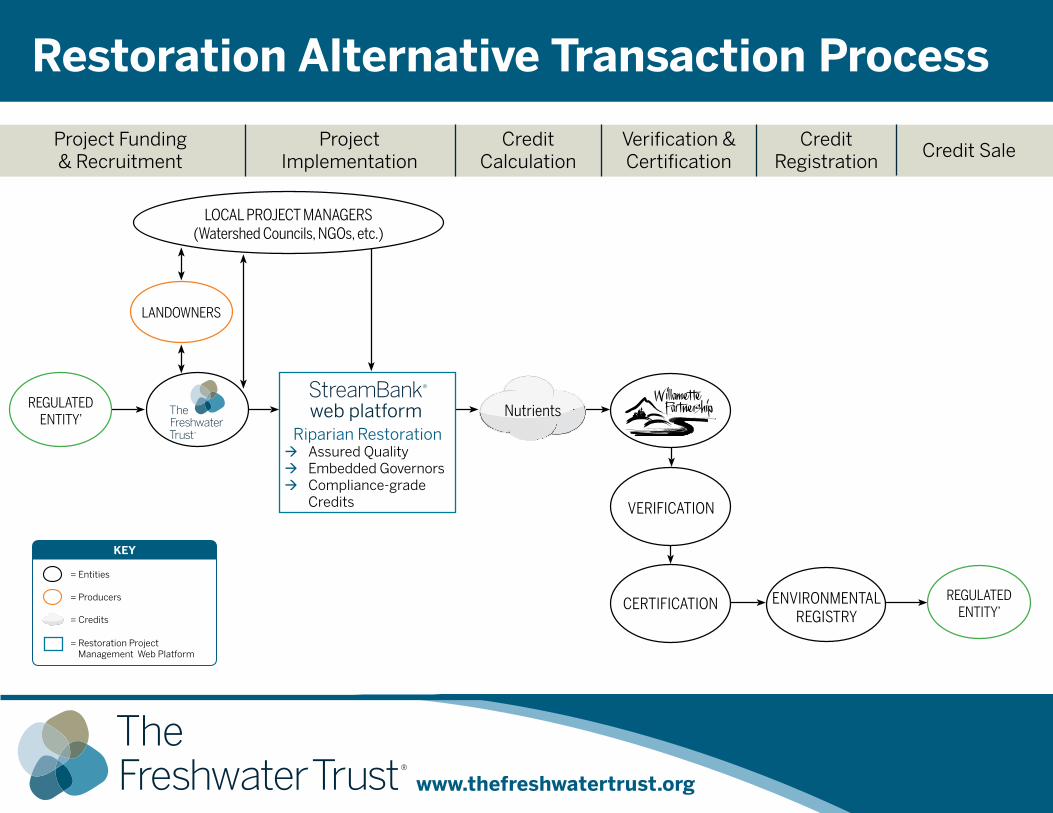
Regulated entity’
Riparian Restoration Æ Assured Quality Æ Embedded Governors Æ Compliance-grade
Credits
web platform
restoration Alternative Transaction Process
Project Funding & Recruitment
Credit Calculation
Verification &Certification
Credit Registration
Project Implementation
local PRoject ManageRs(Watershed councils, ngos, etc.)
landoWneRs
KEy
= Entities
= Producers
= Credits
= Restoration Project Management Web Platform
nutrients
enViRonMentalRegistRy
Credit Sale
ceRtiFication
VeRiFication
Regulated entity’

Building Credible and Effective Upstream Nutrient Reduction ProgramsHydroVision International • July 24th, 2013 • Denver, CO
David Primozich • Senior Director of Ecosystem Services • The Freshwater Trust