Embed Size (px)
Citation preview

A
U P S 2016 CO R P O R AT E
S U S TA I N A B I LI T Y R E P O R T
The Road Ahead

Table of Contents
1.1 CEO Statement ............................................................................2
1.2 Our Global Network .................................................................4
1.3 2016 Headlines & Highlights ...............................................5
1.4 UPS Perspective: Tamara Barker .........................................8
1.5 Goals & Progress .........................................................................10
1.6 Materiality Assessment ..........................................................12
1.7 Stakeholder Engagement ......................................................14
Introduction
01
3.1 Economic Performance ..........................................................42
3.2 Global Trade & Emerging Markets ....................................46
3.3 Supply Chain Management ................................. .................50
3.4 Data Privacy ..................................................................................54
3.5 Digital & Physical Asset Security ........................... .............56
3.6 Humanitarian Relief & Resilience ......................................57
3.7 Sustainable Shipping & Supply Chain Off erings ........62
Economic Enhancement
2.1 Who We Are ..................................................................................18
2.2 Management Approach ..........................................................19
2.3 Diversity & Inclusion .................................................................24
2.4 Employee Health, Safety & Wellness ..............................28
2.5 Recruitment, Training & Development ..........................32
2.6 Labor Relations ............................................................................36
2.7 Ethical Conduct ...........................................................................38
Empowered People
4.1 Material Topics .............................................................................68
4.2 Management Approach .........................................................69
4.3 Energy & Emissions ...................................................................71
4.4 Sustainable Solutions for Urban Logistics ....................79
4.5 Fuel Supply ....................................................................................83
Environmental Responsibility
A. About This Report .........................................................................89
B. Statement of Greenhouse Gas Emissions ......................91
C. Initiatives to Reduce Greenhouse Gas Emissions .......102
D. Energy Performance ...................................................................103
E. GRI Content Index .........................................................................105
Appendix
02
03
04
05
Cover image: Interlaken, Switzerland. January 2016

For more than a century, UPS has been helping people and businesses move goods by focusing on The Road Ahead — both literally and fi guratively. Our success refl ects relentless attention to emerging trends, innovative ideas and transformative technologies that enable growth, progress, and sustainable solutions. This forward-looking approach guides our work as we seek new solutions for the opportunities and challenges that lie ahead.
The Road Ahead
11

102-14*
2016 was a milestone year for sustainability at UPS. We continued to
reduce carbon intensity throughout our network and added more than
1,250 alternative fuel and advanced technology vehicles to our fl eet.
We also completed the U.S. deployment of ORION, a proprietary route
optimization technology helping us save 10 million gallons of fuel and
reduce 100,000 metric tons of emissions each year.
Committed to the Road Ahead
Introduction1.1 // CEO Statement
*This Report has been prepared in accordance with the GRI Standards: Comprehensive option. These disclosure fl ags indicate data is referenced on a specifi c page.2
David Abney, Chairman and Chief Executive Offi cer

102-14
3
Introduction1.1 // CEO Statement
We also continued our longstanding support of global humanitarian needs. With our two partners – Gavi, the Vaccine Alliance and the Silicon Valley startup Zipline – we are pioneering drone delivery of emergency medical supplies to remote locations in Rwanda.
We are especially proud of these achievements in the face of the uncertainty that clouds political, economic and business conditions worldwide. But the scale and urgency of today’s sustainability demands give us little time to refl ect. Looking ahead, we have reaffi rmed our sustainability commitments. In doing so, we have embarked on an enhanced set of enterprise-wide goals, including a bold target to reduce our absolute greenhouse gas emissions 12 percent across our global ground-based operations by 2025.
It is important to note that we’re setting ambitious goals at a time when our carbon footprint would be expected to increase due to the rapid growth in e-commerce volume, which is requiring us to expand our physical network around the world. Over the next few years, we’ll make signifi cant investments in technology and capacity to meet the growing needs of consumers and customers.
As we build the smart logistics network of the future, we must stay disciplined to ensure these investments are made responsibly and sustainably, so our customers and our communities grow along with us. We’re mindful that innovation and creative thinking are more valuable than ever. We will continue to develop new approaches and test new solutions. We’ll scale those with the potential to deliver the best returns to the planet and to our business. In the process, we will continue to learn.
To reduce absolute emissions, we will increasingly rely on renewable energy sources throughout our operations. We are accelerating our investments across our fl eet and facilities, aiming for 25 percent of our total electricity to come from renewable sources by 2025. To support this goal, we recently invested $18 million in on-site solar at eight U.S. facilities, which expands our solar capacity nearly fi ve-fold.
We’re also testing new applications for renewable energy sources. For example, we’re giving vehicle batteries a second life as storage devices for solar energy in our facilities, and we’re exploring ways to use renewable natural gas in fuel cell electric vehicles in the future.
We continue to invest and expand our “rolling laboratory,” which allows us to develop and test low-carbon fuels and technologies. By 2020, a quarter of our annual vehicle purchases will be alternative fuel or advanced technology vehicles. By 2025, alternative fuels will supply 40 percent of our total ground fuel needs. All of these initiatives will drive UPS toward our vision of a zero-emissions future.
But we can’t get there without our most important asset: the 434,000 UPSers who load and unload trucks, deliver packages and freight, manage the business, and support our customers every day. In addition to our environmental targets, we’ve also established new goals to advance our industry-leading safety programs and improve employee engagement – aligning our business strategies with our vision to connect the global community through our intelligent logistics network.
The bright minds of UPSers have created a culture of ingenuity and innovation. Their warm hearts and passion to strengthen the communities where we all live and work have enriched that same culture. It’s this commitment that led UPS and its employees to make more than $116 million in charitable contributions in 2016 – and to an even bolder goal to collectively contribute $127 million in 2020. UPSers, along with their friends and families, have also served 12.8 million hours in volunteer time since 2011, supporting our goal to contribute 20 million hours of community service by 2020.
Their certainty of purpose, even during uncertain times, convinces me that we’re on the right path, traveling in the right direction on the road ahead. With our legacy of sustainable business practices and the dedication of our people, we will continue to overcome the challenges and meet the needs of our ever-changing world.
David Abney, Chairman and Chief Executive Offi cer
“ As we build the smart logistics network
of the future, we must stay disciplined
to ensure these investments are made
responsibly and sustainably, so our
customers and our communities grow
along with us.”
David Abney Chairman

SOLUTIONS
Global Small Package
Logistics & Distribution
Less-Than & Full Truckload
Insurance & Financing
Truckload Freight
Brokerage
Customs Brokerage
Freight Forwarding
150,000Entry
Points
220Countries &
Territories Served
2,500Worldwide
Operating Facilities
4,900The UPS Store®
Locations REACH
114,000Delivery Fleet
Vehicles
434,000Employees
236Aircraft
8,100Alternative
Fuel & Advanced
TechnologyVehicles
RESOURCES
Our Global Network
102-1 | 102-2 | 102-4 | 102-6 | 102-7
UPS is a global leader in logistics, off ering a broad range of supply chain solutions, including transporting
packages and freight, facilitating international trade, and deploying advanced technology to effi ciently
manage the world of business.
UPS Global
Network
10.3 MillionDaily Customers
30 Million
UPS My Choice®
Members
4.9 Billion
Delivery
VolumeCUSTOMERS
26,000 UPS Access Point™
Locations
4

2016
Headlines & Highlights
5
1.82 lost time injuries per 200,000
hours worked, a leading safety
record in the industry
1 billioncleaner miles reached in
2016 through our fl eet of
alternative fuel and advanced
technology vehicles
Setting New Goals for 2020 and 2025In 2016, we developed a new set of enterprise-wide sustainability goals, informed by the fi ndings of our 2016 materiality assessment, our global enterprise strategy, stakeholder feedback, and sustainability frameworks such as the United Nations Sustainable Development Goals. Many of our previous goals had a target date of 2016, and we saw an opportunity to set new goals around topics most important to the environment, our workforce, and UPS communities around the world. These new goals support our sustainability vision for UPS to reinforce our commitment to create innovative solutions for global sustainability challenges. More detail on the new goals is available on page 9, and our performance toward existing Key Performance Indicators (KPIs) can be found on pages 10 and 11.
Reducing Absolute GHG EmissionsAs a global transportation and logistics company, UPS recognizes greenhouse gas (GHG) emissions pose a serious challenge to the environment and ultimately to the global economy. For our part, we have established a goal to reduce absolute GHG emissions 12 percent by 2025 throughout our global ground operations. This goal builds on our ongoing eff orts to achieve a 20 percent reduction in GHG intensity by 2020, which we will continue to measure and report. The use of renewable energy will be critical to reaching this absolute emissions reduction target. We engaged with leading environmental organizations and other stakeholders to establish a meaningful target using the science-based methodology most appropriate for our business. This new goal will advance our commitment to alternative fuels and technologies. This new goal currently does not include our airline fuel usage because of the economic and scalability limitations of aviation biofuel. Read more about this new goal on page 71.
30M+UPS My Choice® members
across
15 countries
Introduction1.3 // Headlines & Highlights

Introduction1.3 // Headlines & Highlights
6
40years of UPS® service
in Europe
26,000+ $2.4BUPS Access Point™ locations
across 18 countries
of economic impact generated
by our supplier diversity
investments
Delivering Relief through New InnovationsWe have a long history of innovating humanitarian relief solutions to address needs more effi ciently and eff ectively. In 2016, this innovation took to the air as we began testing the potential of using drones to deliver urgently needed supplies to remote areas. The UPS Foundation; Zipline, a drone technology startup; and Gavi, the Vaccine Alliance joined in a pilot project for medical supply delivery in Rwanda. The project’s drones put lifesaving blood, vaccines and medications within reach of more than 6 million people — half of the country’s population. Supplies can be requested by healthcare workers and arrive at their destinations in 30 minutes or less. This groundbreaking feat — a global fi rst — highlights how public-private partnerships improve health outcomes for millions of people living in rural communities. Read more about the project on page 60.
Celebrating a Decade of Women's Leadership Development2016 marked the 10-year anniversary of our Women’s Leadership Development (WLD) Business Resource Group (BRG). Over the past decade, WLD has expanded to 65 chapters in in more than 30 countries and territories. It also paved the way for eight additional BRG constituencies, which now span 150 chapters around the world and whose members bring their unique perspectives to UPS. To celebrate this milestone, we hosted the Women’s Leadership Exchange Thought Leadership Summit, which brought together representatives from more than 30 companies. Read more about WLD in the UPS workforce on page 27.
7
2.7M volunteer hours by UPSers,
friends, and family across
the world
25years of UPS® service
in Mexico
100% Human Rights
Campaign Corporate
Equality Index, the only
company in the mail and
freight delivery sector to
earn a perfect score
Refreshing Priorities on Our Most Important Sustainability IssuesWe performed our global corporate materiality assessment in 2016, integrating the results of the regional assessments we conducted in 2015. Among the new and updated fi ndings for 2016: further elevation of issues related to ethics and human rights across the globe; the important role sustainability can play in attracting talent and engaging employees; the need for regionally specifi c emissions-reduction solutions and engagements; and the importance of developing locally relevant sustainability strategies to address global trends. We are using the key fi ndings from the 2016 materiality assessment to identify opportunities to further refi ne our global sustainability strategy. Read more about the key fi ndings on page 12.
Leading the Way with New Standards of Reporting LeadershipMaintaining our leadership in sustainability reporting helps us be more accountable and transparent, demonstrating to our stakeholders how we manage and address the issues most important to them. Staying at the forefront of sustainability reporting best practices, UPS has become a member of the Global Reporting Initiative (GRI) Standards Pioneer program. Standards Pioneers are companies that have joined with GRI to support the transition from G4 to the GRI Standards, the latest reporting guidelines. With support and guidance from this group, we have implemented the newly introduced GRI Standards in our 2016 reporting cycle. This comes three years aft er UPS was one of the fi rst U.S. companies to report to the GRI G4 Guidelines, Comprehensive option. Learn more about our sustainability reporting practices on page 89 and review our GRI context index on page 105.
24,000+ employee participants in the
UPS Earn & Learn program
Introduction1.3 // Headlines & Highlights

Global commerce has changed dramatically in recent
years. Just think about your own shopping habits. A
decade ago, a trip to the mall was considered a fun,
social experience. But today, many people are trading
checkout lines and parking lots for a few simple clicks
on their laptop, tablet, or phone.
With limitless product availability, easy price comparisons, and abundant shopper
reviews, the rise of e-commerce has been a great boon for consumers. It can
be good for the environment in certain ways, too, eliminating a substantial
number of individual car trips.
For UPS, this shift presents both an opportunity and a challenge. Increased
e-commerce activity raises demand for shipping services — indeed, we expect
e-commerce to account for more than half of our U.S. shipping volume by
2019. But these shipments tend to be less effi cient compared to B2B deliveries.
E-commerce deliveries typically have fewer packages per stop and are oft en
delivered to dispersed residential locations, so we travel more miles and use
more fuel to deliver each package. Along with infrastructure and automation
investments we’re undertaking to expand the capacity of our network, e-commerce volume is also driving up the energy used in our
facilities, generating more emissions.
Given these headwinds, it might come as a surprise that UPS is choosing to strengthen our emissions reduction goals. We are now
pledging to reduce the absolute GHG emissions of our global ground operations by 12 percent by 2025. This means that even as our
delivery volume and stops increase, our overall emissions must drop.
Why set such an ambitious goal? As one of the world’s largest logistics partners, our performance should be one of leadership and
refl ect what the world expects of us. With increased awareness of science-based targets for limiting GHG emissions, we believe it’s
time to set this aggressive benchmark for our company.
We arrived at this target through careful consideration and stakeholder engagement with leading environmental organizations —
opting to balance a stretch goal with our business realities. That’s why we’ve set this absolute reduction target for our global ground
operations. The use of renewable energy is critical to achieving this goal, and, though our airline represents the largest percentage of
our emissions, renewable aviation biofuel solutions are simply not feasible today from a scale and economic perspective, nor do
we expect that to change signifi cantly by 2025.
Even with our eff orts focused on ground operations, reaching this goal won’t be easy. It will require us to accelerate investments in
renewable energy throughout our fl eet and in our facilities. We must also continue developing innovative delivery solutions that
create synthetic package density and reduce miles driven, such as the UPS Access Point™ network and route optimization technology.
I believe we’re headed in the right direction. At UPS, we’re always “constructively dissatisfi ed.” We never consider our work complete,
and constantly push forward to fi nd better solutions. That mindset gives me confi dence in UPS’s ability to achieve our new goals over
the next decade — no matter what curves are in the road ahead.
Tamara BarkerChief Sustainability Offi cer
UPS Perspective
Introduction1.4 // UPS Perspective
8

Introduction1.3 // Headlines & Highlights
Goals for the Road Ahead
Electricity from Renewable
Sources
25% by 2025Alternative Fuel
as a Percentage of Total Ground Fuel
40% by 2025Total Vehicles
Purchased Annually that are Alternative
Fuel & Advanced Technology Vehicles
25% by 2020
Total Charitable Contributions
$127 Million Global Volunteerism
Hours
20 Million Global Forestry
Initiative Tree Plantings
15 Million
2020 Community Goals
2020 Workforce Goals
Environmental Goals
Reduction in Absolute GHG Emissions in
Global Ground Operations
12% by 2025
Lost Time Injury Frequency
1% ImprovementAuto Accident
Frequency
3% ImprovementEmployee
Engagement Index
2% Improvement
102-15
9

Global Operations
Total number of vehicular accidents (regardless of severity)
per 100,000 driver hours.
Auto Accident Frequency
4.6% improvement over 2015 due to investments in training and
accident-avoidance solutions.
2016Goal
2016 2015 2014 2011Baseline
9.009.04
9.48
9.96
9.30
Full-Time Employee Retention RateGlobal Operations
Percent of all full-time employees who stay with our company annually.
KPI concluded with performance beyond goal due to fewer
retirements than expected.
2016 Goal
2016 Actual
2015
2014 91.60%
90.50%
87.50%
89.80%
89.60%
2011 Baseline
Total Charitable Contributions (in millions of USD)Global Operations
Includes all charitablecontributions. See page 44 for
category breakdown.
Reached a record high due to United Way employee contributions,
corporate match, and increased UPS Foundation grants.
2016 Goal
2016 Actual
2015
2014 $104.2M
$93.5M
$103.0M
$110.0M
$116.6M
2011 Baseline
Global Operations
Injury cases involving days away from work. This number represents
the number of occurrences per 200,000 hours worked.
Lost Time Injury Frequency
Annual improvement reflects training investments and package handling
efficiency; shy of target due to increase in new, less experienced, employees.
2016 2015 2014 2011Baseline
1.751.82
1.871.82
1.88
2016Goal
1.5Goals & Progress
102-15
This 2016 Report presents our fi nal reporting on the existing 13 key performance indicators (KPIs) identifi ed in 2011, as we transition to a new set of goals that will guide our direction for the next several years. The new goals are presented in an infographic on page 9.Regarding the existing KPIs, we met or exceeded goals for:
• Full-Time Employee Retention Rate;• Total Charitable Contributions;• Aircraft Emissions per Payload Capacity; and• Alternative Fuel & Advanced Technology Miles Driven.
We did not achieve our goals for three KPIs: Employer of Choice Index, Lost Time Injury Frequency and Auto Accident Frequency. Worth noting, we are not reporting on 2016 results of the Employer of Choice Index, as that was no longer measured as part of changes made to the broader Employee Engagement
Survey in 2016. These changes include shortening the survey from 72 to 30 questions and adding six benchmark statements to measure ourselves against best-in-class employers. Given these changes to the survey composition, year-over-year comparisons of EES results are not instructive, but we will keep our six benchmark statements going forward as we continue to modify the survey to better fi t what we need to learn about our workforce. There are three existing KPIs with a 2020 goal year: Transportation Intensity Index, Aviation Gallons Burned per 100 Available Ton Miles and CO2 Pounds per Available Ton Mile. We will continue to publish progress toward these goals through 2020. More information about the results for our existing KPIs and a discussion of our future KPIs can be found in each chapter of this Report.
10

Introduction1.5 // Goals & Progress
U.S. Domestic Package
Energy consumption includes stationary sources (electricity, natural gas, propane,
and heating oil) and mobile sources (gasoline, diesel, Jet-A, natural gas, and propane).
Energy Consumption – Normalized
Absolute reductions remain challenging as e-commerce grows.
• GJ/1,000 Packages
• GJ/US $100,000 of Revenue
2016 2015 2014
2.872.872.90
26.5726.65
26.79
2016 Goal
2016 Actual
2015
2014 0.72
0.73
0.73
0.72
0.72
2011 Baseline
Aircraft Emissions per Payload CapacityUPS Airlines – Global Operations
Total HC, CO, and NOx emissions in kgs divided by sum of max. payload
capacity (in thousands of kgs) weighted by annual aircraft cycles.
Replacing aircraft helped us meet this goal ahead of schedule.
Alternative Fuel & Advanced Technology Miles DrivenGlobal Operations
Miles driven in our Rolling Laboratory of alternative fuel and
advanced technology vehicles.
Investments allowed us to meet this goal a year earlier than expected.
2017 Goal
2016 Actual
2015
2014 505M
1B
805M
1.18B
2000 Baseline 0
Aviation Gallons Burned per 100 Available Ton MilesUPS Airlines – Global Operations
Gallons of jet fuel consumed for every 100 tons of capacity transported
one nautical mile.
Increase due to higher air volume and challenges to reduce fuel intensity.
2020 Goal
2016
2015
2014 6.47
6.66
6.27
6.56
6.58
2011 Baseline
CO2 Pounds per Available Ton MileUPS Airlines – Global Operations
Pounds of CO2 emitted for every ton of capacity transported
one nautical mile.
The lack of viable alternative fuels for aviation presents headwinds
for this goal.
2020 Goal
2016
2015
2014 1.37
1.54
1.24
1.39
1.39
2005 Baseline
U.S. Domestic Package
Scope 1 and 2 CO2e emissions include stationary sources (electricity, natural gas, propane,
and heating oil) and mobile sources (gasoline, diesel, Jet-A, natural gas, and propane).
CO2e Emissions – Normalized
Reductions reflect ongoing network optimization.
• mT/1,000 Packages
• mT/US $100,000 of Revenue
2016 2015 2014
21.0821.2021.22
1.951.97
1.96
2020 Goal
2016
2015
2014 -14.1%
0
-20%
-14.5%
-16.6%
2007 Baseline
Transportation Intensity IndexAll U.S. Operations & Global Airlines
Sums our Scope 1 and 2 emissions from U.S. Domestic Package,
U.S. Supply Chain & Freight and Global UPS Airlines.
GHG reduction strategies enabled ongoing, positive progress.
U.S. Domestic Package
Fuel consumption includes gasoline, diesel, natural gas, propane, fuel for rail
transportation, and other third-party carriers. Packages are total of U.S. ground
packages and air packages moved on ground.
Ground Packages per Gallon of Fuel
E-commerce deliveries to homes and small businesses make this
KPI a continuing challenge.
2016 2015 2014
8.238.32
8.55
11

102-46 | 102-49
Materiality is a critical input into our corporate sustainability strategy because it ensures we provide our stakeholders with the sustainability information most relevant to them and our business. To determine this, we conduct a formal materiality assessment on a regular basis. In 2015 and early 2016, we completed materiality assessments in fi ve regions: Asia-Pacifi c; Canada; Europe; the Indian Subcontinent, Middle East, and Africa; and Mexico. The results of the fi ve regional assessments were used as inputs for a refresh of the global corporate assessment in 2016. Led by BSR, a global nonprofi t organization, the process also included interviews with internal and external stakeholders, as well as internal workshops, to identify the most important sustainability issues. These activities updated our previous global corporate
assessment done in 2013. A complete overview of the UPS materiality assessment regional fi ndings and process is available at www.ups.com/sustainabilityreport.
The 2016 assessment reaffi rmed many fi ndings from earlier assessments while off ering greater direction and granular insights on some issues. New issues, such as urban congestion, also emerged, while others shift ed in importance. For example, safe driving, greenhouse gas policy, philanthropy and volunteering, and network effi ciency have been material issues to UPS throughout multiple materiality assessments, but their degree of importance has shift ed between assessments. We are using the key fi ndings from the 2016 materiality issues, which are summarized below, to further refi ne our global sustainability strategy.
1.6Materiality Assessment
2016 Material Issues
Our material sustainability issues are categorized into the four pillars of our Committed to More™ strategy.
Empowered People
Material Issues:
• Recruitment &
Development
• Ethical Conduct
• Workforce Diversity
• Labor Relations
• Employee Health,
Safety & Wellness
Connected Community
Material Issues:
• Safe Driving
• Humanitarian Relief
& Resilience
Environmental Responsibility
Material Issues:
• Emissions & Fuel Supply
• Greenhouse Gas Policy
• Congestion
Economic Enhancement
Material Issues:
• Global Trade
• Data Privacy
• Transparency &
Reporting
• Management
of Third-Party
Representatives
• Digital & Physical
Asset Security
• Package Contents
Responsibility
• Emerging Markets
12

UPS Material Content Table
Material Issue for UPS UN Sustainable Development Goals Alignment* Corresponding GRI Standards Material Topic Page
Workforce Diversity 5, 8Diversity and Equal Opportunity, Equal Remuneration
for Women and Men24
Employee Health,
Safety & Wellness3, 8 Employment, Occupational Health and Safety 28
Safe Driving 3, 8 Occupational Health and Safety 30
Recruitment & Development 4, 5, 8 Training and Education 32
Labor Relations 3, 4, 5, 8, 10, 16
Labor/Management Relations, Freedom of Association
and
Collective Bargaining
36
Ethical Conduct 12, 16Anti-Corruption, Anti-Competitive Behavior,
Socioeconomic Compliance38
Package Contents Responsibility 12This issue arose during the materiality process but does
not map directly to a GRI Standards material topic.39
Economic Performance** 1, 2, 3, 5, 7, 8, 9, 10, 11, 12, 13, 17Economic Performance, Market Presence, Indirect
Economic Impact, Procurement Practices42
Management of Third-Party
Representatives8, 16
Supplier Environmental Assessment, Supplier Assessment
for Labor Practices, Supplier Human Rights Assessment,
Freedom of Association and Collective Bargaining,
Anti-Corruption
51
Data Privacy 16 Customer Privacy 54
Digital & Physical Asset Security 16 Customer Privacy 56
Humanitarian Relief & Resilience 1, 2, 3, 5, 7, 8, 9, 10, 11, 17 Indirect Economic Impact 57
Greenhouse Gas Policy 3, 12, 13, 14, 15 Energy, Emissions 70
Emissions & Fuel Supply 3, 7, 8, 9, 11, 12, 13, 14, 15 Energy, Emissions 71
Congestion 11This issue arose during the materiality process but does
not map directly to a GRI Standards material topic.79
Transparency & Reporting 12, 16This issue arose during the materiality process but does
not map directly to a GRI Standards material topic.89
Contextual Trend Description Page
Global Trade 1, 8, 9
This trend arose during the materiality process. We
provide additional information in the Report to explain
its signifi cance to UPS.
46
Emerging Markets 1, 8, 9, 10
This trend arose during the materiality process. We
provide additional information in the Report to explain
its signifi cance to UPS.
46
** Please visit sustainabledevelopment.un.org/sdgs to identify corresponding goals.
** Our Materiality Matrix implicitly recognizes that our economic performance is a material infl uence on our business success, so it does not appear in the matrix as a separate issue or aspect.
We fully discuss our economic performance, in line with GRI Standards guidelines.
Introduction1.6 // Materiality Assessment
102-47
13

14
Regular dialogue with employees, customers, investors, community leaders, universities, public offi cials, suppliers, and third-party providers through formal and informal channels is essential to conducting our business, as well as developing and implementing our sustainability strategies.
Because of our long history, we have been engaged with many of these stakeholders for decades. We are always looking for ways to help our customers, employees, and stakeholders do more. That is why we maintain ongoing dialogue with a broad array of stakeholders — even those who may be critical of us.
We stay in regular contact with stakeholders on emerging sustainability issues and trends, and periodically receive inquiries and requests for engagement from stakeholder groups. We are also open to initiating new stakeholder engagement activities to help inform our strategy. In 2015, we convened a cross-functional group of internal stakeholders who have responsibility for our material issues to help develop a framework to focus current engagements and identify new opportunities. We continue to refi ne our stakeholder engagement strategy in 2017.
The following table summarizes the highlights of our stakeholder engagement on sustainability issues during 2016. More in-depth discussions about many of these topics may be found throughout the Report.
1.7StakeholderEngagement
102-42 | 102-43
We consider stakeholder engagement an essential aspect of UPS corporate governance.
We are one of the world’s largest private employers; we serve millions of customers in more
than 220 countries and territories; and hundreds of thousands of investors include UPS stock
shares in their portfolios either directly or via mutual funds.

15
Summary of 2016 Stakeholder Dialogue and Outcomes
Stakeholder Group Mechanisms for Engagement Stakeholder Expectations Actions Taken
Customers - Customer Satisfaction Survey
- Quarterly Business Reviews and regular meetings
- Market research
- UPS.com
- Social media
- UPS sponsored events
- Reliable service and on-time delivery
- Consumer convenience
- Innovative supply chain solutions
- Streamlined returns
- Completed U.S. deployment of our On-Road Integrated Optimization and Navigation (ORION) soft ware, which helps improve on time delivery and reliability
- Expanded UPS My Choice® membership and the UPS Access Point™ network services to off er customers and consumers more convenience and control
- Enhanced retail solutions portfolio by investing in Optoro, a technology company that helps retailers and manufacturers manage returns and excess inventory
- Hosted the UPS Sustainable Connections Summit to collaborate with customers and other stakeholders on key sustainability issues
Active and RetiredEmployees
- Sustainability Ambassador Program
- Business Resource Groups
- Daily Prework Communications Meeting
- Health & Safety Committees
- Annual Employee Engagement Survey
- UPSers.com and UPSers Connect
- Social media
- Union representatives
- Joint labor-management committees
- Town Hall meetings
- Competitive pay and benefi ts
- Clear communication
- Work/life balance
- Career and growth opportunities
- Support of a diverse workforce
- Eff ective off -boarding
- Revamped high-potential employee strategy, performance management tools, and new employee integration
- Redeveloped rewards strategies to attract talent and retain employees in the competitive job market
- Introduced new tools to improve training, performance management, and succession planning
- Celebrated 10 years of the Women’s Leadership Development Business Resource Group
- Hosted our second TED@UPS event to celebrate diverse UPSer perspectives
- Held a global sustainability month to engage employees in UPS’s sustainability eff orts
- Enhanced Employee Engagement Survey to be more actionable
- Improved communications with retirees
Policymakers, government offi cials
- Global advocacy and relationship building
- Multifaceted thought leadership strategy
- Facility visits and targeted outreach
- Collaborative partnerships
- Facilitating cross-border commerce
- Innovative solutions to congestion, noise, and air pollution
- Support for infrastructure investment and maintenance
- Support for a level playing fi eld with logistics operators and postal entities
- Continued advocacy for cross-border trade and the development of emerging markets
- Leveraged UPS’s real-world expertise to position as a global thought leader on trade and alternative fuels
- Collaborated with city offi cials to develop and expand solutions for more sustainable deliveries in urban areas
Investors - Investor Conference earnings communications
- Shareholder meeting
- Annual report
- Proxy statement
- Ratings and rankings
- Return on investment
- Continued investment in innovation
- Transparent reporting with credible data
- Hosted Investor Conference in early 2017
- Added 1,250+ alternative fuel and advanced technology vehicles in 2016 (total fl eet of over 8,100)
- Listed on Dow Jones Sustainability World Index for the fourth consecutive year and recognized at the Leadership level of the CDP Climate Change performance review
- Completed deployment of ORION in the U.S.
Communities - The UPS Foundation
- Employee Volunteer Program
- Community Relations Committees
- Humanitarian relief events
- Leveraging UPS expertise and resources to support humanitarian aid eff orts
- Employee volunteerism and local support
- Road safety programs
- Delivered 468 shipments of goods to communities in urgent need
- Deployed 10 loaned managers to provide logistics expertise to disaster response and resilience programs
- Contributed more than 2.7 million employee volunteer hours in 2016
NGOs - Regular dialogue
- Topic-specifi c conferences and events
- Private-sector expertise and resources
- Collaboration on innovative solutions
- Transparent reporting with credible data
- Set new goals and KPIs, including engagement with leading environmental NGOs to develop goals for our global ground operations
- Pioneered new solutions, including drone delivery of medicine in Rwanda in partnership with Gavi, the Vaccine Alliance and Zipline
- Updated UPS’s Global Materiality Assessment in collaboration with BSR and other NGOs
- Collaborated with BSR's Future of Fuels program and WBCSD's Low Carbon Freight and Zero Emissions Cities initiatives
Suppliers - Top Supplier meetings
- Supplier Diversity Program
- Research and Development of alternative vehicle technologies
- Leadership in testing and scaling alternative fuels and vehicle technologies
- Capacity-building support for local and diverse suppliers
- To date invested $750 million (including $100 million in 2016) in alternative fuel and advanced technology vehicles and fueling stations globally
- Continued to support local and diverse suppliers throughout UPS
Introduction1.7 // Stakeholder Engagement
102-40 | 102-44

16
Empowered People
02
2.1 Who We Are . . . . . . . . . . . . . . . . . . . . . . . . . . . . . . . . . . . . . . . . . . . . . . . . . . 18
2.2 Management Approach . . . . . . . . . . . . . . . . . . . . . . . . . . . . . . . . . 19
2.3 Diversity & Inclusion . . . . . . . . . . . . . . . . . . . . . . . . . . . . . . . . . . . . . . 24
2.4 Employee Health, Safety & Wellness . . . . . . . . . . . . . . . 28
2.5 Recruitment, Training & Development . . . . . . . . . . . . . 32
2.6 Labor Relations . . . . . . . . . . . . . . . . . . . . . . . . . . . . . . . . . . . . . . . . . . . . . 36
2.7 Ethical Conduct . . . . . . . . . . . . . . . . . . . . . . . . . . . . . . . . . . . . . . . . . . . . . 38

17
The Road Ahead“True workplace diversity in an inclusive atmosphere fosters greater creativity, innovation, and eff ectiveness. Diversity of experience, of knowledge, and of ideas strengthens our organization. To accomplish this experience at UPS, we work tirelessly to eliminate the barriers that stand between minorities and women in their attempts to succeed and lead.
Achieving our business potential will require transformative change that goes well beyond what is required of us. We are in the midst of transforming our culture to one that values — and seeks value from — diverse stakeholders. This is transformative
change — change that results in tangible, visible, and faster progress. It’s good for our business, and good for UPSers.”
Teri P. McClure, Chief Human Resources Offi cer and Senior Vice President, Labor
PROUD PAST1957, San Francisco California
Ken Jarvis became one of UPS’s fi rst African-American drivers through a contact at
the National Urban League’s San Francisco offi ce. Throughout his 37-year career at
UPS, Ken championed opportunities at UPS to thousands of qualifi ed and diverse
candidates. He retired in 1994 as Vice President of Human Resources.

Who We Are
Age Group (Global) Gender (Global) Minority Group (U.S.) Full/Part-Time (U.S.)***
<30 30-50 >50 Male Female
African
American Hispanic
Asian
American Other** Male Female
TOTAL EMPLOYEES 27% 51% 22% 80% 20% 23% 14% 3% 3% — —
Senior/Middle
Management8% 61% 31% 75% 25% 13% 9% 5% 1% 15% / 0% 29% / 0%
Entry-Level
Management39% 46% 15% 65% 35% 23% 14% 3% 3% 2% / 14% 9% / 23%
Administrative/
Technical23% 55% 22% 41% 59% 23% 13% 4% 2% 2% / 1% 26% / 7%
Nonmanagement 29% 49% 22% 87% 13% 24% 15% 2% 2% 81% / 85% 36% / 70%
*Data collected on 9/30 to account for year-round employees rather than seasonal peak hires. Does not include Coyote Logistics.
**Indicates two or more.
***As employment type varies from country to country and a signifi cant part of the UPS workforce is in the U.S., we chose to focus on U.S. employment by type.
2016 Statistical Snapshot of UPS Diversity*
Temporary HolidayPart-Time Employees
95,000
A snapshot of our global workforce in 2016
PART-TIME
46%
FULL-TIME
54%
Total Workforce 434,000+
OUTSIDE U.S.
U.S.
Workforce by Location
18.4%
81.6%
MALE
80%
FEMALE
20%
Workforce by Gender
102-8 | 405-1
18

2.2Management
Approach
103-1 | 103-2 | 103-3
19
UPS competes for talent around the world — within, and increasingly outside, the
transportation industry. Market conditions have become more competitive. The
scarcity of key talent continues to grow with an aging working population. This is the
world we compete in, and it will be increasingly more difficult to attract and retain
talent as time goes on.
We address this challenge through our Human Capital Strategy, which aligns with UPS’s business strategy. The goal is to help us build for the future while taking the necessary steps today. UPSers are the fuel that will drive our growth strategy, and we need engaged, innovative, and passionate problem solvers to help achieve mutually benefi cial outcomes — for our people and our business. Our strategy recognizes certain business realities, including:
• The growing diversity and global reach of our business, which requires an equally diverse and global workforce;
• A greater premium on our talent recruitment, retention, and engagement;
• Technological advances within our business that will require new skill sets oft en found beyond the transportation and logistics sector;
• Our ability to off er our people a wide range of experiences and growth opportunities, enabling some UPSers to have multiple career paths without leaving the company; and
• The signifi cant percentage of our workforce that is part-time and seasonal, providing an exceptional level of fl exibility for UPSers and the company.
Our Human Capital Strategy includes three initiatives that focus on high-value business priorities: Global Leadership & Talent, Global Total Rewards, and Employee Engagement.
Work in the Global Leadership & Talent arena defi nes how we will acquire and maintain the desired talent, leadership, culture, and environment to fulfi ll our business strategy. Given that more than 50 percent of our senior staff will be eligible to retire over the next fi ve years, we have identifi ed strategic positions across UPS to focus succession planning eff orts. With those positions in mind, we are working diligently to create a strong pipeline so that we have the right future leaders to fulfi ll critical talent needs. Some of these eff orts include:
• Identifying competency gaps in potential candidates that allow us to accelerate their development;
• Placing greater emphasis on exposure and experiences to help accelerate employee growth; and
• Redefining high-potential employees with new criteria and an assessment tool to help us better identify future leaders.
Global Total Rewards focuses on better aligning our overall compensation components — pay, incentives, healthcare, relocation, retirement, and more — to drive employee engagement and support business outcomes. We also are working to realign business performance and personal fi nancial rewards as business needs and talent markets change. One example is the My Talent Center Program. We determined that some performance and career processes which were key drivers of
Empowered People2.2 // Management Approach
compensation and engagement in the past no longer supported the company’s vision or drove the right business outcomes. Through My Talent Center, we developed new processes, launched an integrated technology platform, and gained employee buy-in with one of the most comprehensive internal training eff orts undertaken in more than 20 years.
Delivering a compelling Employee Value Proposition (EVP) is an integral component of our Human Capital Strategy, and we are in the process of redefi ning it. A strong EVP helps us attract, retain, and engage our people so that they can execute on our business strategy. As with our Global Leadership & Talent initiative, there is a greater emphasis on providing better employee experiences. Our desired EVP includes:
• Values that are shared by UPS and its employees;• Empowerment that enables our people to make smart
decisions and shape the future;• Passion that delivers excellence, makes a meaningful
impact, and provides a voice that matters;
• Opportunity to unlock individual potential; and• Connectivity and collaboration among our global team.
We believe the best way to understand how initiatives aff ect our people is to gather direct feedback from employees on their experiences. That led us to start using the framework of the UPSer Lifecycle, which consists of four stages: Attract & Recruit, Select & Onboard, Develop & Grow, and Transition. Each stage has employee touch points that provide opportunities to create a better employee experience. We are in the process of identifying our strengths and opportunities in each phase and implementing processes and programs to improve.
The data we report for this section was compiled by the UPS Global Workforce Planning team, as of September 30, 2016, to account for year-round employees rather than seasonal hires. We have noted where numbers are global, as opposed to limited to the United States where we have the largest portion of our workforce. Data includes only non-temporary employees.
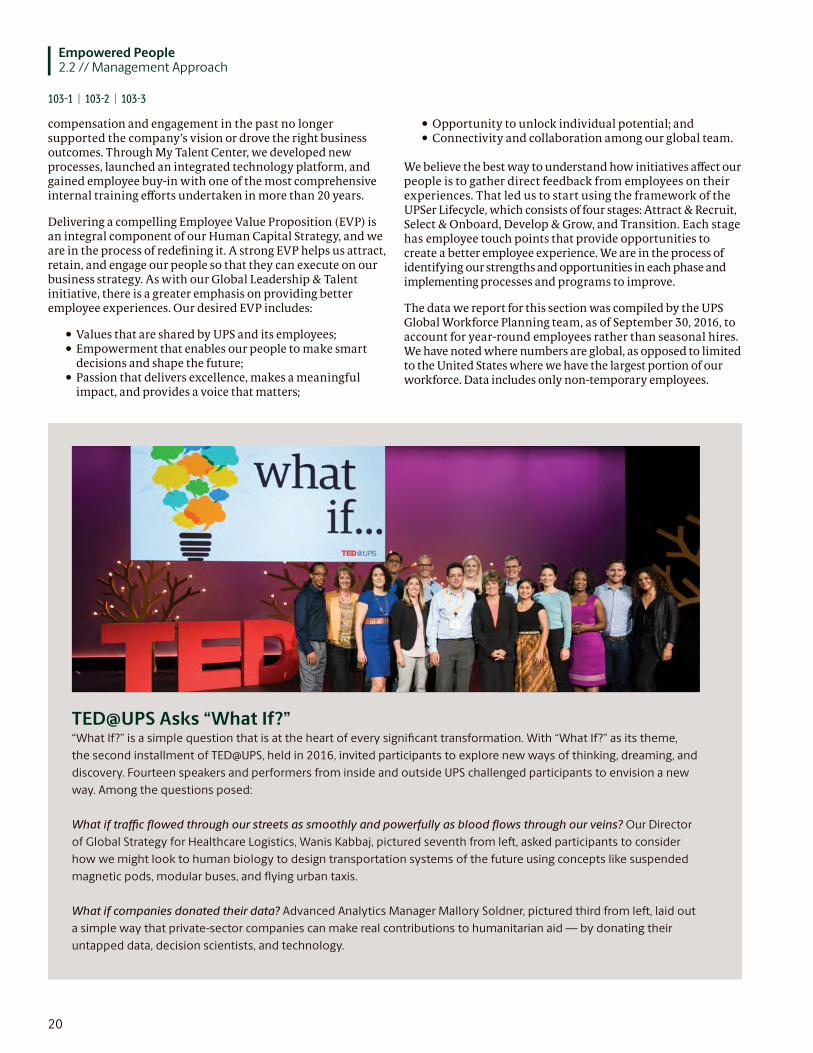
TED@UPS Asks “What If?”“What If?” is a simple question that is at the heart of every signifi cant transformation. With “What If?” as its theme,
the second installment of TED@UPS, held in 2016, invited participants to explore new ways of thinking, dreaming, and
discovery. Fourteen speakers and performers from inside and outside UPS challenged participants to envision a new
way. Among the questions posed:
What if traffi c fl owed through our streets as smoothly and powerfully as blood fl ows through our veins? Our Director
of Global Strategy for Healthcare Logistics, Wanis Kabbaj, pictured seventh from left , asked participants to consider
how we might look to human biology to design transportation systems of the future using concepts like suspended
magnetic pods, modular buses, and fl ying urban taxis.
What if companies donated their data? Advanced Analytics Manager Mallory Soldner, pictured third from left , laid out
a simple way that private-sector companies can make real contributions to humanitarian aid — by donating their
untapped data, decision scientists, and technology.
20
103-1 | 103-2 | 103-3

Empowered People2.2 // Management Approach
Measuring Our PerformanceTo help measure the eff ectiveness of our Human Capital Strategy, we've linked the strategy to one of our new enterprise sustainability goals. We will continue monitoring and improving our workforce practices through an Employee Engagement Index that is driven by employee feedback, research data, and our employee experience initiative. The goal for 2020 is to realize a 2 percent improvement in the index.
The Employee Engagement Index is part of our Employee Engagement Survey (EES), which is conducted annually across all work groups, with results reported to all employees. The EES is an important measurement tool in our engagement eff orts and is used to drive and adjust strategies. In 2016, we improved the EES methodology, shortening the survey from 72 to 30 questions and statements, making it less burdensome on employees. We also focused the 2016 survey on more locally oriented questions to give district leaders actionable information on which to build plans. For example, questions about enterprise matters such as compensation and benefi ts were removed, as they are beyond the control of local leaders. We added six benchmark statements to measure ourselves against best-in-class employers around the world, and two open-ended questions that allow employees to provide comments on what is going well and what can be improved. Given these changes to the survey composition, year-over-year comparisons of EES results are not instructive, but we will keep our six benchmark statements going forward as we continue to modify the survey to better fi t what we need to learn about our workforce. These statements will allow us to construct a new year-over-year comparison. Additionally, this signifi cant change resulted in our no longer measuring the Employer of Choice KPI that concluded in 2016.
Another important measure of success is full-time Employee Retention Rate. Results for this KPI refl ect fewer retirements among our tenured workforce than expected when we initially set the goal.
Workplace GovernanceResponsibility for executing our Human Capital Strategy lies with our Chief Human Resources Offi cer and Senior Vice President, Labor, who is a member of the UPS Management Committee. Our employee policies are detailed in the UPS Code of Business Conduct and UPS Policy Book. Within countries and territories where we operate our own facilities, HR teams are responsible for conducting periodic audits to ensure compliance with all applicable laws, regulations, and UPS policies, as well as implementing corrective plans as needed. The UPS Corporate Compliance and Ethics Group conducts international regulatory compliance reviews in select countries and territories to confi rm that the audit and response process is working eff ectively.
21
103-1 | 103-2 | 103-3

Empowered People2.2 // Management Approach
Individual Commitment that Adds Up to Signifi cant Impact
On most Saturdays, you can fi nd Pat Grace, a 40-year UPSer,
managing basketball leagues and running sports clinics at
Leadership Through Athletics (LTA), the community center Pat
and his two brothers co-founded 12 years ago in Lansdowne,
Maryland. In a community facing widespread poverty and
hardship, LTA provides children and teens with a safe place to go
aft er school. While athletics is a cornerstone of LTA, instructors
also encourage leadership values, instill the importance of
education, promote health and fi tness, and work to stabilize the
community. The center includes 20,000 square feet of athletic,
recreation, and meeting space. Pat’s remarkable contributions to
Lansdowne youth earned him the 2016 Jim Casey Community
Service Award, which is given annually to a UPSer who
demonstrates an exceptional commitment to helping others in
their community.
Pat understands the personal empowerment and satisfaction that
come with the opportunity to make a diff erence — in the life of an
individual, the vitality of a community, or the preservation of the
environment. UPSers around the world seize such opportunities
every day by giving of their time and talents.
Those opportunities led to 2.7 million volunteer hours in 2016,
driving our 2011-2016 cumulative total volunteer hours to more
than 12 million. This puts us more than halfway to achieving an
ambitious goal for our Decade of Service: 20 million volunteer
hours by the end of 2020.
Helping others not only benefi ts our communities and nonprofi t
partners; volunteerism empowers our employees and is an important
tool in cultivating workplace engagement. Many of our volunteer
projects also become a connection point for workplace recruitment.
Around the world, UPS volunteers engage in a range of projects,
including tree plantings, food and supply collections, packaging
and distribution, participation in community fundraising events,
and administrative support for organizations driving social change.
UPS volunteers get involved in a variety of ways, including:
• Teaching safe driving practices to teens and novice
drivers in our UPS Road Code™ program, using
sophisticated multimedia and teaching techniques
drawn from UPS’s own driver safety methods. UPS Road
Code™ training is off ered at 112 sites in Canada, China,
Germany, Mexico, the United Kingdom, and the United
States. We launched the program in Mexico in March
2016, with employees committing to volunteer more
than 2,000 hours of their time teaching best driving
practices to Girl Scouts from Guias de México A.C.;
• Speaking to schools, families, and children to promote
the use of helmets for young people riding scooters
in Southeast Asia. These eff orts are part of a multiyear
program with the Asia Injury Prevention Foundation,
which includes the purchase and distribution of 51,300
helmets funded by a UPS donation;
• Joining the Sustainability Ambassadors program, a
global network of UPSers committed to doing more to
positively impact communities and our environment.
More than 5,500 UPSers around the world have joined
the team to take part in challenges and activities,
build their knowledge and skills, and fi nd new ways to
collaborate to achieve real results;
22
Pat Grace (pictured right), 2016 James Casey Community Service Award Winner
Continued next page

• Planting 29,000 trees in 21 countries to support
the UPS Global Forestry Initiative. Each year, trees
are delivered and distributed to UPS employees to
celebrate Arbor Day in the U.S. and Earth Day globally.
Through these initiatives, employees and their families
have planted more than 101,000 trees; and
• Sponsoring the 2016 VEX Robotics World Championships
in Louisville, Kentucky, where more than 125 employees
from UPS Airlines volunteered in various capacities
and manned an interactive display for participants to
operate a drone.
The volunteer spirit within UPS peaks each year during our
annual Global Volunteer Month in October. To celebrate the
10-year anniversary of the UPS Women’s Leadership Development
program in 2016, this year’s 14th annual Global Volunteer Month
was focused on supporting nonprofi ts and NGOs that help
advance the development of women and young girls. Projects
included supporting breast cancer awareness and research by
participating in the Susan G. Komen Race for the Cure charity
walk in the U.S.; coordinating events to empower women to
support the work of the Women's Foundation in Colombia;
renovating orphanages and women's shelters in Germany;
mentoring adolescent girls at SOS Children’s Villages in India;
and hosting bake sales with proceeds supporting the YWCA
Kuala Lumpur in Malaysia. During the month, approximately
31,000 volunteers contributed more than 335,000 hours.
Each year, we conclude the month of volunteerism with a
US$10,000 grant from The UPS Foundation to a nonprofi t
organization in each UPS region and business unit where an
employee volunteered. In 2016, The UPS Foundation's
charitable giving totaled US$59.1 million to more than
4,300 nonprofit organizations.
As with our business, the scope and scale of our volunteer
eff orts have the potential to make a signifi cant impact. We
never lose sight, however, that our collective impact is the
result of individual commitment.
23
Empowered People2.2 // Management Approach
2.3Diversity
& Inclusion
24
103-1 | 103-2 | 103-3
In the global business arena, diversity and inclusion are no longer about workplace compliance;
rather, they are core drivers of business growth and central to a company’s identity. By leveraging
diverse perspectives and creating inclusive environments, companies are improving organizational
eff ectiveness, cultivating innovation, and driving growth. Diversity and inclusion also enable
companies to adapt and excel in an ever-evolving global marketplace.
At UPS, diversity and inclusion benefi t the economic sustainability of our business by helping us to better understand and meet customer needs, as well as strengthening our workplace environment so that employees can be more successful. We strive to be a model for how diversity and inclusion can create business and societal value.
Management ApproachOur management approach is based on the UPS diversity and inclusion mission to connect and empower our employees, customers, suppliers, and communities for success, embracing the dynamics of diff erent backgrounds, experiences, and perspectives to propel our growth. This mission is grounded in the belief that diversity and inclusion are business imperatives. Cultivating a diverse workforce and inclusive work environment can improve engagement, foster innovation, enhance customer service, and ultimately drive better fi nancial performance.
As a global company serving more than 220 countries and territories, we recognize that diversity is defi ned diff erently around the world. Our broad view of diversity includes visible characteristics such as race, gender, or age, as well as less obvious characteristics such as personality, ethnicity, ability, sexual orientation, education, religion, lifestyle, values, beliefs, experiences, backgrounds, preferences, family situations, or behaviors.
Today, we take an increasingly integrated approach to diversity and inclusion across stakeholder groups that include employees, customers, suppliers, and communities. UPS's Chief Diversity and Inclusion Offi cer leads these eff orts globally, supported by
the UPS Diversity and Inclusion Steering Council. The Council, which meets twice each year, is chaired by our CEO and composed of senior leaders who set and support strategies for the organization while serving as visible champions for diversity and inclusion.
We expect our managers to be models for others. Annual performance reviews for managers include a component to evaluate how well the individual fosters an inclusive environment in which everyone is aff orded opportunities to contribute and develop. We expect managers to foster diverse, inclusive working environments, and we help many diverse groups support one another, exchange information, and engage with management.
In 2016, we made progress in the areas of measuring and reporting workforce diversity. Enhanced reporting gives us the ability to potentially quantify the value of diversity and inclusion by linking changes in diversity data with overall business performance. We also launched Panorama, the company's diversity and inclusion news connection that provides a platform for continued dialogue inside and outside of UPS.
The process of building a diverse workforce begins with recruiting talented people regardless of their race, color, national origin, sex, gender identity, sexual orientation, age, disability, or religion, or any other characteristic protected by law. We then reward and promote people based on their skills, knowledge, experience, and performance. We are also broadening the level of diversity and inclusion education throughout our ranks. In 2016, for example, we continued providing unconscious bias training for UPS leadership, and expanded this eff ort further internationally with training sessions in Brussels, Dubai, London, and Neuss.
As a global company, we believe our culture should refl ect the diversity and inclusion that thrive both inside and outside our walls. Externally, diversity and inclusion are focus areas of The UPS Foundation, with investments in opportunities for underserved and underrepresented segments of society in the areas of economic empowerment, access to higher education, inclusion, and mentorship. We partner with organizations
24
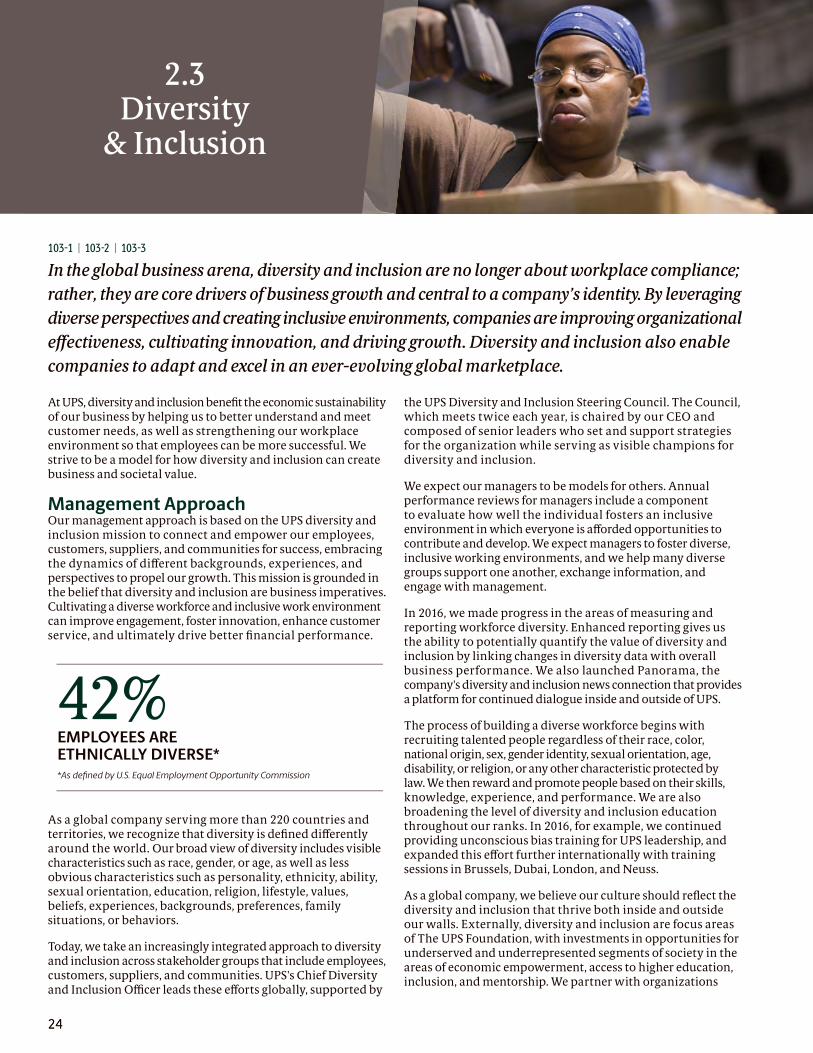
42%EMPLOYEES AREETHNICALLY DIVERSE**As defi ned by U.S. Equal Employment Opportunity Commission

25
that are on the front lines of advancing the values of diversity, inclusion, personal dignity, and professional development, especially when these programs leverage our people and company expertise. This integrated approach off ers tremendous synergy. For example, The UPS Foundation funds organizations that help develop minority participation and placement in engineering programs, which, in turn, aids UPS in its recruitment of minority engineers. In 2016, The UPS Foundation announced awards of more than US$7.4 million in global diversity and inclusion grants to 36 diff erent organizations that are focused on empowering and championing women and diverse people across the globe.
Workforce Diversity MetricsBeginning in 2016, we implemented changes to how we report our workforce diversity data. In previous years, we reported workforce diversity metrics across six groups:
• Governance Bodies: Board of Directors and Management Committee
• Employee Categories: Senior Management, Middle Management, Admin/Technical, and Nonmanagement
In 2016, we undertook an effort to reorganize employee categories to better align with our Human Capital Strategy and ref lect our global job categories. As such, we made several noteworthy changes to how we report workforce diversity data, as ref lected in the Workforce Diversity Snapshot on page 18:
• Combined the Senior Management and Middle Management categories, which now includes Full-time Supervisors and above;
• Added an Entry-Level Management category, which includes management employees in entry-level positions, such as Part-time Supervisors and Full-time Specialists;
• Continued reporting Administrative/Technical employees; and
• Continued reporting Nonmanagement employees, comprised mostly of employees within our operations.
Data for Board of Directors and Management Committee can be found on page 1 in the Corporate Governance overview available at sustainability.ups.com/resources/corporate-governance.
Empowered People2.3 // Diversity and Inclusion
Taking the Initiative in Diversity RecruitmentWhile many companies have English as a Second
Language programs, UPS takes diversity recruitment a
step further. Revenue Recovery Supervisor Larry Rosa
created and heads the Global Gateways program which
focuses on recruiting employees who speak limited
English for UPS's Worldport™ hub, which is its largest
facility. Larry uses his bilingual skills to assist with the
hiring process by translating training materials into
Spanish for use in specialized orientation and classes
in Louisville, Kentucky. In addition, Global Gateways
supports new hires through the entire hiring and training
process. “This program has given opportunities to those
who otherwise may not have had them due to their
limited English language skills,” he said. “This gives UPS
an advantage over other companies that have not yet
adapted to our city’s growing diverse population.”
103-1 | 103-2 | 103-3

Empowered People2.3 // Diversity and Inclusion
Business Resource GroupsBusiness Resource Groups (BRGs) off er networking and learning opportunities outside of regular work teams. All BRGs have advisors and sponsors among senior management. BRG sponsors, who are members of our Management Committee, help connect BRGs with people at the highest levels of UPS, so the BRG can best align their objectives with those of the company. Executive sponsorship also ensures leaders have fi rsthand knowledge of the benefi ts that naturally come from a diverse and inclusive partnership in an organization that continues to expand its international business.
BRGs at UPS make signifi cant contributions to growing the business and supporting the communities we serve. For example, the Veterans BRG hosted its fi rst-ever Summit for members in the U.S. and Canada. Participants gathered at UPS's corporate office in Atlanta for a series of workshops on diversity and inclusion initiatives, the Registered Apprentice Program, Veterans Career Gateway, and UPSers Connect. Together, participants discussed and developed solutions for problems faced by veterans in the corporate world, and strategies to foster a more inclusive workplace environment for veterans.
In 2016, UPS’s Corporate Hispanic/Latino BRG participated in the seventh National Employee Resource Group Summit and Corporate Challenge organized and hosted by the U.S. Hispanic Chamber of Commerce (USHCC). The competition was part of the USHCC’s annual convention, which recognizes the growing importance and value of corporate business or employee resource groups. More than 100 corporations participated in the annual USHCC competition, proving that BRGs are more ready than ever to provide value and impact their companies' growth. The UPS team achieved an impressive third-place fi nish in this national competition. Judging was based on the BRG's ability to impact careers, community, culture, and commerce.
26
Business Resource Groups
At-A-Glance
2016 BRG MEMBERSHIP
27%
U.S. CHARTERED
BRGs
108INTERNATIONAL
CHARTERED BRGS
42
2015
2016
118
150
Locally Chartered Entities Globally

Empowered People2.3 // Diversity and Inclusion
2016 marked the 10-year anniversary of our fi rst BRG, Women’s
Leadership Development (WLD). This anniversary was not only a
milestone for our BRG program, but also underscored how these
groups help us address strategic challenges within our business.
Though women represent 20 percent of UPS’s workforce today,
our industry continues to be seen as a male-dominated fi eld.
Increasing the number of UPSers who are women remains a
challenge because, despite targeted outreach eff orts and advertising,
many front-line positions in our business, such as drivers and
package handlers, have historically attracted more men than
women. Coupled with our focus on promoting from within, this
has created a need for us to attract, recruit, develop, and retain
women for leadership roles.
Our WLD BRG continues to encourage women in management
to remain with the company and develop their careers within
UPS. WLD focuses on enhancing its members’ personal and
professional skill sets in order to prepare them to step confi dently
into leadership roles at UPS. Started as a pilot program in 2006,
WLD today counts 65 chapters in more than 30 countries and
territories. These groups are critical to helping us recruit, develop,
and retain women at all levels of the company.
The signature event of our WLD anniversary celebration in 2016
was the Women’s Leadership Exchange Thought Leadership
Summit, which commemorated the milestone, recognized the
achievements of all BRGs, and identifi ed goals and pathways for
the next 10 years. Held in Atlanta, speakers included our CEO
David Abney and other UPS leaders, as well as leaders from Catalyst,
Kimberly-Clark, Metro Atlanta Chamber of Commerce, McKinsey
& Company, Morgan Stanley, Peace Corps, and The Home Depot,
Inc. Representatives from more than 30 companies attended. In
addition to celebrating WLD and its transformational role at UPS,
the event also demonstrated internally and externally how far we
have come in making UPS a fair, inclusive, and authentic workplace.
27
A Decade of Developing Women’s Leadership

2.4Employee Health, Safety & Wellness
28
103-1 | 103-2 | 103-3
UPS customers worldwide depend on us to meet important deadlines every day. Our
people are problem-solvers who operate more than 114,000 vehicles, more than 2,500
facilities, and one of the world’s largest air cargo fl eets. Meeting our service responsibilities
to customers requires a deep-seated commitment to the health, safety, and well-being of
our people. We invest millions of dollars and hours every year in wellness coaching and
health and safety training.
Management ApproachA commitment to employee health, safety, and well-being permeates our culture and forms the design of our products, processes, and supply chain. We take a whole-person management approach, off ering a wide variety of guides, training, processes, programs, and benefi ts to promote employee health, safety, and wellness. These include companywide initiatives, as well as plans and programs specifi c to the countries and territories in which we operate.
We use a Comprehensive Health and Safety Process (CHSP) to improve the overall health and safety environment of UPS employees. Working closely with our unions, there are more than 3,450 CHSP committees worldwide, which are co-chaired by employees and management. The committees conduct facility and equipment audits, perform work practice and behavioral analysis, conduct training, and recommend work process and equipment changes.
Training, coaching, and recognition are critical components to continuously encouraging a culture of safety. Safety professionals at UPS teach a comprehensive range of workshops, certifying frontline managers and supervisors who, in turn, instruct employees in the specifi cs of each course. We customize training to meet market-specifi c standards and continually enhance training techniques with current multimedia technology. Aft er training, employees and management recognize employees with exceptional safety records and encourage our people to strive for the same high standards.
Global Wellness: Five Being HabitsSafety at UPS begins with the employee who actively mitigates risks at home and on the job. Taking this all-encompassing approach helps instill a healthy, safe mindset among employees, even before they begin work. We follow a global wellness guide called the Five Being Habits that focuses on fi ve areas of wellness: fi tness, sleep, nutrition, stress management, and hydration. These habits serve as actionable steps that employees and their families can take toward creating healthy lifestyles.
Wellness Champions within each CHSP Committee use the Five Being Habits to deliver messages of wellness as part of their eff orts to support health and well-being among their peers. Wellness Champions help disseminate information and implement programs at their work locations on smoking cessation, healthy eating, and other areas of wellness. In 2016, we increased the use of athletic trainers in key facilities to encourage employees to warm up prior to work, which can help prepare the body for activity and reduce the risk of injuries.
28

29
Safety Training and PoliciesUPS employees receive more than 10 million combined hours of safety training each year. In 2016, health and safety training comprised more than US$194 million, or 23 percent, of the total US$834 million spent on training. Safety training courses include UPS Safe Work Methods, which helps address the major sources of known risk to our employees, as well as annual and periodic courses on defensive driving, risk awareness, respiratory protection, hearing conservation, conveyor safety, hazardous material/emergency response, and others.
We supplement formal safety training with mentoring programs that enable employees to learn from others with more experience. For example, in the Drivers Driving Safety mentoring program in southern California, drivers who have been inducted into the UPS Circle of Honor meet regularly to review issues and encourage other drivers to make improvements. The UPS Circle of Honor recognizes individuals who have driven 25 years without a preventable accident. UPS leads the industry in safety practices, with nearly half the injury and accident rates of our peers.
During 2016, we continued our emphasis on Quality Validation Assessments (QVAs). QVAs are used to verify and measure the eff ectiveness of safety and wellness leadership; daily planning and execution; and communication and coaching. In 2016, an additional 3,300 management employees received QVA training, bringing the total number of employees trained in the QVA process to 8,600. Additionally, a QVA was developed for Wellness Champions to educate management on this role
and provide guidance and support for the Wellness Champion on each CHSP committee.
Vehicle crashes represent the majority of UPS employee fatalities and are the leading cause of death and injury in the workplace, according to the National Safety Council. We continue to implement on-road safety training and vehicle technology to help reduce vehicle accidents. In 2016, we updated and standardized our Master Driver Safety Training Workshop, which is now taught at the Global Leadership College UPS Integrad® training facilities in nine locations in the U.S. The workshop provides training to management and nonmanagement employees on key defensive driving topics. We equip our tractors with adaptive cruise control with braking features, along with Collision Mitigation technology. By the end of 2016, we had more than 4,500 class 8 vehicles — 25 percent of our tractors — equipped with this technology, and we intend to equip all future UPS tractors as well.
Within our U.S. Domestic Small Package Operations, we use telematics data to promote and coach safe driver behaviors. Telematics can assist with coaching driver behaviors such as seat belt use and backing up. By using telematics data, seat belt use has improved to 99 percent, and backing incidents have been reduced by 25 percent. In the U.S. we also provide education regarding the Federal Motor Carrier Safety Administration’s Compliance, Safety & Accountability (CSA) program. The CSA program quantifi es the on-road safety performance of carriers and drivers around seven measurements, such as driver fi tness and vehicle maintenance.
Empowered People2.4 // Employee Health, Safety & Wellness
Innovating for Employees by EmployeesAt UPS, there is no shortage of employee innovation to help
solve many of our business needs, from route optimization
to employee safety. In France, a team of drivers utilizes a
vest for training which alerts the wearer if they are lift ing
something improperly. “What is good for our employees,”
says Industrial Engineering Manager, Nathalie Meret, “is
good for our company. I am proud of my innovative French
UPS colleagues.”
103-1 | 103-2 | 103-3

Empowered People2.4 // Employee Health, Safety & Wellness
An ongoing focus is to enforce compliance with regulations as they pertain to working hours, rest hours, and leave times for people who drive and operate vehicles. These policies are tailored to the diff erent types of work we do and how we do it, as well as to the laws and regulations in jurisdictions where we operate, and are oft en included in contracts with collective bargaining organizations. We regularly complete interviews, surveys, document reviews, and site inspections to evaluate the quality of our safety eff orts and audit how well we conform to safety policies. These activities also inform decisions around strategic changes that are necessary to better serve our people as our business grows.
2016 Safety PerformanceWe are committed to maintaining industry leadership in safety performance. With our new 2020 goals, we are committed to realizing a 1 percent improvement in Lost-Time Injury Frequency and a 3 percent improvement in Auto Accident Frequency. UPS leads the industry in safety practices, with nearly half the injury and accident rates of our peers.
Although we report our KPIs on an annual basis externally, we changed our internal measure in 2016 to a rolling 12-month reporting frequency, which helps focus employees on continuous improvement and long-term investment in skill development. By not resetting at the end of each calendar year, we can help promote a year-round emphasis on injury and auto accident prevention.
In 2016, we recorded 9.04 auto accidents per 100,000 driver hours. This is a 4.6 percent improvement over 2015, and slightly above our 2016 goal of 9.00. Improvements are a result of investments in training and crash mitigation automotive solutions. We recorded 1.82 lost-time injuries (LTI) per 200,000 hours worked in 2016, a 2.6 percent improvement from 2015, due in part to training investments and effi ciencies in package handling. While we are proud of our industry leadership in safety practices, we acknowledge that we missed our target to achieve a 1.75 LTI rate by 2016. We attribute this to an increase in new employees who are less experienced in the short-term, driven by the capacity demands of e-commerce growth.
To measure our safety programs and goals, we use the Safety Health Risk Management information System to track this data in Canada, Puerto Rico, and the United States. Outside of those areas, we began deployment of an International Incident Report Tool in 2016 to track injuries, auto crashes and near-misses, replacing manual processes at local levels.
We deeply regret that accidents claimed the lives of eight UPS employees in 2016. Five incidents involved auto accidents; two involved violence encountered on drivers' routes; and one driver was a pedestrian struck by another vehicle. Although the UPS employee fatality rate is far less than the overall transportation and warehouse industry sector fatality rate, we hold ourselves to the highest standard and believe that one employee fatality is too many. Our goal is to eliminate all workplace fatalities. With more than 114,000 vehicles and more than 3 billion miles driven each year, we are committed to implementing best-in-class driver training
103-1 | 103-2 | 103-3 | 403-2
30
UPS Circle of HonorThe Circle of Honor is the ultimate achievement that
recognizes UPS drivers for safety excellence of 25 years
or more without a preventable crash. Earning the right
to wear the distinctive Circle of Honor patch is a source
of unwavering pride among UPS drivers. Circle of Honor
drivers have accumulated more than 266,500 years
of safe driving in their combined careers, and have
collectively driven nearly 14 billion miles.
The 2016 inductee class of 1,575 drivers expanded the
ranks of Circle of Honor members to more than 9,300,
or 7.6 percent of our current driver workforce, the most
in company history. In 2016, a key milestone was
achieved — Package Car Driver Patrick David (pictured
above), from Chilly-Mazarin, France, became the fi rst
European driver outside of Germany to join the Circle
of Honor ranks. Livonia, Michigan, package car driver
Tom Camp is the best-of-the-best, with 54 years of safe
driving. Frankfurt, Germany, tractor-trailer driver Dietmar
Haupenthal has the most years of safe driving in Europe
with 39 years. This year, 74 new members are from
Canada, France, Germany, and Puerto Rico, and 44 new
inductees are women. A total of 206 women are in the
Circle of Honor, and 34 women have joined the ranks of
those with more than 30 years of safe driving.

Empowered People2.4 // Employee Health, Safety & Wellness
solutions and new automotive technologies to help reduce vehicle accidents. We continue to explore ways to improve employee safety through fl eet and building design, training, and technology solutions.
Health and Benefi tsUPS provides health benefi ts for many employees, retirees, and their dependents through several plans administered to meet the health and wellness needs of various employee groups. In addition, we make contributions on behalf of UPS employees who are covered by union-administered plans. These contributions are for our employees and their eligible dependents. While there are variations in available plans, the following is an overview of UPS employee benefi ts:
• Medical care, including a prescription drug program• Dental care• Vision care• Life insurance• Supplemental life insurance• Business travel accident insurance• Short-term and long-term disability coverage• Child/eldercare spending accounts• Pretax healthcare spending and savings accounts• Work-life balance programs
In many countries and territories around the globe, we contribute to social security systems that generally provide health, unemployment, disability, and retirement benefi ts for employees in that country or territory. In addition to government systems, we provide healthcare, life, disability, and/or retirement benefi ts for more than 25,000 employees outside the United States.
UPS benefi ts within the United States include education, counseling, and other programs that help employees and their families deal with a range of issues, including serious disease, substance abuse, smoking, diabetes, high blood pressure, mental health, and many others. Our health coaches program gives eligible UPS employees access to registered nurses who provide confi dential assistance in understanding healthcare issues and navigating the healthcare system. In many countries outside the United States, legislation or national practice provides citizens with benefi ts programs as an integral part of the social system. We off er private-benefi t plans to our international operations to supplement these programs.
In the United States, our Employee Assistance Program (EAP) provides practical information, referrals to trained professionals, and support for a wide range of work/life issues, from fi nancial concerns and child care to substance abuse and bereavement. More than 639,000 current and former UPS employees and/or household members have taken advantage of this program since it began 10 years ago.
Other Benefi ts and AvailabilityWe further invest in our people by off ering a competitive range of other benefi ts in addition to those for health and wellness. In the United States, these other benefits are generally provided to non-union employees without regard to full-time or part-time status. They include:
• Retirement plans• 401(k) plans• Tuition assistance• Discounted employee stock purchase plan• Paid time off • Employee discounts• Relocation programs
Certain benefi ts are not available to all or some part-time employees. These include long-term disability coverage, business travel accident insurance, and tuition assistance; availability may vary by location and employee position. Furthermore, some of these benefi ts may, in practical terms, apply only to management employees, such as those taking advantage of our relocation programs. Our union employees bargain collectively for their benefi ts via their union representatives. Temporary employees and seasonal workers are generally ineligible for UPS benefi ts.
Under the U.S. Family and Medical Leave Act (FMLA), UPS employees in the U.S. are eligible for parental leave if they have worked for UPS for at least 12 months, and 1,250 hours over the previous 12 months. Additionally, any UPS employee who is not eligible according to the FMLA requirements but has worked at UPS for a minimum of 36 consecutive months and for at least 625 hours during the previous 12-month period may still be eligible for leave under the UPS leave policy. In 2016, 354,133 employees qualifi ed for FMLA leave as well as short-term disability maternity leave. In addition, there are state laws that off er greater protections or have eligibility requirements diff erent from the federal law.
31
103-1 | 103-2 | 103-3 | 401-2 | 401-3

2.5Recruitment, Training
& Development
32
103-1 | 103-2 | 103-3 | 202-2
Our industry, customers, and the world’s transportation infrastructure are changing constantly
with new ideas, technology, and environmental challenges. To compete and meet our customers'
needs eff ectively, we must recruit a large and talented workforce and then equip them with the
necessary skills and experiences to help lead change and innovation.
Management ApproachWe believe UPS employees are among the most motivated, highest-performing people in the industry, and they represent a meaningful competitive advantage for our company. This gives us strong reason to recruit good people and keep them with us for the long term. Our management approach includes:
• Promoting from within;• Off ering a range of training and talent development
opportunities; and• Identifying employee potential early to accelerate
career development.
When the business cycle or other forces drive changes in our staffi ng needs, we take steps to retain our people. These steps include promoting from within before considering a new hire, transferring employees into equivalent positions in other departments, and training them for new assignments. This approach and investment contributes to our high employee retention rate. Promoting people from within is a long-standing tradition at UPS. These practices include:
• Part-time workers moving into full-time positions;• Nonmanagement employees moving into management
positions; and• Supervisors and managers moving into positions of
greater responsibility.
More than 74,100 current full-time drivers were once part-time employees, and more than 55,000 of our management team, including most vice presidents, were once nonmanagement employees. Our part-time workforce totaled approximately 198,580 people at any given point during the year. During the year, 18,285 part-time employees advanced to full-time work. As of year end, our management ranks included 5,250 employees who were promoted into management for the fi rst time. We encourage internal promotions by posting available positions through our employee portal in the United States on upsers.com.
We off er employees at all levels of the company a range of training and development options, and cultivate an environment that
encourages continuous learning. This strategy, which is ingrained in our culture, ensures employees have the skills and knowledge needed to perform their jobs successfully and inspires our people to achieve their greatest potential.
RecruitmentWe recruit talented people, regardless of their race, color, national origin, sex, gender identity, sexual orientation, age, disability, religion, or any other characteristic protected by law. We also strive to recruit people from within the local community, both in the United States and in our international locations. Among more than 47,940 full-time management employees, 230 came from outside the country or territory where they worked in 2016. The majority of our international senior management employees are working for UPS in their home countries or territories.
Communicating a compelling Employee Value Proposition (EVP) is key to our ability to successfully recruit a qualifi ed, diverse workforce in competitive markets. As we evolve our EVP to remain competitive in the labor market, we continually enhance recruitment messages in help wanted advertising, social media, recruitment events, and other communication vehicles.
We also are leveraging technology to improve the candidate experience in the recruitment process. In 2016, we updated upsjobs.com — the channel used by a majority of our applicants — making it more user-friendly, dynamic, and accessible through mobile devices. We also more than doubled the size of our social media team and continue to invest in our social mobile media strategy, which promotes upsjobs.com through Facebook, Twitter, Instagram, Snapchat, and other platforms. We are using a digital recruitment portal in 34 countries around the world and continue to explore ways of leveraging technology to improve the effi ciency, consistency, and accuracy of global recruitment eff orts. We also plan to expand to another 15 to 20 countries in 2017.
We are implementing innovative strategies to improve the eff ectiveness of our recruitment eff orts. The “Blue is New” program is designed to help newly hired employees in our hub operations. Created by the UPS Chicago Area Consolidation
32

33
Hub, the program improves the employee experience for new UPSers who wear a blue vest their first 30 days on the job. During this period, they receive daily interactions and follow-ups, and even a graduation celebration for completing their 30-day training cycle.
U.S. veterans are an ongoing focus of our recruitment eff orts. As part of the White House’s Joining Forces program, UPS committed in 2013 to hiring 50,000 veterans by the end of 2018 and supporting veterans and Veteran Service Organizations with 50,000 employee volunteer hours. We achieved this goal during 2016, when we hired 19,187 veterans. This brings our total to 64,376 veterans since making this pledge, and we have contributed over 140,000 volunteer hours with Veteran Service Organizations primarily through our Veteran Business Resource Group. Veteran-specifi c recruitment and
engagement tools have driven our success among this important demographic, and we continue to expand our efforts to recruit veterans.
We off er a website and free mobile app to help U.S. veterans and transitioning service members fi nd civilian careers. The UPS Veteran Career Gateway and the UPS Military Transition app provide a powerful set of tools and a vast library of information for the entire job search process at UPS and provides an ongoing resource. Additionally, many of the veterans we hire participate in our Veterans Business Resource Group, which off ers networking and learning opportunities specifi cally for veterans.
Training and DevelopmentOur approach to training and development is one of a shared responsibility among our company, individual UPSers, and their management teams. We off er a wide range of training and development opportunities that combine education, exposure, and experience for employees at every level of our organization. We connect employees with career development resources and support their decisions to take advantage of the vast opportunities at UPS.
Our development model enables UPSers to hone the skills needed to excel in their roles and achieve their long-term career goals. We are evolving toward a more self-directed development model in which UPSers and their managers collaborate to determine the most beneficial training programs and development opportunities. Training and development includes constructive feedback, coaching, and counseling from managers and co-workers. Employees receive formal and informal development delivered through live and virtual classrooms, as well as on the job and through committee participation and special assignments. Additionally, self-development opportunities are available around the clock through an extensive eLearning library in UPS University, our enterprise-wide learning management system.
Empowered People2.5 // Recruitment, Training & Development
A Life of Service“UPSers understand the importance and value of our
veterans,” explains Brian Ritchie, a UPS international
account executive. This U.S. Army airborne infantry
veteran joined UPS four years ago aft er earning his
degree through the GI bill. Brian credits his military
experience for successfully grooming him for a UPS
career with skills such as leadership, teamwork, and an
ability to operate eff ectively in a fast-paced environment.
He spends much of his time giving back to other veterans,
helping to launch and chair the Veterans BRG chapter
in the Northern Plains district, as well as volunteering
at numerous veterans’ outreach events. “Whether it’s
doing the right things for our employees in the National
Guard or Reserves who get deployed, or through
volunteer eff orts with organizations like the Paralyzed
Veterans of America, UPS has gone above and beyond
to support veterans and military members within our
organization and in our Communities.” 2016 Training by Employee Category
Employee Category
Average Number
of Training Hours
per Employee
Senior/Middle Management 41.8
Entry-Level Management 48.2
Administrative/Technical 5.9
Nonmanagement (Operations) 29.5
By Gender
Female 34.5
Male 36.2
Variable course durations updated in 2016 raised average training hours
and investment primarily among operations employees.
103-1 | 103-2 | 103-3 | 404-1 | 404-2

Empowered People2.5 // Recruitment, Training & Development
Tuition ReimbursementUPS off ers one of the most generous tuition reimbursement programs in the marketplace, helping college students fi nance their education and attend school while working part-time or full-time at UPS. Our Earn & Learn program provides a lifetime maximum of US$25,000 for a college education. While a great benefi t for employees, Earn & Learn is also an important recruiting and retention tool for UPS. The program helps us attract college students to fi ll many of our part-time positions, and turnover among program participants is signifi cantly lower than among nonparticipants. In 2016, UPS invested more than US$26 million in the college education of more than 24,000 employees. This investment included US$14 million in tuition support to approximately 10,800 UPS-employed students through our Earn & Learn program for part-time, non-union employees. Since the program began in 1997, UPS has invested more than US$575 million toward the college education of more than 270,000 UPS employees.
Development and Talent ManagementOur comprehensive talent management cycle encourages continuous employee development. Employees use an annual performance review, career development planning, and ongoing feedback to set measurable performance goals. This allows us to measure performance, recognize accomplishments, and identify areas for continued development.
Annual performance discussions, including leadership skills and multirater feedback reviews, prepare management teams to identify meaningful career development plans. In 2016, 91.5 percent of female management and 93 percent of male
management, respectively, received performance reviews. Through our career development process, management employees identify interests, aspirations, and plans for future professional growth. These discussions determine strengths and opportunities, and encourage individuals to focus on career goals.
In 2016, we introduced an Individual Development Plan (IDP) in a pilot program for full-time management within the Human Resources function. The IDP gives employees the autonomy to craft a development plan that is personalized to their individual needs and a targeted outcome. Along with their immediate manager, employees fi nalize the plan, which addresses development through a balanced combination of experience, exposure, and education. The IDP template is expected to be fully deployed in 2017 and serve as the model for development planning functionality within the new My Talent Center platform.
Given the strong growth in our international business, our International Management Development Program emphasizes accelerated development for critical roles with high impact on business performance. IMDP is customized by country to address the specifi c skills needed to succeed in each market, particularly at the country manager level.
US $834.5MTRAINING SPEND
On-the-Job LearningWhen Quateshia Hunt was promoted to full-time
supervisor at one of our Atlanta hub facilities in 2016, she
was well prepared with a degree in business leadership
from Ashford University. Quateshia earned that degree
with the help of UPS’s Earn & Learn program, which
enabled her to return to college. “The Earn & Learn
program gave me peace of mind to pursue and fi nish my
degree,” explains the 12-year UPSer. “By working part-
time, I was able to really focus on my studies. I don’t
think I would have gone back to school without that
support.” Learn more about the Earn & Learn program
at https://www.jobs-ups.com/earn-and-learn.
34
103-1 | 103-2 | 103-3 | 404-2 | 404-3

Empowered People2.5 // Recruitment, Training & Development
2016 EnhancementsDuring 2016, we focused a signifi cant amount of our training on providing employees with skills that empower and enable optimal performance. Enhancements during the year included expansion of UPS Integrad® training centers to West Boylston, Massachusetts, and Cologne, Germany — our fi rst UPS Integrad® site outside the United States. UPS Integrad training centers provide drivers and their direct supervisors with experiential training, modeled on the philosophy of “teach me, show me, let me.” The program uses a mixture of 3-D computer simulations, webcast learning modules, and traditional classroom instruction to complement hands-on safety, delivery, and customer service training in a controlled environment. UPS Integrad® has raised the bar on training, delivering signifi cant improvements in safety, customer experience, and turnover, compared to traditional training at the local level.
In 2016, all U.S. UPS Integrad® management teams were trained on the Master Driver Safety Training curriculum, which enables them to consistently teach this intense curriculum at Integrad sites around the country. Additionally, Freight Driver Safety Training curriculum was added as a pilot program at one UPS Integrad® site in 2016 and will be expanded to three sites in 2017. With the opening of our UPS Integrad® site in Germany, we off ered training to outside service providers (OSPs) for the
fi rst time. The training, which is delivered for a fee, helps ensure our OSPs meet our standards for safety and performance.
We plan ongoing investments in UPS Integrad® training facilities and curricula around the world. Near-term plans include a new center in the U.K., and up to three more centers in the U.S. Longer term, we plan to use the UPS Integrad® approach to capture its proven performance benefi ts in other areas, such as automotive technician training, tractor-trailer driving, and hub operations.
In 2016, approximately 383 employees participated in the On the Job Supervision (OJS) Methods Workshop, a practical, hands-on, fi ve-day course that trains UPS On-Road Supervisors to conduct eff ective OJS rides and post-OJS ride review meetings with UPS Driver Service Providers. The comprehensive training includes pre-course activities and pre-assessment in UPS University and a five-day, instructor-led workshop. The workshop includes a full-day OJS ride with a driver, a post-ride assessment to ensure mastery of content, a three-day OJS ride with a driver from the supervisor’s workgroup immediately following the course, and a post-course review meeting. After attending the workshop, participants have realized improved productivity as measured by stops per on-road hour and other measures.
35
103-1 | 103-2 | 103-3 | 404-2

2.6Labor Relations
36
Management Approach Everything we do requires trust and teamwork between labor and management. For example, few things matter to customers more than reliability. To maintain business continuity and minimize disruptions, we must maintain successful relationships with workers and their unions. All these factors make labor relations a material aspect for UPS.
We work closely with organized labor in the United States and employee representatives in all our international operations to build and maintain long-term, constructive, and mutually benefi cial relationships. We communicate frequently with our people and their unions at many levels of the company to ensure that all parties are working toward positive results for UPS employees and other major stakeholders. UPS also works with organized labor on key environmental issues. For several years we have served on the Corporate Advisory Board of the Blue-Green Alliance, a group of labor and environmental organizations, to discuss emerging environmental issues and solutions.
As a result of this management approach, we believe UPS is one of the most successfully unionized large companies in the United States. We employ more members of the International Brotherhood of Teamsters than any other company in the world. Approximately 2,600 pilots who fl ew for UPS Airlines in 2016 also belong to a union, the Independent Pilots Association (IPA).
Good-Faith BargainingWe bargain in good faith on all matters that involve our unions and the employees they represent. This includes dealing with union leaders at the national level and also working with local chapters of our unions throughout the United States. We train and develop our regional and national labor relations experts for years to prepare them for their responsibilities. We are not aware of any operations or suppliers in which the right to exercise freedom of association and collective bargaining may violate applicable laws or be at signifi cant risk.
In 2014, the Teamsters voted to approve a new National Master Agreement and related local agreements, which extends
through July 31, 2018, covering package delivery operations and freight operations. On September 1, 2016, the IPA voted to approve a new collective agreement covering our pilots, which will not become amendable until September 1, 2021. The results were overwhelming, with 98 percent of pilots voting and 92 percent approving the new agreement. This is an example of industry-leading participation and approval of good faith bargaining and the benefi ts of strong labor relations.
Health and Safety Provisions All of our United States collective bargaining agreements contain provisions that address the health and safety of union employees. These agreements include, but are not limited to, the following topics: health and safety committees, hazardous materials handling, vehicle and personal safety equipment, accidents, and reports.
102-41 | 103-1 | 103-2 | 103-3 | 403-4 | 407-1
UPS is one of the largest private-sector employers in the world, with more than 434,000
employees. We also are one of the largest unionized employers in the United States, with
more than 75 percent of our people in the U.S. covered by collective bargaining agreements,
including almost everyone who handles or transports packages.
36

37
Minimum Notice of Operational ChangesUPS’s collective bargaining agreements also include minimum notice periods regarding operational changes, which vary by master agreement and also according to specifi c requirements for local chapters of our unions. For example, the labor agreement covering U.S. package delivery operations requires a minimum notice period of 45 days.
Formal Grievance ProcessesAll our collective bargaining agreements in the United States have specifi c provisions regarding the methods for resolving grievances. These provisions mandate periodic meetings of union and company representatives, with escalation to the next level if the parties cannot agree on a resolution. Non-union employees have an alternative process available for dispute resolution. To help us maintain and enhance successful relationships with our unions, we do not publish the number of grievances related to collective bargaining agreements fi led, addressed, or resolved during current or prior reporting periods.
Benefi ts of Strong Labor RelationsThe constructive nature of our labor relations helps us in two vital areas of success for UPS: competitive excellence and exemplary safety. With respect to the former, winning in the marketplace is what enables us to pay high wages for union workers and support them in many other ways. Because our marketplace is both dynamic and competitive, we need fl exibility to adjust services, routes, and prices as conditions change. It is impossible to write all such detailed changes into union contracts, since they can run for up to seven years. The Joint Competition Committee meets to address competitive threats and takes action (between contracts) as necessary to protect our business and grow union jobs. For example, when other companies use non-union labor to off er lower rates than
we do for particular routes or services, the Competition Committee looks for solutions that enable UPS — and union workers — to compete effectively for the business. In the recent IPA collective agreement, a similar Competition Committee was formed to allow UPS — and IPA pilots — to better compete in the global market.
Safety is another area where we benefi t from strong labor relations. We continually seek to increase the safety of our facilities, equipment, and operating procedures, gathering ideas for improvements and upgrades from our Comprehensive Health and Safety Process (CHSP) members. There are more than 3,450 CHSP Health and Safety Committees worldwide, all of which are employee-led and supported by management. The framework for the CHSP allows for approximately 10 percent of the workforce to participate on safety committees, which represent all employees.
Our joint UPS-IPA Safety Task Force is another example of collaboration with employees to increase safety. The task force, composed of three members each from UPS management and the Independent Pilots Association, has worked with the Federal Aviation Administration, Boeing, Airbus, safety vendors, and other industry experts to examine in-fl ight fi re safety enhancements in airplanes.
Among the solutions UPS has implemented over the past six years are industry-first, fire-resistant package containers; quick-donning, full-face oxygen masks; enhanced customer and employee hazardous material training for aircraft shipments; deployment of Emergency Vision Assurance Systems; and continued research of fi re-suppression systems for cargo containers. Together, these solutions are providing a multilayered approach to signifi cantly enhance fl ight fi re safety.
Empowered People2.6 // Labor Relations
103-1 | 103-2 | 103-3 | 402-1 | 403-1

2.7Ethical Conduct
38
102-16 | 103-1 | 103-2 | 103-3 | 205-2
For more than a century, UPS employees have been motivated by the commonly held principles
and values established by our founders, and these remain critical to our success today.
The core of these values is a simple statement: UPS is a company of honesty, quality, and integrity. This legacy is fundamental to our ability to create shareowner value, support the communities in which we operate, and protect our reputation. Operating with integrity is something we strive to do every day to earn customer trust, and it is one of our most important values. We seek to demonstrate this in a number of ways, including the development of strong measures to prevent corruption and anti-competitive behavior, as well as ensuring compliance with applicable laws and regulations around the world.
Management ApproachOur management approach to ethical conduct is to adhere to our corporate governance structures, policies, and processes in the most transparent manner possible. The most senior UPS executives and governing bodies set a tone of compliance and ethical conduct from the top.
They also remain apprised of various aspects of the Business Conduct and Compliance Program. UPS executives and governing bodies receive reviews of relevant compliance programs on risk, management of third-party representatives, audits, self-audits, and other compliance areas.
The UPS Code of Business Conduct sets out the behavior we expect from our employees, the processes available to them for raising concerns about ethical conduct, and the channels we use to respond. Because we operate globally, the Code is available in 20 languages so that our employees, agents, and third-party representatives in other countries can fully understand our guiding principles. A broad base of employees also participates in training related to our Business Conduct and Compliance Program.
We provide refresher courses and job-specific courses on compliance and ethics to employees, using a risk-based approach to identifying the most appropriate audiences. Anti-corruption training is required for management, including management committee members. Of more than 37,000 eligible employees, 98 percent completed anti-corruption training as of the end of 2016.
Anti-Corruption and Anti-Competitive BehaviorUPS’s policy is to comply with applicable laws, rules, and regulations in countries where we operate. The UPS Code of Business Conduct includes policies and procedures that prohibit UPS employees, and the people acting on our behalf, from engaging in anti-competitive behavior or any unlawful activities, including violations of the U.S. Foreign Corrupt Practices Act, the U.K. Bribery Act, and other applicable anti-bribery laws, rules, and regulations.
In conducting business in more than 220 countries and territories worldwide, we work through numerous third parties. In order to mitigate the risk of corruption from third parties, we employ a due diligence process to vet third parties and monitor their compliance with UPS ethical standards. More detail on our Management of Third-Party Representatives can be found on page 51.
ComplianceAt UPS, we recognize ethical business practices can be a competitive advantage, enabling us to:
• Take strong, proven compliance practices and core values with us when we enter new markets;
• Identify suppliers that align with our approach to compliance; and
• Successfully identify, acquire, and integrate businesses that fi t into our culture of integrity.
Global Compliance ProcessUPS invests signifi cant resources in its Compliance & Ethics programs, inclusive of anti-corruption, antitrust, trade restrictions, and other risk areas. We conduct due diligence before entering into new business relationships, and we regularly review the work of our third-party representatives as a further check against compliance risks.
We have implemented a multilayered process to ensure measurable compliance eff ectiveness in our U.S. Domestic Package, International Package, and Supply Chain & Freight business entities. Our global compliance team facilitates this process for employees around the world.
38

39
The process starts with identifying and taking ownership of risks and then documenting processes and procedures to address those risks. Our compliance team then creates training programs and works with business unit managers to implement processes, procedures, and training programs. The global compliance team continually monitors data streams and other information sources that these compliance processes and procedures generate. The focus of this monitoring is to audit and improve our compliance systems and behaviors globally.
Risk Analysis and TrainingUPS managers and select nonmanagers receive training on compliance matters. We regularly review the UPS Code of Business Conduct with these employees, and we periodically conduct comprehensive training on ethics and compliance. In addition to this training, we analyze our business units for compliance risks. One of our primary tools is our Business Compliance and Ethics Questionnaire, which we use to survey our management team each year to identify events, situations, or relationships that could pose ethical or legal risks. There were 47,789 employees (100 percent of the identified audience) who completed the 2016 Business Compliance and Ethics Questionnaire.
Along with the training activities described above, we conduct systematic risk assessments, relying on multiple internal and external factors to determine which UPS sites should be audited in any given year. We then audit methodically for evidence of fraud, corruption, and other process defi ciencies. As part of our audit process, we also pay particular attention to signifi cant changes in a UPS business entity or its regulatory environment that could increase the risk of unethical practices or inadequate controls. In 2016, our corruption-specific risk assessment covered more than 220 countries and territories. We conducted 55 audits that included corruption testing, and 17 corruption-specifi c audits. These audits included businesses with which we have both direct and third-party relationships.
The information we generate through these activities goes to our senior management, up to and including the Management Committee, for prompt review and response. Organizational responsibility for our business conduct and compliance policies rests with our Nominating and Corporate Governance Committee of the Board of Directors and administratively with our Chief Financial Offi cer. Additionally, the UPS Audit Committee of the Board of Directors is responsible for overseeing the company’s compliance obligations related to auditing (both fi nancial and operational), accounting, and fi nancial reporting. The Chief Internal Audit and Compliance & Ethics Executive reports to this Audit Committee.
The Board of Directors has created a specifi c Risk Committee to provide oversight for management’s identification and evaluation of enterprise risks, including the company’s risk management framework and the policies, procedures, and practices employed to manage risks.
Raising ConcernsAt UPS, our employees are encouraged to raise concerns about compliance, ethics, or business conduct with their direct supervisor. Our policy is that employees will not face retaliation if they report in good faith about a violation or suspected violation of UPS’s legal, ethical, or policy obligations. Employees can contact any manager or the Human Resources representative for their respective department.
Employees may also submit a report to the UPS Help Line online or by phone. Both of these channels are monitored by an independent service provider and are available 24 hours a day, 7 days a week, and reports may be anonymous. Translators are available to assist when needed.
In 2016, UPS received more than 8,000 reports of employee concerns through the UPS Help Line and other reporting avenues. We investigated these cases and took corrective or disciplinary action where appropriate. In 2016, we also enhanced our data analytics to enable managers in Human Resources to see and respond to reporting trends in their area of responsibility.
Empowered People2.7 // Ethical Conduct
Package Contents ResponsibilityIn our 2016 corporate materiality assessment, the
issue of package contents responsibility emerged
as an important topic. This issue refers to policies
and protocols related to UPS shippers who tender
regulated goods into our system. UPS requires that
the shipper only tender packages for shipment that
comply with all applicable laws and regulations. UPS
prohibits shipments that are unlawful under applicable
federal, state, or local law. UPS may also, in its discretion,
determine that carriage of a particular commodity
is not feasible.
103-1 | 103-2 | 103-3 | 102-17 | 205-1

40
Economic Enhancement
03
3.1 Economic Performance ........................................................42
3.2 Global Trade & Emerging Markets ..................................46
3.3 Supply Chain Management ...............................................50
3.4 Data Privacy ................................................................................54
3.5 Digital & Physical Asset Security ......................................56
3.6 Humanitarian Relief & Resilience ....................................57
3.7 Sustainable Shipping & Supply Chain Off erings .....62

The Road Ahead“Imagine a system in which big data and analytics combine to predict, in real time and with near certainty, the fastest way to move any package from point A to point B. The data would even tell us who should drive the delivery vehicle. We could help eliminate customers’ chronic inventory problems by ensuring supply never outpaces demand. Analytics can also revolutionize how we manage our fl eet, providing insight into vehicle performance, fuel consumption, and route information — essentially the equivalent of a check-engine light on steroids. Big data is ushering in a new era
of innovation and accelerating advancements that enable us — and our customers — to operate more effi ciently and more sustainably.”
Juan Perez, Chief Information and Engineering Offi cer
41
PROUD PAST1913, Seattle, Washington
UPS began using motorcycles and a Ford Model T truck to consolidate
deliveries so all packages for a specifi c neighborhood would be loaded
onto the same vehicle, maximizing use of resources while keeping
expenses low.

3.1Economic
Performance
102-1 | 102-7 | 102-10 | 102-15 | 103-1 | 103-2 | 103-32 | 201-1
We underscore the importance of economic performance by using it as one of two foundational
reference points by which we defi ne all other material issues. Economic performance is defi ned
as our most material aspect because, like most companies, our economic success ensures our
long-term viability and enables the execution of our sustainability strategies.
Management ApproachOur primary role in society is to enable commerce by connecting individuals and organizations in more than 220 countries and territories. Customers utilize our broad logistics capabilities, global presence, industry-leading technologies, and solutions expertise to build competitive advantages in their respective markets.
We have a long history of producing strong fi nancial results, maintaining a solid balance sheet and high credit rating, distributing dividends, cultivating brand and customer loyalty, and positioning our business to capitalize on growth trends. Today, these trends include increased expertise in the integrated carrier space, logistics outsourcing, expansion of global trade, emerging market growth, and e-commerce growth in the retail sector.
Our business contributes to sustainability by making logistics as resource-effi cient as possible — and far more effi cient than customers could accomplish on their own. To do so, we:
• Meet customer needs by utilizing a broad range of transportation modes — airplanes, trains, ships, trucks, cars, carts, bicycles, and more — to reduce our impact on the environment;
• Achieve optimal effi ciency by equipping, loading, and routing every vehicle and airplane we own to maximize shipments on board and minimize the miles traveled;
• Operate a single, integrated transportation network rather than multiple, redundant networks for similar types of services;
• Help test the potential of innovative reduced-emission technologies through our rolling laboratory that encompasses a large and diverse fl eet of alternative fuel and advanced technology vehicles;
• Minimize energy, water, and material use in our facilities through design, maintenance, and multiclient use;
• Reduce unnecessary visits to customer locations and the associated environmental impact through services such as UPS My Choice® program, the UPS Access Point™ network, and UPS Smart Pickup® option; and
• Help customers make their supply chains more effi cient and manage their carbon footprint more successfully by off ering logistics consulting services.
UPS Financial Highlights
(in US$) 2016 2015
Revenue $ 60.9 billion $ 58.4 billion
Operating Costs $ 55.4 billion $ 50.7 billion
Employee
Compensation &
Benefi ts
$ 34.8 billion $ 31.0 billion
Taxes Paid* $ 3.6 billion $ 4.2 billion
Long-Term Debt Repaid $ 3.8 billion $ 2.7 billion
Dividends Paid to
Shareholders**$ 2.8 billion $ 2.5 billion
Payments to Small &
Diverse Suppliers$ 989.0 million $ 943.0 million
Total Charitable
Contributions$ 116.6 million $ 110.0 million
Retained Earnings*** $ 4.9 billion $ 6.0 billion
In 2016, we signifi cantly increased the resource effi ciency of our integrated network, further enhancing the sustainable value proposition we off er customers. We expanded deployment of our proprietary routing soft ware, ORION, to 100 percent of U.S. delivery routes where it was targeted for implementation.
42
* Additional payments funding our employee benefi t plans, which were
deductible for income tax purposes, resulted in a lower tax liability in
2016 compared to 2015.
** Dividends Paid to Shareholders comprised total cash and non-cash
dividends; 2015 and earlier Reports only included cash dividends.
*** Retained earnings were lower than previous year due to mark-to-market
of pension and post-retirement plans.

43
This investment is expected to result in annual savings of 10 million gallons of fuel and a reduction of 100,000 metric tonnes of CO2 emissions. We continued automation of our hub operations to realize productivity improvements of up to 25 percent. We realized expected synergies in procurement, asset utilization, and cross-selling from our 2015 acquisition of Coyote Logistics. We also announced a contract to purchase 14 new Boeing 747-8 freighter jets for delivery between 2017 and 2020 to help meet our customers’ future capacity needs while reducing fuel use and emissions.
We report on the structure of our organization, changes in structure, and financial performance primarily through www.investors.ups.com. In this Report, we focus on economic performance as it relates to sustainability. The organizational entities covered by this Report are those presented in our Annual Report. This report includes data from UPS subsidiary Coyote Logistics among our fi nancial data and greenhouse gas inventories, but not included in our employee counts.
Understanding Climate Eff ects on Our BusinessClimate change presents both opportunity and risks to the economic performance of our business. From an opportunity perspective, we reduce the emissions intensity of global supply chains by delivering goods more effi ciently through our optimized network than customers would be able to do on their own. This capability will grow and become even more important as emerging markets develop, global population increases, and the f low of goods and services expands. In addition, we believe our ability to operate even more eff ectively will increase because of our proven capabilities for measuring, managing, and mitigating greenhouse gas (GHG) emissions, the emergence of new technology innovations, and ongoing collaboration with stakeholders.
Our main economic risk currently related to climate change is a regulatory risk: the possibility that countries or regions of the world will increase regulation of GHG emissions to include significant new taxes, fees, or other costs for transportation and logistics companies. It is impossible to quantify this risk today because different countries, regions, and states are following diff erent paths with regard to climate change and associated regulation. Our main strategies for managing this risk include continually improving the fuel efficiency and emissions efficiency of our business, as well as educating policymakers and the public about our contributions to making commerce more carbon-efficient for millions of companies.
Direct Economic Benefi tsWe are one of the world’s largest private employers, with a commitment to creating good jobs with competitive pay and benefi ts. As of year-end 2016, we employed more than 434,000 people (excluding temporary seasonal employees), of which 79,000 were located outside the U.S. In 2016, we paid US$34.8 billion in compensation and benefi ts for full-time and part-time employees.
In addition, we pay taxes to local and national governments around the world that help fund schools, community infrastructure, and public services. In 2016, UPS paid US$3.6 billion in taxes worldwide.
UPS Tax Policy UPS’s fundamental tax policy is to ensure the tax results for all our global entities are properly reported in accordance with applicable laws, rules, and regulations. We operate our business where our customers are located, so while tax management is important to the company, how and where we conduct business activities aligns with our goal of providing superior customer service and shareholder value. We consider UPS’s reputation, brand, and corporate responsibility when we evaluate our tax positions. Accordingly, we enter only into structures or transactions designed to further our commercial purpose. We believe in transparency and work to develop positive relationships with tax authorities based on trust and professional interactions. Where appropriate, we proactively seek agreement with tax authorities on positions taken on our tax returns.
Economic Enhancement3.1 // Economic Performance
102-10 | 102-15 | 103-1 | 103-2 | 103-3 | 201-1 | 201-2

Economic Enhancement 3.1 // Economic Performance
Indirect Economic Benefi tsOur business generates a wide range of indirect economic benefi ts, including charitable contributions, access to markets through our local points of presence in the form of retail outlets, procurement activity throughout our supply chain, and venture capital funding. Our support of and advocacy for free trade around the world benefi ts businesses, communities, and countries of all sizes. Similarly, continual investments in our global logistics network — rather than infrastructure and specifi c services — benefi t all of our communities by facilitating commerce and providing jobs.
We also use our scale to stimulate the markets for alternative fuels and advanced fl eet technologies. Our continued investments help drive supply and demand for these promising solutions. UPS is also investing in technology and network enhancements to help make healthcare more accessible and eff ective. At the end of 2016, we acquired Marken, a global provider of supply chain solutions to the life sciences industry. This acquisition will bolster our global network of clinical supply chain services to meet clients’ increasingly complex demands. We fi eld one of the largest dedicated networks of facilities and related services for suppliers of healthcare products, and we continue to invest in this network around the world.
Charitable ContributionsThe Key Performance Indicator for indirect economic benefi t is the sum of our charitable contributions by UPS; The UPS Foundation (our corporate citizenship arm); and UPS employees, retirees, and their families. In 2016, total charitable contributions were US$116.6 million, an increase of US$6.6 million over 2015. In addition, UPSers contributed 2.7 million volunteer hours in 2016, which had an economic value of US$70.2 million, based on the U.S. Bureau of Labor Statistics’ valuation of volunteer time, which is tracked by our Neighbor to Neighbor system.
Solely funded by UPS, The UPS Foundation provides cash contributions to organizations that promote its four focus areas: Diversity and Inclusion, Global Volunteerism, Community Safety, and Environmental Sustainability. Our in-kind donations are composed primarily of transportation services, including ground, ocean, and air shipments to and from 50 countries for humanitarian relief and resilience eff orts in 2016 (see page 57). Charitable contributions also include a 15 percent match of employee pledges to United Way, a major nonprofi t provider of community-based social services.
Local Points of PresenceWe provide more than 150,000 local entry points around the world where customers can tender a package to us at a location or time convenient to them. These entry points include our drivers, drop boxes, UPS Access Point™ locations, and The UPS Store® locations, as well as authorized shipping outlets and commercial counters and customer centers attached to UPS facilities. Local entry points provide customers with one-stop access to our global network, which helps small and diverse businesses participate more fully in the global economy.
We also provide substantial indirect support for more than 4,900 The UPS Store® franchise locations in the United States and Canada, to help them serve the businesses around them. The UPS Store, for example, was the fi rst nationwide retailer to off er 3D printing services in-store; today more than 60 locations provide the service.
44
Total Charitable Contributions
Program Area Year ended December 31, 2016
Allocation (US$ in millions)
Local Grants $ 9.8
Corporate Grants $ 23.8
In-Kind Services $ 5.8
Internal Scholarship Programs $ 2.0
United Way Corporate
Contribution$ 8.6
Charitable Contributions
and Sponsorships$ 9.1
The UPS Foundation
Contribution Total$ 59.1
United Way Employee
Contribution (active and retired)$ 57.5
Total Charitable Contributions $116.6
103-1 | 103-2 | 103-3 | 203-1 | 203-2

Economic Enhancement3.1 // Economic Performance
Since 1997, we have explored emerging markets and technologies
through the UPS Strategic Enterprise Fund (SEF), our venture
capital investment arm. We view the SEF as a window to the
future that enables UPS to learn from companies directly involved
in the new economy. The knowledge we gain through SEF
investments helps broaden our perspectives on how to better
speed the fl ow of goods, information, and funds. We proactively
research and evaluate companies in promising markets,
including fast-growth international markets and consumer
groups; related emerging technologies that support mobile,
social, and e-commerce; and new business models, such as
those related to the sharing economy, digital communities,
and smart cities.
For example, UPS is a minority stake investor through the SEF
in Fast Radius, a provider of additive manufacturing services —
also known as 3D printing — to aerospace, automotive, and
medical industries. These services have the potential to
transform manufacturing and supply chains in the same way
that e-commerce has transformed retail supply chains.
Companies can now begin to virtualize parts inventories,
producing small quantities closer to where they are needed,
with less energy and materials, as well as reducing lead
times and inventory cost.
Fast Radius operates a 3D printing factory at our Louisville air
cargo hub. In the U.S., customers can have parts printed at the
Fast Radius factory or at one of more than 60 The UPS Store®
locations equipped with 3D printers, and then have the parts
shipped to their sites. In 2016, Fast Radius opened a 3D printing
factory in Singapore, extending our 3D printing network to Asia.
Future plans include an additional site in Europe. Another example
of an SEF investment is Optoro, a reverse logistics technology
platform that helps retailers and manufacturers manage, process,
and sell returned and excess inventory. Optoro’s reverse logistics
solutions also help support circular economy principles for retailers.
The SEF usually invests in early-stage, privately held companies
during their venture capital phases. By working together, UPS is
able to help accelerate the growth of these early-stage companies
while also advancing UPS’s knowledge of emerging technologies
and new business models.
45
Investments that Yield Knowledge Returns

3.2Global Trade &
Emerging Markets
Global trade enhances economies by stimulating growth and new opportunities for employment
and entrepreneurship, creating a ripple eff ect as businesses enter new markets and hire more
workers, which in turn helps those workers support their families and communities.
46
Trade plays an important role in reducing poverty in many parts of the world. Trade facilitation reforms, for example, have a disproportionate benefi t in developing countries, according to the Organization for Economic Cooperation and Development and World Bank. Customs modernization helps countries in Africa and Latin America better access global value chains, unlocking opportunities that create jobs, fuel middle-class growth, and create new consumers of goods and services. Small businesses, which represent the vast majority of businesses in most economies, gain access to new customers and markets, and generate higher standards of living for their owners and workers.
The long-dominant view in the United States and other advanced economies in support of globalization and trade liberalization is increasingly challenged. Trade skeptics have won elections on multiple continents. A global economy struggling
to gain momentum, automation trends that have changed skill requirements, and the greater availability of social media and other tools to express opposition are among the reasons for the stepped-up backlash against trade. Part of the response to these trends must be a renewed focus on the importance of worker retraining. The public and private sectors must play a role in ensuring that workers are prepared for the jobs of the 21st century.
As a global logistics company, connecting customers to new economic opportunities is an intrinsic outcome of our business. Given that our business moves nearly 2 percent of global GDP each day, we have a unique and broad perspective of international trading patterns and of development opportunities in emerging markets.
Forty years aft er UPS Germany began delivering packages, fi ve “day one” Germany UPSers, Dieter Weiss, Rüdiger Ernst, Klaus Stolpe, Siegfried Nolte, and Manfred Rost, celebrate their continued service to UPS.
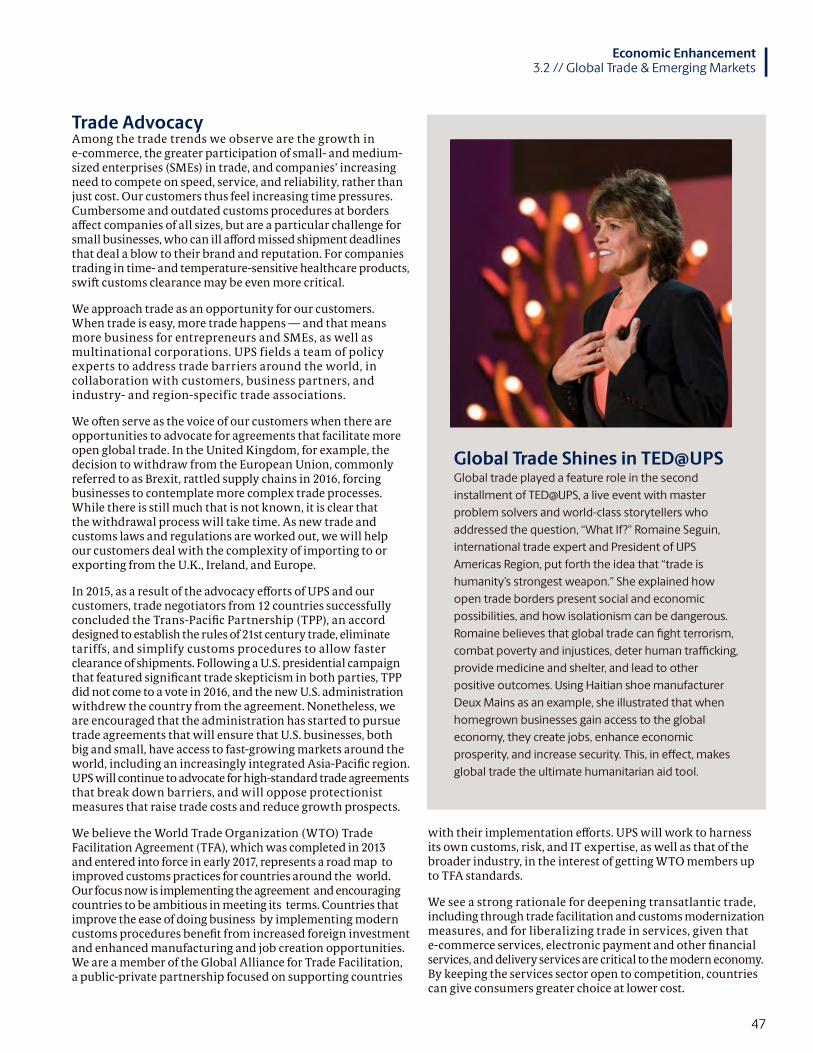
47
Trade AdvocacyAmong the trade trends we observe are the growth in e-commerce, the greater participation of small- and medium- sized enterprises (SMEs) in trade, and companies’ increasing need to compete on speed, service, and reliability, rather than just cost. Our customers thus feel increasing time pressures. Cumbersome and outdated customs procedures at borders aff ect companies of all sizes, but are a particular challenge for small businesses, who can ill aff ord missed shipment deadlines that deal a blow to their brand and reputation. For companies trading in time- and temperature-sensitive healthcare products, swift customs clearance may be even more critical.
We approach trade as an opportunity for our customers. When trade is easy, more trade happens — and that means more business for entrepreneurs and SMEs, as well as multinational corporations. UPS fields a team of policy experts to address trade barriers around the world, in collaboration with customers, business partners, and industry- and region-specific trade associations.
We oft en serve as the voice of our customers when there are opportunities to advocate for agreements that facilitate more open global trade. In the United Kingdom, for example, the decision to withdraw from the European Union, commonly referred to as Brexit, rattled supply chains in 2016, forcing businesses to contemplate more complex trade processes. While there is still much that is not known, it is clear that the withdrawal process will take time. As new trade and customs laws and regulations are worked out, we will help our customers deal with the complexity of importing to or exporting from the U.K., Ireland, and Europe.
In 2015, as a result of the advocacy eff orts of UPS and our customers, trade negotiators from 12 countries successfully concluded the Trans-Pacifi c Partnership (TPP), an accord designed to establish the rules of 21st century trade, eliminate tariffs, and simplify customs procedures to allow faster clearance of shipments. Following a U.S. presidential campaign that featured signifi cant trade skepticism in both parties, TPP did not come to a vote in 2016, and the new U.S. administration withdrew the country from the agreement. Nonetheless, we are encouraged that the administration has started to pursue trade agreements that will ensure that U.S. businesses, both big and small, have access to fast-growing markets around the world, including an increasingly integrated Asia-Pacifi c region. UPS will continue to advocate for high-standard trade agreements that break down barriers, and will oppose protectionist measures that raise trade costs and reduce growth prospects.
We believe the World Trade Organization (WTO) Trade Facilitation Agreement (TFA), which was completed in 2013 and entered into force in early 2017, represents a road map to improved customs practices for countries around the world. Our focus now is implementing the agreement and encouraging countries to be ambitious in meeting its terms. Countries that improve the ease of doing business by implementing modern customs procedures benefi t from increased foreign investment and enhanced manufacturing and job creation opportunities. We are a member of the Global Alliance for Trade Facilitation, a public-private partnership focused on supporting countries
with their implementation eff orts. UPS will work to harness its own customs, risk, and IT expertise, as well as that of the broader industry, in the interest of getting WTO members up to TFA standards.
We see a strong rationale for deepening transatlantic trade, including through trade facilitation and customs modernization measures, and for liberalizing trade in services, given that e-commerce services, electronic payment and other fi nancial services, and delivery services are critical to the modern economy. By keeping the services sector open to competition, countries can give consumers greater choice at lower cost.
Global Trade Shines in TED@UPSGlobal trade played a feature role in the second
installment of TED@UPS, a live event with master
problem solvers and world-class storytellers who
addressed the question, “What If?” Romaine Seguin,
international trade expert and President of UPS
Americas Region, put forth the idea that “trade is
humanity’s strongest weapon.” She explained how
open trade borders present social and economic
possibilities, and how isolationism can be dangerous.
Romaine believes that global trade can fi ght terrorism,
combat poverty and injustices, deter human traffi cking,
provide medicine and shelter, and lead to other
positive outcomes. Using Haitian shoe manufacturer
Deux Mains as an example, she illustrated that when
homegrown businesses gain access to the global
economy, they create jobs, enhance economic
prosperity, and increase security. This, in eff ect, makes
global trade the ultimate humanitarian aid tool.
Economic Enhancement3.2 // Global Trade & Emerging Markets

Emerging MarketsEmerging market opportunities continue to expand our business. These markets are a destination for trade and investment and an engine of growth for current customers, and will also be a focus for our next generation of customers. That’s why we’re making long-term investments where our customers choose to grow. During the past decade, we’ve established a strong presence in leading emerging markets such as China, Poland, Southeast Asia, and Turkey and expect that other markets in Africa, Eastern Europe, Latin America, and the Middle East will become increasingly important for our business.
Africa, in particular, represents signifi cant opportunity, given its large and young population, and growing markets. We see great growth potential in countries across the four corners of Africa, including Kenya, Morocco, Nigeria, and South Africa. We support the African Leadership Academy (ALA) in Johannesburg, South Africa, which seeks to develop a network of more than 6,000 leaders who will work together to address Africa’s greatest challenges, improve social impact, and accelerate the continent’s growth trajectory. ALA identifi es individuals between the ages of 16 and 19 who have demonstrated leadership potential, an entrepreneurial spirit, and a track record of community
service. These young leaders come together for a two-year, pre-university program on entrepreneurial leadership and African studies at a boarding institution in Johannesburg. UPS supports the program fi nancially and seeks to employ individuals as interns while they attend university.
We approach emerging markets with long-term, tailored solutions to meet the unique needs of each country in an effi cient, sustainable way. We typically partner with third parties that have established capabilities and expertise at the local level. These include authorized service contractors or third-party service agents, who are trained and managed to properly represent UPS.
Inclusive Growth Partnerships To support the sustainability of global trade, UPS recognizes the importance of engaging domestic stakeholders, small businesses, and all segments of society to support inclusive growth. This is why we have continued to engage partners throughout the world in providing expertise on import/export procedures, supply chain management, process optimization, and other advanced solutions to improve their overall effi ciency.
48
Economic Enhancement 3.2 // Global Trade & Emerging Markets

49
The UPS Outside Growth Partner program is a cornerstone of our eff ort to engage local logistics companies to help them upgrade, connect to global networks, and service international customers. Working with qualified partners, UPS conducts training in operation, safety, security, and service while sharing our brand, market strategy, and over 100 years of operational best practices. The program combines UPS’s strength in global networks and advanced logistics solutions with local knowledge and entrepreneurship to facilitate the expansion of reach to more geographical locations, better service, and collaborative growth between big and small business. Today, such partnerships support growth in many parts of Europe, China, Indonesia, Korea, Philippines, Taiwan, and Thailand.
Global Supply Chain ReadinessIn Southeast Asia, we continue to work with the US-Association of Southeast Asian Nations Business Alliance for Competitive Small and Medium Enterprises on its multiyear capacity-building
program. During 2016, UPS and its Alliance partners conducted workshops in six countries for more than 600 participants, training small businesses on the basics of exporting, how to leverage logistics to maximize productivity, and how to better service lead fi rms in the automotive, healthcare, technology, and e-commerce sectors.
In Singapore, UPS established a partnership with Autistic Center Pathlight and its handicraft retail store to fulfill a surge in customer orders, and build a longer-term delivery and fulfi llment strategy. Our partnership with Gender Responsive Economic Actions for the Transformation of Women in ASEAN supports artisans and entrepreneurs from 10 Southeast Asian countries through global branding and marketing eff orts, as well as leadership in the professional network of Women in Trade that has helped to include additional segments of society — such as small business, entrepreneurs, and women — in international trade.
Economic Enhancement3.2 // Global Trade & Emerging Markets
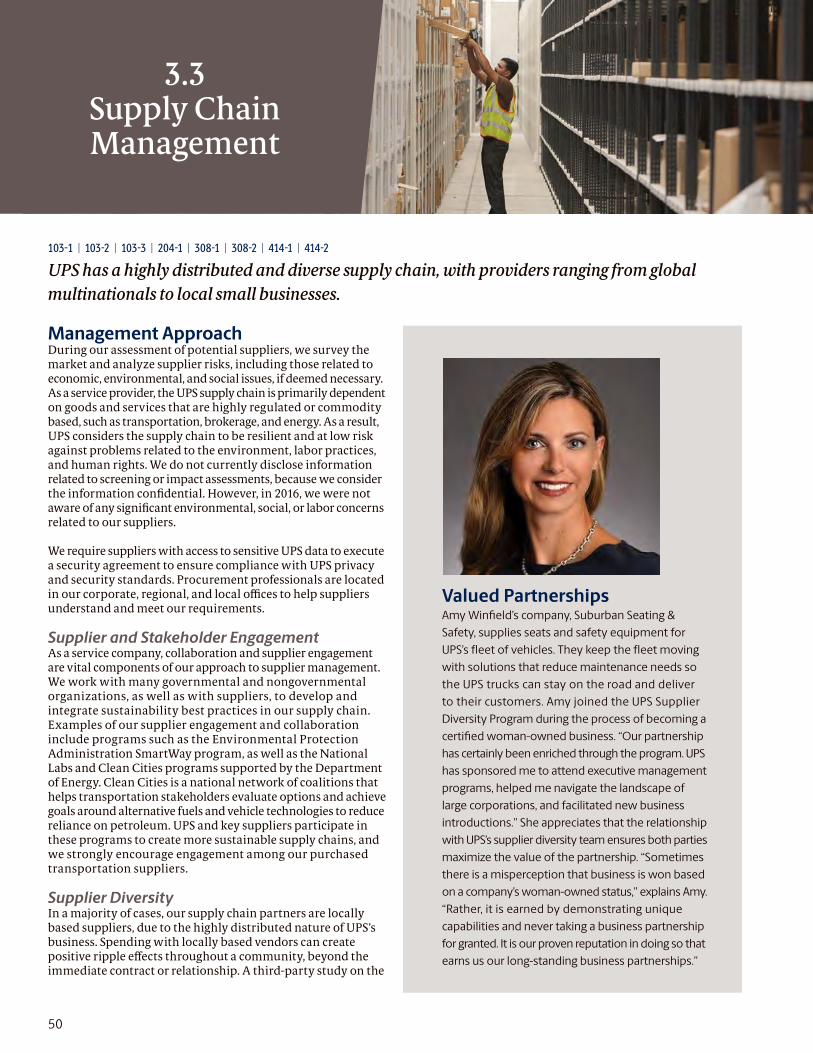
3.3Supply Chain Management
103-1 | 103-2 | 103-3 | 204-1 | 308-1 | 308-2 | 414-1 | 414-2
UPS has a highly distributed and diverse supply chain, with providers ranging from global
multinationals to local small businesses.
50
Management ApproachDuring our assessment of potential suppliers, we survey the market and analyze supplier risks, including those related to economic, environmental, and social issues, if deemed necessary. As a service provider, the UPS supply chain is primarily dependent on goods and services that are highly regulated or commodity based, such as transportation, brokerage, and energy. As a result, UPS considers the supply chain to be resilient and at low risk against problems related to the environment, labor practices, and human rights. We do not currently disclose information related to screening or impact assessments, because we consider the information confi dential. However, in 2016, we were not aware of any signifi cant environmental, social, or labor concerns related to our suppliers.
We require suppliers with access to sensitive UPS data to execute a security agreement to ensure compliance with UPS privacy and security standards. Procurement professionals are located in our corporate, regional, and local offi ces to help suppliers understand and meet our requirements.
Supplier and Stakeholder EngagementAs a service company, collaboration and supplier engagement are vital components of our approach to supplier management. We work with many governmental and nongovernmental organizations, as well as with suppliers, to develop and integrate sustainability best practices in our supply chain. Examples of our supplier engagement and collaboration include programs such as the Environmental Protection Administration SmartWay program, as well as the National Labs and Clean Cities programs supported by the Department of Energy. Clean Cities is a national network of coalitions that helps transportation stakeholders evaluate options and achieve goals around alternative fuels and vehicle technologies to reduce reliance on petroleum. UPS and key suppliers participate in these programs to create more sustainable supply chains, and we strongly encourage engagement among our purchased transportation suppliers.
Supplier DiversityIn a majority of cases, our supply chain partners are locally based suppliers, due to the highly distributed nature of UPS’s business. Spending with locally based vendors can create positive ripple eff ects throughout a community, beyond the immediate contract or relationship. A third-party study on the
Valued PartnershipsAmy Winfi eld’s company, Suburban Seating &
Safety, supplies seats and safety equipment for
UPS’s fl eet of vehicles. They keep the fl eet moving
with solutions that reduce maintenance needs so
the UPS trucks can stay on the road and deliver
to their customers. Amy joined the UPS Supplier
Diversity Program during the process of becoming a
certifi ed woman-owned business. “Our partnership
has certainly been enriched through the program. UPS
has sponsored me to attend executive management
programs, helped me navigate the landscape of
large corporations, and facilitated new business
introductions.” She appreciates that the relationship
with UPS’s supplier diversity team ensures both parties
maximize the value of the partnership. “Sometimes
there is a misperception that business is won based
on a company’s woman-owned status,” explains Amy.
“Rather, it is earned by demonstrating unique
capabilities and never taking a business partnership
for granted. It is our proven reputation in doing so that
earns us our long-standing business partnerships.”

51
Economic Enhancement3.3 // Supply Chain Management
economic impact of our 2016 spending with small businesses, as well as minority-, women-, veteran-owned, and other diverse suppliers, found that UPS contributed more than US$2.4 billion to the U.S. economy (U.S. GDP) and sustained more than 15,700 jobs in the supply chain and local communities. A breakdown of that US$2.4 billion includes US$989 million in direct economic benefi t from suppliers’ operations and activities; US$653 million in indirect impact from the economic benefi t and employment supported in the suppliers’ respective supply chains from procuring goods and services; and US$806 million in community impact from the wider economic benefi ts that arise when the suppliers’ employees and those in their supply chains spend their earnings.
Overall, for every million dollars that we spend with small and diverse suppliers, 16 jobs are created with those companies in their local communities. In 2016, UPS spent approximatelyUS$989 million in procurement with small and diverse businesses in the United States.
We introduced key initiatives in 2016 with the goal of signifi cantly increasing spending with diverse suppliers:
• Coordinating our eff ort to identify more diverse suppliers in areas including plant engineering, automotive, air and transportation; and
• Joining WeConnect International, a global network to identify and certify women-owned businesses outside the U.S. and connect them with the global supply chain. Our director of supplier diversity serves on its board of directors.
Management of Third-Party RepresentativesAs our business grows, we are entering into more contractual relationships with third parties, such as agents, providers, outside service providers (OSPs), and authorized service contractors (ASCs), who may interact with government offi cials or outside parties on behalf of UPS. It is vital that all third-party representatives convey UPS’s integrity and commitment to compliance when they represent our brand, products, and services in the marketplace.
We utilize a risk based third-party due diligence process which requires us to assess candidates’ ownership, fi nancial transparency, local licensure status, compliance record, labor practices, environmental practices, and more. This information is then recorded in our own proprietary global database to enable more eff ective ongoing monitoring and auditing of these third-party relationships.
The UPS Code of Business Conduct, which applies to UPS entities globally, governs our relationships with third-party representatives. We direct them to the Code as part of the Supplier’s Principles Agreement provided during the proposal process, and they must certify they have read the Code and are aware that compliance with the Code is both expected and subject to audit.
To ensure the requirements of the UPS Code of Business Conduct are clear, we produce an Anti-Corruption Compliance Manual for Third-Party Representatives. This manual, available in 20 languages, further explains our expectations and requirements, including the need to report actual or suspected compliance violations.
As a provider of logistics and transportation services, we are an important component of our customers’
supply chains. But we also have our own supply chain and work with vendors that help us provide our services.
This graphic shows our major supply chain categories. Our most material categories include purchased
transportation from third parties, such as airlines, railroads, ocean carriers, and other trucking carriers; energy to
fuel our ground and air fl eet; and air and ground fl eet purchases and maintenance.
Production SuppliersTransport Process
CapacitySuppliersCapacity Process
Support SuppliersBack Offi ce Process
Purchased Transportation & Energy Vehicles, Aircraft ,
Facilities &
Equipment
Financial,
Administrative
& Support
Services
Our Supply Chain
102-9 | 103-1 | 103-2 | 103-3 | 204-1 | 205-2

52
Our Supply ChainAs UPS is a service provider, our supply chain partners tend to be other service providers, rather than raw material or fi nished goods suppliers, and can be broadly grouped into three categories:
Production SuppliersProduction suppliers, which represent the majority of our total procurement spending, provide purchased transportation services and energy to operate our global logistics network. At the regional and country levels, we regularly contract with a large pool of suppliers of transportation services, such as airlines, trucking companies, railroads, and ocean carriers, as well as suppliers of fuel for our vehicles and air fl eets. A complete discussion of our approach to purchasing fuel can be found on page 70.
We also contract with third-party representatives that provide domestic delivery services in certain countries and territories on behalf of UPS. These third-party representatives may be referred to in other UPS documents or policies as agents, providers, outside service providers, or authorized service contractors. It is vital that all third-party representatives convey UPS’s trustworthiness and commitment to compliance when they represent our brand, products, and services in the marketplace. We consider eff ective management of such representatives as material to our sustainability.
Capacity SuppliersThis category includes the equipment and facilities we purchase, build, and maintain. Our supply chain includes a number of suppliers of strategic, high-value assets that we purchase in limited numbers in select years, such as jet aircraft and alternative fuel or advanced technology vehicles. We work on a continual basis with original equipment manufacturers to design and develop our ground and air fl eets in a way that minimizes their environmental impacts.
Support SuppliersWe purchase standardized products and services that support our business. These suppliers provide products and services in the areas of marketing, advertising, human resources, shipping materials, and other professional services.
How Diesel Goes ElectricWe’re expanding our fl eet of alternative fuel vehicles by transforming diesel package cars into
electric vehicles. The conversion not only eliminates tailpipe emissions, but also extends the life
of package cars and the materials within them.
Site Selection
Locations are
selected based on
the power supply
available, electricity
generation method,
duty-cycles, and
additional criteria.
Vehicle Selection
Vehicles are chosen
based on their type,
age, and condition.
Retrofi t
The vehicle is stripped
of its traditional
powertrain to make
room for a new
electric propulsion
system.
Power Up
Electric vehicle is
inspected upon
return to the UPS
facility, and charged
up for use.
Deployment
“Diesel-to-electric”
vehicle is now ready
to deliver packages
with reduced noise
and zero tailpipe
emissions.
1 2 3 4 5
102-9 | 103-1 | 103-2 | 103-3
Economic Enhancement 3.3 // Supply Chain Management

53
Economic Enhancement3.3 // Supply Chain Management
Air pollution, noise, congestion, climate change —
these issues are on the minds of policymakers in cities
around the world, and they are the challenges that
ElektroFahrzeuge-Stuttgart GmbH (EFA-S) is tackling
every day. The European Union and other government
bodies have passed laws to categorize vehicles according
to their emissions levels and restrict high-emissions
vehicles from accessing certain urban areas. Eventually,
only noiseless, zero-emissions vehicles may be permitted
to drive in European city centers.
Many vehicle manufacturers have responded by developing electric vehicles
to meet these new standards. But what about vehicles already on the roads?
For many businesses, transportation fleets are a major investment, and
replacing them is a complex aff air. That’s where EFA-S comes in. We can
convert any diesel- or gas-powered vehicle to an electric one, which lowers
vehicle emissions, reduces noise and allows businesses to meet many inner
city transportation regulations.
Partnering with UPS has been a breakthrough for us. Although we are a small business, EFA-S and UPS share the same values of quality
and continuous improvement, and we are able to provide a service not available elsewhere. In 2010, UPS asked for our help converting
its P80 delivery van, which had been in operation in Bavaria since 1995. At the time, no electric vehicle existed in the 7.5-ton class, and
all electric delivery vans that were available were compromised by signifi cant loss of payload and loading capacity. Moreover, purchasing
new package cars off ered no solution for the many reliable and eff ective P80s UPS already had invested in. We managed to convert the
vehicle without any restrictions, solving the challenges of both operational excellence and sustainability.
Six years later, in 2016, the 100th electric vehicle in UPS’s European delivery fl eet hit the streets of Paris, made possible by EFA-S. This
model, the P45E, can carry up to 3.5 tons and has the body style that UPS package cars in Europe are known for. The vehicle relies on a
combination of rechargeable batteries and kinetic energy recovery systems (KERS), which captures energy created when a vehicle
brakes for later use. KERS has been used in Formula One cars and other racecars, but has not yet been widely adopted for other types
of vehicles. We’re proud to be making UPS a pioneer with this cutting-edge, sustainable technology.
Converting vehicles to electric not only eliminates emissions from exhaust — it reduces vehicles’ life cycle emissions, most of which
originate from production and disposal. Now, UPS’ highly effi cient, durable vehicles, which might otherwise have limited use in many
European cities, can continue to travel the roads, deferring the need for investment in new vehicles.
UPS has ambitious plans to expand its alternative fuel and advanced technology fl eet, and vehicles equipped with EFA-S technology
are helping make that possible. The world of logistics is transitioning to more sustainable transportation models, and EFA-S is pleased
to help UPS hasten that transition.
Bastian BeutelManaging Director, EFA-S
Stakeholder Perspective

3.4Data Privacy
54
Management ApproachData privacy is a key consideration whenever we develop a new service, program, or strategy that involves the use of personal information, and we incorporate privacy protections into the early stages of design. As we evaluate global opportunities, compliance with data privacy laws is critically important. International data privacy laws oft en diff er from those in the United States, but we consider these diff erences in building and managing our global compliance program for the regions in which we operate around the world.
We utilize a cross-functional Information Security Council (ISC) to govern our privacy practices. Formed more than 10 years ago, the ISC is composed of more than 20 senior
managers and reports to our Management Committee. An ISC steering committee of senior managers meets quarterly and focuses on policy, standards, and compliance. An ISC working committee led by our Global Privacy Offi cer and our Chief Information Security Offi cer regularly convenes representatives from our information technology, privacy, legal, and security teams, as well as business units. We also use a global network of privacy coordinators to help raise awareness, act as points of contact, identify privacy issues, and help manage compliance. These employees, who are trained on our privacy policies and practices, are located in each of our international regions. In 2016, we added fi ve new privacy coordinators to cover China, Hong Kong, Japan, New Zealand, and the Philippines. In Europe, a heavily regulated region where privacy is a top concern, we also maintain a network of country-level coordinators.
103-1 | 103-2 | 103-3
Since our founding more than 100 years ago, UPS has viewed our reputation for protecting
customer data as essential to our business success.

55
Economic Enhancement3.4 // Data Privacy
Every year, we conduct information security and privacy audits, domestically and internationally, to gauge our employees’ understanding of our data protection policies. We also conduct practice data breach drills to prepare for potential incidents.
Customer EngagementUPS customers entrust us with their sensitive information, and we uphold this trust through our privacy and information security programs. We are constantly evaluating ways to deliver better service to customers while respecting their rights to privacy and securing information in accordance with UPS policies.
We inform stakeholders about our privacy practices in the UPS Privacy Notice, available on the home page of ups.com. The Privacy Notice describes the personal data that we collect, how we use it, and with whom we share it. We also provide consumers with a contact for questions about our privacy practices. We off er an easy-to-use Privacy Preferences Center that enables consumers to make meaningful choices about how we use their personal information. Behind the scenes, we are continually improving our IT systems, business operations, training, and monitoring to strengthen our privacy practices.
Employee Training and EngagementAs our privacy practices and policies continue to evolve, employee awareness is essential. Employees who are actively aware of privacy issues in their personal lives are more likely to be aware of privacy issues in the workplace. Training and engagement are the primary ways we build awareness.
Our signature event is “Global Privacy Awareness Week,” with events, guest speakers, employee contests, and giveaways held across the globe. In 2016, our privacy coordinators hosted Lunch-and-Learns with privacy experts at our offi ces in Brussels, China, London, and Singapore. At multiple U.S. locations, we hosted a speaker series with law enforcement offi cials about online child safety. We coordinated shred trucks to visit six U.S. locations, off ering employees an opportunity to bring in personal documents from home to dispose of securely. The visits resulted in 24 tons of shredded documents — four times more than in 2015. We also leverage Data Privacy Day, an international eff ort held annually on January 28, and National Cyber Security Awareness Month, a Department of Homeland Security initiative in October, as part of our annual awareness campaign.
Throughout the year, we deliver a steady fl ow of employee communications on topics such as phishing emails, password best practices, and securing paper records. While most of our training and awareness is directed to employees with access to specifi c UPS information systems, certain campaigns are designed for everyone, including drivers. During the 2016 holiday season, Inside UPS, a publication available in fi ve languages and distributed globally to more than 335,000 UPSers, featured a privacy infographic explaining ways to protect sensitive information at home and at work. To keep UPS privacy country coordinators and data protection offi cers engaged and abreast of emerging issues, we also held quarterly training in each international region.
103-1 | 103-2 | 103-3

3.5Digital & Physical
Asset Security
103-1 | 103-2 | 103-3
We operate more than 114,000 vehicles and one of the world’s largest air cargo fl eets from more
than 2,500 facilities, data centers, and offi ce sites around the world. The safety of our employees
and the security of our customers’ shipments are top priorities for UPS.
56
Management ApproachAs potential threats to digital and physical assets evolve — from cybercrime and terrorism to increased traffi c congestion and aging transportation infrastructure — we constantly work to adapt and improve our ability to operate our business eff ectively and sustainably.
Comprehensive risk mitigation techniques are applied globally to help keep our people and customer shipments secure. These risk mitigation techniques are applied across
all business segments. We are not free to disclose specifi c details about the techniques employed, since confi dentiality and customer relationships are critical components of our asset security program. Access to relevant, actionable, and real-time threat information is a critical component of protecting our digital and physical assets. To that end, we use threat information from authorities in both the public and private sectors to allow us to take necessary actions to protect our people, and our digital and physical assets.
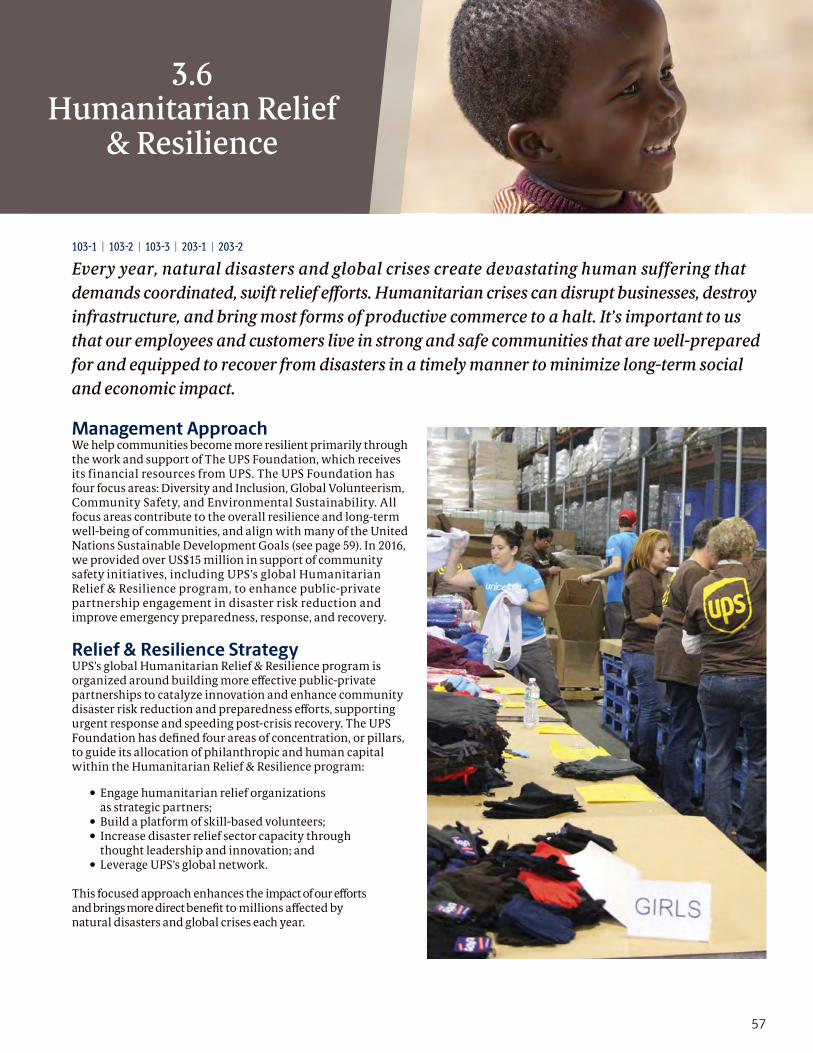
3.6Humanitarian Relief
& Resilience
57
103-1 | 103-2 | 103-3 | 203-1 | 203-2
Every year, natural disasters and global crises create devastating human suffering that
demands coordinated, swift relief eff orts. Humanitarian crises can disrupt businesses, destroy
infrastructure, and bring most forms of productive commerce to a halt. It’s important to us
that our employees and customers live in strong and safe communities that are well-prepared
for and equipped to recover from disasters in a timely manner to minimize long-term social
and economic impact.
Management ApproachWe help communities become more resilient primarily through the work and support of The UPS Foundation, which receives its financial resources from UPS. The UPS Foundation has four focus areas: Diversity and Inclusion, Global Volunteerism, Community Safety, and Environmental Sustainability. All focus areas contribute to the overall resilience and long-term well-being of communities, and align with many of the United Nations Sustainable Development Goals (see page 59). In 2016, we provided over US$15 million in support of community safety initiatives, including UPS’s global Humanitarian Relief & Resilience program, to enhance public-private partnership engagement in disaster risk reduction and improve emergency preparedness, response, and recovery.
Relief & Resilience StrategyUPS’s global Humanitarian Relief & Resilience program is organized around building more eff ective public-private partnerships to catalyze innovation and enhance community disaster risk reduction and preparedness eff orts, supporting urgent response and speeding post-crisis recovery. The UPS Foundation has defi ned four areas of concentration, or pillars, to guide its allocation of philanthropic and human capital within the Humanitarian Relief & Resilience program:
• Engage humanitarian relief organizations as strategic partners;
• Build a platform of skill-based volunteers;• Increase disaster relief sector capacity through
thought leadership and innovation; and• Leverage UPS’s global network.
This focused approach enhances the impact of our eff orts and brings more direct benefi t to millions aff ected by natural disasters and global crises each year.

Economic Enhancement 3.6 // Humanitarian Relief & Resilience
58
Engage Strategic PartnersAt the core of our preparedness, response, and recovery eff orts are the strong relationships we have developed with the world’s leading humanitarian relief organizations. These include the American Red Cross; Cooperative for Assistance and Relief Everywhere; the Salvation Army; Gavi, the Vaccine Alliance; the World Food Programme (WFP); United Nations High Commissioner for Refugees (UNHCR); the United Nations Children’s Fund; and other preeminent partners. We also partner with smaller-scale organizations such as SBP (formerly St. Bernard Project) in New Orleans, which leverages the lessons learned following Hurricane Katrina to expedite the recovery process in other communities. Another partner, Toolbank Disaster Services, equips recovery volunteers with tools and personal protective equipment transported by UPS. With all partners, we leverage our corporate strengths and philanthropic resources to improve the efficiency and effectiveness of relief and recovery efforts.
Build a Platform of Skill-Based VolunteersThe breadth and depth of talent among UPS employees provides a valuable platform to help speed disaster response and recovery. UPSers work side-by-side with our strategic partners and play an integral role in our humanitarian relief program.
The UPS Humanitarian Experts on Mission Program places UPS logistics experts on long-term assignment to our partner organizations. For example, UPS managers utilize their extensive Healthcare, Engineering, and Customer Solutions experience to develop strategies for governments in Africa in partnership with Gavi and the Global Fund to Fight AIDS, Tuberculosis and Malaria. A representative from UPS’s Automotive Group is helping the UNHCR analyze regional trucking operations in east Africa and determine future transportation needs and strategies. Another UPS Solutions manager is working with WFP to map multiple WFP Supply Chain Units processes to optimize service performance.
We also participate in formal programs such as the Logistics Emergency Teams (LETs), which provide expertise and response services to the Global Logistics Cluster of the United Nations led by WFP. LET companies, which are the large global logistics and transportation businesses, provide pro-bono assets and services and deploy highly trained experts to join the United Nations staff in disaster areas. Since 2007, UPS has deployed responders and provided services to the Dominican Republic, Ecuador, Haiti, Horn of Africa, Indonesia, Japan, the Middle East, Myanmar, Nepal, Nigeria, Pakistan, Philippines, Turkey, and West Africa. In the United States, we provide logistical support to the Red Cross to enhance preparedness and response. UPS provides the Red Cross funding and in-kind support that enables them to immediately deploy shelter support services when communities are impacted by disasters. UPS Logistics Action Teams (LATs) provide support to help speed vital relief supplies to communities in the aft ermath of natural disasters. To date, LATs have been active in Alabama, California, Colorado, Florida, Georgia, Kentucky, Louisiana, Mississippi, New Jersey, New York, South Carolina, and Texas.
Expertise on Loan“I go to work every day, knowing that money alone is not
enough to help Masconda,” explains Kevin Etter, a 30-year
UPSer. Masconda and her daughter live in a remote Ugandan
village, more than 10 kilometers from the nearest clinic.
Though Gavi, the Vaccine Alliance, helps increase access to
immunization in this region, and some of the world’s poorest
communities, Masconda still does not know if her daughter
will get the vaccines she needs. The UPS Foundation typically
supports its partner organizations through grants and in-kind
logistics services, but problems like these deserve a more
dynamic solution — people.
“I was my company’s donation,” jokes Kevin, who, along with
fi ve fellow UPSers, is a Loaned Manager working in the fi eld
for UPS humanitarian relief partner organizations. Currently,
“on loan” to Gavi, Kevin is able to use his three decades of
logistics experience to get vaccines to children who otherwise
would not receive them. In his time with Gavi, he and his
team have developed training programs for supply chain
managers; used mobile phones and applications to better
track and trace product usage and record data; developed
maintenance programs for refrigerators and considered
alternative power sources for them; and examined various
delivery methods for last-mile delivery.
Now, with Kevin’s help, Gavi is better equipped to reach its
goal of vaccinating more than 50 percent, or 300 million, of
the world’s children by 2020. “Think of the diff erence we can
make,” says Kevin, “in our world and in our communities,
if our companies donate just a handful of us, or if we
donate ourselves.”
103-1 | 103-2 | 103-3 | 203-1

5959
How The UPS Foundation Made a Diff erence in 2016
$14.9Million
in support of economic
development, education
& leadership development
for underserved or
underrepresented
populations
$3.4Million
toward over 700 scholarships
to benefi t underserved &
underrepresented students
$2.5 Million
to support tree planting
initiatives, environmental
education, conservation
eff orts & research
8,600+new drivers graduated from
the UPS Road Code™ safe
driving program
Sustainable Cities &
Communities
Responsible Consumption & Production
Partnerships for the Goals
Reduced Inequalities
Life on Land
Life Below Water
Climate Action
Peace, Justice, Strong
Institutions
No Poverty
Zero Hunger
Good Health & Well-Being
Quality Education
Gender Equality
Clean Water & Sanitation
Aff ordable &Clean Energy
Decent Work & Economic Growth
Industry, Innovation & Infrastructure
2.7 Millionvolunteer hours by UPSers,
friends & family members
$6.3 Million+
in funding to build volunteer
capacity & eff ectiveness of
nonprofi t organizations
$57 Million+employee contribution
in support of United Way1.9 Million
trees planted
$15 Million+in funding, in-kind
& technical support for
disaster response recovery,
emergency preparedness
and road safety initiatives
468humanitarian relief
shipments across
53 countries
Environmental Sustainability
GlobalVolunteerism
Community Safety
The UPS Foundation’s four focus areas will
drive progress toward achieving the United Nations
17 Sustainable Development Goals.
Diversity &Inclusion
203-1

60
Economic Enhancement 3.6 // Humanitarian Relief & Resilience
The world today is more complex than ever. Confl icts
are displacing people across the globe in the biggest
humanitarian crisis of our time. Natural disasters
are increasing in frequency and severity. Cities are
becoming more congested every day, with more than
half of the world’s population — and growing — now
living in urban areas.
Looking to the future, we don’t expect these challenges to change, but we do
see some clear and common themes to help manage them. Around the world,
innovators are developing solutions that require collaboration to scale and
deliver where they are needed most. To start, we must all leverage our limited
resources better to become more effi cient. We believe the United Nations
Sustainable Development Goals off er an eff ective framework to do so. The
goals provide the private sector with much-needed focus to better direct our
energies, ways to measure impact, and mileposts to aim for collectively.
Given the magnitude of today’s challenges, collaboration among government,
civil society, and the private sector is critical. As an example, in 2016 The UPS
Foundation became a partner in the UN’s Connecting Business initiative, which
provides a platform for the private sector to increase the scale and eff ectiveness of their engagement in disaster risk and response.
Through a more systematic approach to engagement, we’re confi dent businesses can have a stronger and more eff ective impact in
building community resilience.
Collaboration, by its very nature, also helps to
incubate innovative ideas. That’s what happened
when we combined our logistics expertise with
Gavi, the Vaccine Alliance’s public health knowledge
and Zipline’s cutting-edge technology. Together, we
are addressing the “last mile” delivery of healthcare
supplies to remote areas. Today, a fl eet of drones
that delivers blood to transfusion facilities in Rwanda
is providing a powerful model that is likely to lead
to other innovative humanitarian applications. This
would not have been possible without the inclusion
of diverse perspectives and ideas that helped
develop this solution.
Our logistics expertise and years of helping communities respond to crises has taught us the importance of eff ective supply chains;
in essence, getting people what they need — whether it’s in a refugee camp, the aft ermath of a disaster, or even a congested city.
By bringing effi ciency, collaboration, and innovation to the challenge at hand, The UPS Foundation is committed to building more
resilient supply chains for the future.
Eduardo MartinezPresident, The UPS FoundationUPS Chief Diversity and Inclusion Offi cer
UPS Perspective
203-1

61
Increase Capacity Through Thought Leadership and InnovationBuilding public and private partnerships and implementing the latest technological solutions helps ensure stronger infrastructures and greater impacts are achieved. We are helping to bring stakeholders together in broad-based collaborations to enhance disaster risk reduction eff orts in at-risk communities, and build the capacity and capabilities of the disaster relief sector.
In 2016, The UPS Foundation created a public-private partnership with Gavi; Zipline, a California robotics company; and the Rwandan government to launch the fi rst national medical drone delivery service in the world. This program addresses time-sensitive, last-mile delivery, one of the most critical humanitarian challenges. The UPS Foundation is providing more than US$1 million in cash, in-kind, and technical support to facilitate the launch of the delivery service in remote rural communities in Rwanda. The service provides expedited deliveries of lifesaving blood, vaccines, and other medical products to hospital and treatment facilities that serve roughly half of Rwanda’s population. According to WHO, Africa has the highest rate of maternal death due to postpartum hemorrhage, which makes access to blood transfusions critically important to women across the continent.
At the fi rst-ever World Humanitarian Summit (WHS) convened by the United Nations in 2016 in Istanbul, 9,000 participants from the public and private sectors discussed emerging global humanitarian issues and solutions to address those challenges. The WHS spurred the launch of several new initiatives, including the Connecting Business initiative (CBi), to help develop coordinated and more holistic approaches to engage the private sector in disaster risk reduction, emergency preparedness, response, and recovery. As a founding member of CBi, UPS is replicating Sağlam Kobi, its Disaster Business Resilience Program, in Mexico. The program, which launched in Turkey in 2013, adapted existing disaster preparedness techniques and tools available in the U.S. for the Turkish business community, providing training and disaster awareness communications.
UPS has been actively engaged with the WFP, WHO, and other private-sector organizations since the outset of the Ebola crisis in West Africa to help build an upstream supply chain to better respond to future pandemics. For example, data on every fl ight segment going in or out of a country, and warehouse storage capacities by country are being gathered and analyzed to develop more robust response solutions. This work builds on the lessons learned in providing support to communities in West Africa that were impacted by the Ebola epidemic in 2014.
We have been very engaged in the global refugee crisis for several years, working with the UNHCR as its Emergency Standby Partner to improve emergency logistics since 2010. In 2016, in addition to improving UNHCR global fl eet management solutions via our Humanitarian Experts on Mission program, we provided a grant to UNHCR to support the expansion of the UPS Relief Link program in Greece to ensure the equitable
distribution of critical supplies to thousands of refugees arriving on the island of Lesbos. UPSers also provided volunteer support for refugees across 16 countries in Europe.
UPS leaders attended the UN Private Sector Forum 2016, which focused on the role of business in advancing sustainable development to prevent global instability, and committed an additional US$1 million of support. That support includes the delivery of vital supplies addressing basic life-sustaining need for food, water, and shelter to displaced populations in Iraq, Nigeria, and South Sudan. We also participated in the White House initiative Partnership for Refugees, which provides guidance to private-sector organizations that wish to take action to ensure their pledges are sustainable and responsive to refugees’ needs.
Leverage Our Global NetworkAs a global leader in logistics, we are ready to leverage our extensive global assets and logistics expertise to speed relief and recovery to those in need when a natural or man-made disaster strikes. In addition, we oft en have people on the ground who are ready to help. UPSers based all over the world are empowered to volunteer and provide relief assistance to their local communities during sudden-onset disasters. During 2016, The UPS Foundation provided 468 ground, ocean, and air shipments to and from 53 countries for humanitarian relief and resilience eff orts. UPS played a major role in response eff orts following a devastating earthquake in Ecuador, in the aft ermath of Hurricane Matthew in Haiti, in communities aff ected by fl ooding in the southeastern United States, such as West Virginia, and in communities impacted by the water crises in Michigan. UPS also provided urgent relief shipments for refugees in Africa, Europe, and the Middle East.
Economic Enhancement 3.6 // Humanitarian Relief & Resilience
103-1 | 103-2 | 103-3 | 203-1

Our fifth annual UPS Pulse of the Online Shopper™ study, conducted in 2016 by comScore, revealed that:
• Consumers are shopping more with their smartphones and demanding a more seamless experience between virtual and physical stores;
• More than 50 percent of all purchases made by respondents were made online — the fi rst time in the study’s fi ve-year history — and respondents anticipate even more use of digital;
• Free shipping continues to be the most important factor driving customer satisfaction when checking out online, although consumers are willing to pay a premium for faster delivery;
• More than half of shoppers are interested in an alternate delivery location with extended hours and lower fees; and
• Online shoppers are using their smartphones to gain greater control, from accessing store inventory information to managing when and where their packages arrive.
Helping retailers deliver the experience that online shoppers desire creates opportunities for our integrated logistics network as we connect more retailers with more residential addresses. We expect e-commerce to comprise more than 50 percent of our U.S. shipping volume by 2019. This opportunity also comes with a challenge for the transportation and logistics industry to make e-commerce shipping more sustainable. The increasing percentage of residential deliveries means that fewer packages per stop are being delivered, in comparison with commercial deliveries, and that can mean more fuel and emissions per package delivered. We continue to seek innovative solutions throughout our operations and customer solutions so that we can continue to drive sustainability in this evolving environment.
Delivery Solutions for the FutureTo address the changing landscape of increased business-to-consumer shipping, we have pioneered new solutions that drive effi ciencies within our operations, while also giving customers the control they want. UPS My Choice® service enables customers to use a mobile device to choose a convenient time and place of delivery. The UPS Access Point™ network provides a consolidated delivery point — such as a nearby The UPS Store® location, service station, or convenience store — for multiple customers in the same area. Both solutions create a win-win: more fl exibility and convenience for consumers and fewer miles and associated emissions for UPS. Using
proprietary UPS routing soft ware, we are able to integrate the two services, providing even stronger value for our customers. In 2016, UPS received the Digital Edge 25 award for bringing these two innovative consumer package delivery services together.
Even as increasing numbers of consumers signed up for these services in 2016, we continued to enhance both of them through new features. UPS My Choice customers, who now top 30 million, are enjoying a service enhancement that enables them to monitor the progress of their UPS® Air and UPS Worldwide Express® packages on a real-time map, providing unprecedented visibility and convenience. During the year, we grew the UPS Access Point network to 18 countries and more than 26,000 locations worldwide. The service expanded our UPS Access Point locker program, which provides another location for UPS My Choice members to have their packages delivered, typically accessible 24 hours a day. By scanning an ID or in-app barcode, or by entering a PIN at the touchscreen terminal, customers can open the locker and retrieve their packages. We are working with 7-Eleven and independently owned and operated retailers to off er the locker program in select areas across the United States.
62
3.7Sustainable Shipping
& Supply Chain Off erings
Tech-savvy shoppers continue to transform retail as e-commerce continues to transform the
dynamics of our business.

A More Sustainable Shipping Journey Our customers want to ship more but with less impact. We off er sustainable solutions to help
minimize the environmental impacts associated with their supply chains.
AnalyzingOur Carbon Impact Analysis helps
customers understand the climate impact
of UPS shipments. We use the fi ndings
to off er optimization techniques that
improve effi ciency and reduce impact.
PackagingOur Eco Responsible Packaging
Program recognizes shippers
who are committed to
sustainable packaging. Shippers
who meet criteria for damage
prevention, appropriate sizing,
and packaging material can
participate. We also off er a
packaging solution that enables
customers to create a right-
sized box for any item.
ShippingUPS carbon neutral shipping is an easy,
cost-eff ective way to off set GHG emissions
from shipments of any size. With UPS
Smart Pickup® service, customers can
schedule a pickup only when needed,
avoiding unnecessary trips and emissions.
ReceivingUPS My Choice® service enables customers
to adjust delivery times or locations, while
UPS Access Point™ locations enable package
retrieval from a convenient, centralized
location. These solutions increase customer
convenience and help avoid unnecessary
trips, miles, and emissions.
ReturningWe simplify returns with turnkey
packaging, preprinted labels and more
than 150,000 convenient drop-off and
pickup locations. UPS’s reverse logistics
solutions also help customers reclaim
and refurbish products to be used again.
63

In the U.S., we are also reducing miles through services like UPS SurePost® and the UPS Synchronized Delivery™ service. UPS SurePost® service combines the consistency and reliability of the UPS® Ground network with UPS data and algorithms to match packages for delivery to planned UPS deliveries. UPS SurePost packages that match planned deliveries are delivered by UPS drivers, while unmatched packages are transferred to the U.S. Postal Service for “fi nal mile” delivery by USPS mail carriers. The UPS Synchronized Delivery service is designed to consolidate deliveries going to the same address while still delivering the packages within our customers’ committed timeframes to their consumers. Finally, UPS Smart Pickup® service uses innovative technology to automatically arrange a pickup only when a business has packages to ship.
Smarter Packaging SolutionsGrowth in e-commerce is also resulting in a decrease in the density of packages, which compares a package’s weight to its physical dimensions. As package density decreases, so does the eff ective utilization of cargo space, which can translate into more vehicles, more trips, more fuel, and more GHG emissions than necessary. Oversized packages and the extra packaging materials they require create unnecessary waste and are among many consumers’ top shipping-related complaints.
In 2016, UPS and Sealed Air Corporation announced a strategic partnership to help retailers, e-tailers, and businesses around the world maximize the effi ciency of their packaging operations, minimize packaging waste, and reduce shipping costs. This builds on past collaborations with Sealed Air to enable effi cient on-time delivery and returns, provide maximum protection against damage, reduce waste, and lower shipping costs.
We continue to collaborate with Packsize to off er a solution that enables companies to produce a right-sized box for any item or order, onsite at their facility. This reduces waste from excess packaging while allowing UPS to use cargo space more effi ciently in transport. We also continue to encourage packaging effi ciency through dimensional weight pricing, in which the price to ship a package is based on the amount of space a package occupies in relation to its actual weight.
We also off er sustainable solutions at more than 4,900 The UPS Store® locations. This includes carbon neutral shipping, some recycled packaging, and recycling programs for packaging. At some locations, The UPS Store off ers onsite air cushion packaging, which better protects shipments while using less material and saving money.
64
How Logistics Enable a Circular EconomyLogistics play a key role in helping customers develop and align with the 4Rs of the Circular Economy —
Reduce, Reuse, Recycle, and Recover. We enable collection and speedy return of goods that are unused,
damaged, or have reached their end of life. Here are some examples.
RetailPre-paid shipping labels
and right-sized packaging
reduce waste and help
consumers make effi cient
and hassle-free returns.
UPS Access Point™
locations help to limit
trips, reducing fuel use
and emissions.
HealthcareGrowing in-home
patient care is driving
shipments of equipment
and medications. By
simultaneously delivering
and picking up returnable
devices, reusable cartridges,
and empty packaging for
reuse, our UPS Returns
Exchange services help
divert spoiled products
and packaging materials
from landfi lls.
TechnologyFaster obsolescence for
consumer electronics
translates into increasing
amounts of eWaste. UPS
Returns™ Exchange enables
simultaneous delivery of
new electronics while
picking up old ones, which
can either be reused or
disposed of responsibly.
ManufacturingManufacturers provide
return process for reusable
cores and refurbishable
components, as well as
"recycling kits", for items
such as used ink cartridges
and single-serve coff ee
pods. Consumers and
businesses can return
kits to UPS Access Point
locations to ship returns.
Economic Enhancement 3.7 // Sustainable Shipping & Supply Chain Off erings

65
Economic Enhancement 3.7 // Sustainable Shipping & Supply Chain Off erings
In nature, there’s no such thing as “garbage.” Waste
generated by one organism becomes input for the
next, in a never-ending cycle. But with the creation of
synthetic materials, this process has broken down,
leading to ballooning volumes of waste, most of which
ends up in landfi lls.
More than 15 years ago, TerraCycle began to rethink this process. Today, we’re
eliminating the idea of waste by recycling materials that others consider
nonrecyclable, from coff ee capsules to nitrile gloves. We do this through
initiatives like free recycling programs for homes, offi ces, and schools; cigarette
butt recycling programs for major cities in North America and overseas; and
industrial waste solutions for manufacturing facilities. Participants in our
free recycling programs can earn “TerraCycle points” that are redeemable for
rewards and charitable donations — through which we’ve donated more than
$15 million to nonprofi ts since our founding.
TerraCycle took off fast in its early days, moving quickly from a dorm-room
inspiration to a major company, serving customers like Walmart and The Home
Depot. As our demands grew, we looked to UPS as a logistics partner in transporting the tens of thousands of parcels we receive every day.
Consumers ship their materials to us for recycling, so
transportation logistics are central to our business
model. UPS has been there to help solve our biggest
logistics challenges — most importantly by making
recycling an eff ortless activity through shipping services
that are convenient and readily available. The UPS Access
Point™ network gives consumers a variety of shipping
options for their recycled materials. And thanks to UPS’s
app soft ware integration and support, we now off er
prepaid shipping labels that our users can access to
send us their collected waste. In addition, UPS’s global
presence has enabled us to replicate our work in markets
around the world. To date, 60 million people across
20 countries have participated in TerraCycle’s programs,
recycling a total of 3.5 billion units of waste.
TerraCycle’s work transforms waste from a linear
system to a circular one, allowing materials to keep cycling in our economy much as they do in natural systems. When it comes to
choosing business partners, we love working with companies who understand what we do and are making similar commitments to
more sustainable ways of doing business themselves. UPS is one of those companies. Like TerraCycle, UPS takes responsibility for its
activities and its impacts. They just “get it,” and that’s why we’re proud to call them a partner.
Tom SzakyFounder and CEO, TerraCycle
Stakeholder Perspective

66
Environmental Responsibility
04
4.1 Material Topics . . . . . . . . . . . . . . . . . . . . . . . . . . . . . . . . . . . . . . . . . . . . . 68
4.2 Management Approach . . . . . . . . . . . . . . . . . . . . . . . . . . . . . . . . . 69
4.3 Energy & Emissions. . . . . . . . . . . . . . . . . . . . . . . . . . . . . . . . . . . . . . . . 71
4.4 Sustainable Solutions for Urban Logistics. . . . . . . . . 79
4.5 Fuel Supply . . . . . . . . . . . . . . . . . . . . . . . . . . . . . . . . . . . . . . . . . . . . . . . . . . . 83

67
The Road Ahead“Every business day, UPS drives 1 million miles in our fl eet of alternative fuel and advanced technology vehicles. But for all the progress we’ve made, we know there is so much more to do. We remain committed to testing new fuels and technologies, building infrastructure to support them, scaling what works, and learning from what doesn’t. And we’ll continue collaborating with policymakers, customers, manufacturers, and alternative-energy advocates to develop more sustainable solutions for our industry. In the process, we will also create a cleaner, healthier world. I see this as
an incredible opportunity — and an incredible responsibility. One that our industry must embrace with ingenuity, creativity, and a sense of urgency.”
Mark Wallace, Senior Vice President, Global Engineering and Sustainability
PROUD PAST1930s, Los Angeles, California & New York, New York
The fi rst UPS electric vehicles were plugged in during 1930 and
traveled at 20 miles per hour, fast enough for the crowded Manhattan
streets. In 1936, electric-powered package cars began delivering
packages throughout Los Angeles.
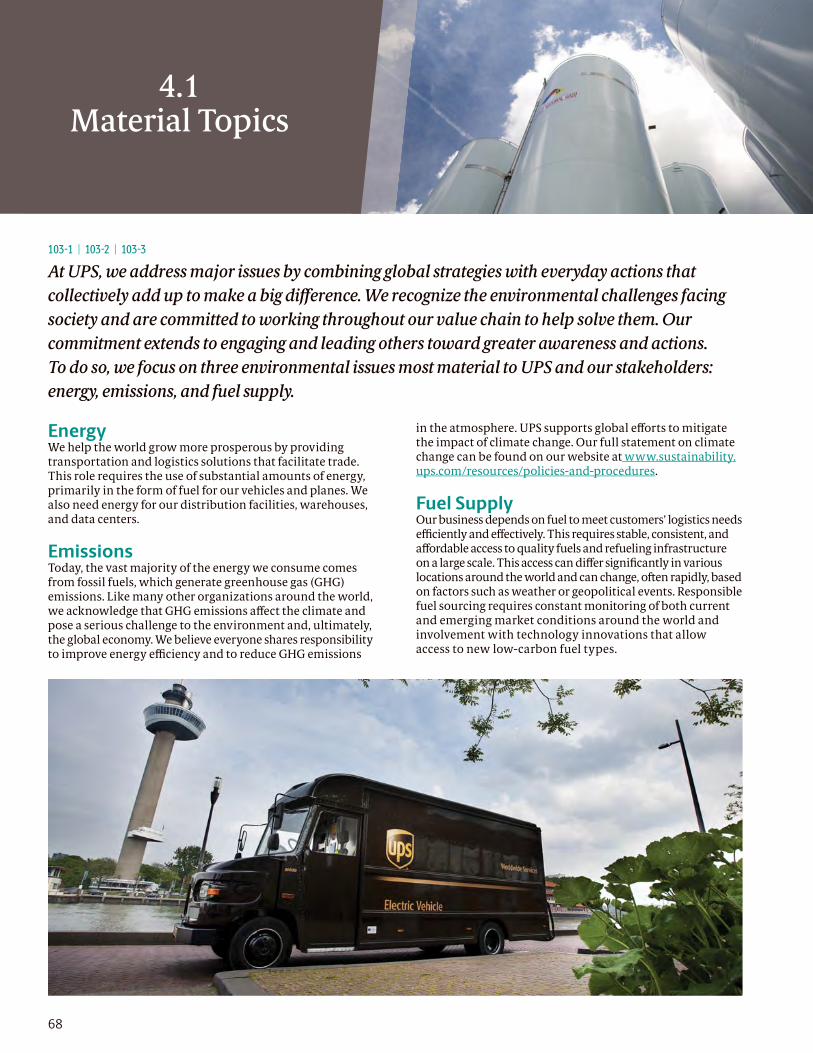
4.1Material Topics
103-1 | 103-2 | 103-3
At UPS, we address major issues by combining global strategies with everyday actions that
collectively add up to make a big diff erence. We recognize the environmental challenges facing
society and are committed to working throughout our value chain to help solve them. Our
commitment extends to engaging and leading others toward greater awareness and actions.
To do so, we focus on three environmental issues most material to UPS and our stakeholders:
energy, emissions, and fuel supply.
EnergyWe help the world grow more prosperous by providing transportation and logistics solutions that facilitate trade. This role requires the use of substantial amounts of energy, primarily in the form of fuel for our vehicles and planes. We also need energy for our distribution facilities, warehouses, and data centers.
EmissionsToday, the vast majority of the energy we consume comes from fossil fuels, which generate greenhouse gas (GHG) emissions. Like many other organizations around the world, we acknowledge that GHG emissions aff ect the climate and pose a serious challenge to the environment and, ultimately, the global economy. We believe everyone shares responsibility to improve energy effi ciency and to reduce GHG emissions
in the atmosphere. UPS supports global eff orts to mitigate the impact of climate change. Our full statement on climate change can be found on our website at www.sustainability.ups.com/resources/policies-and-procedures.
Fuel SupplyOur business depends on fuel to meet customers’ logistics needs effi ciently and eff ectively. This requires stable, consistent, and aff ordable access to quality fuels and refueling infrastructure on a large scale. This access can diff er signifi cantly in various locations around the world and can change, oft en rapidly, based on factors such as weather or geopolitical events. Responsible fuel sourcing requires constant monitoring of both current and emerging market conditions around the world and involvement with technology innovations that allow access to new low-carbon fuel types.
68

4.2Management
Approach
69
103-1 | 103-2 | 103-3
The UPS management approach to Energy, Emissions, and Fuel Supply focuses on a
comprehensive plan of fi ve principles that span each of these areas.
Network OptimizationThe effi ciency of our global logistics network drives both our business success and environmental impact. We have the expertise and infrastructure to handle all categories of service — express, air, ground, domestic, international, commercial, and residential — through one integrated and optimized network. This strategy increases our effi ciency and reduces environmental impacts associated with our network, such as GHG emissions.
Our network is also the primary way in which we preserve natural capital. We benefi t society by providing more effi cient logistics from a fi nancial and natural capital perspective than customers could on their own. Our network optimization strategies include:
• Research, development, and implementation of innovative routing and fl eet performance technologies like ORION, which stands for On-Road Integrated Optimization and Navigation, to enable us to improve fuel effi ciency; and
• Solutions such as UPS My Choice® service and the UPS Access Point™ network, which allow us to deliver more eff ectively for customers while reducing the amount of fuel we use to make those deliveries.
A reduction in our carbon intensity translates into an absolute GHG reduction for our aggregated customer base and the planet. This is why we strive to serve customers more effi ciently, slowing the growth of fuel use and GHG emissions, even as business volume grows. Our optimized global logistics network, combined with our global GHG strategy, helps improve our effi ciency and reduce our carbon intensity.
Comprehensive Data Measurement and ManagementWe have established global, state-of-the-art IT systems that gather package-level detail on our shipping activity. This wealth of operational data is analyzed in conjunction with the GHG emissions data gathered for our fl eets and facilities. The results help us optimize our network, pinpoint our investments and capital expenditures, and accurately report externally on our GHG emissions and other environmental KPIs.
Our analytical data capabilities are considerable and enable us to:
• Advise customers on how to reduce environmental impacts associated with shipping;
• Drive operational effi ciencies that benefi t the environment;
• Identify global network opportunities for future R&D and capital expenditures; and
• Obtain assurance on our environmental performance with a high degree of transparency to drive confi dence and trust among stakeholders.
The use of data analytics is also a good example of how we deploy intellectual capital in a more integrated approach to environmental performance.

Environmental Responsibility4.2 // Management Approach
Global GHG Reduction StrategyWe take a comprehensive, global approach to reducing energy use and GHG emissions, including all our ground, air, and facility operations, as well as major portions of our value chain, including customers and suppliers. Our strategy includes:
• Reducing the miles we travel in our global transportation network and, accordingly, the fuel we use, to accomplish any given level of shipping;
• Expanding our fl eet of alternative fuel and advanced technology vehicles, known as our rolling laboratory, in order to reduce the proportion of conventional fuels we use;
• Reducing conventional energy use and increasing the renewable energy use in our fl eet and facilities;
• Providing shippers with services that help them reduce their environmental impact; and
• Helping increase supplier awareness about GHG emissions and how to reduce them.
Fuel Supply ManagementResponsible management of our fuel supply, which represented 3.8 percent of our total operating expense in 2016, is another critical part of our shared approach to energy and emissions. Maintaining the integrity of our fuel supply is critical to ensuring we can deliver for customers. Our strategy encompasses:
• Large-volume data-gathering on all our air and ground fl eets — including those in our rolling laboratory — to understand our fuel requirements in great detail;
• Direct purchases from vetted counterparties, including producers and brokers, to help ensure supply integrity for meeting customer commitments, controlling costs, and ensuring quality; and
• Diversifi cation of our supplier base to minimize risks of outages.
In addition to our overall fuel supply management strategy, we also leverage our scale and expertise to actively promote the development of lower-emission alternative fuels. This includes:
• Employing a rolling laboratory approach in which we use our fl eet size and diversity to help test the viability of alternative fuels in real-world operating conditions;
• Investing in a fast-growing fl eet of vehicles that uses alternative fuels, which helps to create market incentives to expand supplies of those fuels;
• Collaborating with government and nongovernmental organizations (NGOs) in select alternative fuel initiatives such as the U.S. Environmental Protection Agency SmartWay® Program that promotes the use of alternative fuels;
• Participating in the World Business Council for Sustainable Development’s Low Carbon Freight initiative to explore the potential for fuel and emissions reductions through optimization and collaboration between companies on road freight transport, and its below50 initiative to grow a global corporate market for best-in-class sustainable low-carbon transport fuels; and
• Funding of, participation in, and championing of the Future of Fuels program at BSR, a leading sustainability NGO, to study the impacts of all fuel sources and help guide business in the development of relevant policies and practices.
A complete discussion of Fuel Supply Management can be found on page 83.
External Engagement and Public PolicyAs part of our overall management approach, we also contribute actively to public discussions about environmental sustainability. This includes collaborating with leading NGOs, regulators, and industry consortiums to propel the cause of environmental sustainability forward. We also participate in public policy forums, where we advocate for prudent innovation and investment in new technologies and infrastructure development. Read our Climate Change Statement on our website at https://sustainability.ups.com/resources/policies-and-procedures/.
70
103-1 | 103-2 | 103-3

4.3Energy & Emissions
71
Carbon Reduction GoalsThe decision to establish a science-based target for our ground operations recognizes the degree to which GHG emissions aff ect climate and, ultimately, the global economy. We engaged with leading environmental NGOs and used a methodology aligned with the Science-Based Target initiative to set this goal.
The use of renewable energy is critical to achieving this ambitious goal. To do so, we intend to have 25 percent of our total electricity come from renewable sources by 2025. We have also committed to increase the use of alternative fuels to 40 percent of our total ground fuel use by 2025. These commitments will result in cleaner emissions and help to commercialize the market for alternative fuels, such as renewable diesel and renewable natural gas. This pathway,
however, is not without challenges. Large-scale production of renewable fuels will require signifi cant supplier investments and, in the case of organic sources for renewable diesel, could potentially disrupt other markets.
At this time, we have elected not to set absolute reduction targets for our airline, where the use of renewable fuel is more challenging. Though jet fuel represents 58 percent of our total GHG emissions, large-scale refi ning of next-generation renewable fuels and aviation biofuel solutions is not economically feasible without signifi cant government incentives and subsidies. Aviation biofuels also have commercial scale challenges. A complete discussion of our GHG reduction eff orts at UPS Airlines is found on page 75, and our use of alternative fuels on page 83.
103-1 | 103-2 | 103-3
During 2016, UPS established a new set of enterprise sustainability goals to reach by
2025. Continuing a commitment to address our environmental impacts, we set a goal
to reduce absolute GHG emissions for our global ground operations 12 percent by 2025
against a 2015 baseline.

72
Transportation Intensity IndexThese fi gures represent the three diff erent carbon intensity metrics we combine to generate the complete Index and illustrate for stakeholders how specifi c components of our business are reducing their carbon intensity.
U.S. SMALL PACKAGE OPERATION
CO2e/PACKAGE
2007 Baseline: 2.78 LBS
2016 Actual: 2.28 LBS
17.9%
GLOBAL AIRLINE FUEL
CO2e/ATM
U.S. SUPPLY CHAIN &
FREIGHT OPERATION
CO2e/LB OF FREIGHT
CARBON INTENSITY REDUCTION OVERALL
16.6%
2007 Baseline: 1.54 LBS
2016 Actual: 1.40 LBS
9.1%
30.9%2007 Baseline: 0.26 LBS
2016 Actual: 0.18 LBS
Compared to 2007
2016 PerformanceIn 2016, we continued to improve the efficiency of our operations by delivering more packages for our customers while emitting fewer greenhouse gas (GHG) emissions per package. Our small package volume increased 4.2 percent over 2015, outpacing our scope 1 and scope 2 GHG emissions, which we held to a 1.9 percent increase over the same period. The increase in GHG emissions is largely attributed to next day air volume growth.
In our global ground operations, which includes vehicle fuel, facility heat, and facility electricity, we achieved an absolute GHG reduction of 1.7 percent over 2015. This absolute reduction is the result of successfully implementing our GHG reduction strategy, which includes many initiatives, such as fully implementing ORION in our U.S. Small Package operations, expanding our fl eet of alternative fuel and advanced technology vehicles, providing shippers and customers with services like the UPS Access Point™ network and the UPS My Choice® program, and leading the transportation industry with the use of low-carbon fuels like renewable diesel and renewable natural gas.
Scope 3 emissions — those emitted by others on behalf of UPS activities — increased 3.3 percent from 2015 to 2016. We report on all relevant Scope 3 categories, nine out of 15, as defi ned by the GHG Protocol. The two categories most signifi cant to our business are lifecycle emissions related to the production of fuels and energy we use (category 3), and emissions from purchased transportation (category 4). See pages 96 and 98 for more explanation on Scope 3 categories.
Emissions related to the production of fuels and energy increased 2.7 percent in 2016, due primarily to increased use of jet fuel in our operations. We continue to work with supply chain partners to test and use fuels that lessen our environmental impact and create fewer emissions. Emissions from purchased transportation increased slightly by 0.7 percent in 2016. We continue to work with our transportation service partners to provide reliable service in the most effi cient manner possible.
Transportation Intensity IndexIn addition to our new absolute GHG reduction goal, we continue to report on the progress of our GHG intensity goal, the Transportation Intensity Index, introduced in 2010.
Environmental Responsibility4.3 // Energy & Emissions
GHG Emissions by Source(CO2e metric tonnes)
Source GHG Scope 2016 2015 2014 2013
Airline Fuel Scope 1 7,720,000 7,375,000 7,195,000 7,160,000
Vehicle Fuel Scope 1 4,496,000 4,587,000 4,549,000 4,387,000
Facility Fuel Scope 1 216,000 235,000 256,000 223,000
Facility Electricity Scope 2 831,000 814,000 870,000 828,000
Total 13,263,000 13,011,000 12,870,000 12,598,000
103-1 | 103-2 | 103-3
See page 95 for further breakdown for years 2015 and 2016

73
This Index captures the overall efficiency of our global network by measuring GHG emissions associated with transporting packages and freight for our customers in a given year. Separate carbon intensity metrics measuring the Scope 1 and Scope 2 CO2e emissions for each of our three business segments are included in the Index. All three business segments have seen a decrease in their carbon intensity, refl ecting greater effi ciencies in our ability to move more packages and freight while emitting less carbon. As a result, UPS has realized an overall carbon intensity reduction of 16.6 percent versus a 2007 baseline by successfully executing GHG reduction strategies in our ground and air fl eets, both of which are discussed later in this chapter.
Ground Fleet Effi cienciesOptimization of our ground f leet drives both financial performance and environmental impact. Reducing the number of miles driven and time spent delivering a shipment can translate into lower costs as well as energy savings and lower emissions.
Delivery Network Effi cienciesWe have a long track record of successfully applying cutting-edge technologies and analytics to improve our fl eet effi ciency. For more than a decade, we have been leveraging data through telematics, package routing technology, service off erings, and other strategies to optimize network effi ciencies and minimize the miles we drive. Some of these tactics include:
• Allocating pickups and deliveries to the most effi cient number of vehicles each day at each facility, thus keeping vehicles off the road wherever possible;
• Developing and implementing innovative routing and fl eet performance technologies like ORION to enable us to meet customer service commitments and reduce miles driven; and
• Off ering innovative solutions, such as UPS My Choice® service, the UPS Access Point™ network, and UPS Smart Pickup® requests to reduce wasted miles and associated emissions due to unsuccessful delivery and pickup attempts.
In addition to reducing the number of miles driven, we combine numerous techniques and technologies to reduce fuel use per mile and apply them across more than 55,000 daily routes, such as:
• Selecting route options that minimize idling time, thus reducing fuel use and emissions;
• Matching vehicle types with routes where they will deliver the best fuel effi ciency; and
• Conducting proactive, just-in-time maintenance on our vehicles to keep their miles-per-gallon performance as high as possible.
One method of measuring the eff ectiveness of these initiatives is by analyzing stops per mile. In our package business, we strive to increase stops per mile and avoid driving unnecessary miles. Our drivers make approximately 2 billion stops per year,
which means a slight improvement in the number of stops per mile translates into signifi cant reductions in fuel consumption and emissions. Such was the case in 2016 when total stops in our U.S. domestic package segment increased by 4.4 percent due to higher volume. Through route optimization and other effi ciencies, we held delivery miles driven to a 0.6 percent increase. As a result, stops per mile improved from 1.51 in 2015 to 1.56 in 2016. This small improvement enabled us to avoid driving more than 47 million miles, thereby eliminating 5.3 million gallons of fuel use and 50,000 metric tonnes of CO2.
The continued deployment of telematics is also helping us to reduce fuel use and CO2 emissions. Our proprietary system gathers data on more than 200 vehicle-related elements, which are then analyzed to identify opportunities to enhance safety and boost effi ciency. We use telematics throughout our domestic small package and UPS Freight fl eets, and continue to expand deployment outside the U.S.
The UPS Foundation Global Forestry InitiativeEnvironmental initiatives extend beyond our business
to include The UPS Foundation, which, in 2016, awarded
more than $2.6 million in grants to support environmental
sustainability initiatives, advance environmental research
and thought leadership, strengthen education and
awareness, and promote energy and resource conservation.
Through the UPS Global Forestry Initiative, we have
planted more than 7 million trees since 2012, as we
work toward our goal of 15 million trees by 2020. The
UPS Foundation has also funded the development of
many GHG Protocol standards and tools, including the
Science-Based Targets initiative, as well as educational
eff orts such as The Nature Conservancy’s support of the
Europe China Dialogues, which promotes international
conversations on responsible forestry practices.
Environmental Responsibility4.3 // Energy & Emissions
103-1 | 103-2 | 103-3

74
The deployment of telematics outside the U.S. is a priority, but not without challenges. Signifi cant changes in the telematics soft ware must be made to comply with local laws. To date, we have completed full deployment of telematics in 11 countries: Australia, Canada, the Czech Republic, Denmark, Germany, Ireland, Mexico, the Netherlands, Singapore, Switzerland, and United Kingdom. There are 191 UPS locations and approximately 8,000 vehicles outside the U.S. — 88 percent of our overall owned ground operations outside the U.S. — currently using telematics. We plan to expand telematics to additional countries in 2017.
Our groundbreaking route optimization soft ware, ORION, continues to deliver signifi cant fi nancial and environmental benefi ts. In 2013, aft er 10 years of development, we began implementation of ORION, which stands for On-Road Integrated Optimization and Navigation. Arguably theworld’s largest operations research project, ORION is proprietary routing soft ware that uses package-level detail, customized online map data, fl eet telematics, and advanced algorithms to take route optimization to a new level. ORION enhances customer service and reduces miles driven by determining the most effi cient delivery route each day. We have learned that successful implementation is a combination of ORION’s optimizing technology combined with our drivers’ using their best judgment and knowledge of optimal route solutions.
In 2016, we completed deployment of ORION to 100 percent of U.S. routes targeted for implementation. Since beginning deployment in 2013, we have reduced the distance driven by our drivers by 210 million miles, achieving a 210,000 metric tonne cumulative reduction in CO2 emissions and realized annual cost savings of US$400 million. Now that ORION is fully deployed to these routes, we expect to see annual reductions of 100 million miles and 100,000 metric tonnes in CO2 emissions. The next generation of a dynamic real-time version of ORION will be deployed by 2019 to further reduce miles driven, fuel use, and CO2 emissions.
Feeder Network Effi ciencies Our feeder or, as it is more commonly known, tractor-trailer network accounts for more than half of our fuel consumption in our change to U.S. Ground Domestic Package business segment. The acquisition of Coyote Logistics in 2015 has generated signifi cant opportunities to improve our feeder network operation by reducing empty backhaul miles and associated emissions.
We continually evaluate new fuel-saving equipment and technologies in our feeder network, such as aerodynamic side fairings on tractors, low rolling resistant tires, engine downspeeding, and aerodynamic skirts on trailers. In 2016, we validated the fuel-saving potential of the T-Dolly, a converter dolly for double- and triple-trailer combinations. We are now adding this equipment to our feeder network fl eet. The dolly automatically retracts to close the trailer-to-trailer gap at highway speeds, which reduces aerodynamic drag and improves fuel economy 2.5 to 3.5 percent. At speeds below 40 miles per hour, the dolly automatically extends to allow for sharp turns. Based on its potential to reduce fl eet fuel consumption, we purchased 200 T-Dollies in 2016 and have plans to purchase more going forward.
We fully leverage the capabilities of our global network, which combines air, rail, ocean, and ground transportation, to off er customers environmentally friendly alternatives. Rail options, for example, consume less energy and produce lower carbon emissions than air or road freight. The effi cient freight practices that we have adopted across our ground fl eet operations also can be an important factor that customers consider when making a logistics sourcing decision.
Delivering the Next InnovationToday, data is typically used for descriptive analytics,
which describes what has happened, or predictive
analytics, which explains what might happen next.
Looking to the future, the use of prescriptive analytics
will help businesses understand what should happen,
providing a chance to solve problems before they even
arise. For example, a company like UPS will be able to
predict traffi c gridlock and automatically re-route drivers
to avoid delays. Or use real-time data to determine which
nodes of our network — down to the individual driver
— will best get a package to its destination on time.
It sounds like science fi ction, but UPS is laying the
groundwork for these analytics innovations today. Our
ORION soft ware is already shortening delivery routes by
millions of miles. The next step in our evolution
includes our new Network Planning Tools (NPT). Think
of NPT like a larger-scale version of ORION, with routes
optimized down to the package level. NPT rolls route
and hub optimization into one tool, allowing us to
re-route packages in transit in response to weather
delays or other bottlenecks. The tools will be fully
deployed by 2020 — and will surely open doors to
further breakthroughs using data in years beyond.
Environmental Responsibility4.3 // Energy & Emissions
103-1 | 103-2 | 103-3

75
A New Way to Think About the “Last Mile”At the 2016 installment of TED@UPS, a new way
forward was proposed for “last mile” delivery. Mario
Paluzzi, a logistics and technology specialist with
Coyote Logistics, asked, “What if a person’s exact
geographical location could be used for package
deliveries rather than a traditional street address?” His
inspiration came from the developing world where
many people lack a traditional street address such
as 123 Main Street, but 90 percent of the population
have mobile phones that could give a person’s exact
location. Letting people put themselves on the map,
as Mario put it, could revolutionize the last mile and
disrupt an industry with new ways of doing business.
Air Fleet Effi cienciesUPS Airlines is a critical component of our logistics network, helping us to quickly connect our customers around the world. As a result, we help to reduce the absolute GHG emissions associated with the shipping activities of our customers. To further reduce that carbon footprint, we work aggressively to minimize the carbon intensity of UPS Airlines, which accounts for 58 percent of our total GHG emissions.
As we increase the effi ciency of our network, we have the opportunity to decrease the carbon intensity of our airline by reducing the number of miles fl own and gallons of fuel consumed to meet customer needs. The primary way we measure this progress is through CO2 Pounds per Available Ton Mile, also stated as pounds of CO2 emitted for every ton of capacity transported one nautical mile.
Since 2005, we have realized a 10 percent improvement in this KPI. Total air volume has increased 36 percent while we have held emissions to a 21 percent increase over this time period. We expect that our continued progress toward our 2020 goal of a 20 percent carbon intensity improvement will be challenging. When this goal was originally set, we anticipated greater availability and assumed widespread use of alternative fuels in our air fl eet.
Alternative fuels present a signifi cant challenge to aviation, since the fuel must meet stringent operating and airworthiness certifi cation requirements. Aviation alternative fuel pathways have received certifi cation, and select projects are underway. Globally, fi ve refi ners produce “drop-in” renewable fuels (which can be used in existing conventional engine technology and refueling infrastructure) at a meaningful scale, and a handful of these facilities have the ability to produce renewable jet-blend stocks. However, yields and economics signifi cantly favor the production of other products, including renewable diesel. UPS is the largest global user of “drop-in” renewable diesel used in ground transportation and has established relationships with four of the fi ve current producers.
Long term, we believe that meaningful incorporation of renewable content into the jet fuel stream will result from co-processing rather than the development of high-cost, small-scale boutique facilities. Co-processing utilizes the existing crude oil refi ning infrastructure to process synthetic crude oils that are bio-based. In the future, low-carbon fuel
policies could incent petroleum refi ners to incorporate renewable content directly into their crude oil feedstocks, utilizing existing infrastructure. This would result in renewable content being dispersed across a wide variety of refi ned products, including gasoline, diesel, and jet fuel, and would ultimately lower the well-to-wheels carbon intensity of all products.
Environmental Responsibility4.3 // Energy & Emissions
Particulate Emissions ReductionU.S. Domestic Package & U.S. Freight Operations
2016 2015 2014 2012 Baseline 2020 Goal
PM2.5 Emissions per Ground Vehicle
(kg PM2.5/vehicle)
9
(50% reduction)10 14 18
75% reduction
from 2012 baseline
NOx Emissions per Ground Vehicle
(kg NOx/vehicle)
251
(50% reduction)280 372 503
60% reduction
from 2012 baseline
103-1 | 103-2 | 103-3 | 305-7

76
Absent low-carbon fuel policies and with the price of crude oil at record lows, the fi nancial incentive for fuel companies to advance lower carbon alternative fuels has waned. We continue to participate in the Commercial Alternative Aviation Fuels Initiative, which provides us with a forum to monitor and engage in developments in alternative fuels and technologies for the airline.
UPS always strives to achieve the most optimal and effi cient air network and will continue to do so with initiatives focused around three strategic areas: aircraft fl eet, aircraft weight, and aviation procedures. Examples of our progress in aircraft fl eet and weight are shown on page 77.
In 2016, we ordered 14 new Boeing 747-8 freighter jets to meet increased demand, with an option to purchase 14 additional jets in the future. The jumbo freighters will help meet our customers’ future capacity needs while also reducing fuel use and carbon emissions. The 747-8’s new wing and engine design reduces fuel consumption and carbon emissions by 16 percent over the 747-400F. The aircraft operates 52 percent below the International Civil Aviation Organization’s (ICAO) nitrous oxide limits and is 30 percent quieter than other jumbo cargo jets. We will take delivery of the aircraft between 2017 and 2020.
In 2016, the ICAO took signifi cant action in its 39th Assembly to address CO2 emissions generated by international aviation activities. The ICAO Assembly established a Global Market Based Measure to off set CO2 emissions and contribute to carbon neutral growth of international aviation from 2021 onwards, and brought CO2 emissions into the formal certifi cation process for new aircraft . We monitor and will continue to comply with ICAO and all other rulemaking aff ecting our aircraft operations.
We also implemented a fuel management software solution in 2016 that provides enhanced analytics and visibility of fuel consumption. The solution allows tracking and reporting of fuel usage metrics and helps target areas for fuel and emissions reduction, including factors in f light planning and f light operations. We anticipate this soft ware will help us to effi ciently lower fuel use and reduce CO2 emissions from our aircraft .
UPS Airlines completed a multiyear project implementing a new takeoff and landing performance system on all UPS aircraft in 2016. The new on-board system automates takeoff and landing performance calculations for the entire aircraft fl eet. The new soft ware provides the most current, automated, and optimized
aircraft performance data for all situations and runway conditions. This real-time takeoff and landing data helps make the best and safest decisions during takeoff s and landings. The soft ware also captures all dispatch and crew performance results, enabling greater oversight and performance validation.There are also effi ciency gains from reduction in takeoff fl ap settings and optimized thrust required for takeoff . These gains also mean signifi cant sustainability benefi ts as well: better takeoff climb performance, noise reduction, and saved upwards of 1 million gallons (over 10,000 metric tonnes of CO2e) of fuel annually, while also eliminating approximately 3 million printed pages of paper each year.
Our path forward to realize additional air fl eet effi ciencies extends to 2020 and beyond as the Federal Aviation Administration (FAA) continues to expand its next-generation (“NextGen”) air traffi c control and surface traffi c management systems. We have realized measurable improvements from the 2013 introduction of RECAT — the recategorization of wake turbulence separation standards — at our global air hub in Louisville, Kentucky. By reducing the separation standard between both inbound and outbound aircraft , we have decreased average taxi time by 9 percent and improved average arrival and departure rates by 10 percent. Our Flight Operations team continues to work closely with the FAA to improve arrival and departure effi ciencies at key airports. In addition, we continue to implement digital technology to replace pilot-controller voice communications. Through the DataComm program, UPS now receives controller instructions such as clearances via digital technology, which improves effi ciency, reduces radio congestion, and enhances our ability to save fuel during taxiing. We are working with the FAA to pioneer this program for the industry.
Environmental Responsibility4.3 // Energy & Emissions
CO2 Pounds per Available Ton MileUPS Airlines — Global Operations
2016 2015 2014 2005 Baseline 2020 Goal
lbs CO2/ATM
(Nautical Miles)
1.39
(10% reduction)1.39 1.37 1.54
1.24
(20% reduction)
lbs CO2/ATM
(Statute Miles)
1.21
(10% reduction)1.20 1.19 1.34
1.08
(20% reduction)
103-1 | 103-2 | 103-3

Jet Engine WashingRemoves particulate
matter accumulated
during engine operation
GHG REDUCED
25,500metric tonnes
Flight Crew Tablets70 pounds lighter than
a fl ight bag.
GHG REDUCED
1,300metric tonnes
Fire-Resistant
Containers (FRCs)Enhance safety
and weigh less than
traditional containers.
GHG REDUCED
6,300metric tonnes
Discretionary Fuel ReductionsHistorical fl ight plan data enables
more accurate fuel requirements
GHG REDUCED
17,100metric tonnes
"Winglet" Modifi cationsReduce drag and increase fuel
effi ciency by approximately
3.6 percent per fl ight
GHG REDUCED
81,300metric tonnes
A Lower Carbon Footprint in the AirSince 2005, UPS Airlines has reduced its carbon intensity by 10 percent, thanks to strategies
focused on our aircraft fl eet, aircraft weight, and aviation procedures. Here’s how we avoided
greenhouse gas emissions “in the air” during 2016.
77
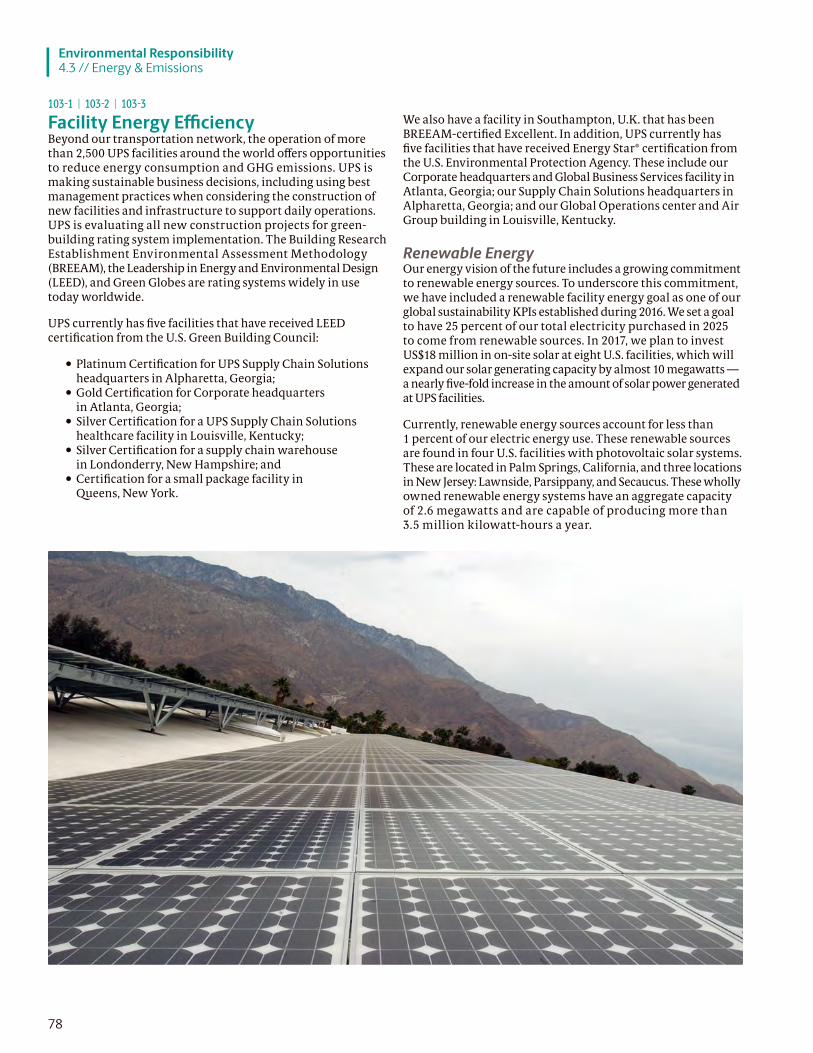
78
Facility Energy Effi ciencyBeyond our transportation network, the operation of more than 2,500 UPS facilities around the world off ers opportunities to reduce energy consumption and GHG emissions. UPS is making sustainable business decisions, including using best management practices when considering the construction of new facilities and infrastructure to support daily operations. UPS is evaluating all new construction projects for green-building rating system implementation. The Building Research Establishment Environmental Assessment Methodology (BREEAM), the Leadership in Energy and Environmental Design (LEED), and Green Globes are rating systems widely in use today worldwide.
UPS currently has fi ve facilities that have received LEED certifi cation from the U.S. Green Building Council:
• Platinum Certifi cation for UPS Supply Chain Solutions headquarters in Alpharetta, Georgia;
• Gold Certifi cation for Corporate headquarters in Atlanta, Georgia;
• Silver Certifi cation for a UPS Supply Chain Solutions healthcare facility in Louisville, Kentucky;
• Silver Certifi cation for a supply chain warehouse in Londonderry, New Hampshire; and
• Certifi cation for a small package facility in Queens, New York.
We also have a facility in Southampton, U.K. that has been BREEAM-certifi ed Excellent. In addition, UPS currently has fi ve facilities that have received Energy Star® certifi cation from the U.S. Environmental Protection Agency. These include our Corporate headquarters and Global Business Services facility in Atlanta, Georgia; our Supply Chain Solutions headquarters in Alpharetta, Georgia; and our Global Operations center and Air Group building in Louisville, Kentucky.
Renewable EnergyOur energy vision of the future includes a growing commitment to renewable energy sources. To underscore this commitment, we have included a renewable facility energy goal as one of our global sustainability KPIs established during 2016. We set a goal to have 25 percent of our total electricity purchased in 2025 to come from renewable sources. In 2017, we plan to invest US$18 million in on-site solar at eight U.S. facilities, which will expand our solar generating capacity by almost 10 megawatts — a nearly fi ve-fold increase in the amount of solar power generated at UPS facilities.
Currently, renewable energy sources account for less than 1 percent of our electric energy use. These renewable sources are found in four U.S. facilities with photovoltaic solar systems. These are located in Palm Springs, California, and three locations in New Jersey: Lawnside, Parsippany, and Secaucus. These wholly owned renewable energy systems have an aggregate capacity of 2.6 megawatts and are capable of producing more than 3.5 million kilowatt-hours a year.
Environmental Responsibility4.3 // Energy & Emissions
103-1 | 103-2 | 103-3

4.4Sustainable
Solutions for Urban Logistics
79
The global population is expected to grow from 7.3 billion today to 9.7 billion by 2050, when
two-thirds of all people will make cities their home. This expanding population is expected
to fuel an increase in middle-class consumers and global commerce, which will add volume
to trade lanes and increase the number of vehicles on already congested roads. To meet these
logistical challenges and ensure a desirable quality of life in increasingly crowded urban areas,
we need more intelligent transportation solutions that are both economically feasible and
environmentally sustainable.
Many city centers are already facing the challenges of vehicle gridlock and congestion, which negatively impact both air quality and economic competitiveness. Urban planners agree that the key to creating livable and walkable “smart cities” lies in reducing reliance on personal vehicles; however, this solution will require investment in better mass transit, ride sharing, bike lanes, and walkable streets.
UPS would add another component: reliable and convenient e-commerce delivery, which is critical to making alternative transportation modes, such as walking, mass transit, and cycling, a viable choice.
Though delivery vehicles are typically seen as contributing to traffi c, the reality in a modern, e-commerce-driven urban marketplace is far diff erent. Eff ective supply chains actually consolidate deliveries and serve as “shared mobility” for packages and freight, reducing the number of trips needed and reducing the environmental impact for each individual package.
Partnering with CitiesUPS and our city partners have a shared interest in reducing congestion, promoting sustainability, and enhancing quality of life for those we serve. We engage with city offi cials and business leaders, off er thought leadership and industry expertise, and work toward collaborative and innovative logistics solutions that minimize congestion, noise, and pollution.
In London, city offi cials are planning to expand and accelerate the Ultra Low Emissions Zone to further reduce emissions of NO2 and particulate matter in the city center. Working with the Freight Electric Vehicles in Urban Europe (FREVUE) project, we continue to convert select model delivery trucks from diesel to electric power, which eliminates tailpipe emissions and circumvents the limited availability of brand-new electric delivery vehicles. In 2016, we ramped up eff orts and continued deploying these vehicles in London, Paris, and various cities in Germany. At year end, we were operating
52 electric vehicles in central London — approximately 30 percent of our fl eet in the city center — 40 of which were diesel-to-electric conversion vehicles.
In 2016, we concluded a successful test of a range-extended electric vehicle, which carries a small generator that recharges the batteries and automatically turns on or off when entering or leaving the city center. This allows us to serve long-range routes while still operating as a fully electric vehicle in the city. We plan to deploy up to 15 range-extended electric vehicles in the U.K. in 2017.

80
Environmental Responsibility4.4 // Sustainable Solutions for Urban Logistics
Looking ahead, we have commissioned a prototype next-generation and autonomous-capable delivery vehicle which, if successful, will transform our f leet beyond converting diesel vehicles. We are exploring a smart grid project for central London, which would leverage the existing grid to power an electric f leet without requiring additional infrastructure upgrades. Additionally, we are participating in a consortium with the U.K. government to develop and deploy electric trailers that can be towed behind electrically assisted bicycles (eBike) or used by service providers on foot, increasing the package capacity of these vehicles.
Similar initiatives are also underway in other parts of Europe. In Paris, we plan to introduce 15 biomethane vehicles alongside diesel-to-electric conversion vehicles, creating the opportunity to compare performance of the two alternative vehicles.
In Germany’s city center of Hamburg, we use electric tricycles to pick up and deliver packages from a stationary trailer, signifi cantly reducing our vehicle presence. This “Cargo Cruiser” model is also being used in Off enbach and Oldenburg, with a similar fi rst eBike test pilot in motion in Portland, Oregon. Toulouse is also using a lighter model of the electrically-assisted tricycle. Other cities are being considered for future projects, generating new ideas among UPS engineering teams, academic and professional researchers, city leaders, and other urban mobility experts around the world.
Innovative “Final Mile” SolutionsCities are also exploring ways to reduce the number of vehicles on the road by consolidating “fi nal mile” deliveries to a single location. Creative solutions like the UPS Access Point™ network provide a consolidated delivery point — such as a local business — for safe and convenient pickups by many customers in the same area. UPS My Choice® service allows customers to choose a more convenient delivery time or location from their mobile device. These solutions help avoid unsuccessful deliveries, provide more fl exibility for consumers, and reduce miles driven and associated emissions.
Collaborating on a Path ForwardReducing urban congestion, noise, and pollution is as much about partnership as it is about innovation. Sharing best practices and harmonizing regulations and standards among cities is critical if delivery companies are to innovate in the most effi cient manner possible.
UPS is actively engaged in developing collaborative solutions through the World Business Council for Sustainable Development’s Zero Emission Cities Initiative, the University of Washington’s Urban Freight Lab, and other organizations.
As cities grow more crowded every day, UPS remains committed to addressing the challenges that lie ahead. By stimulating demand for alternative fuels and technologies, creating more sustainable solutions for our customers, and innovating our fl eet, we will continue to meet the ever-evolving demands of urban logistics.

Sustainable Urban Access SolutionsCities are becoming more crowded every day, and it is expected that 66 percent of the world’s
population will live in urban areas by 2050. As cities grow, so do the issues of congestion, noise,
air quality, and emissions. Here are a few examples of how UPS is innovating solutions to ensure
that we continue to meet our customers’ needs in effi cient and sustainable ways.
Electric VehiclesLess dense surrounding
areas utilize electric and
extended range vehicles
to provide zero and low
emissions solutions.
eBikeNew alternatives, such
as e-bikes, enable
UPS drivers to make
deliveries throughout
the city center for trips
less than 20 miles.
Deliveries by FootOn-foot UPSers make
deliveries throughout
the city center in
pedestrian-only zones.
UPS Access Point™ Locations
UPS Access Point locations
provide centralized sites
for package pick up and
drop off to increase
customer convenience and
reduce wasted miles and
associated emissions.
Central Container Distribution
City deliveries are distributed
from a centrally located
storage container driven daily
into the city to cut down on
trips in and out of city centers.
81

82
Environmental Responsibility4.4 // Sustainable Solutions for Urban Logistics
Personal electric vehicles are growing in use around the
world. But when it comes to commercial vehicles like
urban delivery trucks, the perception remains that electric
options aren’t yet available. That’s a misconception —
and Tevva Motors is at the forefront of changing it.
We off er a zero-emissions-capable freight truck with 7 to 18 tons of gross vehicle
weight and a fully electric range of 150 kilometers, or about 93 miles. This truck can
travel far outside its electric capacity, however, using a range extender — a small,
highly effi cient internal combustion engine that acts as a generator to recharge
the batteries if they become depleted while the vehicle is on the road. Embedded
Predictive Range Extender Management System (PREMS) soft ware helps the
two systems work in tandem. By calculating the vehicle’s daily energy needs,
PREMS ensures that the range extender operates only when necessary and
only in optimal environments. For example, it could run the vehicle on electric
power while moving through a congested city, then automatically switch to
range extender when the truck enters the motorway to return to its base.
The most obvious advantage of this technology is that the truck never runs out
of range, which signifi cantly broadens the scope of activities it can fulfi ll. Less
immediately obvious is that the range extender maximizes the total distance that the vehicle can travel with zero emissions, and the
PREMS system proactively manages any emissions to occur outside sensitive areas. Rather than keeping a margin of safety to avoid being
stranded with no battery charge, the range-extended vehicle uses batteries to their fullest potential.
The successful rollout of our vehicles wouldn’t have been
possible without UPS. Any new and groundbreaking technology
requires a lead customer, and Tevva is no diff erent. We began
working with UPS on a prototype in 2014, which we offi cially
launched in 2015 for a 12-month test period.
Partnering with UPS has enabled us to test and develop the core
concept vehicle and, critically, to prove its capability in a real-world
environment. Understanding the customer and their real-world
challenges is hugely important for any company’s success. UPS
was very open about their needs, and that allowed us to shape
our vision and develop our technology into something that
would bring value to UPS — and, in turn, benefi t other truck operators who use this technology. The credibility that comes from such
a proving ground is invaluable to our eff orts to reach the wider market.
At the same time, Tevva’s commitment to service and ongoing technical development has met UPS’s need for a zero-emissions vehicle
that can operate from depots well outside city centers. This places UPS well ahead of its competitors in terms of vehicle effi ciency.
With this proof of what’s possible, Tevva and UPS have become a united voice at forums such as the Low Carbon Vehicle Partnership.
Together, we can lead the way to work with policymakers regarding the use of delivery vehicles in urban environment while
simultaneously raising the profi le and acceptance of electric vehicles.
Asher BennettCEO, Tevva Motors
Stakeholder Perspective

83
Environmental Responsibility4.4 // Sustainable Solutions for Urban Logistics
4.5Fuel Supply
We outline the key strategies that govern our fuel supply management approach on page 70,
while other sections of this chapter discuss how we are improving the fuel effi ciency of our
air and ground fl eets through technology, advanced routing, and service off erings to our
customers. Here, we focus primarily on our use of alternative fuels, as well as insights gained
and challenges experienced from operating one of the largest private fl eets of alternative fuel
and advanced technology vehicles in the U.S.
Rolling LaboratoryOur ground fl eet has considerably more alternative fuel options than the air fl eet, and we have been exploring their use for the past three decades in our rolling laboratory. This is an opportunity to determine how alternative fuels and advanced technologies perform in diverse, real-world operating conditions.
Our business is dependent upon fuel to power both our air and ground fl eets. This dependence presents two business challenges. First, we must ensure we have access to reliable, readily available, cost-eff ective, petroleum-based fuel. Second, we must manage the environmental impacts inherent in our business, as well as the growing regulations to mitigate emissions around the world. Alternative fuels and advanced technologies offer ways to help address these challenges. The ability to economically produce and access these alternative fuels at a sustainable commercial scale remains a key challenge.
We take a broad approach to alternative fuel and advanced technology vehicles, evaluating all technologies on a global basis and attempting to deploy solutions in regions where they are economically viable. For example, compressed natural gas (CNG) and propane are lower-emission, petroleum-based alternatives that are readily available and work well in North America, whereas the emphasis in much of Europe is on zero tailpipe solutions, such as electric vehicles. The diversity of our rolling laboratory helps us address these regional disparities.
The breadth of our engagement in alternative fuel and technology development is measured through the Alternative Fuel & Advanced Technology Miles Driven KPI (see page 11).
The continued growth of our engagement refl ects a long-term view and commitment to meet our customers’ needs for clean, low-carbon transportation options. It takes years, oft en decades, to develop alternative fuels and advanced technologies, which requires a commitment to stay the course, even in diffi cult business environments. This was the case in 2016 when the price of crude oil averaged under US$50 a barrel, about half the average price in the previous fi ve-year period.
Our Commitment
to Alternative FuelsUPS will remain the industry
leader in seeking alternative fuel
opportunities for our worldwide fl eet.
These acts of leadership demonstrate our
eff orts and continually underscore our commitment
as we work to:
• Protect the global environment;
• Deliver packages and freight globally with the
most environmentally friendly equipment
possible; and
• Pave the way for other transportation fl eets to do
more by continuing to be a leader in alternative
fuel and advanced technology vehicles.
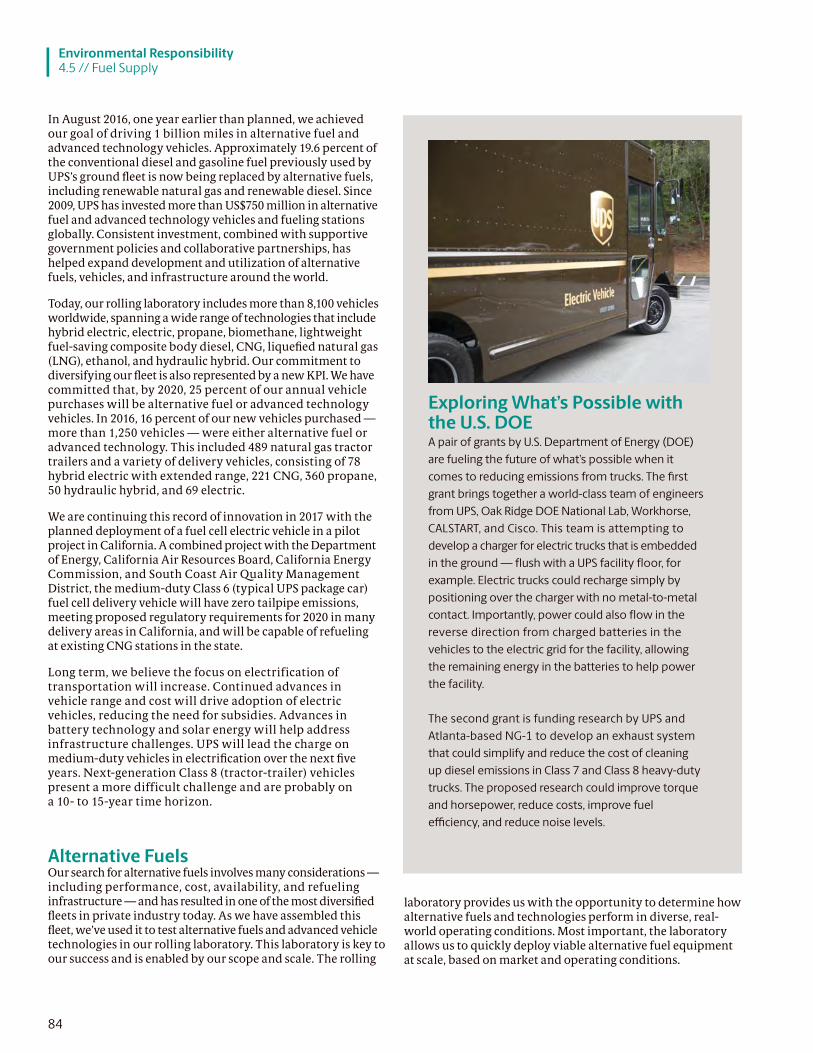
84
In August 2016, one year earlier than planned, we achieved our goal of driving 1 billion miles in alternative fuel and advanced technology vehicles. Approximately 19.6 percent of the conventional diesel and gasoline fuel previously used by UPS’s ground fl eet is now being replaced by alternative fuels, including renewable natural gas and renewable diesel. Since 2009, UPS has invested more than US$750 million in alternative fuel and advanced technology vehicles and fueling stations globally. Consistent investment, combined with supportive government policies and collaborative partnerships, has helped expand development and utilization of alternative fuels, vehicles, and infrastructure around the world.
Today, our rolling laboratory includes more than 8,100 vehicles worldwide, spanning a wide range of technologies that include hybrid electric, electric, propane, biomethane, lightweight fuel-saving composite body diesel, CNG, liquefi ed natural gas (LNG), ethanol, and hydraulic hybrid. Our commitment to diversifying our fl eet is also represented by a new KPI. We have committed that, by 2020, 25 percent of our annual vehicle purchases will be alternative fuel or advanced technology vehicles. In 2016, 16 percent of our new vehicles purchased — more than 1,250 vehicles — were either alternative fuel or advanced technology. This included 489 natural gas tractor trailers and a variety of delivery vehicles, consisting of 78 hybrid electric with extended range, 221 CNG, 360 propane, 50 hydraulic hybrid, and 69 electric.
We are continuing this record of innovation in 2017 with the planned deployment of a fuel cell electric vehicle in a pilot project in California. A combined project with the Department of Energy, California Air Resources Board, California Energy Commission, and South Coast Air Quality Management District, the medium-duty Class 6 (typical UPS package car) fuel cell delivery vehicle will have zero tailpipe emissions, meeting proposed regulatory requirements for 2020 in many delivery areas in California, and will be capable of refueling at existing CNG stations in the state.
Long term, we believe the focus on electrification of transportation will increase. Continued advances in vehicle range and cost will drive adoption of electric vehicles, reducing the need for subsidies. Advances in battery technology and solar energy will help address infrastructure challenges. UPS will lead the charge on medium-duty vehicles in electrifi cation over the next fi ve years. Next-generation Class 8 (tractor-trailer) vehicles present a more difficult challenge and are probably on a 10- to 15-year time horizon.
Alternative FuelsOur search for alternative fuels involves many considerations — including performance, cost, availability, and refueling infrastructure — and has resulted in one of the most diversifi ed fl eets in private industry today. As we have assembled this fl eet, we’ve used it to test alternative fuels and advanced vehicle technologies in our rolling laboratory. This laboratory is key to our success and is enabled by our scope and scale. The rolling
laboratory provides us with the opportunity to determine how alternative fuels and technologies perform in diverse, real-world operating conditions. Most important, the laboratory allows us to quickly deploy viable alternative fuel equipment at scale, based on market and operating conditions.
Environmental Responsibility4.5 // Fuel Supply
Exploring What’s Possible with the U.S. DOEA pair of grants by U.S. Department of Energy (DOE)
are fueling the future of what’s possible when it
comes to reducing emissions from trucks. The fi rst
grant brings together a world-class team of engineers
from UPS, Oak Ridge DOE National Lab, Workhorse,
CALSTART, and Cisco. This team is attempting to
develop a charger for electric trucks that is embedded
in the ground — fl ush with a UPS facility fl oor, for
example. Electric trucks could recharge simply by
positioning over the charger with no metal-to-metal
contact. Importantly, power could also fl ow in the
reverse direction from charged batteries in the
vehicles to the electric grid for the facility, allowing
the remaining energy in the batteries to help power
the facility.
The second grant is funding research by UPS and
Atlanta-based NG-1 to develop an exhaust system
that could simplify and reduce the cost of cleaning
up diesel emissions in Class 7 and Class 8 heavy-duty
trucks. The proposed research could improve torque
and horsepower, reduce costs, improve fuel
effi ciency, and reduce noise levels.

85
Environmental Responsibility4.5 // Fuel Supply
When our fleet of alternative fuel and advanced
technology vehicles logged its one billionth mile in
2016, we wondered, “At what point will the alternative
fl eet become the norm?” The answer: sooner than you
might think. We are bringing that answer closer with
our new goal of committing 25 percent of our total
new vehicle purchases to this fl eet by 2020.
Today, UPS has more than 8,100 vehicles on the road powered by some form
of low-carbon fuel or technology such as electricity, natural gas, or synthetic
fuel. We’ve set a new goal for these specialized vehicles to account for 25 percent
of our new vehicle purchases by 2020. At that rate, our alternative fleet
begins to build critical mass, and the potential for a signifi cantly lower-carbon
transportation footprint is within reach.
Continuing technology gains are a must. We’re especially excited about the potential
of renewable fuel-cell electric vehicle technology, which has zero tailpipe emissions.
This summer, we expect a pilot project in California will enable us to put a renewable
fuel-cell electric package car (Class 6 delivery vehicle) on the road.
The matter of class —- as in vehicle size —- remains a challenge.
While we have a portfolio of alternative technologies for Class 6
and smaller delivery vehicles, low-carbon propulsion systems
to power a class 8 truck tractor are limited, since these tractors
pull trailers weighing up to 80,000 pounds. Renewable
compressed and liquefi ed natural gas are the best option
today, but lack adequate commercial scale and
infrastructure for the immediate future.
Electrifi cation will play a major role in the future of transportation.
In many areas of the world, electrical grids must keep pace with
electric vehicle technology. Today, that’s a challenge in Europe,
where older infrastructure is costly to update, and in Asia, where
adequate infrastructure has yet to be built.
The greatest obstacle to low-carbon transportation, however, may simply be one of economics. In prolonged periods of low
petroleum prices, incentives for research and investment in alternative fuels and technologies decline, and the business case for
gasoline substitutes becomes much harder to make.
The good news: none of these challenges are insurmountable. When our rolling lab took to the road more than a decade ago, the
prospect of driving a billion miles or substituting as much as 20 percent of conventional ground fuel appeared to be a very steep climb.
Today, both of those aspirations are reality. If we continue to employ the same level of commitment and ingenuity that helped us
reach 1 billion miles, we’re confi dent that a lower-carbon horizon will grow steadily closer.
Mike BrittDirector of Maintenance and Engineering -International Operations
UPS Perspective

86
The insights we gain are used to plan investments and develop future strategies. We also share these insights with vehicle manufacturers and energy suppliers to enhance their understanding of how products can help make transportation more sustainable. When a particular fuel or technology demonstrates sustainable benefi ts in the laboratory, we take it to commercial scale through large purchases or infrastructure development if required. We demonstrate this approach through actual use of renewable fuels, as well as a commitment to help commercialize them.
We have committed that, by 2025, 40 percent of our total ground-f leet fuel purchases will be from alternative fuels. The use of alternative fuels is a key strategy to achieving our absolute GHG reduction goal of 12 percent by 2025. Alternative fuels are defi ned as fuels that produce lower lifecycle CO2 emissions than conventional diesel and gasoline. The fuels UPS is currently using that meet the defi nition of alternative fuels are CNG, LNG, propane, renewable diesel, renewable natural gas (RNG), biodiesel, and ethanol. In 2016, we used over 97 million gallons of alternative fuels to fuel our ground fl eet, which represents 19.6 percent of our total ground-fl eet fuel purchased.
RNG is produced in landfi lls and other places where organic matter decomposes and releases methane, which can be captured to provide a viable source of renewable transportation fuel. Because methane is 28 times more powerful a GHG than CO2, the use of RNG provides a compelling, two-for-one GHG solution by replacing diesel and other petroleum-based truck fuels and avoiding the release of methane into the atmosphere. Our RNG purchases are not only helping to commercialize this fuel, but also demonstrate how our scale plays a role in that commercialization process. We can oft en generate enough demand volume from a landfi ll so that they can streamline their selling process to one purchaser rather than multiple parties.
Also known as synthetic diesel, renewable diesel is an emerging alternative fuel that off ers numerous benefi ts over fi rst-generation alternative fuels such as biodiesel and ethanol. This fuel is chemically identical to conventional diesel fuel and can be produced at commercial scale from a variety of organic sources. In addition to renewable inputs, the most signifi cant advantage to this alternative fuel is its ability to serve as a “drop-in” replacement for traditional petroleum-based diesel without blending or infrastructure constraints. This means that renewable diesel could be used in both existing conventional engine technology, as well as refueling infrastructure. The development of this fuel, however, presents challenges that include cost and, depending on the organic source used, potential disruption to other markets.
Natural GasNatural gas remains one of the foundational fuels of our alternative fl eet, thanks to its ability to meet our diverse needs — especially the demands of the heavy-duty, over-the-road trucks that connect our regional hubs. These big rigs travel an average of 400 to 600 miles per day and require strong pulling power. CNG and LNG have proven to be the best alternatives
to diesel for these trucks, meeting their required range and performance criteria while burning cleaner than diesel or gasoline. CNG also performs well in our package cars on local routes averaging more than 100 miles daily.
Natural gas works, in large part, because of its environmental benefi ts and cost effi ciency. Higher-priced alternative fuel vehicles and investment in alternative fueling infrastructure require an environment that supports fuel savings. The payback on these investments typically requires deployment in areas served by high-mileage shipments and availability of lower-cost alternative fuels. The enormous expansion in U.S. natural gas production and natural gas reserves engenders confi dence that natural gas prices will remain attractive, compared with diesel prices, for the foreseeable future.
To support our expanding natural gas fl eet, we continue to invest in refueling infrastructure. We build our own infrastructure to ensure our fl eet has access to fuel, and we have full transparency of all costs involved. In 2016, we opened 11 more CNG fueling stations in cities throughout the United States. We now have 44 CNG and LNG stations in 21 states. We will further expand our refueling infrastructure with an additional eight CNG stations in 2017. UPS has invested more than US$750 million in alternative fuel and advanced technology vehicles and fueling stations globally since 2009. This infrastructure positions UPS to implement the use of RNG. As a result, UPS is now the largest user of RNG in the shipping business.
Environmental Responsibility4.5 // Fuel Supply
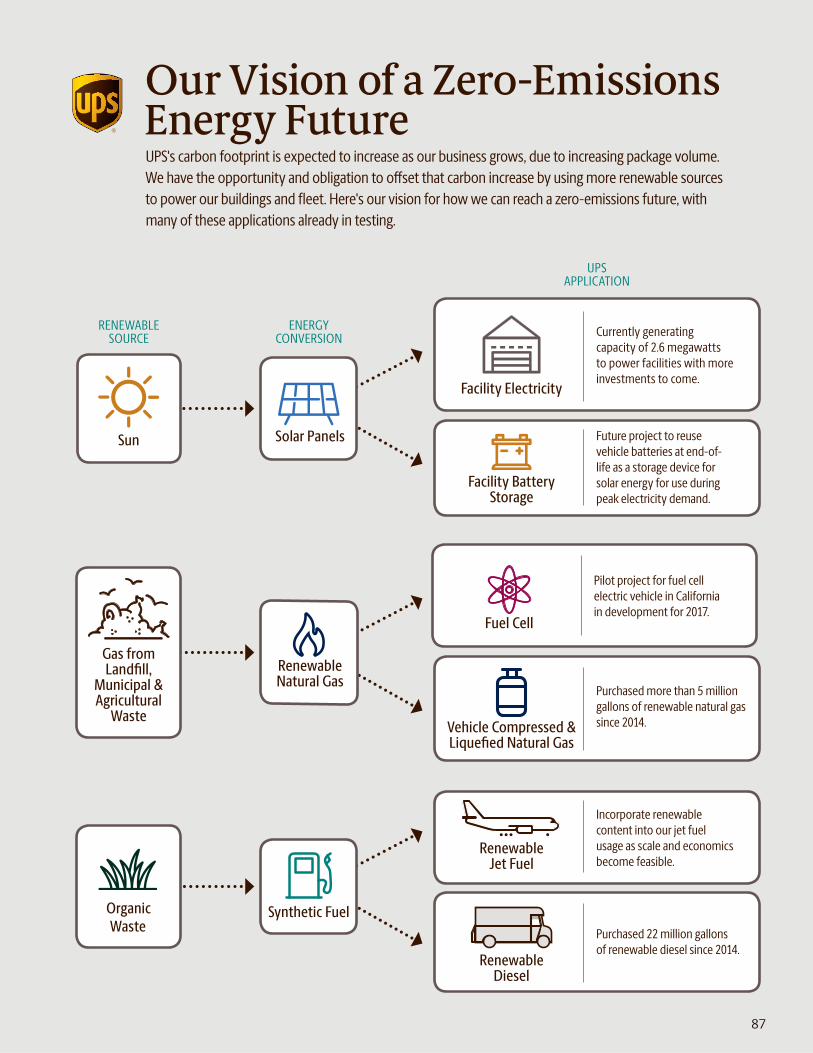
UPSAPPLICATION
Facility Electricity
Sun
RENEWABLE SOURCE
RenewableJet Fuel
RenewableDiesel
ENERGYCONVERSION
Our Vision of a Zero-Emissions Energy FutureUPS's carbon footprint is expected to increase as our business grows, due to increasing package volume.
We have the opportunity and obligation to off set that carbon increase by using more renewable sources
to power our buildings and fl eet. Here's our vision for how we can reach a zero-emissions future, with
many of these applications already in testing.
Synthetic Fuel
Currently generating
capacity of 2.6 megawatts
to power facilities with more
investments to come.
Gas from Landfi ll,
Municipal & Agricultural
Waste
RenewableNatural Gas
Purchased 22 million gallons
of renewable diesel since 2014.
Incorporate renewable
content into our jet fuel
usage as scale and economics
become feasible.
Facility Battery Storage
Future project to reuse
vehicle batteries at end-of-
life as a storage device for
solar energy for use during
peak electricity demand.
Fuel Cell
Pilot project for fuel cell
electric vehicle in California
in development for 2017.
Vehicle Compressed & Liquefi ed Natural Gas
Purchased more than 5 million
gallons of renewable natural gas
since 2014.
Organic Waste
Solar Panels
87

Headline
88
Appendix A
Appendix A About this Report 89
B Statement of Greenhouse Gas Emissions 91
C Initiatives to Reduce Greenhouse Gas Emissions 102
D Energy Performance 103
E GRI Content Index 105
88

89
Appendix A
About This Report102-50 | 102-51 | 102-52
Reporting PeriodThe report presents data as of December 31, 2016. We issue our Corporate Sustainability Report on an annual basis, including our previous Report focused on 2015.
For Key Performance Indicators (KPIs), we present fi gures for up to four years (see pages 10, 11).
102-54 | 102-55
GRI ContentGRI StandardsThe Report is organized and presented in accordance with the GRI Standards published in 2016, established by the Global Reporting Initiative (GRI).
The GRI Standards include two options for reporting in accordance: “Core” and “Comprehensive.” This Report has been prepared in accordance with the GRI Standards: Comprehensive option. We also present signifi cant amounts of additional information not specifi ed by GRI, such as statements contributed by outside stakeholders and graphics that illustrate various aspects of our business. UPS has voluntarily followed GRI reporting guidelines since 2003.
GRI Standards Content Index ServiceContent Index service for the GRI Standards emphasizes the importance of the accuracy and usability of GRI Content Index. The Content Index Service confi rms that all disclosures required for a Comprehensive GRI Standards based sustainability report, are accurately included in the Content Index, as required by disclosures GRI 102-54 and 102-55. This Report has completed the Context Index Service successfully.
GRI Standards IndexWe provide a complete GRI Standards content index in Appendix E, beginning on page 105.
GRI IndicatorsDisclosures on GRI indicators are noted near the titles of chapters and their subsections. These support transparent and comparable disclosures about sustainability within and across industries.
102-56
External Assurance Report,
Statements, or OpinionsWe believe external assurance is vital to the credibility and transparency of sustainability reporting and performance for all companies, because it promotes the broader cause of sustainability. We therefore engage with experienced and respected third parties to assure and verify our sustainability reporting. Authorization for these engagements, and approval of the providers we select, comes from the Audit Committee of our Board of Directors, which is our highest governance body. The assurance providers we engage with are independent organizations that offer objective analysis and conclusions, free from outside inf luence.
GRI recommends the use of external assurance, but it is not a requirement to be in accordance with the Standards. We maintain a strong assurance program that includes the following external assurance reports:
• Deloitte & Touche LLP provides a review report on this Corporate Sustainability Report. Their external assurance statement is on page 90.
• Deloitte & Touche LLP provides an examination report on our global Statement of Greenhouse Gas Emissions. Their external assurance statement is included in Appendix B, on page 101.
For this Report, we engaged Deloitte & Touche LLP to conduct a review, in accordance with attestation standards established by the American Institute of Certifi ed Public Accountants, which includes AT Section 101, Attest Engagements, to provide a limited level of assurance on our 2016 Corporate Sustainability Report.
We also engaged Deloitte & Touche LLP to conduct an examination, in accordance with attestation standards established by the American Institute of Certifi ed Public Accountants, which includes AT Section 101, Attest Engagements, to provide a reasonable level of assurance on our Statement of Greenhouse Gas Emissions for the year ended December 31, 2016.
102-53
Contact UsPlease send comments or questions about this Report to [email protected], or in writing to:
UPSAttention: Sustainability Report Editor 55 Glenlake Parkway N.E.Atlanta, Georgia 30328

90
Appendix A
Board of Directors
United Parcel Service, Inc.
Atlanta, Georgia
We have reviewed the accompanying 2016 Corporate Sustainability Report of United Parcel Service, Inc. (the “Company”) for the year
ended December 31, 2016. The Company’s management is responsible for preparing and presenting the Corporate Sustainability
Report in accordance with the Global Reporting Initiative Sustainability Reporting Standards under its Comprehensive option. Our
responsibility is to express a conclusion on the Corporate Sustainability Report based on our review.
Our review was conducted in accordance with attestation standards established by the American Institute of Certifi ed Public Accountants.
Those standards require that we plan and perform the review to obtain limited assurance about whether any material modifi cations
should be made to the Corporate Sustainability Report in order for it to be presented in accordance with the criteria. A review is substantially
less in scope than an examination, the objective of which is to obtain reasonable assurance about whether the Corporate Sustainability
Report is presented in accordance with the criteria, in all material respects, in order to express an opinion. Accordingly, we do not express
such an opinion. We believe that our review provides a reasonable basis for our conclusion.
The preparation of the Corporate Sustainability Report requires management to interpret the criteria, make determinations as to
the relevancy of information to be included, and make estimates and assumptions that aff ect reported information. Measurement
of certain amounts and metrics, some of which may be referred to as estimates, is subject to substantial inherent measurement
uncertainty. Obtaining suffi cient, appropriate review evidence to support our conclusion does not reduce the inherent uncertainty
in the amounts and metrics. The selection by management of diff erent but acceptable measurement methods, input data, or model
assumptions, or a diff erent point value within the range of reasonable values produced by the model, may have resulted in materially
diff erent amounts or metrics being reported.
Based on our review, we are not aware of any material modifi cations that should be made to the accompanying 2016 Corporate
Sustainability Report of the Company for the year ended December 31, 2016, in order for it to be presented in accordance with the
Global Reporting Initiative Sustainability Reporting Standards under its Comprehensive option.
Stamford, CT
June 2, 2017
Independent Accountants’ Review Report

Appendix B
Statement of Greenhouse Gas (GHG) Emissions for the years ended December 31, 2016 and 2015
GHG Performance
Global CO2e Emissions (‘000 tonnes) 2016 2015(2) % Change 15/16 Base Year(1)
Scope 1 12,432 12,197 1.9% 12,197
Scope 2 (location-based) 831 814 2.1% 814
Gross Scope 1 & 2 13,263 13,011 1.9% 13,011
Scope 3 17,430 16,877 3.3% 16,877
Gross Scope 1, 2 & 3 30,693 29,888 2.7% 29,888
Voluntary carbon off sets for Scope 1 carbon neutral service (retired) (95.7) (44.9) (44.9)
Voluntary carbon off sets for Scope 2 carbon neutral service (retired) (6.0) (3.2) (3.2)
Voluntary carbon off sets for Scope 3 carbon neutral service (retired) (9.0) (4.8) (4.8)
Net Global CO2e Emissions 30,582 29,835 2.5% 29,835
Biomass CO2 Emissions
(‘000 tonnes, not included in above totals) 2016 2015 % Change 15/16 Base Year(1)
Mobile Combustion — Biomass CO2 (e.g. ethanol, bio-diesel) 216 108 100% 108
Stationary Combustion — Biomass CO2 0 0 0% 0
Total Biomass CO2 (reported separately as per GHG Protocol) 216 108 100% 108
Scope 2 CO2e Emissions (‘000 tonnes)(3) 2016 2015 % Change 15/16 Base Year (1)
Scope 2 (location-based method) 831 814 2.1% 814
Scope 2 (market-based method) 831 814 2.1% 814
(1) Base Year has been changed to 2015, to align with new GHG reduction goal.
(2) Recalculated 2015 using updated GWP factors and added emissions for Coyote Logistics. See Note 1, Methodology for additional details.
(3) Location-based and market-based Scope 2 emissions are being reported as per the new GHG Protocol Scope 2 Guidance. UPS does not have any existing contractual instruments in place for specifi c emission factors from purchased electricity, therefore the average energy generation emission factors based on location are used for both Scope 2 methods.
Note 1 — GHG Reporting PoliciesThe statement of greenhouse gas (GHG) emissions was prepared based on a calendar reporting year that is the same as the United Parcel Service, Inc. (UPS or the Company) fi nancial reporting period. Organizational responsibility for our GHG emissions reporting rests with our Chief Sustainability Offi cer.
Scope 1 and 2 GHG emissions information was prepared in accordance with the World Resources Institute/World Business Council for Sustainable Development Greenhouse Gas Protocol: A Corporate Accounting and Reporting Standard, Revised Edition.
Scope 3 GHG emissions information was prepared in accordance with the World Resources Institute/World Business Council for Sustainable Development Greenhouse Gas Protocol: Corporate Value Chain (Scope 3), Accounting and Reporting Standard. Scope 3 emissions include all relevant Scope 3 categories, nine of the 15 categories as defi ned by the GHG Protocol.
Collectively, the Corporate Accounting and Reporting Standard, Revised Edition and the Corporate Value Chain (Scope 3), Accounting and Reporting Standard are referred to as the “GHG Protocol” in this document.
Notes 2-7 below include information on the GHG emissions by
business unit, emission source, and gas type, as well as intensity disclosures.
Base Year GHG Emissions The GHG base year is set out below and has been prepared in accordance with the GHG Protocol.
The base year GHG emissions for Scope 1, 2, and 3 were changed to align with our new GHG reduction goal.
Greenhouse GasesAll GHG emissions fi gures are reported in metric tonnes of carbon dioxide equivalents (CO2e) and include four of the seven GHGs covered by the GHG Protocol — carbon dioxide (CO2), methane (CH4), nitrous oxide (N2O), and hydrofl uoro-carbons (HFCs). Perfl uorocarbons (PFCs), sulphur hexafl uoride (SF6), and nitrogen trifl ouride (NF3) emissions were omitted from our reporting, as they are not a material source of GHGs for the Company.
The GHG Protocol defi nes global warming potential (GWP) as “a factor describing the radiative forcing impact (degree of harm to the atmosphere) of one unit of a given GHG relative to one unit of CO2.” By using GWPs, GHG emissions from multiple gases can
91
305-1 | 305-2 | 305-3

92
Appendix BAppendix B
Statement of GHG Emissions for the years ended December 31, 2016 and 2015
be standardized to a carbon dioxide equivalent (CO2e). The global warming potentials used are
Gas
Global Warming
Potential (GWP) Reference
Carbon Dioxide (CO2) 1Fift h Assessment
Report (SAR) published by
Intergovernmental Panel
on Climate Change
Methane (CH4) 28
Nitrous Oxide (N2O) 265
HFC-134a 1300
GHG Reporting Scope and BoundaryThe Statement of Greenhouse Gas Emissions includes Scope 1 (direct), Scope 2 (indirect), and Scope 3 (indirect) emissions that were reported for operations within the organizational bound-ary described below. GHG emissions have been reported from the entities where the Company has operational control as defi ned by the GHG Protocol. See Notes 8 and 9 for a detailed description of the operational boundaries.
UPS is a global company operating in over 220 countries and territories. Our three reportable business segments are U.S. Domestic Package, International Package, and Global Supply Chain and Freight.
1. The U.S. Domestic Package business consists of air and ground delivery of small packages — up to 150 pounds in weight — and letters to and from all 50 states.
2. The International Package reporting segment includes the small package operations in Europe; Asia; Canada; Latin America; and the Indian Subcontinent, Middle East, and Africa. Europe is our
largest region outside the United States — accounting for approx-imately half of our international revenue.
3. The Global Supply Chain & Freight segment consists of our for-warding and logistics services, truckload freight brokerage, UPS Freight and our fi nancial off erings through UPS Capital. Supply chain complexity creates demand for a global service off ering that incorporates transportation, distribution, and international trade and brokerage services, with complemen-tary fi nancial and information services.
UncertaintyAs calculations of GHG emissions contain uncertainty for a variety of reasons, we conducted an uncertainty analysis to quantify estimates of the likely or perceived diff erence between the reported GHG emissions and a qualitative description of the likely causes of the diff erence such as uncertainty in data inputs and calculation methodologies; uncertainty associated with mathematical equations used to characterize the relation-ship between various parameters and emission processes; and uncertainty associated with quantifying the parameters used as inputs to estimation models. UPS continues to improve internal processes for primary data collection to reduce uncertainty in its GHG inventory reporting for Scopes 1 and 2. UPS continues to work with the third parties responsible for providing the data necessary to calculate Scope 3 emissions and will continue to work on improving the data management and the methodologies used to estimate these emissions to reduce the uncertainty in our GHG inventory reporting. Using the GHG Protocol “Measurement and Estimation Uncertainty of GHG Emissions” guidance and analyzing the collected data through Monte Carlo simulations by using the @Risk statistical analysis soft ware at 95 percent confi dence interval, we are able to estimate the uncertainty for our 2016 GHG inventory as follows:
Scope Uncertainty
Main Source
of Uncertainty Comments
Scope 1 +/- 1% International Operations North America Operations (Small Package, Supply Chain & Freight) and UPS Airlines are our
largest source of Scope 1 emissions and represent 98% of the total Scope 1 emissions. Well-
established processes are in place to capture the primary data for these sources.
International Operations represent 2% of the total Scope 1 emissions.
Scope 2 +/- 2% International Operations North America Operations (Small Package, Supply Chain & Freight) are our largest source of
Scope 2 emissions representing 89% of the total Scope 2 emissions. Well-established
processes are in place to capture the primary data for these sources.
International Operations represent 11% of the total Scope 2 emissions.
Scope 3 +/- 8% Use of
secondary data
UPS reports on all relevant Scope 3 categories described in the Greenhouse Gas Protocol
Corporate Value Chain (Scope 3) Accounting & Reporting Standard.
Calculations for Scope 3 use various sources of secondary data since primary data is
unavailable. Examples of the type of secondary data used vary from estimated miles driven,
number of packages picked-up/delivered to estimated shipment information (weight and
distance per shipment).

93
Appendix B
Statement of GHG Emissions for the years ended December 31, 2016 and 2015
Scope 3 — Global Category 1 & 2: GHG Protocol Scope 3 Evaluator
Category 3: Argonne National Laboratory GREET_1 2014 Model
Category 3: US Environmental Protection Agency eGRID_2012
Category 4: EPA SmartWay Carrier Rankings and Emission Rates (railroad only)
Category 6: EPA Emission Factors for GHG Inventories, Nov 2015
Category 4, 7, 14: GHG Protocol Emission Factors from Cross-Sector Tools, April 2014
Category 5 & 12: 2012 Guidelines to DEFRA/DECC’s GHG Conversion Factors for Company Reporting
Methodology For Scopes 1 and 2, primary usage data is used to calculate GHG Emissions. The primary data is collected through various internal pro-cesses and data systems which are inputted into our sustainability performance management soft ware that quantifi es associated emis-sions through the application of the GHG emission factors described above.
GHG emission calculations for Scope 3 use various sources of secondary data since primary data is unavailable. The secondary data used varies from estimated miles driven, number of packages picked-up/delivered to estimated shipment information (weight and distance per shipment). The appropriate GHG activity factor is applied to estimate the emissions reported.
UPS recalculated 2015 Scope 1, 2, and 3 GHG emissions using updated global warming potential (GWP) factors to align with the Fift h Assessment Report (SAR) published by the Intergovernmental Panel on Climate Change. Previous inventory years used the GWP factors published in the second assessment. In addition, the 2015 Scope 3, category 4 GHG emissions were recalculated to include the acquisition of Coyote Logistics Midco, Inc.
Note 2 — Carbon Off set Purchases from UPS carbon neutral productA carbon off set is a certifi ed fi nancial instrument aimed at a reduction in GHG emissions. The off sets we purchase meet the key standard of additionality, which means that the carbon reduction project in question (such as reforestation) produced a reduction in CO2e gener-ation or sequestration of CO2e in addition to what would have been achieved by activities already planned or underway.
Project Name
Project
Location
Off set
Standard Project Type
2016
Metric
Tonnes
Retired
2015
Metric
Tonnes
Retired
The Conservation Fund — Garcia River Forest U.S. (California) CAR Reforestation 52,557 39,514
The Conservation Fund — Big River and Salmon Creek Forests U.S. (California) CAR Reforestation 25,000 0
Wolf Creek Landfi ll U.S. (Georgia) CAR Landfi ll Gas 10,000 0
Chol Charoen Group Wastewater Treatment with Biogas
System 1
Thailand VCS Wastewater
Methane
Destruction
13,257 13,420
Bangkok Kamphaeng Saen East: Landfi ll Gas to Electricity
Project
Thailand VCS Landfi ll Gas 10,000 0
Total Carbon
Off sets 110,814 52,934
GHG Emission FactorsThe carbon dioxide equivalent emissions associated with the activities described in Notes 8 and 9 were determined on the basis of measured or estimated energy and fuel use, multiplied by relevant carbon emission factors.
Published emission factors were used to calculate emissions from operations.
Emissions Source Emission Factor Employed
Scope 1 — Global GHG Protocol Emission Factors from Cross-Sector Tools, April 2014
Scope 2 — U.S. US Environmental Protection Agency eGRID_2012
Scope 2 — Canada Environment Canada, National Inventory Report, 1990-2012
Scope 2 — Other CO2 Emissions from Fuel Combustion Highlights (2014 Edition © OECD/IEA)

94
Appendix B
Note 3 — Emissions by Business Unit
Global CO2e
Emissions
(‘000 tonnes)
U.S. Domestic Package International Package
Global Supply
Chain & Freight Totals
2016 2015(2)
Base
Year(1) 2016 2015(2)
Base
Year(1) 2016 2015(2)
Base
Year(1) 2016 2015(2)
Base
Year(1)
Scope 1 7,446 7,186 7,186 4,254 4,150 4,150 732 861 861 12,432 12,197 12,197
Scope 2 627 602 602 63 71 71 141 141 141 831 814 814
Total Scope 1 & 2 8,073 7,789 7,789 4,317 4,221 4,221 873 1,001 1,001 13,263 13,011 13,011
Scope 3 8,811 8,287 8,287 2,692 2,552 2,552 5,926 6,038 6,038 17,430 16,877 16,877
Total Scope 1, 2 & 3 16,884 16,076 16,076 7,009 6,772 6,772 6,799 7,040 7,040 30,693 29,888 29,888
(1) Base Year is 2015.
(2) Recalculated 2015 using updated GWP factors and added emissions for Coyote Logistics. See Note 1, Methodology for additional details.
305-4
Note 4 — CO2e Intensity by Business Unit
Global CO2e
(‘000 tonnes/
$M Revenue)
U.S. Domestic Package International Package
Global Supply
Chain & Freight Totals
2016 2015(2)
Base
Year(1) 2016 2015(2)
Base
Year(1) 2016 2015(2)
Base
Year(1) 2016 2015(2)
Base
Year(1)
Revenue in millions $38,301 $36,747 $36,747 $12,350 $12,149 $12,149 $10,255 $9,467 $9,467 $60,906 $58,363 $58,363
Scope 1 0.194 0.196 0.196 0.344 0.341 0.341 0.071 0.091 0.091 0.204 0.209 0.209
Scope 2 0.017 0.016 0.016 0.005 0.006 0.006 0.014 0.015 0.015 0.014 0.014 0.014
Total Scope 1 & 2 0.211 0.212 0.212 0.350 0.347 0.347 0.085 0.106 0.106 0.218 0.223 0.223
Scope 3 0.230 0.225 0.225 0.218 0.210 0.210 0.578 0.638 0.638 0.286 0.289 0.289
Total Scope 1, 2 & 3 0.441 0.437 0.437 0.568 0.557 0.557 0.663 0.744 0.744 0.504 0.512 0.512
(1) ) Base Year is 2015.
(2) Recalculated 2015 using updated GWP factors and added emissions for Coyote Logistics. See Note 1, Methodology for additional details.
Statement of GHG Emissions for the years ended December 31, 2016 and 2015

95
Appendix B
Statement of GHG Emissions for the years ended December 31, 2016 and 2015
Note 5 — Scope 1 and Scope 2 Emissions by Source
Global CO2e Emissions (‘000 tonnes) 2016 2016 Percent to Total 2015(2) Base Year(1)
Airline Fuel 7,720 58.2% 7,375 7,375
Ground Vehicle Fuel 4,496 33.9% 4,587 4,587
Diesel 3,050 23.0% 3,345 3,345
Gasoline 905 6.8% 823 823
CNG 197 1.5% 43 43
Propane/LPG 75 0.6% 70 70
LNG 262 2.0% 299 299
HFCs (fugitive) 7 0.1% 7 7
Facility Fuel 216 1.6% 235 235
Natural Gas 202 1.5% 221 221
Heating Oil 4 0.0% 5 5
Propane 10 0.1% 9 9
Facility Electricity 831 6.3% 814 814
Grand Total 13,263 13,011 13,011
(1) Base Year is 2015.
(2) Recalculated 2015 using updated GWP factors and added emissions for Coyote Logistics. See Note 1, Methodology for additional details.
Note 6 — Emissions by Greenhouse Gas Scope and Type
Global Emissions
(‘000 tonnes)
Scope 1 Scope 2 Scope 3 Totals
2016 2015(2)
Base
Year(1) 2016 2015(2)
Base
Year(1) 2016 2015(2)
Base
Year(1) 2016 2015(2)
Base
Year(1)
Carbon
Dioxide
(CO2) 12,294 12,072 12,072 827 810 810 17,354 16,796 16,796 30,476 29,678 29,678
Methane (CO2e) 33 29 29 0.5 0.5 0.5 10 10 10 44 39 39
(CH4) 1.18 1.02 1.02 0.02 0.02 0.02 0.35 0.37 0.37 1.55 1.41 1.41
Nitrous Oxide (CO2e) 97 90 90 3 3 3 66 71 71 166 164 164
(N2O) 0.37 0.34 0.34 0.01 0.01 0.01 0.25 0.27 0.27 0.63 0.62 0.62
HFCs (CO2e) 7.1 6.8 6.8 0 0 0 0 0 0 7.1 6.8 6.8
(HFCs) 0.005 0.005 0.005 0 0 0 0 0 0 0.005 0.005 0.005
(1) Base Year is 2015.
(2) Recalculated 2015 using updated GWP factors and added emissions for Coyote Logistics. See Note 1, Methodology for additional details.

96
Appendix BAppendix B
Statement of GHG Emissions for the years ended December 31, 2016 and 2015
305-3
Note 7 — Scope 3 Emissions by Category
Global CO2e Emissions (‘000 tonnes) 2016 2015(2) Base Year(1)
Total Scope 3 Emissions 17,430 16,877 16,877
UPSTREAM
1 Purchased Goods & Services 2,478 2,533 2,533
2 Capital Goods 2,175 1,746 1,746
3 Fuel & Energy Related (not incl. Scope 1 & 2) 3,312 3,226 3,226
Jet A (well to pump) 2,016 1,926 1,926
Diesel (well to pump) 693 760 760
Gasoline (well to pump) 298 271 271
CNG (well to pump) 52 12 12
Propane/LPG (well to pump) 10 9 9
LNG (well to pump) 63 72 72
Biomass (well to pump) 70 63 63
Natural Gas, Heating Oil, Propane (stationary) 50 55 55
Electricity (T&D losses/generation of) 60 59 59
4 Transportation & Distribution 7,468 7,417 7,417
Subcontracted Air 3,436 3,805 3,805
Subcontracted Ground 3,216 2,784 2,784
Subcontracted Rail 369 368 368
Subcontracted Ocean 446 461 461
5 Waste Generated in Operations 22 19 19
Landfi lled, Incinerated, Recovery, Recycled 22 19 19
6 Business Travel 92 78 78
Business Travel — Air/Rail/Car 92 78 78
7 Employee Commuting 1,822 1,798 1,798
U.S. Domestic Package 1,372 1,341 1,341
International Package 330 332 332
Global Supply Chain & Freight 120 125 125
8 Leased Assets Not Relevant Not Relevant Not Relevant
DOWNSTREAM
9 Transportation & Distribution Not Relevant Not Relevant Not Relevant
10 Processing of Sold Products Not Relevant Not Relevant Not Relevant
11 Use of Sold Products Not Relevant Not Relevant Not Relevant
12 End-of-Life Treatment of Sold Products 9 9 9
Landfi lled/Recycled 9 9 9
13 Leased Assets Not Relevant Not Relevant Not Relevant
14 Franchises 51 51 51
The UPS Store® — Electricity/Natural Gas 51 51 51
15 Investments Not Relevant Not Relevant Not Relevant
(1) Base Year is 2015.
(2) Recalculated 2015 using updated GWP factors and added emissions for Coyote Logistics. See Note 1, Methodology for additional details.
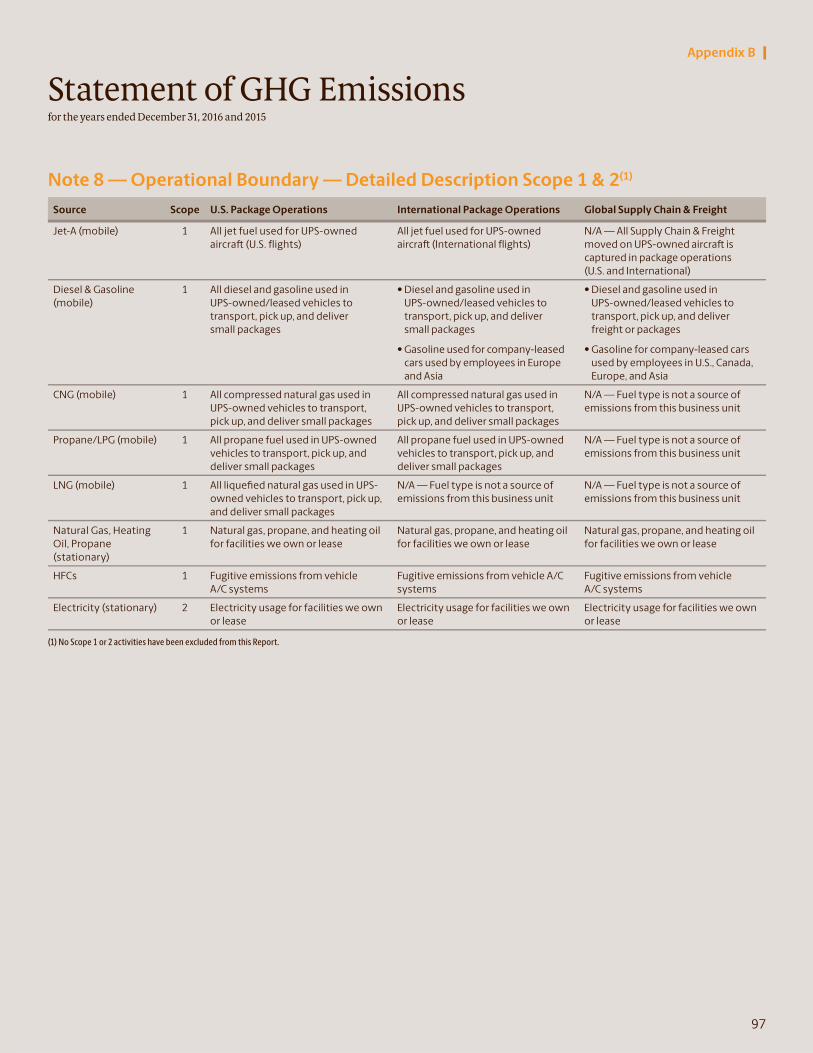
97
Appendix B
Statement of GHG Emissions for the years ended December 31, 2016 and 2015
Note 8 — Operational Boundary — Detailed Description Scope 1 & 2(1)
Source Scope U.S. Package Operations International Package Operations Global Supply Chain & Freight
Jet-A (mobile) 1 All jet fuel used for UPS-owned
aircraft (U.S. fl ights)
All jet fuel used for UPS-owned
aircraft (International fl ights)
N/A — All Supply Chain & Freight
moved on UPS-owned aircraft is
captured in package operations
(U.S. and International)
Diesel & Gasoline
(mobile)
1 All diesel and gasoline used in
UPS-owned/leased vehicles to
transport, pick up, and deliver
small packages
• Diesel and gasoline used in
UPS-owned/leased vehicles to
transport, pick up, and deliver
small packages
• Gasoline used for company-leased
cars used by employees in Europe
and Asia
• Diesel and gasoline used in
UPS-owned/leased vehicles to
transport, pick up, and deliver
freight or packages
• Gasoline for company-leased cars
used by employees in U.S., Canada,
Europe, and Asia
CNG (mobile) 1 All compressed natural gas used in
UPS-owned vehicles to transport,
pick up, and deliver small packages
All compressed natural gas used in
UPS-owned vehicles to transport,
pick up, and deliver small packages
N/A — Fuel type is not a source of
emissions from this business unit
Propane/LPG (mobile) 1 All propane fuel used in UPS-owned
vehicles to transport, pick up, and
deliver small packages
All propane fuel used in UPS-owned
vehicles to transport, pick up, and
deliver small packages
N/A — Fuel type is not a source of
emissions from this business unit
LNG (mobile) 1 All liquefi ed natural gas used in UPS-
owned vehicles to transport, pick up,
and deliver small packages
N/A — Fuel type is not a source of
emissions from this business unit
N/A — Fuel type is not a source of
emissions from this business unit
Natural Gas, Heating
Oil, Propane
(stationary)
1 Natural gas, propane, and heating oil
for facilities we own or lease
Natural gas, propane, and heating oil
for facilities we own or lease
Natural gas, propane, and heating oil
for facilities we own or lease
HFCs 1 Fugitive emissions from vehicle
A/C systems
Fugitive emissions from vehicle A/C
systems
Fugitive emissions from vehicle
A/C systems
Electricity (stationary) 2 Electricity usage for facilities we own
or lease
Electricity usage for facilities we own
or lease
Electricity usage for facilities we own
or lease
(1) No Scope 1 or 2 activities have been excluded from this Report.

98
Appendix B
Statement of GHG Emissions for the years ended December 31, 2016 and 2015
Note 9 — Operational Boundary — Detailed Description Scope 3
Scope and Category
Emissions Included/Excluded
(UPS Scope & Boundary) Description of Methodology
% Emissions Calculated
Using Data Obtained
from Value Chain
Partners
Upstream Scope 3 Emissions
1 Purchased Goods &
Services
The upstream extraction, production, and transportation
of goods and services purchased by all UPS operations,
not otherwise included in Categories 2-8.
Exclusions: None
Economic input-output life cycle
assessment (EIO-LCA) model
0%
2 Capital Goods The upstream extraction, production, and transportation
of capital expenditures purchased by all UPS operations,
including buildings, aircraft , vehicles, and information
technology.
Exclusions: None
Economic input-output life cycle
assessment (EIO-LCA) model
0%
3 Fuel & Energy-
Related Activities
Not Included in
Scope 1 or 2
Includes the upstream (well-to-pump) emissions
from raw material extraction up to the point of (but
excluding) combustion for the following global fuel
sources: Jet-A, Diesel, Gasoline, CNG, LPG, LNG, natural
gas, heating oil, and propane.
Includes the upstream emissions for the transmission
and distribution losses of purchased electricity.
Exclusions: None
The same primary data that is used to
calculate the Scope 1 and 2 emissions
for all energy usage is used to calculate
the upstream emissions; the actual
quantity of energy consumed is
multiplied by the appropriate life
cycle emission factor.
100%
4 Transportation
& Distribution
(Upstream)
The emissions from purchased transportation (air,
ground, rail, and ocean) for the pickup, transportation, and
delivery of packages/freight for our global operations
includes emissions associated with:
U.S. Package Operations
• Packages moved by third parties via aircraft , rail, and
tractor-trailer
• Last-mile delivery of packages by the U.S. Postal Service
International Package Operations
• Packages moved by third parties via aircraft and
tractor-trailers
• Last-mile delivery of packages by the use of Agents and
Outside Service Providers (OSPs)
• Packages transported across the U.K. Channel by third
parties via railroad or ferry
• Packages transported by rail in Canada
Global Supply Chain & Freight
• UPS Supply Chain Solutions® services: transportation,
pickup, and delivery for freight/packages by other third
parties via aircraft , rail, tractor-trailers, and ocean
• UPS Freight® operations: transportation, pickup, and
delivery for freight in the U.S. and Canada via various
modes of transport which include tractor-trailers,
railroads, and ocean transport of freight, typically to
Hawaii, Puerto Rico, Guam, and Alaska
Exclusions: Does not include Scope 2 emissions from
third-party transportation companies. Does not include
any optional life cycle assessment (LCA) emissions.
Source has been excluded due to lack of means to
measure emission source.
The primary method used to
calculate the upstream emissions
from purchased transportation is
to multiply the actual weight and
distance traveled for each shipment
by the appropriate emission factor
from the GHG Protocol.
35%

99
Appendix B
Statement of GHG Emissions for the years ended December 31, 2016 and 2015
Scope and Category
Emissions Included/Excluded
(UPS Scope & Boundary) Description of Methodology
% Emissions Calculated
Using Data Obtained
from Value Chain
Partners
5 Waste Generated
In Operations
Includes the emissions that occur for landfi lled,
incinerated, recovery, and recycled waste streams
in the U.S.
Exclusions: Emissions associated with wastes generated
in operations outside of the U.S. Does not include any
optional LCA emissions. Source has been excluded due
to lack of means to measure emission source.
Methodology used is actual waste
disposed by waste stream multiplied
by the appropriate LCA Emission
factor.
100%
6 Business Travel Includes the emissions that occur from air and rail travel,
rental cars, and the use of personal vehicles for business-
related activities for our global operations.
Exclusions: Does not include any optional life cycle
emissions from hotel stays. Source has been excluded
due to lack of means to measure emission source.
Travel agent provides a detailed
breakdown of GHG emissions based
upon actual travel activity.
100%
7 Employee
Commuting
Includes the emissions that occur for the transportation
of our employees between their homes and their
workplace for our global operations.
Exclusions: Does not include any optional emissions from
employee teleworking. Source has been excluded due to
lack of means to measure emission source.
Actual number of employees
multiplied by average gallons used
per employee (UPS calculated this
factor) multiplied by the emission
factor for gasoline (8.81 kg CO2
per gallon). The UPS factor for
estimated gallons per employee
was created by combining a host of
information from the U.S. Census
data, Department of Transportation,
the Federal Highway Administration,
and other sources.
0%
8 Upstream
Leased Assets
Not Relevant — We do not report on this category since
the category as described by the WRI Guidelines is not
applicable to our business because upstream leased
assets are included in our Scope 1 and 2 emissions.
Not Relevant Not Relevant
Downstream Scope 3 Emissions
9 Transportation &
Distribution
Not Relevant — We do not report on this category since
the category as described by the WRI Guidelines is not
applicable to our business because UPS does not off er a
sold product. For our sold service, emissions from non-
UPS vehicles are reported in category 4 because they are
purchased directly by UPS.
Not Relevant Not Relevant
10 Processing of
Sold Products
Not Relevant — We do not report on this category since
the category as described by the WRI Guidelines is not
applicable to our business because UPS does not off er an
intermediate sold product.
Not Relevant Not Relevant
11 Use of Sold Products Not Relevant — We do not report on this category since
the category as described by the WRI Guidelines is not
applicable to our business because UPS does not off er an
intermediate sold product.
Not Relevant Not Relevant
12 End-of-Life
Treatment of Sold
Products
Includes the global emissions that occur for landfi lled and
recycled waste from UPS-branded packaging materials
sold to customers.
Exclusions: None
Number of pounds of purchased
UPS-branded packaging multiplied
by the appropriate LCA Emission
factor.
100%

100
Appendix B
Statement of GHG Emissions for the years ended December 31, 2016 and 2015
Scope and Category
Emissions Included/Excluded
(UPS Scope & Boundary) Description of Methodology
% Emissions Calculated
Using Data Obtained
from Value Chain
Partners
13 Downstream
Leased Assets
Not Relevant — We do not report on this category since
the category as described by the WRI Guidelines is not
relevant because UPS does not have any signifi cant
downstream leased assets.
Not Relevant Not Relevant
14 Franchises Estimated electricity and natural gas usage for over 4,900
The UPS Store® locations serving the U.S. and Canada.
Exclusions: Does not include any optional LCA emissions.
Source has been excluded due to lack of means to
measure emission source.
Using square footage of The UPS
Store® franchises multiplied by an
average energy emission factor
established by the EPA Energy Star
Program.
0%
15 Investments Not Relevant — We do not report on this category since
the category as described by the WRI Guidelines is not
relevant because UPS does not have any signifi cant
investments that fi t this category.
Not Relevant Not Relevant

101
Appendix B
Independent Accountants’ Examination ReportBoard of DirectorsUnited Parcel Service, Inc.Atlanta, Georgia
We have examined the accompanying Statement of Greenhouse Gas Emissions (“Statement of GHG Emissions”) of United Parcel Service, Inc. (the “Company”) for the year ended December 31, 2016 for Scope 1, Scope 2, and Scope 3 greenhouse gas (GHG) emissions. The Company’s management is responsible for preparing and presenting the Statement of GHG Emissions in accordance with the Greenhouse Gas Protocol: A Corporate Accounting and Reporting Standard, and the Greenhouse Gas Protocol: A Corporate Value Chain (Scope 3) Accounting and Reporting Standard, published by the World Business Council for Sustainable Development and the World Resources Institute (together the “Greenhouse Gas Protocol”). Our responsibility is to express an opinion on the Statement of GHG Emissions based on our examination.
Our examination was conducted in accordance with attestation standards established by the American Institute of Certifi ed Public Accountants. Those standards require that we plan and perform the examination to obtain reasonable assurance about whether the Statement of GHG Emissions is presented in accordance with the above criteria, in all material respects. An examination involves performing procedures to obtain evidence about the Statement of GHG Emissions. The nature, timing and extent of the procedures selected depend on our judgment, including an assessment of the risks of material misstatement of the Statement of GHG Emissions, whether due to fraud or error. We believe that the evidence we obtained is suffi cient and appropriate to provide a reasonable basis for our opinion.
As described in Note 1, environmental and energy use data are subject to measurement uncertainties resulting from limitations inherent in the nature and the methods used for determining such data. The selection by management of diff erent, but acceptable measurement methods, input data or model assumptions, or a diff erent point value within the range of reasonable values produced by the model, could have resulted in materially diff erent amounts or metrics being reported.
In our opinion, the Statement of GHG Emissions of the Company for the year ended December 31, 2016 for Scope 1, Scope 2, and Scope 3 GHG emissions is presented in accordance with the Greenhouse Gas Protocol, in all material respects.
Stamford, CT
June 2, 2017
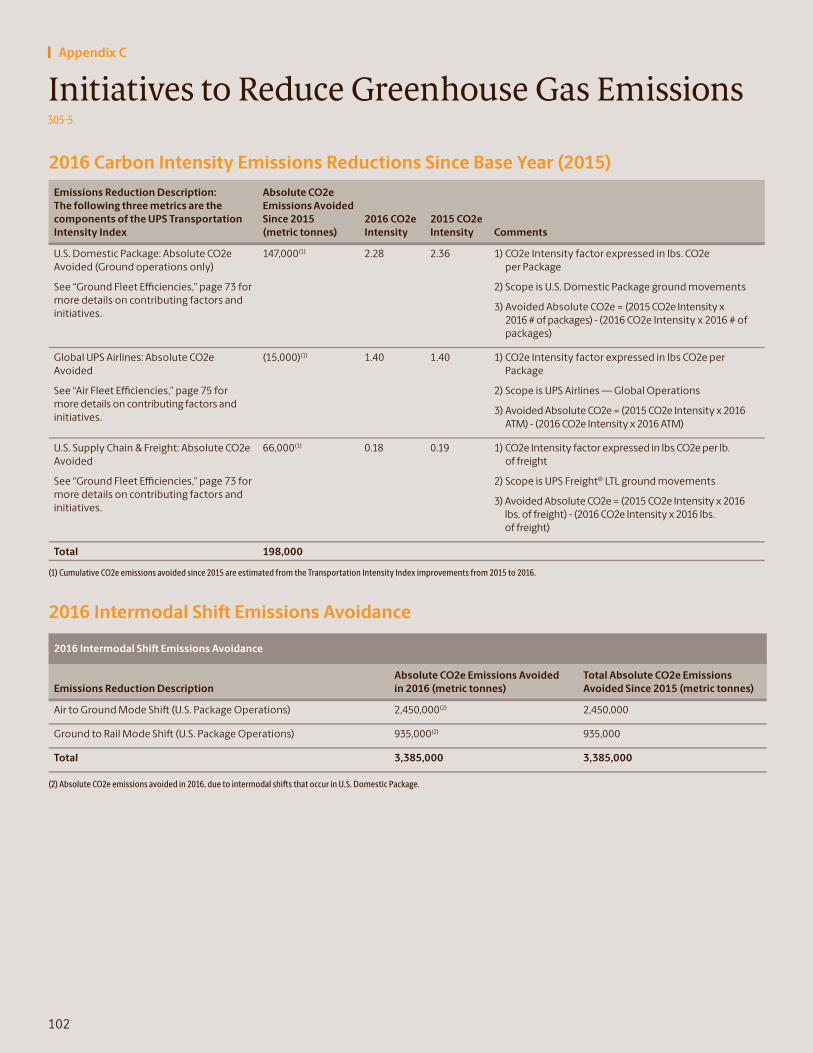
102
Appendix C
Initiatives to Reduce Greenhouse Gas Emissions
2016 Carbon Intensity Emissions Reductions Since Base Year (2015)
Emissions Reduction Description:
The following three metrics are the
components of the UPS Transportation
Intensity Index
Absolute CO2e
Emissions Avoided
Since 2015
(metric tonnes)
2016 CO2e
Intensity
2015 CO2e
Intensity Comments
U.S. Domestic Package: Absolute CO2e
Avoided (Ground operations only)
See “Ground Fleet Effi ciencies,” page 73 for
more details on contributing factors and
initiatives.
147,000(1) 2.28 2.36 1) CO2e Intensity factor expressed in lbs. CO2e
per Package
2) Scope is U.S. Domestic Package ground movements
3) Avoided Absolute CO2e = (2015 CO2e Intensity x
2016 # of packages) - (2016 CO2e Intensity x 2016 # of
packages)
Global UPS Airlines: Absolute CO2e
Avoided
See “Air Fleet Effi ciencies,” page 75 for
more details on contributing factors and
initiatives.
(15,000)(1) 1.40 1.40 1) CO2e Intensity factor expressed in lbs CO2e per
Package
2) Scope is UPS Airlines — Global Operations
3) Avoided Absolute CO2e = (2015 CO2e Intensity x 2016
ATM) - (2016 CO2e Intensity x 2016 ATM)
U.S. Supply Chain & Freight: Absolute CO2e
Avoided
See “Ground Fleet Effi ciencies,” page 73 for
more details on contributing factors and
initiatives.
66,000(1) 0.18 0.19 1) CO2e Intensity factor expressed in lbs CO2e per lb.
of freight
2) Scope is UPS Freight® LTL ground movements
3) Avoided Absolute CO2e = (2015 CO2e Intensity x 2016
lbs. of freight) - (2016 CO2e Intensity x 2016 lbs.
of freight)
Total 198,000
(1) Cumulative CO2e emissions avoided since 2015 are estimated from the Transportation Intensity Index improvements from 2015 to 2016.
2016 Intermodal Shift Emissions Avoidance
2016 Intermodal Shift Emissions Avoidance
Emissions Reduction Description
Absolute CO2e Emissions Avoided
in 2016 (metric tonnes)
Total Absolute CO2e Emissions
Avoided Since 2015 (metric tonnes)
Air to Ground Mode Shift (U.S. Package Operations) 2,450,000(2) 2,450,000
Ground to Rail Mode Shift (U.S. Package Operations) 935,000(2) 935,000
Total 3,385,000 3,385,000
(2) Absolute CO2e emissions avoided in 2016, due to intermodal shift s that occur in U.S. Domestic Package.
305-5

103
Appendix D
Energy Performance302-1 | 302-3
Energy Consumption Within the Organization
Global Energy (‘000 GJs) 2016 2015 % Change 16/15 Base Year (2015)
Direct Energy 178,904 173,665 3.0% 173,665
Indirect Energy 5,913 5,861 0.9% 5,861
Total Energy 184,817 179,526 2.9% 179,526
Energy Consumption Within the Organization by Source
Global Energy (‘000 GJs) 2016 Percent to Total Energy 2016 2015 Base Year (2015)
Direct Energy
Airline Fuel 109,154 59.1% 104,279 104,279
Ground Vehicle Fuel 65,552 35.4% 64,804 64,804
Diesel 42,165 22.8% 46,240 46,240
Gasoline 13,299 7.2% 12,096 12,096
CNG 3,410 1.8% 751 751
Propane/LPG 1,194 0.6% 1,101 1,101
LNG 2,725 1.5% 3,109 3,109
Renewable Fuel (Biomass) 2,759 1.5% 1,507 1,507
Facility Fuel 4,198 2.3% 4,582 4,582
Natural Gas 3,994 2.2% 4,365 4,365
Heating Oil 53 0.0% 72 72
Propane 151 0.1% 145 145
Direct Energy Subtotal 178,904 96.8% 173,665 173,665
Indirect Energy
Electricity 5,904 3.2% 5,850 5,850
Renewable Electricity 9 0.0% 11 11
Indirect Energy Subtotal 5,913 3.2% 5,861 5,861
Total Energy 184,817 100% 179,526 179,526
Energy Consumption Within the Organization by Business Unit
U.S. Domestic Package International Package Global Supply Chain & Freight Totals
Global Energy
(‘000 GJs)2016 2015
Base Year
(2015)2016 2015
Base Year
(2015)2016 2015
Base Year
(2015)2016 2015
Base Year
(2015)
Direct Energy 108,452 102,865 102,865 60,214 58,757 58,757 10,238 12,043 12,043 178,904 173,665 173,665
Indirect Energy 4,359 4,231 4,231 506 549 549 1,048 1,081 1,081 5,913 5,861 5,861
Total Energy 112,811 107,096 107,096 60,720 59,306 59,306 11,286 13,124 13,124 184,817 179,526 179,526
Energy Intensity1 Within the Organization by Business Unit
U.S. Domestic Package International Package Global Supply Chain & Freight Totals
Global Energy (‘000
GJs/$M Revenue)2016 2015
Base Year
(2015)2016 2015
Base Year
(2015)2016 2015
Base Year
(2015)2016 2015
Base Year
(2015)
Revenue in Millions $38,301 $36,747 $36,747 $12,350 $12,149 $12,149 $10,255 $9,467 $9,467 $60,906 $58,363 $58,363
Direct Energy 2.832 2.799 2.799 4.876 4.837 4.837 0.998 1.272 1.272 2.937 2.976 2.976
Indirect Energy 0.114 0.115 0.115 0.041 0.045 0.045 0.102 0.114 0.114 0.097 0.100 0.100
Total Energy 2.946 2.914 2.914 4.917 4.882 4.882 1.100 1.386 1.386 3.034 3.076 3.076
(1) Includes all types of energy defi ned in Energy Consumption Within the Organization by source.

104
Appendix D
Energy Performance302-2 | 302-4 | 302-5
Energy Consumption Outside the Organization
Global Energy ('000 GJs) 2016 2015 % Change 16/15 Base Year (2015)
UPSTREAM
1. Purchased Goods and Services Not Reported Not Reported Not Reported
2. Capital Goods Not Reported Not Reported Not Reported
3. Fuel & Energy-Related (not incl. Scope 1&2) Not Reported Not Reported Not Reported
4. Transportation & Distribution 104,813 104,276 0.5% 104,276
5. Waste Generated in Operations Not Relevant Not Relevant Not Relevant
6. Business Travel 1,309 1,144 14.4% 1,144
7. Employee Commuting 26,927 26,558 1.3% 26,558
8. Leased Assets Not Relevant Not Relevant Not Relevant
DOWNSTREAM
9. Transportation & Distribution Not Relevant Not Relevant Not Relevant
10. Processing of Sold Products Not Relevant Not Relevant Not Relevant
11. Use of Sold Products Not Relevant Not Relevant Not Relevant
12. End-of-life Treatment of Sold Products Not Relevant Not Relevant Not Relevant
13. Leased Assets Not Relevant Not Relevant Not Relevant
14. Franchises 359 356 1.0% 356
15. Investments Not Relevant Not Relevant Not Relevant
Total Energy Consumption Outside the Organization 133,409 132,364 0.8% 132,364
Reduction of Energy Consumption
Energy Saved Due to Conservation and Effi ciency
Improvements
Absolute
Energy Avoided
2016 vs 2015
(gigajoules)(1)
2016
Energy
Intensity
2015
Energy
Intensity
Comments
U.S. Domestic Package: Absolute Energy Avoided Contributing Factors/Initiatives: Implementation of telematics, improved vehicle
routing, conducting proactive maintenance on our
vehicles, shift ing travel to low-emission vehicles. See
“Ground Fleet Effi ciencies,” page 73 for more details.
(834,000)(1) 27.23 27.03 1) Energy Intensity factor expressed in gigajoules per
1,000 Packages
2) Scope is U.S. Domestic Package Operations
3) Includes all direct and indirect energy usage for this
specific business segment
4) Avoided Absolute Energy = (2015 Energy Intensity x
2016 # of packages) - (2016 Energy Intensity x 2016 # of
packages)
International Package: Absolute Energy Avoided Contributing Factors/Initiatives: Miscellaneous initiatives in our airline, including
lower fl ight speeds, computer-optimized fl ight
plans, single-engine taxi. See “Air Fleet Effi ciencies,”
page 75 for more details.
1,419,000(1) 83.70 85.65 1) Energy Intensity factor expressed in gigajoules per
1,000 packages
2) Scope is International Package Operations
3) Includes all direct and indirect energy usage for this
specific business segment
4) Avoided Absolute Energy = (2015 Energy Intensity x
2016 # of packages) - (2016 Energy Intensity x 2016 #
of packages)
Global Supply Chain & Freight: Absolute Energy Avoided Contributing Factors/Initiatives: Implementation of telematics, improved
dispatching of drivers, consolidation of shipments,
loading effi ciency in ways that keep miles driven to
a minimum.
1,060,000(1) 1.11 1.21 1) Energy Intensity factor expressed in gigajoules per
1,000 lbs. of freight hauled
2) Scope is Global Supply Chain & Freight Operations
3) Includes all direct and indirect energy usage for this
specific business segment
4) Avoided Absolute Energy = (2015 Energy Intensity x
2016 lbs. of freight) - (2016 Energy Intensity x 2016
lbs. of freight)
Total 1,645,000
(1) Absolute energy avoided in 2016 was estimated from the energy intensity factor improvements from 2015 (baseline year) to 2016.Notes: • Base year of 2015 was selected to align with GHG reduction goal • Methodology: actual energy used by volume multiplied by appropriate energy
conversion factor • Conversion factor source: GREET 2016, version 1.

GRI Content Index
105
Appendix E
General Disclosures
Disclosure Number Description Response Reason for Omission
GRI 102: General Disclosures 2016
Organizational Profi le
102-1 Report the name of the organization. Page 4
102-2 Report the primary brands, products, and services
Page 4; No UPS brands, products, or services are banned in markets we operate in.
102-3 Report the location of the organization’s headquarters.
Atlanta, GA
102-4 Report the number of countries where the organization operates.
Page 4
102-5 Report the nature of ownership and legal form.
Publicly traded company
102-6 Report the markets served (including geographic breakdown, sectors served, and types of customers and benefi ciaries).
Page 4; UPS operates in 220 countries and territories in the operating regions of USA, Americas (Canada, Latin America, and the Caribbean), Europe, ISMEA (Indian Subcontinent, the Middle East, and Asia), and Asia-Pacifi c.
102-7 Report the scale of the organization. Pages 4, 42
102-8 Breakdown of employee type. Page 18
102-9 Describe the organization’s supply chain.
Page 51-52
102-10 Report any signifi cant changes during the reporting period regarding the organization’s size, structure, ownership, or its supply chain.
Page 42-43
102-11 Report whether and how the precautionary approach or principle is addressed by the organization.
https://sustainability.ups.com/resources/corporate-governance
102-12 List externally developed economic, environmental, and social charters, principles, or other initiatives to which the organization subscribes or which it endorses.
Examples of major external initiatives we engage in — other than those aforementioned in this Report — include the following:
• The World Resources Institute’s Greenhouse Gas Protocol
• CDP’s climate change program
• The President’s Export Council, a nonpartisan body that serves as the United States’ advisory committee on international trade
• The Business Roundtable, an association of CEOs promoting public policy in support of a thriving economy
102-13 List memberships of associations (such as industry associations) and national or international advocacy organizations.
• Green Freight Asia, a transportation association addressing the climate impact of shipping
• The North American Council for Freight Effi ciency, an association committed to doubling the effi ciency of North American goods movement
• The Interstate Clean Transportation Corridor program, a public-private partnership to establish natural gas infrastructure for transportation
• The National Clean Fleets Partnership, as part of the U.S. Department of Energy’s Clean Cities program, which works with large private fl eets to reduce the use of petroleum-based fuels
• The International Air Transport Association’s Air Cargo Carbon Footprint initiative
• The Conference Board, which provides corporations with information to better serve society
• Corporate Eco-Forum, which provides a forum for leaders to strategize and exchange best-practice insights

106
Appendix E
GRI Content IndexAppendix E
General Disclosures
Disclosure Number Description Response Reason for Omission
Strategy
102-14 Provide a statement from the most senior decision-maker of the organization.
Page 2-3
102-15 Provide a description of key impacts, risks, and opportunities.
Pages 9-10, 42-43; 2016 Annual Report — Form 10-K, Item 1A Risk Factors, pages 14-18, http://www.investors.ups.com/phoenix.zhtml?c=62900&p=irol-sec; An overview of our materiality assessment process is available at https://sustainability.ups.com/media/UPS_Corporate_Materiality.pdf
Ethics and integrity
102-16 Describe the organization’s values, principles, standards, and norms of behavior such as codes of conduct and codes of ethics.
Page 38
102-17 Report the internal and external mechanisms for seeking advice on ethical and lawful behavior, and matters related to organizational integrity, such as helplines or advice lines.
Page 39
Governance
102-18 Report the governance structure of the organization, including committees of the highest governance body.
https://sustainability.ups.com/resources/corporate-governance
102-19 Report the process for delegating authority for economic, environmental, and social topics from the highest governance body to senior executives and other employees.
https://sustainability.ups.com/resources/corporate-governance
102-20 Report whether the organization has appointed an executive-level position or positions with responsibility for economic, environmental, and social topics, and whether post holders report directly to the highest governance body.
https://sustainability.ups.com/resources/corporate-governance
102-21 Report processes for consultation between stakeholders and the highest governance body on economic, environmental, and social topics.
https://sustainability.ups.com/resources/corporate-governance
102-22 Report the composition of the highest governance body and its committees.
https://sustainability.ups.com/resources/corporate-governance
102-23 Report whether the Chair of the highest governance body is also an executive offi cer.
https://sustainability.ups.com/resources/corporate-governance
102-24 Report the nomination and selection processes for the highest governance body and its committees, and the criteria used for nominating and selecting highest governance body members.
https://sustainability.ups.com/resources/corporate-governance

107
Appendix E
GRI Content Index
General Disclosures
Disclosure Number Description Response Reason for Omission
102-25 Report processes for the highest governance body to ensure confl icts of interest are avoided and managed.
https://sustainability.ups.com/resources/corporate-governance
102-26 Report the highest governance body’s and senior executives’ roles in the development, approval, and updating of the organization’s purpose, value or mission statements, strategies, policies, and goals related to economic, environmental, and social impacts.
https://sustainability.ups.com/resources/corporate-governance
102-27 Report the measures taken to develop and enhance the highest governance body’s collective knowledge of economic, environmental, and social topics.
https://sustainability.ups.com/resources/corporate-governance
102-28 Report the processes for evaluation of the highest governance body’s performance with respect to governance of economic, environmental, and social topics.
https://sustainability.ups.com/resources/corporate-governance
102-29 Report the highest governance body’s role in the identifi cation and management of economic, environmental and social impacts, risks, and opportunities.
https://sustainability.ups.com/resources/corporate-governance
102-30 Report the highest governance body’s role in reviewing the eff ectiveness of the organization’s risk management processes for economic, environmental, and social topics.
https://sustainability.ups.com/resources/corporate-governance
102-31 Report the frequency of the highest governance body’s review of economic, environmental and social impacts, risks, and opportunities.
https://sustainability.ups.com/resources/corporate-governance
102-32 Report the highest committee or position that formally reviews and approves the organization’s sustainability report.
https://sustainability.ups.com/resources/corporate-governance
102-33 Report the process for communicating critical concerns to the highest governance body.
https://sustainability.ups.com/resources/corporate-governance
102-34 Report the nature and total number of critical concerns that were communicated to the highest governance body and the mechanism(s) used to address and resolve them.
https://sustainability.ups.com/resources/corporate-governance
102-35 Report the remuneration policies for the highest governance body and senior executives.
https://sustainability.ups.com/resources/corporate-governance; page 31; and page 33 in 2017 Proxy Statement at https://www.upsannualmeeting.com/uploads/ups-2017-proxy-fi nal.pdf
102-36 Report the process for determining remuneration.
https://sustainability.ups.com/resources/corporate-governance
102-37 Report how stakeholders’ views are sought and taken into account regarding remuneration.
https://sustainability.ups.com/resources/corporate-governance

108
Appendix E
GRI Content IndexAppendix E
General Disclosures
Disclosure Number Description Response Reason for Omission
102-38 Report the ratio of the annual total compensation for the organization’s highest paid individual in each country of signifi cant operations to the median annual total compensation for all employees.
Confi dentiality constraints — UPS does not report ratios based on individual compensation or make pay decisions based on these ratios. We consider this data confi dential. However, The Securities and Exchange Commission (SEC) in the United States adopted a rule to require disclosure of the ratio of Chief Executive Offi cer (CEO) pay to median employee pay. This disclosure will be required starting in 2018, and UPS will re-evaluate disclosure of this information in accordance with the rule.
102-39 Report the ratio of percentage increase in annual total compensation for the organization’s highest-paid individual in each country of signifi cant operations to the median percentage increase in annual total compensation for all employees (excluding the highest-paid individual) in the same country.
Confi dentiality constraints — UPS does not report ratios based on individual compensation or make pay decisions based on these ratios. We consider this data confi dential. However, The Securities and Exchange Commission (SEC) in the United States adopted a rule to require disclosure of the ratio of Chief Executive Offi cer (CEO) pay to median employee pay. This disclosure will be required starting in 2018, and UPS will re-evaluate disclosure of this information in accordance with the rule.
Stakeholder engagement
102-40 List of stakeholder groups Page 15
102-41 Report the percentage of total employees covered by collective bargaining agreements.
Page 36
102-42 Report the basis for identifi cation and selection of stakeholders with whom to engage.
Page 14
102-43 Report the organization’s approach to stakeholder engagement.
Page 14
102-44 Report key topics and concerns that have been raised through stakeholder engagement, and how the organization has responded to those key topics and concerns.
Page 15
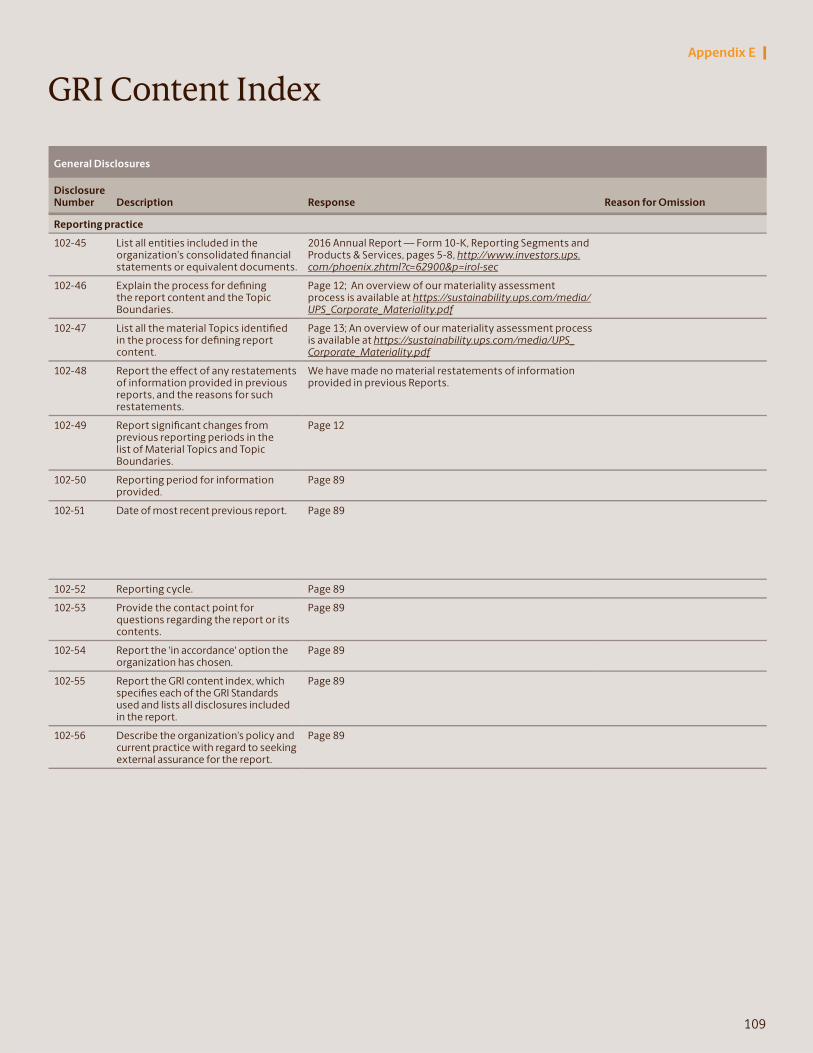
109
Appendix E
General Disclosures
Disclosure Number Description Response Reason for Omission
Reporting practice
102-45 List all entities included in the organization’s consolidated fi nancial statements or equivalent documents.
2016 Annual Report — Form 10-K, Reporting Segments and Products & Services, pages 5-8, http://www.investors.ups.com/phoenix.zhtml?c=62900&p=irol-sec
102-46 Explain the process for defi ning the report content and the Topic Boundaries.
Page 12; An overview of our materiality assessment process is available at https://sustainability.ups.com/media/UPS_Corporate_Materiality.pdf
102-47 List all the material Topics identifi ed in the process for defi ning report content.
Page 13; An overview of our materiality assessment process is available at https://sustainability.ups.com/media/UPS_Corporate_Materiality.pdf
102-48 Report the eff ect of any restatements of information provided in previous reports, and the reasons for such restatements.
We have made no material restatements of information provided in previous Reports.
102-49 Report signifi cant changes from previous reporting periods in the list of Material Topics and Topic Boundaries.
Page 12
102-50 Reporting period for information provided.
Page 89
102-51 Date of most recent previous report. Page 89
102-52 Reporting cycle. Page 89
102-53 Provide the contact point for questions regarding the report or its contents.
Page 89
102-54 Report the 'in accordance' option the organization has chosen.
Page 89
102-55 Report the GRI content index, which specifi es each of the GRI Standards used and lists all disclosures included in the report.
Page 89
102-56 Describe the organization’s policy and current practice with regard to seeking external assurance for the report.
Page 89
GRI Content Index

110
Appendix E
GRI Content IndexAppendix E
Topic-Specifi c Standards
Disclosure Number Description Response Reason for Omission
GRI 201: Economic Performance 2016
GRI 103: Management Approach 2016
103-1 Explain why the topic is material and provide its Boundary.
Pages 42-44, 50-52, 57-58, 61
103-2 Explain how the organization manages the topic.
Pages 42-44, 50-52, 57-58, 61
103-3 Explain how the organization evaluates the management approach.
Pages 42-44, 50-52, 57-58, 61
201-1 Direct economic value generated and distributed.
Pages 42-43
201-2 Financial implications and other risks and opportunities due to climate change.
Page 43; UPS 2016 Annual Report — Form 10-K, Item 1A Risk Factors, page 15, http://www.investors.ups.com/phoenix.zhtml?c=62900&p=irol-sec
201-3 Defi ned benefi t plan obligations and other retirement plans.
We provide detailed disclosures and discussions about our pension and postretirement plan obligations in our Annual Report, primarily in Notes 4 and 5 to the Consolidated Financial Statements beginning on page 80 of the UPS 2016 Annual Report Form 10-K.
201-4 Financial assistance received from government.
UPS does not receive significant financial assistance from the government. We do participate in public-private partnerships that may involve tax incentives, such as the Interstate Clean Transportation Corridor (ICTC) in the United States, or certain incentives related to our purchase of alternative fuel vehicles, but fi nancial assistance is not the main reason we participate. Primarily, we seek to advance our own knowledge and capabilities in ways that help society develop important new transportation options and infrastructure. Achieving these two goals enables us to deliver greater benefi ts to our customers, investors, employees, and other stakeholders.

111
Appendix E
Topic-Specifi c Standards
Disclosure Number Description Response Reason for Omission
GRI 202: Market Presence 2016
GRI 103: Management Approach 2016
103-1 Explain why the topic is material and provide its Boundary.
Pages 42-44
103-2 Explain how the organization manages the topic.
Pages 42-44
103-3 Explain how the organization evaluates the management approach.
Pages 42-44
202-1 Ratios of standard entry-level wage by gender compared to local minimum wage.
The ratio of our standard entry-level hourly wage to local minimum wage varies from location to location around the world. This variation is necessary to comply with local conditions and with national wage minimums in countries that set them. In the United States, which represents 77.5 percent of our employee base, we comply with local minimum-wage laws in each state and pay no less than the local minimum wage or the federal minimum wage. We do not vary entry-level compensation by gender.
We do not have a signifi cant proportion of other workers (excluding employees) performing the organization’s activities that are compensated based on minimum wage rules.
202-2 Proportion of senior management hired from the local community.
Page 32; Because UPS serves more than 220 countries and territories around the world, it is extremely diffi cult to defi ne “local” and “signifi cant” operations. We hire nearly all senior managers within their home country. More than 99 percent of full-time management employees worked in their home country or territory in 2016.
GRI 203: Indirect Economic Impacts 2016
GRI 103: Management Approach 2016
103-1 Explain why the topic is material and provide its Boundary.
Pages 42-44, 57-58, 61
103-2 Explain how the organization manages the topic.
Pages 42-44, 57-58, 61
103-3 Explain how the organization evaluates the management approach.
Pages 42-44, 57-58, 61
203-1 Infrastructure investments and services supported.
Pages 44, 57-61
203-2 Signifi cant indirect economic impacts. Pages 44, 57
GRI 204: Procurement Practices 2016
GRI 103: Management Approach 2016
103-1 Explain why the topic is material and provide its Boundary.
Pages 50-52
103-2 Explain how the organization manages the topic.
Pages 50-52
103-3 Explain how the organization evaluates the management approach.
Pages 50-52
204-1 Proportion of spending on local suppliers. Pages 50-51
GRI Content Index

112
Appendix E
GRI Content IndexAppendix E
Topic-Specifi c Standards
Disclosure Number Description Response Reason for Omission
GRI 205: Anti-corruption 2016
GRI 103: Management Approach 2016
103-1 Explain why the topic is material and provide its Boundary.
Pages 38-39, 51
103-2 Explain how the organization manages the topic.
Pages 38, 51
103-3 Explain how the organization evaluates the management approach.
Pages 38, 51
205-1 Operations assessed for risks related to corruption.
Page 39 Unavailable — UPS provides number of corruption-related audits but does not report on percentage or signifi cant risks due to confi dentiality.
205-2 Communication and training about anti-corruption policies and procedures.
Pages 38, 51; As part of our Director Orientation Program, new Board members are provided with the UPS Code of Business Conduct, which includes a section on our Anti-Corruption Program and sets forth standards applicable to all representatives of UPS.
205-3 Confi rmed incidents of corruption and actions taken.
We are not aware of any confi rmed incidents of corruption in 2016.
GRI 206: Anti-competitive Behavior 2016
GRI 103: Management Approach 2016
103-1 Explain why the topic is material and provide its Boundary.
Page 38
103-2 Explain how the organization manages the topic.
Page 38
103-3 Explain how the organization evaluates the management approach.
Page 38
206-1 Legal actions for anti-competitive behavior, anti-trust, and monopoly practices.
All material litigation and enforcement matters related to competition law are timely disclosed to the SEC and publicly available at www.investors.ups.com.
GRI 302: Energy 2016
GRI 103: Management Approach 2016
103-1 Explain why the topic is material and provide its Boundary.
Pages 68-76, 78
103-2 Explain how the organization manages the topic.
Pages 68-76, 78
103-3 Explain how the organization evaluates the management approach.
Pages 68-76, 78
302-1 Energy consumption within the organization.
Page 103
302-2 Energy consumption outside of the organization.
Page 104
302-3 Energy intensity. Page 103
302-4 Reduction of energy consumption. Page 104
302-5 Reductions in energy requirements of products and services.
Page 104

113
Appendix E
GRI Content Index
Topic-Specifi c Standards
Disclosure Number Description Response Reason for Omission
GRI 305: Emissions 2016
GRI 103: Management Approach 2016
103-1 Explain why the topic is material and provide its Boundary.
Pages 68-78
103-2 Explain how the organization manages the topic.
Pages 68-78
103-3 Explain how the organization evaluates the management approach.
Pages 68-78
305-1 Direct (Scope 1) GHG emissions. Page 91
305-2 Energy indirect (Scope 2) GHG emissions. Page 91
305-3 Other indirect (Scope 3) GHG emissions. Pages 91, 96
305-4 GHG emissions intensity. Page 94
305-5 Reduction of GHG emissions. Page 102
305-6 Emissions of ozone-depleting substances (ODS).
— Not applicable — UPS does not produce, import, or export ODS.
305-7 Nitrogen oxides (NOX), sulfur oxides (SOX), and other signifi cant air emissions.
Page 75; EPA Motor Vehicle Emission Simulator (MOVES) model is used to calculate ground vehicle emissions
GRI 308: Supplier Environmental Assessment 2016
GRI 103: Management Approach 2016
103-1 Explain why the topic is material and provide its Boundary.
Pages 50-51
103-2 Explain how the organization manages the topic.
Pages 50-51
103-3 Explain how the organization evaluates the management approach.
Pages 50-51
308-1 New suppliers that were screened using environmental criteria.
Page 50 Confi dentiality constraints — UPS does not report specifi c numbers or percentages related to screening or impact assessments, as this information is subject to confi dentiality constraints of our supplier contracts.
308-2 Negative environmental impacts in the supply chain and actions taken.
Page 50 Confi dentiality constraints — UPS does not report specifi c numbers or percentages related to screening or impact assessments, as this information is subject to confi dentiality constraints of our supplier contracts.

114
Appendix E
GRI Content IndexAppendix E
Topic-Specifi c Standards
Disclosure Number Description Response Reason for Omission
GRI 401: Employment 2016
GRI 103: Management Approach 2016
103-1 Explain why the topic is material and provide its Boundary.
Pages 19-21
103-2 Explain how the organization manages the topic.
Pages 19-21
103-3 Explain how the organization evaluates the management approach.
Pages 19-21
401-1 New employee hires and employee turnover. We hired 108,844 new permanent employees globally through September 2016. Our permanent employees in our primary market, the United States, were 97,938 - of that, the gender breakdown was 19.4 percent female and 80.6 percent male. The age breakdown was 73.3 percent under 30 years old, 23.4 percent age 30-50, and 3.3 percent over 50 years old. These fi gures do not include more than 107,000 people that we hired to work with us through the fourth-quarter peak holiday shipping season. The full-time employee retention rate for our global operations was 89.6 percent.
401-2 Benefi ts provided to full-time employees that are not provided to temporary or part-time employees.
Page 31; in 2016, UPS administered benefi t plans for more than 245,000 employees, retirees, and their dependents, and contributed to union-administered plans for 108,000 additional employees in the United States.
401-3 Parental leave. Page 31 Information Unavailable — Due to changes in collective bargaining agreements and HR information tracking systems, UPS does not have visibility into the leave, return or retention rates for union employees. There is currently no plan to begin collecting this data.
GRI 402: Labor/Management Relations 2016
GRI 103: Management Approach 2016
103-1 Explain why the topic is material and provide its Boundary.
Pages 36-37
103-2 Explain how the organization manages the topic.
Pages 36-37
103-3 Explain how the organization evaluates the management approach.
Pages 36-37
402-1 Minimum notice periods regarding operational changes.
Page 37

115
Appendix E
Topic-Specifi c Standards
Disclosure Number Description Response Reason for Omission
GRI 403: Occupational Health and Safety 2016
GRI 103: Management Approach 2016
103-1 Explain why the topic is material and provide its Boundary.
Pages 28-31, 36-37
103-2 Explain how the organization manages the topic.
Pages 28-31, 36-37
103-3 Explain how the organization evaluates the management approach.
Pages 28-31, 36-37
403-1 Workers representation in formal joint management-worker health and safety committees.
Page 37
403-2 Types of injury and rates of injury, occupational diseases, lost days, and absenteeism, and number of work-related fatalities.
Page 30; 79.4 percent of injuries in Canada, Puerto Rico, and the United States involved men; the remaining 20.6 percent involved women. Additionally, all eight fatalities were men: seven in the United States and one in Africa.
Confi dentiality constraints — UPS does not currently track or report this data for contractors, as this information is subject to confi dentiality constraints of our contracts. We track through lost time, which includes injury, disease, absenteeism, and other factors. We do not track these numbers by gender and region.
403-3 Workers with high incidence or high risk of diseases related to their occupation.
We are not aware of any occupational diseases among UPS employees, or of any incidence or high risk of disease related to occupations at UPS.
403-4 Health and safety topics covered in formal agreements with trade unions.
Page 36
GRI 404: Training and Education 2016
GRI 103: Management Approach 2016
103-1 Explain why the topic is material and provide its Boundary.
Pages 32-35
103-2 Explain how the organization manages the topic.
Pages 32-35
103-3 Explain how the organization evaluates the management approach.
Pages 32-35
404-1 Average hours of training per year per employee.
Page 33
404-2 Programs for upgrading employee skills and transition assistance programs.
Pages 33-35
404-3 Percentage of employees receiving regular performance and career development reviews.
Page 34 Information Unavailable — Currently, formal performance reviews are provided for management employees and above, and not required for nonmanagement employees. UPS is introducing a new system to track performance and career reviews, and we will provide more comprehensive data on performance reviews by job category in our 2017 Report.
GRI Content Index
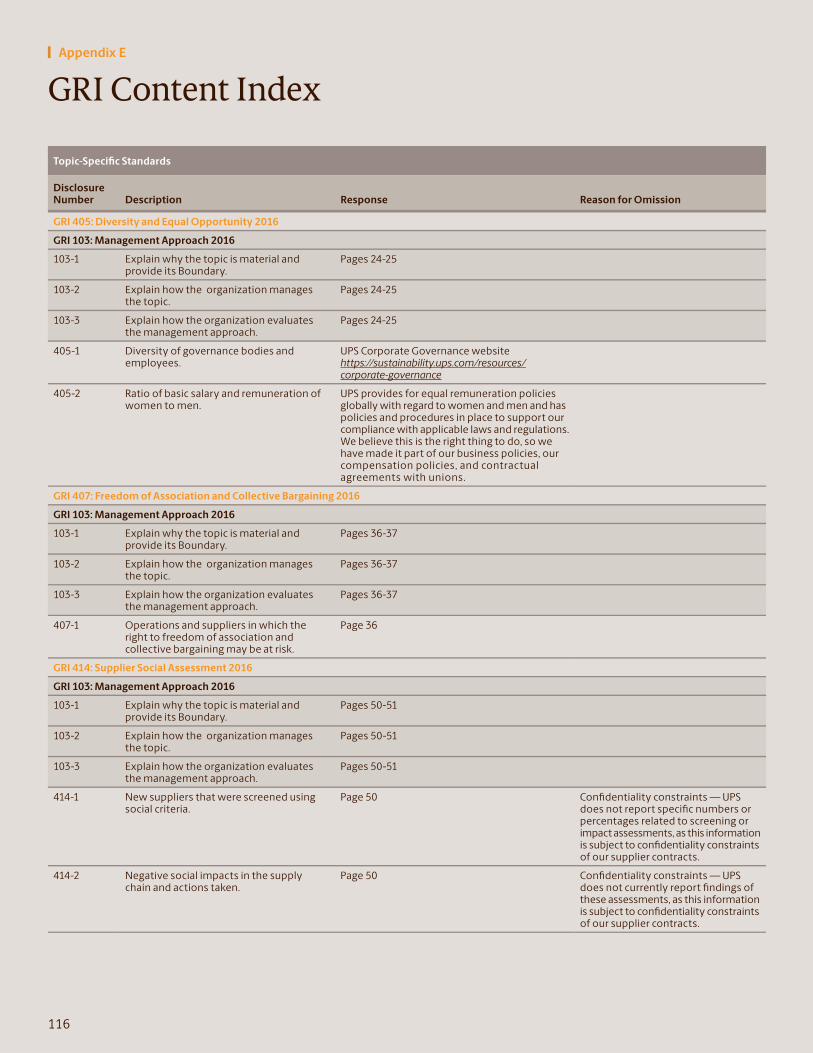
GRI Content Index
116
Appendix E
Topic-Specifi c Standards
Disclosure Number Description Response Reason for Omission
GRI 405: Diversity and Equal Opportunity 2016
GRI 103: Management Approach 2016
103-1 Explain why the topic is material and provide its Boundary.
Pages 24-25
103-2 Explain how the organization manages the topic.
Pages 24-25
103-3 Explain how the organization evaluates the management approach.
Pages 24-25
405-1 Diversity of governance bodies and employees.
UPS Corporate Governance website https://sustainability.ups.com/resources/corporate-governance
405-2 Ratio of basic salary and remuneration of women to men.
UPS provides for equal remuneration policies globally with regard to women and men and has policies and procedures in place to support our compliance with applicable laws and regulations. We believe this is the right thing to do, so we have made it part of our business policies, our compensation policies, and contractual agreements with unions.
GRI 407: Freedom of Association and Collective Bargaining 2016
GRI 103: Management Approach 2016
103-1 Explain why the topic is material and provide its Boundary.
Pages 36-37
103-2 Explain how the organization manages the topic.
Pages 36-37
103-3 Explain how the organization evaluates the management approach.
Pages 36-37
407-1 Operations and suppliers in which the right to freedom of association and collective bargaining may be at risk.
Page 36
GRI 414: Supplier Social Assessment 2016
GRI 103: Management Approach 2016
103-1 Explain why the topic is material and provide its Boundary.
Pages 50-51
103-2 Explain how the organization manages the topic.
Pages 50-51
103-3 Explain how the organization evaluates the management approach.
Pages 50-51
414-1 New suppliers that were screened using social criteria.
Page 50 Confi dentiality constraints — UPS does not report specifi c numbers or percentages related to screening or impact assessments, as this information is subject to confi dentiality constraints of our supplier contracts.
414-2 Negative social impacts in the supply chain and actions taken.
Page 50 Confi dentiality constraints — UPS does not currently report fi ndings of these assessments, as this information is subject to confi dentiality constraints of our supplier contracts.

GRI Content Index
117
Appendix E
Topic-Specifi c Standards
Disclosure Number Description Response Reason for Omission
GRI 418: Customer Privacy 2016
GRI 103: Management Approach 2016
103-1 Explain why the topic is material and provide its Boundary.
Pages 54-56
103-2 Explain how the organization manages the topic.
Pages 54-56
103-3 Explain how the organization evaluates the management approach.
Pages 54-56
418-1 Substantiated complaints concerning breaches of customer privacy and losses of customer data.
There were no breaches of customer privacy or losses of customer data in 2016.
GRI 419: Socioeconomic Compliance 2016
GRI 103: Management Approach 2016
103-1 Explain why the topic is material and provide its Boundary.
Pages 38-39
103-2 Explain how the organization manages the topic.
Pages 38-39
103-3 Explain how the organization evaluates the management approach.
Pages 38-39
419-1 Noncompliance with laws and regulations in the social and economic area.
No signifi cant fi nes were paid for noncompliance with laws and regulations in 2016.