Embed Size (px)
Citation preview
2008 UPS Corporate Sustainability Report
EVERYONE MATTERS
UPS Volunteer of the Year, Andy Jinchang He, Guangzhou City, China.
Table of Contents
2008 UPS CSR
1.0 EVERYONE MATTERS
2.0 LETTER FROM THE CHAIRMAN
3.0 SUSTAINABILITY AT UPS
3.1 Environmental Protection Through Network Efficiency
3.2 Community Engagement: Global and Grass-Roots
3.3 Major Developments Since Our 2007 Report
3.4 Our Sustainability Principles
3.5 About This Report
4.0 REPORT HIGHLIGHTS
4.1 Key Performance Indicators
4.2 2008 Achievements
4.3 External Recognition
4.4 2009 Objectives
5.0 GOVERNANCE
5.1 Governance Structure
5.2 Letter from the Senior Sustainability Officer
5.3 Governance Principles and Processes
5.4 Public Policy Engagement
5.5 Stakeholder Engagement
6.0 ECONOMIC PROSPERITY
6.1 UPS Overview
6.2 Economic Impact
6.3 Grow Business Profitably Through Technology
6.4 Support Global Trade
6.5 Build the Brand
6.6 Focus on Customers
6.7 Provide Value-Added Solutions
6.8 Develop People
7.0 ENVIRONMENTAL STEWARDSHIP
7.1 Commitment to Environmental Leadership
7.2 Reducing Fuel Use and Emissions
7.3 New Airline Emission Reduction Goal
7.4 Emissions Reduction Through Network Efficiency
7.5 Emissions Reduction by Employees and Customers
7.6 Conservation and Recycling
7.7 Environmental Management System
8.0 SOCIAL RESPONSIBILITY
8.1 Develop People
8.2 Promote Safety and Wellness
8.3 Embrace Diversity and Human Rights
8.4 Support Communities
9.0 GLOBAL REPORTING INITIATIVE
9.1 GRI-G3 Index
Design: Emotive Brand, San Francisco
1
1.0 Everyone Matters
2008 UPS CSR
At UPS, Sustainability is Not a Program. It’s Personal.
Everyone at UPS is part of an international logistics network that makes global commerce more efficient. The nearly 426,000 people of UPS continually strive to meet customer needs while reducing our environmental impact in more than 200 countries and territories around the world.
Our drivers, pilots, loaders, planners, mechanics, and engineers—and the thousands of people working to support them—know that getting the details right benefits not only our company, but also the world that depends on us.
Our people applied this same approach to social responsibility in 2008, donating nearly US$53 million to the United Way and more than 1.2 million volunteer hours to give our corporate philanthropy a powerful grass-roots impact.
In 2008 we invested significant management time and resources to focus on the sustainability of our business. We believe these investments will make our network even more efficient and our business even more sustainable. Yet the essence of sustainability at UPS will remain the same.
Everyone matters.
22008 UPS CSR
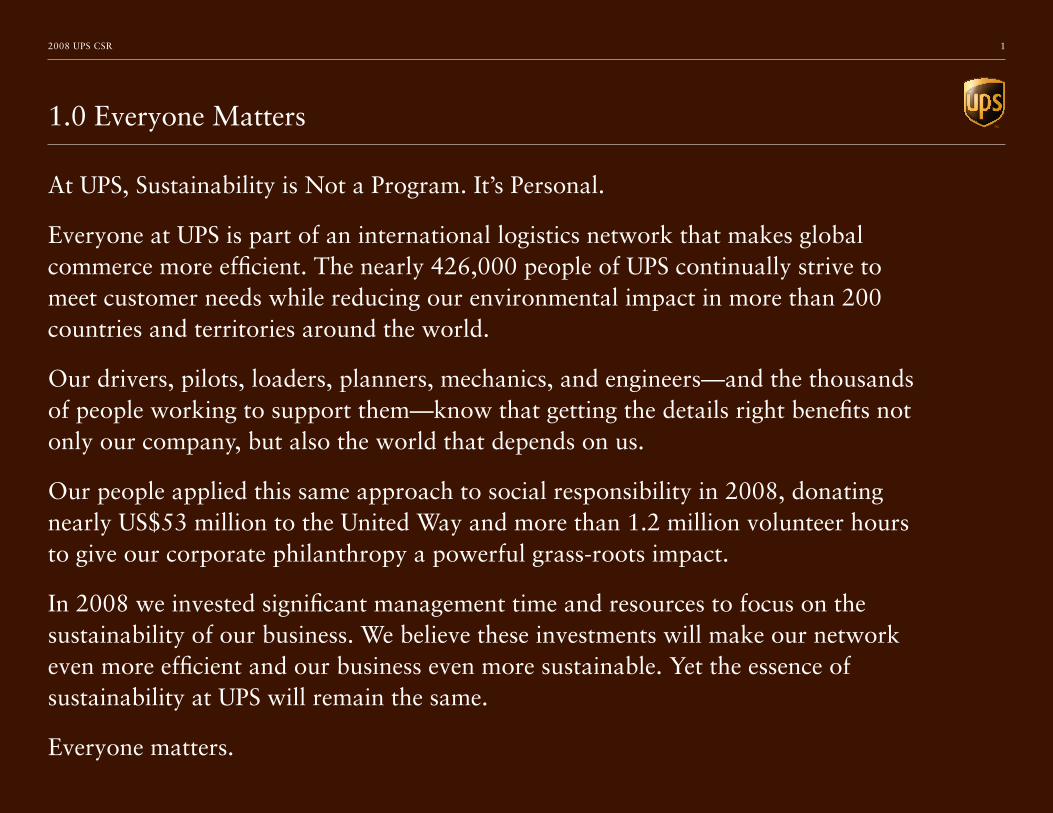
15.5 million packages per day. One integrated network.
The people of UPS make world commerce more efficient by consolidating all types of packages from all over the world into a single network—an average of more than 15.5 million packages every business day. This saves time, money, energy, and greenhouse gas emissions for a world that needs to manage them all.

32008 UPS CSR
US$46.9 million in Foundation giving. One focused strategy.
In 2008, The UPS Foundation realigned its philanthropy strategy with UPS sustain-ability principles. As a result, the Foundation issued its first major environmental grants, totaling US$2.7 million for projects ranging from environmental education in the United States to tree planting in Africa, China, and South America.
42008 UPS CSR
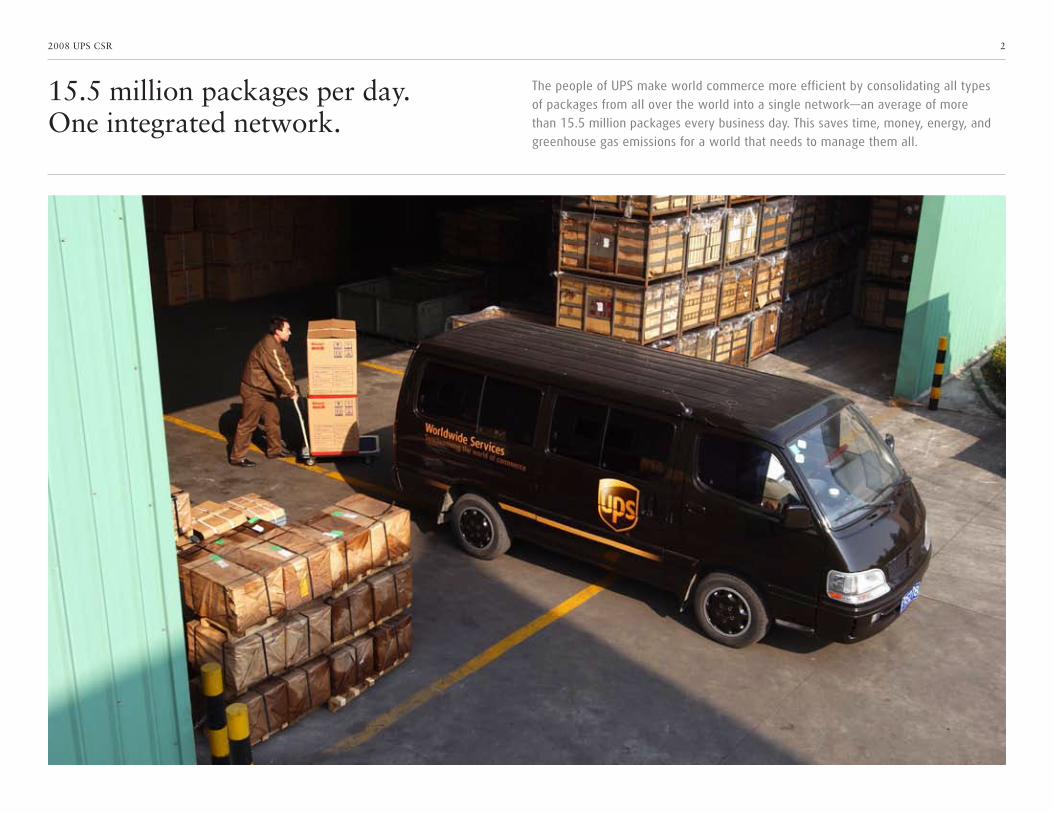
1 million metric tonnes of CO2 avoided. One intermodal network.
UPS uses rail transport extensively to gain significant carbon reductions—far more than any other package delivery company in the United States. In 2008, ground-to-rail shifts prevented absolute emissions of 1 million metric tonnes of CO2 in our U.S. Package Operations.
52008 UPS CSR
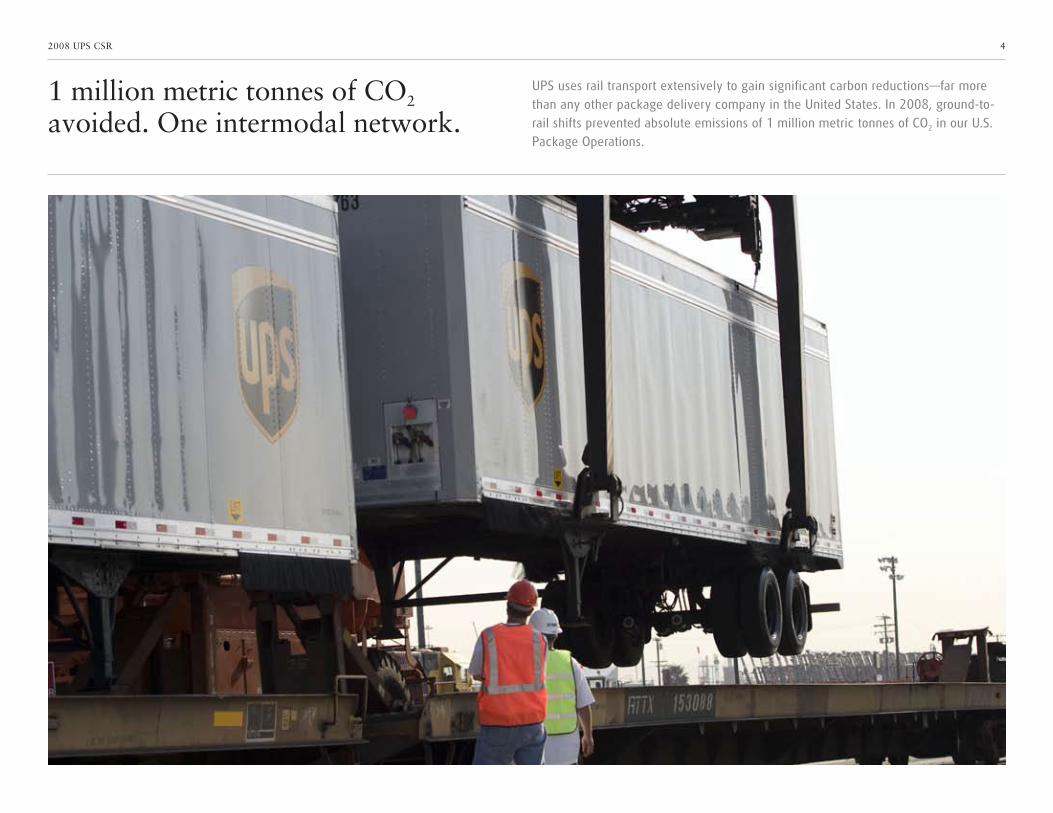
US$61 million. One great cause.
In 2008, more than 249,000 UPS employees and retirees donated nearly US$53 million to United Way. With an additional US$8 million donation by The UPS Foundation, UPS again led all companies in financial support for United Way. On top of that, UPS employees and family members donated over 1.2 million volunteer hours to their communities.
62008 UPS CSR
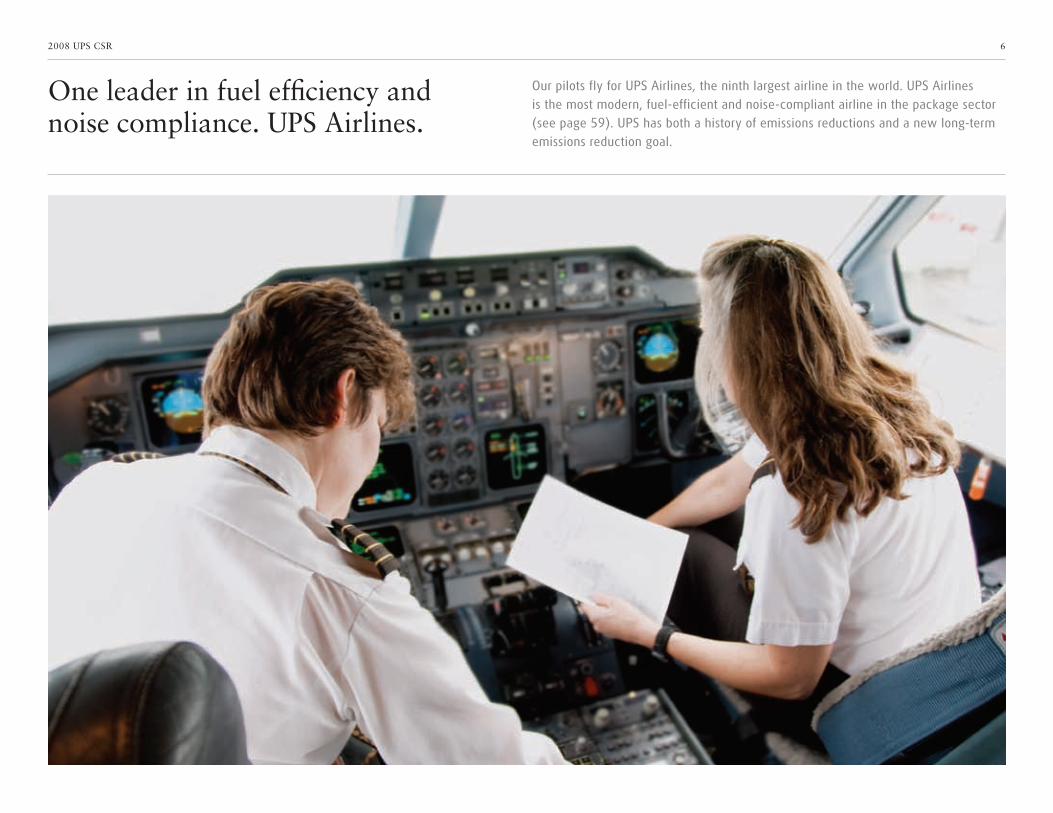
One leader in fuel efficiency and noise compliance. UPS Airlines.
Our pilots fly for UPS Airlines, the ninth largest airline in the world. UPS Airlines is the most modern, fuel-efficient and noise-compliant airline in the package sector (see page 59). UPS has both a history of emissions reductions and a new long-term emissions reduction goal.

72008 UPS CSR
Three kinds of disaster relief.One global system.
UPS is making disaster relief more effective by partnering with the United Nations and with other logistics companies. In 2008, we donated more than US$3 million in financial aid, provided essential in-kind services, and put trained disaster logistics employees on the ground on two continents.
82008 UPS CSR
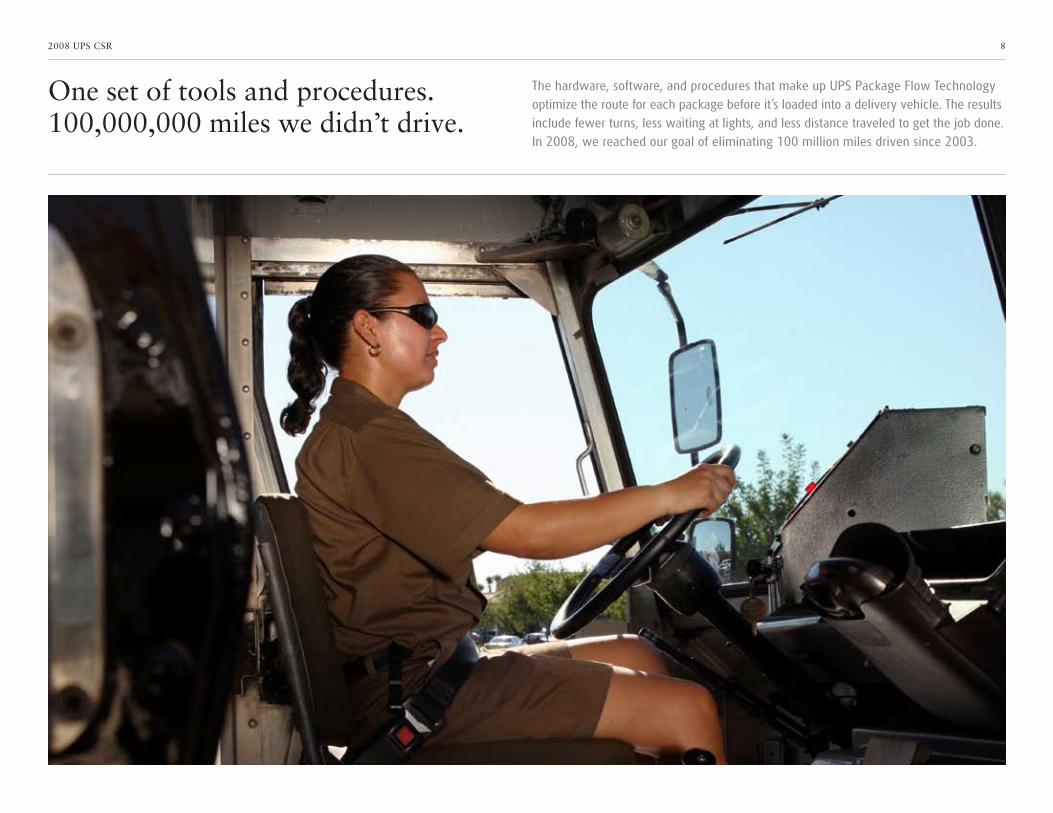
One set of tools and procedures.100,000,000 miles we didn’t drive.
The hardware, software, and procedures that make up UPS Package Flow Technology optimize the route for each package before it’s loaded into a delivery vehicle. The results include fewer turns, less waiting at lights, and less distance traveled to get the job done. In 2008, we reached our goal of eliminating 100 million miles driven since 2003.

92008 UPS CSR
40 percent increase in fuel-efficiency.One more innovative vehicle.
In 2008, we began operating the package delivery industry’s first hydraulic hybrid vehicle (HHV). It joins our existing fleet of 1,819 alternative fuel/technology vehi-cles, already the largest private fleet in our industry. We expect the HHV to operate with 40 percent more fuel efficiency than conventional diesel delivery vehicles.
102008 UPS CSR
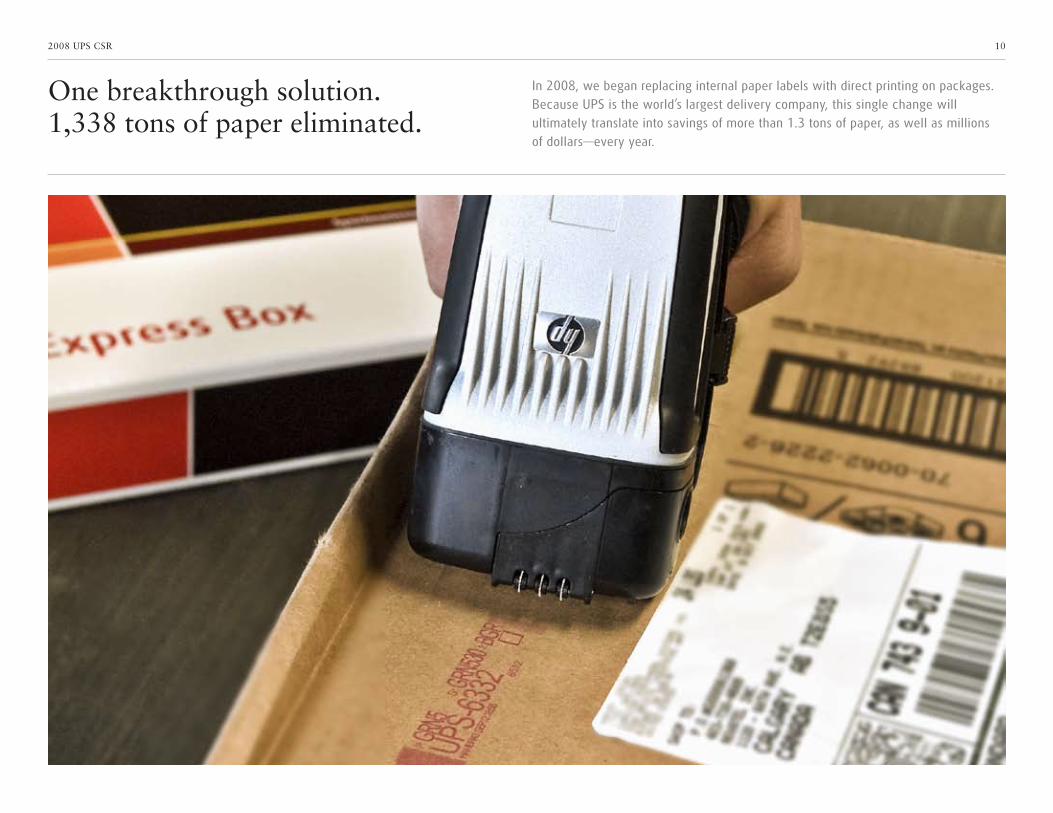
One breakthrough solution.1,338 tons of paper eliminated.
In 2008, we began replacing internal paper labels with direct printing on packages. Because UPS is the world’s largest delivery company, this single change will ultimately translate into savings of more than 1.3 tons of paper, as well as millions of dollars—every year.
11
2.0 Letter from the Chairman
2008 UPS CSR / Letter from the Chairman
Much has changed since our first Corporate
Sustainability Report, issued in 2003. Then, UPS
was largely a U.S. company focused on package
delivery. Today, we are more global, more diversified
in the products and services we offer, and larger in
scale and scope. We are one of the world’s largest
private employers, with nearly 426,000 employees.
Our airline is the ninth largest in the world. We
operate in more than 200 countries and territories.
And we are a vital part of our customers’ global
supply chains, moving nearly two percent of the
world’s GDP. As we have grown, so has our impact.
Consequently, we are more conscious than ever
of the responsibility to manage our business wisely.
This change in our thinking matches that of our
stakeholders, who believe that companies have
an obligation to be transparent about their social,
economic, and environmental performance. As a
result, we dedicated staff to collect and analyze
data about our activities for reporting purposes and
to help us identify gaps that need to be addressed.
I also have appointed a senior vice president,
Bob Stoffel, to be the person accountable for our
overall sustainability program.
In this Report, we unveil detailed information about
our sustainability strategy, our guiding principles,
and our new goals and Key Performance Indicators.
Our data is much more global in scope and also
encompasses business units beyond our traditional
package delivery business. This is particularly appar-
ent in the environmental data offered in this Report.
While we have reported on our CO2 inventory for
a number of years, we are now able to report on a
global, enterprise-wide basis. Therefore, the invento-
ries for 2008 and 2007 include both direct (Scope 1)
and indirect (Scope 2 and 3) emissions—a level of
disclosure unusual among our industry peers.
We believe this is important not just for UPS but also
for our customers and society. The fact is that our
customers rely on the transportation and logistics
industry as part of their supply chains. They need
accurate information from the industry to calculate
At UPS, 2008 was a watershed year for sustainability. We completed work on a set of five-year sustainability goals and evaluated how our company must act to continue to be a sustainable enterprise.
D. Scott Davis, Chairman and Chief Executive Officer

12
2.0 Letter from the Chairman continued
2008 UPS CSR / Letter from the Chairman
their own CO2 inventories and report them to
the public. For that reason, we advocate full
disclosure (Scope 1, 2 and 3) for the transportation
and logistics industry.
This Report is notable also in that it presents for
the first time an emissions reduction goal for UPS
Airlines, which is the source of 53 percent of the
emissions in our global inventory. Even though we
operate the industry’s most modern, fuel-efficient,
noise-compliant airline (see page 59), we are pursu-
ing an aggressive 20 percent additional reduction in
emissions. This builds on our 28 percent reduction
already achieved between 1990 and 2005. You can
find a detailed description of the goal and our plans
to achieve it in section 7. And bear in mind that
this is just one environmental initiative among
many involving our air and ground fleets, our use
of rail transport, and conservation at our facilities.
Our challenge in the coming years is to push our-
selves to go beyond efficiency improvements and
to address our expanding environmental impact
as our business grows.
In the social responsibility area, this Report outlines
our new philanthropic strategy and, for the first time,
offers statements from outside stakeholders regard-
ing their engagements with UPS to address significant
social issues. We also highlight the growing diversity
of our workforce and celebrate the achievement of an
industry-leading workplace safety goal.
All of these activities build on a long-held belief that
our success is dependent on the balance of social,
economic and environmental aspects of our business.
We hold steadfast to this belief, even in uncertain
times. While other companies may step back from
sustainability activities in a challenging economy,
we are stepping forward because we believe that
using our resources wisely and responsibly makes us
stronger for the long run. Time has proven that our
sustainability efforts give us improved efficiencies,
employee pride, customer loyalty, and brand equity.
We renew that commitment in this Report.
D. Scott Davis
Even though we operate the industry’s most modern, fuel-efficient, noise-compliant airline (see page 59), we are pursuing an aggressive 20 percent additional reduction in emissions.
13
3.0 Sustainability at UPS
2008 UPS CSR
UPS has made major strides in sustainability management, measurement and disclosure capability since the 2007 Corporate Sustainability Report. We summarize those developments here. This section should be read in conjunction with those that focus on 2008 highlights (section 4), governance (section 5), economic prosperity (section 6), environmental stewardship (section 7), and social responsibility (section 8).
3.1 Environmental Protection Through Network Efficiency
3.2 Community Engagement: Global and Grass-Roots
3.3 Major Developments Since Our 2007 Report
3.4 Our Sustainability Principles
3.5 About This Report
14
3.1 Environmental Protection Through Network Efficiency
2008 UPS CSR / Sustainability at UPS
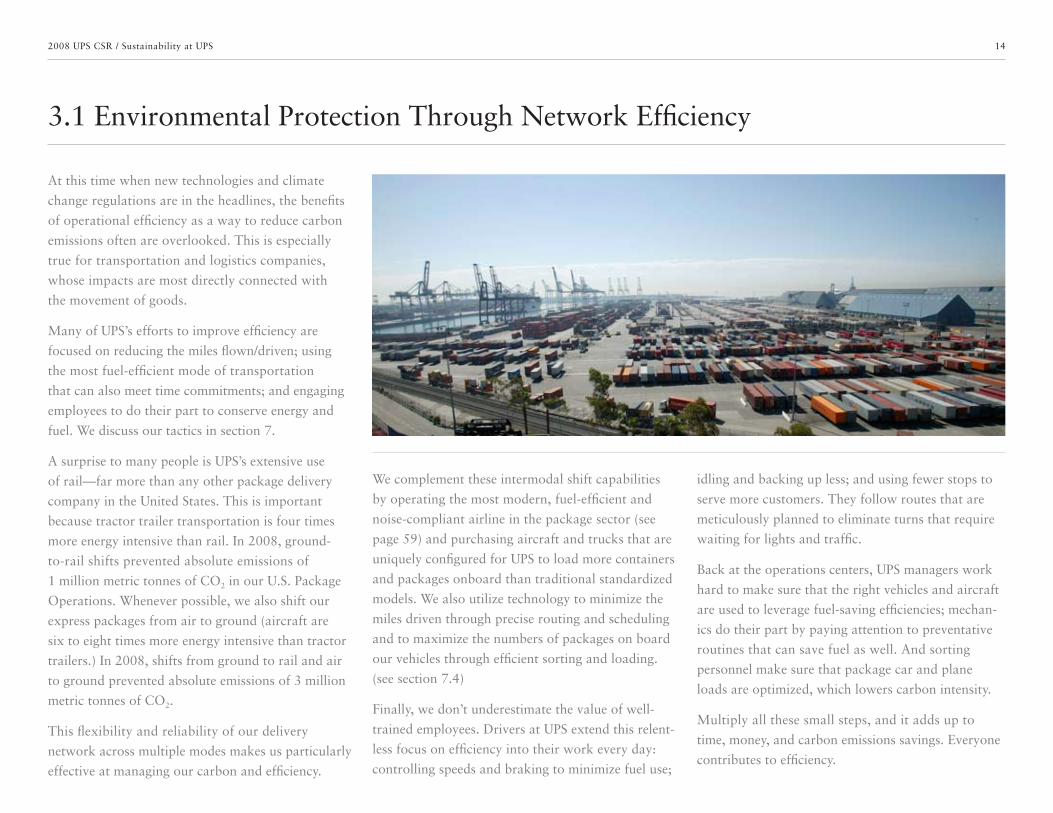
At this time when new technologies and climate
change regulations are in the headlines, the benefits
of operational efficiency as a way to reduce carbon
emissions often are overlooked. This is especially
true for transportation and logistics companies,
whose impacts are most directly connected with
the movement of goods.
Many of UPS’s efforts to improve efficiency are
focused on reducing the miles flown/driven; using
the most fuel-efficient mode of transportation
that can also meet time commitments; and engaging
employees to do their part to conserve energy and
fuel. We discuss our tactics in section 7.
A surprise to many people is UPS’s extensive use
of rail—far more than any other package delivery
company in the United States. This is important
because tractor trailer transportation is four times
more energy intensive than rail. In 2008, ground-
to-rail shifts prevented absolute emissions of
1 million metric tonnes of CO2 in our U.S. Package
Operations. Whenever possible, we also shift our
express packages from air to ground (aircraft are
six to eight times more energy intensive than tractor
trailers.) In 2008, shifts from ground to rail and air
to ground prevented absolute emissions of 3 million
metric tonnes of CO2.
This flexibility and reliability of our delivery
network across multiple modes makes us particularly
effective at managing our carbon and efficiency.
We complement these intermodal shift capabilities
by operating the most modern, fuel-efficient and
noise-compliant airline in the package sector (see
page 59) and purchasing aircraft and trucks that are
uniquely configured for UPS to load more containers
and packages onboard than traditional standardized
models. We also utilize technology to minimize the
miles driven through precise routing and scheduling
and to maximize the numbers of packages on board
our vehicles through efficient sorting and loading.
(see section 7.4)
Finally, we don’t underestimate the value of well-
trained employees. Drivers at UPS extend this relent-
less focus on efficiency into their work every day:
controlling speeds and braking to minimize fuel use;
idling and backing up less; and using fewer stops to
serve more customers. They follow routes that are
meticulously planned to eliminate turns that require
waiting for lights and traffic.
Back at the operations centers, UPS managers work
hard to make sure that the right vehicles and aircraft
are used to leverage fuel-saving efficiencies; mechan-
ics do their part by paying attention to preventative
routines that can save fuel as well. And sorting
personnel make sure that package car and plane
loads are optimized, which lowers carbon intensity.
Multiply all these small steps, and it adds up to
time, money, and carbon emissions savings. Everyone
contributes to efficiency.
15
3.2 Community Engagement: Global and Grass-Roots
2008 UPS CSR / Sustainability at UPS
UPS is interwoven with society like few other organi-
zations. Our people travel the main streets and
alleyways, and visit offices, factories, and homes in
more than 200 countries. Our employees see first-
hand the challenges and opportunities that exist for
the people of the world.
As a consequence, our company and our employees
have a century-old legacy of investing directly into
the health of the communities where they live and
work. We share our resources through direct finan-
cial contributions, volunteerism, leadership on boards
and committees, and skills and knowledge transfer.
Whenever possible, we contribute our acumen in
good management practices, logistics, and transporta-
tion to improve the efficiency of communities.
We began these commitments in the United States,
but this aspect of our culture is now flourishing
outside the United States. For example, in 2008,
our top volunteer service award, the James E. Casey
Community Service Award, went to Andy Jinchang
He of Guangzhou, China, for his work with disad-
vantaged children and the elderly (see our cover and
section 8, page 93, for an in-depth profile). Andy,
a driver, epitomizes the community spirit of UPSers
that thrives at the grass-roots and local level, as well
as at the corporate level.
In 2008, UPSers and their families collectively
volunteered more than 1.2 million hours.
Financially, employees also are generous. Just like
the previous seven years, employees and their families
donated more to the United Way campaign than
any other company—US$53 million from employees
and retirees and an additional US$8 million donated
by The UPS Foundation.
The UPS Foundation in 2008 gave grants to more
than 4,800 non-profit agencies totaling US$46.9 mil-
lion. About half those grants were determined by
employee committees at the local level. Eligibility
for local grants includes employee volunteerism and
selection by grassroots employee committees.
We believe that community service is one of the special
parts of our culture that makes us an Employer of
Choice and a respected global corporate citizen.
To learn more about these topics, go to section 8
of this report.
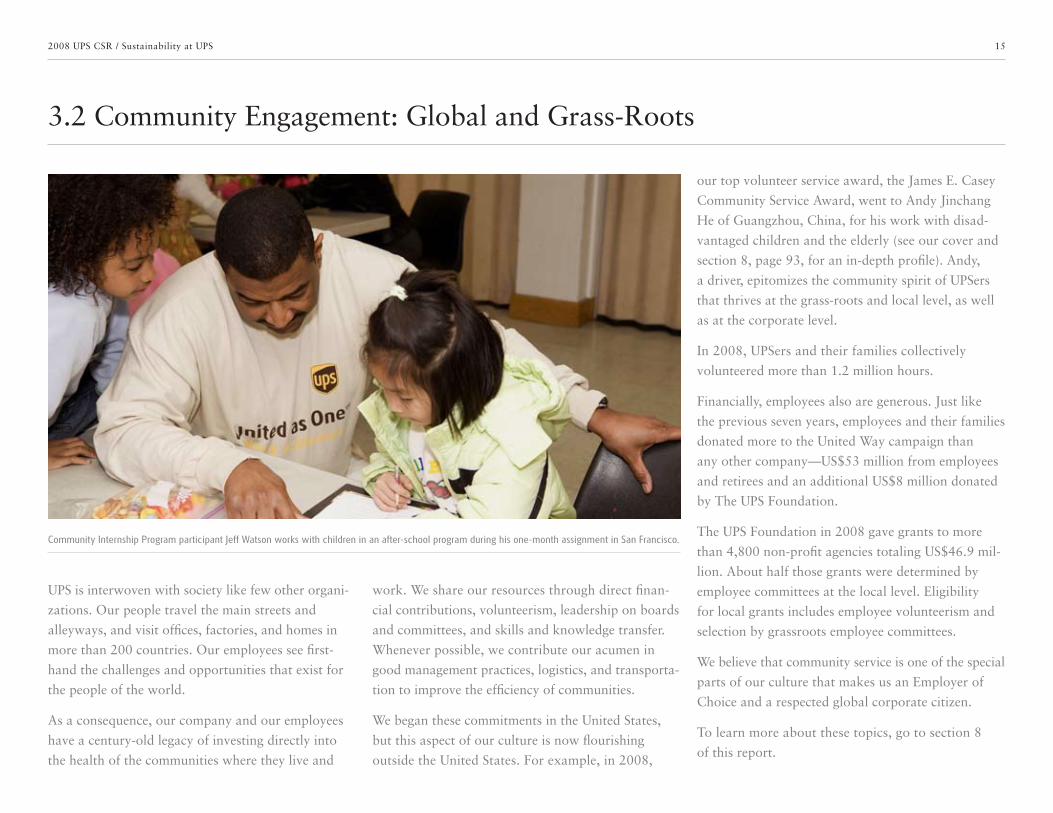
Community Internship Program participant Jeff Watson works with children in an after-school program during his one-month assignment in San Francisco.
16
3.3 Major Developments Since Our 2007 Report
2008 UPS CSR / Sustainability at UPS
2008 was a year of significant developments in
sustainability at UPS. Many of these developments
stem directly from a commitment by our senior
management to formalize long-held sustainability
values and principles, set strategies for expressing
them more systematically, and evaluate their own
functions’ performance accordingly. This includes
increased accountability within their respective man-
agement teams for achieving goals and operating pro-
grams that affect our sustainability as a business.
With this senior management leadership and support,
we have taken a series of strategic steps since our
2007 Corporate Sustainability Report. More infor-
mation on these steps is provided in later sections
of this Report.
We purchased and are deploying enterprise software
to manage our sustainability performance more
robustly. As a logistics company, we understand fully
that it’s hard to manage something we can’t measure.
After a thorough assessment of relevant processes
and technologies, we invested in industry-leading
software capable of helping us capture and analyze
our global environmental, social, and economic data.
We believe this software will lead to more compre-
hensive sustainability reporting, especially in the area
of our global carbon inventory.
We captured our global carbon inventory for 2007
and 2008. With an enterprise information technology
(IT) solution in place, we are now able to view our
business as a whole from the point of view of energy
use and greenhouse gas emissions. This includes
Scope 1, 2 and 3 impacts that take into account our
operations, infrastructure, transportation partners
and service contractors, and supply chain. We are
also able to break down our carbon inventory in
different ways, not only by how our business is orga-
nized but also by how we source the energy we use,
such as from specific quadrants of the public power
grid. This data in turn has enabled us to update and
upgrade the sustainability performance indicators we
report on each year and set more credible goals with
more in-depth empirical data.
We updated and expanded our Key Performance
Indicators (KPIs) and set new goals. A complete
list of our new KPIs is provided in section 4 of
this Report. As before, the KPIs cover our environ-
mental performance, our safety record, employee
satisfaction, and philanthropy. A key difference
is that we are now able in many cases to report on
a global rather than a U.S. basis, and include our
freight and supply chain businesses with our package
delivery business.
We set a long-term, industry-leading, verifiable goal
for airline emission reductions. UPS has been a
pioneer in managing its airline to reduce emissions
and noise. We welcome statistically valid compari-
sons with our peers and competitors, because we
believe it will help our entire industry improve its
performance. Therefore, we adopted a measurement
that is common in the airline industry. Our own
emission reduction goal is one of our new KPIs
as explained above. The goal is a 20 percent reduc-
tion from 2005 to 2020 and represents a 42 percent
reduction between 1990 and 2020.
We initiated third-party validation of our sustain-
ability reporting. Consistent with our commitment
to sustainability and the growing expectations
of stakeholders around the world, we have engaged
Deloitte & Touche LLP to perform a review of
our 2009 UPS Corporate Sustainability Report
(which will be released in 2010). The review will
be conducted in accordance with attestation stan-
dards established by the American Institute of
Certified Public Accountants and will consider our
reporting under the Global Reporting Initiative’s
G3 Sustainability Framework.
In 2008, UPS became the first shipping company
to join the U.S. Environmental Protection Agency’s
Climate Leaders® program. Climate Leaders is
an industry/government partnership in which
companies develop comprehensive climate change
strategies. Partner companies commit to reducing
their impact on the global environment by complet-
ing a corporate-wide inventory of greenhouse gas
emissions, setting aggressive reduction goals and
annually reporting their progress to the EPA.

17
3.4 Our Sustainability Principles
2008 UPS CSR / Sustainability at UPS
At UPS, we recognize sustainability as the business
strategies and activities that meet the needs of the
enterprise and its stakeholders today while protect-
ing and enhancing the human and natural resources
that will be needed in the future. While we have
been operating in accordance with this definition for
most of our 102-year history, in 2008 we decided to
take a more explicit approach.
We therefore identified specific principles for sustain-
ability in our global logistics and transport industry.
The principles we identified now guide us in setting
business strategies and putting them into action,
so that everything we do helps us achieve our aspira-
tions as a sustainable business.
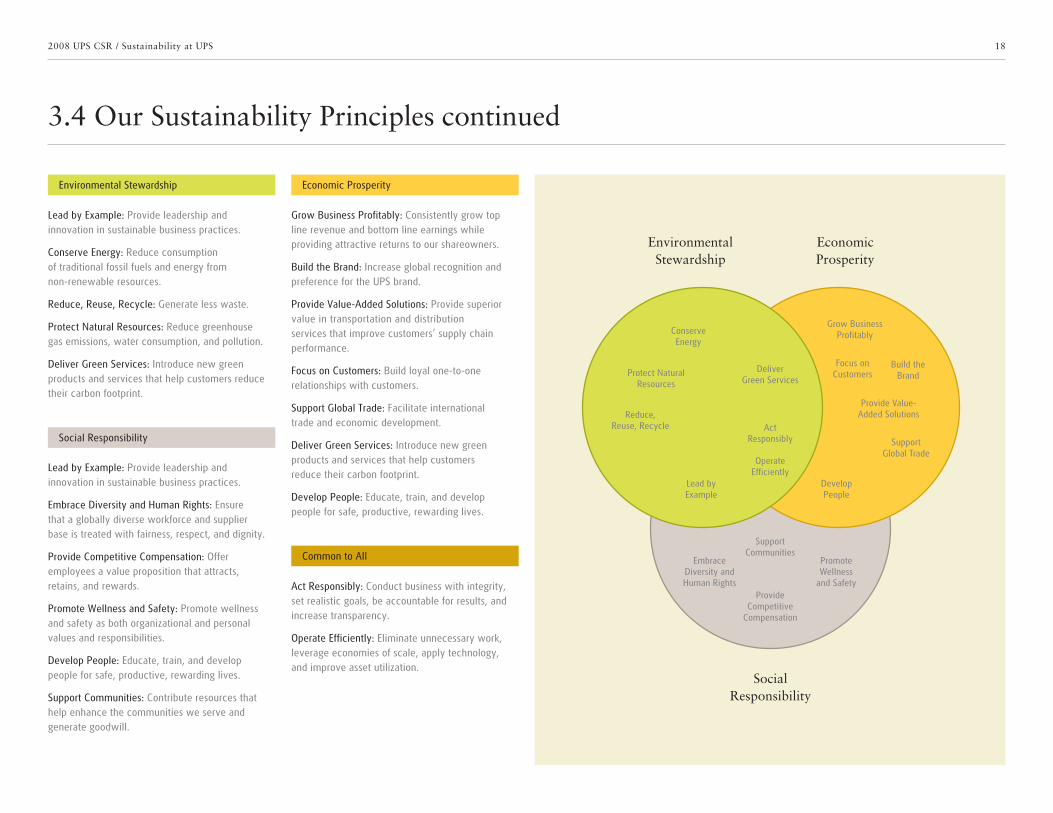
We originally organized our sustainability principles
according to the three broad categories that character-
ize any sustainable enterprise: economic prosperity,
social responsibility, and environmental stewardship.
It soon became apparent that a number of our
principles apply to more than one of these broad
categories, and two principles applied to all three.
This integrated approach to sustainability strategy
is illustrated in the diagram on the following page.
The two principles common to all aspects of our
sustainability strategy are to operate efficiently and
act responsibly. Together they drive us to expand
our positive effect on the world faster than we
expand our environmental impact and help us
directly increase our contribution to addressing
global climate change.
Strengthen the Enterprise
Economic Prosperity
Improve the Human Condition
Social Responsibility
Protect the Environment
Environmental Stewardship
182008 UPS CSR / Sustainability at UPS
Protect NaturalResources
Reduce,Reuse, Recycle
ConserveEnergy
Deliver Green Services
Embrace Diversity and Human Rights
Lead by Example: Provide leadership and innovation in sustainable business practices.
Embrace Diversity and Human Rights: Ensure that a globally diverse workforce and supplier base is treated with fairness, respect, and dignity.
Provide Competitive Compensation: Offer employees a value proposition that attracts, retains, and rewards.
Promote Wellness and Safety: Promote wellness and safety as both organizational and personal values and responsibilities.
Develop People: Educate, train, and develop people for safe, productive, rewarding lives.
Support Communities: Contribute resources that help enhance the communities we serve and generate goodwill.
Lead by Example: Provide leadership and innovation in sustainable business practices.
Conserve Energy: Reduce consumption of traditional fossil fuels and energy from non-renewable resources.
Reduce, Reuse, Recycle: Generate less waste.
Protect Natural Resources: Reduce greenhouse gas emissions, water consumption, and pollution.
Deliver Green Services: Introduce new green products and services that help customers reduce their carbon footprint.
Grow Business Profitably: Consistently grow top line revenue and bottom line earnings while providing attractive returns to our shareowners.
Build the Brand: Increase global recognition and preference for the UPS brand.
Provide Value-Added Solutions: Provide superior value in transportation and distribution services that improve customers’ supply chain performance.
Focus on Customers: Build loyal one-to-one relationships with customers.
Support Global Trade: Facilitate international trade and economic development.
Deliver Green Services: Introduce new green products and services that help customers reduce their carbon footprint.
Develop People: Educate, train, and develop people for safe, productive, rewarding lives.
Act Responsibly: Conduct business with integrity, set realistic goals, be accountable for results, and increase transparency.
Operate Efficiently: Eliminate unnecessary work, leverage economies of scale, apply technology, and improve asset utilization.
Lead by Example
DevelopPeople
Provide Competitive
Compensation
Promote Wellness
and Safety
Support Communities
OperateEfficiently
ActResponsibly
Grow BusinessProfitably
Build theBrand
Provide Value-Added Solutions
Focus on Customers
SupportGlobal Trade
EnvironmentalStewardship
EconomicProsperity
SocialResponsibility
Economic Prosperity
Common to All
Environmental Stewardship
Social Responsibility
3.4 Our Sustainability Principles continued
19
3.5 About This Report
2008 UPS CSR / Sustainability at UPS
UPS has issued a Corporate Sustainability Report
every year since 2003. For all past reports,
please visit our sustainability website at
sustainability.ups.com.
We based this Report on the third generation of
Global Reporting Initiative (GRI) guidelines, known
as GRI-G3. GRI is an independent institution that
provides a standardized framework for sustainability
reporting, conceptually similar to the international
accounting standards that corporations use for
financial reporting. We self-declare this Report
to GRI Application Level B. For a complete list
of GRI-G3 topics and where to find corresponding
information in this Report, please see section 9.
We invite readers to send comments or questions
regarding this Report to:
UPS
Attention: Lynnette McIntire
55 Glenlake Parkway, N.E.
Atlanta, GA 30328
20
4.0 Report Highlights
2008 UPS CSR
The previous section of this Report, “Sustainability at UPS,” describes long-term, strategic changes to our sustainability commitments and programs. This section presents our complete set of Key Performance Indicators for 2008 along with other achievements. You will also find highlights of external recognition we received during the year, and specific objectives we have set for 2009.
4.1 Key Performance Indicators
4.2 2008 Achievements
4.3 External Recognition
4.4 2009 Objectives
21
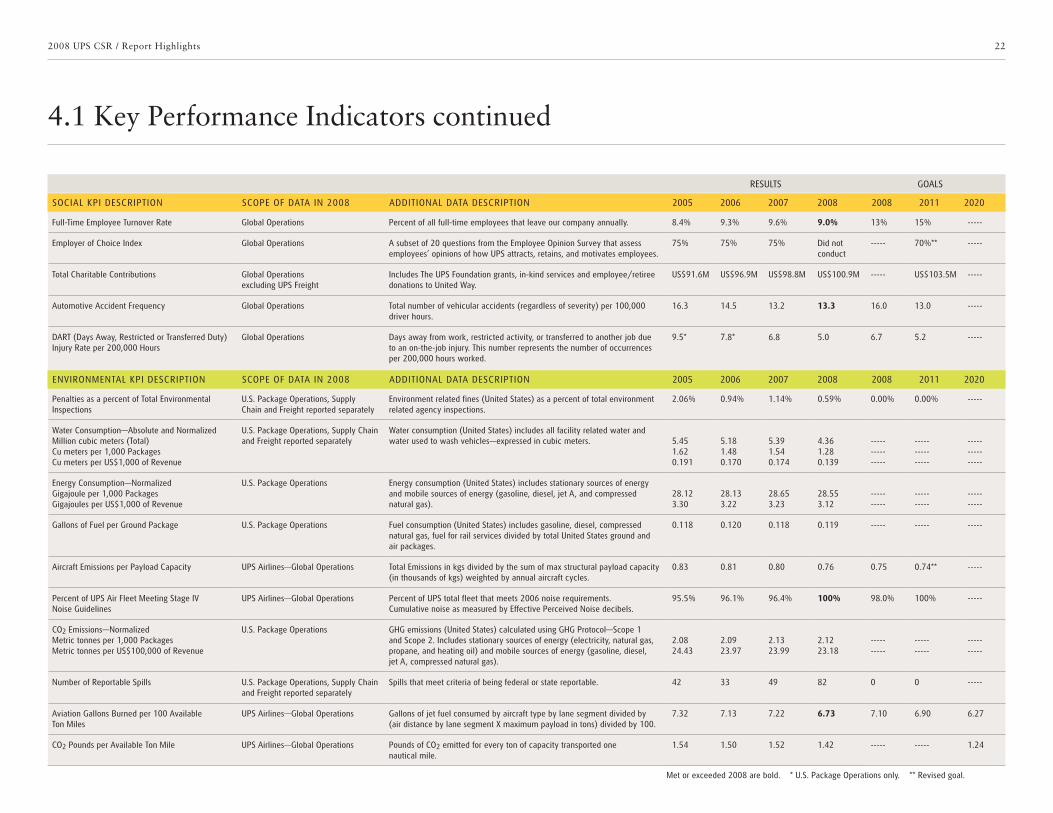
4.1 Key Performance Indicators
2008 UPS CSR / Report Highlights
UPS documents and evaluates its sustainability in
many ways, including both quantitative and quali-
tative information. At the highest level, we track a
number of Key Performance Indicators (KPIs) that
capture important developments such as our carbon
footprint, employee safety, and philanthropy. From
our first Corporate Sustainability Report in 2003
through our 2007 Report, we reported on the same
set of KPIs and associated goals. We reached many
of our previous KPI goals in 2008, which set the
stage for us to address them from a fresh perspective.
As a result, we have revised a number of existing
KPIs and added new ones. In some cases, we have
expanded the scope of KPIs because we are now
able to measure our international operations
with accuracy comparable to our U.S. operations.
In other cases, we have adjusted a KPI to match
internationally accepted reporting standards. Finally,
we have also added a new KPI that focuses on our
aircraft emissions, which represent the largest, single
component of our overall carbon footprint. Overall,
we are striving to make our KPIs more comprehen-
sive, transparent, and useful to external audiences.
Each of the KPIs in the table on the following page
is presented in context in the relevant section of this
Report, with more explanatory detail. We present
them here as a snapshot of our overall sustainability
performance. Note that we have already set 2011
goals for a number of KPIs in this table. We expect
to set additional goals in 2009. In setting these goals,
we are taking into account the views and standards
of a wide range of external stakeholders, specifi-
cally including those that monitor, rate, and report
on our sustainability performance from a third-party
perspective. While we will continue to report annu-
ally on our performance, we also intend to provide
periodic updates. Go to sustainability.ups.com for
updated information.
We reached many of our previous KPI goals in 2008, which set the stage for us to address them from a fresh perspective.
22
Full-Time Employee Turnover Rate Global Operations Percent of all full-time employees that leave our company annually. 8.4% 9.3% 9.6% 9.0% 13% 15% -----
Employer of Choice Index Global Operations A subset of 20 questions from the Employee Opinion Survey that assess employees’ opinions of how UPS attracts, retains, and motivates employees.
75% 75% 75% Did not conduct
----- 70%** -----
Total Charitable Contributions Global Operations excluding UPS Freight
Includes The UPS Foundation grants, in-kind services and employee/retiree donations to United Way.
US$91.6M US$96.9M US$98.8M US$100.9M ----- US$103.5M -----
Automotive Accident Frequency Global Operations Total number of vehicular accidents (regardless of severity) per 100,000 driver hours.
16.3 14.5 13.2 13.3 16.0 13.0 -----
DART (Days Away, Restricted or Transferred Duty) Injury Rate per 200,000 Hours
Global Operations Days away from work, restricted activity, or transferred to another job due to an on-the-job injury. This number represents the number of occurrences per 200,000 hours worked.
9.5* 7.8* 6.8 5.0 6.7 5.2 -----
Penalties as a percent of Total Environmental Inspections
U.S. Package Operations, Supply Chain and Freight reported separately
Environment related fines (United States) as a percent of total environment related agency inspections.
2.06% 0.94% 1.14% 0.59% 0.00% 0.00% -----
Water Consumption—Absolute and NormalizedMillion cubic meters (Total)Cu meters per 1,000 PackagesCu meters per US$1,000 of Revenue
U.S. Package Operations, Supply Chain and Freight reported separately
Water consumption (United States) includes all facility related water and water used to wash vehicles—expressed in cubic meters. 5.45
1.620.191
5.181.480.170
5.391.540.174
4.361.280.139
---------------
---------------
---------------
Energy Consumption—NormalizedGigajoule per 1,000 PackagesGigajoules per US$1,000 of Revenue
U.S. Package Operations Energy consumption (United States) includes stationary sources of energy and mobile sources of energy (gasoline, diesel, jet A, and compressed natural gas).
28.123.30
28.133.22
28.653.23
28.553.12
----------
----------
----------
Gallons of Fuel per Ground Package U.S. Package Operations Fuel consumption (United States) includes gasoline, diesel, compressed natural gas, fuel for rail services divided by total United States ground and air packages.
0.118 0.120 0.118 0.119 ----- ----- -----
Aircraft Emissions per Payload Capacity UPS Airlines—Global Operations Total Emissions in kgs divided by the sum of max structural payload capacity (in thousands of kgs) weighted by annual aircraft cycles.
0.83 0.81 0.80 0.76 0.75 0.74** -----
Percent of UPS Air Fleet Meeting Stage IV Noise Guidelines
UPS Airlines—Global Operations Percent of UPS total fleet that meets 2006 noise requirements. Cumulative noise as measured by Effective Perceived Noise decibels.
95.5% 96.1% 96.4% 100% 98.0% 100% -----
CO2 Emissions—NormalizedMetric tonnes per 1,000 PackagesMetric tonnes per US$100,000 of Revenue
U.S. Package Operations GHG emissions (United States) calculated using GHG Protocol—Scope 1 and Scope 2. Includes stationary sources of energy (electricity, natural gas, propane, and heating oil) and mobile sources of energy (gasoline, diesel, jet A, compressed natural gas).
2.0824.43
2.0923.97
2.1323.99
2.1223.18
----------
----------
----------
Number of Reportable Spills U.S. Package Operations, Supply Chain and Freight reported separately
Spills that meet criteria of being federal or state reportable. 42 33 49 82 0 0 -----
Aviation Gallons Burned per 100 Available Ton Miles
UPS Airlines—Global Operations Gallons of jet fuel consumed by aircraft type by lane segment divided by (air distance by lane segment X maximum payload in tons) divided by 100.
7.32 7.13 7.22 6.73 7.10 6.90 6.27
CO2 Pounds per Available Ton Mile UPS Airlines—Global Operations Pounds of CO2 emitted for every ton of capacity transported one nautical mile.
1.54 1.50 1.52 1.42 ----- ----- 1.24
4.1 Key Performance Indicators continued
2008 UPS CSR / Report Highlights
SCOPE OF DATA IN 2008 ADDITIONAL DATA DESCRIPTION 2005 2006 2007 2008 2008 2011 2020SOCIAL KPI DESCRIPTION
GOALSRESULTS
Met or exceeded 2008 are bold. * U.S. Package Operations only. ** Revised goal.
SCOPE OF DATA IN 2008 ADDITIONAL DATA DESCRIPTION 2005 2006 2007 2008 2008 2011 2020ENVIRONMENTAL KPI DESCRIPTION
23
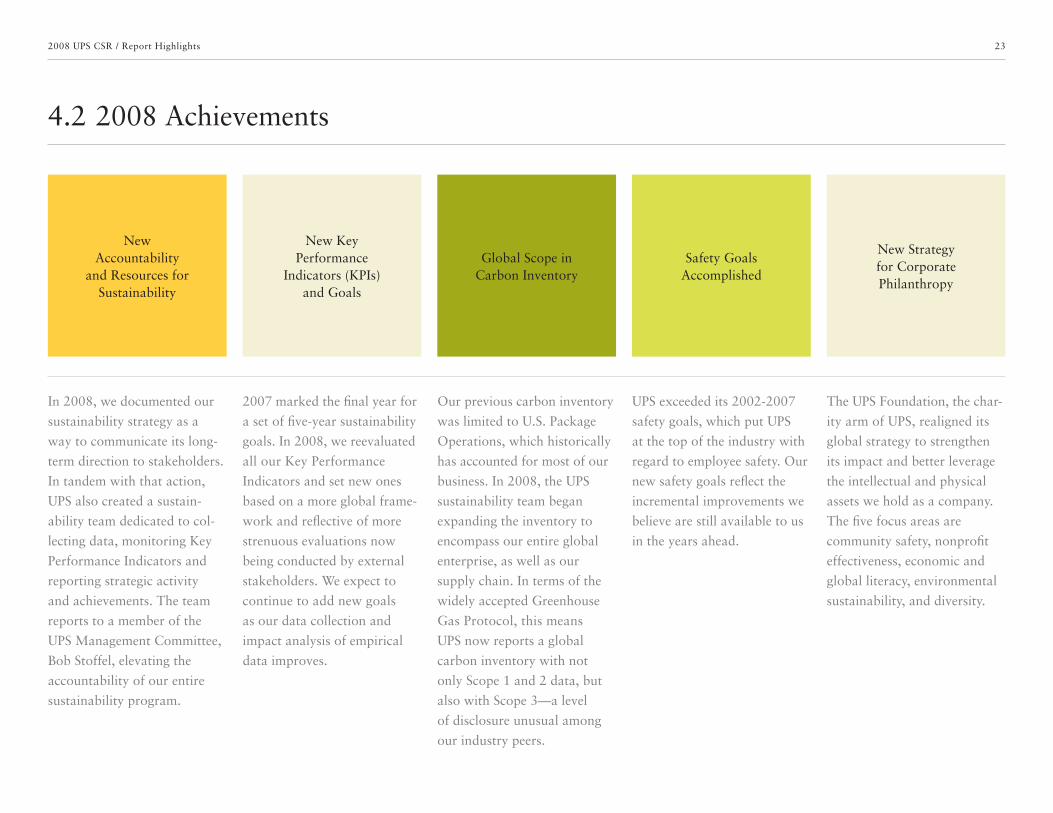
4.2 2008 Achievements
2008 UPS CSR / Report Highlights
In 2008, we documented our
sustainability strategy as a
way to communicate its long-
term direction to stakeholders.
In tandem with that action,
UPS also created a sustain-
ability team dedicated to col-
lecting data, monitoring Key
Performance Indicators and
reporting strategic activity
and achievements. The team
reports to a member of the
UPS Management Committee,
Bob Stoffel, elevating the
accountability of our entire
sustainability program.
2007 marked the final year for
a set of five-year sustainability
goals. In 2008, we reevaluated
all our Key Performance
Indicators and set new ones
based on a more global frame-
work and reflective of more
strenuous evaluations now
being conducted by external
stakeholders. We expect to
continue to add new goals
as our data collection and
impact analysis of empirical
data improves.
Our previous carbon inventory
was limited to U.S. Package
Operations, which historically
has accounted for most of our
business. In 2008, the UPS
sustainability team began
expanding the inventory to
encompass our entire global
enterprise, as well as our
supply chain. In terms of the
widely accepted Greenhouse
Gas Protocol, this means
UPS now reports a global
carbon inventory with not
only Scope 1 and 2 data, but
also with Scope 3—a level
of disclosure unusual among
our industry peers.
UPS exceeded its 2002-2007
safety goals, which put UPS
at the top of the industry with
regard to employee safety. Our
new safety goals reflect the
incremental improvements we
believe are still available to us
in the years ahead.
The UPS Foundation, the char-
ity arm of UPS, realigned its
global strategy to strengthen
its impact and better leverage
the intellectual and physical
assets we hold as a company.
The five focus areas are
community safety, nonprofit
effectiveness, economic and
global literacy, environmental
sustainability, and diversity.
New Accountability
and Resources for Sustainability
New Key Performance
Indicators (KPIs) and Goals
Global Scope in Carbon Inventory
Safety Goals Accomplished
New Strategy for Corporate Philanthropy
24
4.3 External Recognition
2008 UPS CSR / Report Highlights
In 2008, UPS was selected for the sixth
time for the Dow Jones Sustainability
Index for North America.
In Fortune magazine’s ranking of
Most Admired Companies for 2008,
UPS was No. 1 in the Delivery and
Logistics industry and placed among
the top 20 companies overall. In
the category of social responsibility
among American companies, UPS
placed No. 2 in 2008 and No. 1 in
the industry in both 2008 and 2009.
The U.S. Environmental Protection
Agency (EPA) recognized UPS
with its SmartWay Excellence
Award for environmental leadership
in the U.S. freight industry. UPS
was also the first company in the
package sector to join the EPA’s
Climate Leaders Program.
The Women’s Business Enterprise
National Council (WBENC)
named UPS to its “America’s Top
Corporations for Women’s Business
Enterprises.” The award honors
corporations for world-class supplier
diversity programs.
Complete information on external recognition during 2008 is available at pressroom.ups.com.
DOW JONES
SUSTAINABILITY INDEX
FORTUNE MOST ADMIRED COMPANIES
SMARTWAY EXCELLENCE AWARD
WBENC AMERICA’S TOP CORPORATION
25
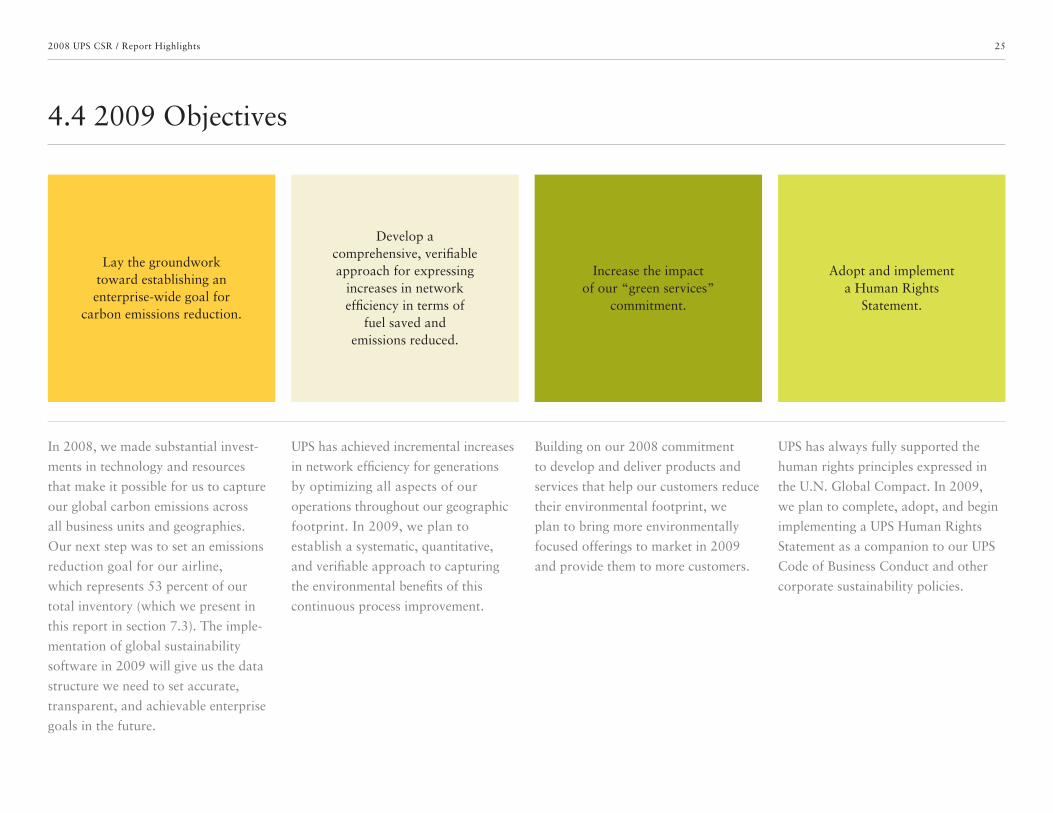
4.4 2009 Objectives
2008 UPS CSR / Report Highlights
In 2008, we made substantial invest-
ments in technology and resources
that make it possible for us to capture
our global carbon emissions across
all business units and geographies.
Our next step was to set an emissions
reduction goal for our airline,
which represents 53 percent of our
total inventory (which we present in
this report in section 7.3). The imple-
mentation of global sustainability
software in 2009 will give us the data
structure we need to set accurate,
transparent, and achievable enterprise
goals in the future.
UPS has achieved incremental increases
in network efficiency for generations
by optimizing all aspects of our
operations throughout our geographic
footprint. In 2009, we plan to
establish a systematic, quantitative,
and verifiable approach to capturing
the environmental benefits of this
continuous process improvement.
Building on our 2008 commitment
to develop and deliver products and
services that help our customers reduce
their environmental footprint, we
plan to bring more environmentally
focused offerings to market in 2009
and provide them to more customers.
UPS has always fully supported the
human rights principles expressed in
the U.N. Global Compact. In 2009,
we plan to complete, adopt, and begin
implementing a UPS Human Rights
Statement as a companion to our UPS
Code of Business Conduct and other
corporate sustainability policies.
Lay the groundwork toward establishing an enterprise-wide goal for
carbon emissions reduction.
Develop a comprehensive, verifiable approach for expressing
increases in network efficiency in terms of
fuel saved and emissions reduced.
Increase the impact of our “green services”
commitment.
Adopt and implement a Human Rights
Statement.
26
5.0 Governance
2008 UPS CSR
UPS provides detailed governance information within the Investor Relations website. We publish this information for the benefit of shareowners, employees, and stakeholders of the company. In this section of the Report, we highlight key aspects of our governance structures, principles, and processes. Also described here are our activities to influence public policy and engage with our stakeholders. We encourage all readers to visit our governance web pages at investor.shareholder.com/ups for further information.
5.1 Governance Structure
5.2 Letter from the Senior Sustainability Officer
5.3 Governance Principles and Processes
5.4 Public Policy Engagement
5.5 Stakeholder Engagement
27
BOARD OF DIRECTORS
The top governance body at UPS is the Board of
Directors. Eight of the 10 members are indepen-
dent, as defined below. The Chairman of the Board,
D. Scott Davis, is also Chief Executive Officer (CEO)
of UPS, which we believe ensures that Board-level
directions are appropriately carried out by the UPS
Management Committee. The remaining director,
Michael L. Eskew, is a non-executive member in
his capacity as former Chairman and CEO of UPS.
Mr. Davis and Mr. Eskew comprise the Executive
Committee of the Board. The other three committees
are made up of independent directors.
INDEPENDENT DIRECTORS
We define an “independent” director as one whom
the Board has determined has no material relation-
ship, other than as a director of the company, with
the company or any of its consolidated subsidiaries,
either directly, or as a partner, shareholder, or officer
of an organization that has a relationship with the
company. In addition, when determining whether
a director is independent, the Board applies addi-
tional categorical standards that are set forth
at investor.shareholder.com/ups. The independent
directors meet regularly as a group, without
employee directors present. We believe that having
a strong majority of independent directors ensures
avoidance of conflict of interest on the part of the
Board of Directors. In addition, our corporate
compliance officer reports directly to the Audit
Committee, which met nine times in 2008 and is
composed entirely of independent directors.
COMPENSATION AND PERFORMANCE
Compensation for the CEO is based on performance
in meeting objectives established by the Compensation
Committee of the Board of Directors. The Committee
also reviews and approves compensation for other
executive officers. The charter for the Committee
can be found at investor.shareholder.com/ups.
COMMUNICATING WITH THE BOARD
We encourage shareowners to communicate directly
with our Board of Directors, with our independent
directors as a group, or with the presiding director
of our independent directors. We publish the relevant
address here and on our governance website:
UPS c/o Corporate Secretary
55 Glenlake Parkway, N.E.
Atlanta, Georgia 30328
MANAGEMENT COMMITTEE
Supporting the Board of Directors is the UPS
Management Committee, comprising 12 senior
managers of the company. The only person sitting
on both the Board and the Management Committee
is CEO D. Scott Davis. The Management Committee
is a vital component of the UPS governance structure,
because it includes senior managers from all major
operational and administrative groups within UPS.
The Management Committee includes Bob Stoffel,
Senior Vice President for Supply Chain, Strategy,
Engineering, and Sustainability. Mr. Stoffel holds this
portfolio of responsibilities in common because they
all have a substantial and inter-related impact on our
economic prosperity, environmental stewardship,
and social responsibility.
5.1 Governance Structure
2008 UPS CSR / Governance
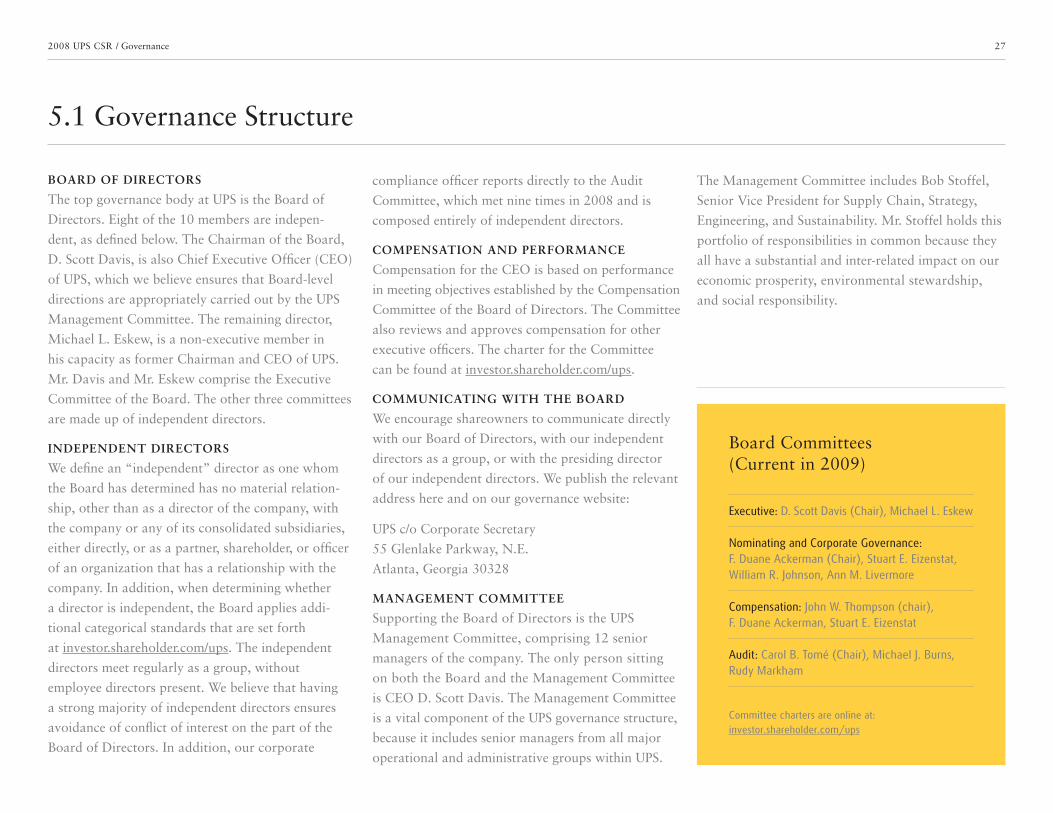
Board Committees (Current in 2009)
Committee charters are online at: investor.shareholder.com/ups
Executive: D. Scott Davis (Chair), Michael L. Eskew
Nominating and Corporate Governance: F. Duane Ackerman (Chair), Stuart E. Eizenstat, William R. Johnson, Ann M. Livermore
Compensation: John W. Thompson (chair), F. Duane Ackerman, Stuart E. Eizenstat
Audit: Carol B. Tomé (Chair), Michael J. Burns, Rudy Markham
28
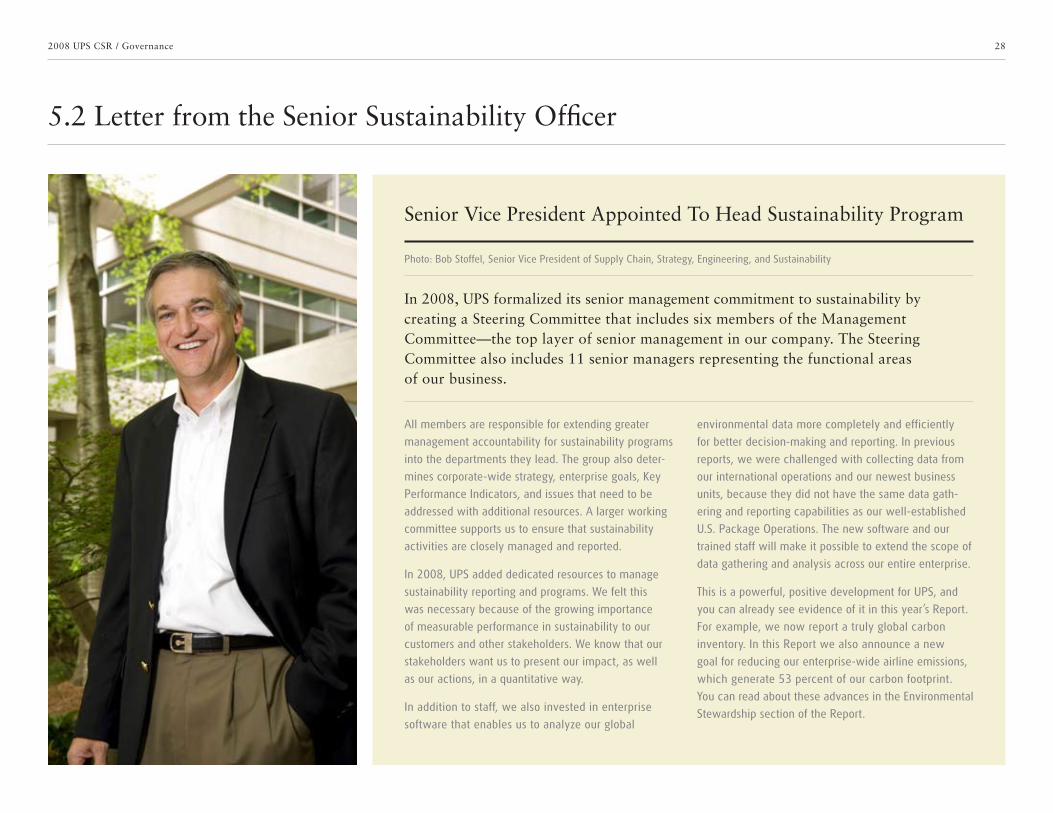
In 2008, UPS formalized its senior management commitment to sustainability by creating a Steering Committee that includes six members of the Management Committee—the top layer of senior management in our company. The Steering Committee also includes 11 senior managers representing the functional areas of our business.
Senior Vice President Appointed To Head Sustainability Program
Photo: Bob Stoffel, Senior Vice President of Supply Chain, Strategy, Engineering, and Sustainability
5.2 Letter from the Senior Sustainability Officer
2008 UPS CSR / Governance
All members are responsible for extending greater
management accountability for sustainability programs
into the departments they lead. The group also deter-
mines corporate-wide strategy, enterprise goals, Key
Performance Indicators, and issues that need to be
addressed with additional resources. A larger working
committee supports us to ensure that sustainability
activities are closely managed and reported.
In 2008, UPS added dedicated resources to manage
sustainability reporting and programs. We felt this
was necessary because of the growing importance
of measurable performance in sustainability to our
customers and other stakeholders. We know that our
stakeholders want us to present our impact, as well
as our actions, in a quantitative way.
In addition to staff, we also invested in enterprise
software that enables us to analyze our global
environmental data more completely and efficiently
for better decision-making and reporting. In previous
reports, we were challenged with collecting data from
our international operations and our newest business
units, because they did not have the same data gath-
ering and reporting capabilities as our well-established
U.S. Package Operations. The new software and our
trained staff will make it possible to extend the scope of
data gathering and analysis across our entire enterprise.
This is a powerful, positive development for UPS, and
you can already see evidence of it in this year’s Report.
For example, we now report a truly global carbon
inventory. In this Report we also announce a new
goal for reducing our enterprise-wide airline emissions,
which generate 53 percent of our carbon footprint.
You can read about these advances in the Environmental
Stewardship section of the Report.
29
5.2 Letter from the Senior Sustainability Officer continued
2008 UPS CSR / Governance
We also have been more actively reaching out to
new groups of stakeholders to learn their expectations
and ideas about how we can improve our performance.
We know that these constituencies are often the best
sources of good ideas for strengthening our sustain-
ability as a thriving business.
As examples: from customers, we are finding ways
to offer new products and services that meet their
own sustainability reporting and environmental needs;
from NGOs (non-governmental organizations) and
assessors we are learning how to enhance our cred-
ibility in reporting and how to hone our programs
to meet their expectations; from employees we are
discovering new ways we can make our operations
more efficient and environmentally friendly, and also
how to give them more flexibility to balance their
personal and professional needs.
I look forward to sharing our progress on the sustain-
ability goals presented in this Report. You can look
to our website at sustainability.ups.com for regular
updates on our new initiatives and achievements
throughout the year.
Bob Stoffel
30
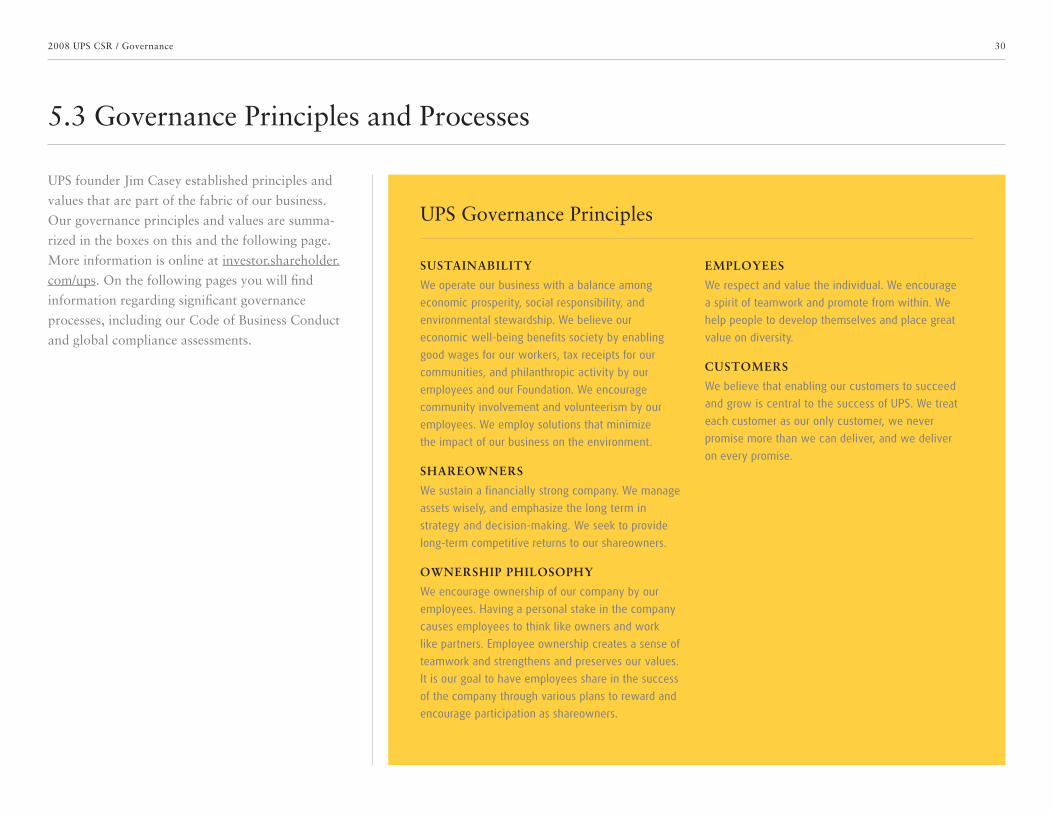
SUSTAINABILITY
We operate our business with a balance among
economic prosperity, social responsibility, and
environmental stewardship. We believe our
economic well-being benefits society by enabling
good wages for our workers, tax receipts for our
communities, and philanthropic activity by our
employees and our Foundation. We encourage
community involvement and volunteerism by our
employees. We employ solutions that minimize
the impact of our business on the environment.
SHAREOWNERS
We sustain a financially strong company. We manage
assets wisely, and emphasize the long term in
strategy and decision-making. We seek to provide
long-term competitive returns to our shareowners.
OWNERSHIP PHILOSOPHY
We encourage ownership of our company by our
employees. Having a personal stake in the company
causes employees to think like owners and work
like partners. Employee ownership creates a sense of
teamwork and strengthens and preserves our values.
It is our goal to have employees share in the success
of the company through various plans to reward and
encourage participation as shareowners.
EMPLOYEES
We respect and value the individual. We encourage
a spirit of teamwork and promote from within. We
help people to develop themselves and place great
value on diversity.
CUSTOMERS
We believe that enabling our customers to succeed
and grow is central to the success of UPS. We treat
each customer as our only customer, we never
promise more than we can deliver, and we deliver
on every promise.
5.3 Governance Principles and Processes
2008 UPS CSR / Governance
UPS founder Jim Casey established principles and
values that are part of the fabric of our business.
Our governance principles and values are summa-
rized in the boxes on this and the following page.
More information is online at investor.shareholder.
com/ups. On the following pages you will find
information regarding significant governance
processes, including our Code of Business Conduct
and global compliance assessments.
UPS Governance Principles
31
5.3 Governance Principles and Processes continued
2008 UPS CSR / Governance
CODE OF BUSINESS CONDUCT
Our Code of Business Conduct provides an
overview of our legal and ethical responsibilities
as employees. We update the Code as necessary
to address new and relevant issues that may affect
our business. The Code also provides a mechanism
for its own revision when suggested changes arise.
In 2009, for example, we intend to update the Code
to include a statement supporting the U.N. Global
Compact on Human Rights. In 2007 and 2008 we
trained 42,233 of our management employees on
our Business Conduct and Compliance Program.
The complete Code of Business Conduct is online
at investor.shareholder.com/ups.
COMPLIANCE MEASUREMENTS
We internally monitor the effectiveness of our con-
duct and compliance programs in a number of ways,
including an annual Business Ethics Questionnaire
sent to management employees; an annual Report
and Certification of our compliance activities; and
Regulatory Compliance Reviews.
EMPLOYEE CONCERNS
We encourage employees to raise questions, voice
concerns, or report potential violations of our legal
or ethical obligations. We maintain the confidentiality
of the question, concern, or report. We also provide
employees access to a “Help Line” so they can voice
concerns anonymously. The Help Line is available
24 hours a day and seven days a week, interpreters
are available, and calls are taken without caller ID,
recorders, or other devices that can identify or
trace the caller’s number. The Help Line is available
toll-free enterprise-wide. We take each Help Line
call seriously, and address the concerns raised.
Governance Processes

32
5.4 Public Policy Engagement
2008 UPS CSR / Governance
UPS is active in a number of organizations and
public forums for discussion of public policy issues.
Here we highlight three subject areas where we are
involved in public policy, particularly as it relates to
the logistics industry: Climate Change, Global Trade
and Fair Competition, and Community Service.
CLIMATE CHANGE
We participate actively in organizations influential
in environmental policy issues, such as the World
Resource Institute (WRI). UPS employees serve
on a number of technical committees for WRI that
develop standards and guidance, and UPS is a found-
ing member of the WRI Climate Southeast working
group. UPS also contributed expertise as part of
the Consultative Group for a January 2009 World
Economic Forum publication entitled, “Supply Chain
Decarbonization: The Role of Logistics and Transport
in Reducing Supply Chain Carbon Emissions.”
UPS also is active in the U.S. Environmental
Protection Agency’s (EPA’s) various environmental
stewardship programs, as a way to bring industry
insight to the agency for policy consideration and
also as a way to share best practices with companies.
UPS is the first and only global shipping company to
join the Climate Leaders® program of the EPA. UPS
was a charter partner in EPA’s SmartWaySM program,
which is reducing the fuel consumption and emis-
sions impact of the U.S. freight industry. We are a
participant in the SmartWay program at the leader-
ship level, with 100 percent of the UPS-owned vehi-
cle fleet in the program. We also helped the EPA test
the initial SmartWay model, and contributed impor-
tant fuel-saving strategies. We participate in five other
EPA voluntary programs as well, seeking to change
U.S. climate change policy in constructive ways.
As a climate leader in our industry, we invest
significant time and energy in bringing elected offi-
cials and policymakers to our operations centers so
they can learn firsthand how increasing the efficiency
of global logistics and transport helps the world
economy operate with a more sustainable resource
footprint. We also publicize innovations, such as
our purchase and deployment of the industry’s first
hydraulic hybrid vehicle (HHV) in 2008, that can
help create greater awareness of climate change and
influence changes in public policy.
UPS is the first and only global shipping company to join the Climate Leaders® program of the U.S. Environmental Protection Agency (EPA).
33
5.4 Public Policy Engagement continued
2008 UPS CSR / Governance
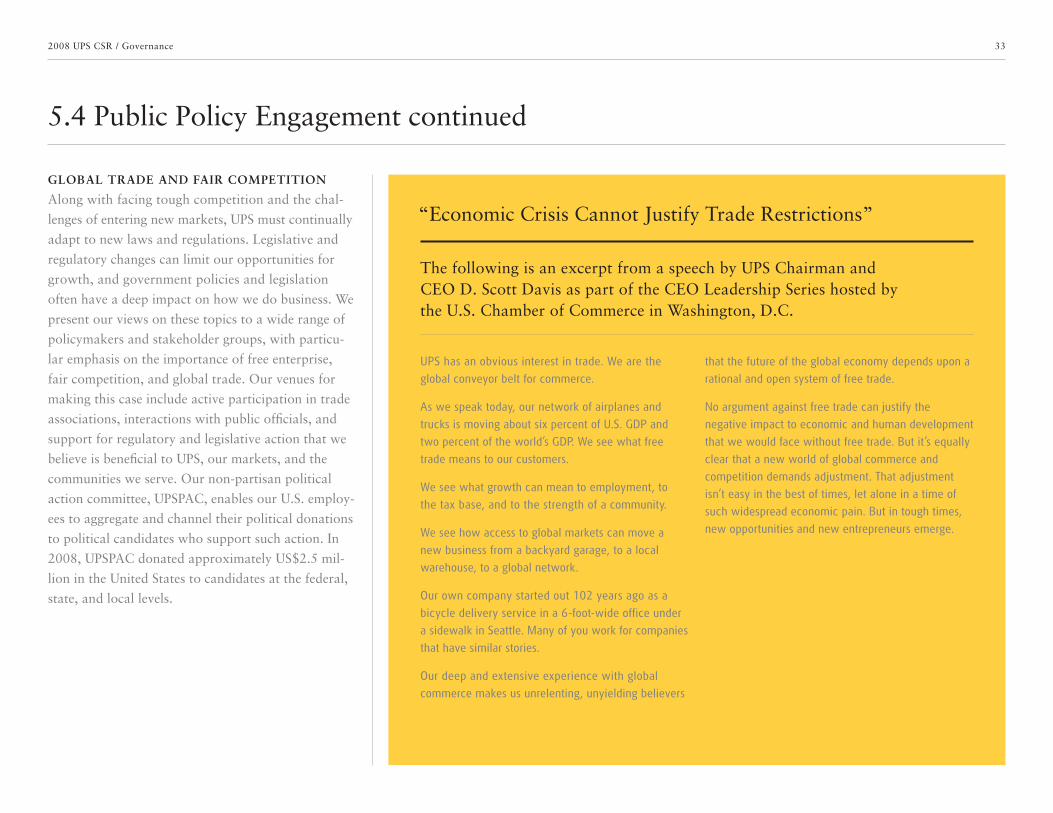
GLOBAL TRADE AND FAIR COMPETITION
Along with facing tough competition and the chal-
lenges of entering new markets, UPS must continually
adapt to new laws and regulations. Legislative and
regulatory changes can limit our opportunities for
growth, and government policies and legislation
often have a deep impact on how we do business. We
present our views on these topics to a wide range of
policymakers and stakeholder groups, with particu-
lar emphasis on the importance of free enterprise,
fair competition, and global trade. Our venues for
making this case include active participation in trade
associations, interactions with public officials, and
support for regulatory and legislative action that we
believe is beneficial to UPS, our markets, and the
communities we serve. Our non-partisan political
action committee, UPSPAC, enables our U.S. employ-
ees to aggregate and channel their political donations
to political candidates who support such action. In
2008, UPSPAC donated approximately US$2.5 mil-
lion in the United States to candidates at the federal,
state, and local levels.
UPS has an obvious interest in trade. We are the
global conveyor belt for commerce.
As we speak today, our network of airplanes and
trucks is moving about six percent of U.S. GDP and
two percent of the world’s GDP. We see what free
trade means to our customers.
We see what growth can mean to employ ment, to
the tax base, and to the strength of a community.
We see how access to global markets can move a
new business from a backyard garage, to a local
warehouse, to a global network.
Our own company started out 102 years ago as a
bicycle delivery service in a 6-foot-wide office under
a sidewalk in Seattle. Many of you work for companies
that have similar stories.
Our deep and extensive experience with global
commerce makes us unrelenting, unyielding believers
that the future of the global economy depends upon a
rational and open system of free trade.
No argument against free trade can justify the
negative impact to economic and human development
that we would face without free trade. But it’s equally
clear that a new world of global commerce and
competition demands adjustment. That adjustment
isn’t easy in the best of times, let alone in a time of
such widespread economic pain. But in tough times,
new opportunities and new entrepreneurs emerge.
“Economic Crisis Cannot Justify Trade Restrictions”
The following is an excerpt from a speech by UPS Chairman and CEO D. Scott Davis as part of the CEO Leadership Series hosted by the U.S. Chamber of Commerce in Washington, D.C.

34
5.4 Public Policy Engagement continued
2008 UPS CSR / Governance
UPS welcomes opportunities to speak directly to policymakers regarding social, environmental, and economic issues that affect our communities, our industry, and our company. We bring to these engagements our practical business expertise as well as our corporate commitment to sustainability in its many forms. UPS employees have appeared before members of the U.S. Congress in Washington, D.C., at the state level across the United States, and in countless global forums.
Engaging Policymakers on Sustainability
In February of 2009, Lisa Hamilton of UPS
testified before a full hearing of the U.S. House of
Representatives Committee on Education and Labor,
on the topic of “Renewing America through National
Service and Volunteerism.” Hamilton, currently Vice
President of Public Relations for UPS, was speaking
then as President of The UPS Foundation. Under
her leadership in 2008, the Foundation’s “Neighbor
to Neighbor” program supported UPS employees
and their families in donating more than 1.2 million
hours of volunteer service.
In her remarks to the Committee, Hamilton noted
that UPS employees have a “unique vantage point”
on community service. “Each day, UPS people go
to doorsteps in every community across our nation.
We see the hungry, the homeless, and the hopeless.
We see the ills impacting our society—whether it’s the
need for aid in recovery from a natural disaster or the
need for revitalization in a struggling neighborhood—
and we want to make a difference. Our employees
drive our volunteer engagement strategy. They play a
pivotal role in identifying the needs of the community.
As a result, approximately half of The UPS Foundation’s
grants are tied to our employees’ volunteer efforts.”
More information on The UPS Foundation and volun-
teerism at UPS is provided in section 8 of this Report.
Photo: Lisa Hamilton, Vice President of Public Relations
35
5.5 Stakeholder Engagement
2008 UPS CSR / Governance
UPS believes stakeholder engagement is consistent
with good corporate governance and should be an
integrated business practice.
We have regular dialogue with employees, custom-
ers, investors, community leaders, and public offi-
cials through both formal and informal channels.
Together, we seek to balance social, economic, and
environmental considerations for the public good.
UPS has been engaged with many external groups
for decades. We believe that long-time commitment,
personal involvement, and focused action prove to
be the best ways to build trust and connections with
external and internal groups. We offer not only an
attentive ear, but also management and logistics
expertise. Some of those relationships are featured in
this Report, such as our engagements with the World
Economic Forum, Earth Day Network, and World
Association of Girl Guides and Girl Scouts.
We also welcome criticism and diverse points of view.
In fact, one of our guiding principles is to be “con-
structively dissatisfied” with our own performance as
a company. This in turn compels us to listen carefully
to others, who may have better ideas than our own.
For example, we:
• Participate in assessments and surveys by
non-government organization and research firms
as a way to learn about how we compare to our
competitors and other sustainability leaders.
• Actively seek and gather feedback from our
employees through the use of internal surveys,
focus groups and confidential hotlines.
• Engage respectfully in open dialogue with our
unions to answer their concerns.
• Solicit insights from nonprofits, academics, and
community leaders on a variety of emerging
issues or criticisms.
• Review performance scorecards, reporting
standards and other benchmarking tools, such as
awards submissions, to identify areas where we
can improve.
• Respond directly to inquiries and comments from
groups critical of our business practices.
• Catalogue, review and address customer comments
about service issues or concerns about UPS’s actions.
• Track individual customer concerns to determine
if they are trends or broad-based issues.
• Hold benchmarking sessions with other
companies to determine best practices that can be
implemented at UPS.
• Require managers to respond to critical comments
that emerge from employees, both personally
and collectively; according to our policy book,
“We Respect Each Employee’s Point of View.”
• Communicate transparently, consistently and
frequently to shareholders.
In summary, we appreciate feedback on our own oper-
ations and seek to share our expertise with others.
UPS believes stakeholder engagement is consistent with good corporate governance and should be an integrated business practice.
36
6.0 Economic Prosperity
2008 UPS CSR
UPS achieves and sustains economic prosperity through the combined strengths of a world-leading logistics network, state-of-the-art technology, and nearly 426,000 people in more than 200 countries and territories. The service that generates our revenue and income also facilitates global commerce in a more efficient and responsible manner, because it aggregates millions of shipments into one delivery network. Our operating efficiency also supports our environmental stewardship and corporate citizenship. In this section of the Report we present an overview of UPS and its economic impact, highlight our principles related to economic sustainability, and report on relevant activities since our 2007 Report.
6.1 UPS Overview
6.2 Economic Impact
6.3 Grow Business Profitably Through Technology
6.4 Support Global Trade
6.5 Build the Brand
6.6 Focus on Customers
6.7 Provide Value-Added Solutions
6.8 Develop People
37
6.1 UPS Overview
2008 UPS CSR / Economic Prosperity
GLOBAL LEADERSHIP
UPS is the world’s largest package delivery and
logistics company, serving nearly eight million
customers daily. Over the past two decades, we have
built a massive international transportation network,
interconnected by one of the largest information tech-
nology (IT) infrastructures in commercial history. We
have systematically leveraged these assets to expand
our portfolio of services for customers, including
freight transportation and supply chain offerings.
INTEGRATED NETWORK
One of the hallmarks of our management approach
is to operate an integrated network worldwide.
Unlike other companies of comparable size in the
package sector, we use the same network for all
packages, whether they are domestic, international,
commercial, or residential. All modes of transport—
package cars, delivery vehicles, trucks, planes, trains
and ships—fit seamlessly together in our physical net-
work, all synchronized by our IT network infrastruc-
ture. This business model eliminates redundancies
and enables us to use all assets more efficiently while
serving customers more reliably. It also reduces our
environmental impact on a unit volume basis, offers
opportunities to employees, and provides positive
financial performance.
POLICY, RESPONSIBILITY, AND MANAGEMENT
The UPS Charter for how we run our business has
been in place for 10 years and is available online
at investor.shareholder.com/ups. The Management
Committee responsible for executing the charter is
profiled online at pressroom.ups.com. Ten of the 12
members of the UPS Management Committee have
worked for UPS their entire careers, which ensures
that our top managers are thoroughly familiar with
the operating realities of our business at every level.
ECONOMIC RISKS AND OPPORTUNITIES
Because our business is synchronizing commerce
for the global economy, our economic prosperity is
tightly linked to the world’s macroeconomic health.
During 2008, the global economy struggled with
tight credit, falling asset values, and contraction in
demand in many industries. These factors affected
our markets in the second half of 2008; their impact
intensified significantly in the opening quarter of
2009. We have responded to these macroeconomic
risks in a systematic fashion throughout our busi-
ness, including adjustments in hiring, compensation,
network logistics, and expansion plans. With more
than 100 years in business, we have significant man-
agement experience in dealing with economic cycles,
including the importance of planning ahead for the
opportunities we will encounter when the business
cycle turns positive.
The cost and availability of fuel for our vehicle and
aircraft fleets are inherent risk factors, because our
business involves moving goods around the world
using package cars, delivery vehicles, trucks, and
planes. Our primary long-term strategy for managing
these risks is to reduce our dependence on fossil fuels.
We achieve this with a range of techniques and tech-
nologies that enable us to reduce the miles we drive
and fly, and by continuing to increase the number
of alternative fuel/technology vehicles in our ground
fleet. More detailed discussions of fuel efficiency
and other environmental stewardship activities are
provided later in this section and in section 7 of this
Report, respectively. Our Climate Change Statement
can be found on page 51.
38
6.1 UPS Overview continued
2008 UPS CSR / Economic Prosperity
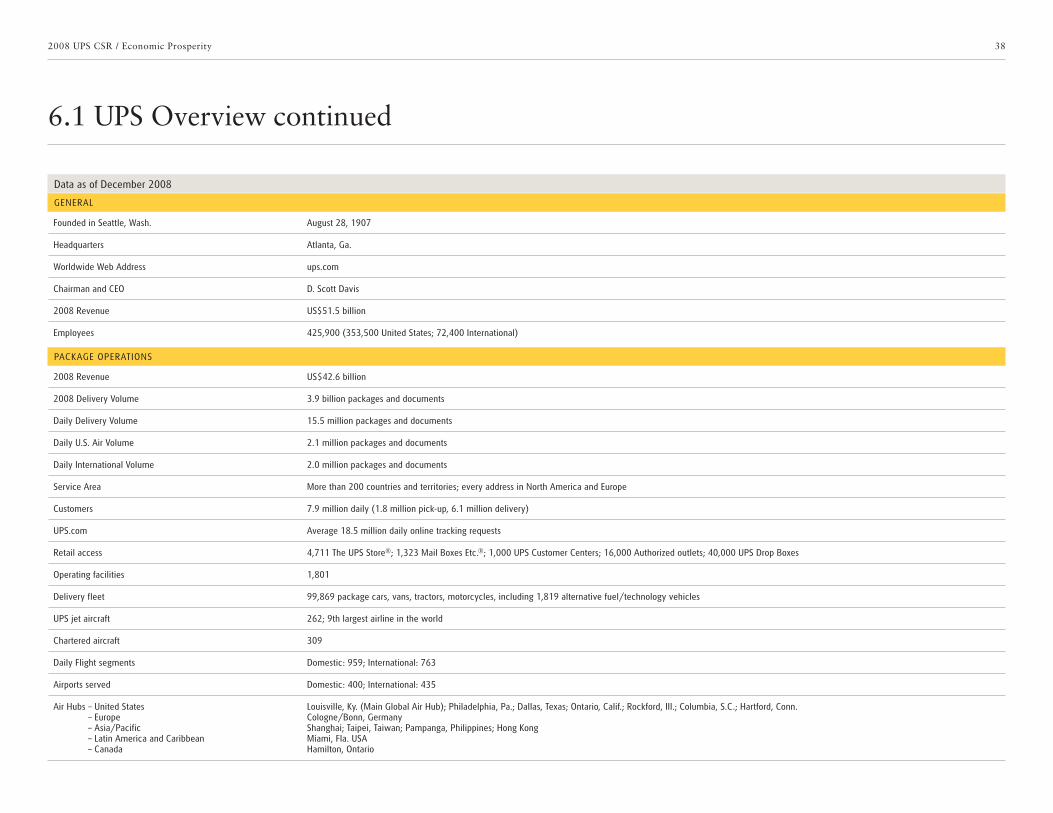
Founded in Seattle, Wash. August 28, 1907
Headquarters Atlanta, Ga.
Worldwide Web Address ups.com
Chairman and CEO D. Scott Davis
2008 Revenue US$51.5 billion
Employees 425,900 (353,500 United States; 72,400 International)
2008 Revenue US$42.6 billion
2008 Delivery Volume 3.9 billion packages and documents
Daily Delivery Volume 15.5 million packages and documents
Daily U.S. Air Volume 2.1 million packages and documents
Daily International Volume 2.0 million packages and documents
Service Area More than 200 countries and territories; every address in North America and Europe
Customers 7.9 million daily (1.8 million pick-up, 6.1 million delivery)
UPS.com Average 18.5 million daily online tracking requests
Retail access 4,711 The UPS Store®; 1,323 Mail Boxes Etc.®; 1,000 UPS Customer Centers; 16,000 Authorized outlets; 40,000 UPS Drop Boxes
Operating facilities 1,801
Delivery fleet 99,869 package cars, vans, tractors, motorcycles, including 1,819 alternative fuel/technology vehicles
UPS jet aircraft 262; 9th largest airline in the world
Chartered aircraft 309
Daily Flight segments Domestic: 959; International: 763
Airports served Domestic: 400; International: 435
Air Hubs – United States – Europe – Asia/Pacific – Latin America and Caribbean – Canada
Louisville, Ky. (Main Global Air Hub); Philadelphia, Pa.; Dallas, Texas; Ontario, Calif.; Rockford, Ill.; Columbia, S.C.; Hartford, Conn.Cologne/Bonn, GermanyShanghai; Taipei, Taiwan; Pampanga, Philippines; Hong KongMiami, Fla. USAHamilton, Ontario
GENERAL
Data as of December 2008
PACKAGE OPERATIONS
39
6.1 UPS Overview continued
2008 UPS CSR / Economic Prosperity
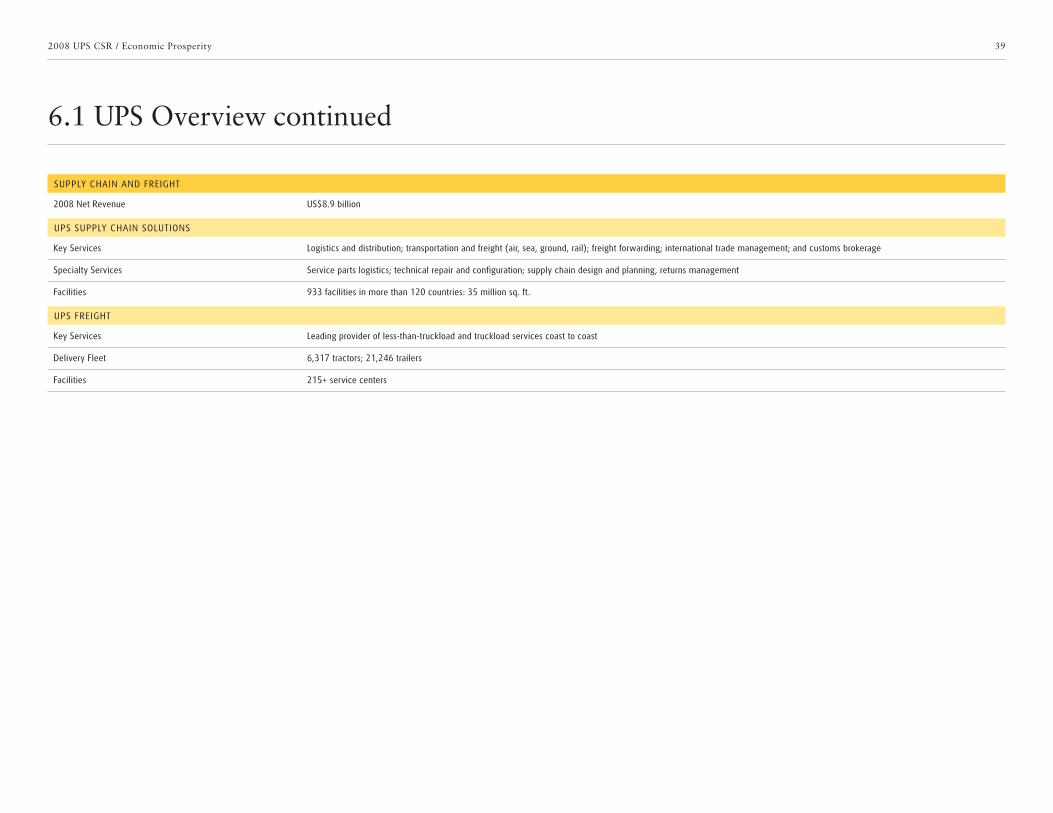
2008 Net Revenue US$8.9 billion
Key Services Logistics and distribution; transportation and freight (air, sea, ground, rail); freight forwarding; international trade management; and customs brokerage
Specialty Services Service parts logistics; technical repair and configuration; supply chain design and planning, returns management
Facilities 933 facilities in more than 120 countries: 35 million sq. ft.
Key Services Leading provider of less-than-truckload and truckload services coast to coast
Delivery Fleet 6,317 tractors; 21,246 trailers
Facilities 215+ service centers
SUPPLY CHAIN AND FREIGHT
UPS FREIGHT
UPS SUPPLY CHAIN SOLUTIONS

40
Revenue
Operating expenses
Net income
Adjusted net income*
Diluted earnings per share
Adjusted diluted earnings per share*
Dividends declared per share
Assets
Long-term debt
Shareowners’ equity
Capital expenditures
Cash and investments
6.2 Economic Impact
2008 UPS CSR / Economic Prosperity
JOBS AND COMPENSATION
As one of the world’s largest private employers, UPS
today has a global workforce of nearly 426,000 people,
more than 72,000 of whom are located outside the
United States. In 2008, UPS paid its full-time and part-
time employees US$26 billion in wages and benefits.
Our global compensation and benefit programs vary
based upon the competitive market, local regulation,
and our desire to create programs that are sustainable.
Our investment in UPS employees generally includes
competitive wages and salaries, health care, savings
plans and incentive programs. Good jobs and compet-
itive compensation packages help make our employees
a positive economic force throughout the world.
DIVIDENDS
In 2008, UPS distributed US$2.22 billion in divi-
dends to UPS shareholders, including approximately
134,000 UPS employees globally. Shareholders
received five dividend payments due to a payment
schedule change.
TAXES
The taxes that UPS pays to local and national
governments around the world help fund schools,
community infrastructure, and services. In 2008, UPS
paid more than US$3.4 billion in taxes worldwide.
SUPPORT FOR SMALL AND DIVERSE BUSINESSES
UPS has an indirect economic impact on its markets
by providing local businesses with three vital
resources: procurement contracts, finance, and
logistics. In areas where money and transport are
not readily available to entrepreneurs, providing
these opportunities makes UPS part of the local
commercial infrastructure. This is particularly
important for small and diverse businesses, which
make up a majority of the world’s importers and
exporters. UPS spent more than US$1.3 billion
with small and diverse businesses in 2008. This
was an increase of US$65.9 million over 2007.
The UPS Store® (with more than 4,700 locations
around the world) is a franchise opportunity for
small business entrepreneurs.
Our financing subsidiary, UPS Capital®, helps small
and diverse businesses finance trade and get access
to government-backed loan programs. In 2008, UPS
was again one of the top 15 lenders by dollar vol-
ume for the U.S. Small Business Administration. The
UPS Foundation has pledged more than US$1 mil-
lion to microlending organizations operating around
the world. In addition, our 26,000 points of retail
presence around the world provide small and diverse
businesses with local, one-stop access to our global
network, including the products, services, and tools
they need. In 2008, we opened retail stores in Beijing
and Shanghai. Our overall goal is to make it easier for
small and diverse businesses everywhere to participate
in the global economy.
Financial Highlights(in millions except for per-share amounts)
2008 2007
US$51,486
46,104
3,003
3,578
2.94
3.50
1.80
31,879
7,797
6,780
2,636
1,049
US$49,692
49,114
382
4,369
0.36
4.11
1.80
39,042
7,506
12,183
2,820
2,604
* For an explanation of adjustments affecting results, see the footnote on page 5 of the UPS 2008 Annual Report at investor.shareholder.com/ups

41
6.2 Economic Impact continued
2008 UPS CSR / Economic Prosperity
In my experience, minority suppliers want what all suppliers want: partnerships
with great customers who value what we offer. This is particularly true for
companies like mine, GIC, which have a proven track record. So when UPS and
GIC both participated in a capacity-building program put on by the National
Minority Supplier Development Council in 2007, it did not take long before we
were in conversation.
Our first opportunity was to provide an automotive part that UPS needed. We had
to produce it profitably at a lower cost than UPS was already paying—and we had
to deliver a prototype in two weeks. We succeeded, and that became our first
order with UPS.
We are now working on a much larger, value-added solution for UPS, and still
enjoying the challenge. Their procurement team is relentless on costs, but also
honest, fair, and respectful at all times. It’s the same with the engineers. They
don’t tell us how to do things, they just tell us the problem and let us solve it. They
also keep their agreements, to the point that GIC is comfortable investing in new
capabilities aimed at serving UPS today and in the future.
This is particularly important to us as a growing company, and I believe most
minority suppliers would agree with me: We want an opportunity to show what
we can do tomorrow, not just repeat what we have done in the past.
Valuing supplier diversity comes from the top down at UPS. Our senior executives
are committed and involved, and we have dedicated staff in corporate manage-
ment and in the field. As a procurement manager, I am expected to be on the
lookout for great suppliers that are qualified to work with UPS. Our markets are
growing more diverse, so supplier diversity is a key to our future growth.
My focus is providing parts for our vehicle fleet, which is one of the largest in the
world. Because we’ve been doing this for decades, we have particular require-
ments that most suppliers can’t meet off the shelf. So one of the things we look for
in a supplier is the ability to listen and learn. It’s unlikely that they have dealt with
a customer like UPS, particularly with regard to how much information we have
and how readily available it is when we are planning or negotiating. So if they can
listen, learn, and work with us as partners, we have opportunities for them.
GIC is a good example of how this works. They listened to our challenges
regarding a strategic, fleet-wide technology project. They understood how rigor-
ously we manage major projects. Then they showed us capabilities we didn’t
know they had, and we realized they could handle some of the project logistics
better than we could ourselves. That doesn’t happen every day at UPS.
Gerald Toledo David HuntFounder and CEO, Global Industrial Components, Inc. Global Procurement Manager, UPS
Stakeholder: Supplier Diversity UPS: Supplier Diversity
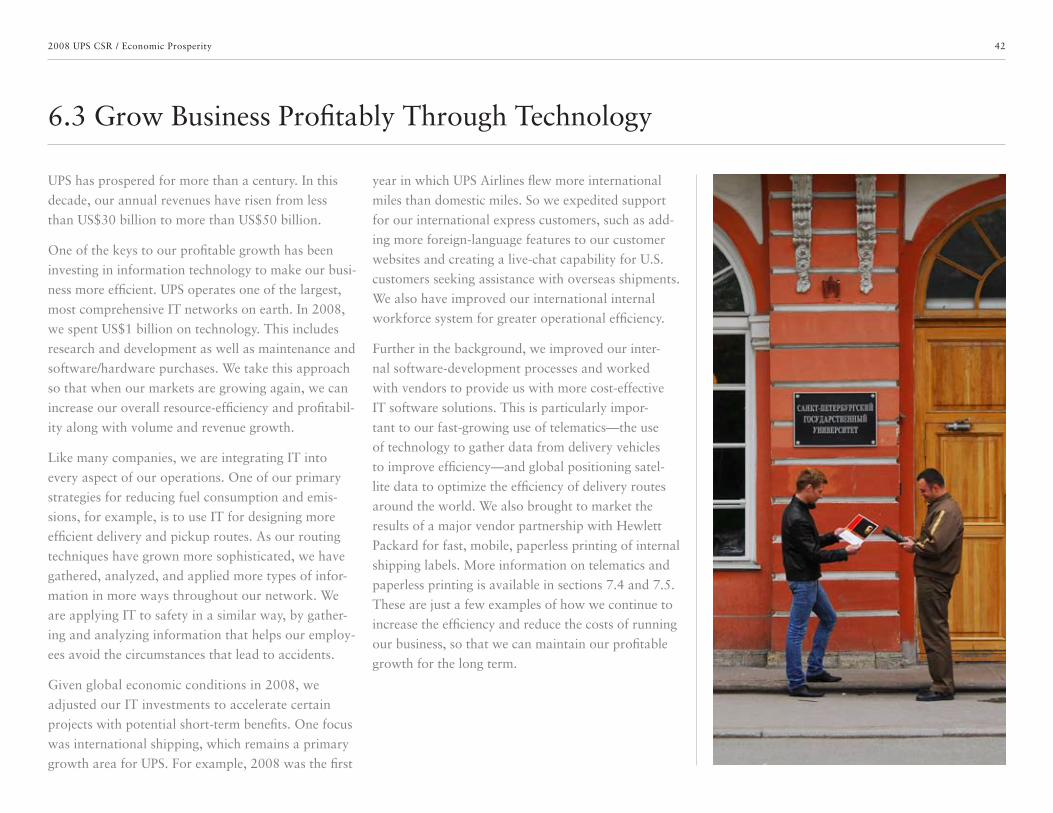
42
6.3 Grow Business Profitably Through Technology
2008 UPS CSR / Economic Prosperity
UPS has prospered for more than a century. In this
decade, our annual revenues have risen from less
than US$30 billion to more than US$50 billion.
One of the keys to our profitable growth has been
investing in information technology to make our busi-
ness more efficient. UPS operates one of the largest,
most comprehensive IT networks on earth. In 2008,
we spent US$1 billion on technology. This includes
research and development as well as maintenance and
software/hardware purchases. We take this approach
so that when our markets are growing again, we can
increase our overall resource-efficiency and profitabil-
ity along with volume and revenue growth.
Like many companies, we are integrating IT into
every aspect of our operations. One of our primary
strategies for reducing fuel consumption and emis-
sions, for example, is to use IT for designing more
efficient delivery and pickup routes. As our routing
techniques have grown more sophisticated, we have
gathered, analyzed, and applied more types of infor-
mation in more ways throughout our network. We
are applying IT to safety in a similar way, by gather-
ing and analyzing information that helps our employ-
ees avoid the circumstances that lead to accidents.
Given global economic conditions in 2008, we
adjusted our IT investments to accelerate certain
projects with potential short-term benefits. One focus
was international shipping, which remains a primary
growth area for UPS. For example, 2008 was the first
year in which UPS Airlines flew more international
miles than domestic miles. So we expedited support
for our international express customers, such as add-
ing more foreign-language features to our customer
websites and creating a live-chat capability for U.S.
customers seeking assistance with overseas shipments.
We also have improved our international internal
workforce system for greater operational efficiency.
Further in the background, we improved our inter-
nal software-development processes and worked
with vendors to provide us with more cost-effective
IT software solutions. This is particularly impor-
tant to our fast-growing use of telematics—the use
of technology to gather data from delivery vehicles
to improve efficiency—and global positioning satel-
lite data to optimize the efficiency of delivery routes
around the world. We also brought to market the
results of a major vendor partnership with Hewlett
Packard for fast, mobile, paperless printing of internal
shipping labels. More information on telematics and
paperless printing is available in sections 7.4 and 7.5.
These are just a few examples of how we continue to
increase the efficiency and reduce the costs of running
our business, so that we can maintain our profitable
growth for the long term.
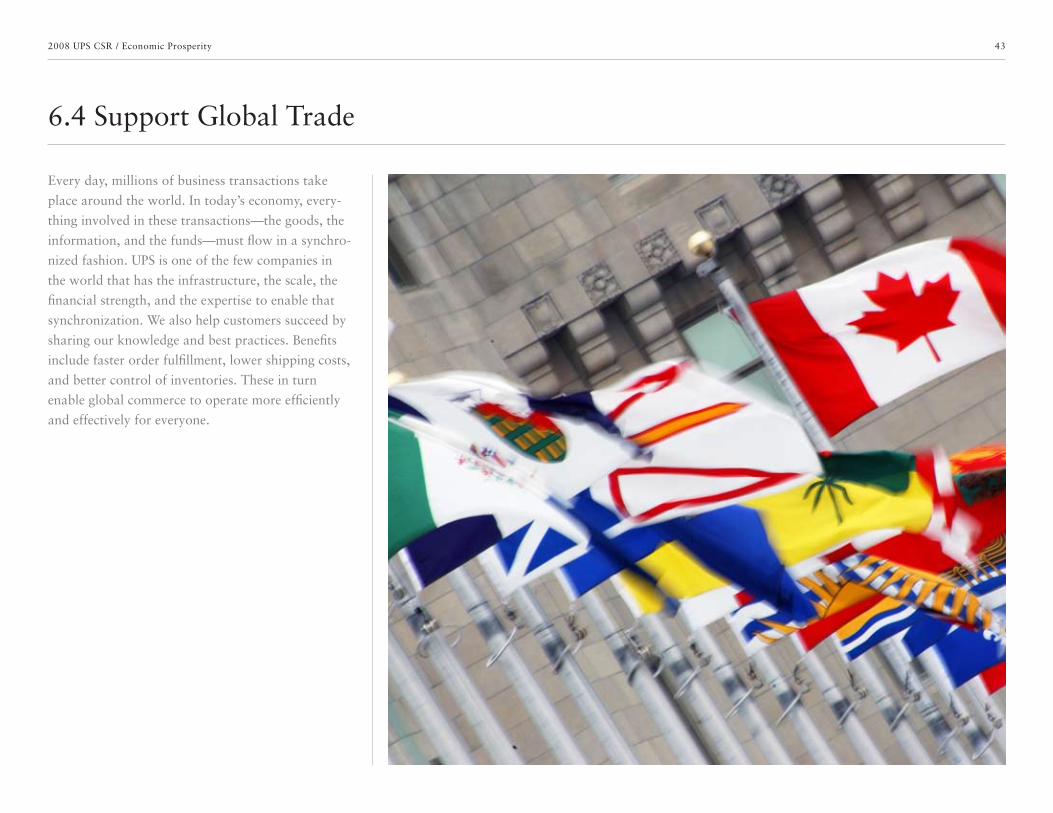
43
6.4 Support Global Trade
2008 UPS CSR / Economic Prosperity
Every day, millions of business transactions take
place around the world. In today’s economy, every-
thing involved in these transactions—the goods, the
information, and the funds—must flow in a synchro-
nized fashion. UPS is one of the few companies in
the world that has the infrastructure, the scale, the
financial strength, and the expertise to enable that
synchronization. We also help customers succeed by
sharing our knowledge and best practices. Benefits
include faster order fulfillment, lower shipping costs,
and better control of inventories. These in turn
enable global commerce to operate more efficiently
and effectively for everyone.
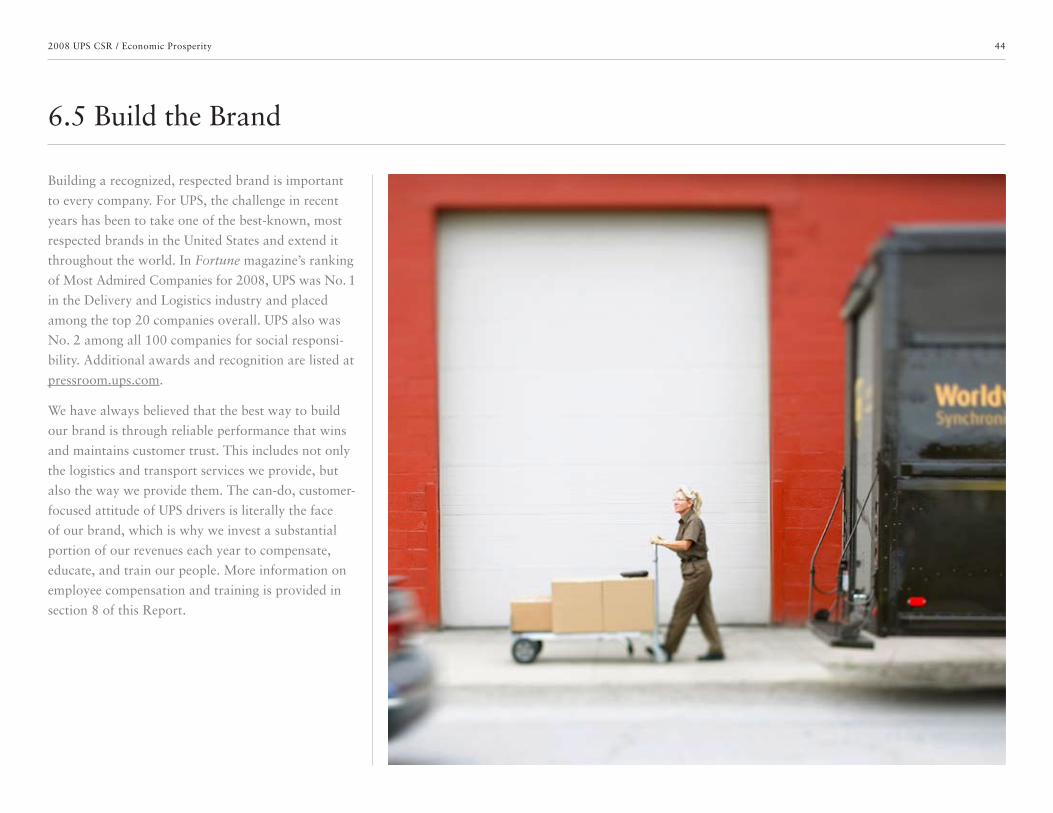
44
6.5 Build the Brand
2008 UPS CSR / Economic Prosperity
Building a recognized, respected brand is important
to every company. For UPS, the challenge in recent
years has been to take one of the best-known, most
respected brands in the United States and extend it
throughout the world. In Fortune magazine’s ranking
of Most Admired Companies for 2008, UPS was No. 1
in the Delivery and Logistics industry and placed
among the top 20 companies overall. UPS also was
No. 2 among all 100 companies for social responsi-
bility. Additional awards and recognition are listed at
pressroom.ups.com.
We have always believed that the best way to build
our brand is through reliable performance that wins
and maintains customer trust. This includes not only
the logistics and transport services we provide, but
also the way we provide them. The can-do, customer-
focused attitude of UPS drivers is literally the face
of our brand, which is why we invest a substantial
portion of our revenues each year to compensate,
educate, and train our people. More information on
employee compensation and training is provided in
section 8 of this Report.
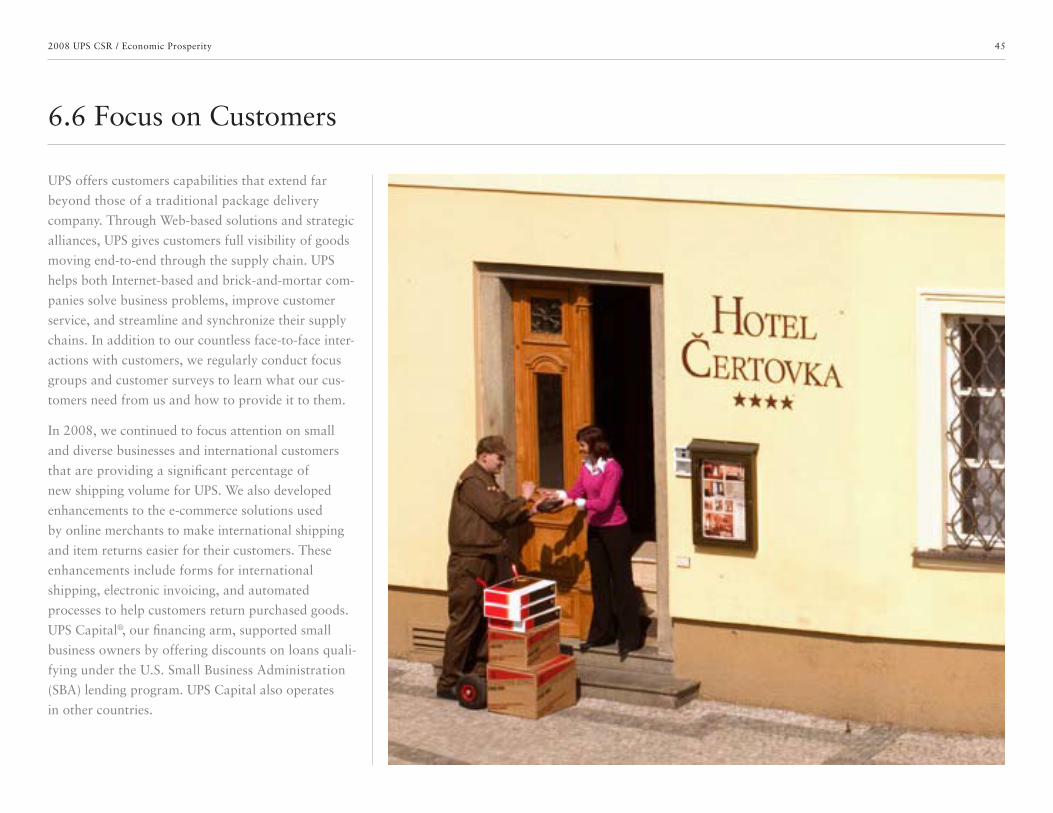
45
6.6 Focus on Customers
2008 UPS CSR / Economic Prosperity
UPS offers customers capabilities that extend far
beyond those of a traditional package delivery
company. Through Web-based solutions and strategic
alliances, UPS gives customers full visibility of goods
moving end-to-end through the supply chain. UPS
helps both Internet-based and brick-and-mortar com-
panies solve business problems, improve customer
service, and streamline and synchronize their supply
chains. In addition to our countless face-to-face inter-
actions with customers, we regularly conduct focus
groups and customer surveys to learn what our cus-
tomers need from us and how to provide it to them.
In 2008, we continued to focus attention on small
and diverse businesses and international customers
that are providing a significant percentage of
new shipping volume for UPS. We also developed
enhancements to the e-commerce solutions used
by online merchants to make international shipping
and item returns easier for their customers. These
enhancements include forms for international
shipping, electronic invoicing, and automated
processes to help customers return purchased goods.
UPS Capital®, our financing arm, supported small
business owners by offering discounts on loans quali-
fying under the U.S. Small Business Administration
(SBA) lending program. UPS Capital also operates
in other countries.
46
6.7 Provide Value-Added Solutions
2008 UPS CSR / Economic Prosperity
UPS is often the strongest third-party link between
a company and its customers. We therefore continue
to develop and implement value-added services
that help our customers provide better service to
their customers.
New value-added offerings in 2008 include services
for handling and managing the shipment of tem-
perature-sensitive medical items, including around-
the-clock intervention when necessary to utilize
refrigeration or replenish dry ice. The new suite of
time- and temperature-sensitive capabilities has been
developed for the pharmaceutical, biotech and medi-
cal device industries. Targeted particularly to global
clinical trials, UPS is facilitating the quick movement
of test medicines, specimens, supplies, testing kits and
accompanying documents to locations worldwide.

47
6.7 Provide Value-Added Solutions continued
2008 UPS CSR / Economic Prosperity
Most people store gardening tools in their backyard sheds. Diana Kingree housed a budding online retail business called Smartphone Experts. The 150-square-foot shed at her Florida home held containers full of cell phone accessories such as chargers, headsets and screen protectors. The items were imported from China, packaged in the shed and shipped out to customers around the world.
Smartphone Experts: Wired For Success
As orders poured in and Kingree, the company’s senior
vice president, needed more space for products, she
didn’t move; she simply got another shed. This caught
the attention of UPS driver Rich Strittmatter, who
introduced Kingree and CEO Marcus Adolfsson to UPS
account executive Rob Fleischer. He learned that
Smartphone Experts customers want the latest accesso-
ries as soon as they are available—and that the company
was struggling to keep up. Fleischer coordinated a
trailer dedicated to delivering inbound accessories each
morning, as well as a timely daily pick-up of outbound
shipments. Smartphone Experts’ on-time delivery rate
shot up to 99.2 percent.
UPS also showed Kingree how UPS WorldShip® shipping
software could work with her order software to print
a shipping label and invoice on one page, saving time
and minimizing errors. The next step was integrating
UPS OnLine® Tools into the Smartphone Experts website
so customers could choose shipping options. When
customers need a return or exchange, Smartphone
Experts uses UPS Returns® services to e-mail customers
a UPS return label they can print out and attach to an
envelope or box. Strittmatter even alerted Kingree about
a vacant office building near her home; she moved the
business there within a week.
Today SmartPhone Experts has a staff of 20 people
and ships an average of 5,000 packages a week.
Inc. magazine ranks the company as America’s fastest-
growing retailer. Kingree sums up her partnership with
UPS succinctly: “We do whatever it takes. So does UPS.”
Diana Kingree, Vice President of Smartphone Experts, surrounded by bins of smartphone accessories.
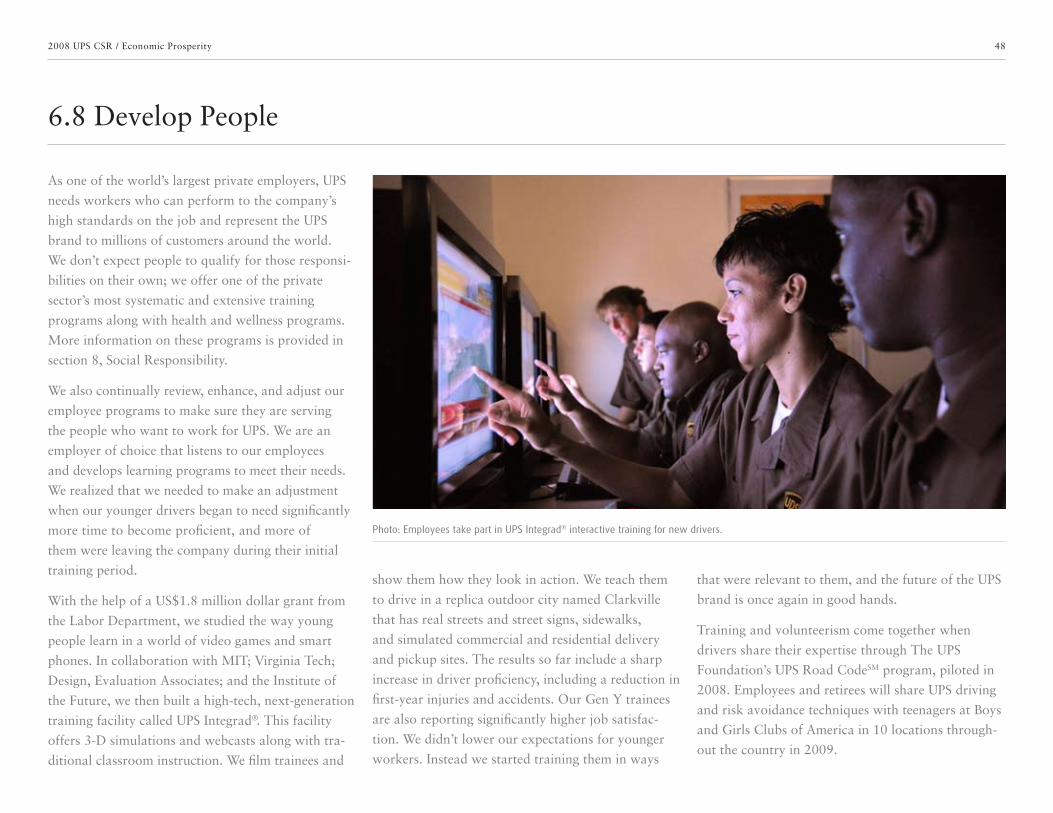
48
6.8 Develop People
2008 UPS CSR / Economic Prosperity
As one of the world’s largest private employers, UPS
needs workers who can perform to the company’s
high standards on the job and represent the UPS
brand to millions of customers around the world.
We don’t expect people to qualify for those responsi-
bilities on their own; we offer one of the private
sector’s most systematic and extensive training
programs along with health and wellness programs.
More information on these programs is provided in
section 8, Social Responsibility.
We also continually review, enhance, and adjust our
employee programs to make sure they are serving
the people who want to work for UPS. We are an
employer of choice that listens to our employees
and develops learning programs to meet their needs.
We realized that we needed to make an adjustment
when our younger drivers began to need significantly
more time to become proficient, and more of
them were leaving the company during their initial
training period.
With the help of a US$1.8 million dollar grant from
the Labor Department, we studied the way young
people learn in a world of video games and smart
phones. In collaboration with MIT; Virginia Tech;
Design, Evaluation Associates; and the Institute of
the Future, we then built a high-tech, next-generation
training facility called UPS Integrad®. This facility
offers 3-D simulations and webcasts along with tra-
ditional classroom instruction. We film trainees and
show them how they look in action. We teach them
to drive in a replica outdoor city named Clarkville
that has real streets and street signs, sidewalks,
and simulated commercial and residential delivery
and pickup sites. The results so far include a sharp
increase in driver proficiency, including a reduction in
first-year injuries and accidents. Our Gen Y trainees
are also reporting significantly higher job satisfac-
tion. We didn’t lower our expectations for younger
workers. Instead we started training them in ways
that were relevant to them, and the future of the UPS
brand is once again in good hands.
Training and volunteerism come together when
drivers share their expertise through The UPS
Foundation’s UPS Road CodeSM program, piloted in
2008. Employees and retirees will share UPS driving
and risk avoidance techniques with teenagers at Boys
and Girls Clubs of America in 10 locations through-
out the country in 2009.
Photo: Employees take part in UPS Integrad® interactive training for new drivers.
49
7.0 Environmental Stewardship
2008 UPS CSR
UPS has long pursued numerous, integrated strategies for reducing energy use and associated emissions. In 2008, we invested in new capabilities for capturing our carbon inventory, so we could match our logistical expertise with leadership in measuring and reporting. This section of the Report presents the results of this initiative, including Key Performance Indicators associated with fuel use, emissions, and our environmental management system. This section also highlights ways we increase efficiency in our network and conservation in our operations.
7.1 Commitment to Environmental Leadership
7.2 Reducing Fuel Use and Emissions
7.3 New Airline Emission Reduction Goal
7.4 Emissions Reduction Through Network Efficiency
7.5 Emissions Reduction by Employees and Customers
7.6 Conservation and Recycling
7.7 Environmental Management System
50
7.1 Commitment to Environmental Leadership
2008 UPS CSR / Environmental Stewardship
We conduct our business and operations with con-
sideration for their environmental impact, and seek
to lead our industry in reducing that impact. Because
our operations depend on vehicles and aircraft to a
considerable extent, we focus strongly on making
our transportation networks as efficient and environ-
mentally sound as possible. We apply this approach
to our facilities as well, particularly with regard to
conservation and recycling programs. We continually
evaluate both available and emerging technologies
and seek opportunities for using them to improve
our environmental performance. All our people are
responsible for considering the environmental impact
of their actions, participating in UPS conservation
efforts, and for complying with applicable environ-
mental laws and regulations.
In our previous sustainability disclosure cycle, we
reported on five-year environmental stewardship
goals set in 2002. (Our 2007 Corporate Sustainability
Report is online at sustainability.ups.com). While
we achieved many of those goals, we also saw
profound changes in our company and the external
marketplace during that five-year period. UPS as
a company became far larger and we dramatically
expanded our international presence and delivery
volume. Meanwhile, society as a whole experienced
a powerful awakening to the risks and realities of
climate change.
As a result of all these factors, we have brought
significant new resources to bear on environmental
stewardship for the current reporting cycle. As we
described in earlier sections of this Report, UPS:
• Created a Sustainability Steering Committee that
includes six members of the UPS Management
Committee and 11 other senior managers.
• Formalized and documented an enterprise-wide
sustainability strategy.
• Created a sustainability team dedicated to
collecting data, monitoring key performance
indicators and reporting strategic activity and
achievements.
• Invested in and began implementing state-of-
the-art software for capturing emissions on a
global enterprise basis.
• Expanded and revised our Key Performance
Indicators and other environmental metrics,
often to make them more comprehensive and
comparable.
• Initiated and substantially completed a process
of setting new environmental stewardship goals.
Our new goals and KPIs are based on our ability to
capture data on a worldwide basis, throughout our
operations, at a far higher level of accuracy. Even
so, our rapid international expansion has brought us
numerous facilities, supply chain relationships, and
other assets for which there is little or no prior infor-
mation available on energy use and emissions. Rather
than exclude these assets from our comprehensive
carbon inventories for 2007 and 2008, we have
applied a rigorous process of analysis, estimation and
calculation to develop meaningful data. The great
majority of our carbon inventory, however, is based
on actual data.
In this Report, we focus on data from 2005 to
the present because we believe that this period and
the data we can provide for it are most relevant
for us and our stakeholders. (Data for prior years
is available in previous Reports, which remain
available at sustainability.ups.com). In all charts
and graphs presented in this section of the Report,
we note any exclusions or material issues regarding
underlying data.
We conduct our business and operations with consideration for their environmental impact, and seek to lead our industry in reducing that impact.

51
7.1 Commitment to Environmental Leadership continued
2008 UPS CSR / Environmental Stewardship
UPS prides itself on its current, numerous sustainability
initiatives, and being a responsible corporate citizen.
Our long-term strategy is to optimize the processes that
consume non-renewable resources. We also recognize
that UPS is a critical component of our customers’ supply
chains, and that we have an obligation to help them
operate in a more environmentally sustainable way.
We continue to review all aspects of our business,
including: systems, procedures, equipment, and operating
processes. These efforts are being developed in tandem
with our plans for growth and profitability.
Our plan includes:
• Transportationnetworkoptimizationtominimize
the miles driven/flown.
• Investmentsinfuel-savingtechnologiestoreduce
our dependency on fossil-based fuels.
• Energyconservationviafacilitydesign,operational
practices, renewable energy, and retrofitting.
All these measures include both ongoing and
new initiatives for the entire enterprise. We utilize
technology-enabled, behavior-based, and engineering-
based approaches to address our environmental footprint.
Specific ongoing programs yielding both operational
and environmental results are:
• Alternativefuel/technologyfleetdeployment.
• Fuelandenergyconservationprograms.
• Airlineinitiativesonthegroundandintheair.
• Shipmentconsolidation.
• Employeeengagementprograms.
We will continue to improve our operating efficiency,
which is one of the most significant ways we reduce
our energy and fuel use. These actions are just a
partial list of our efforts to reduce our greenhouse
gas emissions and our dependency on fossil fuel. We
report our progress annually in our sustainability
report (sustainability.ups.com). Additional information is
on our community website (responsibility.ups.com).
In closing, we will be part of the solution to discover more
opportunities for improvement with our industry partners
and other thought leaders. It will take determination and
collaboration with government, commercial, and
non-government organizations to create a sustainable
transportation infrastructure that will minimize environ-
mental impact. Climate change is a critical issue that
affects the future viability and prosperity of our world.
D. Scott Davis
Chairman and CEO
As a global transportation company, UPS acknowledges that greenhouse gas emissions impact the climate and pose a serious challenge to the environment—and ultimately the global economy. It is the responsibility of all segments of society to improve energy efficiency and to reduce carbon emissions in the atmosphere.
Climate Change Statement
52
7.1 Commitment to Environmental Leadership continued
2008 UPS CSR / Environmental Stewardship
In 2008, UPS became the first shipping company to
join the U.S. Environmental Protection Agency’s Climate
Leaders® program. Climate Leaders is an industry/govern-
ment partnership that works with companies to develop
comprehensive climate change strategies. Partner
companies commit to reducing their impact on the global
environment by completing a corporate-wide inventory
of greenhouse gas emissions, setting aggressive reduction
goals and annually reporting their progress to the EPA.
We have been a long-time partner in many voluntary
programs sponsored by the EPA including the Green
Power Partnership, Waste Wise, and ENERGY STAR
program. UPS was a charter partner in EPA’s SmartWaySM
program for the freight industry, and received the
SmartWay Environmental Excellence Award in 2008
for leadership in conserving energy and lowering
greenhouse gas emissions.
UPS is the only transportation company among
S&P corporations to be selected for the 2008 Carbon
Disclosure Leadership Index (CDLI). More than 300
S&P companies responded to the Carbon Disclosure
Project’s 2008 request for information about climate
change risks and opportunities, emissions accounting,
performance and governance. Those selected were
judged on the basis of their transparency and depth of
information provided in the response. As the Carbon
Disclosure Project (CDP) says on its website, “companies
selected to appear in the CDLI demonstrate the highest
level of transparency and disclosure on climate change
within the S&P 500 index.” To view the entire CDLI
report: cdproject.net.
UPS has always believed that leadership is a matter of performance. Because climate change is such a serious challenge for all of society, we are engaging actively in external programs and partnerships in addition to pursuing our own climate change initiatives. In recognition that our environmental processes, procedures, and performance may be models or inspirations for others, we are eager to continue the broad public discussion of climate change and how to address it.
Climate Leadership

53
The single most important advance in our reporting
capability is completion of our first global CO2
inventories, for the years 2007 and 2008. UPS was
the first company in the package sector to conduct a
CO2 inventory, and we have done so every year since
2002. Our latest leadership initiatives are captur-
ing our CO2 inventory on an enterprise basis for
the entire world and, within that inventory, includ-
ing indirect emissions that come largely from our
transportation and service contractors rather than
our own operations. In other words, there is enough
detail in the rendering of our inventory to show that
it covers Scope 1, 2, and 3 emissions from all our
business segments worldwide.
In conducting and disclosing our inventory, we
use the internationally recognized Greenhouse Gas
Protocol developed jointly by the World Resources
Institute (WRI) and the World Business Council on
Sustainable Development (WBCSD). Currently, the
majority of our metrics are expressed in terms of CO2
emissions. The Greenhouse Gas Protocol includes
five other type of emissions, which can be expressed
in CO2 equivalents (CO2-e). While CO2-e reporting
is significantly more data- and calculation-intensive
than CO2 reporting, it results in a more detailed
and actionable inventory. Even though we now
report absolute emissions from our U.S. Package
Operations on a CO2-e basis, we intend to broaden
our CO2-e reporting in the future as we gather and
analyze more data from international operations.
According to the Greenhouse Gas Protocol, our
Scope 1 emissions are those produced by our own
vehicles and aircraft; they are therefore considered
“direct.” Scope 2 emissions come from the electric-
ity that is used in a company’s facilities but produced
by others (usually electrical utilities); these emissions
are therefore considered indirect. Scope 3 emissions
are also indirect, but harder to capture because many
of them result from a company’s supply chain. These
include emissions related to production of purchased
materials as well as those from outsourced activities.
Given that most companies utilize resources that
generate Scope 3 emissions in order to operate, only
an inventory that includes Scope 3 data truly cap-
tures an enterprise-wide CO2 impact. Yet a 2008
survey by the consulting firm Accenture, as reported
in Logistics Management magazine, showed that
only 10 percent of the companies surveyed actively
captured emissions from their supply chains. In
7.2 Reducing Fuel Use and Emissions
2008 UPS CSR / Environmental Stewardship
Note on KPI Goals and Calculations
Given the number of vehicles, locations, countries, and authorized service provider relationships involved in our global enterprise CO2 inventory, we have been unable to collect direct fuel usage data in all cases. To complete the inventory, we developed estimates and calculations based on the best available information and conservative assumptions. Our objective is to provide the most complete picture of our global CO2 inventory that we can, even as we continue to advance our data-gathering and analysis capabilities We are also continuing to develop goals based on these new capabilities.
contrast, our Scope 3 inventory is both wide-ranging
and detailed, including data and calculations for
the shipping lines we use in our freight operations,
subcontractors included within our logistics network,
employee business travel, and more.
GLOBAL EMISSIONS
Our global CO2 inventory was smaller in 2008
compared to 2007. This was due in large part to the
global economic downturn, which resulted in volume
UPS was the first company in the package sector to conduct a CO2 inventory, and we have done so every year since 2002.
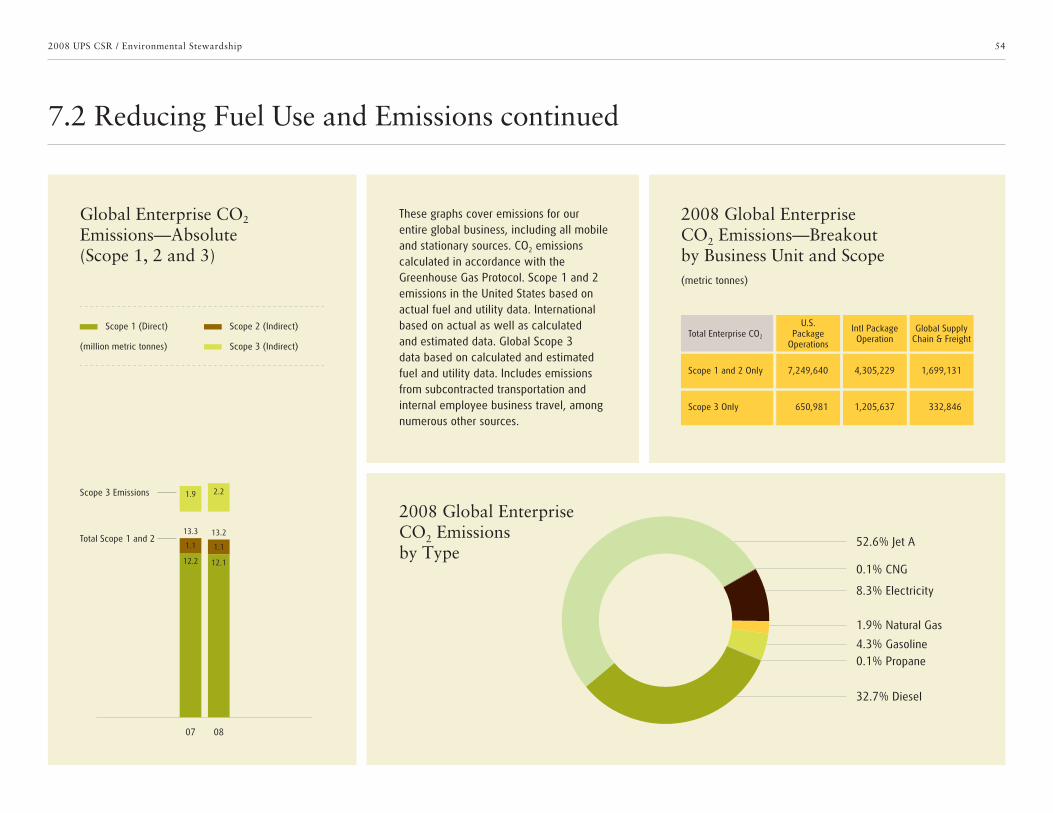
54
7.2 Reducing Fuel Use and Emissions continued
2008 UPS CSR / Environmental Stewardship
Global Enterprise CO2 Emissions—Absolute (Scope 1, 2 and 3)
2008 Global Enterprise CO2 Emissions—Breakout by Business Unit and Scope
These graphs cover emissions for our entire global business, including all mobile and stationary sources. CO2 emissions calculated in accordance with the Greenhouse Gas Protocol. Scope 1 and 2 emissions in the United States based on actual fuel and utility data. International based on actual as well as calculated and estimated data. Global Scope 3 data based on calculated and estimated fuel and utility data. Includes emissions from subcontracted transportation and internal employee business travel, among numerous other sources.
Scope 2 (Indirect)
Scope 3 (Indirect)
Scope 3 Emissions
Total Scope 1 and 2
(million metric tonnes)
Scope 1 (Direct)
07 08
2008 Global Enterprise CO2 Emissions by Type
0.1% CNG
8.3% Electricity
1.9% Natural Gas
0.1% Propane4.3% Gasoline
32.7% Diesel
52.6% Jet A
Total Enterprise CO2
Scope 1 and 2 Only
Scope 3 Only
4,305,229 1,699,1317,249,640
1,205,637 332,846650,981
U.S. Package
Operations
Intl PackageOperation
Global Supply Chain & Freight
12.112.2
1.1
13.3
1.1
13.2
1.9 2.2
(metric tonnes)

55
7.2 Reducing Fuel Use and Emissions continued
2008 UPS CSR / Environmental Stewardship
declines, changes in product mix, and lower package
weight for UPS. Our initial inventories showed varia-
tion in existing processes for capturing fuel and
emissions data, particularly in international locations
and recently acquired companies. We are addressing
these variations at the process and personnel level
around the world, and expect to capture more actual
data in more locations in future inventories.
U.S. EMISSIONS
In 2008, we reduced energy consumption and
emissions from our U.S. Package Operations below
the levels in each of the previous three years, as
normalized by revenue. U.S. Package Operations is
our largest business segment by revenue and delivery
volume, and includes UPS Airlines emissions for the
United States. We have reported on this segment
extensively in prior Reports, and we continue to
include its energy and emissions efficiency among our
Key Performance Indicators. In 2008, we reduced
absolute energy consumption and emissions in our
U.S. Package Operations compared to the levels in
each of the previous two years. Within the 2008
improvement just mentioned, we reduced consump-
tion from both direct and indirect sources. In com-
parison to 2007 in particular, our focus on network
efficiency enabled us to reduce energy consump-
tion and emissions by a greater percentage than the
decline in package volume year-over-year.
The Greenhouse Gas Protocol includes six sources of global warming emissions, of which CO2 is by far the most prominent. The other five greenhouse gas sources can be expressed in CO2 equivalents (“CO2-e”) of global warming potential. While CO2-e reporting is more data- and calculation-intensive, it results in a more detailed and actionable carbon inventory. Results provided are derived from actual fuel and utility data. In previous Reports, we divided energy consumption and emissions between mobile and stationary sources. Beginning with this Report we now measure “direct” and “indirect” energy consumption. Direct energy consumption includes all mobile sources of energy (gasoline, diesel, Jet A, compressed natural gas) and stationary sources of energy (natural gas, propane and heating oil). Indirect energy consumption results from electricity consumption in UPS facilities.
Energy Consumption— Absolute, Direct vs. Indirect, U.S. Package Operations
Direct Energy Consumption (million gigajoules)
Indirect Energy Consumption (million gigajoules)
90.05
93.69
95.53
93.264.35
4.52
4.53
4.4194.40
98.21
100.06
97.67
05 06 07 08
CO2-e Emissions—Absolute, Direct vs. Indirect, U.S. Package Operations (Scope 1 and 2)
Direct CO2e Emissions (million metric tonnes)
Indirect CO2e Emissions (million metric tonnes)
6.306.59 6.72 6.56
0.730.76 0.76 0.74
7.037.35 7.48
7.30
05 06 07 08
CO2-e
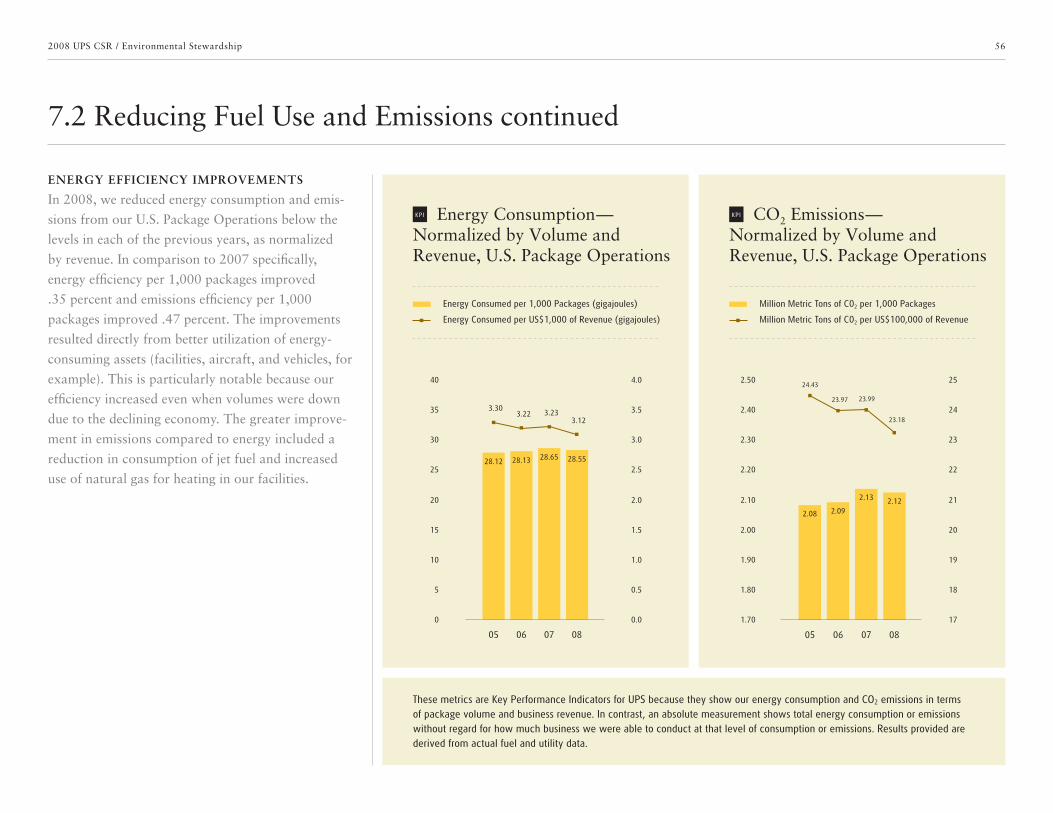
56
7.2 Reducing Fuel Use and Emissions continued
2008 UPS CSR / Environmental Stewardship
ENERGY EFFICIENCY IMPROVEMENTS
In 2008, we reduced energy consumption and emis-
sions from our U.S. Package Operations below the
levels in each of the previous years, as normalized
by revenue. In comparison to 2007 specifically,
energy efficiency per 1,000 packages improved
.35 percent and emissions efficiency per 1,000
packages improved .47 percent. The improvements
resulted directly from better utilization of energy-
consuming assets (facilities, aircraft, and vehicles, for
example). This is particularly notable because our
efficiency increased even when volumes were down
due to the declining economy. The greater improve-
ment in emissions compared to energy included a
reduction in consumption of jet fuel and increased
use of natural gas for heating in our facilities.
Energy Consumed per 1,000 Packages (gigajoules) Million Metric Tons of C02 per 1,000 Packages
Energy Consumed per US$1,000 of Revenue (gigajoules) Million Metric Tons of C02 per US$100,000 of Revenue
Energy Consumption— Normalized by Volume and Revenue, U.S. Package Operations
CO2 Emissions— Normalized by Volume and Revenue, U.S. Package Operations
These metrics are Key Performance Indicators for UPS because they show our energy consumption and CO2 emissions in terms of package volume and business revenue. In contrast, an absolute measurement shows total energy consumption or emissions without regard for how much business we were able to conduct at that level of consumption or emissions. Results provided are derived from actual fuel and utility data.
KPI KPI
1.70 17
2.20 22
1.80 18
2.30 23
2.00 20
2.50 25
1.90 19
2.40 24
2.10 21
05 06 07 08
23.97
24.43
23.99
23.18
2.08 2.09
2.13 2.12
0 0.0
25 2.5
5 0.5
30 3.0
15 1.5
40 4.0
10 1.0
35 3.5
20 2.0
05 06 07 08
3.223.30
3.233.12
28.12 28.13 28.65 28.55
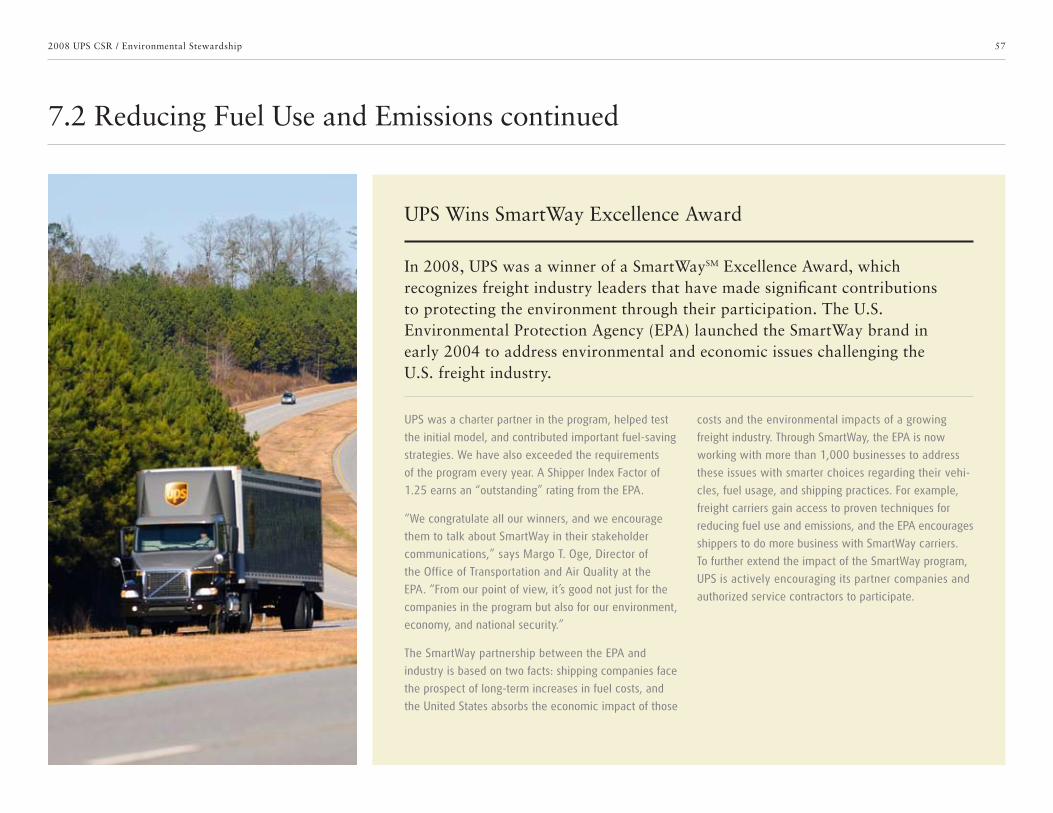
57
7.2 Reducing Fuel Use and Emissions continued
2008 UPS CSR / Environmental Stewardship
In 2008, UPS was a winner of a SmartWaySM Excellence Award, which recognizes freight industry leaders that have made significant contributions to protecting the environment through their participation. The U.S. Environmental Protection Agency (EPA) launched the SmartWay brand in early 2004 to address environmental and economic issues challenging the U.S. freight industry.
UPS Wins SmartWay Excellence Award
UPS was a charter partner in the program, helped test
the initial model, and contributed important fuel-saving
strategies. We have also exceeded the requirements
of the program every year. A Shipper Index Factor of
1.25 earns an “outstanding” rating from the EPA.
“We congratulate all our winners, and we encourage
them to talk about SmartWay in their stakeholder
communications,” says Margo T. Oge, Director of
the Office of Transportation and Air Quality at the
EPA. “From our point of view, it’s good not just for the
companies in the program but also for our environment,
economy, and national security.”
The SmartWay partnership between the EPA and
industry is based on two facts: shipping companies face
the prospect of long-term increases in fuel costs, and
the United States absorbs the economic impact of those
costs and the environmental impacts of a growing
freight industry. Through SmartWay, the EPA is now
working with more than 1,000 businesses to address
these issues with smarter choices regarding their vehi-
cles, fuel usage, and shipping practices. For example,
freight carriers gain access to proven techniques for
reducing fuel use and emissions, and the EPA encourages
shippers to do more business with SmartWay carriers.
To further extend the impact of the SmartWay program,
UPS is actively encouraging its partner companies and
authorized service contractors to participate.
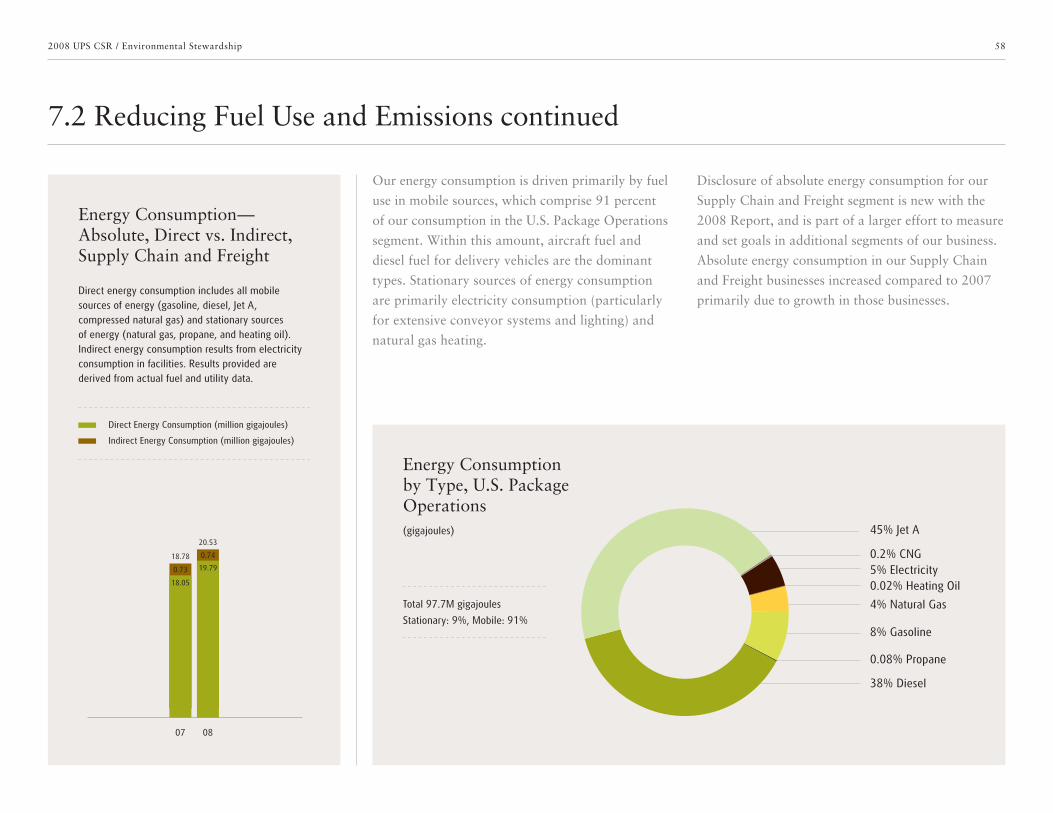
58
7.2 Reducing Fuel Use and Emissions continued
2008 UPS CSR / Environmental Stewardship
Our energy consumption is driven primarily by fuel
use in mobile sources, which comprise 91 percent
of our consumption in the U.S. Package Operations
segment. Within this amount, aircraft fuel and
diesel fuel for delivery vehicles are the dominant
types. Stationary sources of energy consumption
are primarily electricity consumption (particularly
for extensive conveyor systems and lighting) and
natural gas heating.
Disclosure of absolute energy consumption for our
Supply Chain and Freight segment is new with the
2008 Report, and is part of a larger effort to measure
and set goals in additional segments of our business.
Absolute energy consumption in our Supply Chain
and Freight businesses increased compared to 2007
primarily due to growth in those businesses.
Energy Consumption by Type, U.S. Package Operations
0.2% CNG5% Electricity
4% Natural Gas
0.02% Heating Oil
0.08% Propane
8% Gasoline
38% Diesel
45% Jet A
Energy Consumption— Absolute, Direct vs. Indirect, Supply Chain and Freight
Direct energy consumption includes all mobile sources of energy (gasoline, diesel, Jet A, compressed natural gas) and stationary sources of energy (natural gas, propane, and heating oil). Indirect energy consumption results from electricity consumption in facilities. Results provided are derived from actual fuel and utility data.
18.05
0.73
18.78
19.79
0.74
20.53
07 08
Direct Energy Consumption (million gigajoules)
Indirect Energy Consumption (million gigajoules)
(gigajoules)
Total 97.7M gigajoules
Stationary: 9%, Mobile: 91%
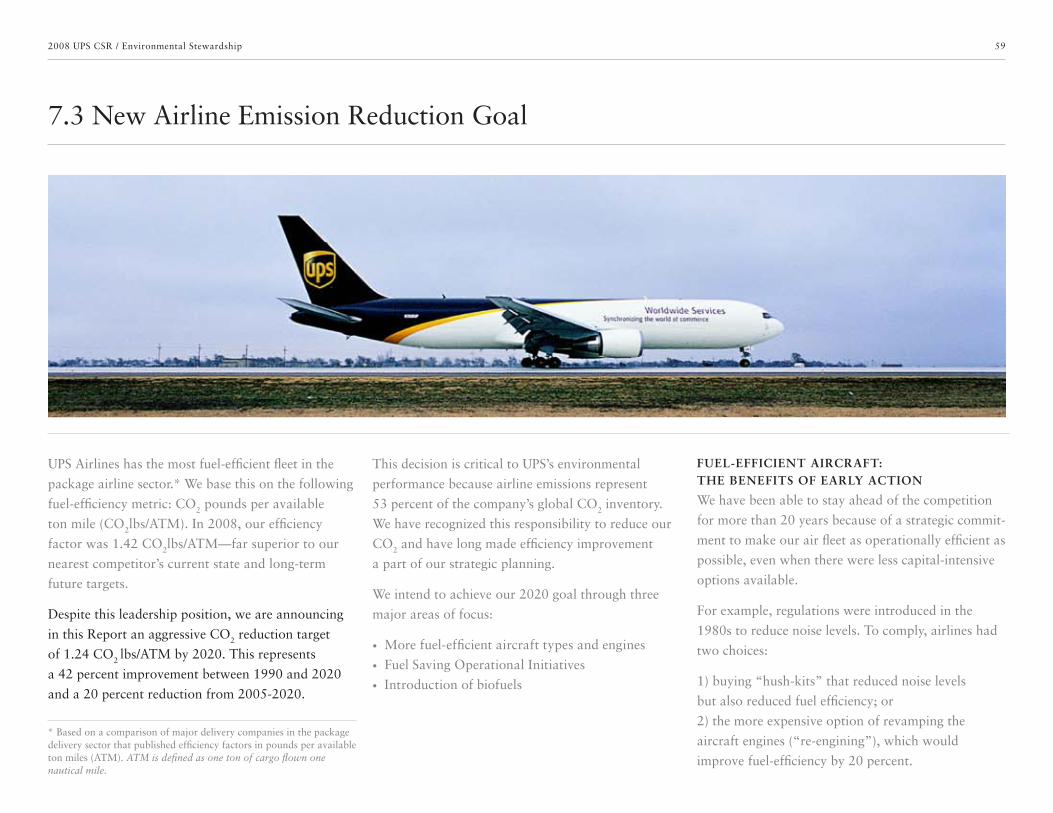
59
7.3 New Airline Emission Reduction Goal
2008 UPS CSR / Environmental Stewardship
UPS Airlines has the most fuel-efficient fleet in the
package airline sector.* We base this on the following
fuel-efficiency metric: CO2 pounds per available
ton mile (CO2lbs/ATM). In 2008, our efficiency
factor was 1.42 CO2lbs/ATM—far superior to our
nearest competitor’s current state and long-term
future targets.
Despite this leadership position, we are announcing
in this Report an aggressive CO2 reduction target
of 1.24 CO2 lbs/ATM by 2020. This represents
a 42 percent improvement between 1990 and 2020
and a 20 percent reduction from 2005-2020.
This decision is critical to UPS’s environmental
performance because airline emissions represent
53 percent of the company’s global CO2 inventory.
We have recognized this responsibility to reduce our
CO2 and have long made efficiency improvement
a part of our strategic planning.
We intend to achieve our 2020 goal through three
major areas of focus:
• More fuel-efficient aircraft types and engines
• Fuel Saving Operational Initiatives
• Introduction of biofuels
FUEL-EFFICIENT AIRCRAFT: THE BENEFITS OF EARLY ACTION
We have been able to stay ahead of the competition
for more than 20 years because of a strategic commit-
ment to make our air fleet as operationally efficient as
possible, even when there were less capital-intensive
options available.
For example, regulations were introduced in the
1980s to reduce noise levels. To comply, airlines had
two choices:
1) buying “hush-kits” that reduced noise levels
but also reduced fuel efficiency; or
2) the more expensive option of revamping the
aircraft engines (“re-engining”), which would
improve fuel-efficiency by 20 percent.
* Based on a comparison of major delivery companies in the package delivery sector that published efficiency factors in pounds per available ton miles (ATM). ATM is defined as one ton of cargo flown one nautical mile.

602008 UPS CSR / Environmental Stewardship
Unlike competitors, UPS chose the latter for its
727-100 fleet, a prevalent type of our aircraft at the
time. Between 1985 and 2008, that decision saved
more than 50 million gallons of fuel and more than
479,000 metric tonnes of CO2 emissions over the
life of those 51 aircraft.
All DC-8 aircraft purchased in the 1980s and 1990s
also were re-engined or equipped with more efficient
engines.
In addition, we made the strategic decision in the
1980s to purchase 757s (an aircraft that offered
30 percent better fuel efficiency) instead of 727s.
Meanwhile, our competitors continued to buy 727s.
Between 1995-2008 alone, UPS’s early action saved
more than one billion gallons of fuel and 11 million
metric tonnes of CO2.
We have been able to stay ahead of the competition for more than 20 years because of a strategic commitment to make our air fleet as operationally efficient as possible.
CO2 Emissions per Available Ton Mile—UPS Airlines
This metric is a new Key Performance Indicator (KPI) for UPS because UPS Airlines is our single largest source of emissions. Our goal is to reduce our aircraft emissions to 1.24 pounds of CO2 emitted per available ton mile (CO2lbs/ATM) by 2020. Distance is measured in nautical miles. Please note that this metric is currently strongly correlated with our KPI “Aviation Gallons Burned per 100 Available Ton Miles” later in this section. We track both KPIs because future developments, such as the introduction of lower-carbon jet fuels, may reduce their correlation.
1990 to 2020 = 42% reduction
2005 to 2020 = 20% reduction
1990 to 2005 = 28% reduction
2.13
1.2
1.0
1.4
1.6
1.8
2.0
2.2
1990 2005 2008 2020
1.24
1.42
1.54
KPI
7.3 New Airline Emission Reduction Goal continued
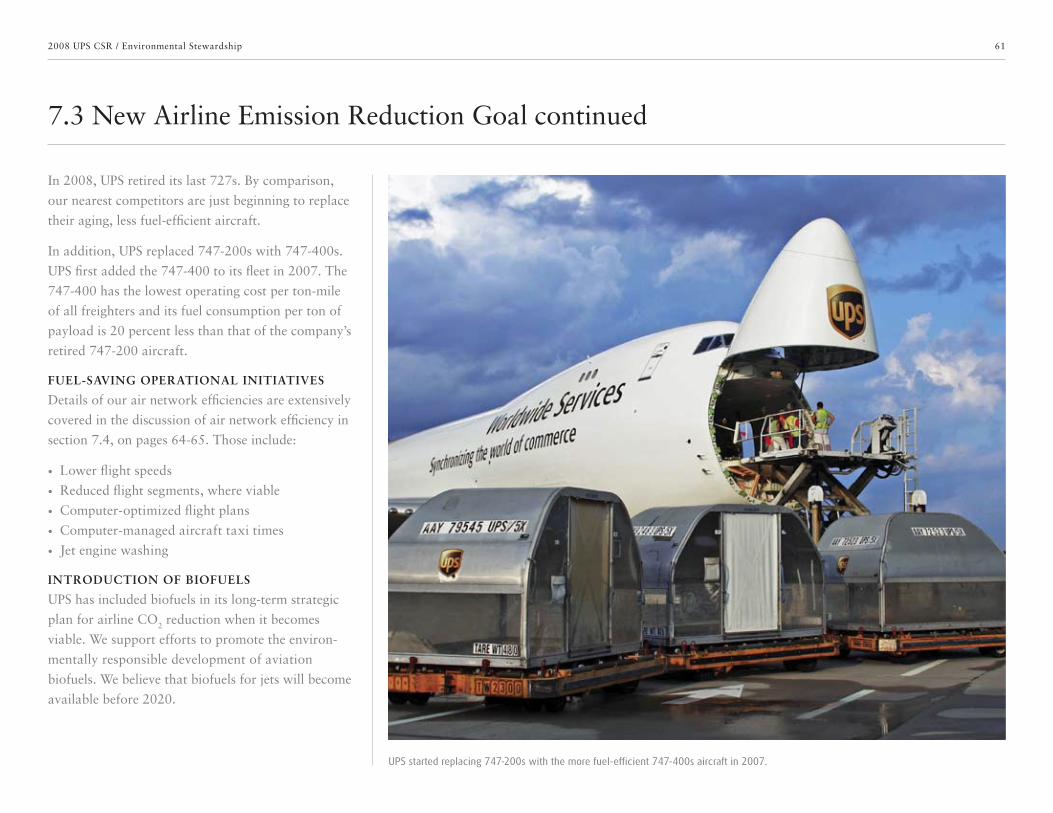
612008 UPS CSR / Environmental Stewardship
In 2008, UPS retired its last 727s. By comparison,
our nearest competitors are just beginning to replace
their aging, less fuel-efficient aircraft.
In addition, UPS replaced 747-200s with 747-400s.
UPS first added the 747-400 to its fleet in 2007. The
747-400 has the lowest operating cost per ton-mile
of all freighters and its fuel consumption per ton of
payload is 20 percent less than that of the company’s
retired 747-200 aircraft.
FUEL-SAVING OPERATIONAL INITIATIVES
Details of our air network efficiencies are extensively
covered in the discussion of air network efficiency in
section 7.4, on pages 64-65. Those include:
• Lower flight speeds
• Reduced flight segments, where viable
• Computer-optimized flight plans
• Computer-managed aircraft taxi times
• Jet engine washing
INTRODUCTION OF BIOFUELS
UPS has included biofuels in its long-term strategic
plan for airline CO2 reduction when it becomes
viable. We support efforts to promote the environ-
mentally responsible development of aviation
biofuels. We believe that biofuels for jets will become
available before 2020.
UPS started replacing 747-200s with the more fuel-efficient 747-400s aircraft in 2007.
7.3 New Airline Emission Reduction Goal continued

62
7.4 Emissions Reduction Through Network Efficiency
2008 UPS CSR / Environmental Stewardship
In 2008, shifts from ground to rail and air to ground together prevented absolute emissions of 3 million metric tonnes of CO2.
One of the cornerstones of our emissions reduction
program is to use the most energy-efficient mode of
transportation available while still meeting the deliv-
ery time requirements of our customers. By using our
intermodal network, we reduce our carbon impact by
moving shipments from air to ground and ground to
rail when possible. Tractor trailer transportation is
four times more energy-intensive then rail, and
aircraft are six to eight times more energy-intensive
than tractor trailers. In 2008, shifts from ground to
rail and air to ground together prevented absolute
emissions of 3 million metric tonnes of CO2.
Our extensive use of rail in the United States and the
extraordinary network and intermodal-shift capabili-
ties are complemented by:
• A modern, fuel-efficient and noise compliant
airline (see p. 59)
• Uniquely customized vehicle and air fleets,
which improve our overall load optimization
• An operating model that gives us the ability
to deliver and pick up all express and ground
packages with one vehicle and one driver
• State-of-the-art Package Flow Technology
that gives us unprecedented sorting, loading,
and routing capabilities, and
• Highly skilled employees, who are members of
the International Brotherhood of Teamsters, for
delivery services throughout the United States.
GROUND NETWORK EFFICIENCY
While 2008 saw negative economic growth com-
pared to 2007, the long-term trend in our business
is toward an increased proportion of residential
deliveries due in part to internet commerce. This in
turn can impact miles driven and fuel per ground
package. Nevertheless, we have remained constant in
the gallons of fuel per ground package in each of the
past four years. As in 2007, we continued to increase
energy and emissions efficiency. Ground network
fuel efficiency is driven by consumption of fuels
relative to package volume, through the application
of efficient routing technology, utilization of rail, our
alternative fuel/technology vehicle fleet, our growing
use of telematics, behavior-based fuel conservation,
and other initiatives.
ROUTING TECHNOLOGY
UPS has been using technology to improve efficiency
for a long time. In recent years we have refined
and integrated a number of hardware and software
tools. One example of this is Package Flow Technol-
ogy. In 2008, Package Flow Technology enabled us
to reach our cumulative goal, set in 2003, of elimi-
nating 100 million miles driven. Our routing tech-
nology reduces fuel consumption and emissions by
optimizing the processes of:
• Allocating our pick-ups and deliveries to the most
efficient number of vehicles each day at each facility,
thus keeping vehicles off the road wherever possible
Reduced Emissions
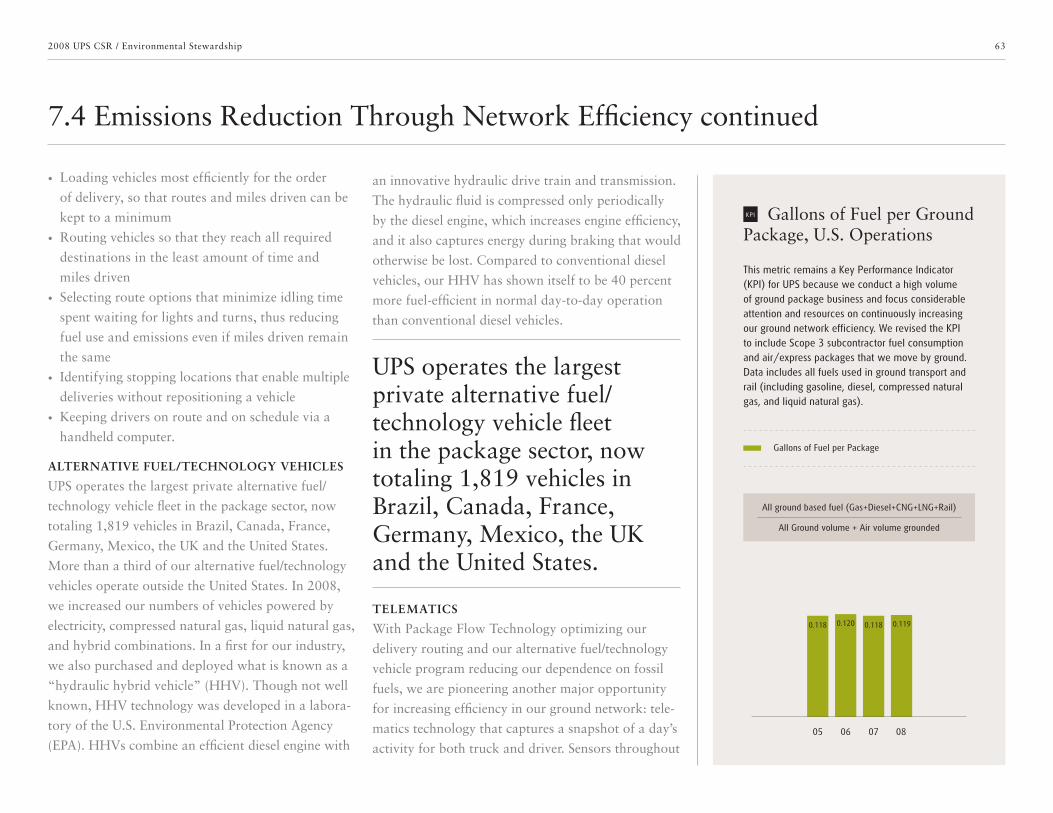
63
7.4 Emissions Reduction Through Network Efficiency continued
2008 UPS CSR / Environmental Stewardship
• Loading vehicles most efficiently for the order
of delivery, so that routes and miles driven can be
kept to a minimum
• Routing vehicles so that they reach all required
destinations in the least amount of time and
miles driven
• Selecting route options that minimize idling time
spent waiting for lights and turns, thus reducing
fuel use and emissions even if miles driven remain
the same
• Identifying stopping locations that enable multiple
deliveries without repositioning a vehicle
• Keeping drivers on route and on schedule via a
handheld computer.
ALTERNATIVE FUEL/TECHNOLOGY VEHICLES
UPS operates the largest private alternative fuel/
technology vehicle fleet in the package sector, now
totaling 1,819 vehicles in Brazil, Canada, France,
Germany, Mexico, the UK and the United States.
More than a third of our alternative fuel/technology
vehicles operate outside the United States. In 2008,
we increased our numbers of vehicles powered by
electricity, compressed natural gas, liquid natural gas,
and hybrid combinations. In a first for our industry,
we also purchased and deployed what is known as a
“hydraulic hybrid vehicle” (HHV). Though not well
known, HHV technology was developed in a labora-
tory of the U.S. Environmental Protection Agency
(EPA). HHVs combine an efficient diesel engine with
an innovative hydraulic drive train and transmission.
The hydraulic fluid is compressed only periodically
by the diesel engine, which increases engine efficiency,
and it also captures energy during braking that would
otherwise be lost. Compared to conventional diesel
vehicles, our HHV has shown itself to be 40 percent
more fuel-efficient in normal day-to-day operation
than conventional diesel vehicles.
TELEMATICS
With Package Flow Technology optimizing our
delivery routing and our alternative fuel/technology
vehicle program reducing our dependence on fossil
fuels, we are pioneering another major opportunity
for increasing efficiency in our ground network: tele-
matics technology that captures a snapshot of a day’s
activity for both truck and driver. Sensors throughout
UPS operates the largest private alternative fuel/technology vehicle fleet in the package sector, now totaling 1,819 vehicles in Brazil, Canada, France, Germany, Mexico, the UK and the United States.
Gallons of Fuel per Ground Package, U.S. Operations
This metric remains a Key Performance Indicator (KPI) for UPS because we conduct a high volume of ground package business and focus considerable attention and resources on continuously increasing our ground network efficiency. We revised the KPI to include Scope 3 subcontractor fuel consumption and air/express packages that we move by ground. Data includes all fuels used in ground transport and rail (including gasoline, diesel, compressed natural gas, and liquid natural gas).
05 06 07 08
All ground based fuel (Gas+Diesel+CNG+LNG+Rail)
All Ground volume + Air volume grounded
Gallons of Fuel per Package
0.118 0.120 0.118 0.119
KPI
64
7.4 Emissions Reduction Through Network Efficiency continued
2008 UPS CSR / Environmental Stewardship
a delivery vehicle collect data on acceleration, brak-
ing, turns, idle time, seat belt use, and other aspects
of vehicle and driver performance; and the data flows
wirelessly to our operating centers. We analyze the
data in multiple ways, seeking a range of outcomes.
One immediate benefit we discovered was greater
ability to reduce idling time (when a vehicle is burn-
ing fuel and producing emissions without a produc-
tive result). Current tests showed that drivers can
reduce idling time by up to 15 minutes per driver per
day. Projecting this reduction across our entire aver-
age daily delivery fleet would potentially avoid gener-
ating 15,000 metric tonnes of CO2 per year. Another
benefit is increasing safety by eliminating actions or
circumstances that might lead to injury. For example,
we can identify roads or stretches of road with a
high percentage of harsh braking events, and advise
drivers to operate in those areas with extra caution
and greater following distances. We can also identify
driver behaviors that may require additional training,
such as rapid accelerations, exceeding speed limits,
or driving without fastening a seat belt.
Yet another advantage we have found with telemat-
ics is higher precision in vehicle maintenance. In the
past, we have conducted an extensive program of
proactive preventative maintenance. We are proud
of this program, which extends the lives of our
vehicles, maintains their fuel and emissions efficiency,
minimizes spills or leaks of environmentally sensitive
fluids, and keeps our drivers safe. Yet with telematics
we now see significant opportunities to enhance the
program further.
One of those opportunities is to schedule our proac-
tive maintenance based on actual operating history.
For example, we have historically replaced the start-
ers for vehicle engines roughly every 24 months,
regardless of how the truck was used. Now we can
differentiate between trucks driven on routes with as
few as 30 starts per day and trucks driven on routes
with as many as 150 starts per day. We will still plan
to replace the starters in our trucks before they fail—
and we will be able to do so when it’s actually neces-
sary for individual trucks. This increase in program
efficiency will further increase the financial and envi-
ronmental benefits of preventative maintenance.
In 2008, we equipped more than 8,000 vehicles with
telematics kits following successful tests in 2007. We
expect to continue rolling out the telematics program
internationally in the years ahead.
AIR NETWORK EFFICIENCY
UPS has pioneered numerous strategies and tech-
niques for reducing aircraft fuel consumption
and associated emissions. Efficiency increases at
UPS Airlines include:
• Lower flight speeds: In the United States, we are
slowing down 30 of our cross-country flights
each week. By slowing these flights by only a few
minutes, we can still keep service commitments to
customers, operate safely, and save several million
dollars in fuel costs.
• Computer-optimized flight plans: We computer-
optimize our flight plans to minimize fuel burn
based on destination, winds aloft, and other factors.
Savings total several million dollars per year.
• Computer-managed aircraft taxi times: UPS
has begun using a computer system, called the
Surface Management System, to track the ground
move ments of our aircraft while on the airfield.
This helps us minimize taxi times and long
lines of aircraft waiting to take off, saving us
as much as 250,000 gallons of fuel per year.
In addition, we taxi our aircraft on one engine
as often as safety allows.
• Fuel-efficient towing tugs: UPS is working with
the Environmental Protection Agency on a
project to put more fuel-efficient engines in
92 diesel tugs at UPS Worldport®.
UPS has pioneered numerous strategies and techniques for reducing aircraft fuel consumption and associated emissions.

65
7.4 Emissions Reduction Through Network Efficiency continued
2008 UPS CSR / Environmental Stewardship
• Electric dockers at Worldport: To power our
parked aircraft at UPS Worldport®, we are using
electricity rather than fuel-powered auxiliary
power units or ground power units. We are
also loading and unloading those aircraft with
electrically powered equipment rather than
traditional diesel-powered machinery.
• Biodiesel in ground support equipment: We
are working with the Commonwealth of Kentucky
on an experiment to power some of our ground
support equipment with a 5 percent blend
biodiesel fuel.
• Environmentally friendly paint: UPS has recently
begun using a new aircraft paint process that
eliminates many of the potentially hazardous
chemicals involved in preparing an aircraft for
painting. It also eliminates the typical need
for a third coat of paint weighing approximately
300 pounds per plane. Reducing plane weight
helps minimize fuel burn.
• Cleaner engines: We are washing engines on our
767 and MD-11 fleets to extend operating life and
minimize fuel burn.
AVIATION GALLONS BURNED
Our goal is to reduce aviation fuel burned per
100 ATM (gals/100ATM) to 6.27 gallons by 2020.
Note that this goal is aligned with our goal for reduc-
ing aircraft emissions (CO2 lbs/ATM) as described
above in section 7.3. Achieving the goal represents
Aviation Gallons Burned per 100 Available Ton Miles—UPS Airlines
This metric is a Key Performance Indicator (KPI) for UPS because aviation fuel is our single largest source of energy consumption. Our goal is to reduce our aviation fuel use to 6.27 gallons per 100 available ton miles (ATM) by 2020. Distance measured in nautical miles. Please note that this metric is currently strongly correlated with our KPI “CO2 Emissions per Available Ton Mile—UPS Airlines” earlier in this section. We track both KPIs because future developments, such as the introduction of lower-carbon jet fuels, may reduce their correlation.
1990 to 2020 = 38%
2005 to 2020 = 14%
10.12
1990
5
6
7
8
9
10
11
2005 2008 2020
6.27
7.32
6.73
KPI
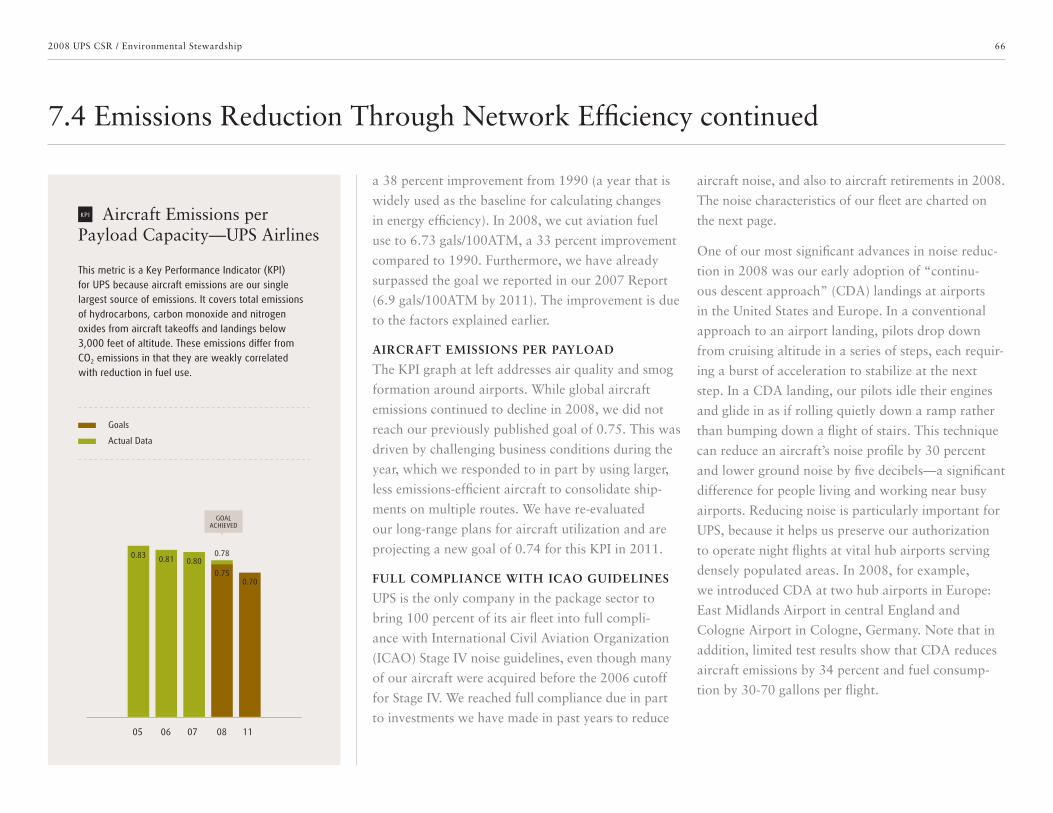
66
7.4 Emissions Reduction Through Network Efficiency continued
2008 UPS CSR / Environmental Stewardship
a 38 percent improvement from 1990 (a year that is
widely used as the baseline for calculating changes
in energy efficiency). In 2008, we cut aviation fuel
use to 6.73 gals/100ATM, a 33 percent improvement
compared to 1990. Furthermore, we have already
surpassed the goal we reported in our 2007 Report
(6.9 gals/100ATM by 2011). The improvement is due
to the factors explained earlier.
AIRCRAFT EMISSIONS PER PAYLOAD
The KPI graph at left addresses air quality and smog
formation around airports. While global aircraft
emissions continued to decline in 2008, we did not
reach our previously published goal of 0.75. This was
driven by challenging business conditions during the
year, which we responded to in part by using larger,
less emissions-efficient aircraft to consolidate ship-
ments on multiple routes. We have re-evaluated
our long-range plans for aircraft utilization and are
projecting a new goal of 0.74 for this KPI in 2011.
FULL COMPLIANCE WITH ICAO GUIDELINES
UPS is the only company in the package sector to
bring 100 percent of its air fleet into full compli-
ance with International Civil Aviation Organization
(ICAO) Stage IV noise guidelines, even though many
of our aircraft were acquired before the 2006 cutoff
for Stage IV. We reached full compliance due in part
to investments we have made in past years to reduce
aircraft noise, and also to aircraft retirements in 2008.
The noise characteristics of our fleet are charted on
the next page.
One of our most significant advances in noise reduc-
tion in 2008 was our early adoption of “continu-
ous descent approach” (CDA) landings at airports
in the United States and Europe. In a conventional
approach to an airport landing, pilots drop down
from cruising altitude in a series of steps, each requir-
ing a burst of acceleration to stabilize at the next
step. In a CDA landing, our pilots idle their engines
and glide in as if rolling quietly down a ramp rather
than bumping down a flight of stairs. This technique
can reduce an aircraft’s noise profile by 30 percent
and lower ground noise by five decibels —a significant
difference for people living and working near busy
airports. Reducing noise is particularly important for
UPS, because it helps us preserve our authorization
to operate night flights at vital hub airports serving
densely populated areas. In 2008, for example,
we introduced CDA at two hub airports in Europe:
East Midlands Airport in central England and
Cologne Airport in Cologne, Germany. Note that in
addition, limited test results show that CDA reduces
aircraft emissions by 34 percent and fuel consump-
tion by 30-70 gallons per flight.
Aircraft Emissions per Payload Capacity—UPS Airlines
This metric is a Key Performance Indicator (KPI) for UPS because aircraft emissions are our single largest source of emissions. It covers total emissions of hydrocarbons, carbon monoxide and nitrogen oxides from aircraft takeoffs and landings below 3,000 feet of altitude. These emissions differ from CO2 emissions in that they are weakly correlated with reduction in fuel use.
0.83 0.81 0.80
0.75
0.78
0.70
Goals
Actual Data
05 06 07 08 11
GOAL ACHIEVED
KPI
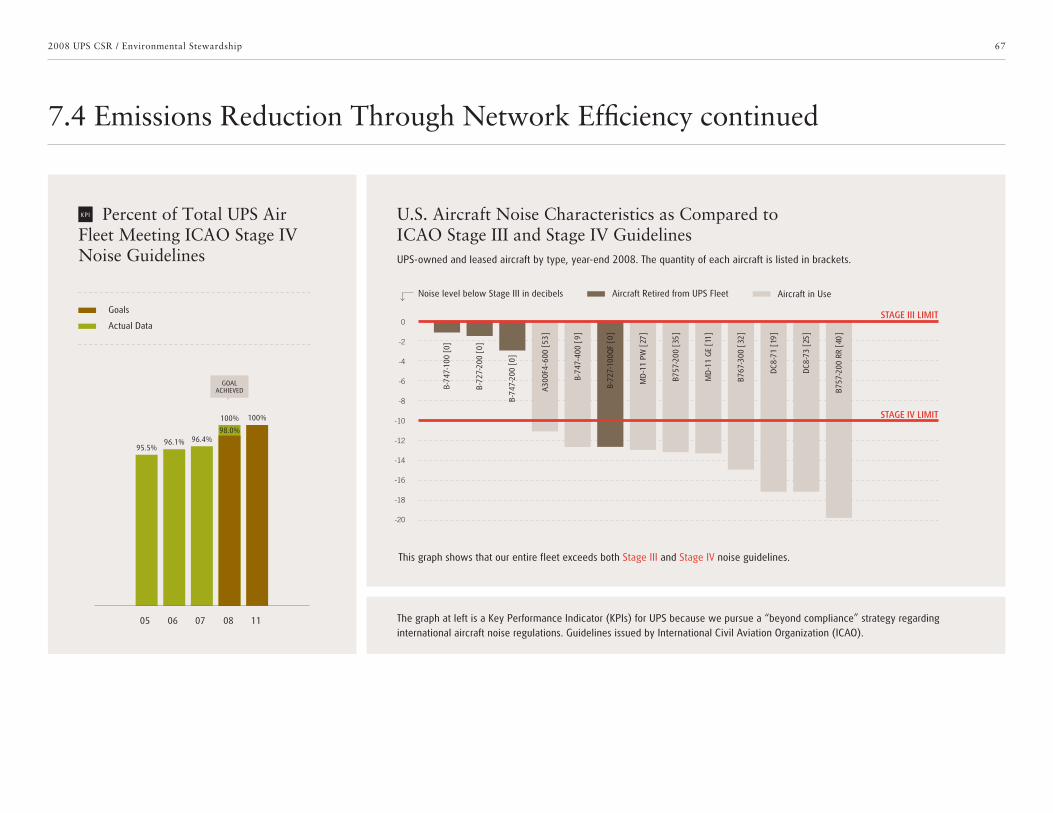
67
7.4 Emissions Reduction Through Network Efficiency continued
2008 UPS CSR / Environmental Stewardship
Percent of Total UPS Air Fleet Meeting ICAO Stage IV Noise Guidelines
The graph at left is a Key Performance Indicator (KPIs) for UPS because we pursue a “beyond compliance” strategy regarding international aircraft noise regulations. Guidelines issued by International Civil Aviation Organization (ICAO).
95.5%96.1% 96.4%
98.0%
100% 100%
05 06 07 08 11
U.S. Aircraft Noise Characteristics as Compared to ICAO Stage III and Stage IV GuidelinesUPS-owned and leased aircraft by type, year-end 2008. The quantity of each aircraft is listed in brackets.
This graph shows that our entire fleet exceeds both Stage III and Stage IV noise guidelines.
Noise level below Stage III in decibels
-16
-18
-20
-6
-14
-4
-10
0
-12
-2
-8
STAGE III LIMIT
STAGE IV LIMIT
B-74
7-10
0 [0
]
B-72
7-20
0 [0
]
B-74
7-20
0 [0
]
A30
0F4-
600
[53
]
B-72
7-10
0QF
[0]
MD
-11
PW [
27]
B757
-200
[35
]
MD
-11
GE
[11
]
DC8
-73
[25
]
DC8
-71
[19
]
B767
-300
[32
]
B757
-200
RR
[40
]
B-74
7-40
0 [9
]
Aircraft Retired from UPS Fleet Aircraft in Use
KPI
Goals
Actual Data
GOAL ACHIEVED
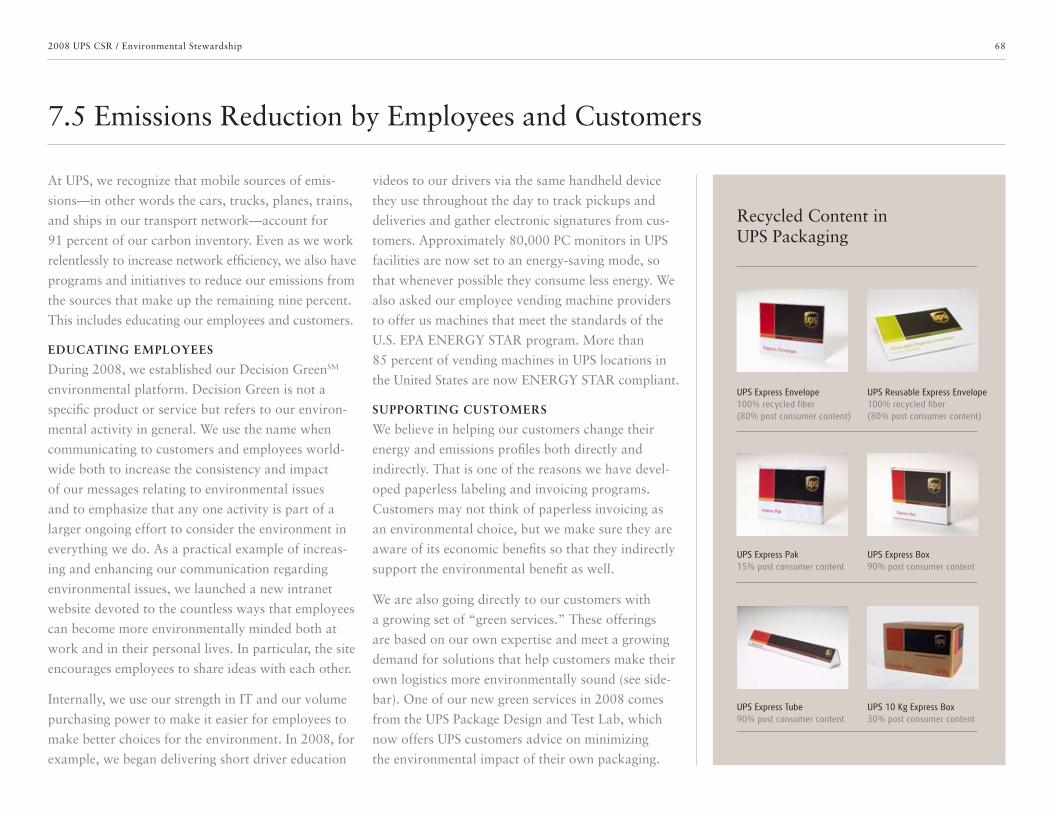
68
7.5 Emissions Reduction by Employees and Customers
2008 UPS CSR / Environmental Stewardship
At UPS, we recognize that mobile sources of emis-
sions—in other words the cars, trucks, planes, trains,
and ships in our transport network—account for
91 percent of our carbon inventory. Even as we work
relentlessly to increase network efficiency, we also have
programs and initiatives to reduce our emissions from
the sources that make up the remaining nine percent.
This includes educating our employees and customers.
EDUCATING EMPLOYEES
During 2008, we established our Decision GreenSM
environmental platform. Decision Green is not a
specific product or service but refers to our environ-
mental activity in general. We use the name when
communicating to customers and employees world-
wide both to increase the consistency and impact
of our messages relating to environmental issues
and to emphasize that any one activity is part of a
larger ongoing effort to consider the environment in
everything we do. As a practical example of increas-
ing and enhancing our communication regarding
environmental issues, we launched a new intranet
website devoted to the countless ways that employees
can become more environmentally minded both at
work and in their personal lives. In particular, the site
encourages employees to share ideas with each other.
Internally, we use our strength in IT and our volume
purchasing power to make it easier for employees to
make better choices for the environment. In 2008, for
example, we began delivering short driver education
videos to our drivers via the same handheld device
they use throughout the day to track pickups and
deliveries and gather electronic signatures from cus-
tomers. Approximately 80,000 PC monitors in UPS
facilities are now set to an energy-saving mode, so
that whenever possible they consume less energy. We
also asked our employee vending machine providers
to offer us machines that meet the standards of the
U.S. EPA ENERGY STAR program. More than
85 percent of vending machines in UPS locations in
the United States are now ENERGY STAR compliant.
SUPPORTING CUSTOMERS
We believe in helping our customers change their
energy and emissions profiles both directly and
indirectly. That is one of the reasons we have devel-
oped paperless labeling and invoicing programs.
Customers may not think of paperless invoicing as
an environmental choice, but we make sure they are
aware of its economic benefits so that they indirectly
support the environmental benefit as well.
We are also going directly to our customers with
a growing set of “green services.” These offerings
are based on our own expertise and meet a growing
demand for solutions that help customers make their
own logistics more environmentally sound (see side-
bar). One of our new green services in 2008 comes
from the UPS Package Design and Test Lab, which
now offers UPS customers advice on minimizing
the environmental impact of their own packaging.
Recycled Content in UPS Packaging
UPS Express Envelope100% recycled fiber (80% post consumer content)
UPS Reusable Express Envelope100% recycled fiber (80% post consumer content)
UPS Express Pak15% post consumer content
UPS Express Box90% post consumer content
UPS Express Tube90% post consumer content
UPS 10 Kg Express Box30% post consumer content
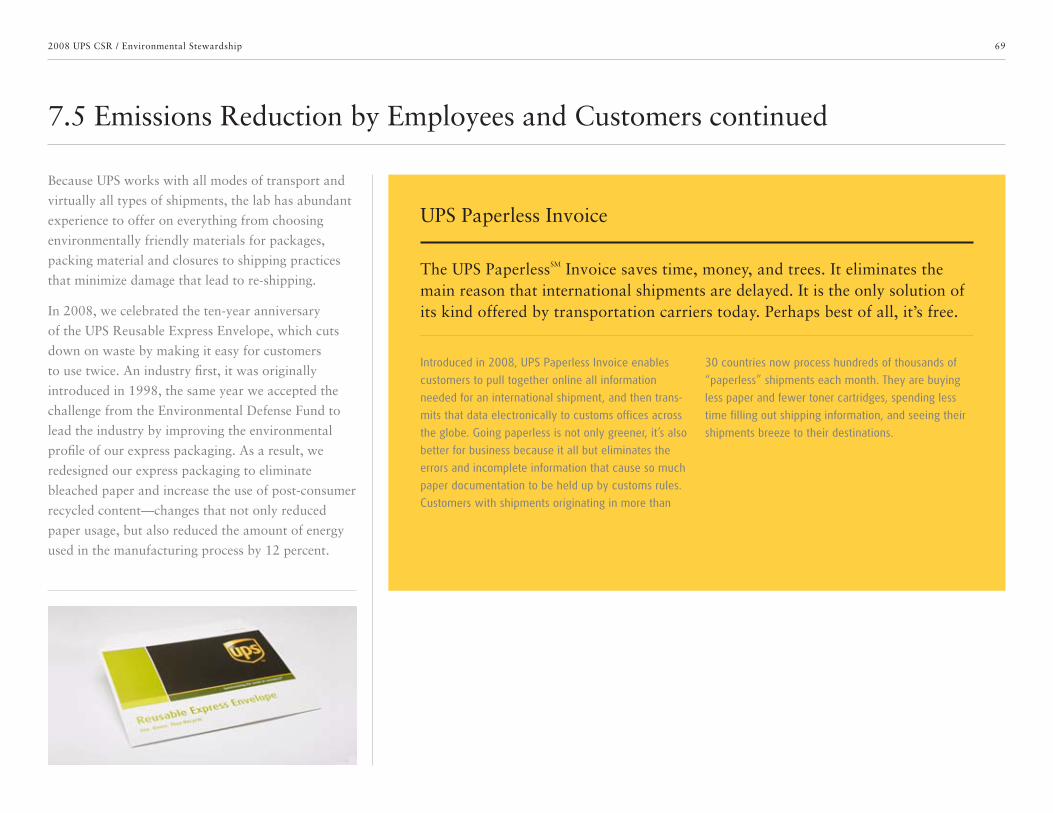
69
7.5 Emissions Reduction by Employees and Customers continued
2008 UPS CSR / Environmental Stewardship
Because UPS works with all modes of transport and
virtually all types of shipments, the lab has abundant
experience to offer on everything from choosing
environmentally friendly materials for packages,
packing material and closures to shipping practices
that minimize damage that lead to re-shipping.
In 2008, we celebrated the ten-year anniversary
of the UPS Reusable Express Envelope, which cuts
down on waste by making it easy for customers
to use twice. An industry first, it was originally
introduced in 1998, the same year we accepted the
challenge from the Environmental Defense Fund to
lead the industry by improving the environmental
profile of our express packaging. As a result, we
redesigned our express packaging to eliminate
bleached paper and increase the use of post-consumer
recycled content—changes that not only reduced
paper usage, but also reduced the amount of energy
used in the manufacturing process by 12 percent.
Introduced in 2008, UPS Paperless Invoice enables
customers to pull together online all information
needed for an international shipment, and then trans-
mits that data electronically to customs offices across
the globe. Going paperless is not only greener, it’s also
better for business because it all but eliminates the
errors and incomplete information that cause so much
paper documentation to be held up by customs rules.
Customers with shipments originating in more than
30 countries now process hundreds of thousands of
“paperless” shipments each month. They are buying
less paper and fewer toner cartridges, spending less
time filling out shipping information, and seeing their
shipments breeze to their destinations.
UPS Paperless Invoice
The UPS PaperlessSM Invoice saves time, money, and trees. It eliminates the main reason that international shipments are delayed. It is the only solution of its kind offered by transportation carriers today. Perhaps best of all, it’s free.

70
7.5 Emissions Reduction by Employees and Customers continued
2008 UPS CSR / Environmental Stewardship
FLEXIBLE SHIPPING
UPS’s multimodal network—which flexibly moves goods
by ship, rail, aircraft, and truck—enables us to offer a
range of options so that customers can balance their
concerns regarding speed, cost, and carbon footprint.
PAPERLESS BILLING
Electronic Billing saves trees on the way to giving
customers a much better way to manage their account
with us, and it can help them manage their own customer
receivables more effectively as well. We offer four options
for paperless billing, so customers can choose how they
take advantage of it.
REUSABLE ENVELOPES
UPS Reusable Express Envelopes come with a second strip
of adhesive, making it easy to use them again. Reusable
Express Envelopes are especially convenient for shippers
in document-intensive industries, such as law and real
estate, in which it is common to send out documents that
must be signed and returned.
SMARTER PACKING MATERIALS
Many The UPS Store® locations offer earth-friendly
packaging that does the job of bubble cushioning and
packaging peanuts using a fraction of the material and
energy. We also let customers recycle old packaging
peanuts at many store locations.
GREEN PACKAGING LAB
Our Package Design and Test Lab helps customers
improve, enhance, and right-size their packaging. When
smaller, lighter, smarter-shaped packages still deliver on
quality, they reduce fuel consumption and emissions—
often while saving money for the customer as well.
SUPPLY CHAIN CONSULTING
As an operator of one of the world’s most extensive and
advanced logistics, distribution and transport networks,
we can help customers improve the efficiency of their
own supply chains. Our expertise includes working closely
with businesses of all sizes, in all industries, in all parts of
the world, so we know how other companies are turning
their logistics green. Whether customers are looking for a
few good ideas or an expert team to take over their whole
transportation network, we can help reduce their costs
and carbon footprint.
FLEET MANAGEMENT SOLUTIONS
We offer customers sophisticated software solutions for
routing, scheduling and dispatching their vehicle fleets.
Currently, nearly 190,000 customer vehicles are using
UPS technology to eliminate more than 1.1 billion miles
driven in the course of a year, with an associated saving
of approximately 1.9 million metric tonnes of CO2.
UPS Green Services

71
7.6 Conservation and Recycling
2008 UPS CSR / Environmental Stewardship
During 2008, UPS continued or expanded numerous initiatives aimed at reducing energy consumption and emissions from facilities while conserving natural resources.
LIGHTING
Lighting is one of our major stationary sources of
energy use and emissions, in part because our dis-
tribution centers are large facilities that remain in
operation overnight. In 2008, we funded 117 light-
ing upgrade projects that are expected to produce an
annual energy savings of more than 25 million kWh.
This is equivalent to the energy required to power
2,490 homes for a year. We expect these projects to
lower CO2 emissions by 15,893 metric tonnes annu-
ally. We also continue to test and evaluate low-energy
LED lighting for specific applications, such as yard
lighting and the loading and unloading of trailers.
RENEWABLE ENERGY
In 2008, we deployed a solid oxide fuel cell in our
Anchorage, Alaska distribution facility that converts
low-carbon fuels directly into electrical energy.
The system is expected to produce 100,000 kilowatt
hours of electricity, and reduce CO2 emissions by
62 metric tonnes per year. This project will enable us
to learn more about fuel cells as a potential source of
electricity for our distribution centers, which operate
around the clock.
In 2008, four other UPS facilities drew a substantial
proportion of their electricity from renewable
sources. Our solar-powered facility in Palm Springs,
Calif. produced 70 percent of its own electricity from
solar technology in 2008, eliminating 544 metric
tonnes of CO2 emissions—the equivalent of taking
99 automobiles off the road for the year. The remain-
ing facilities received approximately 50 percent of
their electricity from the conversion of biomass, a
renewable source provided as an option by the elec-
tricity supplier.
ENERGY-EFFICIENT BUILDINGS
We approach the energy efficiency of our distribution
facilities from a logistics-network perspective: the
building is not a stand-alone island, but part of a
larger system. Buildings and facilities account for 9
percent of our total energy consumption. For exam-
ple, we choose site locations to minimize transport
and delivery travel distances, therefore reducing fuel
consumption and costs throughout the life of the
building. We design the entire building site, including
employee parking areas, to minimize fuel consump-
tion of all vehicles using the site. We have developed
a new design for our distribution facilities so that
delivery vehicles are parked outside rather than
inside, which reduces the size of the building. This in
turn reduces materials required for construction and
energy needed for lighting, heating and cooling. We
equip the buildings with high-speed roll-up doors that
open and close quickly when vehicles are departing
and arriving, to minimize heating and cooling loss.
Other steps we take to make our distribution
facilities more energy efficient include:
72
7.6 Conservation and Recycling continued
2008 UPS CSR / Environmental Stewardship
• Skylights to reduce energy consumption for general
lighting during the day.
• Energy-efficient motors and low-friction belts for
conveyer systems.
• Pressurized heating systems and dock door seals
to prevent heat loss in cooler climates.
• Localized infrared systems for “task heating” that
reduce the need for general heating requirements.
We are currently developing LEED certification
processes and criteria for building construction and
materials, to ensure that we use the most efficient and
economical materials in future facility construction.
Energy efficiency is a priority in our office and IT
environments as well. For example, we have achieved
nearly three million kilowatt hours of annual elec-
tricity savings in one of our largest data centers (see
sidebar). We are steadily expanding our use of build-
ing automation systems, such as motion sensors for
office lighting, to reduce energy consumption. These
systems have been installed at our corporate offices,
major data centers, and new distribution facilities,
such as in Newington, Va. and Cordova, Calif.
As older heating, ventilation and air conditioning
(HVAC) systems reach the end of their life cycles,
we replace them with high-efficiency units.
WATER CONSERVATION
In 2008, U.S. Package Operations substantially
reduced water consumption, to 4.36 million cubic
Data drives the UPS global logistics network, and
electricity drives the data centers. Most of the elec-
tricity that pours into corporate data centers is used
to cool massive racks of computer servers so that
they can process data at high speeds. Data centers
have grown larger and more numerous around the
world, leading McKinsey & Co. and the Uptime Institute
to predict that data centers could become the world’s
number one source of greenhouse gases by 2020.
In 2008, we continued to address this issue with
one of our largest data centers. Located near our
headquarters in Atlanta, Ga., the Windward Data
Center monitors the approximately 15.5 million pack-
ages we deliver daily. We have managed to reduce
annual electricity consumption by nearly three million
kilowatt hours at Windward Data Center through
innovative use of simple but powerful elements: air
and water. In one case we re-engineered airflow to
adjust hydrostatic pressure and keep cool air where
it belonged: surrounding the server racks. That change
alone produced a saving of 1.5 million kilowatt hours
of electricity. We also combined a high-efficiency
heat exchanger with a 650,000-gallon water tank
to replace the cooling power of 400-kilowatt chillers.
The data center’s facility managers can now turn off
the energy-consuming chillers for more than five
months a year—a substantial achievement in the rela-
tively warm climate of Atlanta. This produced another
saving of approximately 1.5 million kilowatt hours—and
eliminated more than 1,000 metric tonnes of emissions.
In 2008, Windward Data Center won Uptime Institute’s
Green Enterprise IT Award.
Driving Down Energy Costs in a Data-Driven Business

73
7.6 Conservation and Recycling continued
2008 UPS CSR / Environmental Stewardship
meters (1.15 billion gallons) from 5.39 million cubic
meters (1.42 billion gallons) in 2007. Our absolute
and normalized water use dropped substantially
compared to each of the previous three years as well.
We led water conservation efforts by example from
our corporate offices, where we cut water consump-
tion by 4.8 million gallons compared to 2007. This
reduction came from multiple sources, including
landscape irrigation changes, installation of waterless
urinals, and upgrades to the HVAC system. In the
field, we wash our more than 75,000 vehicles in the
United States only as needed to maintain appearance;
we reclaim water from our vehicle washing tunnels;
and we use an environmentally friendly enzyme wash
agent that reduces the need for rinse water.
We are committed to further reducing our enter-
prise water consumption, both on an absolute and
normalized basis. One of our primary strategies for
achieving this result is to improve our collection and
analysis of water data, so that we can more rapidly
and effectively identify additional conservation
opportunities. Because of our local presence in so
many municipalities, we must deal with more than
1,900 water accounts in the United States alone.
Furthermore, those accounts involve more than
1,000 unique suppliers using 16 different measure-
ment systems. As we have expanded overseas, the
challenge of gathering and correlating water data has
grown even greater.
Water Consumption per 1,000 Packages
Water Consumption per US$1,000 of Revenue
Water Use Normalized
We track normalized water use because it shows our water-dependence in terms of package volume and business revenue. In contrast, an absolute measurement shows total water use without regard for how much business we were able to conduct at that level of consumption or emissions at that level of water consumption.
Water Use Absolute
This metric is a Key Performance Indicator (KPI) for UPS because we seek to reduce water consumption throughout our business as a cost-saving measure as well as a conservation measure. Data for 2005 does not include Supply Chain and Freight. Measured in million cubic meters.
5.455.18
0.69
5.39
0.73
4.36
0.68
05 06 07 08
0.40 0.04
1.40 0.14
0.60 0.06
1.60 0.16
1.00 0.10
2.00 0.20
0.80 0.08
1.80 0.18
1.20 0.12
05 06 07 08
0.170
0.191
0.174
0.139
1.62
1.48 1.54
1.28
KPIKPI
U.S. Package Operations (million cubic meters)
Supply Chain and Freight (million cubic meters)
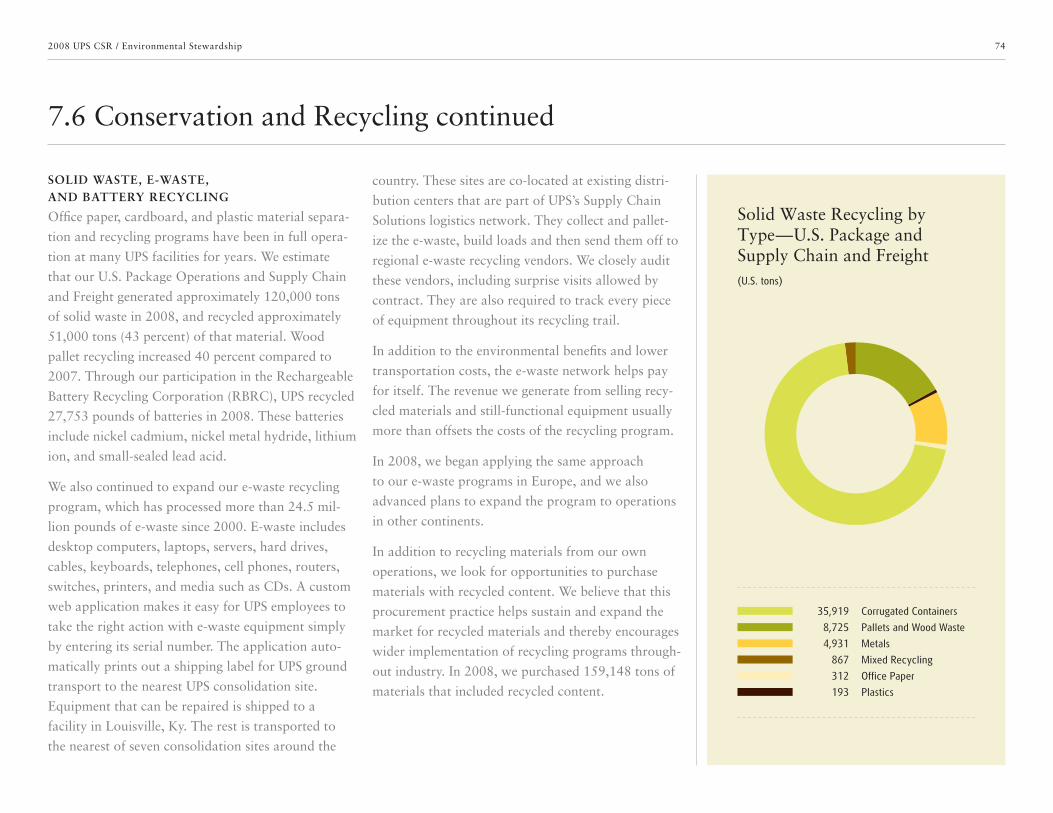
74
7.6 Conservation and Recycling continued
2008 UPS CSR / Environmental Stewardship
SOLID WASTE, E-WASTE, AND BATTERY RECYCLING
Office paper, cardboard, and plastic material separa-
tion and recycling programs have been in full opera-
tion at many UPS facilities for years. We estimate
that our U.S. Package Operations and Supply Chain
and Freight generated approximately 120,000 tons
of solid waste in 2008, and recycled approximately
51,000 tons (43 percent) of that material. Wood
pallet recycling increased 40 percent compared to
2007. Through our participation in the Rechargeable
Battery Recycling Corporation (RBRC), UPS recycled
27,753 pounds of batteries in 2008. These batteries
include nickel cadmium, nickel metal hydride, lithium
ion, and small-sealed lead acid.
We also continued to expand our e-waste recycling
program, which has processed more than 24.5 mil-
lion pounds of e-waste since 2000. E-waste includes
desktop computers, laptops, servers, hard drives,
cables, keyboards, telephones, cell phones, routers,
switches, printers, and media such as CDs. A custom
web application makes it easy for UPS employees to
take the right action with e-waste equipment simply
by entering its serial number. The application auto-
matically prints out a shipping label for UPS ground
transport to the nearest UPS consolidation site.
Equipment that can be repaired is shipped to a
facility in Louisville, Ky. The rest is transported to
the nearest of seven consolidation sites around the
country. These sites are co-located at existing distri-
bution centers that are part of UPS’s Supply Chain
Solutions logistics network. They collect and pallet-
ize the e-waste, build loads and then send them off to
regional e-waste recycling vendors. We closely audit
these vendors, including surprise visits allowed by
contract. They are also required to track every piece
of equipment throughout its recycling trail.
In addition to the environmental benefits and lower
transportation costs, the e-waste network helps pay
for itself. The revenue we generate from selling recy-
cled materials and still-functional equipment usually
more than offsets the costs of the recycling program.
In 2008, we began applying the same approach
to our e-waste programs in Europe, and we also
advanced plans to expand the program to operations
in other continents.
In addition to recycling materials from our own
operations, we look for opportunities to purchase
materials with recycled content. We believe that this
procurement practice helps sustain and expand the
market for recycled materials and thereby encourages
wider implementation of recycling programs through-
out industry. In 2008, we purchased 159,148 tons of
materials that included recycled content.
Solid Waste Recycling by Type—U.S. Package and Supply Chain and Freight
35,919
8,725
4,931
867
312
193
Corrugated Containers
Pallets and Wood Waste
Metals
Mixed Recycling
Office Paper
Plastics
(U.S. tons)
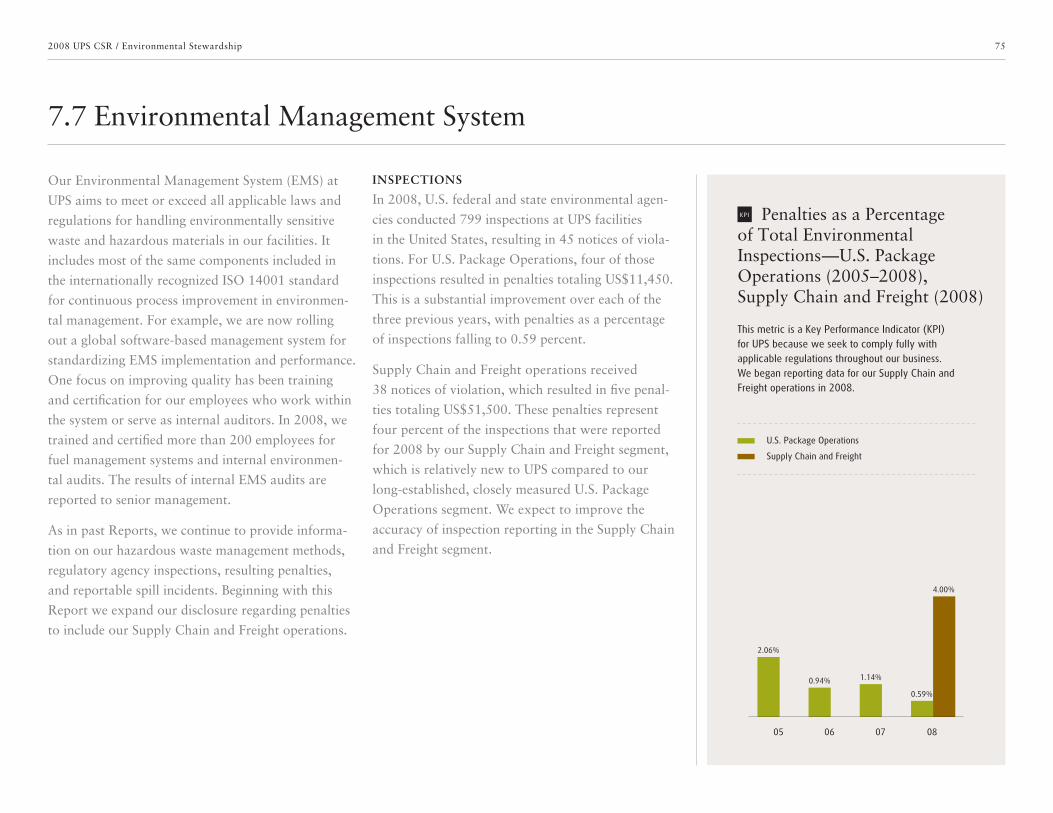
75
7.7 Environmental Management System
2008 UPS CSR / Environmental Stewardship
Our Environmental Management System (EMS) at
UPS aims to meet or exceed all applicable laws and
regulations for handling environmentally sensitive
waste and hazardous materials in our facilities. It
includes most of the same components included in
the internationally recognized ISO 14001 standard
for continuous process improvement in environmen-
tal management. For example, we are now rolling
out a global software-based management system for
standardizing EMS implementation and performance.
One focus on improving quality has been training
and certification for our employees who work within
the system or serve as internal auditors. In 2008, we
trained and certified more than 200 employees for
fuel management systems and internal environmen-
tal audits. The results of internal EMS audits are
reported to senior management.
As in past Reports, we continue to provide informa-
tion on our hazardous waste management methods,
regulatory agency inspections, resulting penalties,
and reportable spill incidents. Beginning with this
Report we expand our disclosure regarding penalties
to include our Supply Chain and Freight operations.
INSPECTIONS
In 2008, U.S. federal and state environmental agen-
cies conducted 799 inspections at UPS facilities
in the United States, resulting in 45 notices of viola-
tions. For U.S. Package Operations, four of those
inspections resulted in penalties totaling US$11,450.
This is a substantial improvement over each of the
three previous years, with penalties as a percentage
of inspections falling to 0.59 percent.
Supply Chain and Freight operations received
38 notices of violation, which resulted in five penal-
ties totaling US$51,500. These penalties represent
four percent of the inspections that were reported
for 2008 by our Supply Chain and Freight segment,
which is relatively new to UPS compared to our
long-established, closely measured U.S. Package
Operations segment. We expect to improve the
accuracy of inspection reporting in the Supply Chain
and Freight segment.
Penalties as a Percentage of Total Environmental Inspections—U.S. Package Operations (2005–2008), Supply Chain and Freight (2008)
This metric is a Key Performance Indicator (KPI) for UPS because we seek to comply fully with applicable regulations throughout our business. We began reporting data for our Supply Chain and Freight operations in 2008.
05 06 07 08
2.06%
0.94% 1.14%
4.00%
0.59%
KPI
U.S. Package Operations
Supply Chain and Freight

76
7.7 Environmental Management System continued
2008 UPS CSR / Environmental Stewardship
HAZARDOUS WASTE
In 2008, UPS operating facilities in the United States
generated 1,120 tons of hazardous waste. This
represents approximately 1 percent of total wastes,
compared to 10 percent of total wastes in 2007.
While the total weight of hazardous waste increased
compared to 879 tons in 2007, the percentage of
tonnage by management method (recycling, landfills
and incineration) remained nearly unchanged year-
over-year. Non-hazardous waste in 2008 totaled
2.1 million tons.
Both hazardous and non-hazardous wastes come
from aircraft, vehicles, and operations facilities. They
typically include spent antifreeze, used oil, spent
solvents, spill residues, paint wastes, used filters, and
leaking packages. We work with authorized vendors
that are properly qualified to dispose of or recycle
these wastes. Hazardous waste vendors are selected
even more carefully and audited regularly to ensure
safe handling of all wastes generated by UPS.
INCIDENTAL SPILLS
Our EMS objective for incidental spills is to reduce
the number to zero. This is an aggressive goal for
a company that operates more than 75,000 vehicles
in the United States. In fact, UPS exceeds federal
reporting guidelines by requiring that facilities
report all spills that can impact the environment
to our internal Corporate Environmental Affairs
department. We closely analyze information about
every spill in order to anticipate and prevent future
occurrences. In responding to a spill incident we
focus on rapid action, from identification of the
substance through remediation and reporting to all
appropriate authorities.
Reportable spills increased to 99 incidents in 2008,
higher than in each of the previous three years. The
total spill volume from reportable spills in 2008 was
4,933 gallons, of which Supply Chain and Freight
operations accounted for 1,867 gallons. We have
determined that the increase in spills for U.S. Package
Operations was due primarily to a higher number of
vehicle equipment failures such as leaks or breaks in
fluid lines, fluid reservoirs, and radiators, and we are
taking steps to address these issues.
This metric is no longer a Key Performance Indicator (KPI) for UPS because our hazardous waste manage-ment methods remain stable over time and do not represent a significant risk factor for our business.
Hazardous WasteManagement Methods— U.S. Package Operations, Supply Chain and Freight
2% Treated and Landfilled (21 tons)
9% Recycled (68 tons)
89% Incinerated (994 tons)

77
7.7 Environmental Management System continued
2008 UPS CSR / Environmental Stewardship
2008 Spill Incidents by Type
Number of Reportable Spill Incidents to a U.S. Federal or State Environmental Agency
The number of reportable spill incidents is a Key Performance Indicator (KPI) for UPS because the number of reportable spill incidents has increased in our U.S. Package Operations in each of the past two years. A spill or release at a facility or from a motor vehicle is reportable if it enters into a navigable waterway or adjoining shoreline of the United States, providing that the release meets a given set of criteria. The total number of incidents also includes any spills from vendors operating on UPS property, such as during delivery of fuel.
Aircraft AST and/or Piping Fuel Delivery Vehicle Package UPS Vehicle
EquipmentFailure
HumanError
HumanError
Equipment Failure
VehicleOverfill
Storage TankOverfill
1 11 1
0 20 0
1 0
0 1
2
0
9
0
3
0
23
4
27
2
8 2
6 4
EquipmentFailure
DamagedPackage
ImproperPackaging
Accident EquipmentFailure
RoadDebris
VehicleOverfill
U.S. Package Operations
Supply Chain and Freight
Ground Support
Equipment
2005 20072006 2008
42 4933 82
n/a 26n/a 17
U.S. Package Operations
Supply Chain and Freight
KPI
78
7.7 Environmental Management System continued
2008 UPS CSR / Environmental Stewardship
Earth Day Network will celebrate the 40th anniversary of Earth Day in 2010, but
our focus on youth keeps us young. There are approximately 105,000 schools in
the United States for children in kindergarten through twelfth grade, and we have
100,000 Earth Day coordinators active in those schools. Earth Day Network has
also expanded into 180 countries around the world. We keep seeing that the way
to change society with regard to the environment is to reach out to kids. They’re
open, they’re teachable, and they have their whole lives ahead of them to act on
what they learn.
For all these reasons, we were open to becoming one of the first environmental
organizations to work with UPS as a philanthropic partner. They are global, they
hire many young people, and they go about making their business more earth-
friendly in a calm, straightforward way. We had substantial discussions with UPS
to assess their authenticity and commitment to environmental education, and we
found strong alignment on goals and values.
For example, Earth Day Network is good at taking successful local programs and
expanding them to the country and the world. UPS connected us with the Clean
Air Campaign of Atlanta, Ga., which it supports in cutting vehicle emissions
associated with schools. We’re now taking that good local model nationwide. This
showed us that UPS is not looking at the environment as a marketing opportunity;
like us, they want practical results now that also change behavior for the long term.
Kathleen RogersPresident, Earth Day Network
Stakeholder: Earth Day Network
79
8.0 Social Responsibility
2008 UPS CSR
In this section of the Report, we present information regarding relationships between UPS and its employees, its suppliers, and its communities. We approach all our social relationships with respect and willingness to engage. This year we have included statements from a range of representative outside stakeholders, some working at the grass-roots level and others seeking global impact. We have also included corresponding statements from some of our own employees, to help illuminate how we engage with our stakeholders not just as an organization, but as people. We encourage you to visit the UPS sustainability website at sustainability.ups.com to learn more about all our programs and progress in the area of social responsibility.
8.1 Develop People
8.2 Promote Safety and Wellness
8.3 Embrace Diversity and Human Rights
8.4 Support Communities
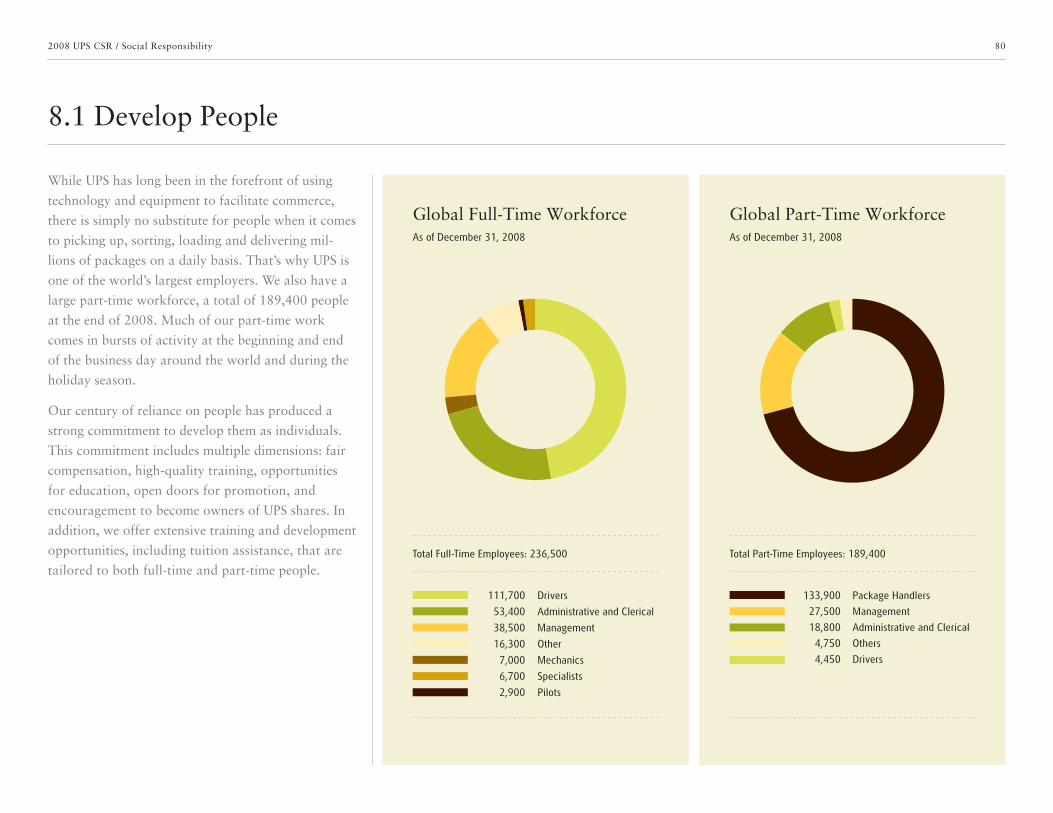
80
8.1 Develop People
2008 UPS CSR / Social Responsibility
While UPS has long been in the forefront of using
technology and equipment to facilitate commerce,
there is simply no substitute for people when it comes
to picking up, sorting, loading and delivering mil-
lions of packages on a daily basis. That’s why UPS is
one of the world’s largest employers. We also have a
large part-time workforce, a total of 189,400 people
at the end of 2008. Much of our part-time work
comes in bursts of activity at the beginning and end
of the business day around the world and during the
holiday season.
Our century of reliance on people has produced a
strong commitment to develop them as individuals.
This commitment includes multiple dimensions: fair
compensation, high-quality training, opportunities
for education, open doors for promotion, and
encouragement to become owners of UPS shares. In
addition, we offer extensive training and development
opportunities, including tuition assistance, that are
tailored to both full-time and part-time people.
111,700
53,400
38,500
16,300
7,000
6,700
2,900
Total Full-Time Employees: 236,500 Total Part-Time Employees: 189,400
133,900
27,500
18,800
4,750
4,450
Drivers
Administrative and Clerical
Management
Other
Mechanics
Specialists
Pilots
Package Handlers
Management
Administrative and Clerical
Others
Drivers
Global Full-Time Workforce Global Part-Time WorkforceAs of December 31, 2008 As of December 31, 2008
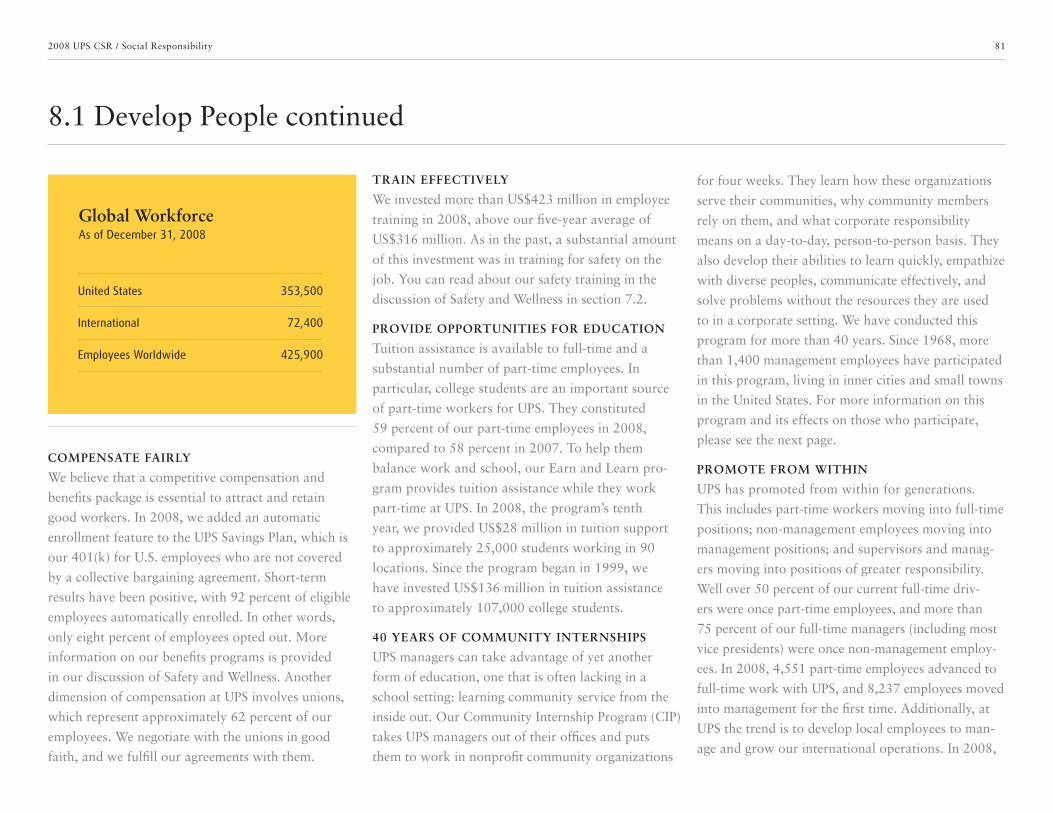
81
8.1 Develop People continued
2008 UPS CSR / Social Responsibility
TRAIN EFFECTIVELY
We invested more than US$423 million in employee
training in 2008, above our five-year average of
US$316 million. As in the past, a substantial amount
of this investment was in training for safety on the
job. You can read about our safety training in the
discussion of Safety and Wellness in section 7.2.
PROVIDE OPPORTUNITIES FOR EDUCATION
Tuition assistance is available to full-time and a
substantial number of part-time employees. In
particular, college students are an important source
of part-time workers for UPS. They constituted
59 percent of our part-time employees in 2008,
compared to 58 percent in 2007. To help them
balance work and school, our Earn and Learn pro-
gram provides tuition assistance while they work
part-time at UPS. In 2008, the program’s tenth
year, we provided US$28 million in tuition support
to approximately 25,000 students working in 90
locations. Since the program began in 1999, we
have invested US$136 million in tuition assistance
to approximately 107,000 college students.
40 YEARS OF COMMUNITY INTERNSHIPS
UPS managers can take advantage of yet another
form of education, one that is often lacking in a
school setting: learning community service from the
inside out. Our Community Internship Program (CIP)
takes UPS managers out of their offices and puts
them to work in nonprofit community organizations
for four weeks. They learn how these organizations
serve their communities, why community members
rely on them, and what corporate responsibility
means on a day-to-day, person-to-person basis. They
also develop their abilities to learn quickly, empathize
with diverse peoples, communicate effectively, and
solve problems without the resources they are used
to in a corporate setting. We have conducted this
program for more than 40 years. Since 1968, more
than 1,400 management employees have participated
in this program, living in inner cities and small towns
in the United States. For more information on this
program and its effects on those who participate,
please see the next page.
PROMOTE FROM WITHIN
UPS has promoted from within for generations.
This includes part-time workers moving into full-time
positions; non-management employees moving into
management positions; and supervisors and manag-
ers moving into positions of greater responsibility.
Well over 50 percent of our current full-time driv-
ers were once part-time employees, and more than
75 percent of our full-time managers (including most
vice presidents) were once non-management employ-
ees. In 2008, 4,551 part-time employees advanced to
full-time work with UPS, and 8,237 employees moved
into management for the first time. Additionally, at
UPS the trend is to develop local employees to man-
age and grow our international operations. In 2008,
COMPENSATE FAIRLY
We believe that a competitive compensation and
benefits package is essential to attract and retain
good workers. In 2008, we added an automatic
enrollment feature to the UPS Savings Plan, which is
our 401(k) for U.S. employees who are not covered
by a collective bargaining agreement. Short-term
results have been positive, with 92 percent of eligible
employees automatically enrolled. In other words,
only eight percent of employees opted out. More
information on our benefits programs is provided
in our discussion of Safety and Wellness. Another
dimension of compensation at UPS involves unions,
which represent approximately 62 percent of our
employees. We negotiate with the unions in good
faith, and we fulfill our agreements with them.
Global WorkforceAs of December 31, 2008
United States
International
Employees Worldwide
353,500
72,400
425,900

82
8.1 Develop People continued
2008 UPS CSR / Social Responsibility
I am a product of Henry Street Settlement. It was my home away from home for
eight years, when I was one of six kids in an immigrant family from the Dominican
Republic. During that time, UPS began its Community Internship Program (CIP).
I was very aware of the people from UPS coming to the lower east side in those
years. Now I take time each summer to help direct the CIP for Henry Street. In
2008, we celebrated the program’s 40th anniversary.
We design our program to show UPS interns how a community works its way
through major issues, such as crime, teen pregnancy and homelessness. We
explode the myths and stereotypes they have, and get them working closely
with members of the community every day for weeks. At first they bring their
UPS professionalism to whatever they do, working hard with a good attitude.
After a few weeks, they start to bring their humanity as well. That’s when the
real change happens.
The true marriage of public and private sectors occurs when each side becomes
human to the other. Then people are not tackling a challenge together despite
their differences, they are tackling the challenge and their differences at the same
time. They are achieving something together, and letting it change them in the
process. We don’t usually think that corporations focused on profit want to be part
of this marriage, but some of them do. I see it every summer at Henry Street, and
every year I still say to myself, this is amazing.
Rafael JaquezProgram Coordinator, Children’s Aid Society, New York City
Stakeholder: Community Internship Program
I became interested in the Community Internship Program (CIP) after people at
UPS described it as an opportunity of a lifetime. They were right. Henry Street
Settlement was a good match for me because it has a long heritage of helping
immigrant populations, and I’ve spent much of my career abroad as an outsider
learning to fit in. The director of the program keeps it relevant—he added the
Lower East Side Ecology Center to our program this year because the environment
is a hot topic for UPS.
During my four weeks at Henry Street, I learned a tremendous amount about
how community services work in the United States, from day care centers to the
criminal justice system. I also discovered that people at nonprofits share many of
the same challenges as corporate managers: hitting targets, doing things more
efficiently, showing that we deserve our budgets. The people running the services
were happy to find out that the corporate world has to work at these things, too.
I took some new perspectives with me when I went back to work. For one thing,
when something’s not quite right with an employee, I don’t just assume that it’s
not my business. Now I’m open to understanding what’s behind it, and how I
might help. I’m also determined to create a CIP in Europe, where I am working
now. I think many people would like to have this kind of experience, but they
don’t know where to begin. The CIP program opened the door for me, and I want
to open it for others.
Mike HarrellOperations Manager, UPS Freight, Europe
UPS: Community Internship Program
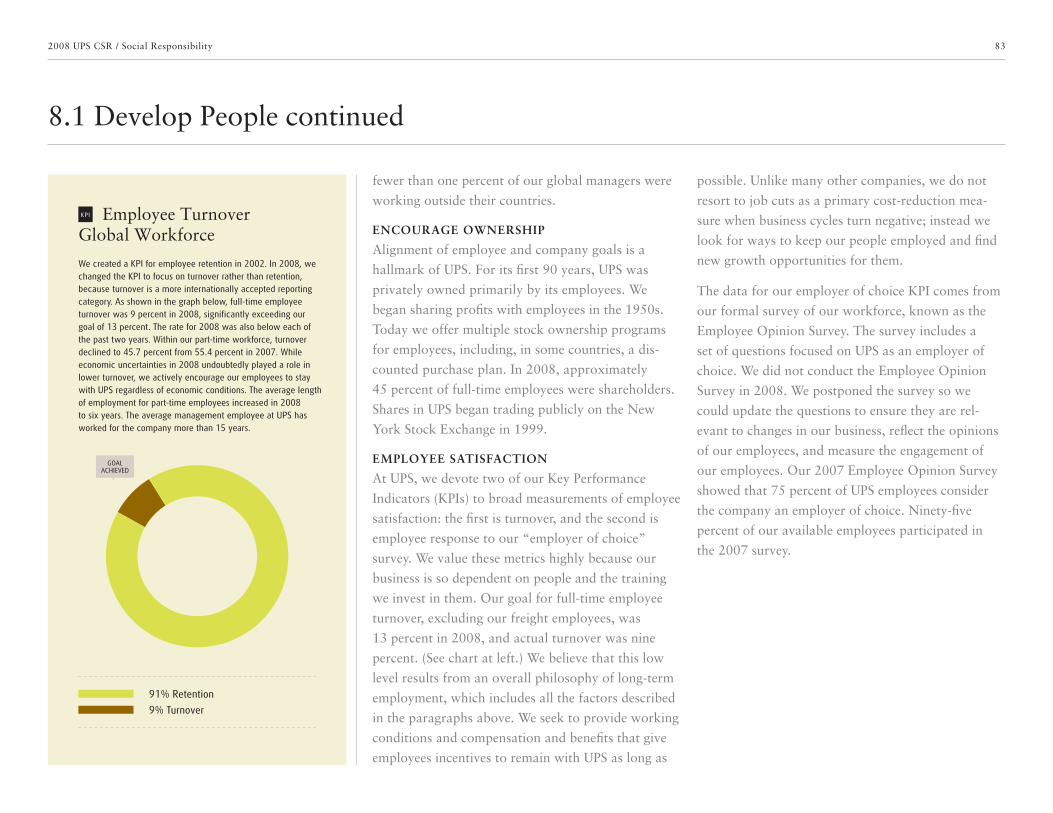
83
8.1 Develop People continued
2008 UPS CSR / Social Responsibility
fewer than one percent of our global managers were
working outside their countries.
ENCOURAGE OWNERSHIP
Alignment of employee and company goals is a
hallmark of UPS. For its first 90 years, UPS was
privately owned primarily by its employees. We
began sharing profits with employees in the 1950s.
Today we offer multiple stock ownership programs
for employees, including, in some countries, a dis-
counted purchase plan. In 2008, approximately
45 percent of full-time employees were shareholders.
Shares in UPS began trading publicly on the New
York Stock Exchange in 1999.
EMPLOYEE SATISFACTION
At UPS, we devote two of our Key Performance
Indicators (KPIs) to broad measurements of employee
satisfaction: the first is turnover, and the second is
employee response to our “employer of choice”
survey. We value these metrics highly because our
business is so dependent on people and the training
we invest in them. Our goal for full-time employee
turnover, excluding our freight employees, was
13 percent in 2008, and actual turnover was nine
percent. (See chart at left.) We believe that this low
level results from an overall philosophy of long-term
employment, which includes all the factors described
in the paragraphs above. We seek to provide working
conditions and compensation and benefits that give
employees incentives to remain with UPS as long as
possible. Unlike many other companies, we do not
resort to job cuts as a primary cost-reduction mea-
sure when business cycles turn negative; instead we
look for ways to keep our people employed and find
new growth opportunities for them.
The data for our employer of choice KPI comes from
our formal survey of our workforce, known as the
Employee Opinion Survey. The survey includes a
set of questions focused on UPS as an employer of
choice. We did not conduct the Employee Opinion
Survey in 2008. We postponed the survey so we
could update the questions to ensure they are rel-
evant to changes in our business, reflect the opinions
of our employees, and measure the engagement of
our employees. Our 2007 Employee Opinion Survey
showed that 75 percent of UPS employees consider
the company an employer of choice. Ninety-five
percent of our available employees participated in
the 2007 survey.
We created a KPI for employee retention in 2002. In 2008, we changed the KPI to focus on turnover rather than retention, because turnover is a more internationally accepted reporting category. As shown in the graph below, full-time employee turnover was 9 percent in 2008, significantly exceeding our goal of 13 percent. The rate for 2008 was also below each of the past two years. Within our part-time workforce, turnover declined to 45.7 percent from 55.4 percent in 2007. While economic uncertainties in 2008 undoubtedly played a role in lower turnover, we actively encourage our employees to stay with UPS regardless of economic conditions. The average length of employment for part-time employees increased in 2008 to six years. The average management employee at UPS has worked for the company more than 15 years.
Employee TurnoverGlobal Workforce
91% Retention
9% Turnover
GOAL ACHIEVED
KPI

84
8.2 Promote Safety and Wellness
2008 UPS CSR / Social Responsibility
OUR FOCUS ON SAFETY
Approximately 82 percent of UPS workers are
involved in freight and package handling, driving
motor vehicles, or both. To perform these jobs
safely, people need specific skills and abilities that
maximize their performance while minimizing
their exposure to injury. In 2008, we invested
US$52 million in teaching 56 formal safety training
courses in more than 1,800 facilities. Our workers
spent approximately 1.3 million hours in safety
training in 2008. One highlight of this investment
is our new “UPS Integrad®” training program,
which is profiled in section 6.8.
In addition to training our people, we continually
increase the safety of the facilities they work in
and the equipment they use. In 2008, we invested
millions in upgrading and improving facilities and
equipment from a safety perspective. Many of the
ideas for these improvements and upgrades come
from our Comprehensive Health and Safety Process
(CHSP) members. There are more than 3,700
CHSP committees in UPS facilities worldwide,
and they are employee driven and management
supported. Non-management employees serving
on CHSP committees constitute approximately
10 percent of the total UPS workforce. In addition
to the CHSP process, approximately 350 employees
at UPS work full time to protect the health and
safety of UPS employees.
DRIVING SAFELY
Because we operate approximately 100,000 delivery
vehicles on a daily basis all over the world, safe
driving is a major focus for UPS. We measure both
our successes and challenges in this regard. On
the positive side, for example, 715 more drivers
entered the UPS “Circle of Honor” in 2008 in rec-
ognition of driving 25 years without an avoidable
accident. The Circle of Honor now includes 4,648
drivers who have achieved this remarkable record.
Unfortunately, we also deeply regret the fatal acci-
dents that claimed the lives of six UPS employees
in 2008. This total represents 0.18 fatalities per
100 million miles driven in our global operations.
Whenever an accident occurs, we invest significant
management attention in investigating the causes,
retraining the driver(s), and, as appropriate, chang-
ing our procedures and safety training.
Auto Accident Frequency per 100,000 Driver Hours
The KPI for package car driver safety is shown in the graph below. This KPI is unchanged compared to prior years. Note that we calculate auto accident frequency differently than most transportation companies, in two important ways. First, we report all accidents, not just those defined as “reportable” by government agencies. Second, we report the rate per 100,000 driver hours rather than one million driver hours. This is because our drivers must navigate traffic-intensive routes in congested urban areas, while long-haul truckers spend the majority of their time on open roads and highways. Data for 2005 and 2006 is U.S. only.
05 06 07 08 11
16.3
14.515.1
13.3
16.0
13.0
GOAL ACHIEVED
KPI
Actual Data
Goals

85
8.2 Promote Safety and Wellness continued
2008 UPS CSR / Social Responsibility
AVOIDING INJURY
One of our new KPIs for 2008 is shown at left. It
measures days away from the job, or with restricted
or transferred duty, as a result of injury. This metric
replaces a previous KPI measuring lost-time injuries
per 200,000 hours. We made the change for two rea-
sons. First, we had achieved our 2007 goal with the
previous KPI. For example, we have reduced inju-
ries in the United States by 30 percent in the last five
years even while our workforce has grown signifi-
cantly. More importantly, we wanted our new KPI to
reflect the actual impact of injuries on our business—
time lost rather than simply the number of injuries.
WELLNESS
In 2008, UPS provided health benefits for more
than 725,000 employees, retirees, and their depen-
dents. Our benefits programs provide medical,
dental, and vision care as well as education pro-
grams and tools regarding healthcare and proactive
wellness programs. The goal of these programs and
tools is getting our people to take wellness person-
ally, by making informed choices in how they live
and respond to wellness challenges. We also seek to
reduce overall healthcare costs for UPS.
One of the characteristic qualities of UPS wellness
programs is an emphasis on matching employees with
individuals who can help them. We learned the power
of this approach with our “health coaches” program,
which gives UPS employees access to registered nurses
who provide confidential assistance in understand-
ing healthcare issues and navigating the healthcare
system. UPS health coaches helped more than 11,500
employees and family members in 2008. In 2007, we
launched a smoking cessation program that includes
a “quit coach” for every smoker who wants to stop.
More than 2,200 people enrolled in the program in
2008; with the help of their coaches, they achieved
a 42 percent responder quit rate —far above average.
We took the coaching approach to the next level
in 2008 with our “Wellness Champions” program.
More than 3,600 UPS employees at all levels of the
company are Wellness Champions in their facilities
or locations. We provide them with a wide range
of tools and resources for informing their co-workers
about health risks and encouraging them to adopt
new behaviors to prevent or offset them. Each month
in 2008 was dedicated to a different health risk, and
Wellness Champions put up posters, hung calendars,
organized classes, led activities, and supported their
co-workers in changing their health habits. Whether
it was helping a runner achieve a new distance
or taking a desk-bound worker to a yoga class
after work, Wellness Champions were everywhere
at UPS in 2008.
Especially during difficult times, our Employee
Assistance Program (EAP) and Work/Life benefit
play a significant role in our overall wellness
program. More than 100,000 UPS employees
Global Operations, Days away from work, restricted activity, or transferred to another job due to an on-the-job injury. This number represents the number of occurrences per 200,000 hours worked. Data for 2005 and 2006 is U.S. only.
05 06 07 08 11
Days Away, Restricted or Transferred Duty (DART)
9.5
7.8
6.0
5.0
6.7
5.2
Actual Data
Goals
KPI
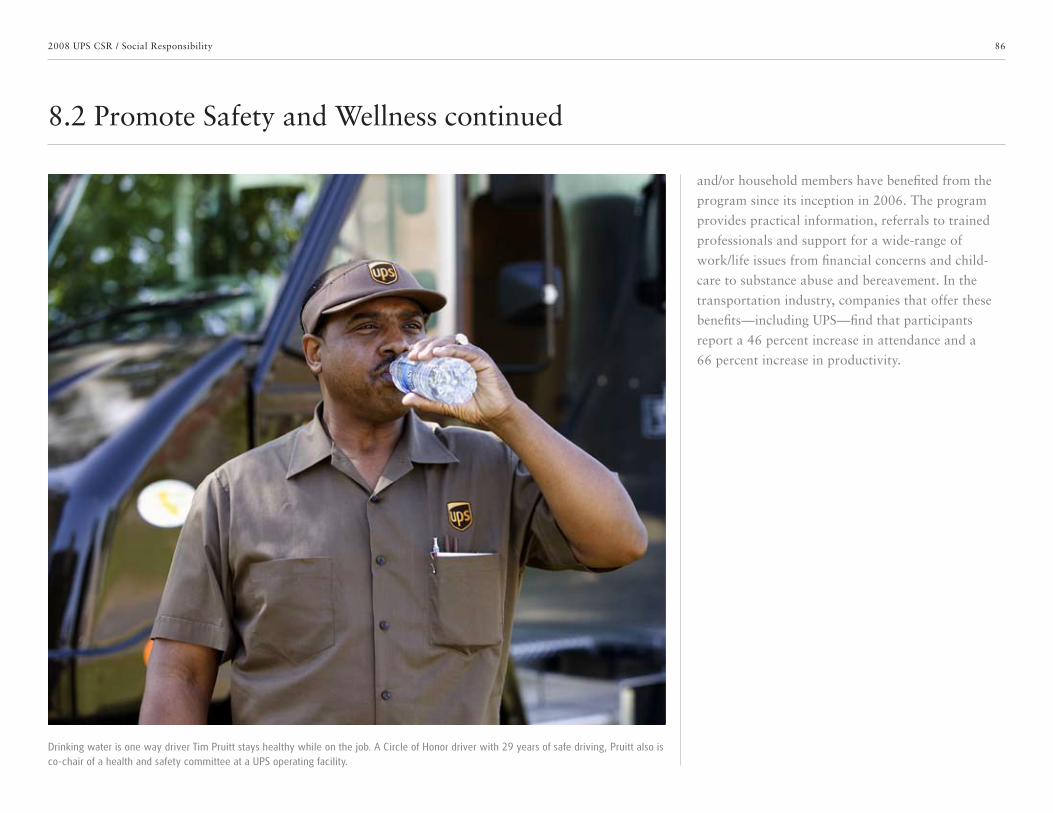
86
8.2 Promote Safety and Wellness continued
2008 UPS CSR / Social Responsibility
and/or household members have benefited from the
program since its inception in 2006. The program
provides practical information, referrals to trained
professionals and support for a wide-range of
work/life issues from financial concerns and child-
care to substance abuse and bereavement. In the
transportation industry, companies that offer these
benefits—including UPS—find that participants
report a 46 percent increase in attendance and a
66 percent increase in productivity.
Drinking water is one way driver Tim Pruitt stays healthy while on the job. A Circle of Honor driver with 29 years of safe driving, Pruitt also is co-chair of a health and safety committee at a UPS operating facility.

87
8.3 Embrace Diversity and Human Rights
2008 UPS CSR / Social Responsibility
UPS is one of the largest and most multinational
private employers in the world, and we succeed by
hiring and developing talented, motivated individuals.
As a logical consequence of these two factors, we are
becoming an ever-more diverse company.
At UPS, diversity encompasses more than race and
gender. It also extends to ethnicity, sexual orienta-
tion, and physical ability. Inclusiveness, respect, and
cooperation are core values that help drive the way
we do business with our customers and suppliers.
These values strengthen our bonds with a multi-
cultural community of friends and neighbors.
WOMEN’S LEADERSHIP DEVELOPMENT
Entry-level positions in our business, such as for
drivers and package loaders, have traditionally
attracted more men than women. Coupled with
our focus on promoting from within, this has created
a particular need for UPS to develop and retain
women for supervisory and management positions.
Our Women’s Leadership Development program,
which we expanded internationally in 2008, meets
this need in three ways:
• Creating meaningful dialogues between women
and men regarding workplace issues.
• Opening avenues for women to build their
leadership skills through community service.
• Providing opportunities for women to expand
and strengthen their career networks. Julie LaSalle, communications manager.
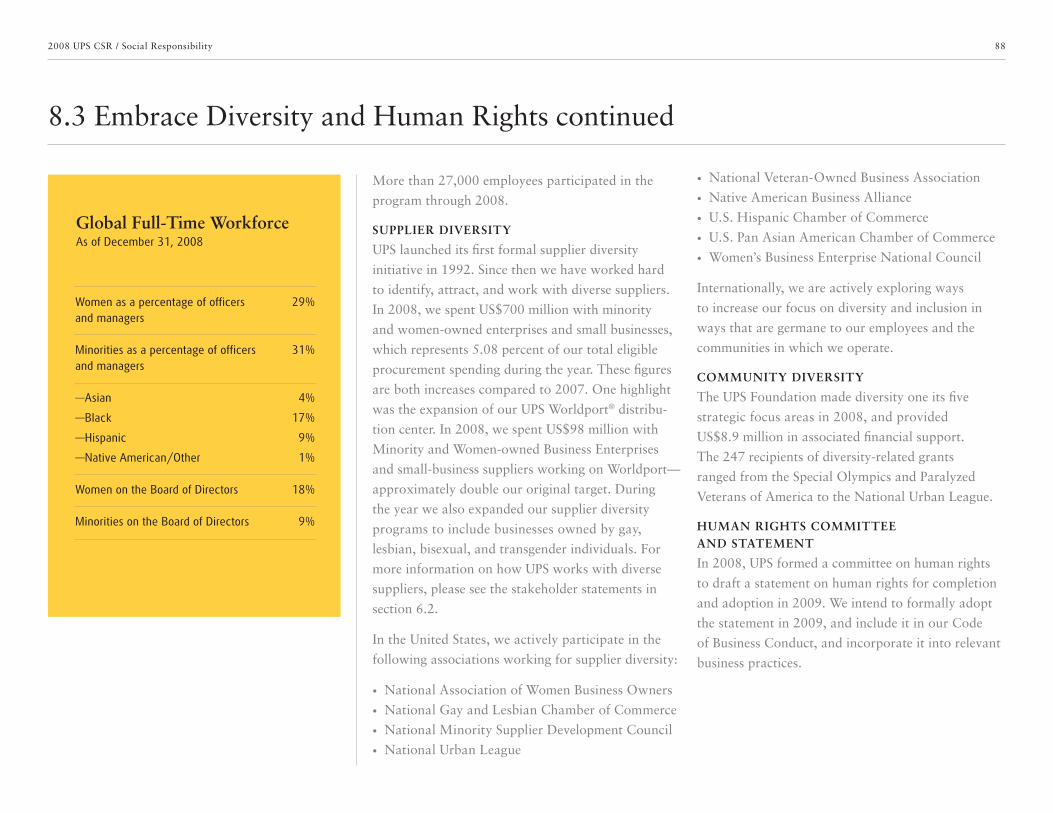
88
8.3 Embrace Diversity and Human Rights continued
2008 UPS CSR / Social Responsibility
More than 27,000 employees participated in the
program through 2008.
SUPPLIER DIVERSITY
UPS launched its first formal supplier diversity
initiative in 1992. Since then we have worked hard
to identify, attract, and work with diverse suppliers.
In 2008, we spent US$700 million with minority
and women-owned enterprises and small businesses,
which represents 5.08 percent of our total eligible
procurement spending during the year. These figures
are both increases compared to 2007. One highlight
was the expansion of our UPS Worldport® distribu-
tion center. In 2008, we spent US$98 million with
Minority and Women-owned Business Enterprises
and small-business suppliers working on Worldport—
approximately double our original target. During
the year we also expanded our supplier diversity
programs to include businesses owned by gay,
lesbian, bisexual, and transgender individuals. For
more information on how UPS works with diverse
suppliers, please see the stakeholder statements in
section 6.2.
In the United States, we actively participate in the
following associations working for supplier diversity:
• National Association of Women Business Owners
• National Gay and Lesbian Chamber of Commerce
• National Minority Supplier Development Council
• National Urban League
• National Veteran-Owned Business Association
• Native American Business Alliance
• U.S. Hispanic Chamber of Commerce
• U.S. Pan Asian American Chamber of Commerce
• Women’s Business Enterprise National Council
Internationally, we are actively exploring ways
to increase our focus on diversity and inclusion in
ways that are germane to our employees and the
communities in which we operate.
COMMUNITY DIVERSITY
The UPS Foundation made diversity one its five
strategic focus areas in 2008, and provided
US$8.9 million in associated financial support.
The 247 recipients of diversity-related grants
ranged from the Special Olympics and Paralyzed
Veterans of America to the National Urban League.
HUMAN RIGHTS COMMITTEE AND STATEMENT
In 2008, UPS formed a committee on human rights
to draft a statement on human rights for completion
and adoption in 2009. We intend to formally adopt
the statement in 2009, and include it in our Code
of Business Conduct, and incorporate it into relevant
business practices.
29%
31%
4%
17%
9%
1%
18%
9%
Global Full-Time WorkforceAs of December 31, 2008
Women as a percentage of officers and managers
Minorities as a percentage of officers and managers
—Asian
—Black
—Hispanic
—Native American/Other
Women on the Board of Directors
Minorities on the Board of Directors
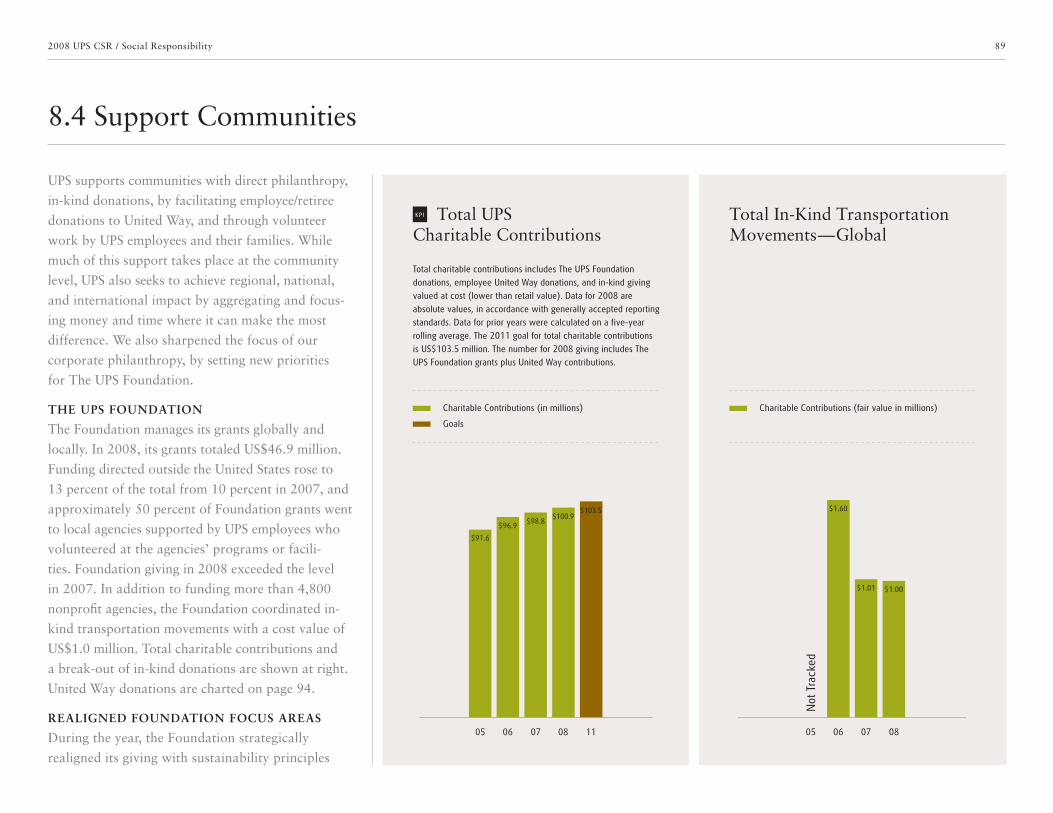
89
8.4 Support Communities
2008 UPS CSR / Social Responsibility
UPS supports communities with direct philanthropy,
in-kind donations, by facilitating employee/retiree
donations to United Way, and through volunteer
work by UPS employees and their families. While
much of this support takes place at the community
level, UPS also seeks to achieve regional, national,
and international impact by aggregating and focus-
ing money and time where it can make the most
difference. We also sharpened the focus of our
corporate philanthropy, by setting new priorities
for The UPS Foundation.
THE UPS FOUNDATION
The Foundation manages its grants globally and
locally. In 2008, its grants totaled US$46.9 million.
Funding directed outside the United States rose to
13 percent of the total from 10 percent in 2007, and
approximately 50 percent of Foundation grants went
to local agencies supported by UPS employees who
volunteered at the agencies’ programs or facili-
ties. Foundation giving in 2008 exceeded the level
in 2007. In addition to funding more than 4,800
nonprofit agencies, the Foundation coordinated in-
kind transportation movements with a cost value of
US$1.0 million. Total charitable contributions and
a break-out of in-kind donations are shown at right.
United Way donations are charted on page 94.
REALIGNED FOUNDATION FOCUS AREAS
During the year, the Foundation strategically
realigned its giving with sustainability principles
Total UPS Charitable Contributions
Total charitable contributions includes The UPS Foundation donations, employee United Way donations, and in-kind giving valued at cost (lower than retail value). Data for 2008 are absolute values, in accordance with generally accepted reporting standards. Data for prior years were calculated on a five-year rolling average. The 2011 goal for total charitable contributions is US$103.5 million. The number for 2008 giving includes The UPS Foundation grants plus United Way contributions.
05 06 07 08 11
$91.6
$96.9$98.8
$100.9$103.5
Total In-Kind Transportation Movements—Global
05 06 07 08
KPI
Charitable Contributions (in millions)
Goals
Charitable Contributions (fair value in millions)
Not
Tra
cked
$1.01 $1.00
$1.60

90
8.4 Support Communities continued
2008 UPS CSR / Social Responsibility
The UPS Foundation, founded in 1951, keeps evolving. In 2008, the Foundation announced new priorities for its financial funding, aligning them with UPS sustainability principles. One of the most significant changes arising from this realignment is the beginning of grant-making in support of environmental sustainability.
The UPS Foundation Gives Green
These investments reflect and complement many initia-
tives under way inside UPS to be more environmentally
responsible. This is a way to export that value and experi-
ence to communities through funding and volunteerism.
“Protecting the environment is increasingly important
to our company, to our customers, our employees
and the communities in which we operate around the
world, so it is a natural fit for the Foundation,” says Ken
Sternad, president of The UPS Foundation. In October of
2008, the Foundation put its new priority into practice,
announcing five grants totaling more than US$1 million.
They include:
• US$300,000 to The Nature Conservancy to assist
with tree planting efforts in the Atlantic Forest of
Brazil, conservation initiatives for rural residents in the
Yunnan Forest in China and reforestation efforts in East
Africa’s Highland Forest.
• US$300,000 to the Earth Day Network to support its
national civic engagement project to educate youth
about environmental issues and provide teachers with
lesson plans and environmental impact online tools.
• US$220,000 to Keep America Beautiful (KAB) to
support its environmental education initiatives,
including the creation of KAB affiliates on college
campuses, support for a community volunteer
initiative, a challenge grant for KAB affiliates and
an environmental partnership grant for UPS Global
Volunteer Month to encourage employee participation.
• US$200,000 to the National Park Foundation to fund
youth-engagement programs, including First Bloom,
which provides children in urban locations (grades 4
through 6) with hands-on environmental learning.
• US$50,000 to the Arbor Day Foundation to plant
one tree for each of the first 50,000 UPS customers
to begin using UPS electronic billing solutions, which
eliminate the need for paper invoices.
Photo: A UPS Mexico employee volunteers with Naturalia AC, a civil organization dedicated to preserving ecosystems.
91
8.4 Support Communities continued
2008 UPS CSR / Social Responsibility
of UPS, to further strengthen the ties between the
Foundation, the company, and the communities they
both serve. The five focus areas are as follows:
• Community safety: programs range from teen safe
driving programs in local communities to helping
strengthen disaster relief logistics globally.
• Nonprofit effectiveness: helping community-
based organizations improve their volunteer
management, leadership development, fund-
raising capacity and operational efficiency.
• Economic and global literacy: helping
globalization produce social and economic
progress for all, through microlending and
other innovative programs.
• Environmental sustainability: supporting
organizations and activities focused on
environmental education and conservation.
• Diversity: helping communities thrive by
embracing and leveraging the unique experience,
cultures and ideas of their people.
As part of this strategic realignment of philanthropy
priorities, the Foundation gave its first large
environmental grants in 2008. For more information
on these ground-breaking grants, please see the
previous page. Information on disaster relief activities
is provided later in this section.
UPS began supporting micro-lending in 2007,
awarding US$1 million to three global organizations
that help individual entrepreneurs start businesses,
create jobs, build assets and improve the standard
of living for their families. In 2008, the three
organizations began reporting on how the grants
were making a difference in their progress:
• Opportunity International is helping nearly
5,000 entrepreneurs in 15 developing countries.
• ACCION International works with partners in
25 countries to reach more than three million
active clients with loans and financial services.
• FINCA International extends credit to 1,400
micro-entrepreneurs in 21 countries.
GLOBAL SIGNATURE PROGRAM
The UPS Global Signature Program is a six-year,
US$3.1 million partnership between The UPS
Foundation and the World Association of Girl Guides
and Girl Scouts (WAGGGS). This funding helped
WAGGGS increase the recruitment and retention of
volunteers, support volunteers through training and
self-development, and introduce a system to monitor
and appraise volunteer leadership in Brazil, China,
Malaysia, Mexico, and South Africa. In 2007, The
UPS Foundation launched a second phase of fund-
ing by authorizing US$1.5 million over the next three
years in an effort to increase the WAGGGS network’s
capacity to engage volunteers effectively and contrib-
ute to a culture of volunteerism around the world.
EMPLOYEES AND LOCAL ACTION
Just as our employees are vital to the success of UPS
as a business, they are a powerful force for com-
munity action. During 2008, UPS employees and
their family members donated more than one million
volunteer hours to their communities through our
Neighbor to Neighbor program. In October, our
Global Volunteer Month, more than 30,000 UPS
employees volunteered 139,000 hours of time in
their communities. The focus for the month was
the environment. In 2009, employees will be able to
use a new intranet system to find volunteer opportu-
nities and track their hours.
Another highlight of UPS volunteerism in 2008
was our annual Jim Casey Community Service
Award, named after our founder and given to a UPS
employee whose volunteer work has been especially
notable. Every year the award process helps us
identify and recognize numerous candidates who
have made a clear, measurable difference in their
communities. In 2008, the ultimate recipient of the
award was “Andy” Jinchang He of Guangzhao,
China—our first winner outside the United States.
His story is included later in this section. For more
information, please see page 93.
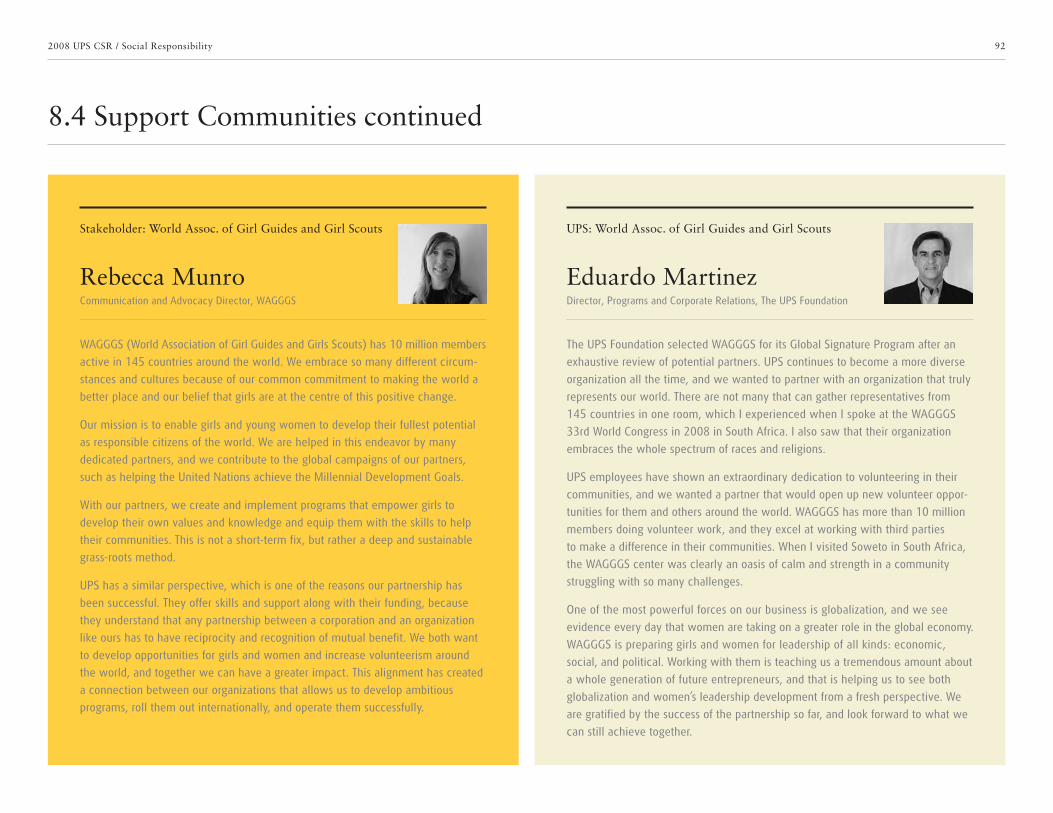
92
8.4 Support Communities continued
2008 UPS CSR / Social Responsibility
The UPS Foundation selected WAGGGS for its Global Signature Program after an
exhaustive review of potential partners. UPS continues to become a more diverse
organization all the time, and we wanted to partner with an organization that truly
represents our world. There are not many that can gather representatives from
145 countries in one room, which I experienced when I spoke at the WAGGGS
33rd World Congress in 2008 in South Africa. I also saw that their organization
embraces the whole spectrum of races and religions.
UPS employees have shown an extraordinary dedication to volunteering in their
communities, and we wanted a partner that would open up new volunteer oppor-
tunities for them and others around the world. WAGGGS has more than 10 million
members doing volunteer work, and they excel at working with third parties
to make a difference in their communities. When I visited Soweto in South Africa,
the WAGGGS center was clearly an oasis of calm and strength in a community
struggling with so many challenges.
One of the most powerful forces on our business is globalization, and we see
evidence every day that women are taking on a greater role in the global economy.
WAGGGS is preparing girls and women for leadership of all kinds: economic,
social, and political. Working with them is teaching us a tremendous amount about
a whole generation of future entrepreneurs, and that is helping us to see both
globalization and women’s leadership development from a fresh perspective. We
are gratified by the success of the partnership so far, and look forward to what we
can still achieve together.
WAGGGS (World Association of Girl Guides and Girls Scouts) has 10 million members
active in 145 countries around the world. We embrace so many different circum-
stances and cultures because of our common commitment to making the world a
better place and our belief that girls are at the centre of this positive change.
Our mission is to enable girls and young women to develop their fullest potential
as responsible citizens of the world. We are helped in this endeavor by many
dedicated partners, and we contribute to the global campaigns of our partners,
such as helping the United Nations achieve the Millennial Development Goals.
With our partners, we create and implement programs that empower girls to
develop their own values and knowledge and equip them with the skills to help
their communities. This is not a short-term fix, but rather a deep and sustainable
grass-roots method.
UPS has a similar perspective, which is one of the reasons our partnership has
been successful. They offer skills and support along with their funding, because
they understand that any partnership between a corporation and an organization
like ours has to have reciprocity and recognition of mutual benefit. We both want
to develop opportunities for girls and women and increase volunteerism around
the world, and together we can have a greater impact. This alignment has created
a connection between our organizations that allows us to develop ambitious
programs, roll them out internationally, and operate them successfully.
Eduardo MartinezRebecca MunroDirector, Programs and Corporate Relations, The UPS FoundationCommunication and Advocacy Director, WAGGGS
UPS: World Assoc. of Girl Guides and Girl ScoutsStakeholder: World Assoc. of Girl Guides and Girl Scouts
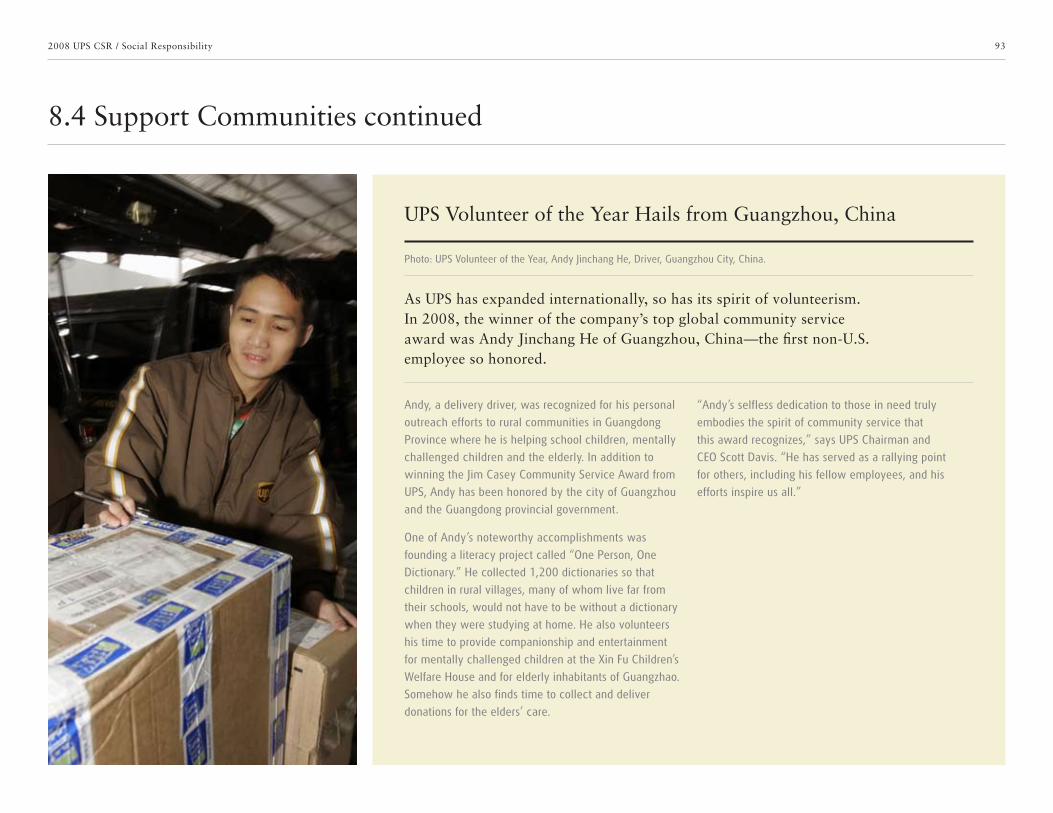
93
8.4 Support Communities continued
2008 UPS CSR / Social Responsibility
As UPS has expanded internationally, so has its spirit of volunteerism. In 2008, the winner of the company’s top global community service award was Andy Jinchang He of Guangzhou, China—the first non-U.S. employee so honored.
UPS Volunteer of the Year Hails from Guangzhou, China
Andy, a delivery driver, was recognized for his personal
outreach efforts to rural communities in Guangdong
Province where he is helping school children, mentally
challenged children and the elderly. In addition to
winning the Jim Casey Community Service Award from
UPS, Andy has been honored by the city of Guangzhou
and the Guangdong provincial government.
One of Andy’s noteworthy accomplishments was
founding a literacy project called “One Person, One
Dictionary.” He collected 1,200 dictionaries so that
children in rural villages, many of whom live far from
their schools, would not have to be without a dictionary
when they were studying at home. He also volunteers
his time to provide companionship and entertainment
for mentally challenged children at the Xin Fu Children’s
Welfare House and for elderly inhabitants of Guangzhao.
Somehow he also finds time to collect and deliver
donations for the elders’ care.
“Andy’s selfless dedication to those in need truly
embodies the spirit of community service that
this award recognizes,” says UPS Chairman and
CEO Scott Davis. “He has served as a rallying point
for others, including his fellow employees, and his
efforts inspire us all.”
Photo: UPS Volunteer of the Year, Andy Jinchang He, Driver, Guangzhou City, China.
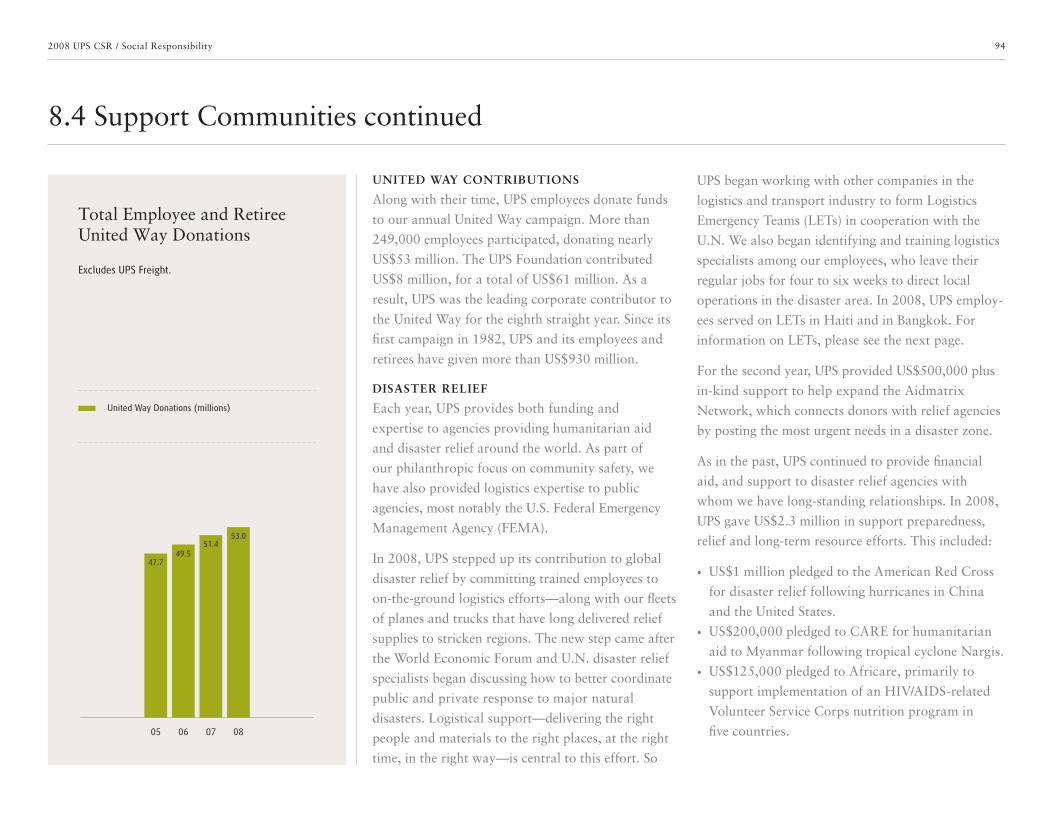
94
8.4 Support Communities continued
2008 UPS CSR / Social Responsibility
UNITED WAY CONTRIBUTIONS
Along with their time, UPS employees donate funds
to our annual United Way campaign. More than
249,000 employees participated, donating nearly
US$53 million. The UPS Foundation contributed
US$8 million, for a total of US$61 million. As a
result, UPS was the leading corporate contributor to
the United Way for the eighth straight year. Since its
first campaign in 1982, UPS and its employees and
retirees have given more than US$930 million.
DISASTER RELIEF
Each year, UPS provides both funding and
expertise to agencies providing humanitarian aid
and disaster relief around the world. As part of
our philanthropic focus on community safety, we
have also provided logistics expertise to public
agencies, most notably the U.S. Federal Emergency
Management Agency (FEMA).
In 2008, UPS stepped up its contribution to global
disaster relief by committing trained employees to
on-the-ground logistics efforts —along with our fleets
of planes and trucks that have long delivered relief
supplies to stricken regions. The new step came after
the World Economic Forum and U.N. disaster relief
specialists began discussing how to better coordinate
public and private response to major natural
disasters. Logistical support—delivering the right
people and materials to the right places, at the right
time, in the right way—is central to this effort. So
UPS began working with other companies in the
logistics and transport industry to form Logistics
Emergency Teams (LETs) in cooperation with the
U.N. We also began identifying and training logistics
specialists among our employees, who leave their
regular jobs for four to six weeks to direct local
operations in the disaster area. In 2008, UPS employ-
ees served on LETs in Haiti and in Bangkok. For
information on LETs, please see the next page.
For the second year, UPS provided US$500,000 plus
in-kind support to help expand the Aidmatrix
Network, which connects donors with relief agencies
by posting the most urgent needs in a disaster zone.
As in the past, UPS continued to provide financial
aid, and support to disaster relief agencies with
whom we have long-standing relationships. In 2008,
UPS gave US$2.3 million in support preparedness,
relief and long-term resource efforts. This included:
• US$1 million pledged to the American Red Cross
for disaster relief following hurricanes in China
and the United States.
• US$200,000 pledged to CARE for humanitarian
aid to Myanmar following tropical cyclone Nargis.
• US$125,000 pledged to Africare, primarily to
support implementation of an HIV/AIDS-related
Volunteer Service Corps nutrition program in
five countries.
Total Employee and Retiree United Way Donations
Excludes UPS Freight.
05 06 07 08
47.749.5
51.453.0
United Way Donations (millions)

95
8.4 Support Communities continued
2008 UPS CSR / Social Responsibility
My LETs assignment in Haiti was eye-opening and will stay with me forever.
It was a learning experience, not only regarding the logistics but also the human
factors as well. I learned to be empathetic with people less fortunate than I—
more compassionate with others and appreciative for what I have and what
I have achieved.
There are so many things we take for granted in the United States, which these
people have never had the good fortune to experience. I showered with soap and
water on a daily basis, but many Haitian people don’t even have running water.
I was able to get into clean clothing yet many children in Haiti have never had a
new pair of shoes. Despite the conditions after the hurricanes in 2008, I witnessed
children walking to school in clean pressed uniforms and a street vendor selling
vegetables to his customer with a glimmer of hope in his eye that foresees
better days ahead. Even in a state of despair, the Haitian people are proud and
welcoming and have unlimited gratitude for the assistance offered to them.
During my LETs assignment I met people from all over the world. We work for
competing companies and many different organizations, and come from different
places, cultures and backgrounds. Yet, we have many things in common. We
have a similar sense of humor. We feel it when we see a child who is sick or in
need. And when we join together to help our brothers and sisters in need, we
become united as one.
Before the tsunami in 2004, logistics companies were contributing to disaster
relief by working with individual agencies on a bilateral basis. After the tsunami,
it became clear that the world needed a more coordinated approach to massive
delivery of humanitarian aid. The World Economic Forum is a multi-stakeholder
platform for bringing organizations together to address challenges like this, and
we initiated a discussion in 2005 with private companies, non-governmental
organizations, and the United Nations.
The result of that dialog has been far-reaching. Now the U.N. Office of Coordination
of Humanitarian Assistance employs a “cluster process” that organizes all the
parties, public and private, which are providing similar kinds of disaster relief,
whether it is food aid, medical help, shelter or communications. Each cluster
makes sure it is meeting the right needs at the right time using the organizations
with the right capabilities.
The logistics cluster has been impressive in that the companies had a clear view
of how to cooperate, and they put it into action. Their Logistics Emergency Teams
(LETs) have already responded around the world, and other clusters are modeling
their success. As one of the original participants, UPS has engaged in a multi-year
process, identified and trained people, and committed resources on the ground in
inhospitable environments—including places that do not represent big commercial
markets for them. At the World Economic Forum, we consider this a progressive
approach, the kind that supports our belief that companies are here to do good.
John VeraShruti MehrotraHealth and Safety Manager, Americas Region, UPSAssociate Director, World Economic Forum
UPS: Logistics Emergency TeamsStakeholder: Logistics Emergency Teams
96
9.0 Global Reporting Initiative (GRI)
2008 UPS CSR
The Global Reporting Initiative (GRI-G3) serves as the foundation for compiling the UPS Corporate Sustainability Report. The GRI helps us to develop key performance indicators relevant to our business.
The 2008 report is based on the third generation of Global Reporting Initiative (GRI) guidelines known as GRI-G3. The GRI is an independent institution that provides a credible framework for sustainability reporting.
We believe that our 2008 reporting qualifies for the GRI scope “B” application level requirements. Last year, we made a mistake when completing the GRI-G3 Index. We met the requirements but inadvertently did not record disclosure in two required categories—human rights and product responsibility. This has been corrected in 2008.
9.1 GRI-G3 Index
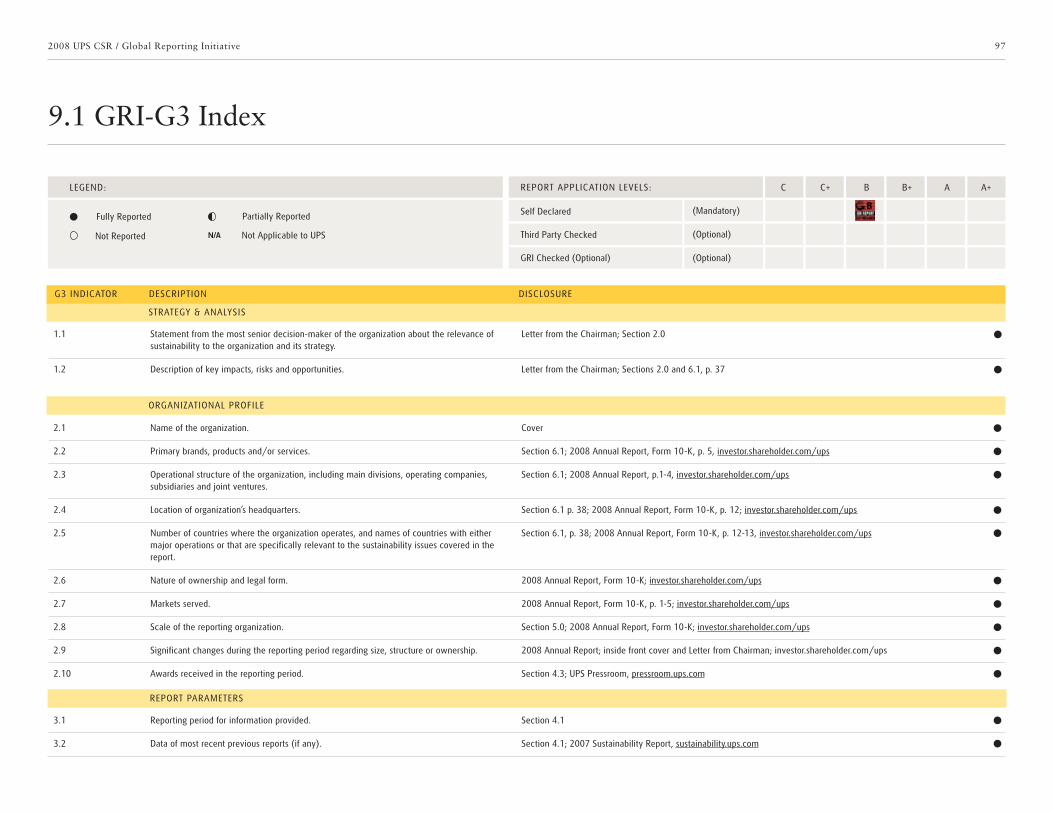
97
9.1 GRI-G3 Index
2008 UPS CSR / Global Reporting Initiative
Fully Reported
LEGEND:
N/A
1.1 Statement from the most senior decision-maker of the organization about the relevance of sustainability to the organization and its strategy.
Letter from the Chairman; Section 2.0
1.2 Description of key impacts, risks and opportunities. Letter from the Chairman; Sections 2.0 and 6.1, p. 37
2.1 Name of the organization. Cover
2.2 Primary brands, products and/or services. Section 6.1; 2008 Annual Report, Form 10-K, p. 5, investor.shareholder.com/ups
2.3 Operational structure of the organization, including main divisions, operating companies, subsidiaries and joint ventures.
Section 6.1; 2008 Annual Report, p.1-4, investor.shareholder.com/ups
2.4 Location of organization’s headquarters. Section 6.1 p. 38; 2008 Annual Report, Form 10-K, p. 12; investor.shareholder.com/ups
2.5 Number of countries where the organization operates, and names of countries with either major operations or that are specifically relevant to the sustainability issues covered in the report.
Section 6.1, p. 38; 2008 Annual Report, Form 10-K, p. 12-13, investor.shareholder.com/ups
2.6 Nature of ownership and legal form. 2008 Annual Report, Form 10-K; investor.shareholder.com/ups
2.7 Markets served. 2008 Annual Report, Form 10-K, p. 1-5; investor.shareholder.com/ups
2.8 Scale of the reporting organization. Section 5.0; 2008 Annual Report, Form 10-K; investor.shareholder.com/ups
2.9 Significant changes during the reporting period regarding size, structure or ownership. 2008 Annual Report; inside front cover and Letter from Chairman; investor.shareholder.com/ups
2.10 Awards received in the reporting period. Section 4.3; UPS Pressroom, pressroom.ups.com
3.1 Reporting period for information provided. Section 4.1
3.2 Data of most recent previous reports (if any). Section 4.1; 2007 Sustainability Report, sustainability.ups.com
STRATEGY & ANALYSIS
G3 INDICATOR DESCRIPTION DISCLOSURE
ORGANIZATIONAL PROFILE
REPORT PARAMETERS
Self Declared (Mandatory)
(Optional)
(Optional)
Third Party Checked
GRI Checked (Optional)
C C+ B B+ A A+
Partially Reported
Not Reported Not Applicable to UPS
REPORT APPLICATION LEVELS:
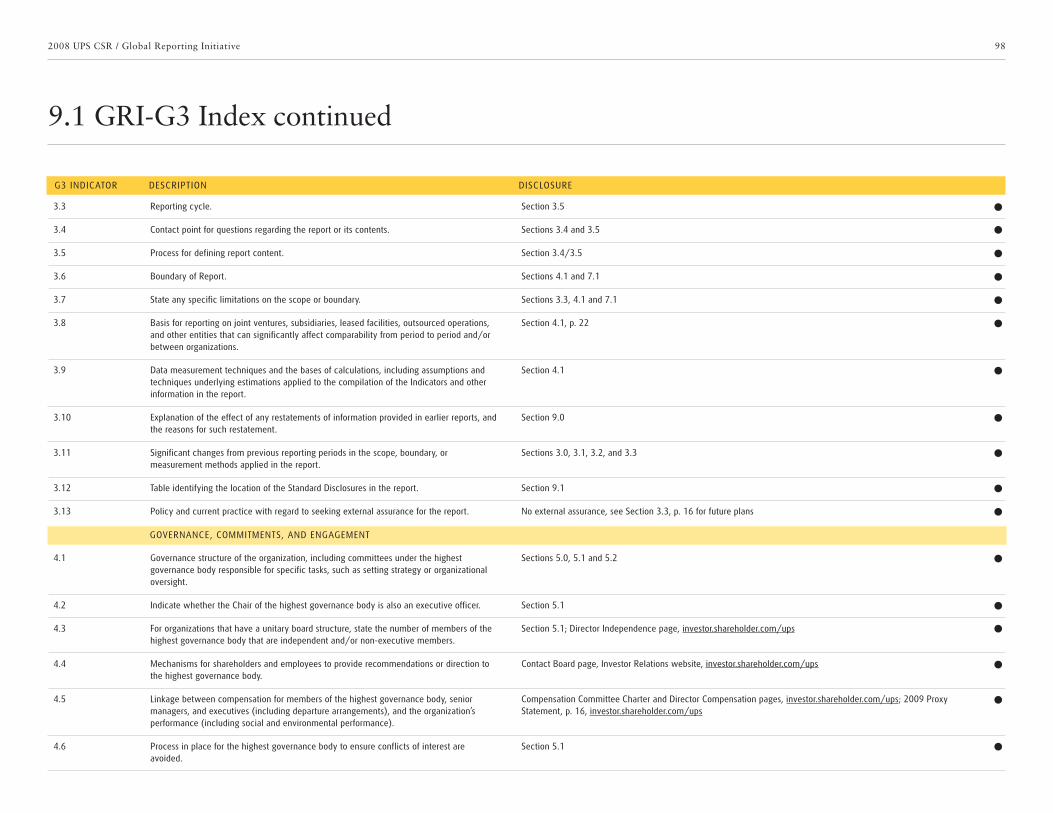
982008 UPS CSR / Global Reporting Initiative
9.1 GRI-G3 Index continued
3.3 Reporting cycle. Section 3.5
3.4 Contact point for questions regarding the report or its contents. Sections 3.4 and 3.5
3.5 Process for defining report content. Section 3.4/3.5
3.6 Boundary of Report. Sections 4.1 and 7.1
3.7 State any specific limitations on the scope or boundary. Sections 3.3, 4.1 and 7.1
3.8 Basis for reporting on joint ventures, subsidiaries, leased facilities, outsourced operations, and other entities that can significantly affect comparability from period to period and/or between organizations.
Section 4.1, p. 22
3.9 Data measurement techniques and the bases of calculations, including assumptions and techniques underlying estimations applied to the compilation of the Indicators and other information in the report.
Section 4.1
3.10 Explanation of the effect of any restatements of information provided in earlier reports, and the reasons for such restatement.
Section 9.0
3.11 Significant changes from previous reporting periods in the scope, boundary, or measurement methods applied in the report.
Sections 3.0, 3.1, 3.2, and 3.3
3.12 Table identifying the location of the Standard Disclosures in the report. Section 9.1
3.13 Policy and current practice with regard to seeking external assurance for the report. No external assurance, see Section 3.3, p. 16 for future plans
4.1 Governance structure of the organization, including committees under the highest governance body responsible for specific tasks, such as setting strategy or organizational oversight.
Sections 5.0, 5.1 and 5.2
4.2 Indicate whether the Chair of the highest governance body is also an executive officer. Section 5.1
4.3 For organizations that have a unitary board structure, state the number of members of the highest governance body that are independent and/or non-executive members.
Section 5.1; Director Independence page, investor.shareholder.com/ups
4.4 Mechanisms for shareholders and employees to provide recommendations or direction to the highest governance body.
Contact Board page, Investor Relations website, investor.shareholder.com/ups
4.5 Linkage between compensation for members of the highest governance body, senior managers, and executives (including departure arrangements), and the organization’s performance (including social and environmental performance).
Compensation Committee Charter and Director Compensation pages, investor.shareholder.com/ups; 2009 Proxy Statement, p. 16, investor.shareholder.com/ups
4.6 Process in place for the highest governance body to ensure conflicts of interest are avoided.
Section 5.1
G3 INDICATOR DESCRIPTION DISCLOSURE
GOVERNANCE, COMMITMENTS, AND ENGAGEMENT
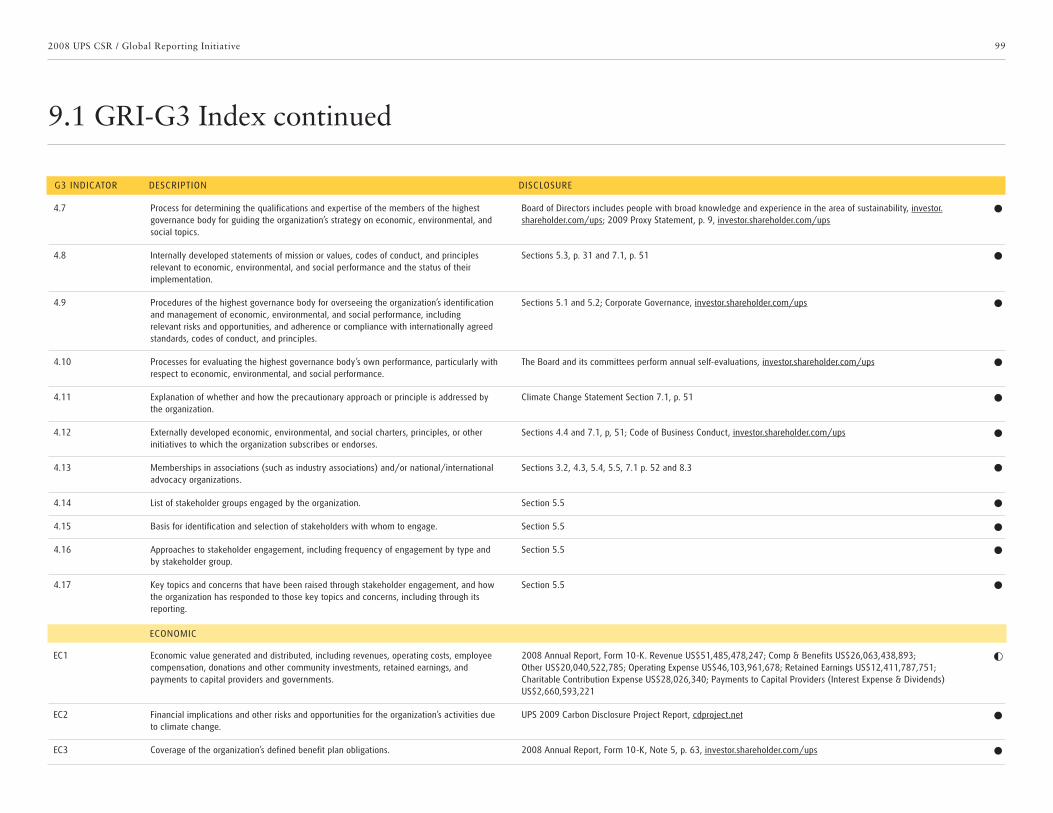
99
9.1 GRI-G3 Index continued
2008 UPS CSR / Global Reporting Initiative
4.7 Process for determining the qualifications and expertise of the members of the highest governance body for guiding the organization’s strategy on economic, environmental, and social topics.
Board of Directors includes people with broad knowledge and experience in the area of sustainability, investor.shareholder.com/ups; 2009 Proxy Statement, p. 9, investor.shareholder.com/ups
4.8 Internally developed statements of mission or values, codes of conduct, and principles relevant to economic, environmental, and social performance and the status of their implementation.
Sections 5.3, p. 31 and 7.1, p. 51
4.9 Procedures of the highest governance body for overseeing the organization’s identification and management of economic, environmental, and social performance, including relevant risks and opportunities, and adherence or compliance with internationally agreed standards, codes of conduct, and principles.
Sections 5.1 and 5.2; Corporate Governance, investor.shareholder.com/ups
4.10 Processes for evaluating the highest governance body’s own performance, particularly with respect to economic, environmental, and social performance.
The Board and its committees perform annual self-evaluations, investor.shareholder.com/ups
4.11 Explanation of whether and how the precautionary approach or principle is addressed by the organization.
Climate Change Statement Section 7.1, p. 51
4.12 Externally developed economic, environmental, and social charters, principles, or other initiatives to which the organization subscribes or endorses.
Sections 4.4 and 7.1, p, 51; Code of Business Conduct, investor.shareholder.com/ups
4.13 Memberships in associations (such as industry associations) and/or national/international advocacy organizations.
Sections 3.2, 4.3, 5.4, 5.5, 7.1 p. 52 and 8.3
4.14 List of stakeholder groups engaged by the organization. Section 5.5
4.15 Basis for identification and selection of stakeholders with whom to engage. Section 5.5
4.16 Approaches to stakeholder engagement, including frequency of engagement by type and by stakeholder group.
Section 5.5
4.17 Key topics and concerns that have been raised through stakeholder engagement, and how the organization has responded to those key topics and concerns, including through its reporting.
Section 5.5
EC1 Economic value generated and distributed, including revenues, operating costs, employee compensation, donations and other community investments, retained earnings, and payments to capital providers and governments.
2008 Annual Report, Form 10-K. Revenue US$51,485,478,247; Comp & Benefits US$26,063,438,893; Other US$20,040,522,785; Operating Expense US$46,103,961,678; Retained Earnings US$12,411,787,751; Charitable Contribution Expense US$28,026,340; Payments to Capital Providers (Interest Expense & Dividends) US$2,660,593,221
EC2 Financial implications and other risks and opportunities for the organization’s activities due to climate change.
UPS 2009 Carbon Disclosure Project Report, cdproject.net
EC3 Coverage of the organization’s defined benefit plan obligations. 2008 Annual Report, Form 10-K, Note 5, p. 63, investor.shareholder.com/ups
G3 INDICATOR DESCRIPTION DISCLOSURE
ECONOMIC

100
9.1 GRI-G3 Index continued
2008 UPS CSR / Global Reporting Initiative
EC4 Significant financial assistance received from government. Not Reported
EC5 Range ratios of standard entry level wage compared to local minimum wage at significant locations of operations.
Not Reported
EC6 Policy, practices and proportion of spending on locally based suppliers at significant locations of operation.
Our emphasis is on diversity spend rather than local. We do, however, track local, which is approximately 7-12 percent of total spend.
EC7 Procedures for local hiring and proportion of senior management hired from the local community at significant locations of operations.
We recruit, train and develop local management people to lead our operations. In 2008, out of 72,400 employees working in operations outside the U.S., fewer than 265 were foreign expatriates working in host countries, including only 65 U.S. expats. A majority of country leadership positions are held by managers hired locally.
EC8 Development and impact of infrastructure investments and services provided primarily for public benefit through commercial, in kind or pro bono engagement.
Not reported
EC9 Understanding and describing significant indirect economic impacts, including the extent of impacts.
Section 6.0-6.8
EN1 Materials used by weight or volume. 41,797 U.S. tons of packaging material globally
EN2 Percentage of materials used that are recycled input materials. 93% of the 41,797 U.S. tons contains recycled materials
EN3 Direct energy consumption by primary energy source. Section 7.2, p. 53-58
EN4 Indirect energy consumption by primary energy source. Section 7.2, p. 53-58
EN5 Energy saved due to conservation and efficiency improvements. Section 7.2, p. 53-58
EN6 Initiatives to provide energy-efficient or renewable energy-based products and services, and reductions in energy requirements as a result of these initiatives.
Sections 7.2, p. 53-58 and 7.4, p. 62-67
EN7 Initiatives to reduce indirect energy consumption and reductions achieved. Section 7.5, p. 68-70
EN8 Total water withdrawal by source. Section7.6, p. 72-74
EN9 Water sources significantly affected by withdrawal of water. Not Applicable
EN10 Percentage and total volume of water recycled and reused. Not Applicable
EN11 Location and size of land owned, leased, managed in or adjacent to, protected areas and areas of high biodiversity value outside protected areas.
Not reported
EN12 Description of significant impacts of activities, products and services on biodiversity in protected areas and areas of high biodiversity value outside protected areas.
Not reported
EN13 Habitats protected or restored. Not reported
G3 INDICATOR DESCRIPTION DISCLOSURE
ENVIRONMENTAL
N/A
N/A
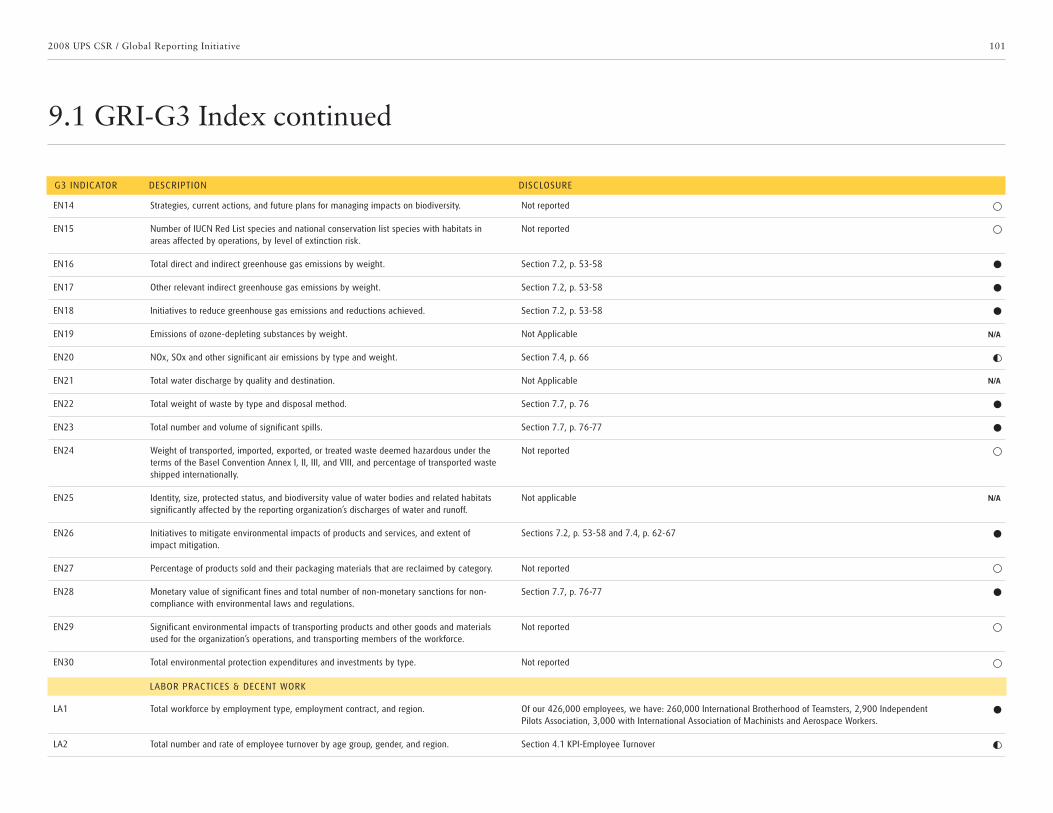
101
9.1 GRI-G3 Index continued
2008 UPS CSR / Global Reporting Initiative
EN14 Strategies, current actions, and future plans for managing impacts on biodiversity. Not reported
EN15 Number of IUCN Red List species and national conservation list species with habitats in areas affected by operations, by level of extinction risk.
Not reported
EN16 Total direct and indirect greenhouse gas emissions by weight. Section 7.2, p. 53-58
EN17 Other relevant indirect greenhouse gas emissions by weight. Section 7.2, p. 53-58
EN18 Initiatives to reduce greenhouse gas emissions and reductions achieved. Section 7.2, p. 53-58
EN19 Emissions of ozone-depleting substances by weight. Not Applicable
EN20 NOx, SOx and other significant air emissions by type and weight. Section 7.4, p. 66
EN21 Total water discharge by quality and destination. Not Applicable
EN22 Total weight of waste by type and disposal method. Section 7.7, p. 76
EN23 Total number and volume of significant spills. Section 7.7, p. 76-77
EN24 Weight of transported, imported, exported, or treated waste deemed hazardous under the terms of the Basel Convention Annex I, II, III, and VIII, and percentage of transported waste shipped internationally.
Not reported
EN25 Identity, size, protected status, and biodiversity value of water bodies and related habitats significantly affected by the reporting organization’s discharges of water and runoff.
Not applicable
EN26 Initiatives to mitigate environmental impacts of products and services, and extent of impact mitigation.
Sections 7.2, p. 53-58 and 7.4, p. 62-67
EN27 Percentage of products sold and their packaging materials that are reclaimed by category. Not reported
EN28 Monetary value of significant fines and total number of non-monetary sanctions for non-compliance with environmental laws and regulations.
Section 7.7, p. 76-77
EN29 Significant environmental impacts of transporting products and other goods and materials used for the organization’s operations, and transporting members of the workforce.
Not reported
EN30 Total environmental protection expenditures and investments by type. Not reported
LA1 Total workforce by employment type, employment contract, and region. Of our 426,000 employees, we have: 260,000 International Brotherhood of Teamsters, 2,900 Independent Pilots Association, 3,000 with International Association of Machinists and Aerospace Workers.
LA2 Total number and rate of employee turnover by age group, gender, and region. Section 4.1 KPI-Employee Turnover
G3 INDICATOR DESCRIPTION DISCLOSURE
N/A
N/A
N/A
LABOR PRACTICES & DECENT WORK
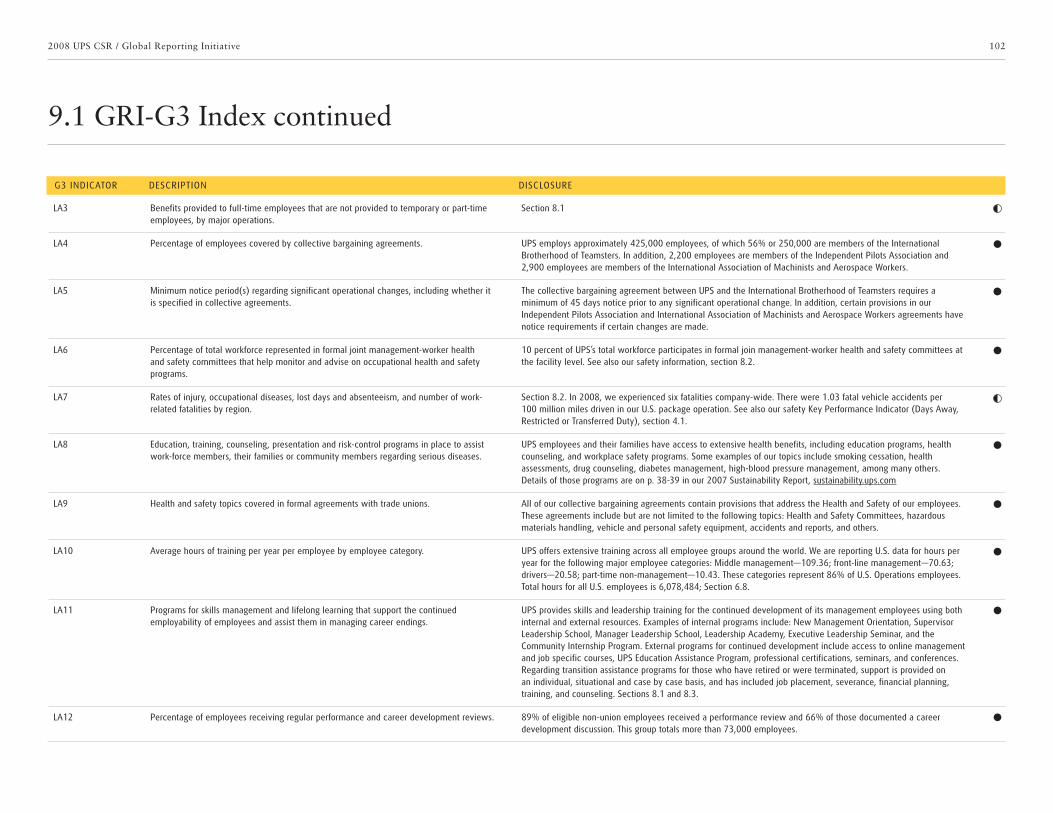
102
9.1 GRI-G3 Index continued
2008 UPS CSR / Global Reporting Initiative
LA3 Benefits provided to full-time employees that are not provided to temporary or part-time employees, by major operations.
Section 8.1
LA4 Percentage of employees covered by collective bargaining agreements. UPS employs approximately 425,000 employees, of which 56% or 250,000 are members of the International Brotherhood of Teamsters. In addition, 2,200 employees are members of the Independent Pilots Association and 2,900 employees are members of the International Association of Machinists and Aerospace Workers.
LA5 Minimum notice period(s) regarding significant operational changes, including whether it is specified in collective agreements.
The collective bargaining agreement between UPS and the International Brotherhood of Teamsters requires a minimum of 45 days notice prior to any significant operational change. In addition, certain provisions in our Independent Pilots Association and International Association of Machinists and Aerospace Workers agreements have notice requirements if certain changes are made.
LA6 Percentage of total workforce represented in formal joint management-worker health and safety committees that help monitor and advise on occupational health and safety programs.
10 percent of UPS’s total workforce participates in formal join management-worker health and safety committees at the facility level. See also our safety information, section 8.2.
LA7 Rates of injury, occupational diseases, lost days and absenteeism, and number of work-related fatalities by region.
Section 8.2. In 2008, we experienced six fatalities company-wide. There were 1.03 fatal vehicle accidents per 100 million miles driven in our U.S. package operation. See also our safety Key Performance Indicator (Days Away, Restricted or Transferred Duty), section 4.1.
LA8 Education, training, counseling, presentation and risk-control programs in place to assist work-force members, their families or community members regarding serious diseases.
UPS employees and their families have access to extensive health benefits, including education programs, health counseling, and workplace safety programs. Some examples of our topics include smoking cessation, health assessments, drug counseling, diabetes management, high-blood pressure management, among many others. Details of those programs are on p. 38-39 in our 2007 Sustainability Report, sustainability.ups.com
LA9 Health and safety topics covered in formal agreements with trade unions. All of our collective bargaining agreements contain provisions that address the Health and Safety of our employees. These agreements include but are not limited to the following topics: Health and Safety Committees, hazardous materials handling, vehicle and personal safety equipment, accidents and reports, and others.
LA10 Average hours of training per year per employee by employee category. UPS offers extensive training across all employee groups around the world. We are reporting U.S. data for hours per year for the following major employee categories: Middle management—109.36; front-line management—70.63; drivers—20.58; part-time non-management—10.43. These categories represent 86% of U.S. Operations employees. Total hours for all U.S. employees is 6,078,484; Section 6.8.
LA11 Programs for skills management and lifelong learning that support the continued employability of employees and assist them in managing career endings.
UPS provides skills and leadership training for the continued development of its management employees using both internal and external resources. Examples of internal programs include: New Management Orientation, Supervisor Leadership School, Manager Leadership School, Leadership Academy, Executive Leadership Seminar, and the Community Internship Program. External programs for continued development include access to online management and job specific courses, UPS Education Assistance Program, professional certifications, seminars, and conferences. Regarding transition assistance programs for those who have retired or were terminated, support is provided on an individual, situational and case by case basis, and has included job placement, severance, financial planning, training, and counseling. Sections 8.1 and 8.3.
LA12 Percentage of employees receiving regular performance and career development reviews. 89% of eligible non-union employees received a performance review and 66% of those documented a career development discussion. This group totals more than 73,000 employees.
G3 INDICATOR DESCRIPTION DISCLOSURE
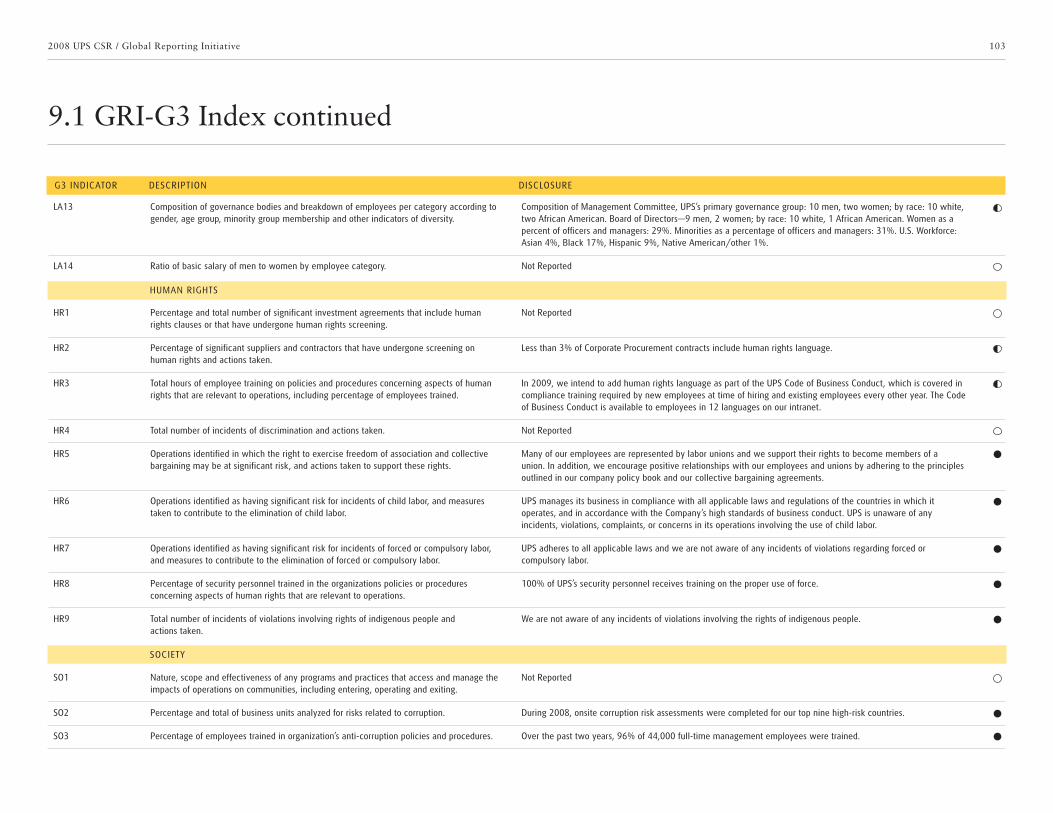
103
9.1 GRI-G3 Index continued
2008 UPS CSR / Global Reporting Initiative
LA13 Composition of governance bodies and breakdown of employees per category according to gender, age group, minority group membership and other indicators of diversity.
Composition of Management Committee, UPS’s primary governance group: 10 men, two women; by race: 10 white, two African American. Board of Directors—9 men, 2 women; by race: 10 white, 1 African American. Women as a percent of officers and managers: 29%. Minorities as a percentage of officers and managers: 31%. U.S. Workforce: Asian 4%, Black 17%, Hispanic 9%, Native American/other 1%.
LA14 Ratio of basic salary of men to women by employee category. Not Reported
HR1 Percentage and total number of significant investment agreements that include human rights clauses or that have undergone human rights screening.
Not Reported
HR2 Percentage of significant suppliers and contractors that have undergone screening on human rights and actions taken.
Less than 3% of Corporate Procurement contracts include human rights language.
HR3 Total hours of employee training on policies and procedures concerning aspects of human rights that are relevant to operations, including percentage of employees trained.
In 2009, we intend to add human rights language as part of the UPS Code of Business Conduct, which is covered in compliance training required by new employees at time of hiring and existing employees every other year. The Code of Business Conduct is available to employees in 12 languages on our intranet.
HR4 Total number of incidents of discrimination and actions taken. Not Reported
HR5 Operations identified in which the right to exercise freedom of association and collective bargaining may be at significant risk, and actions taken to support these rights.
Many of our employees are represented by labor unions and we support their rights to become members of a union. In addition, we encourage positive relationships with our employees and unions by adhering to the principles outlined in our company policy book and our collective bargaining agreements.
HR6 Operations identified as having significant risk for incidents of child labor, and measures taken to contribute to the elimination of child labor.
UPS manages its business in compliance with all applicable laws and regulations of the countries in which it operates, and in accordance with the Company’s high standards of business conduct. UPS is unaware of any incidents, violations, complaints, or concerns in its operations involving the use of child labor.
HR7 Operations identified as having significant risk for incidents of forced or compulsory labor, and measures to contribute to the elimination of forced or compulsory labor.
UPS adheres to all applicable laws and we are not aware of any incidents of violations regarding forced or compulsory labor.
HR8 Percentage of security personnel trained in the organizations policies or procedures concerning aspects of human rights that are relevant to operations.
100% of UPS’s security personnel receives training on the proper use of force.
HR9 Total number of incidents of violations involving rights of indigenous people and actions taken.
We are not aware of any incidents of violations involving the rights of indigenous people.
SO1 Nature, scope and effectiveness of any programs and practices that access and manage the impacts of operations on communities, including entering, operating and exiting.
Not Reported
SO2 Percentage and total of business units analyzed for risks related to corruption. During 2008, onsite corruption risk assessments were completed for our top nine high-risk countries.
SO3 Percentage of employees trained in organization’s anti-corruption policies and procedures. Over the past two years, 96% of 44,000 full-time management employees were trained.
G3 INDICATOR DESCRIPTION DISCLOSURE
SOCIETY
HUMAN RIGHTS

104
9.1 GRI-G3 Index continued
2008 UPS CSR / Global Reporting Initiative
SO4 Actions taken in response to incidents of corruption. We comply with all applicable laws, rules and regulations, in all countries where we operate. The UPS Policy Book and The Code of Business Conduct have policies and procedures which prohibit UPS employees, and the people acting on our behalf, from engaging in unlawful activities, including violations of the U.S. Foreign Corrupt Practices Act and other applicable anti-bribery laws, rules and regulations in various countries.
SO5 Public policy positions and participation in public policy development and lobbying. Section 5.4
SO6 Total value of financial and in-kind contributions to political parties, politicians and related institutions by country.
In the United States, UPS’s Political Action Committee donations to U.S. federal, state and local candidates totaled US$2.4 million.
SO7 Total number of legal actions for anti-competitive behavior, anti trust, and monopoly practices and their outcomes.
Not Reported
SO8 Monetary value of significant fines and total number of non-monetary sanctions for non-compliance with laws and regulations.
Not Reported
PR1 Life cycle stages in which health and safety impacts of products and services are assessed for improvement, and percentage of significant products and services categories subject to such procedures.
Not Reported
PR2 Total number of incidents of non-compliance with regulations and voluntary codes concerning health and safety impacts of products and services during their lifecycle by type of outcomes.
Not Reported
PR3 Type of product and service information required by procedures, and percentage of significant products and services subject to such information requirements.
Not Reported
PR4 Total number of incidents of non-compliance with regulations and voluntary codes concerning product and service information and labeling by type of outcomes.
Not Reported
PR5 Practices related to customer satisfaction, including results of surveys measuring customer satisfaction.
UPS extensively monitors customer comments via internal and external channels. An important tool is an independent survey that collects comments from more than 3,000 shipper interviews each year. And focus groups are held throughout the year.
PR6 Programs for adherence to laws, standards and voluntary codes related to marketing communications, including advertising, promotion and sponsorship.
All communications materials, including advertising enterprise-wide, goes through a legal review to determine compliance with all pertinent laws and regulations.
PR7 Total number of incidents of non-compliance with regulations and voluntary codes concerning marketing communications including advertising, promotion and sponsorship by type of outcome.
Not Reported
PR8 Total number of substantiated complaints regarding breaches of customer privacy and loses of customer data.
Not Reported
PR9 Monetary value of significance fines for non-compliance with laws and regulations concerning the provision and use of products and services.
2008 Annual Report, Form 10-K, pages 14 and 37, investors.shareholders.com/ups
G3 INDICATOR DESCRIPTION DISCLOSURE
PRODUCT RESPONSIBILITY