Embed Size (px)
Citation preview
Upper Oldman River Drainage Angler Survey, 2004
CONSERVATIONCONSERVATION
REPORT REPORT
SERIESSERIES

CONSERVATIONCONSERVATION
REPORT REPORT
SERIESSERIES 25% Post Consumer Fibre
When separated, both the binding and paper in this document are recyclable
The Alberta Conservation Association is a Delegated Administrative Organization under Alberta’s Wildlife Act.
Upper Oldman River Drainage Angler Survey, 2004
Crystal Speigl1 and Brad. J. Hurkett2 1Alberta Conservation Association
P.O. Box 1139 Provincial Building
12501 – 20 Ave, Blairmore, Alberta T0K 0E0
2Alberta Conservation Association Bag 3014 YPM Place
530‐8 Street S Lethbridge, Alberta
T1J 2J8

Report Series Co‐editors PETER AKU KELLEY J. KISSNER Alberta Conservation Association 50 Tuscany Meadows Crescent NW #101, 9 Chippewa Rd Calgary, AB T3L 2T9 Sherwood Park, AB T8A 6J7 Conservation Report Series Type Data, Technical ISBN printed: 978‐0‐7785‐7703‐4 ISBN online: 978‐0‐7785‐7704‐1 Publication No.: T/193 Disclaimer: This document is an independent report prepared by the Alberta Conservation Association. The authors are solely responsible for the interpretations of data and statements made within this report. Reproduction and Availability: This report and its contents may be reproduced in whole, or in part, provided that this title page is included with such reproduction and/or appropriate acknowledgements are provided to the authors and sponsors of this project.
Suggested citation: Spiegl, C., and B.J. Hurkett. 2005. Upper Oldman River drainage angler survey, 2004.
Data report, D‐2005‐036, produced by Alberta Conservation Association, Blairmore and Lethbridge, Alberta. 23 pp. + App.
Cover photo credit: David Fairless Digital copies of conservation reports can be obtained from: Alberta Conservation Association #101, 9 Chippewa Rd Sherwood Park, AB T8A 6J7 Toll Free: 1‐877‐969‐9091 Tel: (780) 410‐1998 Fax: (780) 464‐0990 Email: info@ab‐conservation.com Website: www.ab‐conservation.com
i
ii
EXECUTIVE SUMMARY
A roving angler survey was conducted from 16 June to 6 September 2004 in the Upper
Oldman River (UOM) drainage on Dutch Creek, Racehorse Creek, Upper Oldman
River and the Livingstone River. The survey was initiated to assess angling pressure,
angling effort, catch rate and angler satisfaction. These data were compared with data
collected from previous angling surveys in the UOM drainage between 1988 and 1992
to assist resource managers in monitoring the status of the cutthroat trout fishery.
A total of 2,941 anglers fished a total of 8,468 h in the UOM drainage and reported a
combined catch of 9,560 cutthroat trout, 93 rainbow trout, 84 bull trout and 60
mountain whitefish. Of the 9,560 cutthroat, 2,531 (26%) were legal‐size (i.e., total length
≥ 30 cm), two‐thirds of these were captured in the Livingstone River. The catch‐per‐
unit‐effort (CPUE) for cutthroat trout across the entire study area averaged 1.13 fish/h.
There was no clear temporal pattern in CPUE. However, CPUE on the Livingstone
River was higher in 2004 than in 1992, but the reverse pattern occurred on Dutch Creek
over the same period.
In 2004, angling pressure was lowest on Dutch Creek and Racehorse Creek and highest
on the Livingstone River. Overall, angling pressure was higher in 2004 than in
previous surveys in 1988 and 1992. In addition, angling pressure shifted from the
Upper Oldman River during the 1988 to 1992 surveys to the Livingstone River in 2004.
The shift in popularity toward the Livingstone River was likely due to the increased
size and number of cutthroat trout in this system, presumably related to the
implementation of a catch‐and‐release regulation on the Livingstone River in 1995. In
contrast to the Livingstone River, catch rates decreased on the Upper Oldman River
and Dutch Creek from 1992 to 2004, and anglers captured fewer and smaller cutthroat
trout in these rivers compared to the Livingstone River. Despite the overall increase in
fishing pressure, the majority of anglers felt that the size and number of cutthroat trout
caught in the drainage did not change between 1992 and 2004.
Of the 2,941 anglers interviewed during the study, the majority (95%) were residents of
Alberta, 3% were from out of province and 2% were from the United States. Fly‐fishing
was the most common angling method and provided the greatest overall CPUE.
ACKNOWLEDGEMENTS
A number of individuals and organizations contributed to the angler survey. We thank
Nathan Shaw, angler survey technician, for assisting with the angler survey and Mike
Jokinen, Trevor Council and Daryl Wig for assisting with survey preparations. Alberta
Public Lands and Forest Division, Gap Base, allowed us to establish a field camp at the
fire base and also provided access to facilities. Devon Canada Corporation funded a
portion of the angler survey. Trevor Council, Peter Aku and Daryl Wig edited earlier
versions of this report.
iii
iv
TABLE OF CONTENTS
EXECUTIVE SUMMARY.............................................................................................................ii
ACKNOWLEDGEMENTS......................................................................................................... iii
TABLE OF CONTENTS ..............................................................................................................iv
LIST OF FIGURES.........................................................................................................................v
LIST OF TABLES..........................................................................................................................vi
LIST OF APPENDICES ............................................................................................................. vii
1.0 INTRODUCTION ............................................................................................................1 1.1 Background information ............................................................................................1 1.2 Study rationale .............................................................................................................2 1.3 Study objectives ...........................................................................................................3
2.0 STUDY AREA...................................................................................................................3
3.0 METHODS ........................................................................................................................5 3.1 General sampling methods ........................................................................................5
4.0 RESULTS ...........................................................................................................................8 4.1 Catch summary............................................................................................................8 4.2 Angler effort ...............................................................................................................10 4.3 Catch‐per‐unit‐effort .................................................................................................13 4.4 Angler success............................................................................................................16 4.5 Recreational harvest ..................................................................................................18 4.6 Angling method.........................................................................................................18 4.7 Angler residency........................................................................................................18 4.8 Angler opinion questionnaire..................................................................................20 4.9 Summary.....................................................................................................................20
5.0 LITERATURE CITED ....................................................................................................23
6.0 APPENDICES.................................................................................................................24

LIST OF FIGURES
Figure 1. Location of the Upper Oldman River drainage in southern Alberta.. ............4
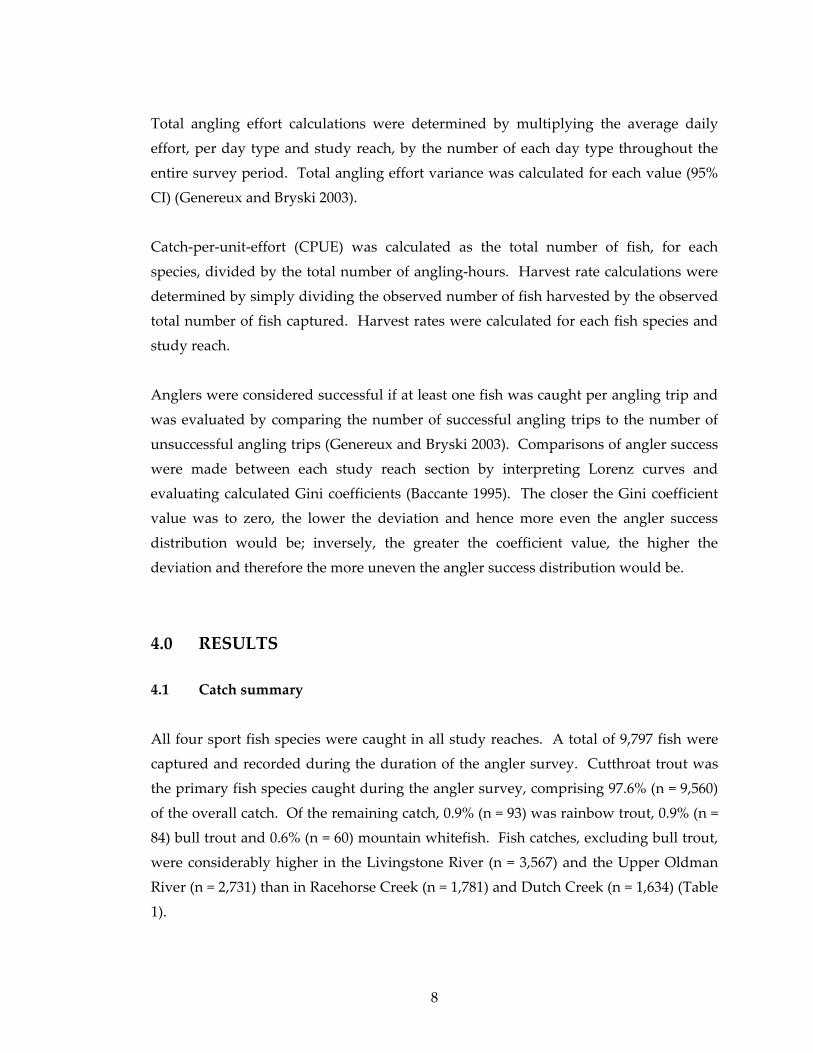
Figure 2. Estimated number of anglers in the Upper Oldman River drainage during the past four angler surveys................................................................................12
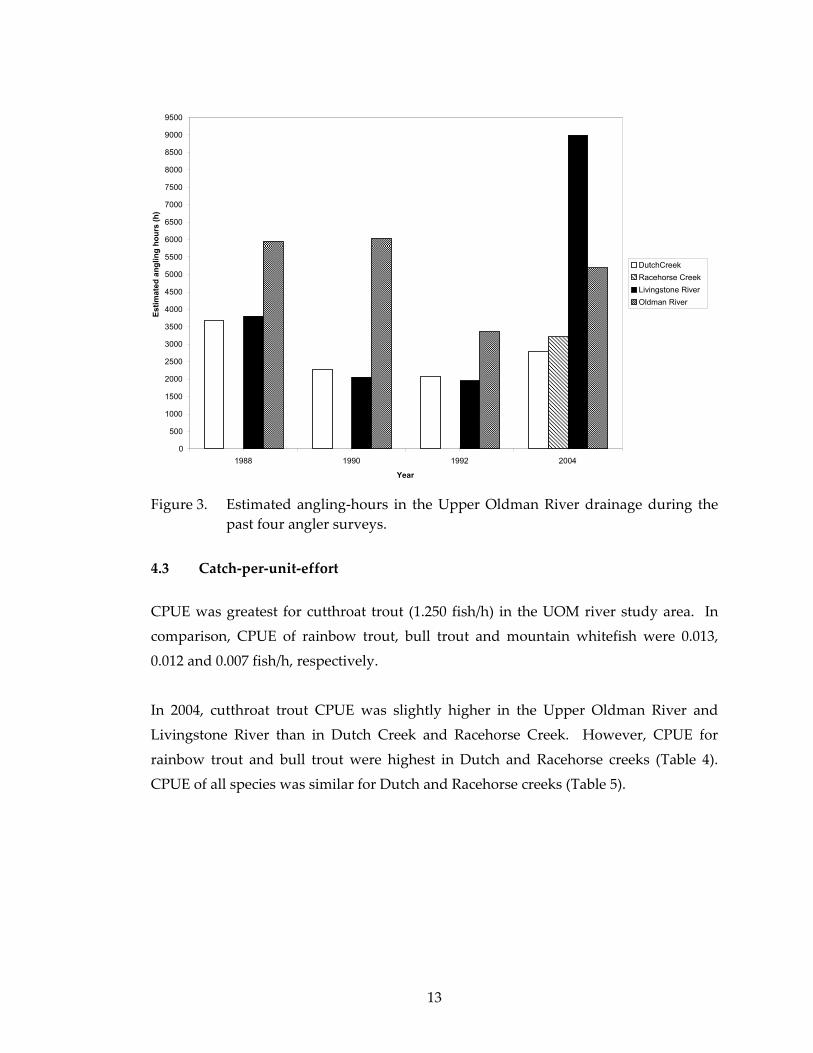
Figure 3. Estimated angling‐hours in the Upper Oldman River drainage during the past four angler surveys. .....................................................................................13
Figure 4. Catch‐per‐unit‐effort (CPUE) of cutthroat trout in the Upper Oldman River drainage during the past four angler surveys. .................................................15
Figure 5. Distribution of fish catch among anglers in Dutch and Racehorse creeks, Livingstone River, and Upper Oldman River, 2004. .......................................17
Figure 6. Area of residence for anglers interviewed on Dutch Creek and Racehorse Creek. .....................................................................................................................19
Figure 7. Area of residence for anglers interviewed on the Livingstone River. ..........19
Figure 8. Area of residence for anglers interviewed on the Upper Oldman River. ....20
v
LIST OF TABLES
Table 1. Number of legal‐size sport fish captured during the Upper Oldman River drainage angler survey, 2004. ...............................................................................9
Table 2. Estimated total catch of sport fish in the Upper Oldman River drainage, 2004. ..........................................................................................................................9
Table 3. Observed and estimated angler effort in the Upper Oldman River drainage from 16 June to 6 September 2004. .....................................................................11
Table 4. Catch‐per‐unit‐effort of fish species caught in the Upper Oldman River drainage study area, 2004....................................................................................14
Table 5. Catch‐per‐unit‐effort of fish species caught in Dutch Creek and Racehorse Creek during the Upper Oldman River drainage angler study, 2004...........14
vi
LIST OF APPENDICES
Appendix 1. Upper Oldman River drainage fish species scientific names and species abbreviations. ................................................................................24
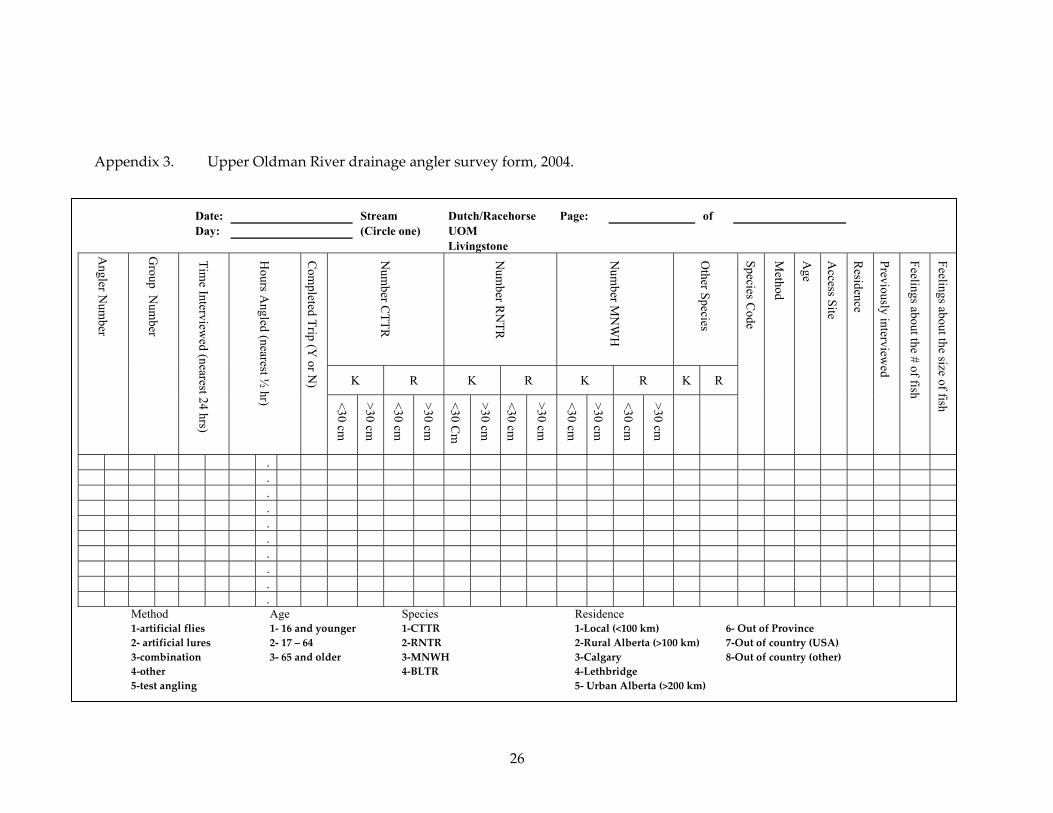
Appendix 2. Upper Oldman River drainage angler survey vehicle tally form, 2004........................................................................................................................25
Appendix 3. Upper Oldman River drainage angler survey form, 2004....................26
Appendix 4. Upper Oldman River drainage daily summary form, 2004. ................27
Appendix 5. Estimated Upper Oldman River drainage angler survey data across survey years ................................................................................................28
vii
1.0 INTRODUCTION
1.1 Background information
The Upper Oldman River (UOM) drainage is located in the southern region of the
eastern slopes of the Rocky Mountains and is recognized for its trout fishery by anglers
throughout North America (Byrne 1993). Cutthroat trout (Oncorhynchus clarkii) are the
predominant fish species and the most sought after sport fish inhabiting streams within
the UOM drainage (Byrne 1993). Bull trout (Salvelinus confluentus) and mountain
whitefish (Prosopium williamsoni) are two other native sport fish species occupying the
UOM drainage and are also targeted by anglers, but less sought after than cutthroat
trout. Rainbow trout (Oncorhynchus mykiss), also targeted by anglers, is the only non‐
native sport fish species within the UOM drainage and is known to hybridize with and
outcompete cutthroat trout (Nelson and Paetz 1992; D. Wig, pers. comm. 2004)
(Appendix 1).
The UOM drainage has become increasingly accessible to anglers due to industrial and
recreational development. High density road and trail networks have become
established throughout majority of the UOM drainage, primarily from timber
harvesting and oil and gas development. The increase in road development
coincidentally promotes public access to recreationists, including anglers, and therefore
heightens the pressure on the land base and drainage. Provincial recreational
campgrounds and random access campsites are also common throughout the UOM
drainage and have become established adjacent to major tributaries and mainstem
rivers increasing their accessibility to anglers. Increased angling pressure associated
with increased access has the potential to impact the trout fishery.
Fisheries managers practice adaptive fisheries management to account for increases in
angling pressure. Stream regulations are routinely adjusted to facilitate a sustainable
fishery. For example, in 1987, fishing regulations for all fish species, was changed from
alternate‐year‐stream‐closures to an imposition of size limits (Clements 1989; Byrne
1992, 1993). In 1995, a catch‐and‐release regulation for all fish species was
implemented on the Livingstone River and a province‐wide catch‐and‐release
regulation for bull trout was enforced (D. Wig, pers. comm. 2004). In 1998, the legal
1
harvestable size restriction for cutthroat trout and rainbow trout was increased from ≥
25 cm to ≥ 30 cm in the Upper Oldman River and its tributaries, but not in the
Livingstone River (Alberta Guide to Sportfishing Regulations 1998). Current angling
regulations permit a two trout (cutthroat and/or rainbow) ≥ 30 cm harvest limit and five
mountain whitefish ≥ 30 cm harvest limit throughout the entire UOM drainage
between 16 June and 31 August, excluding the Livingstone River and the Racehorse
Creek confluence to the GAP falls (Alberta Guide to Sportfishing Regulations 2004).
Catch‐and‐release regulations apply to all drainages in the UOM drainage between 1
September to 31 October.
Angler surveys within the UOM drainage have been routinely conducted (i.e., in 1988,
1990 and 1992) to monitor current fish populations and detect any changes within the
fishery (D. Wig, pers. comm. 2004). As part of this monitoring process, a roving angler
survey was conducted in 2004 on four major trout streams, Dutch Creek, Racehorse
Creek, Upper Oldman River and the Livingstone River; there has been no previous
angler data collected for Racehorse Creek (D. Wig, pers. comm. 2004). This (2004)
angler survey is a component of the UOM Drainage Sport Fish Assessment, which also
included population estimates within the Upper Oldman River, Dutch Creek and
Racehorse Creek (Jokinen and Council 2004). The 2004 survey was also designed to
address angler concerns about the smaller sizes and reduced numbers of fish in water
of the UOM drainage. Results from this survey (2004) will be compared to those of
previous surveys to identify trends in angler pressure, catch rates and angler
satisfaction.
1.2 Study rationale
Recently anglers have expressed concern regarding the size and number of cutthroat
trout being captured in parts of the UOM drainage. The current survey was conducted
to address angler concerns by assessing angler pressure, success rates and angler
satisfaction.
2

1.3 Study objectives
The primary objectives of this study were:
i. To compare angling pressure, angler effort, and catch rates in 2004 with
those of previous surveys;
ii. To evaluate angler concerns of reduced numbers and sizes of trout being
captured; and
iii. To assess the need for a change in sport fish management practices within
the UOM drainage.
2.0 STUDY AREA
The UOM drainage is located in the southwestern region of Alberta along the eastern
slopes of the Rocky Mountains, approximately 40 km north of Coleman. The entire
UOM watershed drains the flowing waters upstream from the Gap falls on the Oldman
River. The drainage is located in the forest reserve that occupies montane, subalpine
and alpine forests. Streams and rivers within the UOM drainage are coldwater
streams, creeks and rivers inhabited by cutthroat trout, bull trout, rainbow trout and
mountain whitefish (Clements 1989; Byrne 1992, 1993). The 2004 survey was conducted
on four primary drainages within the UOM watershed: Livingstone River, Upper
Oldman River, Dutch Creek and Racehorse Creek (Figure 1).
3
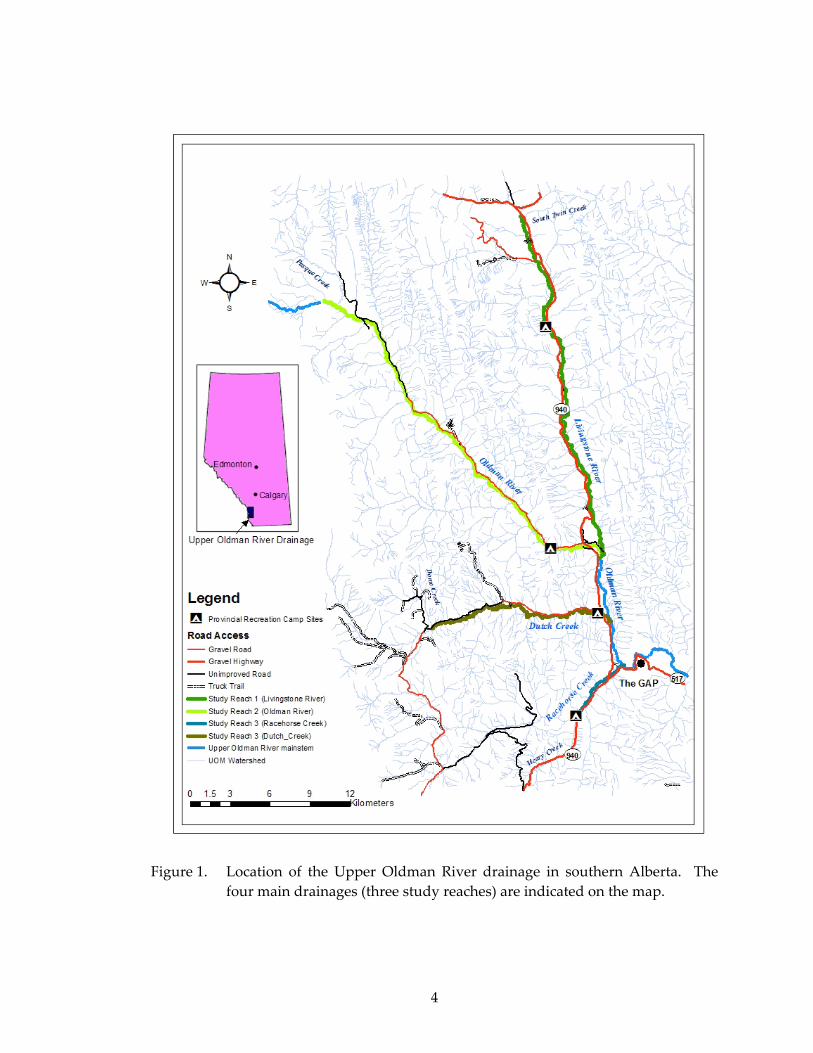
Figure 1. Location of the Upper Oldman River drainage in southern Alberta. The
four main drainages (three study reaches) are indicated on the map.
4

3.0 METHODS
3.1 General sampling methods
The angling survey occurred between 16 June and 6 September 2004. The survey
design followed Malvestuto’s (1996) multi‐stage stratified roving angler survey and
was replicated from previous UOM angler surveys by integrating a non‐uniform
probability random sampling technique (Clements 1989; Byrne 1992, 1993). The survey
was stratified according to day type and study reach. Day types were classified as
weekdays and weekend days/holidays. Angler sampling was conducted between 1400
to 2200 h which was the general time frame when anglers had completed their day.
Later in the season this sampling time shifted to compensate for shorter days.
The Livingstone River and Oldman River were considered as separate study reaches,
and Dutch Creek and Racehorse Creek were combined together as a single study reach
due to their adjacency to one another and their short survey reaches. The Livingstone
River was sampled from the confluence of South Twin Creek downstream to the
Livingstone River / Oldman River confluence. The Upper Oldman River was sampled
from the Livingstone River / Oldman River confluence upstream to the confluence of
Pasque Creek. Racehorse Creek was surveyed from the Vicary Creek confluence,
adjacent to Racehorse Creek provincial campground, downstream to the Oldman River
confluence, and Dutch Creek was sampled downstream from the Dome Creek
confluence to the Oldman River confluence.
A single study reach was surveyed daily. Each study reach was divided into three
subsections to allow surveyors to randomly select subsections relative to the day type.
One to two subsections were surveyed during weekdays and two to three subsections
were surveyed during weekends and holidays when angling pressure was expected to
be higher.
Access points from previous UOM angling surveys were adopted by technicians in the
2004 UOM angling survey (Byrne 1993). Additional access points to the Livingstone
River, Upper Oldman River and Dutch Creek, plus new sites along Racehorse Creek,
were selected by analyzing National Topographical Series (NTS) 1:50,000 maps; these
5

points were ground‐truthed prior to the survey season. Common angling access points
discovered during the survey were also routinely surveyed.
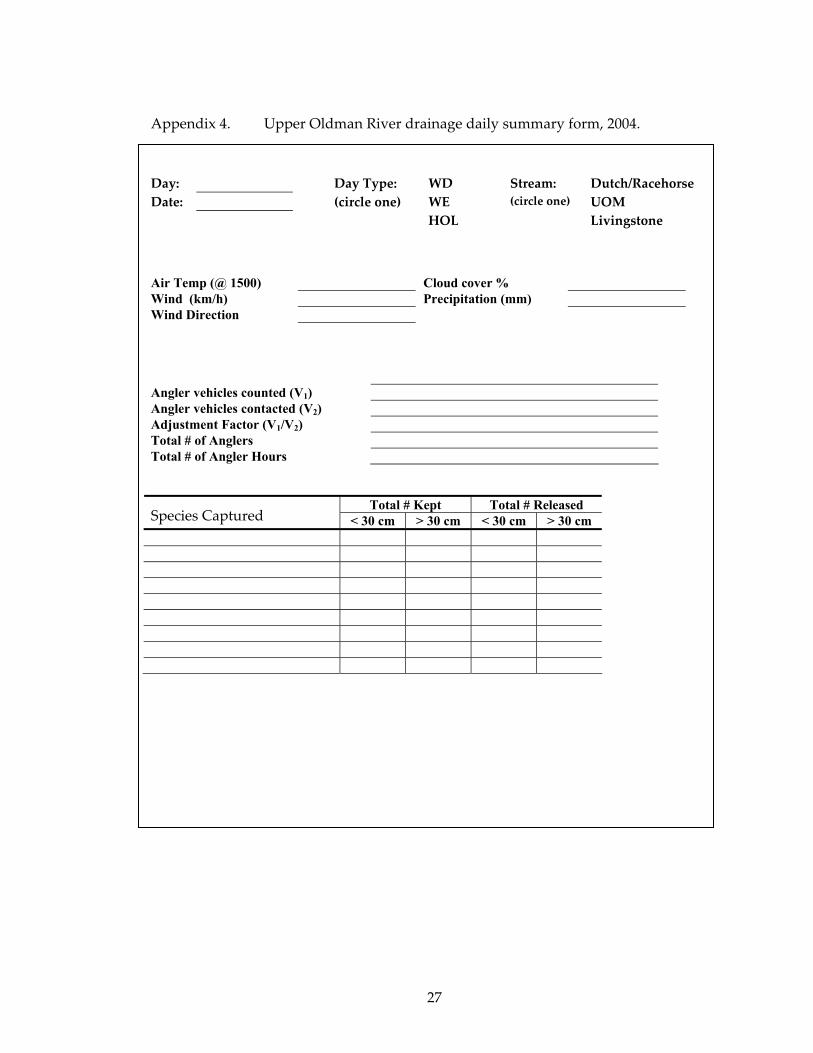
A count run was integrated into the 2004 survey to provide additional data to
accurately estimate angling pressure. Each day, prior to angling surveys, access points
were visited to record the number of vehicles in the survey section. All vehicles were
recorded on a tally form where suspected anglers’ vehicles and other vehicles were
enumerated into separate categories (Appendix 2); vehicles that were suspected to be
owned by anglers were only included for analysis. Count runs were conducted over a
short time period to improve the accuracy of the estimate of angling pressure
(Malvestuto 1996).
Daily surveys were initiated by randomly choosing an access point at a random time
within the survey time period (Malvestuto 1996). Anglers were approached by Alberta
Conservation Association (ACA) fisheries technicians and asked to participate in the
angling survey. Questions in the survey included age class, angler residency, angling
method, catch success, total number of angling hours, species and approximate fish size
(Appendix 3). Angler residency was classified as local (> 100 km), rural (< 100 km),
Calgary, Lethbridge, out of province, out of country (USA) or out of country (other
than USA). Angling method was classified as artificial flies, artificial lures,
combination, other or test angling.
Anglers who had fished in the drainage previously were asked additional questions
regarding their opinion of i) whether or not a change had been observed in the size and
number of fish within the study reach, and ii) the status of the fishery as increasing,
decreasing or remaining the same.
Following the interview, anglers were associated with their vehicles enumerated earlier
in the count run and noted as a contacted vehicle. Suspected vehicles that remained
anonymous were classified as not contacted (Genereux and Bryski 2003). The ratio
between the total counted vehicles to the total contacted vehicles was determined as the
daily adjustment factor. The daily adjustment factor is a correction factor that accounts
for all anglers who were angling that day and were not interviewed, and therefore
were not enumerated (Genereux and Bryski 2003).
6
Upon the completion of a survey day, fisheries technicians recorded and summarized
all data collected during the day on a daily summary form (Appendix 4). Angler data
was entered into a Microsoft Excel spreadsheet for data storage and data analysis.
Angling information was submitted to Alberta Sustainable Resource Development
(ASRD) for storage in their Fisheries Management Information System (FMIS)
database.
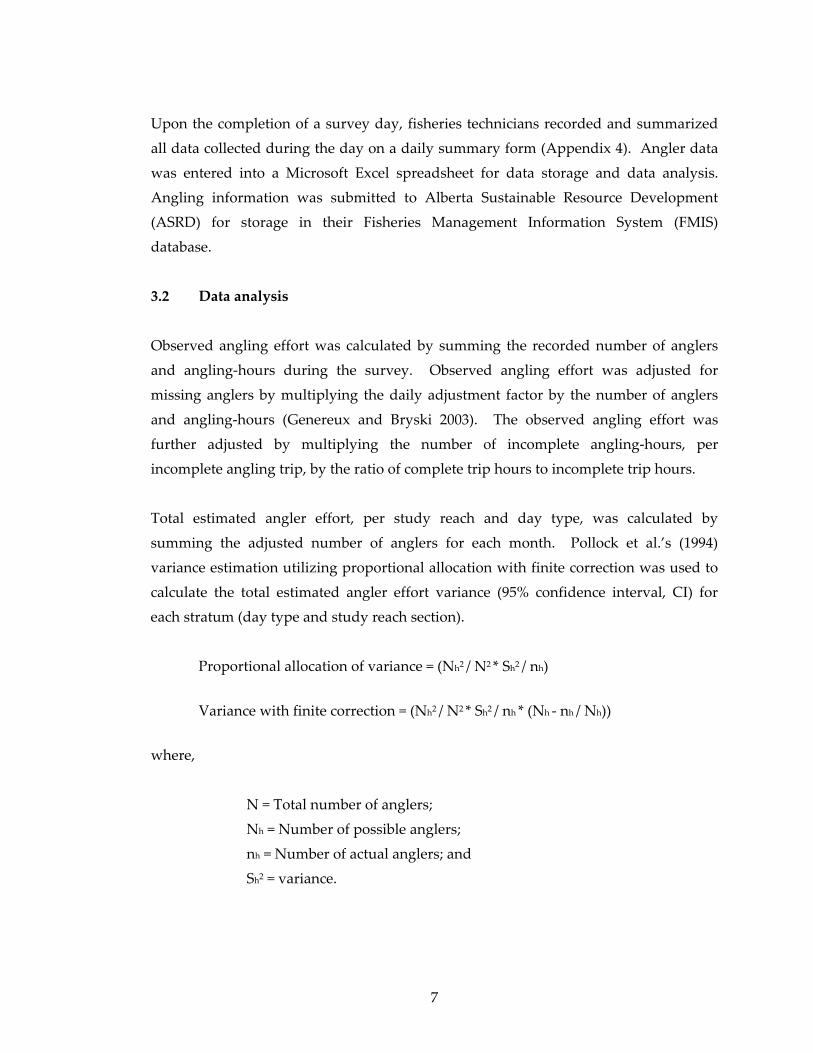
3.2 Data analysis
Observed angling effort was calculated by summing the recorded number of anglers
and angling‐hours during the survey. Observed angling effort was adjusted for
missing anglers by multiplying the daily adjustment factor by the number of anglers
and angling‐hours (Genereux and Bryski 2003). The observed angling effort was
further adjusted by multiplying the number of incomplete angling‐hours, per
incomplete angling trip, by the ratio of complete trip hours to incomplete trip hours.
Total estimated angler effort, per study reach and day type, was calculated by
summing the adjusted number of anglers for each month. Pollock et al.’s (1994)
variance estimation utilizing proportional allocation with finite correction was used to
calculate the total estimated angler effort variance (95% confidence interval, CI) for
each stratum (day type and study reach section).
Proportional allocation of variance = (Nh2 / N2 * Sh2 / nh)
Variance with finite correction = (Nh2 / N2 * Sh2 / nh * (Nh ‐ nh / Nh))
where,
N = Total number of anglers;
Nh = Number of possible anglers;
nh = Number of actual anglers; and
Sh2 = variance.
7
Total angling effort calculations were determined by multiplying the average daily
effort, per day type and study reach, by the number of each day type throughout the
entire survey period. Total angling effort variance was calculated for each value (95%
CI) (Genereux and Bryski 2003).
Catch‐per‐unit‐effort (CPUE) was calculated as the total number of fish, for each
species, divided by the total number of angling‐hours. Harvest rate calculations were
determined by simply dividing the observed number of fish harvested by the observed
total number of fish captured. Harvest rates were calculated for each fish species and
study reach.
Anglers were considered successful if at least one fish was caught per angling trip and
was evaluated by comparing the number of successful angling trips to the number of
unsuccessful angling trips (Genereux and Bryski 2003). Comparisons of angler success
were made between each study reach section by interpreting Lorenz curves and
evaluating calculated Gini coefficients (Baccante 1995). The closer the Gini coefficient
value was to zero, the lower the deviation and hence more even the angler success
distribution would be; inversely, the greater the coefficient value, the higher the
deviation and therefore the more uneven the angler success distribution would be.
4.0 RESULTS
4.1 Catch summary
All four sport fish species were caught in all study reaches. A total of 9,797 fish were
captured and recorded during the duration of the angler survey. Cutthroat trout was
the primary fish species caught during the angler survey, comprising 97.6% (n = 9,560)
of the overall catch. Of the remaining catch, 0.9% (n = 93) was rainbow trout, 0.9% (n =
84) bull trout and 0.6% (n = 60) mountain whitefish. Fish catches, excluding bull trout,
were considerably higher in the Livingstone River (n = 3,567) and the Upper Oldman
River (n = 2,731) than in Racehorse Creek (n = 1,781) and Dutch Creek (n = 1,634) (Table
1).
8
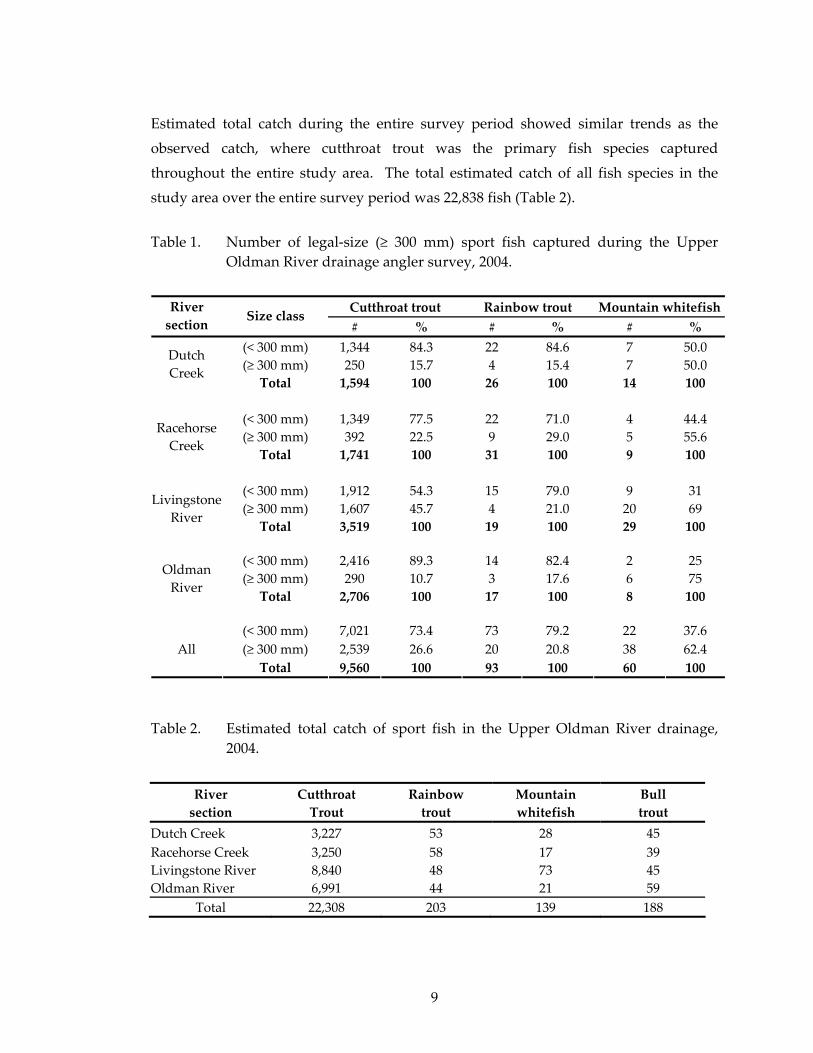
Estimated total catch during the entire survey period showed similar trends as the
observed catch, where cutthroat trout was the primary fish species captured
throughout the entire study area. The total estimated catch of all fish species in the
study area over the entire survey period was 22,838 fish (Table 2).
Table 1. Number of legal‐size (≥ 300 mm) sport fish captured during the Upper
Oldman River drainage angler survey, 2004.
Cutthroat trout Rainbow trout Mountain whitefishRiver section Size class
# % # % # % (< 300 mm) 1,344 84.3 22 84.6 7 50.0 (≥ 300 mm) 250 15.7 4 15.4 7 50.0
Dutch Creek
Total 1,594 100 26 100 14 100
(< 300 mm) 1,349 77.5 22 71.0 4 44.4 (≥ 300 mm) 392 22.5 9 29.0 5 55.6
Racehorse Creek
Total 1,741 100 31 100 9 100
(< 300 mm) 1,912 54.3 15 79.0 9 31 (≥ 300 mm) 1,607 45.7 4 21.0 20 69
Livingstone River
Total 3,519 100 19 100 29 100
(< 300 mm) 2,416 89.3 14 82.4 2 25 (≥ 300 mm) 290 10.7 3 17.6 6 75
Oldman River Total 2,706 100 17 100 8 100
(< 300 mm) 7,021 73.4 73 79.2 22 37.6 (≥ 300 mm) 2,539 26.6 20 20.8 38 62.4 All Total 9,560 100 93 100 60 100
Table 2. Estimated total catch of sport fish in the Upper Oldman River drainage,
2004.
River section
Cutthroat Trout
Rainbow trout
Mountain whitefish
Bull trout
Dutch Creek 3,227 53 28 45 Racehorse Creek 3,250 58 17 39 Livingstone River 8,840 48 73 45 Oldman River 6,991 44 21 59
Total 22,308 203 139 188
9
Total estimated catch of cutthroat trout was higher in the 2004 survey compared to the
1992 angler survey. Livingstone River demonstrated the most dramatic change, with
catch of cutthroat increasing from 1,686 fish in 1992 (Byrne 1993) to 8,840 in 2004. Catch
of cutthroat on Dutch Creek increased from 2,485 fish in 1992 (Byrne 1993) to 3,227 in
2004, while on Upper Oldman River increased from 5,927 in 1992 (Byrne 1993) to 6,991
in 2004. An estimated 5,934 cutthroat trout ≥ 300 mm were caught in the entire UOM
drainage during the 2004 survey period. Approximately 67% of these legal‐sized
cutthroat trout were caught in the Livingstone River, 12% were caught in both
Racehorse Creek and Upper Oldman River and the remaining 9% were caught in Dutch
Creek. The remainder of the 16,374 cutthroat trout caught in the UOM drainage were <
300 mm.
4.2 Angler effort
Angler sampling was conducted during 116 of a possible 249 sampling periods.
Approximately 40% (67 of 168) of weekdays and 67% (54 of 81) of weekend days and
holidays were sampled during the 2004 survey period. During this period, 2,941
contacted anglers reported they had fished 8,453 angling‐h at a rate of 2.87 h/angler. As
a result, an estimated 7,185 anglers fished an estimated 20,197 angling‐h in the UOM
drainage during the 2004 survey period.
Overall, angling pressure was greatest on the Livingstone River compared to the other
study reaches. Each month, the Livingstone River had the highest number of observed
anglers and angling‐hours, followed by the Upper Oldman River. Dutch Creek and
Racehorse Creek had the lowest angling pressure in the UOM drainage in 2004 (Table
3).
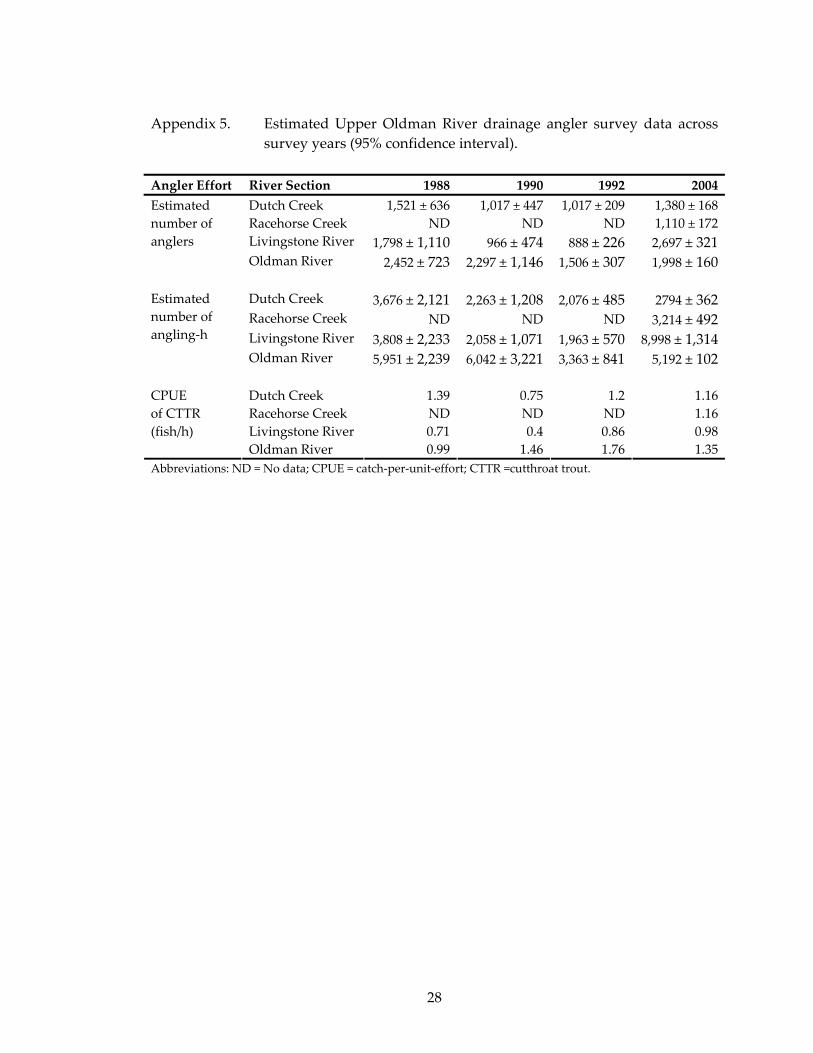
The trend in estimated number of anglers across all study reaches was similar across
survey years, with the exception of Racehorse Creek where incomplete data precluded
an evaluation of trends in angler numbers (Appendix 5). The number of anglers in all
study reaches was greatest during the 1988 survey, excluding the Livingstone River
where the estimated number of anglers was greatest in 2004. Compared to the 1988
survey, the 1990 angler survey revealed a substantial decrease in anglers on Dutch
Creek and Livingstone River, whereas there was only a slight decrease in anglers on
10

the Upper Oldman River. The 1992 survey revealed a drastic decline (from 1990) in the
estimated number of anglers on the Upper Oldman River, whereas the Livingstone
River exhibited a smaller decline and angler numbers on Dutch Creek remained the
same. Compared to 1992, angler numbers were higher in 2004, especially on the
Livingstone River where the number of anglers increased by approximately 1,800
(Figure 2).
Table 3. Observed and estimated (95% confidence interval) angler effort in the
Upper Oldman River drainage from 16 June to 6 September 2004.
Month River Reach
Anglers interviewed
Observedangling‐h
Estimated anglers
Estimated angling‐h
Dutch Creek 73 161.5 187 (± 38.71) 324.1 (± 70.97) Racehorse Creek 58 161.5 97 (± 32.41) 264 (± 89.50) Livingstone River 140 484.5 317(± 51.99) 1,092 (± 214.03)
June
Oldman River 81 229.5 195 (± 59.67) 536.4 (± 207.59)
Dutch Creek 246 588 660 (± 90.42) 966.8 (± 172.09) Racehorse Creek 230 604.5 413 (± 83.43) 1,249.8 (± 291.20) Livingstone River 467 1524 1,265 (± 173.31) 4,430.3 (± 762.01)
July
Oldman River 383 1,027.50 927 (± 167.79) 2,503.4 (± 505.69)
Dutch Creek 201 562.5 476 (± 81.87) 1,319.7 (± 166.28) Racehorse Creek 184 516 429 (± 87.95) 1,175.4 (± 248.01) Livingstone River 342 1,085.50 904 (± 152.78) 2,704.0 (± 700.34)
Aug
Oldman River 230 551.5 628 (± 242.41) 1,481.6 (± 628.20)
Dutch Creek 26 76 ‐‐ ‐‐ Racehorse Creek 67 191 ‐‐ ‐‐ Livingstone River 139 488 ‐‐ ‐‐
Sept
Oldman River 74 201 ‐‐ ‐‐
Dutch Creek 546 1,388 1,380 (± 168.36) 2,793.9 (± 363.21) Racehorse Creek 539 1,473 1,110 (± 172.05) 3,213.6 (± 492.09) Livingstone River 1,088 3,582 2,697 (± 320.94) 8,998.1 (± 1313.72)
Total
Oldman River 768 2,009.50 1,998 (± 319.68) 5,192.0 (± 789.18) Grand Total 2,941 8,452.50 7,185 (± 998.72) 20,197.6 (± 3070.04)
‐‐ Insufficient data
11
3000
Oldman RiverLivingstone RiverRacehorse CreekDutch Creek
2500
2000
Estim
ated
Ang
lers
(#)
1500
1000
500
01988 1990 1992 2004
Year
Figure 2. Estimated number of anglers in the Upper Oldman River drainage during the past four angler surveys.
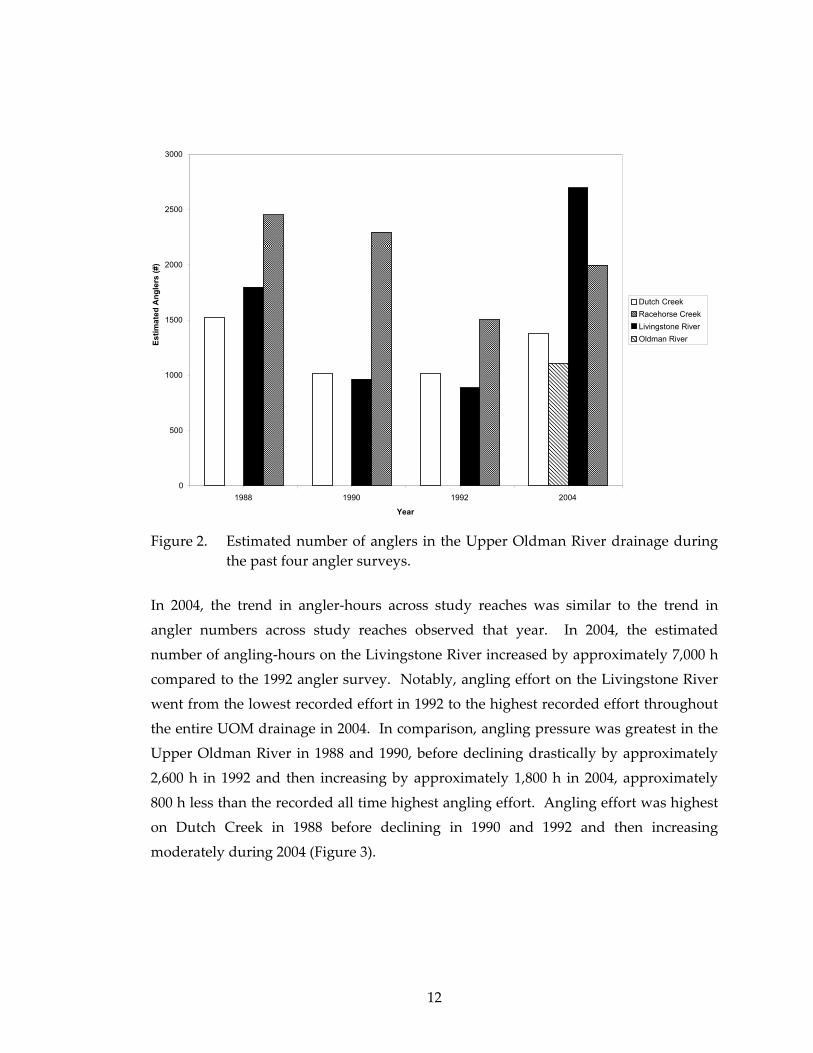
In 2004, the trend in angler‐hours across study reaches was similar to the trend in
angler numbers across study reaches observed that year. In 2004, the estimated
number of angling‐hours on the Livingstone River increased by approximately 7,000 h
compared to the 1992 angler survey. Notably, angling effort on the Livingstone River
went from the lowest recorded effort in 1992 to the highest recorded effort throughout
the entire UOM drainage in 2004. In comparison, angling pressure was greatest in the
Upper Oldman River in 1988 and 1990, before declining drastically by approximately
2,600 h in 1992 and then increasing by approximately 1,800 h in 2004, approximately
800 h less than the recorded all time highest angling effort. Angling effort was highest
on Dutch Creek in 1988 before declining in 1990 and 1992 and then increasing
moderately during 2004 (Figure 3).
12
9500
9000
8500
8000
7500
7000
Estim
ated
ang
ling
hour
s (h
)
6500
6000
5500
Oldman RiverLivingstone RiverRacehorse CreekDutchCreek
5000
4500
4000
3500
3000
2500
2000
1500
1000
500
01988 1990 1992 2004
Year
Figure 3. Estimated angling‐hours in the Upper Oldman River drainage during the past four angler surveys.
4.3 Catch‐per‐unit‐effort CPUE was greatest for cutthroat trout (1.250 fish/h) in the UOM river study area. In
comparison, CPUE of rainbow trout, bull trout and mountain whitefish were 0.013,
0.012 and 0.007 fish/h, respectively.
In 2004, cutthroat trout CPUE was slightly higher in the Upper Oldman River and
Livingstone River than in Dutch Creek and Racehorse Creek. However, CPUE for
rainbow trout and bull trout were highest in Dutch and Racehorse creeks (Table 4).
CPUE of all species was similar for Dutch and Racehorse creeks (Table 5).
13
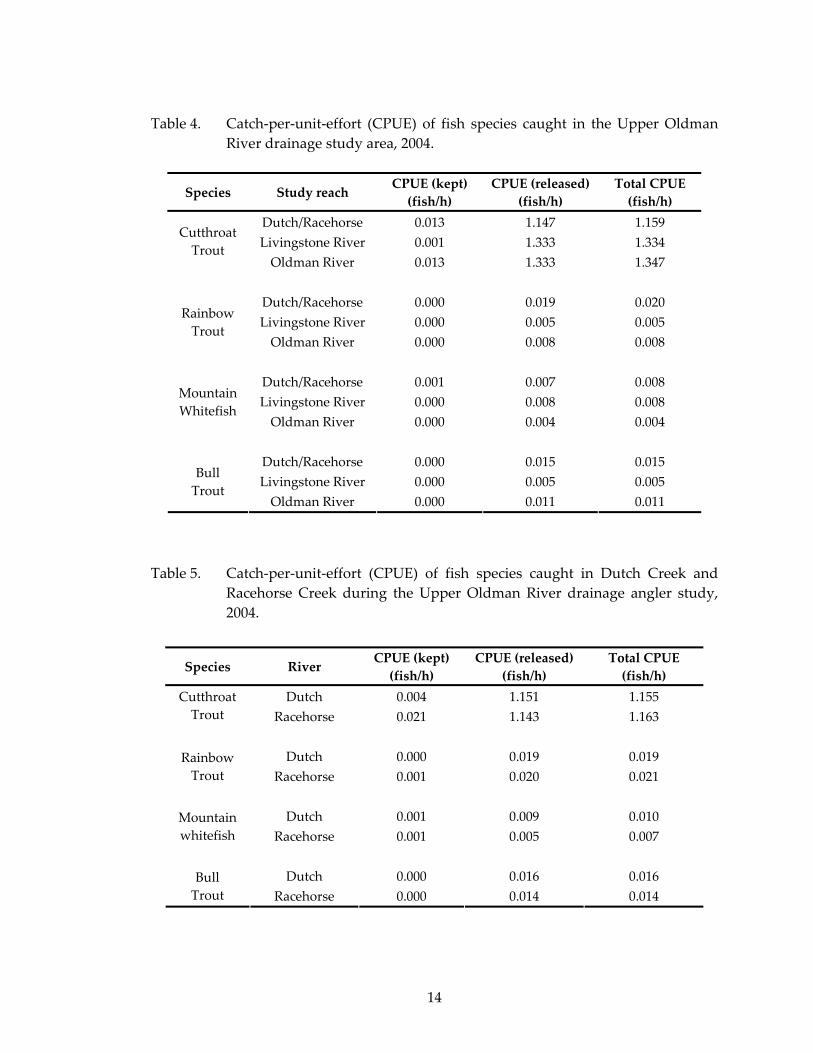
Table 4. Catch‐per‐unit‐effort (CPUE) of fish species caught in the Upper Oldman River drainage study area, 2004.
Species Study reach CPUE (kept) (fish/h)
CPUE (released) (fish/h)
Total CPUE (fish/h)
Dutch/Racehorse 0.013 1.147 1.159 Livingstone River 0.001 1.333 1.334
Cutthroat Trout
Oldman River 0.013 1.333 1.347
Dutch/Racehorse 0.000 0.019 0.020 Livingstone River 0.000 0.005 0.005
Rainbow Trout
Oldman River 0.000 0.008 0.008
Dutch/Racehorse 0.001 0.007 0.008 Livingstone River 0.000 0.008 0.008 Mountain
Whitefish Oldman River 0.000 0.004 0.004
Dutch/Racehorse 0.000 0.015 0.015 Livingstone River 0.000 0.005 0.005 Bull
Trout Oldman River 0.000 0.011 0.011
Table 5. Catch‐per‐unit‐effort (CPUE) of fish species caught in Dutch Creek and Racehorse Creek during the Upper Oldman River drainage angler study, 2004.
Species River CPUE (kept) (fish/h)
CPUE (released) (fish/h)
Total CPUE (fish/h)
Dutch 0.004 1.151 1.155 Cutthroat Trout Racehorse 0.021 1.143 1.163
Dutch 0.000 0.019 0.019 Rainbow Trout Racehorse 0.001 0.020 0.021
Dutch 0.001 0.009 0.010 Mountain whitefish Racehorse 0.001 0.005 0.007
Dutch 0.000 0.016 0.016 Bull
Trout Racehorse 0.000 0.014 0.014
14
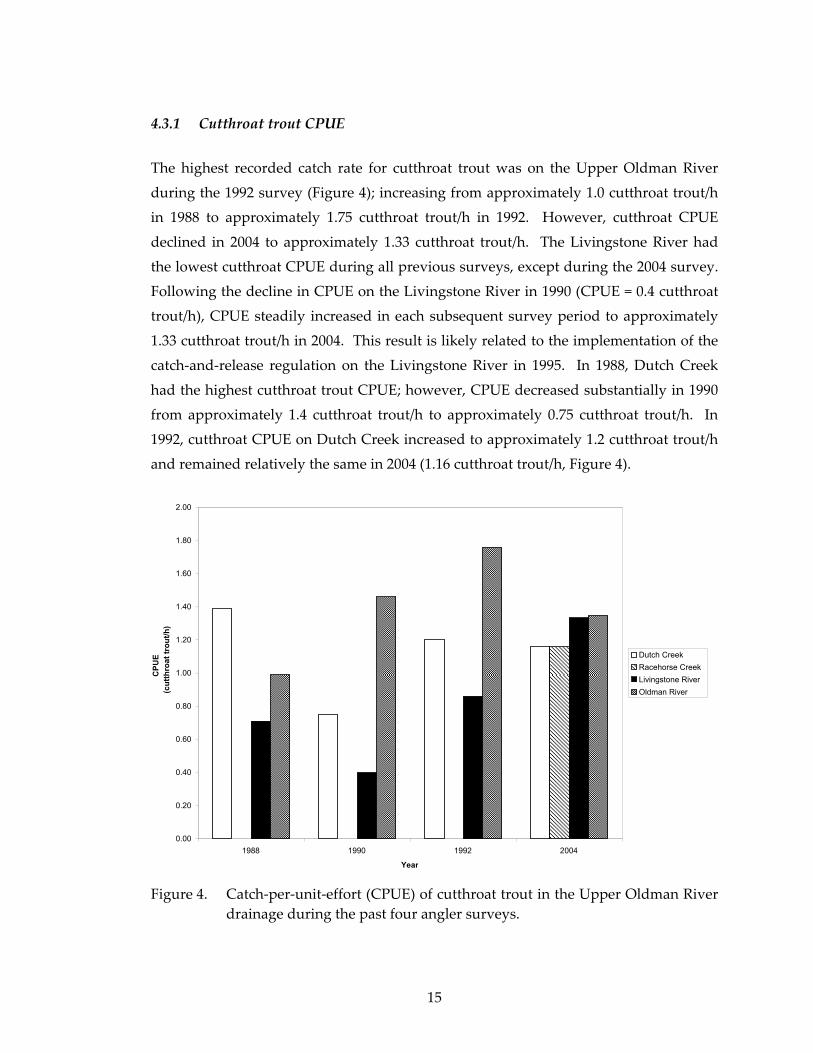
4.3.1 Cutthroat trout CPUE
The highest recorded catch rate for cutthroat trout was on the Upper Oldman River
during the 1992 survey (Figure 4); increasing from approximately 1.0 cutthroat trout/h
in 1988 to approximately 1.75 cutthroat trout/h in 1992. However, cutthroat CPUE
declined in 2004 to approximately 1.33 cutthroat trout/h. The Livingstone River had
the lowest cutthroat CPUE during all previous surveys, except during the 2004 survey.
Following the decline in CPUE on the Livingstone River in 1990 (CPUE = 0.4 cutthroat
trout/h), CPUE steadily increased in each subsequent survey period to approximately
1.33 cutthroat trout/h in 2004. This result is likely related to the implementation of the
catch‐and‐release regulation on the Livingstone River in 1995. In 1988, Dutch Creek
had the highest cutthroat trout CPUE; however, CPUE decreased substantially in 1990
from approximately 1.4 cutthroat trout/h to approximately 0.75 cutthroat trout/h. In
1992, cutthroat CPUE on Dutch Creek increased to approximately 1.2 cutthroat trout/h
and remained relatively the same in 2004 (1.16 cutthroat trout/h, Figure 4).
2.00
1.80
1.60
1.40
CPU
E(c
utth
roat
trou
t/h)
1.20
Oldman RiverLivingstone RiverRacehorse CreekDutch Creek
1.00
0.80
0.60
0.40
0.20
0.001988 1990 1992 2004
Year
Figure 4. Catch‐per‐unit‐effort (CPUE) of cutthroat trout in the Upper Oldman River drainage during the past four angler surveys.
15
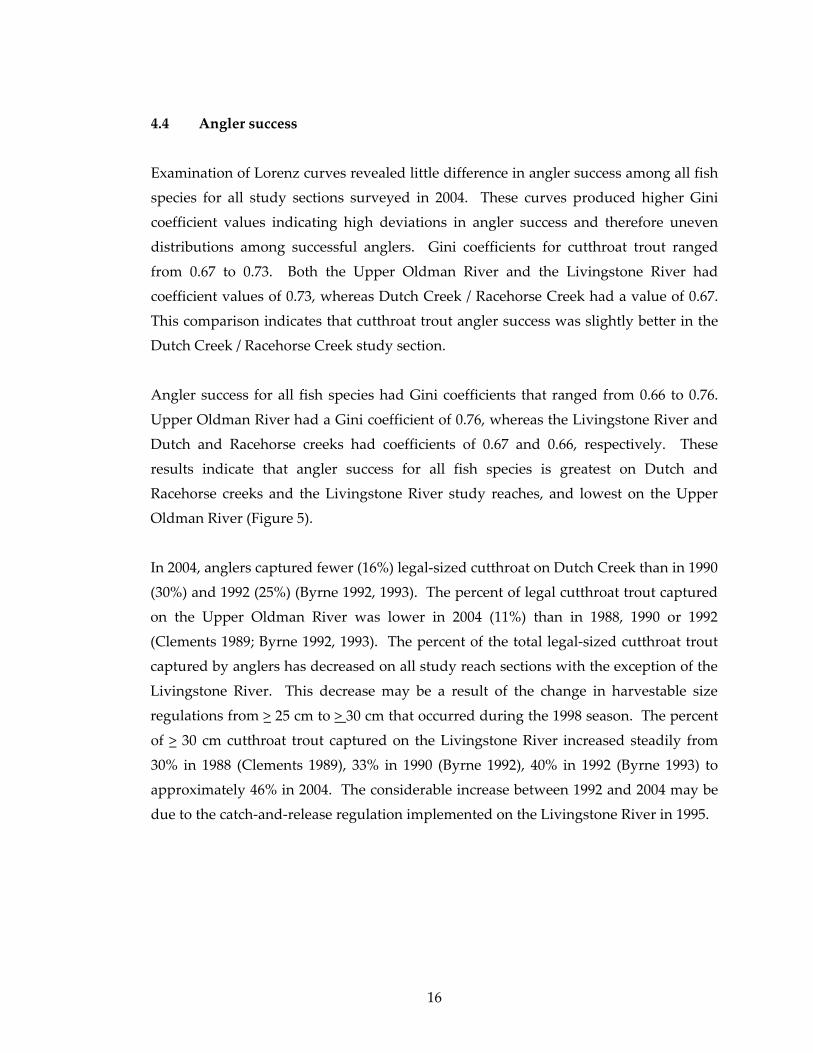
4.4 Angler success
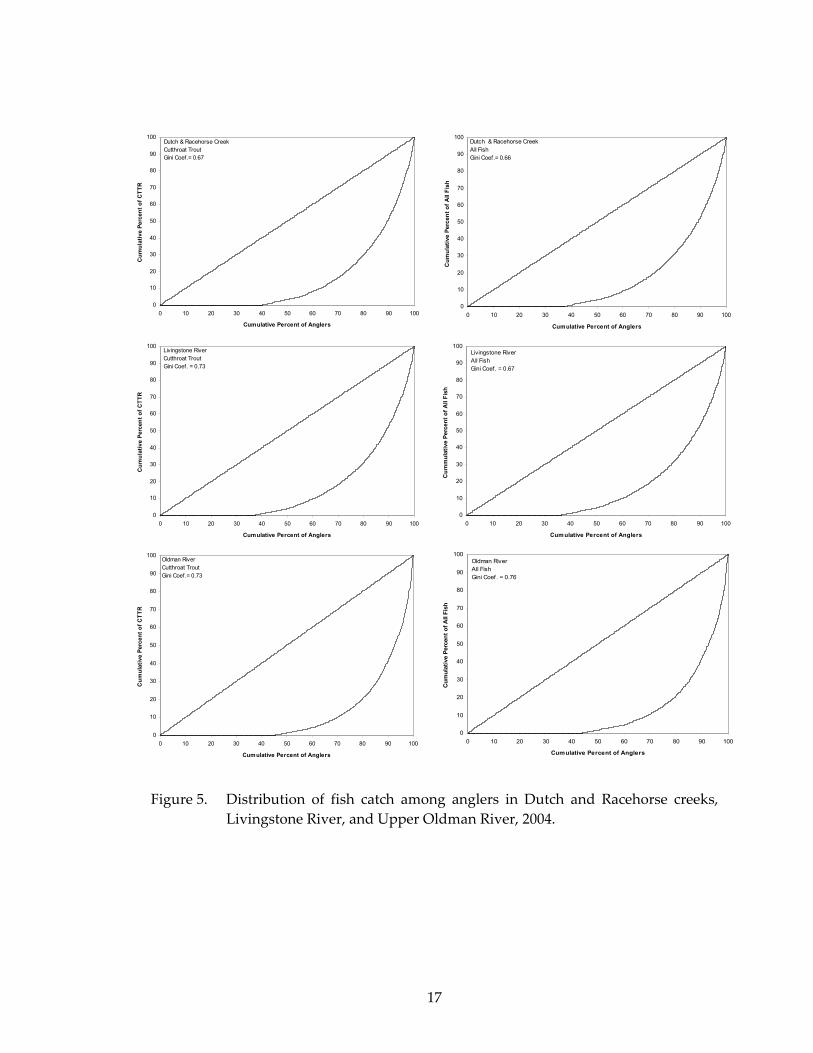
Examination of Lorenz curves revealed little difference in angler success among all fish
species for all study sections surveyed in 2004. These curves produced higher Gini
coefficient values indicating high deviations in angler success and therefore uneven
distributions among successful anglers. Gini coefficients for cutthroat trout ranged
from 0.67 to 0.73. Both the Upper Oldman River and the Livingstone River had
coefficient values of 0.73, whereas Dutch Creek / Racehorse Creek had a value of 0.67.
This comparison indicates that cutthroat trout angler success was slightly better in the
Dutch Creek / Racehorse Creek study section.
Angler success for all fish species had Gini coefficients that ranged from 0.66 to 0.76.
Upper Oldman River had a Gini coefficient of 0.76, whereas the Livingstone River and
Dutch and Racehorse creeks had coefficients of 0.67 and 0.66, respectively. These
results indicate that angler success for all fish species is greatest on Dutch and
Racehorse creeks and the Livingstone River study reaches, and lowest on the Upper
Oldman River (Figure 5).
In 2004, anglers captured fewer (16%) legal‐sized cutthroat on Dutch Creek than in 1990
(30%) and 1992 (25%) (Byrne 1992, 1993). The percent of legal cutthroat trout captured
on the Upper Oldman River was lower in 2004 (11%) than in 1988, 1990 or 1992
(Clements 1989; Byrne 1992, 1993). The percent of the total legal‐sized cutthroat trout
captured by anglers has decreased on all study reach sections with the exception of the
Livingstone River. This decrease may be a result of the change in harvestable size
regulations from > 25 cm to > 30 cm that occurred during the 1998 season. The percent
of > 30 cm cutthroat trout captured on the Livingstone River increased steadily from
30% in 1988 (Clements 1989), 33% in 1990 (Byrne 1992), 40% in 1992 (Byrne 1993) to
approximately 46% in 2004. The considerable increase between 1992 and 2004 may be
due to the catch‐and‐release regulation implemented on the Livingstone River in 1995.
16
0
10
20
30
40
50
60
70
80
90
100
0 10 20 30 40 50 60 70 80 90 100
Cumulative Percent of Anglers
Cum
ulat
ive
Perc
ent o
f CTT
RDutch & Racehorse CreekCutthroat TroutGini Coef.= 0.67
0
10
20
30
40
50
60
70
80
90
100
0 10 20 30 40 5
Cumulative Per
Cum
ulat
ive
Perc
ent o
f All
Fish
Dutch & Racehorse CreekAll FishGini Coef.= 0.66
0 60 70 80 90 100
cent of Anglers
0
10
20
30
40
50
60
70
80
90
100
0 10 20 30 40 50 60 70 80 90 100
Cumulative Percent of Anglers
Cum
ulat
ive
Perc
ent o
f CTT
R
Livingstone RiverCutthroat TroutGini Coef. = 0.73
Figure 5. Distribution of fish catch among anglers in Dutch and Racehorse creeks,
Livingstone River, and Upper Oldman River, 2004.
0
10
20
30
40
50
60
70
80
90
100
0 10 20 30 40
Cumulative Perc
Cum
mul
ativ
e Pe
rcen
t of A
ll Fi
sh
Livingstone RiverAll FishGini Coef. = 0.67
50 60 70 80 90 100
ent of Anglers
0
10
20
30
40
50
60
70
80
90
100
0 10 20 30 40 50 60 70 80 90 100
Cumulative Percent of Anglers
Cum
ulat
ive
Perc
ent o
f CTT
R
Oldman RiverCutthroat TroutGini Coef.= 0.73
0
10
20
30
40
50
60
70
80
90
100
0 10 20 30 40 5
Cumulative Per
Cum
ulat
ive
Perc
ent o
f All
Fish
Oldman RiverAll FishGini Coef. = 0.76
0 60 70 80 90 100
cent of Anglers
17
4.5 Recreational harvest
Fish harvested during 2004 comprised 0.7% (72 of 9,797) of the overall fish catch. This
low harvest rate suggests that the UOM drainage is primarily a catch‐and‐release
fishery. Harvest rate was highest in Dutch and Racehorse creeks at 1.2% (40 harvested
of 3,458 fish). When assessed individually, the harvest rate on Dutch Creek was 1.8%
(33 harvested of 1,802 fish) and on Racehorse Creek was 0.4% (7 harvested of 1,656).
The Upper Oldman River had a harvest rate of 1.0% (28 harvested of 2,754 fish). Fish
were reportedly harvested from the Livingstone River, despite it being regulated as a
catch‐and‐release fishery. Anglers reported that four of 3,585 fish were illegally
harvested on the Livingstone River (harvest rate = 0.1%).
No bull trout were reportedly harvested during the 2004 survey, but all other fish
species were harvested. Across the entire study area, mountain whitefish had the
greatest harvest rate at 5.0% (3 harvested of 60 fish), rainbow trout had a harvest rate of
2.2% (2 harvested of 93 fish) and cutthroat trout had the lowest harvest rate at 0.7% (67
harvested of 9,560 fish).
4.6 Angling method
Fly‐fishing was the most common angling method used in the study area in 2004 and
was used by 73% of all interviewed anglers. Lures were used by 24% of anglers. Only
3% of anglers used a combination of flies and lures, or other angling methods. Angling
preference has shifted since 1992 when anglers used flies and lures equally (Byrne
1993).
4.7 Angler residency
Of the 2,941 anglers interviewed, the majority of anglers (50.2%) reported Calgary as
their location of residence. Anglers from Lethbridge represented 9.9% of anglers
fishing in the UOM drainage and only 3.5% of anglers were local residents. Anglers
from rural Alberta comprised 22.7% of the study sample, while 6.2% consisted of urban
Albertans (> 200 km). The remaining 7.5% of anglers interviewed were from either out
of province or out of country. Since the 1988 angler survey, there has been a
18
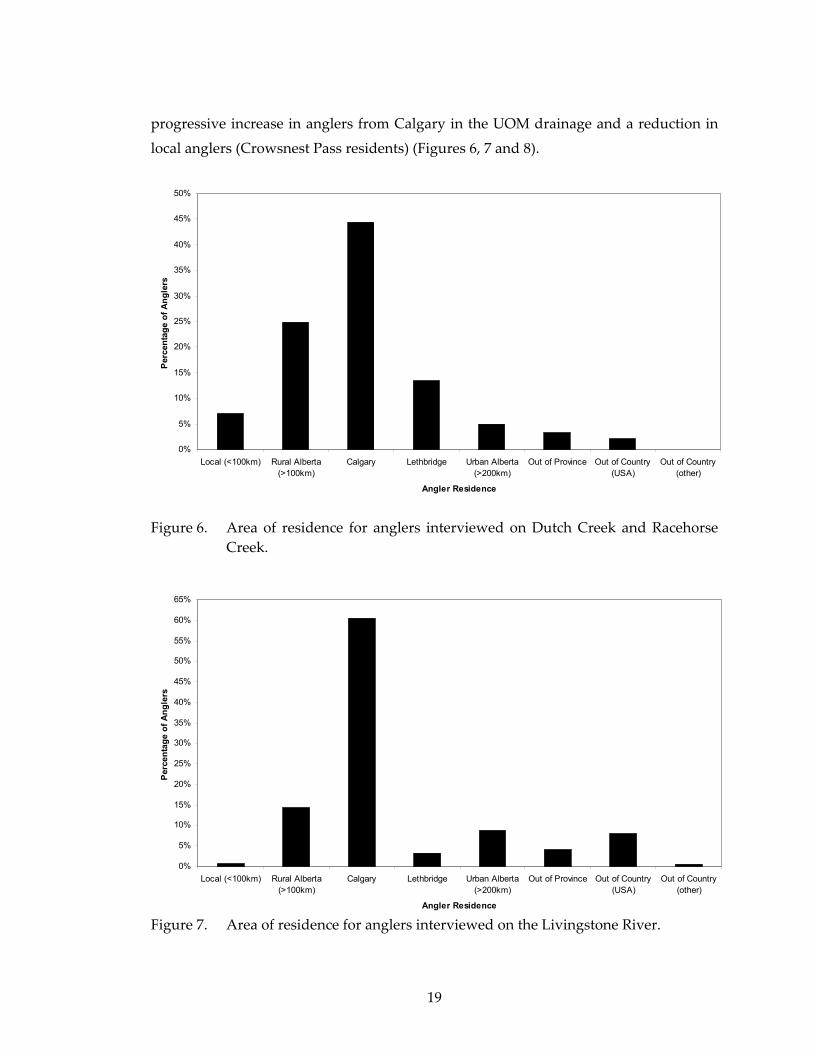
progressive increase in anglers from Calgary in the UOM drainage and a reduction in
local anglers (Crowsnest Pass residents) (Figures 6, 7 and 8).
0%
5%
10%
15%
20%
25%
30%
35%
40%
45%
50%
Local (<100km) Rural Alberta(>100km)
Calgary Lethbridge Urban Alberta(>200km)
Out of Province Out of Country(USA)
Out of Country(other)
Angler Residence
Perc
enta
ge o
f Ang
lers
Figure 6. Area of residence for anglers interviewed on Dutch Creek and Racehorse
Creek.
0%
5%
10%
15%
20%
25%
30%
35%
40%
45%
50%
55%
60%
65%
Local (<100km) Rural Alberta(>100km)
Calgary Lethbridge Urban Alberta(>200km)
Out of Province Out of Country(USA)
Out of Country(other)
Angler Residence
Perc
enta
ge o
f Ang
lers
Figure 7. Area of residence for anglers interviewed on the Livingstone River.
19
0%
5%
10%
15%
20%
25%
30%
35%
40%
45%
50%
Local (<100km) Rural Alberta(>100km)
Calgary Lethbridge Urban Alberta(>200km)
Out of Province Out of Country(USA)
Out of Country(other)
Angler Residence
Perc
enta
ge o
f Ang
lers
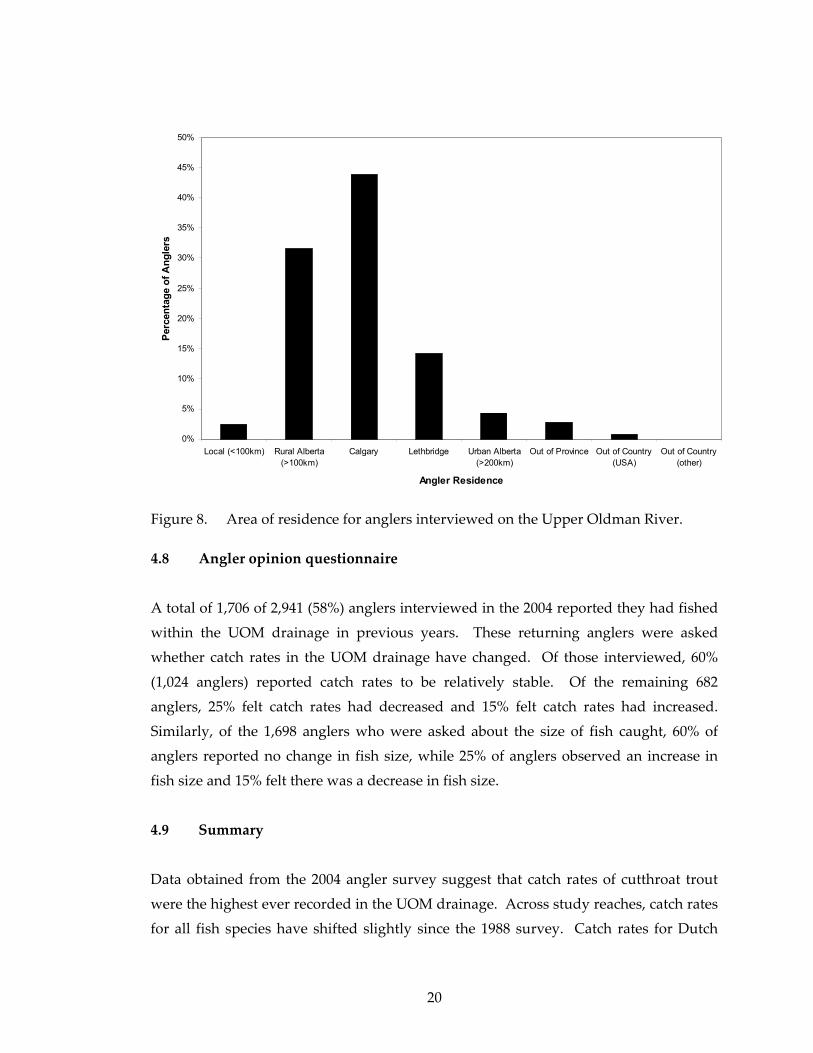
Figure 8. Area of residence for anglers interviewed on the Upper Oldman River. 4.8 Angler opinion questionnaire
A total of 1,706 of 2,941 (58%) anglers interviewed in the 2004 reported they had fished
within the UOM drainage in previous years. These returning anglers were asked
whether catch rates in the UOM drainage have changed. Of those interviewed, 60%
(1,024 anglers) reported catch rates to be relatively stable. Of the remaining 682
anglers, 25% felt catch rates had decreased and 15% felt catch rates had increased.
Similarly, of the 1,698 anglers who were asked about the size of fish caught, 60% of
anglers reported no change in fish size, while 25% of anglers observed an increase in
fish size and 15% felt there was a decrease in fish size.
4.9 Summary
Data obtained from the 2004 angler survey suggest that catch rates of cutthroat trout
were the highest ever recorded in the UOM drainage. Across study reaches, catch rates
for all fish species have shifted slightly since the 1988 survey. Catch rates for Dutch
20
Creek and the Upper Oldman River were highest during the 1992 and 1988 survey,
respectively. Since that time, catch rates for Dutch Creek have remained constant,
while catch rates for the Upper Oldman River have decreased during the angler
surveys. Catch rates on the Livingstone River have increased significantly from
previous survey years, as this reach has provided the highest catch rates in the UOM
drainage.
Since the 1992 angler survey, angling pressure has increased in all study reaches, likely
due to the increase in human population and development in southern Alberta. The
greatest increase in angling pressure has occurred on the Livingstone River, where
anglers had greater catch rates and captured a higher abundance of cutthroat trout ≥
300 mm. During previous angler surveys, the Upper Oldman River had the highest
angling pressure in the UOM drainage, but since the increase in popularity of
Livingstone River, angling pressure has decreased. The 2004 angler survey revealed
that there are fewer and smaller cutthroat trout in the Upper Oldman River, and fewer
anglers and less angling pressure than the Livingstone River. Dutch Creek has
experienced minor shifts in angling pressure across study years. In 2004, angling
pressure increased slightly from previous years, but to a lesser extent than for the
Livingstone River. Angler success was highest on Dutch and Racehorse creeks than on
the other surveyed streams in the UOM drainage.
In general, angling pressure in the UOM drainage has increased since the 1992 angler
survey. The effect of regulation changes within the drainage since 1995 has improved
the quality of fishing, primarily on the Livingstone River, and as a result has increased
the number of anglers using the fishery. In 1995, catch‐and‐release regulations were
implemented on the Livingstone River for cutthroat trout and a zero harvest limit on
bull trout was implemented province‐wide. Shortly thereafter, legal‐sized fish length
was increased from ≥ 25 cm to ≥ 30 cm in 1998.
The majority of anglers indicated that there has been no change in catch rates (i.e., catch
rates have remained stable). Similarly, 60% of anglers indicated that there had been no
change in the number and size of fish.
21

Harvest rates are relatively low throughout the entire UOM drainage, suggesting that
the majority of anglers practice catch‐and‐release angling. A few anglers illegally
harvested cutthroat trout from the Livingstone River. No bull trout were harvested in
the UOM drainage. Harvest rates were likely higher than anglers indicated, but rates
are likely still quite low.
Fly fishing was the preferred angling method in the UOM drainage. Approximately
three‐quarters of anglers used artificial flies, whereas the rest used lures or a
combination of both.
22
5.0 LITERATURE CITED Alberta Guide to Sportfishing Regulations. 1998. Sports Scene Publications Inc.
Alberta Environment. Edmonton, Alberta. Alberta Guide to Sportfishing Regulations. 2004. Sports Scene Publications Inc.
Alberta Environment. Edmonton, Alberta. Baccante, D. 1995. Assessing catch inequality in walleye angling fisheries. North
American Journal of Fisheries Management 15: 661‐665. Byrne, R. 1992. Livingstone drainage creel survey 1990. Alberta Fish and Wildlife
Division, Alberta Environment Protection, Lethbridge, Alberta. 94 pp. Byrne, R. 1993. Livingstone drainage creel survey 1992. Alberta Fish and Wildlife
Division, Alberta Environment Protection, Lethbridge, Alberta. 70 pp. Clements, G. 1989. Livingstone drainage creel survey 1988. Report produced by
Alberta Fish and Wildlife Division, Alberta Environment Protection, Lethbridge, Alberta. 78 pp.
Genereux, D.G., and M.S. Bryski. 2003. A creel survey of the Crowsnest River June –
September, 2001. Report produced by Alberta Environment, Lethbridge, Alberta. 38 pp.
Jokinen, M., and T. Council. 2004. Upper Oldman drainage population estimate. Data
Report, produced by Alberta Conservation Association, Blairmore, Alberta, Canada. 15 pp.
Malvestuto, S.P. 1996. Sampling the recreational creel. Chapter 20. In: B.R. Murphy
and D.W. Willis (editors). Fisheries techniques. 2nd Edition. American Fisheries Society, Bethesda, Maryland, U.S.A. 732 pp.
Nelson, J.S., and M.J. Paetz. 1992. The fishes of Alberta. University of Alberta Press.
Edmonton, Alberta. Pollock, K.H., C.M. Jones, and T.L. Brown. 1994. Angler survey methods and their
applications in fisheries management. American Fisheries Society Special Publication 25, American Fisheries Society, Bethesda, Maryland, U.S.A. 371 pp.
23
6.0 APPENDICES Appendix 1. Upper Oldman River drainage fish species scientific names and
species abbreviations. Common name Scientific name Species abbreviation Cutthroat trout Oncorhynchus clarki CTTR Rainbow trout Oncorhynchus mykiss RNTR Mountain whitefish Prosopium williamsoni MNWH Bull trout Salvelinus confluentus BLTR
24
25
Appendix 2. Upper Oldman River drainage angler survey vehicle tally form, 2004.
Upper Oldman Drainage angler survey vehicle tally form (2004). Date: Stream: Dutch/Racehorse Day: (circle one) UOM
Start Time: Livingstone
End Time: Page: of Interviewer:
Contact y es = #
Access Site #
Vehicle Description
Vehicle Licence #
Remarks
(anglers, non-anglers, nobody around etc.) no =
1
2
3
4
5
6
7
8
9
10
11
12
13
14
15
16
17
18
Appendix 3. Upper Oldman River drainage angler survey form, 2004.
Date: Stream Dutch/Racehorse Page: of Day: (Circle one) UOM Livingstone
Num
ber CTTR
Num
ber RN
TR
Num
ber MN
WH
Other Species
K R K R K R K R
Angler N
umber
Group N
umber
Time Interview
ed (nearest 24 hrs)
Hours A
ngled (nearest ½ hr)
Com
pleted Trip (Y or N
)
<30 cm
>30 cm
<30 cm
>30 cm
<30 Cm
>30 cm
<30 cm
>30 cm
<30 cm
>30 cm
<30 cm
>30 cm
Species Code
Method
Age
Access Site
Residence
Previously interviewed
Feelings about the # of fish
Feelings about the size of fish
. . . . . . . . . .
Method Age Species Residence 1‐artificial flies 1‐ 16 and younger 1‐CTTR 1‐Local (<100 km) 6‐ Out of Province 2‐ artificial lures 2‐ 17 – 64 2‐RNTR 2‐Rural Alberta (>100 km) 7‐Out of country (USA) 3‐combination 3‐ 65 and older
3‐MNWH 3‐Calgary 8‐Out of country (other)
4‐other
4‐BLTR
4‐Lethbridge5‐test angling 5‐ Urban Alberta (>200 km)
26
Appendix 4. Upper Oldman River drainage daily summary form, 2004. Day: Day Type: WD Stream: Dutch/Racehorse Date: (circle one) WE (circle one) UOM HOL Livingstone Air Temp (@ 1500) Cloud cover % Wind (km/h) Precipitation (mm) Wind Direction Angler vehicles counted (V1) Angler vehicles contacted (V2) Adjustment Factor (V1/V2) Total # of Anglers Total # of Angler Hours
Total # Kept Total # Released Species Captured < 30 cm > 30 cm < 30 cm > 30 cm
27
28
Appendix 5. Estimated Upper Oldman River drainage angler survey data across survey years (95% confidence interval).
Angler Effort River Section 1988 1990 1992 2004
Dutch Creek 1,521 ± 636 1,017 ± 447 1,017 ± 209 1,380 ± 168 Racehorse Creek ND ND ND 1,110 ± 172 Livingstone River 1,798 ± 1,110 966 ± 474 888 ± 226 2,697 ± 321
Estimated number of anglers
Oldman River 2,452 ± 723 2,297 ± 1,146 1,506 ± 307 1,998 ± 160
Dutch Creek 3,676 ± 2,121 2,263 ± 1,208 2,076 ± 485 2794 ± 362 Racehorse Creek ND ND ND 3,214 ± 492 Livingstone River 3,808 ± 2,233 2,058 ± 1,071 1,963 ± 570 8,998 ± 1,314
Estimated number of angling‐h
Oldman River 5,951 ± 2,239 6,042 ± 3,221 3,363 ± 841 5,192 ± 102
Dutch Creek 1.39 0.75 1.2 1.16 Racehorse Creek ND ND ND 1.16 Livingstone River 0.71 0.4 0.86 0.98
CPUE of CTTR (fish/h)
Oldman River 0.99 1.46 1.76 1.35 Abbreviations: ND = No data; CPUE = catch‐per‐unit‐effort; CTTR =cutthroat trout.

CONSERVATIONCONSERVATIONREPORT REPORT SERIESSERIES

The Alberta Conservation Association acknowledges the following partner for their generous support of
this project