Embed Size (px)
Citation preview
Upper ocean salinity stratification in the Tropics as derived from N2 (the buoyancy frequency)
Dr Christophe MaesLaboratoire de Physique des Océans - LPOInstitut de Recherche pour le Développement – IRD
- November 2014 -
OUTLINEGeneral context and Motivations
Data & Method
N2 stratification results
Conclusion & Perspectives
Maes, C., and T. J. O’Kane (2014), Seasonal variations of the upper ocean salinity stratification in the Tropics, J. Geophys. Res. Oceans, 119, doi:10.1002/2013JC009366.
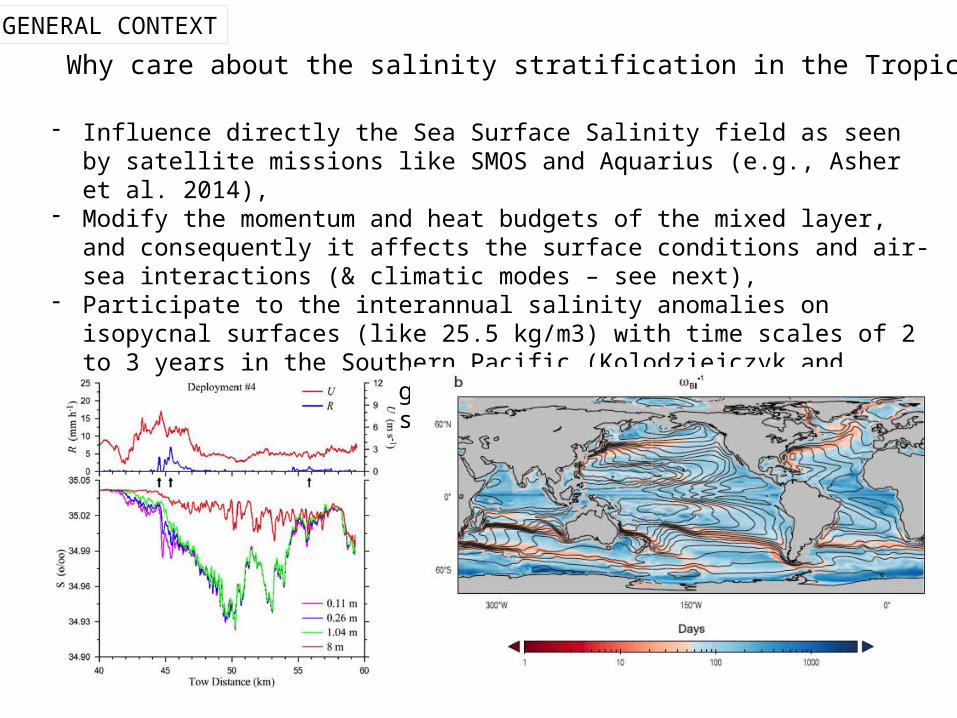
GENERAL CONTEXT
Why care about the salinity stratification in the Tropics?
- Influence directly the Sea Surface Salinity field as seen by satellite missions like SMOS and Aquarius (e.g., Asher et al. 2014),
- Modify the momentum and heat budgets of the mixed layer, and consequently it affects the surface conditions and air-sea interactions (& climatic modes – see next),
- Participate to the interannual salinity anomalies on isopycnal surfaces (like 25.5 kg/m3) with time scales of 2 to 3 years in the Southern Pacific (Kolodziejczyk and Gaillard 2012) or along the ocean storm track connecting the subtropical regions with the Tropics (O’Kane et al. 2014).
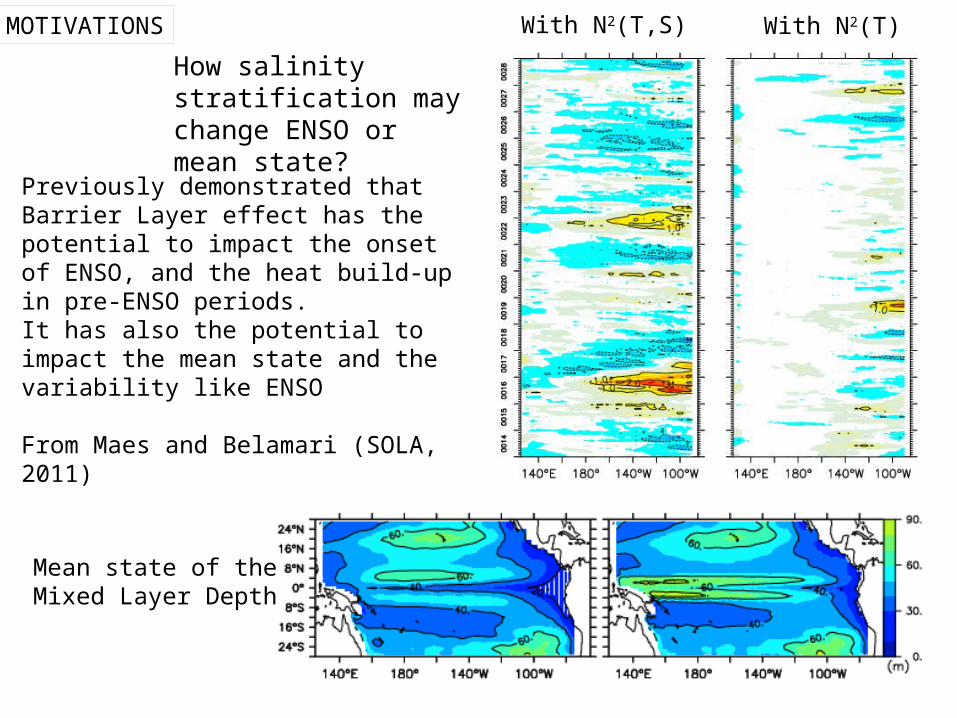
MOTIVATIONS
How salinity stratification may change ENSO or mean state?
With N2(T,S) With N2(T)
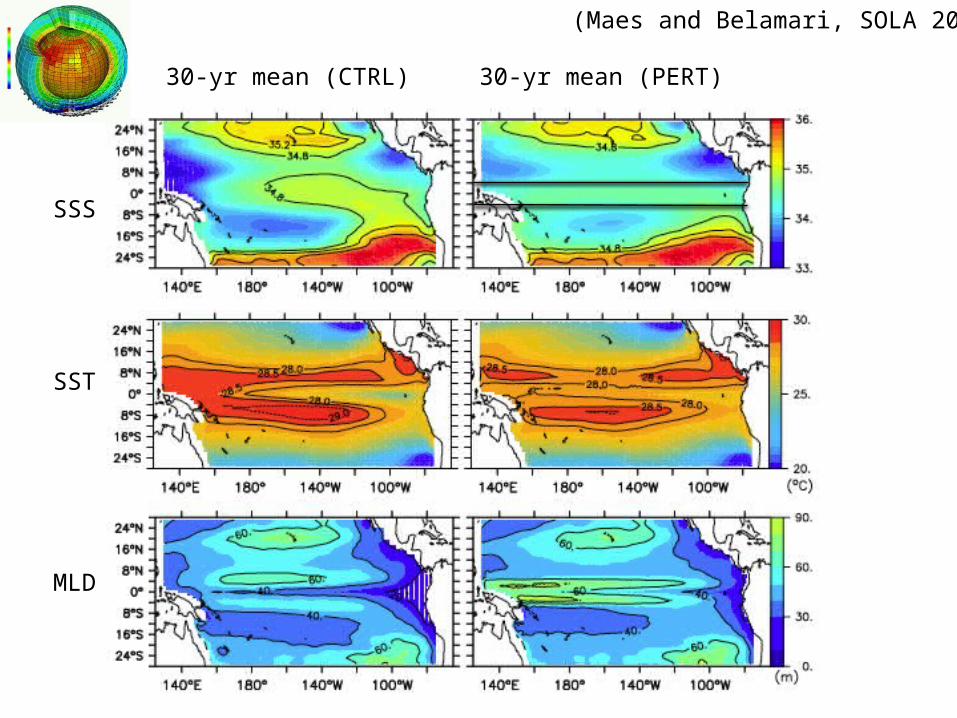
Previously demonstrated that Barrier Layer effect has the potential to impact the onset of ENSO, and the heat build-up in pre-ENSO periods.It has also the potential to impact the mean state and the variability like ENSO
From Maes and Belamari (SOLA, 2011)
Mean state of the Mixed Layer Depth
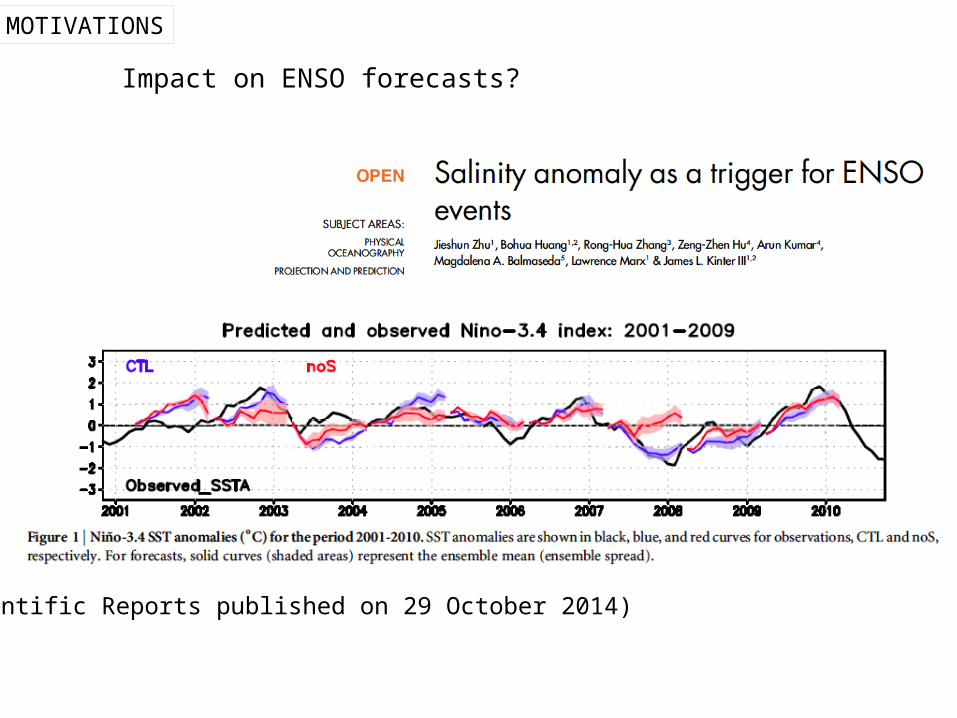
MOTIVATIONS
Impact on ENSO forecasts?
(Scientific Reports published on 29 October 2014)
DATA & METHODWhat product do we have to consider to determine the salinity stratification at the global scales?
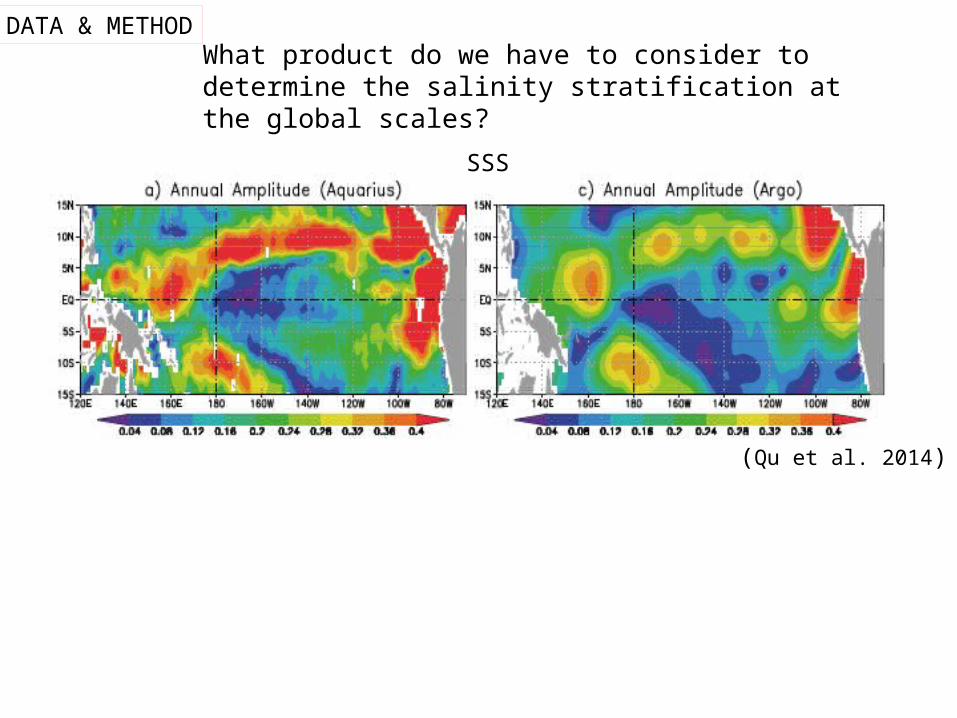
DATA & METHODWhat product do we have to consider to determine the salinity stratification at the global scales?
SSS
(Qu et al. 2014)
DATA & METHOD
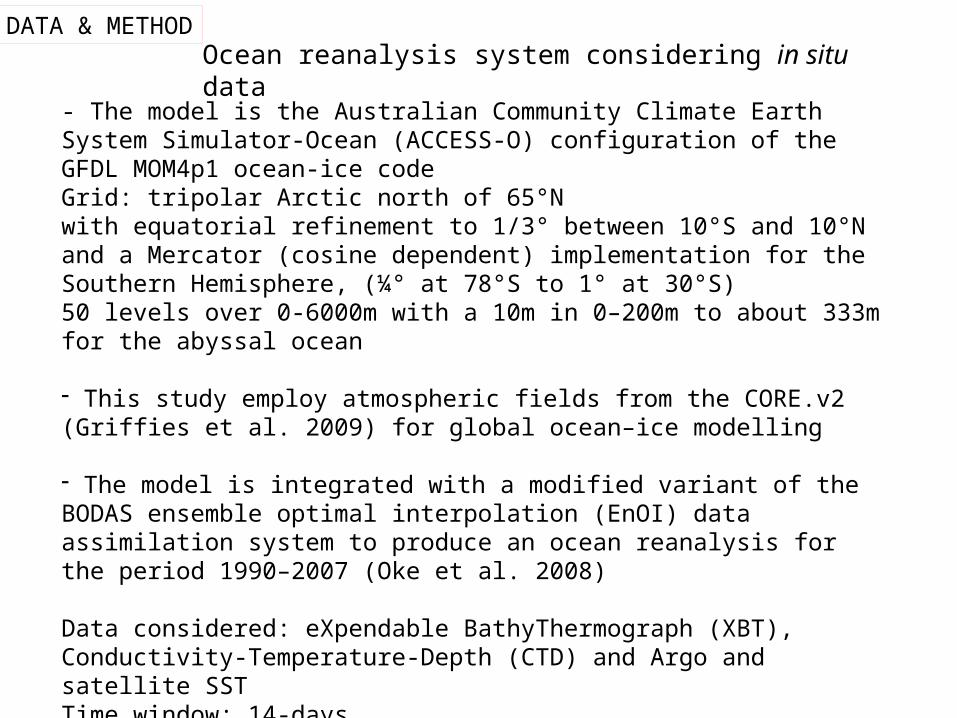
- The model is the Australian Community Climate Earth System Simulator-Ocean (ACCESS-O) configuration of the GFDL MOM4p1 ocean-ice codeGrid: tripolar Arctic north of 65°Nwith equatorial refinement to 1/3° between 10°S and 10°N and a Mercator (cosine dependent) implementation for the Southern Hemisphere, (¼° at 78°S to 1° at 30°S)50 levels over 0-6000m with a 10m in 0–200m to about 333m for the abyssal ocean
- This study employ atmospheric fields from the CORE.v2 (Griffies et al. 2009) for global ocean–ice modelling
- The model is integrated with a modified variant of the BODAS ensemble optimal interpolation (EnOI) data assimilation system to produce an ocean reanalysis for the period 1990–2007 (Oke et al. 2008)
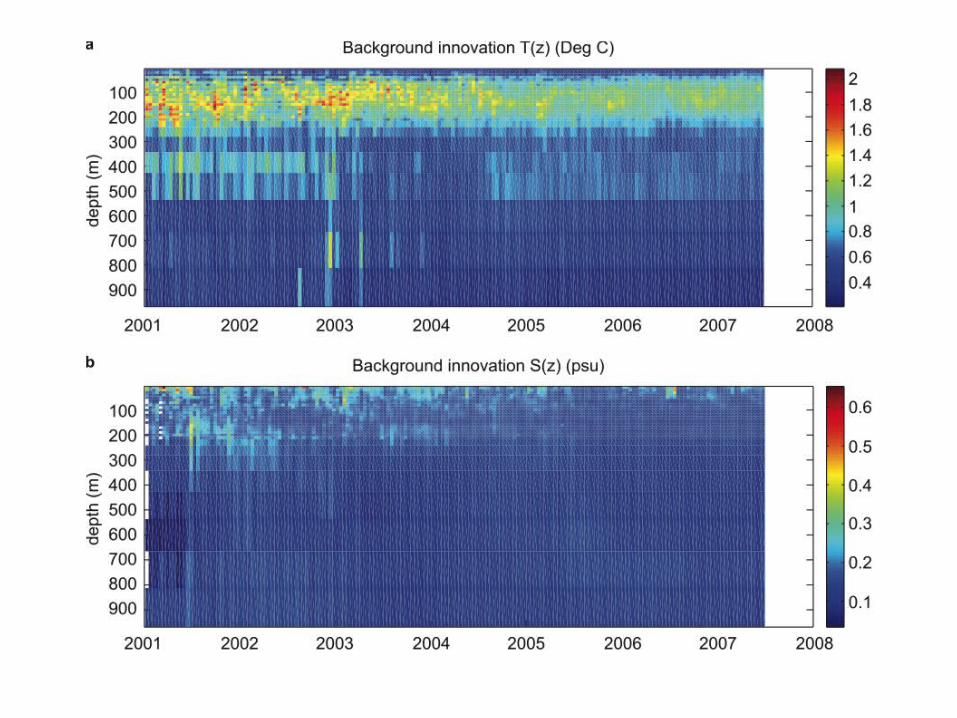
Data considered: eXpendable BathyThermograph (XBT), Conductivity-Temperature-Depth (CTD) and Argo and satellite SST Time window: 14-days
Ocean reanalysis system considering in situ data
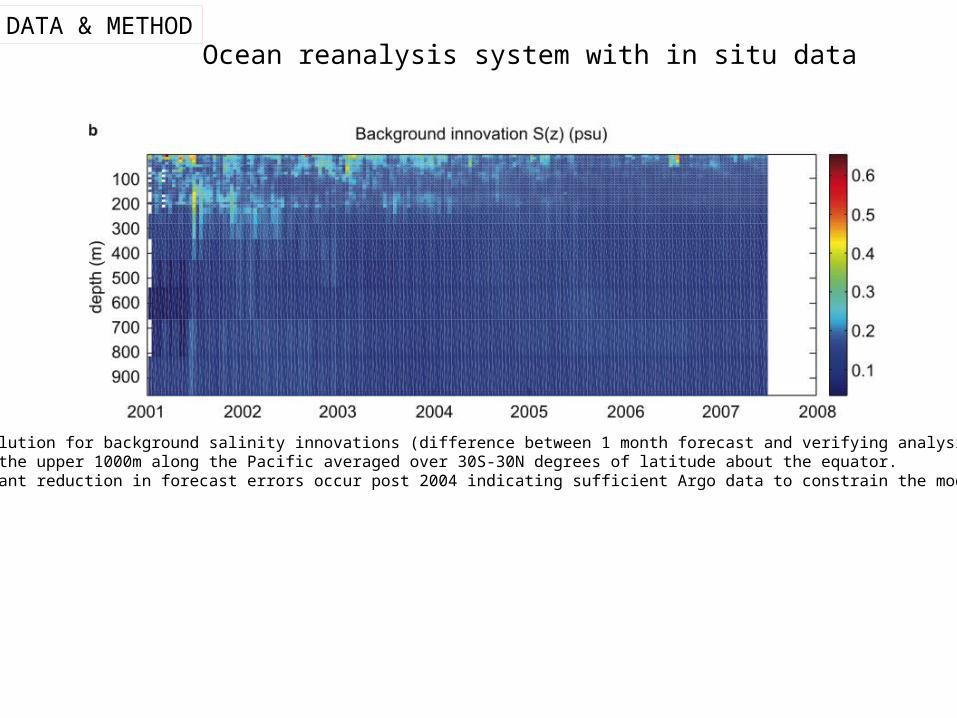
DATA & METHODOcean reanalysis system with in situ data
Time evolution for background salinity innovations (difference between 1 month forecast and verifying analysis) through the upper 1000m along the Pacific averaged over 30S-30N degrees of latitude about the equator. Significant reduction in forecast errors occur post 2004 indicating sufficient Argo data to constrain the model.
DATA & METHOD
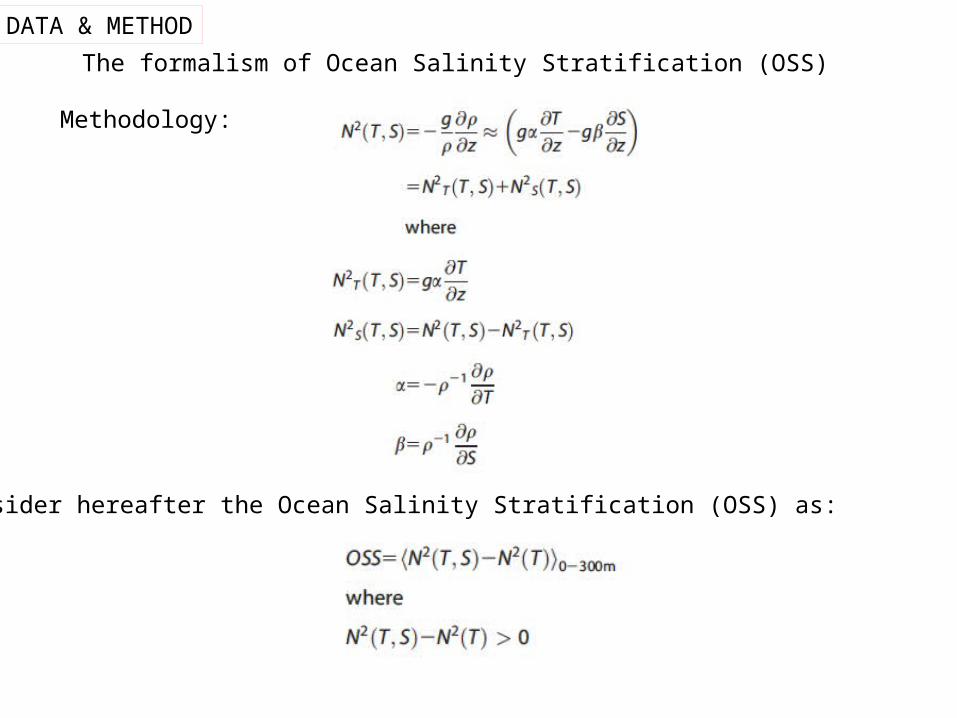
We consider hereafter the Ocean Salinity Stratification (OSS) as:
Methodology:
The formalism of Ocean Salinity Stratification (OSS)
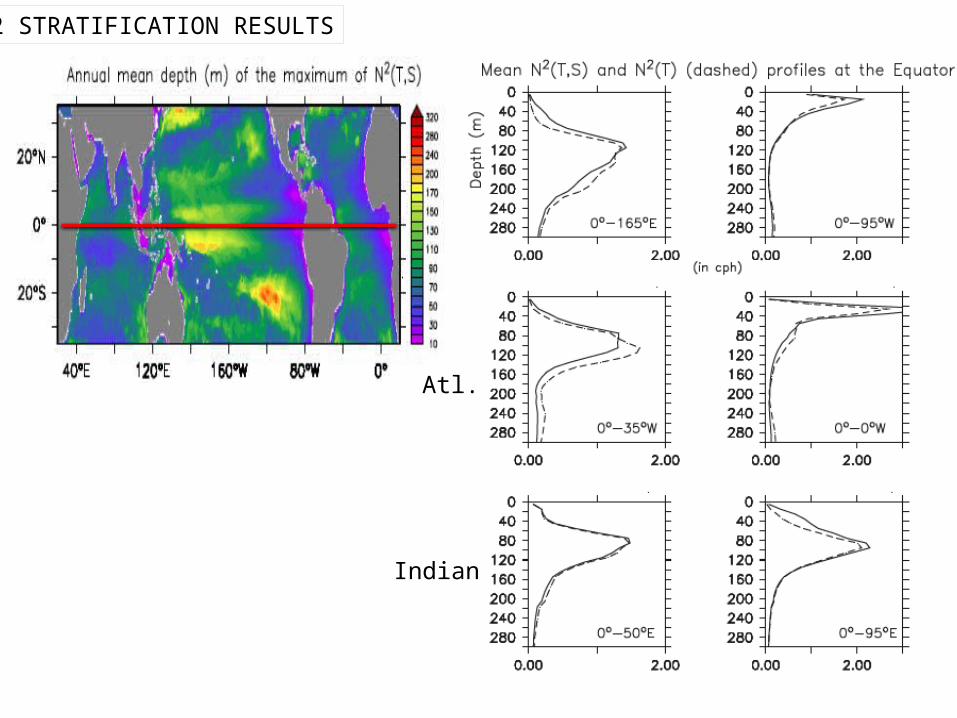
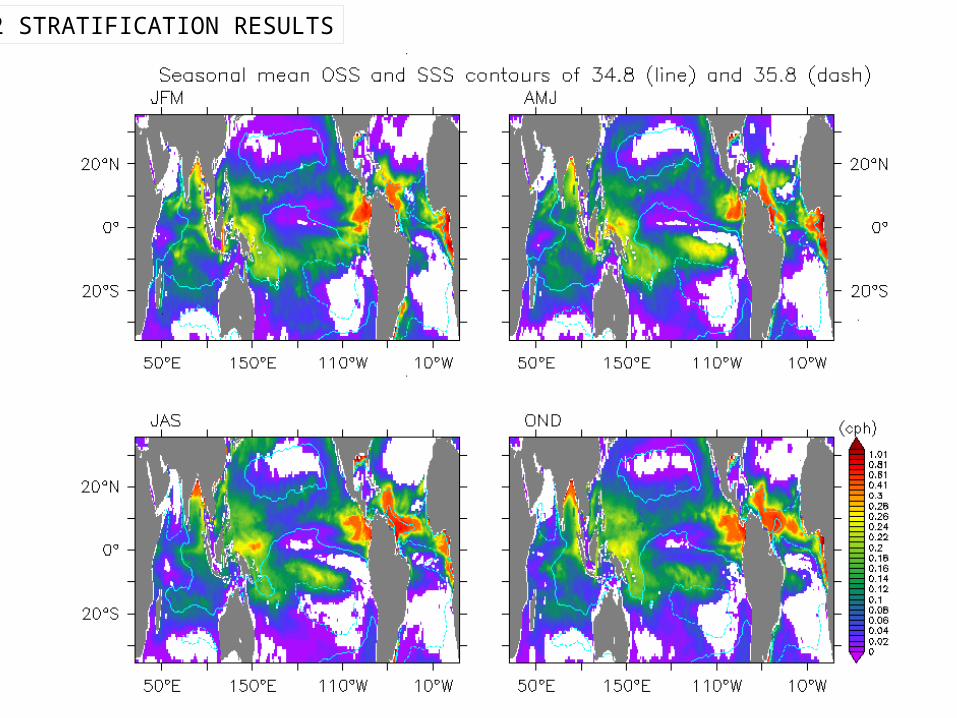
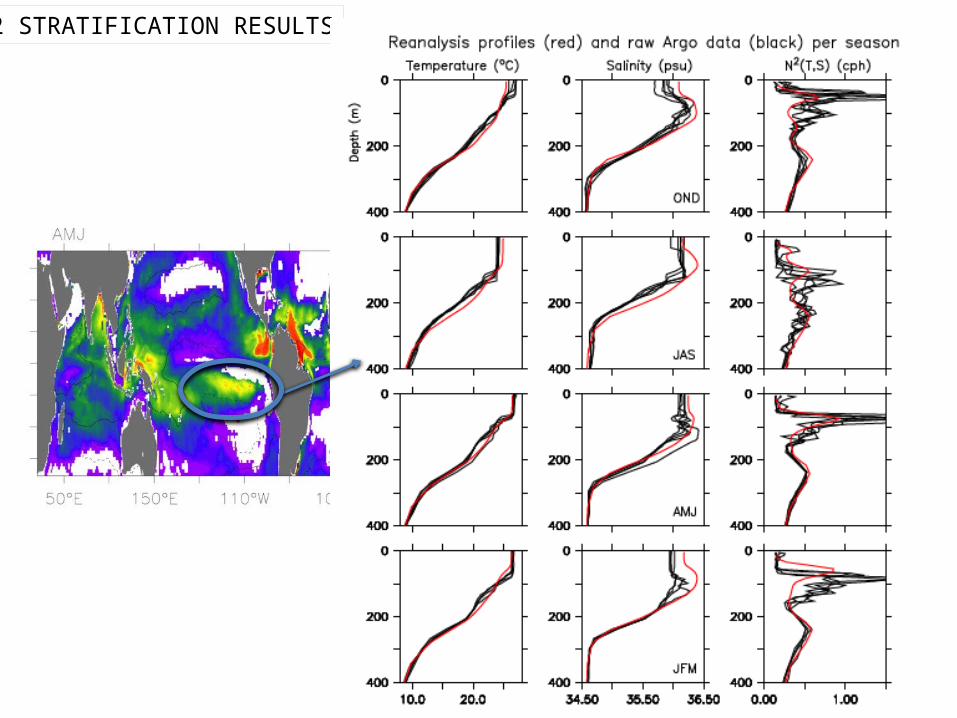
N2 STRATIFICATION RESULTS
Atl.
Indian
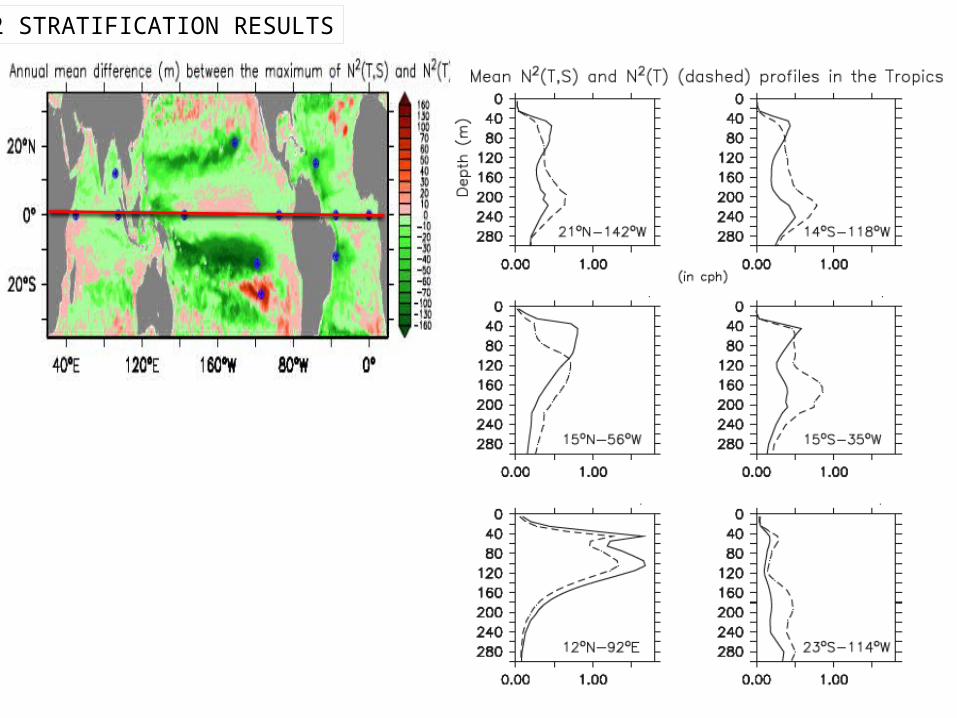
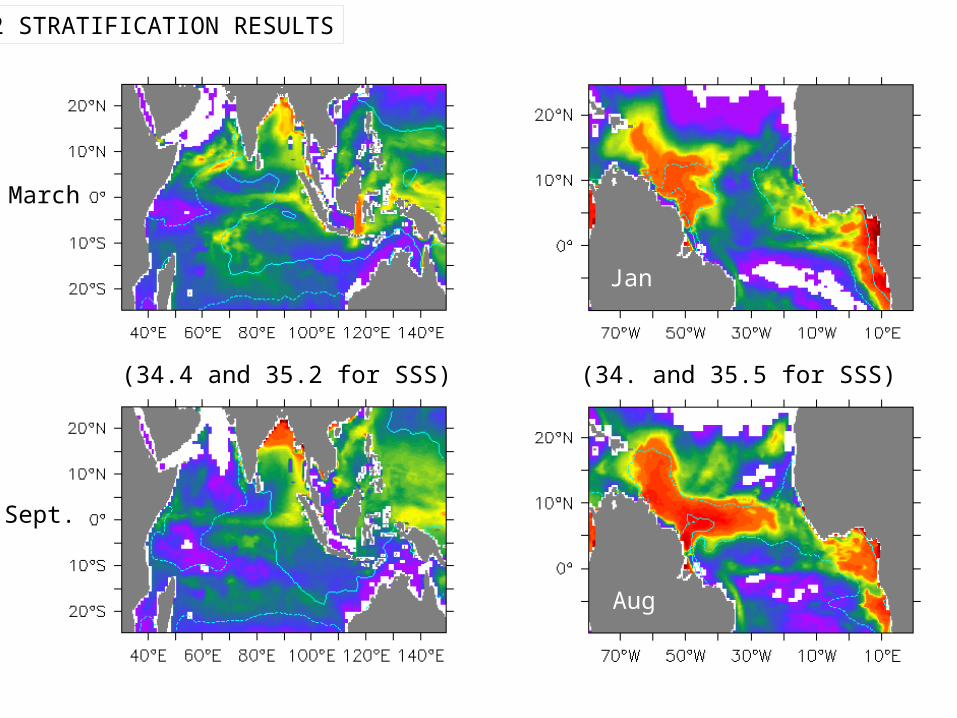
N2 STRATIFICATION RESULTS
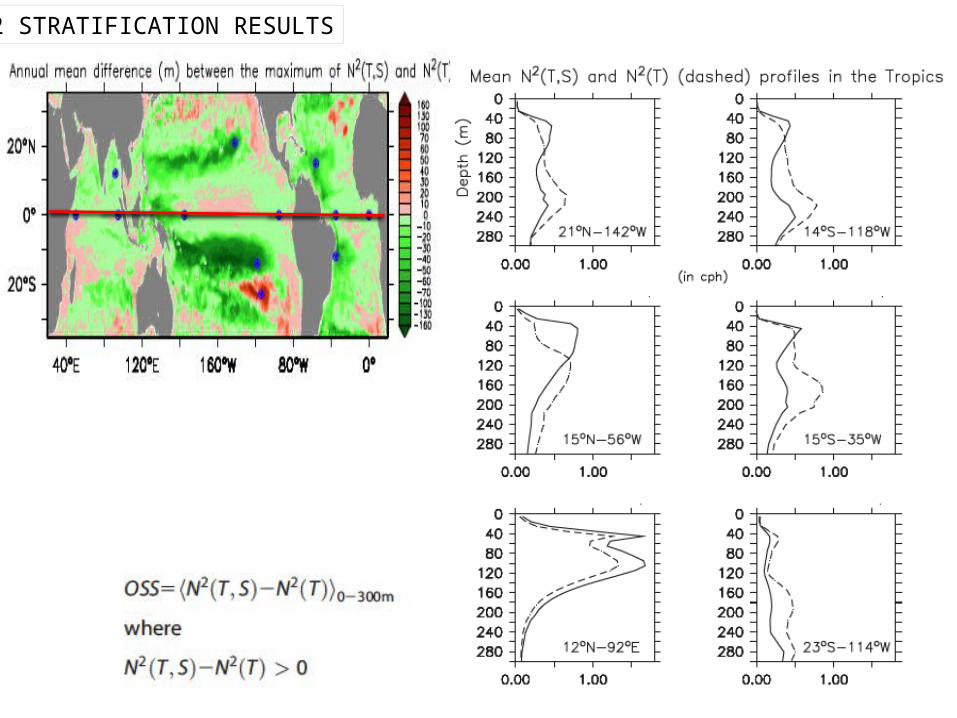
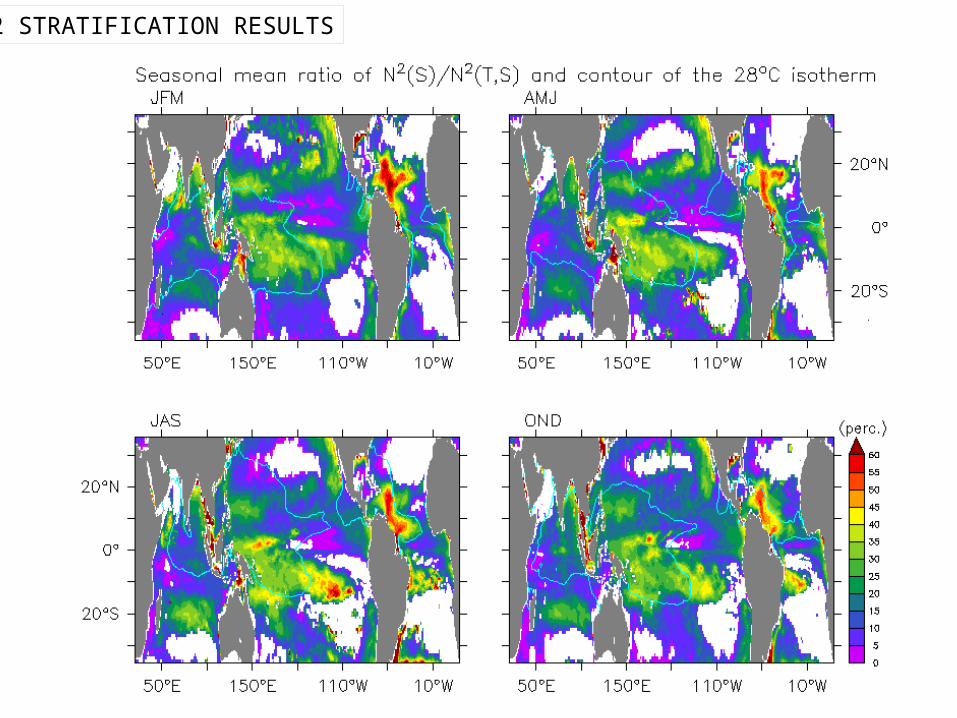
N2 STRATIFICATION RESULTS
N2 STRATIFICATION RESULTS
N2 STRATIFICATION RESULTS
March
Sept.
Jan
Aug
(34.4 and 35.2 for SSS) (34. and 35.5 for SSS)
N2 STRATIFICATION RESULTS
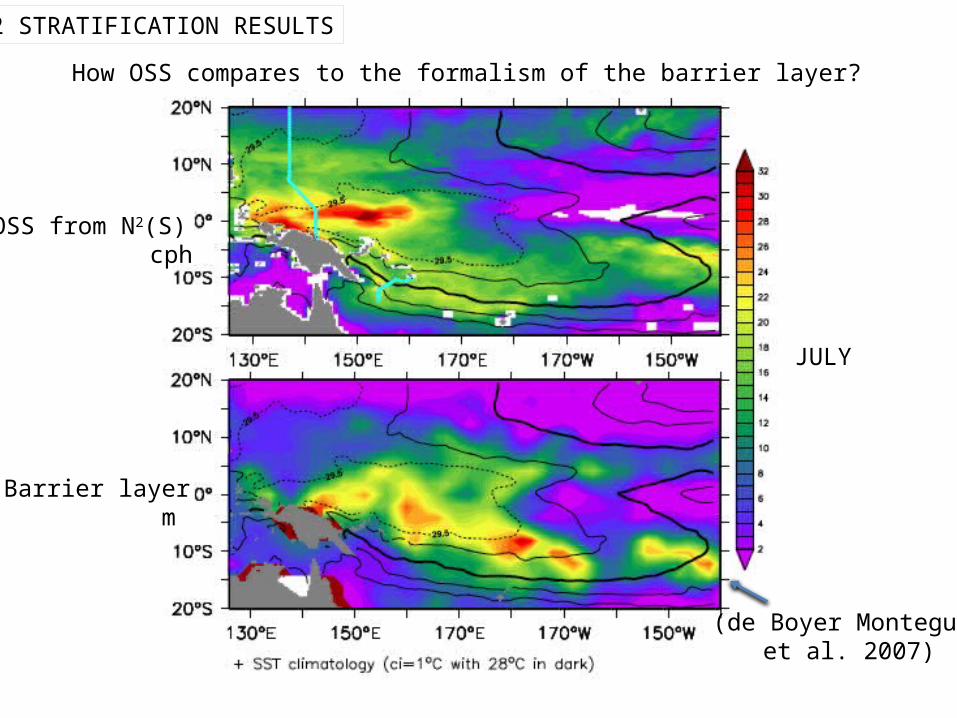
N2 STRATIFICATION RESULTS
(de Boyer Montegut et al. 2007)
Barrier layer m
OSS from N2(S) cph
How OSS compares to the formalism of the barrier layer?
JULY
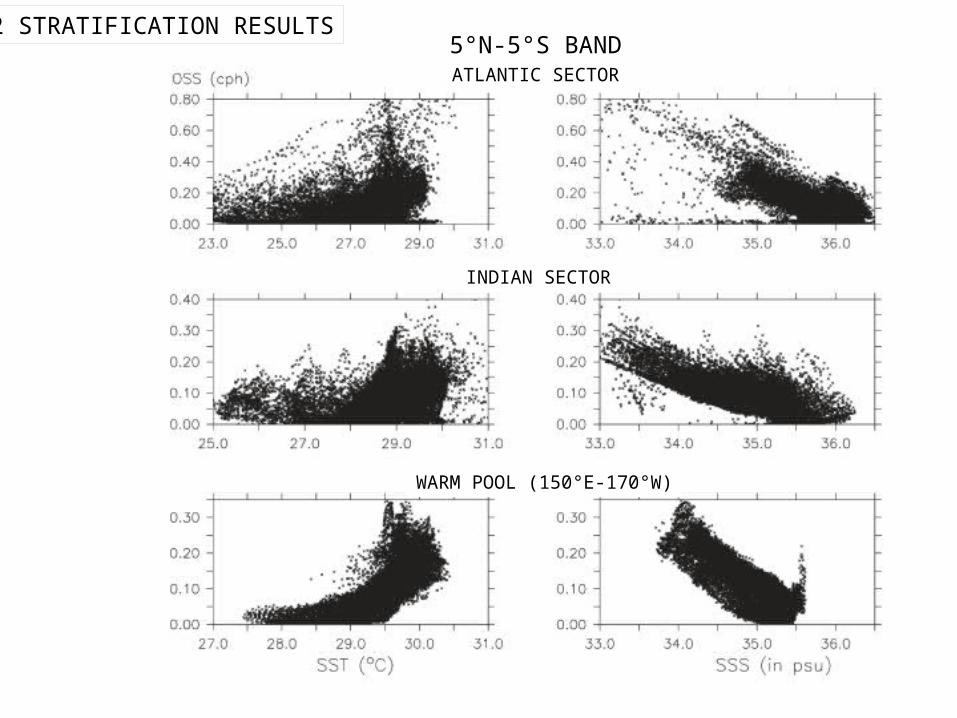
N2 STRATIFICATION RESULTS5°N-5°S BAND
WARM POOL (150°E-170°W)
INDIAN SECTOR
ATLANTIC SECTOR
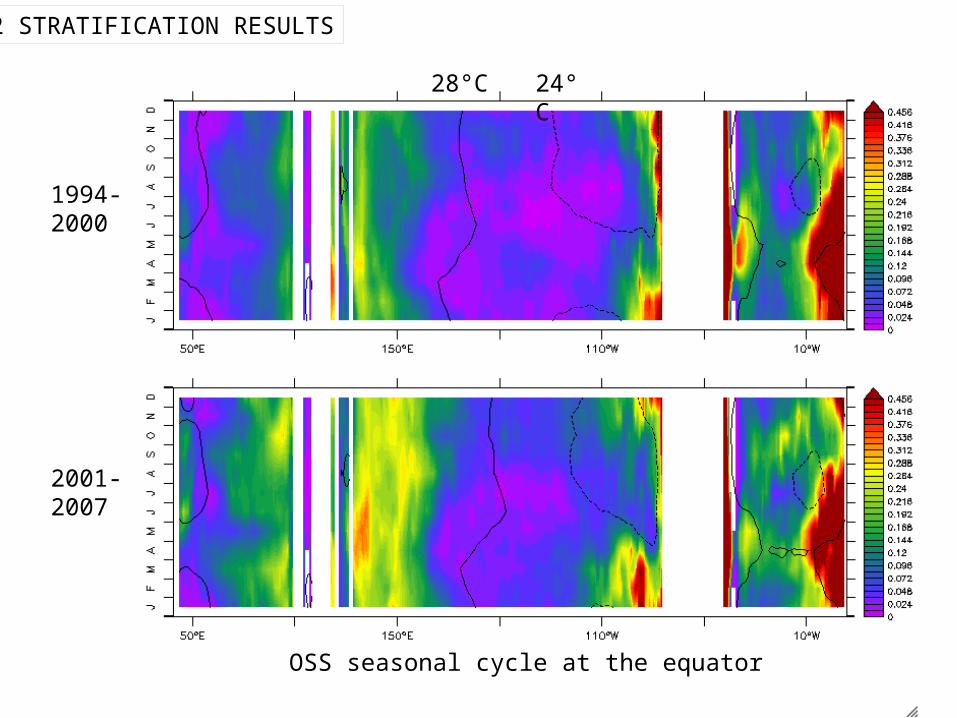
N2 STRATIFICATION RESULTS
28°C 24°C
1994-2000
2001-2007
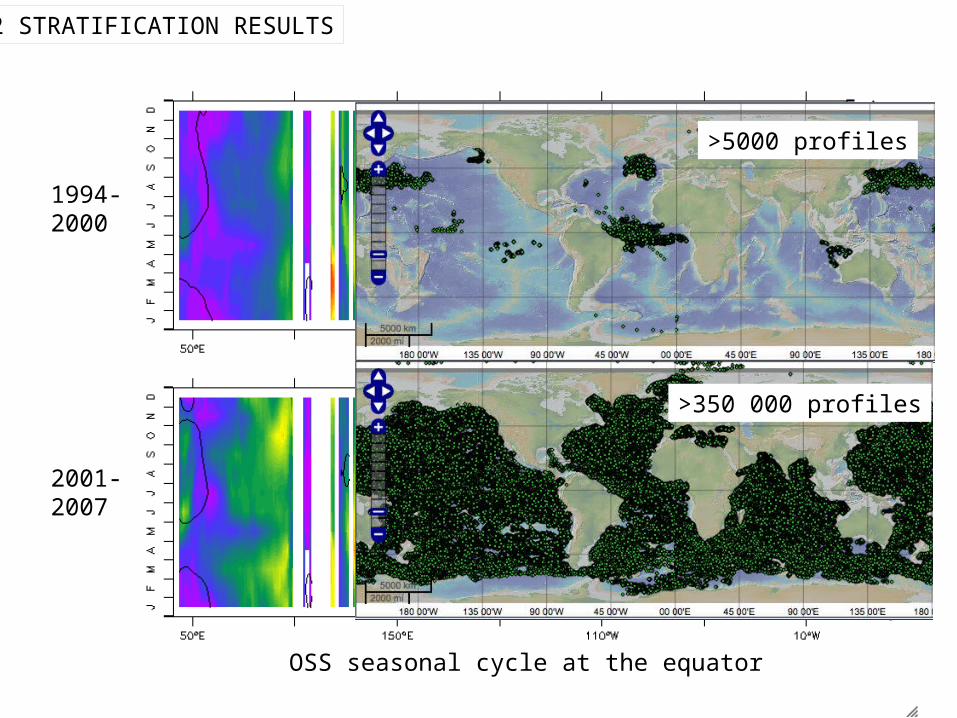
OSS seasonal cycle at the equator
N2 STRATIFICATION RESULTS
28°C 24°C
1994-2000
2001-2007
>5000 profiles
>350 000 profiles
OSS seasonal cycle at the equator
CONCLUSION AND PERSPECTIVES
* The Ocean Salinity Stratification (stabilizing part of N2 that is due to salinity only) is a natural variable of ocean dynamics,
* In regions where the stratification of temperature and salinity differs between the base of the mixed layer and the top of the pycnocline, both the OSS and Barrier Layer (BLT) agree relatively well; however, unlike the BLT the OSS can be significant in regions where both T and S are mixed over the same depthThe contribution of the OSS to N2 could be as large as 40-50% of the contribution of the thermal stratification at the seasonal timescales,
* The seasonal variability of the OSS is mainly dominated by the annual first harmonics,
* Many regions of the Tropics exhibit a tight scatter relationship with SSS
Deploy, deploy…
SMOS-Mission Oceanographic Data ExploitationSMOS-MODE
SMOS-MODE supports the network of SMOS ocean-related R&D
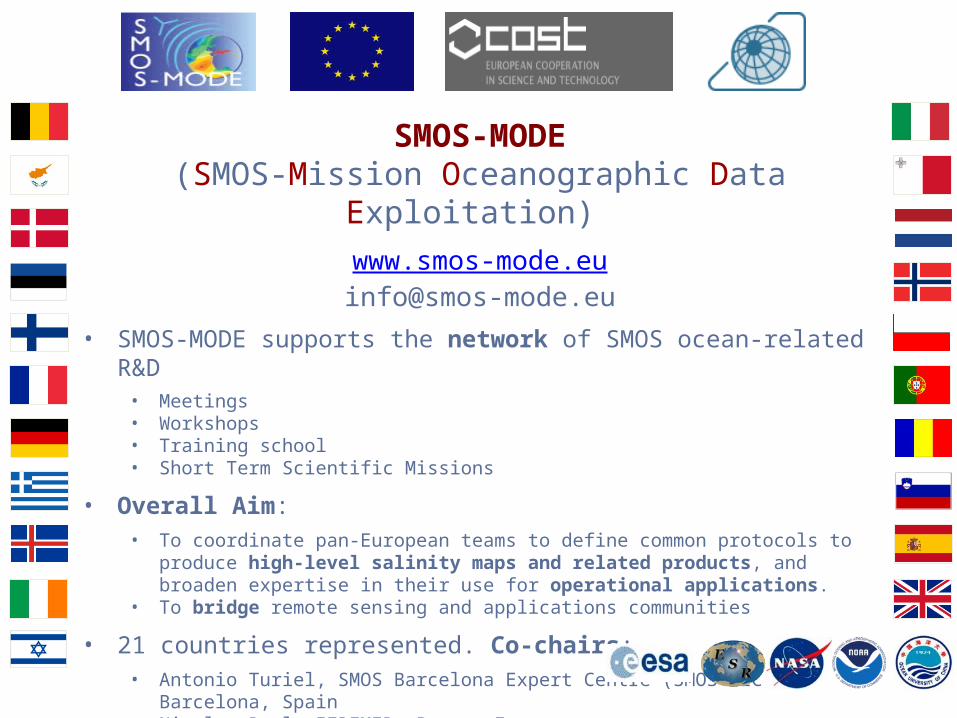
SMOS-MODE(SMOS-Mission Oceanographic Data Exploitation)
• SMOS-MODE supports the network of SMOS ocean-related R&D• Meetings• Workshops• Training school• Short Term Scientific Missions
• Overall Aim:• To coordinate pan-European teams to define common protocols to produce high-level salinity
maps and related products, and broaden expertise in their use for operational applications.• To bridge remote sensing and applications communities
• 21 countries represented. Co-chairs: • Antonio Turiel, SMOS Barcelona Expert Centre (SMOS-BEC), Barcelona, Spain • Nicolas Reul, IFREMER, Brest, France
• Last meeting during 2nd SMOS Science Conference

ADDITIONAL MATERIAL
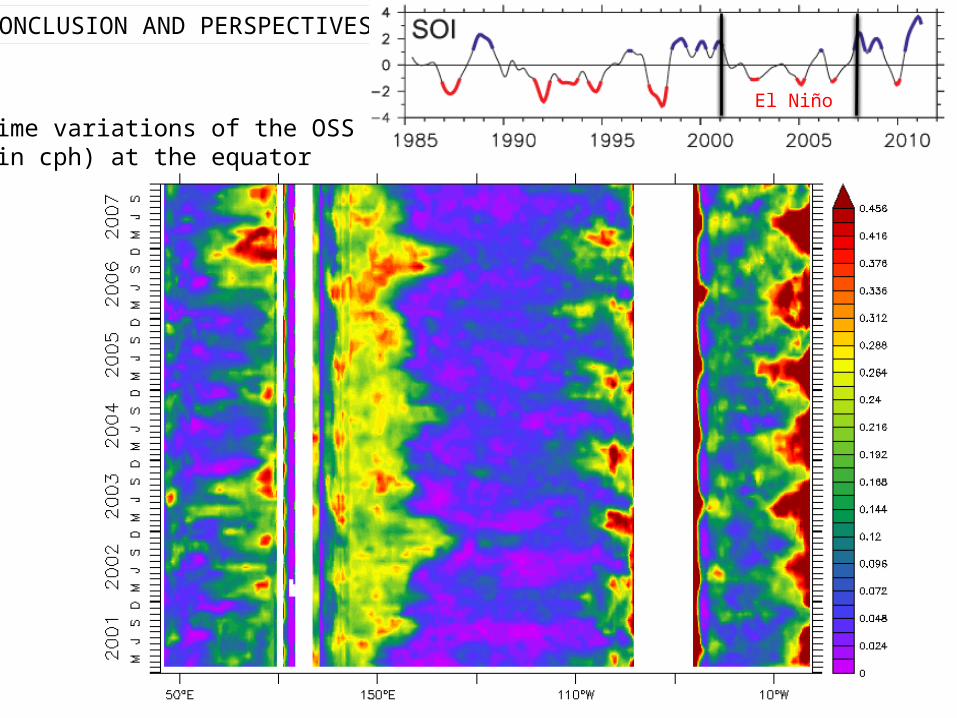
CONCLUSION AND PERSPECTIVES
Time variations of the OSS (in cph) at the equator
El Niño
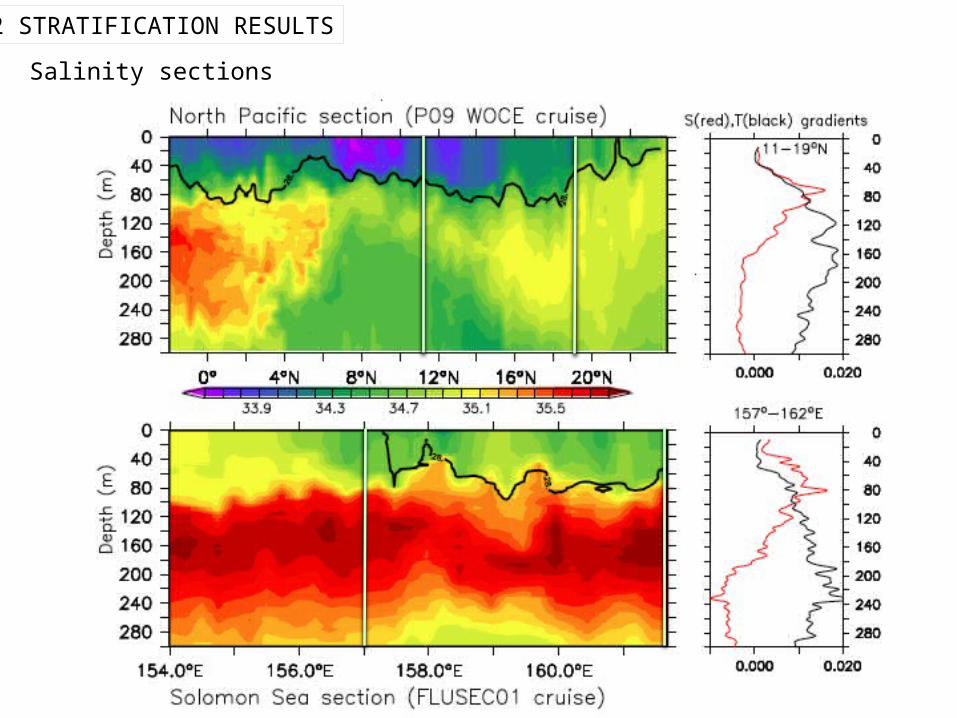
N2 STRATIFICATION RESULTS
Salinity sections
N2 STRATIFICATION RESULTS
30-yr mean (PERT)
SSS
SST
MLD
30-yr mean (CTRL)
(Maes and Belamari, SOLA 2011)