Embed Size (px)
Citation preview

Technical Report - 2014 - 080
Mapping and Assessment of Ecosystems and their Services
Indicators for ecosystem assessments under Action 5 of the EU Biodiversity Strategy to 2020
2nd Report – Final, February 2014
Environment

Europe Direct is a service to help you find answers to your questions about the European Union
New freephone number:00 800 6 7 8 9 10 11
A great deal of additional information on the European Union is available on the Internet.It can be accessed through the Europa server (http://ec.europa.eu).
ISBN 978-92-79-36161-6doi: 10.2779/75203
© European Union, 2014Reproduction is authorised provided the source is acknowledged.

Mapping and Assessment of Ecosystems and their Services
Indicators for ecosystem assessments under Action 5 of the EU Biodiversity Strategy to 2020
2nd Report – Final, February 2014
Summary
The second MAES report presents indicators that can be used at European and Member State's level to map and assess biodiversity, ecosystem condition and ecosystem services according to the Common International Classification of Ecosystem Services (CICES v4.3).
This work is based on a review of data and indicators available at national and European level and is applying the MAES analytical framework adopted in 2013.

Mapping and Assessment of Ecosystems and their Services
5 | P a g e
CONTENTS
EXECUTIVE SUMMARY ....................................................................................................................................................... 7
1 INTRODUCTION ........................................................................................................................................................... 9 1.1 Context ............................................................................................................................................................................................................ 9 1.2 The importance of MAES and Action 5 ...................................................................................................................................... 10
1.2.1 Biodiversity policy .......................................................................................................................................................................... 10 1.2.2 Common Agricultural Policy ..................................................................................................................................................... 11 1.2.3 Forest policy ...................................................................................................................................................................................... 12 1.2.4 Water policy ...................................................................................................................................................................................... 12 1.2.5 Climate action .................................................................................................................................................................................. 13 1.2.6 Marine policy ..................................................................................................................................................................................... 13 1.2.7 Regional policy ................................................................................................................................................................................. 14 1.2.8 Research .............................................................................................................................................................................................. 15
1.3 Experience based on country cases ............................................................................................................................................. 15 1.3.1 Key challenges ................................................................................................................................................................................. 16
1.4 Structure of the report ........................................................................................................................................................................ 17
2 THE SIX PILOTS AND THE COMMON ASSESSMENT FRAMEWORK ............................................................. 18 2.1 Set up and description of the pilot studies ............................................................................................................................. 18 2.2 A common approach for the ecosystem pilots ..................................................................................................................... 18
2.2.1 Map ecosystems: Identification of data for ecosystem mapping ...................................................................... 20 2.2.2 Assess the condition of ecosystems: Review of data and indicators for ecosystem assessment ... 20 2.2.3 Map and assess ecosystem services: Reference frame for ecosystem services mapping and assessment. .............................................................................................................................................................................................................. 20 2.2.4 Integration of the two assessments: Reference frame linking condition of ecosystems to their services. .................................................................................................................................................................................................................. 21 2.2.5 Working procedure ......................................................................................................................................................................... 21
3 MAPPING ECOSYSTEMS ........................................................................................................................................ 24
4 ASSESSING ECOSYSTEM CONDITION ................................................................................................................ 27 4.1 Results from the ecosystem pilots .............................................................................................................................................. 27 4.2 Towards an EU-wide assessment of ecosystems and their conditions .................................................................. 29 4.3 The use of Article 17 data for mapping and assessment .............................................................................................. 32
4.3.1 The use of data generated in the context of the Habitats and Birds’ Directives. ...................................... 32 4.3.2 Other global and pan-European sources of information/data in relation to species and habitats. 33 4.3.3 National, regional and local data sets relating to species, species groups and habitats. .................... 33
5 ASSESSING ECOSYSTEM SERVICES ................................................................................................................... 34 5.1 Forest services ......................................................................................................................................................................................... 34
5.1.1 Provisioning services .................................................................................................................................................................... 34 5.1.2 Regulating/ maintenance services ........................................................................................................................................ 36 5.1.3 Cultural services .............................................................................................................................................................................. 38 5.1.4 Strengths and weaknesses ....................................................................................................................................................... 39 5.1.5 Key references for forest ecosystem services ............................................................................................................... 39

Mapping and Assessment of Ecosystems and their Services
6 | P a g e
5.2 Cropland and grassland services .................................................................................................................................................. 40 5.2.1 Provisioning services .................................................................................................................................................................... 41 5.2.2 Regulating/Maintenance Services .......................................................................................................................................... 43 5.2.3 Cultural services .............................................................................................................................................................................. 45
5.3 Freshwater services .............................................................................................................................................................................. 46 5.3.1 Provisioning Services .................................................................................................................................................................... 47 5.3.2 Regulating/ Maintenance Services ........................................................................................................................................ 48 5.3.3 Cultural Services ............................................................................................................................................................................. 53
5.4 Marine services ....................................................................................................................................................................................... 53 5.4.1 Provisioning services .................................................................................................................................................................... 54 5.4.2 Regulating/ maintenance services ........................................................................................................................................ 55 5.4.3 Cultural services .............................................................................................................................................................................. 55
5.5 Lessons learned ...................................................................................................................................................................................... 59 5.5.1 Similarities and differences between the ecosystem pilots .................................................................................. 59 5.5.2 The use of the MAES typology as classification of ecosystems ......................................................................... 60 5.5.3 The use of CICES as classification for ecosystem services .................................................................................... 60
5.6 Key recommendations based on the ecosystem pilots .................................................................................................... 62
6 NATURAL CAPITAL ACCOUNTING ....................................................................................................................... 64
7 TOWARDS INTEGRATED MAPPING AND ASSESSMENT ................................................................................ 66 7.1 Linking biodiversity and ecosystem condition to human well-being ........................................................................ 66 7.2 A tiered approach to mapping and assessing ecosystem services ........................................................................... 68
7.2.1 Tier 1 – Ecosystem service mapping using available indicators ......................................................................... 68 7.2.2 Tier 2 – Ecosystem services mapping linking different indicators with land use data .......................... 68 7.2.3 Tier 3 - Model-based approaches to map ecosystem services ............................................................................ 68
7.3 The Ecosystem Services Partnership Visualization tool: an interactive knowledge platform for ecosystem service maps ........................................................................................................................................................................................... 70
8 CONCLUSIONS AND NEXT STEPS ....................................................................................................................... 72
REFERENCES ...................................................................................................................................................................... 74
ABBREVIATIONS ............................................................................................................................................................... 76
ANNEX 1: GLOSSARY OF TERMS .................................................................................................................................. 78

Mapping and Assessment of Ecosystems and their Services
7 | P a g e
EXECUTIVE SUMMARY
Action 5 of the EU Biodiversity Strategy to 2020 foresees that Member States will, with the assistance of the Commission, map and assess the state of ecosystems and their services in their national territory by 2014. Following the adoption of an analytical framework, the Working Group MAES, which steers the implementation of Action 5 decided to test it based on the outcomes of six thematic pilots.
Four of the pilots focused on Europe’s main ecosystem types: agro-ecosystems, forest ecosystems, freshwater ecosystems and marine ecosystems. A further pilot focused on the use of conservation status data for assessing the state of ecosystems and of the associated delivery of services. The final pilot addressed the challenge of natural capital accounts.
In these pilots EU services worked hand in hand with Member States to make a review of national and European data and indicators to assess the condition of ecosystems, to quantify biodiversity and to map and assess their services.
The pilot studies contributed indicators, which can be used for mapping and assessing biodiversity, ecosystem condition and ecosystem services according to the Common International Classification of Ecosystem Services (CICES v4.3). The way information is structured is presented in a graph.
Quick guidance for mapping and assessing ecosystems and their services

Mapping and Assessment of Ecosystems and their Services
8 | P a g e
A first European map of ecosystems according to the MAES typology is provided in Chapter 3.
Indicators for the assessment of biodiversity and condition are presented in Chapter 4. Two pieces of information are provided: a set of available indicators based on the four thematic pilot studies, which is complemented by a review of information that is available at EU scale.
Indicators for the assessment of ecosystem services are presented in Chapter 5. This chapter reports in detail on the selection of indicators per ecosystem type (or per pilot study). This information can be used by Member States in at least two possible ways. Firstly, all information is available per ecosystem type, which enables an in-depth assessment of services provided by priority ecosystems. Indicator colour codes identify strengths, weaknesses and possible data gaps offering additional information to users in terms of applicability and representativeness of each indicator. Secondly, this report presents a synthesis table, which contains indicators that are spatially explicit and readily available at national and EU scale. This indicator set is designed in such a way that they assess ecosystem services delivered by the most important supplying ecosystems. Depending on the availability of the data, this table can be used for a rapid assessment of ecosystem services at national scale.
Chapter 6 of this report summarised the progress made on natural capital accounting.
Chapter 7 elaborates further on mapping issues. In particular, this report introduces a tiered mapping approach from simple to complex on how to map ecosystem services. Tier 1 is strongly based on land cover land use information and involves the use of the ecosystem map presented in this report. Tier 2 is based on the mapping of indicators on land cover data. Tier 3 refers to a modelling approach.
Importantly, the authors stress the pilot-based approach of this study, which is exclusively built on the voluntary contributions of participating Member States and EU services. Clearly, some Member States have made substantially more progress in the development of an indicator framework for ecosystem assessment than is reported in this report. The MAES analytical framework developed in 2013 was designed to accommodate to a large extent the views and concepts of leading Member States so that their assessments serve as examples of good practise.
This report provides “working guidance” on suitable approaches for the Member States for mapping and assessment based on spatial information and indicators. Therefore, the experience arising from the application of currently available methods and indicators is open for commenting and will be reviewed again in 2015.
The outcome of this report is reflecting the best-available assessment of suitable data sets and indicators for mapping and assessing ecosystems and their services under Action 5 of the EU Biodiversity Strategy. Nevertheless, the recommendations for the use of maps and indicators presented here should be taken as a first working version on which feedback is welcome in order to continue improving guidance to Member States.
Supporting documents from the Pilots' work can be found at https://circabc.europa.eu/w/browse/837b3dda-6b1a-4316-a554-723e31062c8f
Relevant reports from EEA can be found at http://projects.eionet.europa.eu/eea-ecosystem-assessments.

Mapping and Assessment of Ecosystems and their Services
9 | P a g e
Mapping and Assessment of Ecosystems and their Services I N D I C A T O R S F O R E C O S Y S T E M A S S E S S M E N T S U N D E R A C T I O N 5 O F T H E E U B I O D I V E R S I T Y S T R A T E G Y T O 2 0 2 0
1 INTRODUCTION
1.1 Context Action 5 of the Biodiversity Strategy foresees that Member States will, with the assistance of the Commission, map and assess the state of ecosystems and their services in their national territory by 2014, assess the economic value of such services, and promote the integration of these values into accounting and reporting systems at EU and national level by 2020.
The Working Group on Mapping and Assessment on Ecosystems and their Services (MAES) is mandated to co-ordinate and oversee Action 5. In 2012, the working group developed ideas for a coherent analytical framework to ensure consistent approaches are used. The report adopted in April 2013 (1) proposes a conceptual framework linking biodiversity, ecosystem condition and ecosystem services to human well-being. Furthermore, it develops a typology for ecosystems in Europe and promotes the CICES1 classification for ecosystem services.
Following the adoption of the analytical framework, the Working Group MAES decided to test it and in order to do so set up six thematic pilots. Four of the pilots focused on the main ecosystem types: agro-ecosystems (cropland and grassland), forest ecosystems, freshwater ecosystems (rivers, lakes, groundwater and wetlands), and marine ecosystems (transitional waters and marine inlets, coastal ecosystems, the shelf, the open ocean). A further pilot focused on the use of conservation status assessment data (cf. under Article 17 of the Habitats Directive) for assessing the condition of ecosystems and of the associated delivery of services. The final pilot addressed the challenge of natural capital accounts, which is an important part of Action 5 of the EU 2020 Biodiversity Strategy. These themes were in line with the recommendations from the 2012 MAES Stakeholder workshop2 where Member States expressed their priorities for activities under Action 5 of the EU 2020 Biodiversity Strategy. All pilots build on the MAES Analytical Framework and the proposed ecosystem typology and ecosystem service classification and on the activities and information available from Member States, the European Commission Services and the European Environment Agency (EEA).
This report provides working guidance to the Member States on how to map and assess the state of ecosystems and of their services, based on the outcomes of the pilot studies. The outcome of this report is considered to be based on the best-available assessment of suitable data sets and
1 The Common International Classification of Ecosystem Services (CICES) is linked with the Framework of the UN System of Environmental Economic Accounts (SEEA). 2 See https://circabc.europa.eu/w/browse/ff690df1-2fdc-414c-b0a3-12b48e35f207

Mapping and Assessment of Ecosystems and their Services
10 | P a g e
indicators. Nevertheless, the outcomes presented here should be taken as a first working version on which feedback is awaited that will be reflected in future versions.
1.2 The importance of MAES and Action 5 The work being carried out on the mapping and assessment of ecosystems and ecosystem services is important for the advancement of biodiversity objectives, and also to inform the development and implementation of related policies, on water, climate, agriculture, forest, and regional planning (Fig. 1). Robust, reliable and comparable data are also important for the planning and implementation of individual projects.
Figure 1. Example to illustrate inputs of Action 5 into other policies.
1.2.1 Biodiversity policy
The mapping and assessment of ecosystems and their services is an essential part of the EU Biodiversity Strategy to 2020 and a necessary condition to make ecosystems and their services key parameters informing planning and development processes and decisions.
High quality and consistent information on the condition of ecosystems and the services provided by those ecosystems will be needed in order to identify priorities for restoration, support the deployment of Green Infrastructure and enable the development of a No Net Loss initiative (actions 6a, 6b and 7b of the EU 2020 Biodiversity Strategy).

Mapping and Assessment of Ecosystems and their Services
11 | P a g e
1.2.2 Common Agricultural Policy Target 3 of the EU 2020 Biodiversity Strategy addresses the integration of biodiversity concerns into the development and implementation of EU policy on Agriculture and Forestry. Agriculture is a major land use in the EU28, covering about 47% of the land surface. The Common Agricultural Policy (CAP) is entering a new programming period (2014-2020), with the introduction of an enhanced environmental component in Pillar 1 of the CAP (income support to farmers). In the revised CAP, 30% of direct payments are allocated to “green” measures predominantly focussed on the following three actions:
• Maintenance of permanent grassland; • Crop diversification: a farmer must cultivate at least 2 crops when the arable land exceeds 10 hectares
and at least 3 crops when the arable land exceeds 30 hectares. The main crop may cover at most 75% of arable land, and the two main crops at most 95% of the arable area;
• Ecological Focus Areas (EFAs): at least 5% of the arable area of holdings with an arable area larger than 15 hectares must be allocated to EFAs (i.e. field margins, hedges, trees, fallow land, landscape features, biotopes, buffer strips, afforested area). This figure may rise to 7% after reporting from the European Union in 2017 and subject to a legislative proposal.
Furthermore, under Pillar II (Rural Development) of the revised CAP there are three long-term strategic objectives in the programming period 2014-202, one of which is “the sustainable management of natural resources and climate action”. This over-arching objective is further broken down into six priorities, one of which is “Restoring, preserving and enhancing ecosystems dependent on agriculture and forestry”. The focus areas identified under this priority area are:
• Restoring, preserving and enhancing biodiversity, including Natura 2000 areas, areas facing natural or other specific constraints, High Nature Value farmland, and the state of European landscapes;
• Improving water management, including fertiliser and pesticide management; • Preventing soil erosion and improving soil management.
In the light of the “green” elements that are now included in the programming period 2014-2020, the new CAP is expected to actively contribute to maintaining the rural landscape, to combating biodiversity loss and to mitigating/adapting to climate change (COM(2010) 672 final).
By providing the information needed to characterise agricultural lands in terms of the provision of multiple ecosystem services and the maintenance and enhancement of biodiversity, the MAES process can facilitate and enable the delivery of the “green” elements of the revised CAP. Moreover, besides information on provisioning ecosystem services in terms of agricultural production, the role of agro-ecosystems in supplying regulating and cultural ecosystem services will be made explicit through the MAES process. This can support the discussion on public goods provided by agriculture and the assessment of trade-offs for a better use of resources and an improved spatial targeting of policy measures (2). The results from the MAES initiative will also enable the identification of areas where regulating ecosystem services supporting agricultural production (e.g. pollination, bio-control) should be enhanced (3). Finally, synergies between “greening” measures, in particular Ecological Focus Areas, and the deployment of the Green Infrastructure in agricultural landscapes can be identified.

Mapping and Assessment of Ecosystems and their Services
12 | P a g e
1.2.3 Forest policy
Forests cover around 40% of the EU land surface. The many interlinked roles of forest, from biodiversity conservation to timber provision, explain the multi-sectoral and multi-objective character of forest policies. There is a long history of EU measures supporting forest-related activities contributing to implementing sustainable forest management: coordination with Member States is developed mainly through the Standing Forestry Committee (SFC).
In September 2013, a new EU Forest Strategy for forest and the forest-based sector3 was presented with a new framework and wider scope in which forest protection, biodiversity conservation and the sustainable use and delivery of forest ecosystem services are addressed. Under the Strategy, sustainable forest management (SFM) is defined following MCPFE4 criteria: “SFM means using forests and forest land in a way, and at a rate, that maintains their biodiversity, productivity, regeneration capacity, vitality and their potential to fulfil, now and in the future, relevant ecological, economic and social functions, at local, national, and global levels, and that does not cause damage to other ecosystems”. SFM addresses current pressures on European forests from two different angles. Firstly, threats from environmental changes are expected to increase in the next years and decades, such as increasing water scarcity and pests, spread of invasive alien species, habitat loss, increased risk of forest fires, etc. Secondly, human-induced pressures such as forest fragmentation and over-exploitation of forest resources could impact negatively the provision, health and vitality of forest ecosystems. With this in mind the new Forest Strategy promotes a coherent and holistic approach of forest management covering i) the multiple benefits and services of forests; ii) internal and external forest-policy issues and iii) the complete forest value-chain. From this perspective assessing, mapping and accounting of forest ecosystem services as foreseen under MAES, provides an integrated and systemic view of the forest system and the interlinked effects of the different pressures on forests. Ensuring forest protection and the delivery of forest ecosystem services is the overarching aim of the Strategy.
1.2.4 Water policy
The MAES initiative is strongly linked to the implementation of EU legislation on freshwater resources, recently reviewed and synthesised in the Blueprint to Safeguard Europe's Water Resources5. The effective implementation of legislation such as the Water Framework Directive, the Groundwater Directive and the Floods Directive is sustained by high quality and comprehensive information on the quantity and quality of freshwater resources. This legislation has extensive provisions for the collection and reporting of this information. The MAES process will serve to integrate this information into a wider assessment of ecosystem condition and ecosystem services covering all ecosystem types. The outputs from the MAES process will complement the information currently available on freshwater resources and facilitate a more effective protection and management of those resources. In the light of the mutual interests and common concerns, the Nature and Water Directors of the Member States have invited the Commission in collaboration with the Member States and the EEA to review, by mid-2014 the linkages between the mapping and assessment of ecosystems and of their services (MAES) and the work
3 http://eur-lex.europa.eu/LexUriServ/LexUriServ.do?uri=COM:2013:0659:FIN:en:PDF 4 Ministerial Conference on the Protection of Forests in Europe; http://www.foresteurope.org/ 5 COM(2012) 673 final - A Blueprint to Safeguard Europe's Water Resources. http://ec.europa.eu/environment/water/blueprint/index_en.htm

Mapping and Assessment of Ecosystems and their Services
13 | P a g e
undertaken under the Water Legislation and to make recommendations concerning the priority operational actions that should be taken to improve integration and promote synergies.
1.2.5 Climate action
Healthy, productive and resilient ecosystems are also essential if we are to combat climate change effectively. Current EU Biodiversity policy identifies carbon sequestration and the important role that ecosystems play in mitigating climate change and adapting to its impacts as essential ecosystem services. The recent communication on climate change adaptation6 places considerable emphasis on nature-based solutions. There are strong synergies between the policies on climate change and biodiversity. The work being carried out under MAES will allow us to know more about the condition of Europe’s ecosystems and to identify opportunities for increasing the contribution to climate change mitigation and adaptation. In particular, the mapping and assessment of several protective functions of ecosystems preventing downstream and coastal flooding or droughts are clear examples of how increased knowledge on the current distribution and state of ecosystems and their services helps support climate adaptation.
1.2.6 Marine policy
Marine and coastal ecosystems provide an essential contribution to human wellbeing in multiple ways. From a European policy perspective, increasing threats to the marine environment resulting from human use have been recognized, and a number of policies are in place, aiming at managing/reducing the impact of human activities on the marine environment.
The Marine Strategy Framework Directive (MSFD) is the latest and foremost piece of legislation, focusing on achieving/maintaining good environmental status (GES) of European marine waters by 2020. The MSFD requires an assessment on the use of marine environments and the development of action plans and explicit measures to achieve GES. Before their adoption, robustness of these measures needs to be determined, inter alia, though cost-effectiveness and cost-benefit analysis. MSFD has also a strong link with the Habitats and Birds Directives, which provide the legal basis for the designation of marine protected areas. This linkage lends further strength to the need for the application of spatially based conservation measures to protect marine biodiversity in marine environments, both at EU and global level.
Criteria set down in the MSFD for the attainment of GES build upon existing obligations arising directly from the Water Framework Directive (WFD), under which umbrella fall transitional and coastal waters. In this sense, for example, the initial assessment of the environmental status of marine waters under the MSFD must take into account the results of the assessment of coastal and transitional waters under the WFD. Similarly, the program of measures adopted by Member States (MS) as part of their marine strategies to achieve GES must take into account relevant measures already adopted under the WFD.
Among others, the MSFD is aimed at fulfilling a number of obligations that arise under the United Nations Convention on the Law of the Sea (UNCLOS), namely the protection and preservation rare and/or fragile ecosystems as well as the habitat of depleted, threatened or endangered forms of marine life. On a regional basis, the MSFD is complemented by the obligations set forth under a number of regional agreements (the Convention on the Protection of the Marine Environment of the Baltic Sea Area, the Convention for the Protection
6 http://ec.europa.eu/clima/policies/adaptation/what/docs/com_2013_216_en.pdf

Mapping and Assessment of Ecosystems and their Services
14 | P a g e
of the Marine Environment of the North-East Atlantic, the Convention for the Protection of the Marine Environment and the Coastal Region of the Mediterranean, the Protocol for the Protection of the Mediterranean Sea Against Pollution from Land-Based Sources). Such conventions can provide a wealth of data and information relevant to the mapping and assessment of ecosystems and the services they provide. Thus knowledge made available through the data gathering and reporting associated with the MSFD, the WFD and other nature legislation (not to mention the various Regional Sea Conventions) complements data collection and reporting under the MAES process, enhancing and facilitating harmonised policy and decision making.
Target 4 of the EU 2020 Biodiversity Strategy also concerns the integration of biodiversity issues into the development and implementation of EU Maritime and Fisheries policy. Information coming from the full implementation of the Maritime and (new) Fisheries Policy will be paramount for the build-up of a detailed knowledge base in view of the full implementation of target 4 of the Biodiversity Strategy. In particular, the Integrated Maritime Policy aims to provide a coherent approach to maritime issues, increasing coordination between cross-cutting policies, such as blue growth, marine data and knowledge, maritime spatial planning, integrated maritime surveillance. In relation to fisheries management (the MSFD limiting the power of MS to making recommendations to the Commission when action cannot be taken at a national level and where EU measures are needed), the latest CFP (effective since 1 January 2014) aims to bring fish stocks back to sustainable levels and put an end to wasteful fishing practices. The CFP provides for the adoption of a broad range of EU legal measures concerning, inter alia the management of living aquatic resources and technical restrictions on the environmental impact of fishing. It is already foreseen that achieving the objectives of the MSFD may entail the adoption of additional fisheries management measures under the CFP, with a view to maintaining or restoring fish stocks, as well as to ensure the structure and functioning of ecosystems. Indeed, one of the qualitative criteria for determining GES under the MSFD is focused on ensuring that the populations of all commercially exploited fish and shellfish are within safe biological limits and exhibit characteristics that are consistent with healthy stocks.
The success of EU Maritime and Fisheries policy is inextricably linked to the health and resilience of the natural systems that sustain our economic activities. Reporting from this policy will also contribute to the gathering of high quality and reliable information for the assessment of the condition of European marine ecosystems and the services that these ecosystems provide. Although the harmonisation of marine and maritime policy at EU level in terms of objectives and data requirements is still far from complete, the MAES process will complement the data collection and reporting activities under the individual pieces of legislation and will enhance and facilitate joined-up decision taking and policy making.
1.2.7 Regional policy
Working with nature can offer cost-effective solutions to many of the challenges facing society such as adaptation to climate change, protection against extreme weather events and natural disasters, increased food and water security, better living conditions, improved social cohesion as well as business and development opportunities. Optimising the delivery of these ecosystem services will contribute significantly to regional and urban development across the Union. High quality and consistent data on the condition of our ecosystems and the services that they produce is essential for making the right decisions for future investments and the MAES initiative will play a major role in ensuring the timely provision of such data.

Mapping and Assessment of Ecosystems and their Services
15 | P a g e
1.2.8 Research
The on-going efforts on the mapping and assessment of ecosystems and ecosystem services are totally dependent upon reliable data and good science. This action needs to integrate growing scientific evidence on biodiversity as a key component for resilient ecosystems and delivery of ecosystem services. It is the basis for valuing the multifunctionality of ecosystems for sustaining long-term human well-being. The integration of these concerns in the Horizon 2020 research programme and the further engagement with the scientific community will strengthen the knowledge and evidence base for policy and decision-making.
1.3 Experience based on country cases DG Environment supports the practical implementation of Action 5 in the Member States not only via the working group MAES but additionally through a service contract (MESEU - Mapping of Ecosystems and their Services in the EU and its Member States). The aim of this contract is to provide assistance on mapping and assessment of the state of ecosystems and their services in their national territories by making the best use of studies and work already undertaken at EU and MS levels. A first report7 provides an analysis of several ongoing or recently completed ecosystem assessments in Europe. The country cases are Wales (UK), Flanders and Wallonia (Belgium), Spain, Austria, Switzerland, the Wadden Sea (The Netherlands), and several Balkan countries. The most important outcomes from the country cases are the following:
• The degree of engagement of national governments varies widely across the Member States. Only in the case of Spain and the UK were ecosystem assessments undertaken on the basis of a national government initiative. Therefore, Action 5 can be seen as an incentive for other countries to engage biodiversity policy departments and agencies.
• The country case studies provide a useful body of material. However, frameworks, indicators and quantification methods differ widely and comparisons across the different case studies are therefore very difficult. The hierarchical structure of the CICES classification for ecosystem services facilitates the translation of available data and results in a common European classification8.
• All the case studies used land cover/ land use data as a basis for mapping. In many cases, this was combined with other, more detailed layers to map or model particular ecosystems. The present document provides a link to a pan-European ecosystem map that can be used for spatial ecosystem assessments (see chapter 3).
• Mapping precision and accuracy depend on time and material resources and data availability. The tiered approach to mapping and assessment based on the MESEU project results is adapted to accommodate the different situations in the Member States (see chapter 7).
7 https://circabc.europa.eu/w/browse/872fa6f9-7e69-429e-9696-2d117c66f66b 8 In the frame of the FP7 project OpenNESS a typology translator is available via the HUGIN website at: http://openness.hugin.com/example/cices. It translates CICES to other classifications including MA and TEEB. Also the first MAES paper (1) includes a cross walk between the different classification systems.

Mapping and Assessment of Ecosystems and their Services
16 | P a g e
In the context of the MESEU contract a survey was carried out of Member States’ assessments of their own needs in relation to the work on mapping and assessment of ecosystems and ecosystem services. Box 1 summarizes the most important results.
Box 1. Where is guidance most useful. Outcomes from survey of the Member States
Mapping and assessment is an ongoing process in most of the countries but needs targeted support. From the 15 countries responding:
• About 80% have started the MAES process at national level, regional or case-study level. • Mapping is already happening, but not uniformly developed; • 80% include stakeholders in the assessment (policy makers, NGO’s, scientists, citizens, etc.). • Expertise is available but government (financial) support and EU based guidance (e.g. a common approach) are needed.
Methods: The main ecosystems and ecosystem services are covered using national data as well as European sources. In particular the CICES classification and CORINE Land Cover are used. The main problems encountered are lack of consistent approaches among all parties involved, lack of relevant data and limited resources. Based on the replies from the 15 responding countries, the results of the survey led to the following conclusions::
• National assessments mostly cover forests, followed by agro-ecosystems, freshwater ecosystems and marine ecosystems. Other ecosystems mentioned are: urban systems, heathland, mountains, arid zones, and peat-lands (as part of wetlands).
• The most assessed ecosystem services are cultural services (tourism and recreation), followed by provisioning services (nutrition and materials such as timber) and regulating and maintenance services (regulation of water flows, climate and extreme events).
• Indicators are mainly based on national statistics; • Common approaches across the EU are the CICES classification (60%), the CORINE Land Cover dataset and the reporting
streams under the EU environmental directives.
Technical aspects: guidance is needed. From the 15 replies of the responding countries, the following needs were expressed:
• Guidance is needed with respect to methods for mapping and assessment including GIS methods and data sources for mapping and assessment;
• The common elements in mapping approaches are the use of land cover/ land use data and the use of ESRI’s ArcGIS.
• The INSPIRE directive is not yet considered when mapping.
1.3.1 Key challenges
This report aims to synthesise what information is available at EU and Member State scales in terms of data and indicators in order to facilitate Member States' work when:
• identifying and prioritising which ecosystems and services to map and assess; • identifying what data are available or needed; • making optimal use of EU environmental reporting streams; • helping implement other actions of the EU 2020 Biodiversity Strategy; • guiding the use of information on ecosystem services in impact assessments or in other policies; • linking biodiversity and ecosystem condition to ecosystem services and human well-being.

Mapping and Assessment of Ecosystems and their Services
17 | P a g e
1.4 Structure of the report The report is structured as follows: Chapter 2 introduces the readers to the collaborative efforts of the Member States and EU services in order to identify the data and indicators that can be used to report under Action 5. Chapters 3 to 6 report on the outcomes of the work on ecosystem mapping, assessment of biodiversity and
ecosystem condition, and assessment of ecosystem services, respectively. Chapter 7 introduces the readers to
ongoing efforts to account for natural capital. Chapter 8 builds on the previous chapters to support Member
States with their national assessments. Chapter 9, finally, sums up the essential conclusions and next steps.

Mapping and Assessment of Ecosystems and their Services
18 | P a g e
2 THE SIX PILOTS AND THE COMMON ASSESSMENT FRAMEWORK
2.1 Set up and description of the pilot studies Participation from Member States, stakeholders and EU bodies (EC, EEA) in the pilots was made on a volunteer basis with a view to draw on existing initiatives and resources that could be used to measure or monitor biodiversity, ecosystem condition and ecosystem services at national and European scales. Each pilot was co-led by a Member State and an EU body. Table 1 provides the list of contributing parties including some stakeholders who commented on the outcomes or who provided additional information with regard to indicators and data sources.
Table 1. Contributions of Member States, stakeholders and EU services to the pilots
1 Nature
2 Agriculture
3Forest
4Fresh water
5 Marine
6Natural Capital
Accounting MS Lead LT BE SE
PT FR FR BG
EU Lead ENV JRC JRC JRC JRC EEAEU members EEA
JRC EEA ENV AGRI
EEAENV AGRI
ESTAT
EEAENV
EEA ENV
ENVESTAT RTD AGRI
MS members LT HU BG
AT BE DE ES SK
BGFI ES SE PT
ATES FR
PT FR
DEEE FR PT SK UK BG
Stakeholders CEEBweb ELO FACE
WWF-BGELO FACE
FOREST EUROPE
WWF Oceana LAGOONS1
ARCH2
TPEA3
WWF
1. “Integrated water resources and coastal zone management in European lagoons in the context of climate change”, FP7 grant agreement n° 283157, http://lagoons.web.ua.pt/. 2. “Architecture and roadmap to manage multiple pressures on lagoons”, FP7 grant agreement n° 282748, http://www.arch-fp7.eu/.
3. TPEA - "Transboundary Planning in the European Atlantic”, DG MARE, grant agreement MARE/2012/08, http://www.tpeamaritime.eu/
2.2 A common approach for the ecosystem pilots The MAES conceptual model builds on the premise that the delivery of certain ecosystem services upon which we rely for our socio-economic development and long-term human well-being is strongly dependent on both the spatial accessibility of ecosystems as well as on ecosystem condition. This working hypothesis has been translated into a working structure that has been adopted to guide the work of the ecosystem pilot cases (Figure 2). In order to provide operational recommendations to both EU and its Member States, the proposed work structure for the 4 ecosystem pilots is based on a 4 step approach: (i) Mapping of the concerned ecosystem; (ii) Assessment of the condition of the ecosystem; (iii) Quantification of the services provided by the ecosystem; and (iv) Compilation of these into an integrated ecosystem assessment (Figure 2).

Mapping and Assessment of Ecosystems and their Services
19 | P a g e
Introducing the pilot studies.
Pilot on habitat and species conservation status data for ecosystem assessment. How can reported assessments on conservation status (under Habitats Directive) be used effectively to assess the state of ecosystems and services.
Ecosystem pilots
Agro-ecosystems Forests Freshwater ecosystems Marine
ecosystems
What indicators and data are available to map ecosystems and assess their biodiversity, condition and their services?
Agricultural land covers almost half of the EU territory. Besides providing food, agro-ecosystems deliver biotic materials for industrial processes and as a source for energy and provide important regulating and maintenance services such as pollination and pest control. Furthermore some agricultural landscapes are a valuable source of cultural ecosystem services
European forest ecosystems face multiple threats. Currently competing socio-economic demands for forest services can result in multiple drivers of forest change, and may lead to degradation of the forest ecosystem. Yet forests are key providers of almost all ecosystem services provided that they are managed in a sustainable way.
Lakes, rivers, wetlands and groundwater deliver clean water for multiple purposes and are thus vital to human well-being. Lakes are primary locations for summer recreation. Wetlands are crucial in maintaining habitats for many species while regulating water flows and filtering water. An essential question is understanding how achieving good ecological status result in the supply of multiple services.
Oceans, seas and especially coastal zones are estimated to contribute more than 60% of the total economic value of the biosphere. Yet, our knowledge of marine ecosystems and the services they provide is not at the same level as their terrestrial counterparts. In particular, the mapping is lagging behind. Hence, this pilot is among the first to address indicators to map and assess marine ecosystem services
The pilot on natural capital accounting aims at exploring the potential for valuation and natural capital accounting at EU and national level. This builds on the
biophysical mapping and assessment of the state of ecosystems and of their services in the context of the EU 2020 Biodiversity Strategy using latest
developments on ecosystem accounts at global and EU level and concrete examples in Member States.

Mapping and Assessment of Ecosystems and their Services
20 | P a g e
2.2.1 Map ecosystems: Identification of data for ecosystem mapping
The 1st MAES report (1) proposes a typology for ecosystem mapping based on the key databases available at EU level. At the same time, the typology should allow integration of assessments on national or sub-national levels based on more detailed classifications. The mapping of ecosystems is largely dependent on the availability of land-cover/land-use datasets at various spatial resolutions. The most comprehensive dataset for terrestrial and freshwater ecosystems at EU level is Corine Land Cover (CLC). The CLC dataset allows also mapping of one of the four marine ecosystems (marine inlets and transitional waters). For the marine environment, the 1st MAES report (1) contained a proposal to define marine ecosystem typology solely on the base of bathymetry (2D approach). Such a rough criterion would be then complemented by other available information, at EU or MS level. To date, EuSeaMap provides basic information for ecosystem mapping and assessment but does not yet cover all European marine regions. However, any mapping should not be limited to the availability of land and sea cover data only, neither at EU nor at MS level. Ecosystem mapping needs to be based on the best available data from sub-national and national data sources at appropriate scales, to provide coherent information about ecosystems and their characteristics additional to EU level data.
2.2.2 Assess the condition of ecosystems: Review of data and indicators for ecosystem assessment
The EU wide assessment of the condition of the various ecosystem types requires information about drivers, mainly land/sea use and management, and pressures such as land-take, fragmentation, pollution, climate change as well as their impacts on the structure and function of each ecosystem type. It should make use of existing data, mainly the reported data under EU legislation and, in particular, from assessments under Art. 17 of the Habitats Directive and Art. 12 of the Birds Directive, the Water Framework Directive, the Marine Strategy Framework Directive and other environmental legislation. For ecosystems without legislative reporting framework, such as forests, either national data or European monitoring data, e.g. from the European Forest Data Centre (EFDAC)9 or the Copernicus programme can be used. To complete and refine the ecosystem assessment, additional information indicating habitat connectivity or other functionalities as well as information on drivers and pressures reducing the capacity of ecosystems to provide services is needed and must be integrated in the assessment. Again, national and sub-national data sources need to be used to provide more detailed and additional information to describe the variability of ecosystem condition across Europe.
2.2.3 Map and assess ecosystem services: Reference frame for ecosystem services mapping and assessment.
The 1st MAES report (1) proposed the CICES v4.3 classification as typology for ecosystem services to ensure a coherent approach across EU Member States and to support their integration into (ecosystem) accounting systems. The four ecosystem pilots have used this classification to organise the data collection and to compare outcomes.
9 http://forest.jrc.ec.europa.eu/efdac/

Mapping and Assessment of Ecosystems and their Services
21 | P a g e
2.2.4 Integration of the two assessments: Reference frame linking condition of ecosystems to their services.
The capacity of an ecosystem to deliver different ecosystem services is related to the condition of this ecosystem. In a “healthy state”, an ecosystem may provide more and a sustained flow of a variety of services- compared to an ecosystem, which is managed to provide only a maximum amount of one specific service, e.g. fish, crops or timber. As a result, the overall capacity of such a system to provide services will be higher. Ecosystems in a “healthy state” are considered resilient systems, which are able to recover after disturbance and they are generally characterized by higher species diversity and a balanced trophic community.
Every ecosystem delivers multiple services. The mapping work is therefore not targeted to identify the maximum potential of one service but to understand the spatial delivery of multiple services by interconnected ecosystems.
The capacity of an ecosystem to deliver ecosystem services should be measurable in quantitative units.
2.2.5 Working procedure
The four thematic pilots followed a coordinated approach for information gathering, review and compiling of indicator lists. The approach is structured around four main steps.
Firstly, the Pilot leaders applied a table (referred to hereafter as the “MAES matrix”) including all ecosystem services using CICES v4.3 as baseline classification. An EU-wide MAES matrix of ecosystem services was populated from a literature review and assessing data and indicators available in the European data centres. After completion and agreement with the Pilot leaders, this matrix was sent to participating Commission services and stakeholders for review, addition of further data and agreement.
In a second step, participant MS and stakeholders from international and national organisations were requested to populate a country-level MAES matrix with relevant data and indicators available in their country. The resulting MAES matrices are available in CIRCABC.
The high level of detail and wide scope of the pilots yielded MAES matrices that required a supplementary level of synthesis for better access and readability. Thus, in a third step a series of “MAES cards” were implemented representing a synthesis of the information collected by the European and country-level MAES matrices. Each card focussed on one service at a time and includes information on four aspects: reporting body, data availability of the indicator (six levels), units of measurement and compiling agency. The cards are more accessible and “readable” than the information included in the MAES matrices. The cards of the ecosystem pilots are included in a separate supplement to this report10 and could be used as a screening tool for deciding what indicators are available for mapping and assessing biodiversity, ecosystem condition and ecosystem services. The cards were reviewed and agreed in a technical workshop held at the JRC in Ispra on 18 and 19 November 2013. The workshop brought together Member States, stakeholders and experts, members of the pilots, who contributed in several technical working sessions to the further refinement and agreement on the information included in the cards.
10 https://circabc.europa.eu/w/browse/837b3dda-6b1a-4316-a554-723e31062c8f

Mapping and Assessment of Ecosystems and their Services
22 | P a g e
Figure 2. A common assessment framework for the ecosystem pilots
A fourth step of synthesis is included in the “MAES summary tables”, which are provided in this report as final outcomes of the pilots. The summary tables are built from the outcomes of the MAES cards and synthesized information from the MAES matrices. The summary table is seen as the entry point for information regarding ecosystem services and potential indicators, proxies and datasets. It combines information provided by Member States and EU-level experts alike. The table is designed following the CICES classification and includes a colour key classifying indicators into four types (Box 2).

Mapping and Assessment of Ecosystems and their Services
23 | P a g e
Box 2. Indicators for mapping and assessment of ecosystems and their services
The indicators that are suggested here were each evaluated according to 2 criteria: i) data availability and ii) ability to convey information to the policy making and implementation processes (4).
• available indicator to measure the condition of an ecosystem, or the quantity of an ecosystem service at a given CICES level
for which harmonised, spatially-explicit data at European scale is available and which is easily understood by policy makers or non-technical audiences. Spatially-explicit data in this context refer to data that are at least available at the regional NUTS2 level or at a finer spatial resolution. CICES classifies ecosystem services at 4 hierarchical levels. Sometimes, it is more cost-effective to consider an assessment of ecosystem services at a higher CICES level than at class level, especially if aggregated indicators are available. Indicators that aggregate information at higher hierarchical CICES level can therefore also have a green label.
• available indicator to measure the condition of an ecosystem, or the quantity of an ecosystem service at a given CICES level but for which either harmonised, spatially-explicit data at European scale is unavailable or which is used more than once in an ecosystem assessment, which possibly results in different interpretations by the user. This is typically the case for indicators that are used to measure ecosystem condition, which are reused to assess particular ecosystem services. This colour also includes indicators that capture partially the ecosystem service assessed.
• available indicator to measure the condition of an ecosystem, or the quantity of an ecosystem service at a given CICES level but for which no harmonised, spatially-explicit data at European scale is available and which only provides information at aggregated level and requires additional clarification to non-technical audiences. This category includes indicators with limited usability for an ecosystem assessment due to either high data uncertainty or a limited conceptual understanding of how ecosystems deliver certain services or how ecosystem condition can be measured. The ability to convey information to end-users is limited and further refined and/or local level assessments should be used for verifying the information provided by this type of indicators.
• unknown availability of reliable data and/or unknown ability to convey information to the policy making and implementation processes.

Mapping and Assessment of Ecosystems and their Services
24 | P a g e
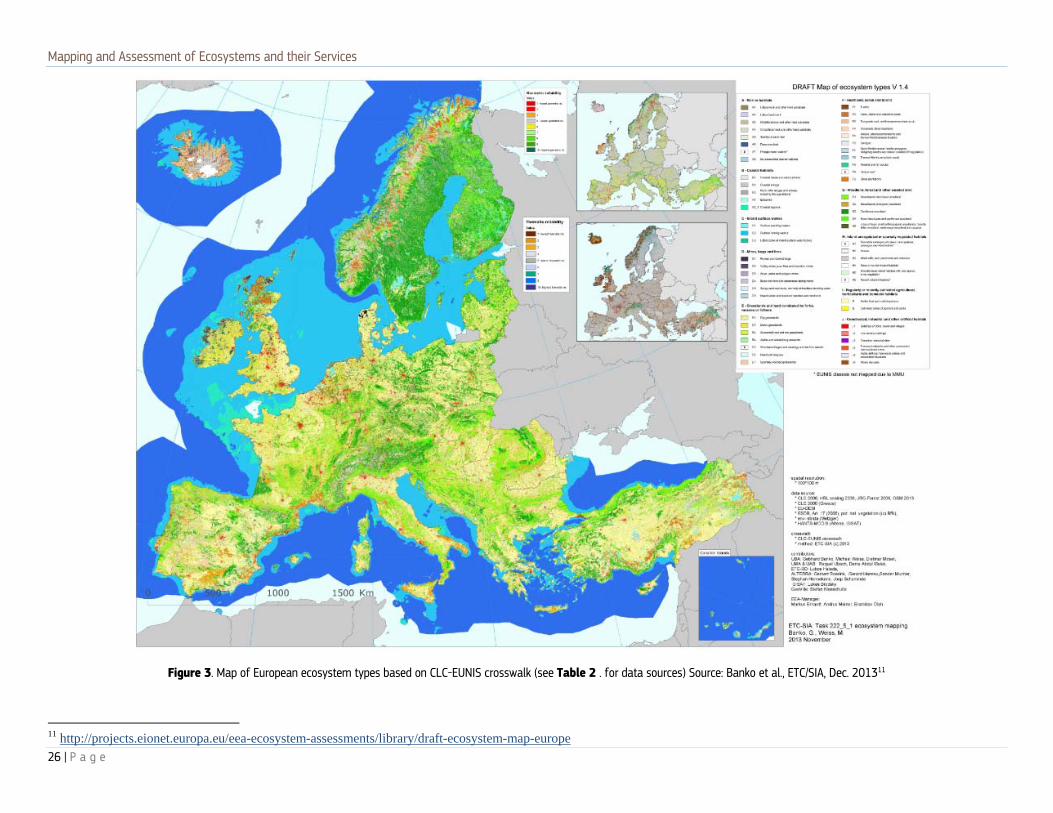
3 MAPPING ECOSYSTEMS The assessment of ecosystems and their services needs spatially explicit mapping to address the key drivers (e.g. land/sea use and management), pressures (air pollution, climate change etc.) and their different gradients and variations in space and time. These are affecting the condition of ecosystems across Europe in all combinations of intensities and consequently their biodiversity and the amount of services they can provide. A first version of a European ecosystem map has been delivered by EEA and its European Topic Centre for Spatial Information and Analysis (ETC/SIA) in December 2013 (Figure 3). For land and freshwater it covers spatially explicit ecosystem types for EEA-39 countries at 1 ha spatial resolution. Ecosystems are mapped by interpreting available land cover data (Corine LC 2006, 2000) on the basis of the European habitat classification (EUNIS). Such remapping (so-called ‘cross-walk’) allows for underpinning land-cover information with more detailed habitat-related information to provide more detailed insights into the biodiversity we may expect for each ecosystem type across Europe.
To link habitats with land-cover, additional reference data has been used to specify the areas where habitats are present according to their environmental characteristics as described in the EUNIS classes. Land reference data include information on elevation, soil and geological conditions, and climate. Additionally, potential natural vegetation and phenological data derived from remote sensing (MODIS) have been used to attribute habitats to Corine land cover classes. This is particularly useful in being able to distinguish, arable land from grassland.
The marine part of the map has been developed using global data sets of sea bed conditions, bathymetry, the current draft of the national economic zones and sea ice monitoring combined with coastline and coastal areas derived from Corine land cover data.
In situations where additional and/or more detailed information is not available at the national/sub-national levels, this map or the elements, which have been used to create it (Table 2) can be used as input for assessments of ecosystem conditions and ecosystem services.
Table 2. Reference data for ecosystem mapping
Reference data
Data/maps available
URL Comment
Terrestrial Land cover 100x100m
Corine Land Cover
http://www.eea.europa.eu/publications/COR0-landcover
Soil sealing 100x100m
HRL imperviousness 2006
http://www.eea.europa.eu/data-and-maps/data/eea-fast-track-service-precursor-on-land-monitoring-degree-of-soil-sealing#tab-european-data
Forest 25x25m JRC Forests 2006
http://forest.jrc.ec.europa.eu/download/data/
Roads and land use
Open Street Map OSM 2013
Europe (except Germany, France):http://download.geofabrik.de/europe.html Germany and France: http://osmdata.thinkgeo.com/openstreetmap-data/europe/
Constantly updated product
Digital elevation 100x100m
EU DEM https://sdi.eea.europa.eu/ Altitude, slope, aspect, landform, upper tree line

Mapping and Assessment of Ecosystems and their Services
25 | P a g e
Reference data
Data/maps available
URL Comment
Soil 1:1 Mio. European soil type map
http://eusoils.jrc.ec.europa.eu/ESDB_Archive/ESDB_data_1k_raster_intro/ESDB_1k_raster_data_intro.html
Environmental regions ca. 1:1 Mio.
Environmental stratification
Metzger, M, Bunce, RGH, Jongman, RHG, Mucher, CA & Watkins, JW 2005, 'A climatic stratification of the environment of Europe' Global Ecology and Biogeography, vol. 14, pp. 549-563.
Including main climatic variables
Potential natural vegetation 1:2,5 Mio
Bohn & Neuhäusl
http://www.floraweb.de/vegetation/dnld_eurovegmap.html
Phenology 250x250 m
HANTS (Harmonized time series of adjusted MODIS NDVI data)
ALTERRA, Gerbert Roerink Differentiation arable land vs. grassland
Habitats EUNIS http://eunis.eea.europa.eu/index.jsp Not spatially explicit; using EUNIS – Corine cross-walk
Marine Ecosystem types 2x2 arc minutes
NCEAS dbSEABED
http://www.nceas.ucsb.edu/GlobalMarine and http://instaar.colorado.edu/~jenkinsc/dbseabed/
Based on hard or soft substrate differentiation
Bathymetry 30x30 arc second
GEBCO 08 Grid
http://www.gebco.net/data_and_products/gridded_bathymetry_data/
Global bathymetry data sets for the world's oceans.
Sea zones VLIZ World EEZ v7 (20.11.2012) still under revision!
Flanders Marine Institute (VLIZ, 2012), http://www.marineregions.org
EEZ is the sea zone over which a state has the right to manage and use the marine resources.
Coastal areas 100 x 100m
CLC Coastal area 2000,2006
lusiftp:\\222_51_EcosystemMapping\Coast\clc06coast10km.tif The coastal area (10 km stripe) based on CLC v16.
Sea ice 1x1km
NASA MODIS_MOD29 2000-present
http://nsidc.org/data/modis/order_data.html The sea ice algorithm identifies pixels as sea ice, ocean, land, inland water, cloud or other condition.
Mapping and Assessment of Ecosystems and their Services
26 | P a g e
Figure 3. Map of European ecosystem types based on CLC-EUNIS crosswalk (see Table 2 . for data sources) Source: Banko et al., ETC/SIA, Dec. 201311
11 http://projects.eionet.europa.eu/eea-ecosystem-assessments/library/draft-ecosystem-map-europe
Mapping and Assessment of Ecosystems and their Services
27 | P a g e
4 ASSESSING ECOSYSTEM CONDITION This section provides three types of information that can be used by Member States for an assessment of ecosystem condition.
Firstly, the results of the ecosystem pilots are presented in a summary table showing the essential indicators that are available at the scale of Member States to report on the condition of selected ecosystem types. Secondly, this chapter contains a summary of a recently finished study, which lists the key datasets that are available at the European level for assessment of ecosystem state or condition. Both of these information sources complement each other. Thirdly, particular attention goes to the use of Article 17 data for mapping and assessment. Member States collect a wealth of information on the conservation status of protected habitats and species, which can contribute to the assessment of ecosystem condition.
4.1 Results from the ecosystem pilots Table 3 contains a selection of indicators to measure condition of 10 ecosystems, based on the consultation of EU services and MS, which contributed to the ecosystem pilots. Condition indicators discriminate between drivers and pressures, and state. Many biodiversity indicators are ecosystem specific whereas others can be used across ecosystems. Complete lists are available in the supplement (cf. MAES cards on condition and biodiversity) and on CIRCABC12 (cf. MAES matrices with detailed information per input provider).
The proposed selection of indicators aims to ensure a coherent mapping of ecosystem condition across the EU. Variations between countries may arise due to presence of specific ecosystems, pressures, different priorities for species protection or spatially explicit patterns of species distribution.
Table 3 provides a set of cross-ecosystem biodiversity indicators, which can be used for assessments and which aim to ensure a consistent approach across the EU. These include at EU level the change in status of protected species (i.e. Art.17 assessments), the assessment of extinction risk of threatened species (i.e. EU Red List assessments) and trends in the abundance and distribution of populations of selected common species (e.g. birds, butterflies).
The assessment of condition can largely build on existing frameworks under the EU Common Agricultural Policy (CAP), the Water Framework Directive (WFD), the Marine Strategy Framework Directive (MSFD) and the pan-European forest assessment. Many green indicators are available at national and European scale. For most marine and freshwater ecosystems, single, aggregated indicators exist (i.e. ecological status and environmental status). For wetlands, no final selection was made but possible ways to measure wetland status can be found in the MAES cards and matrices. Clearly wetlands (which do not fall under the scope of WFD) are poorly covered and would benefit from further work. For agricultural ecosystems, indicators that are being reported under the agri-environmental schemes (AEI) or as Common Context Indicators (CCI) to monitor the CAP are proposed. Art.17 assessments can be used to help assess the state of grassland, less so for cropland. Forest condition indicators retained from the pilot studies are mainly measuring state, and data are available at national and EU scale for forest pattern, damage and soil condition. Clearly, the list of indicators in Table 3 is not exhaustive and Member States are encouraged to integrate additional indicators where these are available.
12 https://circabc.europa.eu/w/browse/4580a3d6-f93d-4c21-be5c-f46235201aec

Mapping and Assessment of Ecosystems and their Services
28 | P a g e
Table 3. Indicators to assess condition and biodiversity of ecosystems
Condition Biodiversity Drivers and pressures State
• Ar
t.17
asse
ssm
ents
(Hab
itat a
nd s
pecie
s co
nser
vatio
n st
atus
) • E
ndan
gere
d sp
ecie
s ric
hnes
s an
d re
d lis
ts •
Agg
rega
ted
biod
iver
sity
indi
cato
rs: N
atur
al C
apita
l Ind
ex
(NCI
), Bi
odiv
ersit
y In
tact
ness
Inde
x (B
II), M
ean
Spec
ies
Abun
danc
e (M
SA),
Livi
ng P
lane
t Ind
ex (L
PI)
Forest
• Deposition of air pollutants (www.emep.int) • Forest Fires (EFFIS)
• SEBI 03 & 05 Species and Habitat conservation status (Art.17 data)
• Species richness (of different taxa) (country specific) • SEBI 01 Abundance and distribution of selected species (woodland bird) SEBI 02 Red List Index for European species
• Forest damage indicators (EFDAC)
• Tree species richness (FISE, EFDAC)
• Forest pattern indicators: Forest connectivity, morphology, edge interface, forest landscape mosaic (FISE, EFDAC). • SEBI013: fragmentation and connectivity (forest, natural/semi-natural areas) (EFDAC) • Soil condition (LUCAS) • Naturalness • Forest area • SEBI 18 Deadwood
• Relative area of protected forest
Cropland and grassland
• AEI 12 Intensification Extensification and CCI Farming intensity
• AEI 26: Soil quality • AEI 22 Genetic Diversity
• AEI 13 Specialisation • CCI 41: Soil Organic Matter in arable land
• AEI 25 Population trends of farmland birds and CCI 35 Farmland bird index • SEBI 02 Red List Index for European species
• AEI 14 Risk of land abandonment
• SEBI 03 & 05 • Species and Habitat conservation status (Art.17)
• Species richness (of different taxa) (country specific)
• AEI 15,16 and CCI 40: Gross Nutrients Balance
• SEBI 01 Abundance and distribution of selected species (farmland birds, grassland butterfly • Assessment of pressures
on species (Art.17) • AEI 17 Pesticides risk (cropland only) • AEI 21 and CCI 42: Soil Erosion by water (cropland only)
Rivers and lakes
• Pollutant concentrations • Ecological status (WFD) • Specific indicators collected to assess ecological status13 • SEBI 02 Red List Index for European species
• Modification of river system (dams per basin, ECRINS) • Over-exploitation-overfishing
Wetland • Land take and conversion of wetlands • Drought (EDO)
Transitional waters and marine inlets
• Ecological status (WFD)
Coastal • Environmental status (MSFD)
• MSFD descriptors 1, 2, 3, 4 and 6 SEBI 02 Red List Index for European species Shelf
Ocean
13 Commission Decision of 20 September 2013 establishing, pursuant to Directive 2000/60/EC of the European Parliament and of the Council, the values of the Member State monitoring system classifications as a result of the intercalibration exercise and repealing Decision 2008/915/EC. 2013/480/EU.

Mapping and Assessment of Ecosystems and their Services
29 | P a g e
4.2 Towards an EU-wide assessment of ecosystems and their conditions
Mapping ecosystems provides information about the spatial extension and distribution of the main ecosystem types: it is the starting point for assessing the condition of each ecosystem. Mapping ecosystem condition is useful to deliver additional information about the quantity and quality of services each ecosystem can provide taking into account the site specific conditions triggered by climate, geology and other natural factors as well as the drivers and pressures it is exposed to. It also affects the functional relationship between ecosystems and their biodiversity. Changes in ecosystem condition due to human activities (harvesting, management etc.) or environmental changes such as pollution or climate change provide further information about how their capacity to deliver ecosystem services increases or decreases over time. This chapter provides a short overview about the Europe-wide information, which is currently available for each ecosystem type to describe condition and change over time. The ecosystem types are defined and described in the MAES analytical framework (1). The information can be used by Member States and regional stakeholders including the data sets if no more detailed information is available.
ETC/SIA drafted a report entitled ‘Towards a Pan-European Ecosystem Assessment Methodology14’ that aims at putting together approaches, factual data, ecosystem specific knowledge and tools to assess ecosystems and their condition at the European level.
Table 4 synthesizes the main datasets and indicators that are available. Key drivers and pressures are separated into 5 major classes (i) habitat change, (ii) climate change, (iii) land use specified as overexploitation (unsustainable management), (iv) invasive species and (v) pollution and nutrient enrichment. The greenness from pale (low) to dark green (high) of each box indicates data availability for European wide assessments.
The overview aims to be comprehensive with regard to at least terrestrial ecosystems, but coverage is clearly limited by the availability of spatial datasets. The overview covers the EEA-3915 countries, which includes the EU-28. However, several of the datasets that have been included have either wider or more limited geographic extensions. From a European perspective it is obvious that data availability has not reached the same level of detail for all ecosystem types and all major drivers and pressures. There is only limited information available for heathland and shrubs or wetlands while information for mapping and assessing conditions for forest and agro-ecosystems is much more comprehensive. Data availability is generally low also for freshwater and marine ecosystems.
In terms of ecosystem assessment it is considered more promising to map the current condition of ecosystems than reviewing many of the key drivers of change. That is because it is difficult to quantify and assess their impact in terms of ecosystem change and their capacity to provide services. This mainly concerns climate change and invasive species but also goes for pollution and nutrient loading of freshwater, wetland and marine ecosystems. Approaches combining European data sets of ecosystem status with national and regional data are likely to provide more detailed insights into the link between ecosystem condition and the provision of ecosystem services.
14 http://projects.eionet.europa.eu/eea-ecosystem-assessments/library/working-document-towards-ecosystem-asssessment-methodology
15 EEA Member States: EU 28, Iceland, Liechtenstein, Norway, Switzerland, Turkey and associated countries: Albania, Bosnia Herzegovina, Kosovo under the UN SCR 1244/99, FYR of Macedonia, Montenegro, and Serbia

Mapping and Assessment of Ecosystems and their Services
30 | P a g e
Ecosystem condition Major drivers of ecosystem change
Ecosystem type Condition Habitat change Climate change Overexploitation(unsustainable management)
Invasive species Pollution and Nutrient Enrichment
Biodiversity level
- HD and BD reporting obligations - IUCN European species assessments - Birdlife International species assessments - Species and habitats accounts of European conservation importance - EEA’s on-going fast track implementation methodology of biodiversity and species accounts (ecosystem accounting methodology) Natura 2000 Directive on Air Quality - Thematic High Resolution Layers
- HD and BD reporting obligations - IUCN European species assessments - Birdlife International species assessments - Species and habitats accounts of European conservation importance - Landscape fragmentation - Loss of accessibility for migratory fish due to dams in major European river basins
- ESPON climate - EFFIS
- HNV forest - AEI4 Indicator on Area under organic farming - AEI23 indicator on HNV farmland - Carbon accounts on timber extraction and grazing livestock - CSI032 Indicator on Status of marine fish stocks - FAO fishstats
- SEBI10 Indicator on Invasive alien species in Europe - EASIN network - Trends and pathways of Marine Alien Species (upcoming datasets: EEA)
- Air quality Directive - Nitrates Directive -Exceedance of critical loads for eutrophication by nutrient nitrogen - Exceedance of pesticides in soils - Heavy Metals input-output balance - Critical levels of ozone damage assessment
Woodland and forest
- HD and BD reporting obligations - CLC - JRC Forest Type Map 2006 - HNV forest area, Naturalness - Pan-European map on growing stock - EFI dataset, EFISCEN database - UNECE/FAO/Forest Europe statistics - CORILIS radius 0, NDVI - Forest fires (EFFIS) - 2 upcoming indicator (FISE): Pan-European map of forest living biomass, Pan-European map of forest biomass increment Natura 2000 Directive on Air Quality
- HD and BD reporting obligations - CLC - JRC Forest Type Map 2006 - HANTS NDVI - JRC Forest Pattern, Fragmentation and Connectivity - SEBI13 Indicator on fragmentation of natural and semi-natural areas - IUCN European species assessments - Birdlife international database - On-going JRC work on Mediterranean forest and forest Nat-2000, CC and biodiversity.
- CLC - Natura 2000 database - World Fire Atlas - JRC Eurosoil - OEROK 2011, - JNCC 2010 - HANTS NDVI - ESPON climate - EFFIS - Maps on impacts of CC on tree species distribution (FISE/EFDAC).
- HNV forest - Nutrient accounts - SEBI17 Indicator on forest (growing stock, increment and felling) - NFI datasets 2005 - Carbon accounts on timber extraction and grazing livestock - Timber provision (JRC, based on AFOLU and EFISCEN) - Pan-European map on growing stock - Forest productivity (forest biomass) - JRC Forest Pattern, Fragmentation and Connectivity - Forest mapping - Private forest ownership map
- SEBI10 Indicator on Invasive alien species in Europe - EASIN network
- Air quality Directive - Nitrates Directive 1 - SEBI9 Indicator on Critical load exceedance for nitrogen) 2 - Critical loads exceedance of eutrophication due to the deposition of nutrient nitrogen 3 - Critical levels of ozone damage assessment 4 - Nutrient accounts – Methodology development for N and P accounts per ecosystem type 5 - HAIR2010 6 - Heavy Metals 7 - E-PRTR
Grassland
- HD and BD reporting obligations - CLC - HR layer on grassland - LEAC tools - FAO livestock map - JRC nitrogen map - Eurostat Livestock statistics - Grazed biomass Natura 2000 Directive on Air Quality
- HD and BD reporting obligations- CLC - HR layer on grassland - HANTS NDVI - Landscape fragmentation - Carbon accounts - HNV farmlands - AEI4 Indicator on Area under organic farming - IUCN European species assessments - Birdlife international database
- CLC - ESPON climate - World Fire Atlas - HANTS NDVI - EFFIS
- HNV farmlands - AEI4 Indicator on Area under organic farming - Nutrient accounts - Carbon accounts on grazing livestock
- Invasive alien species in Europe (SEBI 010 - EASIN network
-Air quality Directive -Nitrates Directive 8 - SEBI09 Indicator on Critical load exceedance for nitrogen 9 - Critical levels of ozone damage assessment 10 - Nutrient accounts – Methodology development for N and P accounts per ecosystem type 11 - Heavy Metals
Heathland and shrub
- HD and BD reporting obligations - CLC - LEAC - Biogeographical regions layer Natura 2000 Directive on Air Quality
- HD and BD reporting obligations- CLC - HANTS NDVI - EFFIS - Landscape fragmentation - IUCN European species assessments - Birdlife international database
- CLC - ESPON climate - World Fire Atlas - HANTS NDVI - EFFIS
- HANTS NDVI - Invasive alien species in Europe (SEBI 010) - EASIN network
12 - SEBI09 Indicator on Critical load exceedance for nitrogen 13 - Nutrient accounts – Methodology development for N and P accounts per ecosystem type
Agro-ecosystems (cropland)
- Biomass harvested - Eurostat Statistics: crop production and land use change - CAPRI LU maps - Carbon accounts – crop production in arable land Natura 2000 Directive on Air Quality
- CLC - HANTS NDVI - AEI4 Indicator on Area under organic farming -AEI23 indicator on HNV farmland - CSI14, Land take indicator - Landscape structure: fragmentation, ecotones, linear features
- ESPON climate - EFFIS
- Nutrient accounts - Carbon accounts on grazing livestock and arable land - AEI4 Indicator on Area under organic farming - AEI23 indicator on HNV farmland - High irrigated land usage - CLC
- SEBI10 Indicator on Invasive alien species in Europe - EASIN network
-Air quality Directive-Nitrates Directive 14 - SEBI09 indicator on Critical load exceedance for nitrogen - Critical levels of ozone damage assessment 15 - Nutrient accounts – Methodology development for N and P accounts per ecosystem type

Mapping and Assessment of Ecosystems and their Services
31 | P a g e
Rivers and lakes
- WFD - ECRINS - River basin Districts (RBDs) - CLC - JRC MARS - ETR Evapotranspiration - EEA ORNL’s Landscan - FEC - WISE - Waterbase Natura 2000 Directive on Air Quality *
- CLC - ECRINS - Waterbase databases - Loss of accessibility for migratory fish due to dams in major European river basins - IUCN European species assessments - Birdlife international database
- ESPON climate
- ECRINS - Loss of accessibility for migratory fish due to dams in major European river basins - Waterbase databases
- SEBI10 Indicator on Invasive alien species in Europe - EASIN network
- Air quality Directive - Nitrates Directive - Urban Waste Water Treatment Directive (UWWTD) - WFD: Mean annual nitrates in rivers reported by MS - SEBI09 indicator on Critical load exceedance for nitrogen)
Wetlands
- HD and BD reporting obligations - WFD - CLC - LEAC - HRL wetland - Satellite imagery - Ramsar layer on wetlands Natura 2000 Directive on Air Quality
- HD and BD reporting obligations- CLC - LEAC tools - HRL wetland - IUCN European species assessments - Birdlife international database - Loss of accessibility for migratory fish due to dams in major European river basins - Wetlands inventories and land use/land cover layers *
- ESPON climate
- Multi-temporal satellite imagery - Wetland indicators developed by ETC-SIA (section 3.6.2.1. of the EA Methodology report) - Wetlands inventories and land use/land cover layers
- SEBI10 Indicator on Invasive alien species in Europe - EASIN network
- Air quality Directive - Nitrates Directive - Urban Waste Water Treatment Directive (UWWTD)
- WFD: Mean annual nitrates in rivers reported by MS - SEBI09 indicator on Critical load exceedance for nitrogen
Marine
- HD and BD reporting obligations - MSFD (upcoming datasets) - CLC - Art. 17 Species distribution - Art. 12 Birds conservation status - Ecosystem map (ETC/SIA 2013) Directive on Air Quality - Natura 2000 - EU Sea map - Waterbase
- HD and BD reporting obligations - MSFD (upcoming datasets) - IUCN European species assessments - Birdlife international database - Loss of accessibility for migratory fish due to dams in major European river basins
- ESPON climate - EMIS portal and data
- Common Fisheries Policy (CFP) - MSFD (upcoming datasets) - CSI032 Indicator on Status of marine fish stocks - CSI034 Indicator on Fishing fleet capacity - FAO fishstats - CSI 033 Indicator on Aquaculture production - Biomass surveys and analysis of commercial catch per unit effort (CPUE)
- SEBI10 Indicator on Invasive alien species in Europe - Trends and pathways of Marine Alien Species (upcoming datasets: EEA) -MAS (upcoming 2 indicators per MSFD area by EEA (expected 2014)
- Air quality Directive - Nitrates Directive - CSI021 Indicator on Nutrients in transitional, coastal and marine waters - CSI023 Indicator on Chlorophyll in transitional, coastal and marine waters - MAR001 Indicator on Hazardous substances in marine organism - Regional Sea Conventions monitoring networks
Table 4. Relevance and main data gaps for ecosystems assessment.
* Only the most relevant knowledge available is listed in this table. Please refer to the “Towards a Pan-European ecosystem assessment report (ETC-SIA 2013) for more details16
16 http://projects.eionet.europa.eu/eea-ecosystem-assessments/library/working-document-data-availability
Data availability
Low Moderate High Very High
- Presence of greenhouses- EU Agricultural census *
- SoilProd model: spatially explicit results- SPOT VEGETATION1 - LUCAS - HSMU database - SENSOR Project *
16 - Heavy Metals

Mapping and Assessment of Ecosystems and their Services
32 | P a g e
4.3 The use of Article 17 data for mapping and assessment Under Article 17 of the Habitats Directive, Member States must submit information on how the directive is being implemented every six years. For the reporting period 2001 to 2006, Member States provided detailed assessments of the conservation status of each of a total of 231 habitats (and 1288 species, which are not considered here). All national assessments were compiled by the European Topic Centre on Biological Diversity (ETC/BD) and are available in a geospatial database, which contains information on the range or the presence of habitats on a 10 km grid covering the EU-2517.
4.3.1 The use of data generated in the context of the Habitats18 and Birds’ Directives19.
In accordance with the requirements under Article 17 of the Habitats’ Directive, Member States reported for the first time in 2006 on the conservation status of species and habitats covered by the Directive. The deadline for the submission by Member States of the second report under this Directive was June 2013. A consolidated report summarizing the information provided in the first reporting round and based on the analysis carried out by the EEA20 was published by the European Commission in 200821. The EEA is currently processing and analysing the data provided by the Member States under the second reporting round and this work is scheduled to be completed by early 2015. Member States will, by end-December 2013, also provide for the first time detailed reports on the status of European Bird Species to be reported under Article 12 of the Birds’ Directive. The EEA is also expected to complete the processing and analysis of the data contained in these reports by early 2015.
The reports submitted under Article 17 of the Habitats’ Directive can make an important contribution to the mapping and assessment of ecosystems both at the level of the EU and in the Member States. However, it should not be forgotten that the Directive was put in place to protect the species and habitats of European interest considered to be most at risk across the European Union and consequently the conservation status of these species and habitats as reported under Article 17 does not provide a comprehensive overview of the condition of the 11 MAES ecosystem types across the 27/28 Member States. Furthermore, proper account should be taken of the way data are generated in the Member States and the way the data are processed and aggregated. The EEA and its associated European Topic Centre on Biodiversity have produced several reports on these issues22. The EEA is producing a database on the linkages between the species and habitats covered by the Habitats’ directive and the 11 ecosystem types recognized under the MAES process
17 http://www.eea.europa.eu/data-and-maps/data/article-17-database-habitats-directive-92-43-eec 18 http://ec.europa.eu/environment/nature/legislation/habitatsdirective/index_en.htm 19 http://ec.europa.eu/environment/nature/legislation/birdsdirective/index_en.htm 20 http://bd.eionet.europa.eu/activities/Reporting/Article_17/Reports_2007 21 http://eur-lex.europa.eu/LexUriServ/LexUriServ.do?uri=CELEX:52009DC0358:EN:NOT 22 References to the EEA and ETC reports on the nature of the data reported under Article 17 including the report of the Paris meeting of 17th July and reports on calculation methods and maps generated using these data. http://www.eea.europa.eu/data-and-maps/data/article-17-database-habitats-directive-92-43-eec/content-and-characteristics-of-the/contextual-information-to-help-an http://forum.eionet.europa.eu/x_habitat-art17report/library/papers-maes-pilot-nature/

Mapping and Assessment of Ecosystems and their Services
33 | P a g e
The Birds’ Directive covers all the bird species that breed in the EU. There is also evidence from the literature to suggest that the status of bird species can provide a robust indicator of ecosystem condition23. The data reported under Article 12 of the Birds’ Directive may therefore provide important insights for the mapping and assessment of ecosystems. However, this is the first time that Member States have provided comprehensive data on the status of bird species within the framework of the Birds’ directive and it will be several months before the data can be assessed with regard to their coverage and quality.
4.3.2 Other global and pan-European sources of information/data in relation to species and habitats.
In addition to the data contained in the reports submitted by Member States in the framework of the Habitats’ and Birds’ directives, there are other European data sets concerning the abundance and distribution of selected species (e.g. birds, butterflies) and species groups including the European Red List assessments24. The recent EEA report on “Available data for mapping and assessing ecosystems” includes a review of these data sources25.
4.3.3 National, regional and local data sets relating to species, species groups and habitats.
Many of the Member States will have data sets on the status of different species, species groups and habitats. Some of these species and habitats will be the same as those covered by the EU legislation but the information is likely to be “richer” than the data reported to the EU. Each Member State will need to decide how to incorporate this data into the mapping and assessment of ecosystem condition at the national level.
One of the key challenges in using current Art. 17 and other information on species and habitats is linking these data to ecosystem condition and providing spatially explicit maps, which are the pre-requisite for ecosystem service assessments. The ecosystem map as outlined in chapter 3 provides a first input data for relating species and habitat information based on EUNIS classes to ecosystem condition. Other approaches currently explored are mapping Art. 17 species data using the predominant land cover classes of Corine or indicators such as nLEP (net Landscape Ecological Potential), which is a composite of land cover data, ‘greenness’ (a measure land use intensity), protection status, and fragmentation. An overview of current approaches and data is provided in the ETC/SIA report “Towards a Pan-European Ecosystem Assessment Methodology”, especially in Annex 1 and 2. In the first instance spatially explicit indicators such as nLEP or ‘wilderness’ provide at least qualitative information delineating areas of different levels of ‘expected biodiversity’, which can be then underpinned with more detailed data on observed species diversity.
23 See http://www.bioone.org/doi/abs/10.2326/osj.9.3 and http://www.ebcc.info/wpimages/other/bio-iindicators.pdf 24 Status assessments have already been completed for mammals, reptiles, amphibians, butterflies, dragonflies, freshwater fishes and selected saproxylic beetles, molluscs and vascular plants. Assessments of pollinators, medicinal plants, birds and marine fishes are currently being carried out http://ec.europa.eu/environment/nature/conservation/species/redlist/index_en.htm 25 http://projects.eionet.europa.eu/eea-ecosystem-assessments/library/working-document-data-availability

Mapping and Assessment of Ecosystems and their Services
34 | P a g e
5 ASSESSING ECOSYSTEM SERVICES
This section reports on the indicators that were collected in the four ecosystem pilots to measure ecosystem services at national scale. The results are reported separately for each pilot study but the section ends with a common set of lessons learnt and recommendations for assessments.
5.1 Forest services The summary table is structured in three mains sections of forest ecosystem services (FES) i.e. provisioning, regulating/maintenance and cultural.
5.1.1 Provisioning services
The provisioning section (Table 5) includes those forest services related to forest production of biomass, water and energy. In this section there are a reasonably large number of indicators in the green category. Most of these services are related to forest biomass supply and several available indicators are derived from data collected by National Forest Inventories (NFI) and from the European Forest Data Centre (EFDAC) for European level datasets. For these services, using data from NFI either as baseline for further assessment and/or mapping OR using it as data for model calibration/validation is the recommended option. Therefore, MS should use data from their NFI for mapping and assessment of Forest ecosystem services (FES) in this category. Other sources of information for forest biomass provision are remote sensing derived indicators that would in any case require ground information from NFI for model fitting and validation of results (5).
Within the provisioning FES the situation regarding water-related services seems more problematic since no plug-and-play indicators were identified and/or addition of hydrological modelling techniques would be required for proper assessments. A few indicators were included for this category, most of them in the red category and only modelling-related indicators are green. Regarding provisioning services derived from plants and animals, most of the relevant indicators are in the yellow category, indicating a relatively good option for mapping and assessment, but requiring further work to be operational.

Mapping and Assessment of Ecosystems and their Services
35 | P a g e
Table 5. Indicators for provisioning services delivered by forests
Division Group Class IndicatorsNutrition Biomass Cultivated crops
Reared animals and their outputs ● Meat production (Iberian pig species) ● Meat consumption (Iberian pig species) ● Number of individuals (Iberian pig) ● Meat production (reindeer) ● Meat consumption (reindeer) ● Number of individuals (reindeer)
Wild plants, algae and their outputs ● Distribution of heathlands and other habitats for bees ● Distribution of plants important for honey production ● Distribution of wild berries, fruits, mushrooms (NFI plot data) ● Distribution of wild berries (modelling) ● Honey production ● Honey consumption ● Wild berries, fruits and mushroom harvest
Wild animals and their outputs ● Amount of meat (hunting) ● Value of game ● Hunting records (killed animals)
Plants and algae from in-situ aquaculture Animals from in-situ aquaculture
Water Surface water for drinking ● Total supply of water per forest area (modelling) ● Area of forest dedicated to preserve water resources ● Surface water supply per forest area (at river basin level) ● River discharge ● Reservoir water (proxy) ● Population and per capita water consumption
Ground water for drinking NoneMaterials Biomass Fibres and other materials from
plants, algae and animals for direct use or processing
● Forest biomass stock ● Forest biomass increment ● Forest for timber, pulp wood, etc. production ● Commercial forest tree volume & harvesting rates ● Trees (presence): cork oak for cork & pines for resins ● Tree species (timber tress) ● Wood consumption (industrial roundwood, fuelwood) ● Consumption of cork and resins
Materials from plants, algae and animals for agricultural use
● Distribution of foraging areas in forest; estimate of grassland/shrubland (NPP) ● Marketed forage
Genetic materials from all biota ● Distribution of plants species with biochemical /pharmaceutical uses ● Raw materials for medicines
Water Surface water for non-drinking purposes Same as for drinking purposes
Ground water for non-drinking purposes
Energy Biomass-based energy sources
Plant-based resources ● Wood fuel stock (fraction of forest biomass stock) ● Wood fuel production (fraction of forest biomass increment) ● Distribution of tress for wood production ● Fuel wood consumption
Animal-based resourcesMechanical energy Animal-based energy

Mapping and Assessment of Ecosystems and their Services
36 | P a g e
5.1.2 Regulating/ maintenance services
This section of FES seems to be poorly covered by available indicators (Table 6) and many of these are coded in red. This is the case for “Filtration, sequestration, storage, accumulation by ecosystems” where only two indicators were included, one red and one yellow. It is worth mentioning that in this case the area of forest has been suggested as one indicator, in red, for this service. This is because in this case the area of forest is a qualitative indicator from the perspective that it is able to indicate forested areas, but is unable to account for quantitative information about the supply of the service. Consequently the area of forest is considered to be a coarse indicator unable to convey relevant information to end-users and policy-makers. Therefore, further refined and/or local level assessments should be used for verifying the information provided by this type of indicator. This is applicable to other FES indicators coded in red in the summary table.
Regarding the Division “Mediation of flows” green indicators are those derived from modelling exercises. In this case, more robust information can be provided. However, there is a need for the implementation of specific modelling approaches integrating different spatial datasets usually in a GIS environment or coupled with hydrological models, in particular for erosion protection, water supply and water flow maintenance.
There is wide variability in the indicators identified in the Division “Maintenance of physical, chemical, biological conditions”. Four indicators are coded in green representing the most reliable sources of information for assessment and mapping. A closer look shows that for instance “abundance of pollinators” is an indicator that should be streamlined with the agriculture pilot of MAES considering the strong links of these two ecosystems regarding pollinators. It is also noticeable that for a number of indicators included in the red category more accurate local-level assessments could provide more reliable information to end-users and policy makers. One of the important services provided by forests regarding “global climate regulation” is carbon storage (and carbon sequestration). Indicators for this service could be computed from available proxy datasets derived from remote sensing imagery. Indicators for this service are coded in green and there is good availability of data at European and at country level.
Table 6. Indicators for regulating services delivered by forests
Division Group Class IndicatorsMediation of waste, toxics and other nuisances
Mediation by biota Bio-remediation by micro-organisms, algae, plants, and animals Filtration/sequestration/storage/accumulation by micro-organisms, algae, plants, and animals
Mediation by ecosystems
Filtration/sequestration/storage/accumulation by ecosystems
● Area of forest ● Sulphur (S) and Nitrogen (N) retention and removal
Dilution by atmosphere, freshwater and marine ecosystems Mediation of smell/noise/visual impacts
Mediation of flows
Mass flows Mass stabilisation and control of erosion rates
● Erosion protection (modelling) ● Area of forest ● Area of forest designated to the prevention of soil erosion ● Area eroded by wind and water ● Forest cover in high slope areas (GIS analysis) ● Sediments removed from dams, lakes, rivers
Buffering and attenuation of ● Forest area designated for attenuation of mass flows ●

Mapping and Assessment of Ecosystems and their Services
37 | P a g e
Division Group Class Indicatorsmass flows Erosion risk mitigation ● Flood risk mitigation
Liquid flows Hydrological cycle and water flow maintenance
● Forest area (designated to preserve water resources) ● Number of floods ● Water retention in forest ● Snow cover ● Infiltration ● Capacity for maintaining baseline flow (modelling) ● Water storage/delivery capacity of soil ● Water supply and discharge (hydrological modelling) ● Important areas for water infiltration and headwater surroundings covered by forest ● Drought and water scarcity
Flood protection ● Special protection areas for preventing mass flows linked to the River Basin Management Plans ● Reforestation of forest territories against floods ● Number of floods
Gaseous / air flows Storm protection ● Area of forest designated to protect infrastructure and managed nat. resources ● Frequency of storms ● Area of forest
Ventilation and transpiration NoneMaintenance of physical, chemical, biological conditions
Lifecycle maintenance, habitat and gene pool protection
Pollination and seed dispersal ● Number of pollinator species ● Number of bee hives ● Abundance of pollinators (maps) ● Areas managed for gene conservation ● Pollination potential (maps) ● Surface area of dependent crops ● Honey production (modelling) ● Honey consumption
Maintaining nursery populations and habitats
● Tree species distribution ● Conservation investments ● Protected Areas for nursery populations ● Forest area designated for habitat-landscape protection: Natura2000, etc.
Pest and disease control
Pest control ● Host-species (trees) abundance ● Surface of healthy Forests (quality parameter of forest health) ● Number of pests and diseases ● Surface affected by pests and diseases ● Number of IAS ● Surface occupied by IAS ● Damage costs
Disease control NoneSoil formation and composition
Weathering processes ● Area of forest ● Restoration costs ● Forest soil condition: chemical soil properties
Decomposition and fixing processes
● Soil organic matter ● Amount of dead wood ● Thickness of the organic layer
Water conditions Chemical condition of freshwaters
● Area of forest ● Water quality ● Forest area designated to preserve waters resources ● Cost of water purification
Chemical condition of salt waters
Atmospheric composition and climate regulation
Global climate regulation by reduction of greenhouse gas concentrations
● C storage in forest ● C sequestration by forest (NPP; NEP) ● Forest growth, growing stock ● Number of CO2 emissions permits
Micro and regional climate regulation
● Area of forest ● Albedo maps ● Foliar surface index ● Ozone & particle pollution

Mapping and Assessment of Ecosystems and their Services
38 | P a g e
5.1.3 Cultural services
Forest cultural services include the non-material outputs of forest ecosystems. In this report cultural services should be regarded as the physical settings, locations or situations that produce benefits in the physical, intellectual or spiritual state of people. They can involve individual species, forest habitats and whole ecosystems (6). Forest cultural services are often computed using multivariable analysis techniques in a GIS environment. These techniques provide a cost-effective option for integration of a large number of explanatory variables into useful, spatially-explicit indicators. Further refined analyses computing the economic value of the recreational services provided by forests are feasible using value-transfer and meta-analysis techniques. Some indicators included in the summary table (Table 7) are useful baseline data for further GIS-based spatial analysis and/or recreational services quantification. Nevertheless, the indicators on their own have a relatively low capacity for conveying relevant information to end-users. This is shown in the summary table by the number of indicators identified in red. Another important aspect for cultural indicators is the availability and access of readily available data on, for instance, number of visitors, data on distribution of wildlife, number of hunters, etc. as well as the availability of GIS maps usually needed for computing spatial indicators such as accessibility to forested areas.
Table 7. Cultural services delivered by forest ecosystems
Division Group Class IndicatorsPhysical and intellectual interactions with biota, ecosystems, and land-/seascapes
Physical and experiential interactions
Experiential use of plants, animals and land-/seascapes in different environmental settings. And physical use of land-/seascapes in different environmental settings
● Distribution of wildlife/emblematic species associated with forest ● Important bird areas associated with forest ● Area of forest accessible for recreation ● Number of visitors ● Number of hunters ● Ecotourism operators ● Area of forests accessible for hunting
Intellectual and representative interactions
Scientific, educational, heritage, cultural, entertainment and aesthetic
● Citations, distribution of research projects, educational projects, number of historic records ● Number/value of publications sold
Spiritual, symbolic and other interactions with biota, ecosystems, and land-/seascapes
Spiritual and/or emblematic
Symbolic and sacred and/or religious
● Distribution of sites of emblematic plants/forest ● Number of sites with recognised cultural & spiritual value ● Number of visitors
Other cultural outputs
Existence and bequest
● Distribution of important areas for forest biodiversity and their conservation status ● Condition of forest-associated priority species on habitat and birds directives ● Distribution of sites with forest designated as having cultural values ● Number of visitors

Mapping and Assessment of Ecosystems and their Services
39 | P a g e
5.1.4 Strengths and weaknesses
In this section we assess the strengths and weaknesses of the indicators included in the forest summary tables and propose some options for dealing with data gaps and the handling of red-coloured indicators.
The set of “green” indicators in the three tables are those for which information is readily available and that are able to convey valuable information for end-users and policy-makers. These indicators are available at pan-European and at country level and are considered reliable sources of information for the mapping and assessment of FES. Clearly, the indicators at pan-European level are usually coarser in spatial resolution (grid size of around 1 km) in comparison to country-level indicators where finer spatial resolution and higher accuracy of the measured variable is expected e.g. forest biomass provision.
NFI data should play an important role in the assessment and mapping of FES. NFIs are the main sources of forest information at country level and of the harmonized data collections held by EFDAC (FISE). Therefore, their use is the suggested option for first hand data and indicators of forests services. In some cases further refinement and analysis should be implemented using NFI data for building indicators of FES, otherwise they can be used as baseline data for calibrating and validating models used for implementing FES indicators.
Among the main limitations of the indicators in the summary table it is necessary to consider the opportunity for the proper use of “red” indicators. In many cases they are qualitative indicators (e.g. forest/non forest maps) and are not adequate for allowing an estimation of the supply of services, which should be based on quantitative information. The alternative of using qualitative indicators for measuring supply or stock of a given service is a limited option for providing information to the policy-makers. Quantitative validated indicators are the suggested option for this purpose. This is an aspect that should be carefully considered in the methodological step of the implementation of mapping and assessment of FES.
5.1.5 Key references for forest ecosystem services
• EUROSTAT (2012) Energy, transport and environment indicators – EUROSTAT Pocketbooks. EUROSTAT, European Commission. Luxembourg: Publications Office of the European Union. doi:10.2785/19616.
• FAO (2010) Global Forest Resources Assessment 2010 - Main report, Food and Agriculture Organisation of the United Nations (FAO), Rome, pp. 340.
• FOREST EUROPE, UNECE, FAO (2011) State of Europe's Forests 2011 - Status and Trends in Sustainable Forest Management in Europe., FOREST EUROPE, UNECE and FAO, Oslo, pp. 337.

Mapping and Assessment of Ecosystems and their Services
40 | P a g e
5.2 Cropland and grassland services In the pilot on agro-ecosystems two ecosystems were considered: cropland and grassland. The concept of agro-ecosystems encompasses cultivated crops (herbaceous and woody, annual and perennial), grasslands, and farmland features as part of farm holdings (hedges, ridges, field margins, buffer strips, uncultivated land, single trees, woodlots etc.), composed by natural or semi-natural vegetation.
The monitoring of environmental impacts of agricultural practices has been part of the Common Agricultural Policy (CAP) for decades. Monitoring occurs at various scales and resolutions and is harmonised at EU level in:
• the Farm Structure Survey (FSS), which is a harmonised agricultural census. Data collected at farm level are published at aggregated level by Eurostat;
• the Farm Accountancy Data Network (FADN), which is an instrument for evaluating the income of agricultural holdings and the CAP impacts. Besides economic data it contains physical and structural data;
• the Land use/cover area frame statistical survey (LUCAS), a survey on the state and the dynamics of changes in land use and cover in the EU, which recently has included an extensive topsoil survey;
• the Land Parcel Identification System (LPIS), which is part of the Integrated Administration and Control system; besides serving as an identification system for payment entitlements it also contains data at parcel level on crop type;
• Eurostat Agri-environmental indicators (AEIs), that track the integration of environmental concerns into the Common Agricultural Policy (CAP) at EU, national and regional levels;
• the Common Monitoring and Evaluation Framework (CMEF) for monitoring and evaluation of all rural development interventions, and the Common Context Indicators (CCI), which describe the state of the economic, social and environmental situation in a given territory at a given time. These are two reference frameworks for impact assessment of Rural Development Plans, which include a substantial environmental part.
All these initiatives provide a wealth of information to MAES, in particular for what concerns provisioning ecosystem services. In some cases (i.e. FSS, FADN, LPIS) they report on the Utilised Agricultural Area (UAA) defined as “area used for farming”. Common lands are also part of the UAA, while landscape elements such as tree lines and woodlots, though part of farmland, are not. Care must be taken when attaching agricultural statistics to land cover maps as the two areal estimates (i.e. UAA and CORINE land cover agricultural classes) usually do not match.
The MAES exercise shows that most of indicators are available either at EU or national scale. It shows as well that it is not always possible to calculate separately ecosystem service indicators for cropland and grassland (bounding across ecosystems). This applies to some regulating and to most of the cultural ecosystem services. In some case, though, it is possible to apply a cropland or a grassland mask a-posteriori when the ecosystem service is mapped at a sufficient level of detail (10 km or less) and identify the contribution of each ecosystem type.
On the other hand, there are cases where the same indicator can be used to map more ecosystem services (bounding across ecosystem services). This is especially the case of semi-natural vegetation in agricultural lands. It can be divided in two broad groups: i) large patches of semi-natural vegetation (i.e. semi-natural grasslands,

Mapping and Assessment of Ecosystems and their Services
41 | P a g e
agroforestry areas, traditional orchards) that are widely recognised as hot spots of agro-biodiversity (so-called High Nature Value farmland) and ii) smaller features in more intensive landscapes such as hedgerows, buffer strips, field margins, scattered trees or woodlots (also referred to as landscape features). The value for biodiversity and ecosystem service provision of the first group, and especially of semi-natural grasslands, is widely recognised (7). The second group has an important role in providing a number of regulating ecosystem services relevant to agricultural production (e.g. pollination, pest control, mitigation of soil erosion) in cropland in particular in addition to being widely associated to landscape values and cultural ecosystem services.
While the first group can be mapped i.e. through LPIS data or the High Nature Value farmland indicator (as mapped in the Agri-environmental indicator framework, or reported by Member States in the CMEF), the second group is more difficult to map due to the small size of its elements
5.2.1 Provisioning services
The primary role of agriculture is to provide food, feed, fibres, and energy. Therefore, associating agricultural production to provisioning services is straightforward, as made evident in the MAES table. Data relevant to this set of services are largely provided by CAP monitoring and span from parcel data (IACS/LPIS) to regional statistics (FSS). The three main divisions of provisioning services (nutrition, materials, energy) can be mapped either through access to detailed parcel data (or derived products i.e. gridded layers) or using regional statistics. The units of measure can be surfaces, weight and energy. Once the indicator is selected (area, yield or caloric content), it should be maintained throughout the division in order to avoid double counting. For the same reason, crops must be allocated either totally or on the basis of known shares to each of the three divisions. If this is not possible, divisions should be merged. Energy can be an exception, since the quantity of produced biofuel may in fact be available as an indicator. Care must be taken though, to discount the corresponding hectares of bio-energy crops from the other divisions.
The proposed indicators for mapping provisioning services (Table 8) do not take into account the fact that agricultural output is not a mere product of the ecosystems, but a result of land management, and increased production figures depend partly on the exploitation of ecosystem services elsewhere (including outside the EU). Therefore a full accounting of the agro-ecosystem provisioning services would ideally discount the human input (labour, machinery, irrigation, fertilisation, pest control etc.) in order to identify the contribution of ecosystems to production. However, as there is currently no agreed approach to carrying out this discounting agricultural production is retained as indicator as it is widely accepted as a proxy for provisioning ecosystem services from agriculture. The link between ecosystems and human systems can be analysed a-posteriori by using the Driver-Pressure-State-Impact-Response framework (6).
Livestock is considered as an ecosystem service as it feeds on products of agro-ecosystems. For this same reason, data on livestock should not be used if feed and grassland are already accounted for in the provisioning services. In order to avoid double counting, livestock data can be used as indicator when feed and grassland are not already included in the “cultivated crops” indicator.
Manure data can be derived from excretion factors delivered by MS to Eurostat for the calculation of gross nutrient balance.
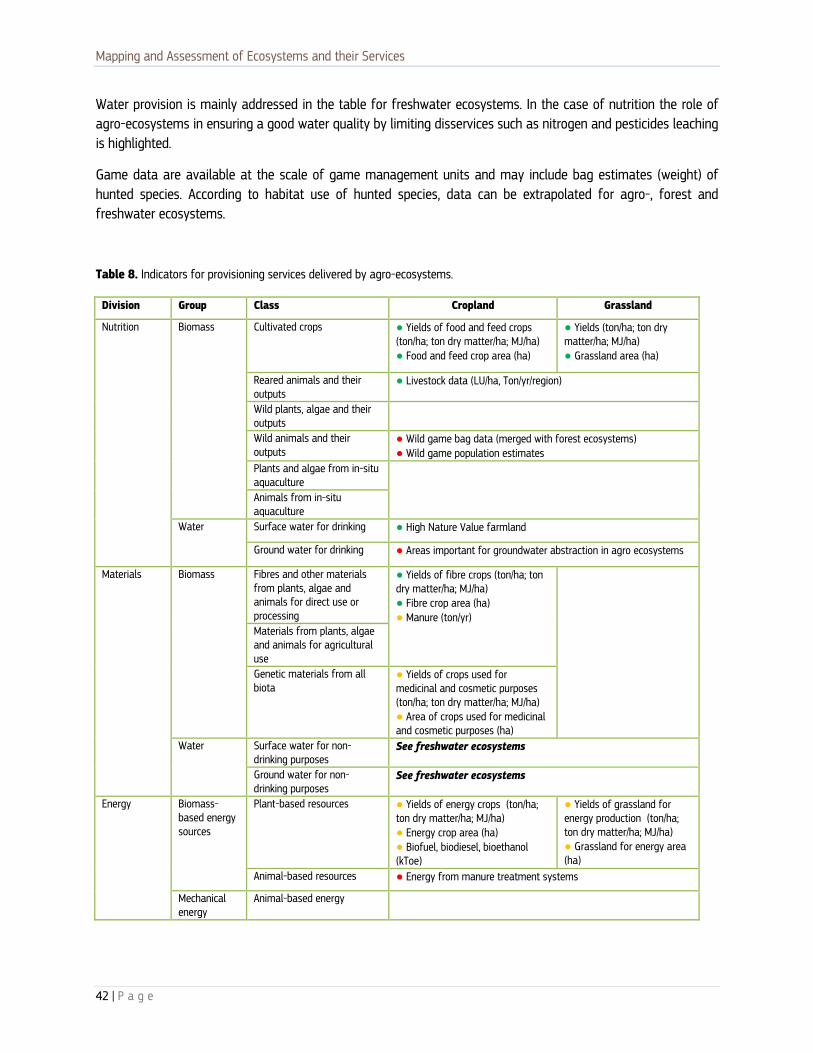
Mapping and Assessment of Ecosystems and their Services
42 | P a g e
Water provision is mainly addressed in the table for freshwater ecosystems. In the case of nutrition the role of agro-ecosystems in ensuring a good water quality by limiting disservices such as nitrogen and pesticides leaching is highlighted.
Game data are available at the scale of game management units and may include bag estimates (weight) of hunted species. According to habitat use of hunted species, data can be extrapolated for agro-, forest and freshwater ecosystems.
Table 8. Indicators for provisioning services delivered by agro-ecosystems.
Division Group Class Cropland Grassland
Nutrition Biomass Cultivated crops ● Yields of food and feed crops (ton/ha; ton dry matter/ha; MJ/ha) ● Food and feed crop area (ha)
● Yields (ton/ha; ton dry matter/ha; MJ/ha) ● Grassland area (ha)
Reared animals and their outputs
● Livestock data (LU/ha, Ton/yr/region)
Wild plants, algae and their outputs
Wild animals and their outputs
● Wild game bag data (merged with forest ecosystems) ● Wild game population estimates
Plants and algae from in-situ aquaculture
Animals from in-situ aquaculture
Water Surface water for drinking ● High Nature Value farmland
Ground water for drinking ● Areas important for groundwater abstraction in agro ecosystems
Materials Biomass Fibres and other materials from plants, algae and animals for direct use or processing
● Yields of fibre crops (ton/ha; ton dry matter/ha; MJ/ha) ● Fibre crop area (ha) ● Manure (ton/yr)
Materials from plants, algae and animals for agricultural use Genetic materials from all biota
● Yields of crops used for medicinal and cosmetic purposes (ton/ha; ton dry matter/ha; MJ/ha) ● Area of crops used for medicinal and cosmetic purposes (ha)
Water Surface water for non-drinking purposes
See freshwater ecosystems
Ground water for non-drinking purposes
See freshwater ecosystems
Energy Biomass-based energy sources
Plant-based resources ● Yields of energy crops (ton/ha; ton dry matter/ha; MJ/ha) ● Energy crop area (ha) ● Biofuel, biodiesel, bioethanol (kToe)
● Yields of grassland for energy production (ton/ha; ton dry matter/ha; MJ/ha) ● Grassland for energy area (ha)
Animal-based resources ● Energy from manure treatment systems
Mechanical energy
Animal-based energy

Mapping and Assessment of Ecosystems and their Services
43 | P a g e
5.2.2 Regulating/Maintenance Services
Agricultural activities by definition change the state of ecosystems and consequently have a great impact on regulating/maintenance services. The perspective from which the mapping must be done is of how much agro-ecosystems support regulation of ecological processes such as bio-remediation, filtration, mass stabilisation, flood protection, soil formation, and atmospheric composition.
There is a difficulty in mapping this type of services, partially deriving from the need to map pressures deriving from agriculture in order to make it more sustainable (i.e. soil erosion, pollution by nitrates versus soil loss mitigation and nitrogen removal). In the above-mentioned monitoring frames a number of indicators are available on drivers, pressures and impacts, but these should be used when they are a proxy for an ecosystem service (i.e. how much CO2 is sequestered by agro-ecosystems) and not of a disservice (i.e. GHG emissions). Drivers, pressures and impacts can be associated to the ecosystem services frame in a post-analysis context to explain links and trends (8).
Exceptionally the measurement of pressures or impacts is accepted as proxy for the ecosystem services: in the case of soil erosion risk, though the percentage of soil covered though appropriate farming practices is considered a better proxy for this ecosystem service, and in the case of gross nitrogen balance for decomposition and fixing processes.
Overall, the MAES table (Table 9) shows that some indicators are readily available, for example information on soil weathering processes is available in the LUCAS topsoil survey, the share of organic farming is available in FSS and the AEI framework, organic carbon content and percentage of soil cover are available in the AEI framework. LUCAS topsoil survey data are collected through a sampling approach and, in order to avoid introducing bias in the estimates, point data (collected on agricultural lands) should be averaged over NUTS2 regions and not at a more detailed resolution.
As already mentioned above, a group of ecosystem services can be mapped using as proxy the density of hedgerows or, more generally, woody vegetation in agricultural lands, which is not already tackled by the forest pilot (woody landscape features). This is information that is collected at EU level in the LUCAS survey, though it is available in this case on a 250 m transect for each point of the sampling grid and may not be sufficient to map those ecosystem services that require a full spatial coverage (i.e. pollination). The best option in this case would be to use national/regional surveys when available. LPIS will contain a reference layer to accommodate CAP Ecological Focus Areas, but this will only become available in 2017.
National/regional surveys are also needed to report on the pollination ecosystem service, which relies on data on pollinators' distribution. As a proxy, the areal coverage of farmland features supporting pollination can be used. This is the sum of the macro- and micro- elements of semi-natural vegetation described in the introduction of this chapter (High Nature Value farmland including ecologically valuable grasslands, traditional orchards, traditional agro-forestry areas, plus small scale features such as hedges, field margins, flower strips etc.). A pollination potential map is also available at EU scale (9). Such indicators are proxies for landscape suitability to host pollinators and to provide pollination as ecosystem service. Pollination is needed for the production of seeds both in wild plants and crops. It must be underlined that not all crops need to be pollinated by insects therefore the actual service derives from the match between the availability of pollinators and spatial distribution of crops depending from insect pollination. Such distribution, though, is not stable over time; therefore a proxy for the landscape potential to supply the service is considered sufficient for mapping and assessment purposes.

Mapping and Assessment of Ecosystems and their Services
44 | P a g e
Table 9. Indicators for regulation and maintenance services delivered by agro-ecosystems.
Division Group Class Cropland Grassland
Mediation of waste, toxics and other nuisances
Mediation by biota
Bio-remediation by micro-organisms, algae, plants, and animals
Filtration/sequestration/storage/accumulation by micro-organisms, algae, plants, and animals
Mediation by ecosystems
Filtration/sequestration/storage/accumulation by ecosystems
● Concentration of pollutants in soil in agricultural areas ● Concentration of nutrient elements (C, N, P, K, Ca, Mg, S) in soil in agricultural areas
Dilution by atmosphere, freshwater and marine ecosystems
Mediation of smell/noise/visual impacts
● Hedgerow length
Mediation of flows
Mass flows Mass stabilisation and control of erosion rates
● Percentage of soil cover in cropland (conservation tillage (low tillage), zero tillage, winter crops, Cover crop or intermediate crop, plant residues ) ● Density of hedgerows ● Soil erosion risk
● Percentage of grassland cover ● Soil erosion risk
Buffering and attenuation of mass flows
● Density of hedgerows
Liquid flows Hydrological cycle and water flow maintenance
● Retention capacity of water in agricultural soils
Flood protection ● Share of agroforestry within floodplains
Gaseous / air flows
Storm protection ● Density of hedgerows
Ventilation and transpiration ● Amount of biomass
Maintenance of physical, chemical, biological conditions
Lifecycle maintenance, habitat and gene pool protection
Pollination and seed dispersal ● Pollination potential ● Pollinators distribution ● Pollinators species richness ● Number of beehives ● Areal coverage of vegetation features supporting pollination (hedgerows, flower strips, High Nature Value Farmland etc.)
Maintaining nursery populations and habitats
● Share of High Nature Value farmland ● Traditional orchards
Pest and disease control
Pest control ● Density of hedgerows
Disease control
Soil formation and composition
Weathering processes ● Share of organic farming ● Soil organic matter content ● Ph of topsoil ● Cation exchange capacity
Decomposition and fixing processes
● Area of N fixing crops ● Gross nitrogen balance
Water conditions
Chemical condition of freshwaters
See water pilot
Chemical condition of salt waters
See water pilot
Atmospheric composition and climate regulation
Global climate regulation by reduction of greenhouse gas concentrations
● Carbon sequestered by permanent crops
● Carbon sequestered by grasslands
Micro and regional climate regulation
● Humidity index

Mapping and Assessment of Ecosystems and their Services
45 | P a g e
5.2.3 Cultural services
Provision of cultural ecosystem services is deeply rooted in agro-ecosystems, and their thousand-year old history of human management. Cultural manifestations of the link between human society and agricultural land are numerous and very different throughout the EU, therefore the MAES table, especially for intellectual and spiritual ecosystem services, cannot be exhaustive. Moreover, due to this variety, and also to some methodological and practical difficulties in mapping this type of services EU wide (often surveys are needed), only a few indicators are readily available in monitoring frameworks.
The mapping of physical interaction services is based on indicators describing the experiential use people make of agro-ecosystems. These refer to visitors/tourism in agricultural areas; number of rural enterprises offering tourism-related services); density of walking, riding, biking trails; number of hunting licences, number of birdwatchers. Among these, visitors' data are the most appropriate variable to directly map the actual service. Most of this information can be available at national/regional level, except the number of tourism-related enterprises for which there is EU level reporting in the FSS (holdings declaring tourism “as other gainful activity”). Data related to hunting are available at the scale of game management units and may include the number of people involved in hunting and hunting related expenditures.
Intellectual interactions can be mapped through the number of didactic farms, fairs, competitions. The number of certified products (Protected Designation of Origin, Protected Geographical Identification) that require specific (often traditional) landscape management can be used, since on the one hand these products directly represent cultural heritage linked to agro-ecosystems, and on the other hand, their marketing supports agricultural landscape maintenance (10). Data on visitors can be used in this context as well, while taking care of avoiding double counting with physical interaction services. If visitor's preferences towards the use of nature are not known and a share of the overall visitor's number cannot be assigned to the two services, then the mapping should be made at a higher aggregation level of the CICES table (i.e. division rather than class). Lastly, with the development of social media, the number of photos of agro ecosystems uploaded on websites is becoming an option (11).
Spiritual and emblematic services are probably the most difficult to be mapped; they require local knowledge or detailed mapping of landscape features. Examples are remarkable trees, charismatic species, pilgrim paths in rural areas (i.e. Camino de Santiago, Via Francigena).
Finally, agro ecosystems included in conservation or protection programmes on the basis of their importance for the maintenance of biodiversity and other cultural values (e.g. Natura2000, Biosphere reserves, IUCN category V areas, World Heritage Unesco sites related to agricultural landscape, landscape conservation areas, High Nature Value farmland) can be taken as representative of 'existence' and 'bequest' services in the CICES typology. In this case it is important to avoid double counting; the synthesis of the different layers is the product of a spatial overlay and not of the sum of areas.

Mapping and Assessment of Ecosystems and their Services
46 | P a g e
Table 10. Indicators for cultural services delivered by agro-ecosystems.
Division Group Class Cropland Grassland
Physical and intellectual interactions with biota, ecosystems, and land-/seascapes [environmental settings]
Physical and experiential interactions
Experiential use of plants, animals and land-/seascapes in different environmental settings
● Number of visitors in agricultural areas ● Number of Number of rural enterprises offering tourism-related services ● Farm tourism ● Walking and biking trails ● Number of hunting licences, number of birdwatchers ● Expenditures related to hunting
Physical use of land-/seascapes in different environmental settings
Intellectual and representative interactions
Scientific ● Amount of scientific studies on agro-ecosystems
Educational ● Number of didactic farms
Heritage, cultural ● Number of agricultural-livestock fairs ● Number of monuments in agricultural areas ● Number of certified products that require traditional landscape management
Entertainment ● Contests and competitions related to agriculture
Aesthetic ● Number of visitors in agricultural areas ● Number of nature/agricultural landscape photos uploaded on web portals
Spiritual, symbolic and other interactions with biota, ecosystems, and land-/seascapes [environmental settings]
Spiritual and/or emblematic
Symbolic ● Remarkable trees ● Symbolic species
Sacred and/or religious ● Religious monuments, pilgrim paths in agro-ecosystems
Other cultural outputs
Existence ● Cropland or grassland in protected agricultural areas (e.g. Natura2000, Biosphere reserves, IUCN category V areas, World Heritage Unesco sites related to agricultural landscape, landscape conservation areas) ● Willingness to pay for landscape measures in cropland or grassland areas
Bequest
5.3 Freshwater services In the pilot on freshwater, four ecosystems were considered: lakes, rivers, groundwater and wetlands26. Table 11 lists the indicators for mapping ecosystem services provided by these four ecosystems.
The exercise showed that in some cases the same indicator can be used across different ecosystems (bounding across ecosystems). For example, several indicators suggested for wetlands are also used for services provided by forest, cropland and grassland, as wetlands are at the interface between water bodies and terrestrial ecosystems. In a similar way, many of the indicators proposed for lakes, rivers and groundwater are often of the same typology (e.g. ecological or chemical status) although in the technical implementation they refer to the specific freshwater ecosystem.
In other cases the same indicator can be used for different services (bounding across ecosystem services). In this case the indicator represents the CICES group or division without distinguishing between different ecosystem
26 The MAES Freshwater pilot dealt with inland surface water bodies (rivers, lakes, small water bodies) and groundwater, as well as inland wetlands and floodplains, while transitional waters and coastal waters including coastal wetlands were considered in the Marine pilot.

Mapping and Assessment of Ecosystems and their Services
47 | P a g e
service classes. This is especially evident for cultural services where there is overlap in the services at the class level (e.g. educational vs. scientific services). For this reason, while attempts have been made to capture all relevant indicators with data at the class level, in some cases indicators were introduced only at the group level.
The contribution of groundwater to some ecosystem services is not well known as groundwater is connected to surface waters and exerts many indirect effects on the functioning of the other ecosystems. This has resulted in some conceptual difficulties in identifying appropriate indicators. Ecosystem services related to springs and thermal sites can be accounted under rivers and lakes, but those connected to karst systems, such as caves and speleology, can be described under groundwater.
Most of the indicators suggested for ecosystem services provided by freshwater refer to the condition of the water body. This involves the assumption that good conditions indicate a healthier and more resilient ecosystem that provides more services and maintains the capacity to provide them for the future. However, the relationship between ecosystem conditions and services has not been explicitly explored and remains a topic of research.
Finally, many indicators are not necessarily the only indicators related to the delivery of a particular service, and therefore they cannot be used as a stand-alone indicator for that service. Many indicators should be used in combination with other datasets or indicators to make them complete or even spatially explicit (see also chapter 7 and tiered mapping approaches).
5.3.1 Provisioning Services
Water provision is the availability of clean water for domestic or industrial use. Water availability (estimated by modelling or by simple difference between precipitation and evapotranspiration) conveys information on the capacity of the ecosystem to supply water, while water abstraction describes the demand for water. Indicators such as the Water Exploitation Index (WEI) (12) combine the supply and demand components. The possibility to describe the ecosystem service at the class level of the CICES classification depends on the availability of information on the use, for drinking or non-drinking purposes, and on the source, from lakes, rivers or groundwater (for example, water abstractions reported in Eurostat are divided between water for drinking and water for other uses, but the source of the abstractions is not indicated). Statistical information from datasets such as EUROSTAT, needs to be combined with other data such as NUTS, the location of dams or land cover to make it spatially explicit. Outputs from models usually contain water availability per river basin or catchment.
One aspect that is still poorly represented by the annual indicators is the temporal availability of water, as they provide only the total annual amount of water. In addition, when assessing water provisioning services, the quality should also be considered. Higher quality is required for drinking purposes than for other uses. Information on nutrient loading or ecological status of water bodies could provide insights on water quality.
The provisioning of fish can be described by the fish catch (ton/yr) as in the marine ecosystem. The number of licenses or fishermen is a proxy of the fishing activity. In this context the status of a fish population is an indicator of the capacity of the ecosystem for fish provisioning. Fish catch in tons/yr could be converted to tons/ha/yr. To map the fish provisioning services, the statistics on fish catch could be reallocated to water bodies where the fish comes from. For example the total fish catch from a particular administrative region could be reallocated to all the water bodies in the region to make it spatial (tier 2 approach to mapping, chapter 7).
For wetlands the production of wood and reeds for fibres or energy, as well as the production of peat for energy, are indicators similar to those used in forest and cropland ecosystems. In the absence of information, the surface

Mapping and Assessment of Ecosystems and their Services
48 | P a g e
of wetlands, peat soils and riparian areas is suggested as proxy for these services. However, only areas within the wetland that contain the necessary vegetation cover should be delineated for the service. For example, for wood production, only woodland areas or forested areas within the wetland should be mapped. It may be necessary to overlay a wetland or riparian zone map with a forest map to map this service.
5.3.2 Regulating/ Maintenance Services
Regulating and maintenance services are the benefits humans get from ecosystem through their regulation of ecological processes such as climate change, hydrological cycle or sediment transport. The regulation of freshwater ecological processes therefore usually involves many variables including characteristics of vegetation surrounding lakes and rivers, soils, slopes and rivers characteristics. The regulation and maintenance services are the most difficult to be mapped and assessed, both for the partial understanding of some biophysical processes and for the nature of the services, which underpin all the other services. This is especially evident for water because the hydrological cycle is at the basis of climate, soil and landscape formation, plant growth, erosion and biogeochemical cycle of elements. The water cycle is involved in almost all the regulation and maintenance services and describing this through few indicators is challenging and conceptually questionable. The service Hydrological cycle and water flow maintenance is still under discussion and it is not possible to select an indicator that is better than the others. Many indicators of the water cycle or the modelling of the hydrological cycle can be used here.
The water cycle is also involved in maintaining water quality. Indicators of water quality and the trophic status have been suggested as indicators for several regulating services, especially for mediation of waste, toxics and other nuisances and for CICES group ‘Water conditions’. However, they are indicators of conditions and this assumes an implicit relationship between the status of the water body and the provision of the service. Nutrient and sediment retention (net amount of nutrient or sediment permanently or temporarily removed by the system in a time period) are suggested as indicators of the ecosystem service of water quality regulation. Usually, nutrient retention is estimated by modelling, because of the lack of spatial and temporal primary data. The nutrient load can be considered as a measure of the demand of water purification from nutrient pollution. The indicators proposed under mediation of waste, toxics and other nuisances are similar for the different service classes, for this reason they are grouped together.
The indicator suggested for groundwater regulation services is generally the evolution of groundwater depth. Although this is a simple indicator of the status, it can provide insights into the interaction between groundwater and surface water as well as surface vegetation and between groundwater and wetlands. The depth of the water table has also an influence on the climate.

Mapping and Assessment of Ecosystems and their Services
49 | P a g e
Table 11. Indicators for ecosystem services delivered by freshwater ecosystems (Indicators in red fond are subject to discussion). 1
Division Group Class Lakes Rivers Ground water WetlandsNutrition Biomass Cultivated crops
Reared animals and their outputs Wild plants, algae and their outputs ● Wild plants used in gastronomy,
cosmetic, pharmaceutical uses (data on industries collecting the plants)
see lakes and rivers
Wild animals and their outputs ● Fish production (catch in tonnes by commercial and recreational fisheries) ● Number of fisherman and hunters of waterfowls (anglers, professional and amateur fishermen) ● Status of fish population (Species composition, Age Structure, Biomass kg/ha)
see lakes and rivers
Plants and algae from in-situ aquaculture Animals from in-situ aquaculture ● Freshwater aquaculture production (e.g.
sturgeon and caviar production)
Water Surface water for drinking ● Water exploitation index (WEI)
● Water consumption for drinking ● Surface water availability ● Water abstracted
● Nitrate-vulnerable zones
Ground water for drinking ● Ground water bodies ● Ground water abstraction
Materials Biomass Fibres and other materials from plants, algae and animals for direct use or processing
● Wood produced (tons or volume) by riparian forest ● Surface of exploited wet forests (e.g. poplars) and reeds
Materials from plants, algae and animals for agricultural use
Genetic materials from all biota Water Surface water for non-drinking
purposes ● Water exploitation index (WEI)
● Water use per sector ● Surface water availability ● Water abstracted ● Volume of water bodies
● Surface of flood-prone areas
Ground water for non-drinking purposes
● Ground water bodies ● Ground water abstraction

Mapping and Assessment of Ecosystems and their Services
50 | P a g e
Division Group Class Lakes Rivers Ground water WetlandsEnergy Biomass-based energy
sources Plant-based resources
● Firewood produced by
riparian forests Animal-based resources
Mechanical energy Animal-based energy Mediation of waste, toxics and other nuisances
Mediation by biota Bio-remediation by micro-organisms, algae, plants, and animals
● Indicators on water quality (microbiological data for bathing waters, BOD5 nitrate conc, phosphate conc, oxygen conditions, saprobiological status) ● Nutrient loads ● Ecological status ● Trophic status ● Area occupied by riparian forests ● Number and efficiency of treatment plants ● Waste treated
● Indicators on groundwater quality (NO3, pesticide, trace metals, emerging pollutants, etc. evolution in GW)
● Carbon storage per unit of area ● Potential mineralization or decomposition ● Ecological status ● Nutrient concentration ● Nutrient retention
Filtration/sequestration/storage/accumulation by micro-organisms, algae, plants, and animals
Mediation by ecosystems Filtration/sequestration/storage/accumulation by ecosystems
Dilution by atmosphere, freshwater and marine ecosystems
Mediation of smell/noise/visual impacts Mediation of flows
Mass flows Mass stabilisation and control of erosion rates ● GW level evolution
Buffering and attenuation of mass flows ● Sediment retention ● Sediment retention
Liquid flows Hydrological cycle and water flow maintenance Volume of water (or snow)
Hydrological flow data
Surface of wetlands
Flood protection ● Holding capacity flood risk maps ● Conservation of river and lakes banks
● Water holding capacity of soils ● Floodplains areas (and record of annual floods) ● Area of wetlands located in flood risk zones ● Conservation status of riparian wetlands
Gaseous / air flows Storm protection ● Conservation status of wetlands Area of wetlands, vegetation cover?
Ventilation and transpiration Maintenance of physical, chemical, biological conditions
Lifecycle maintenance, habitat and gene pool protection
Pollination and seed dispersal ● GW level Beekeeping value of wetlands
Maintaining nursery populations and habitats ● Biodiversity value (Species diversity or abundance, endemics or red list species and spawning location) ● Ecological status Morphological status
Biodiversity value?
Pest and disease control Pest control ● Alien species (Introduced riparian and aquatic plants ● Number of introduced aquatic
see lakes and rivers

Mapping and Assessment of Ecosystems and their Services
51 | P a g e
Division Group Class Lakes Rivers Ground water Wetlandsinvertebrates ● Number of introduced vertebrates in rivers and riparian areas
Disease control Soil formation and composition
Weathering processes ● Fluvisols surface ● Hydromorphic soils (Presence/absence) Surface of floodplains
Decomposition and fixing processes ● Potential mineralization, decomposition, etc.
Water conditions Chemical condition of freshwaters ● Chemical status ● Ecological status ● Indicators of GW quality
● Chemical status ● Ecological status ● Potential of water purification of wetlands
Chemical condition of salt waters Atmospheric composition and climate regulation
Global climate regulation by reduction of greenhouse gas concentrations
● C sequestration (Annual increase in ● Carbon sequestration in living biomass of riparian forest ● Carbon sequestered by plantations of Populus ● Organic carbon stored in fluvisols)
● C sequestration (Evolution of annual volumes of CO2 injected, ● Number of sites for CO2 deep injections)
see rivers and lakes
Micro and regional climate regulation ● GW level Physical and intellectual interactions with biota, ecosystems, and land-/seascapes [environmental settings]
Physical and experiential interactions
Experiential use of plants, animals and land-/seascapes in different environmental settings
● Number of visitors (to National Parks including lakes or rivers) ● National Parks and Natura 2000 sites ● Known bird watching sites Waterfowl
● Number of visitors (waterfowl hunters and fishermen, ● Visitors to National Parks or protected areas including wetlands) ● Known bird watching sites ● Waterfowl ● Tourism revenue
Physical use of land-/seascapes in different environmental settings
● Number of visitors ● bathing areas and Number beaches ● Fishing reserves, ● Fish abundance, ● Fish monetary value from angling, ● Number fishing licenses, ● Quality of fresh waters for fishing
● Number of visitors (to thermal, mineral and mud springs and beaches, to Natural Reserve areas) speleology sites
● Number of visitors (waterfowl hunters and fishermen) ● Number of fishing licenses ● Tourism revenue
Intellectual and representative interactions
Scientific ● Monitoring sites (by scientists) ● Number of scientific projects, articles, studies ● Classified sites (world heritage, label European tourism)
Educational ● Number of visitors

Mapping and Assessment of Ecosystems and their Services
52 | P a g e
Division Group Class Lakes Rivers Ground water Wetlands● National Parks and Natura 2000 sites
Heritage, cultural ● Number of visitors ● Natural heritage and cultural sites ● Number of annual cultural activities organised
Entertainment Number of visitors (surface or number of wetlands located next to a bike path)
Aesthetic ● Number of visitors ● Contrasting landscapes (lakes close to mountains) ● Proximity to urban areas of scenic rivers or lakes
Spiritual, symbolic and other interactions with biota, ecosystems, and land-/seascapes [environmental settings]
Spiritual and/or emblematic
Symbolic ● National species or habitat types ● Number of visitors (to places where springs and streams with GW origin made them historic and religious sites)
● National species or habitat types
Sacred and/or religious ● sacred/religious sites (catastrophic events, religious places)
● sacred/religious sites (catastrophic events, religious places)
Other cultural outputs Existence ● Number of visitors (to National Parks including lakes) ● Number of fishing licenses
● Number of visitors (to hot mineral spring waters)
See rivers and lakes
Bequest ● Number of association registered on animals, plants, environment, naturism
See rivers and lakes Social perception of wetlands

Mapping and Assessment of Ecosystems and their Services
53 | P a g e
5.3.3 Cultural Services
The most frequent indicator for the cultural services is the number of visitors to the lake, river or wetland. Then the specific reason of the visit can describe the service at a higher level of detail of the CICES classification. However, it is often impossible to distinguish between several services, such as entertainment and aesthetic, or cultural and educational, and in many case the motivation of the visit is a mix of several reasons. As the information on the number of visitors is often not available, mapping the areas of interest for different cultural services can be used as proxy. Examples are: mapping parks, protected areas, bike and walk paths and sacred sites in the vicinity of lakes, rivers and wetlands, natural springs and thermal sites, bird watching sites, beaches and contrasting landscapes. However, mapping contrasting landscapes, parks or areas of interest shows the capacity to deliver a service, while the number of visitors gives information on the demand for a service. The abundance of fish or waterfowls indirectly indicates the interest for the area, assuming that the higher the abundance the higher is the interest or value; this could be the case for example for fishermen and hunters. Finally, the map of monitoring sites for scientific purposes in lakes, rivers, groundwater and wetlands has been suggested as indicator for scientific cultural services. However, this only partially addresses the scientific interest for the site, as monitoring also depends on the investment in research and not only on the relevance of the specific site.
5.4 Marine services The typology of marine ecosystems was defined so as to encompass all marine waters, including all waters at the land/sea interface with salinity higher than 0.5‰. Four ecosystems were considered: i) marine inlets and transitional waters (including, among others, coastal lagoons, estuaries and fjords); ii) coastal waters (up to a depth of 70 m); iii) shelf waters (up to a depth of 200 m); and iv) open ocean (depth above 200 m). The decision to test a typology based mainly on bathymetry (thus reducing the ocean to a 2-D structure whose third dimension -pelagic habitats- is attached directly to each ecosystem) stemmed from the necessity, in this preliminary exercise, to:
• reduce difficulties arising from data availability linked to dynamic ecosystem boundaries (based, for example on light penetration or primary production)
• link the mapping and assessment exercise to the reporting streams generated from current legislation in various sectors, but mainly: • WFD and CAP on the land side • MSFD and CFP on the ocean side.
The monitoring of environmental impacts of human activities on marine ecosystems, as defined above, falls under the umbrella of a suite of policies, the main and most relevant ones being the WFD, MSFD and the CFP. Mapping and assessment of services provided by “marine inlets and transitional waters” ecosystems can derive useful data and indicators from the reporting framework of the WFD. The WFD covers not only inland water bodies, but also coastal waters within the 1nm from the baseline/coastline in each MS. MSFD explicitly recognises the overlaps with WFD and makes it clear that in coastal waters as defined in the WFD, MSFD is only intended to apply to those aspects of Good Environmental Status, which are not already covered by WFD (e.g. noise, litter, aspects of biodiversity). Thus, “coastal waters” and, in a limited number of cases, “shelf waters” ecosystems (as defined in the MAES ecosystem typology) may benefit from the joint reporting streams under both directives.

Mapping and Assessment of Ecosystems and their Services
54 | P a g e
“Open ocean” ecosystems, on the other hand, can take advantage only from data reporting under the MSFD. In both instances, data from reporting streams under WFD and MSFD are currently available only at the MS level. At the EU level, the identification of indicators for marine ecosystem services has not considered/included WFD nor MSFD indicators due to lack of EU harmonised data sets (Table 12).
Monitoring of fisheries and stock status under the CFP has been ongoing from the 70’s. Currently, data collection on fisheries is governed by the Data Collection Framework (DCF)27. Under the DCF, Member States are required to collect data on biological (e.g. stock assessment) and economic aspects of many European fisheries and related fisheries sectors (including the economic situation of the aquaculture and processing industry sectors, and the evaluation of the effects of the fishing sector on the marine ecosystem).
The different pieces of legislation provide a wealth of information relevant to the MAES process, in particular for what concerns provisioning services. The MAES exercise shows that most of the indicators are available either at EU or national scale. It shows as well that often it is not possible to identify the individual contribution of each ecosystem to the provision of a certain service. In those cases the only realistic approach is to bundle the assessment of that service across many/all ecosystems (bundling across ecosystems); where and if possible, the contribution of each ecosystem can be assessed a-posteriori, using ancillary data at local/regional scale.
In other cases, the same indicator can be used to map several ecosystem services (bundling across services). The scarcity of spatially distributed data in relation to marine ecosystems means that the same indicator can sometimes be used to provide information across ecosystems and across services. This is especially the case for some provisioning and some cultural services. The following paragraphs provide guidance for the 3 major categories of services as presented in the CICES 4 3 classification (Table 12).
The CICES classification contains a number of services that are not relevant for marine ecosystems. These services have decreased font size. Some services for which no indicators are currently available are considered as emerging ones (i.e. they are expected to become relevant sometime in the future) or which are provided at a very small/local scale, and therefore too marginal to be included in the national/EU accounting.
5.4.1 Provisioning services
Marine ecosystems are major providers of food and feed. Thus, in the provisioning service section, only the divisions related to “Nutrition” and “Materials” have been filled out. “Energy” provision has been considered as not-applicable for the most part, except for plant-based energy, which has been considered as relevant only at local scale. Within “Nutrition” and “Materials”, “Water” provision with both “Nutrition” and “Materials” has not been considered, as this service is not dependent on the biotic component of the ecosystem. In terms of food for nutrition and feed (related mostly to provision of fish-meal and the aquaculture industry), indicators proposed are available at national and EU level from the Common Fisheries Policy reporting.
27 Commission Regulation (EC) No. 665/2008) establishing a Community framework for the collection, management and use of data in the fisheries sector and support for scientific advice regarding the Common Fisheries Policy (CFP).

Mapping and Assessment of Ecosystems and their Services
55 | P a g e
5.4.2 Regulating/ maintenance services
For the service division on “Mediation of waste, toxic and other nuisances” nutrient loads to coastal areas are available at EU level through the FATE28 initiative from JRC on pollutants in terrestrial and aquatic ecosystems; spatial distribution of total annual deposition fluxes of HM and POP atmospheric input to the regional seas (the Baltic, North, Black, Mediterranean and Caspian Seas) is available at EMEP.
For the service division on “Mediation of flows”, information is available at EU level as illustrated in Liquete et al. (2013) (13).
For the service division on “Maintenance of physical, chemical, biological conditions”, some indicators are available at national level from reporting requirements under the Habitat directive (e.g. “Maintaining nursery populations and habitats”), and are therefore available at national level, but not harmonized at EU level. Some others are resulting from modelling activities and are available within the JRC/EMIS datasets. “Chemical conditions of salt water” is bundled with indicators under the “Mediation of waste, toxic and other nuisances” division.
5.4.3 Cultural services
Only a few services under the “Physical and intellectual interactions with biota, ecosystems, and land-/seascapes [environmental settings]” division have available datasets or proxies harmonized at EU level. Most datasets would only be available at local sites, and would not be harmonized even at MS level, thus requiring extensive work to extrapolate the datasets in a form relevant for mapping at the national level).
For the “Spiritual, symbolic and other interactions with biota, ecosystems, and land-/seascapes [environmental settings]” the outlook for available indicators is quite similar.
28 http://ies.jrc.ec.europa.eu/our-activities/scientific-achievements/the-fate.html

Mapping and Assessment of Ecosystems and their Services
56 | P a g e
Table 12. Indicators for ecosystem services delivered by marine ecosystems.
Division Group Class Marine inlets and transitional waters
Coastal waters
Shelf waters Open Ocean
Nutrition Biomass Cultivated cropsReared animals and their outputsWild plants, algae and their outputs ● Harvest (ton/a) Wild animals and their outputs ● Landings (ton) ● Landings (ton) ● CPUE (ton) Plants and algae from in-situ aquaculture ● Harvest (ton/a) Animals from in-situ aquaculture ● Harvest (ton/a)
Water Surface water for drinkingGround water for drinking
Materials Biomass Fibres and other materials from plants, algae and animals for direct use or processing
● Harvest (ton/a) ● Landings (ton) ● Harvest (ton/a)
Materials from plants, algae and animals for agricultural use ● Landings (ton) ● Harvest (ton/a) Genetic materials from all biota ● Patents (no.) ● Published articles (no.)
Water Surface water for non-drinking purposesGround water for non-drinking purposes
Energy Biomass-based energy sources
Plant-based resources Animal-based resources
Mechanical energy
Animal-based energy
Mediation of waste, toxics and other nuisances
Mediation by biota
Bio-remediation by micro-organisms, algae, plants, and animals
● Nutrient load to coast (ton/a) ● HM and POP deposition (ton/a) ● Oxyrisk
● HM and POP deposition (ton/a) ● Oxyrisk Filtration/sequestration/storage/accumulation by micro-
organisms, algae, plants, and animals Mediation by ecosystems
Filtration/sequestration/storage/accumulation by ecosystemsDilution by atmosphere, freshwater and marine ecosystems Mediation of smell/noise/visual impacts
Mediation of flows Mass flows Mass stabilisation and control of erosion rates ● Composite indices based on extent of selected emerged, submerged and intertidal habitats, coastline slope and coastal geomorphology, wave regime, tidal range, relative sea level, storm surge
Buffering and attenuation of mass flows
Liquid flows Hydrological cycle and water flow maintenanceFlood protection See buffering and attenuation of
mass flows Gaseous / air flows
Storm protectionVentilation and transpiration

Mapping and Assessment of Ecosystems and their Services
57 | P a g e
Division Group Class Marine inlets and transitional waters
Coastal waters
Shelf waters Open Ocean
Maintenance of physical, chemical, biological conditions
Lifecycle maintenance, habitat and gene pool protection
Pollination and seed dispersal Maintaining nursery populations and habitats ● Submerged and intertidal
habitats diversity (no.) ● Oxygen concentration (%) ● Turbidity (%) ● Species distribution (km2/ha) ● Abundance and richness - at age (ton/a) ● Extent of marine protected areas (km2/ha) ●Nursery areas (km2/ha)
● Oxygen concentration (%) ● Turbidity (%) ● Species distribution (km2/ha) ● Abundance and richness - at age (ton/a) ● Extent of marine protected areas (km2/ha) ●Nursery areas (km2/ha)
Pest and disease control
Pest control ● Presence (no.) and ● Distribution (km2) of alien species Disease control
Soil formation and composition
Weathering processesDecomposition and fixing processes ● Nitrogen removal (%) ● Water residence time (months) ●
Depth/water residence time (m/year)
Water conditions
Chemical condition of freshwatersChemical condition of salt waters ● Nutrient load to coast (ton/yr) ● HM and POP loading (ton/yr)
● Oxyrisk Atmospheric composition and climate regulation
Global climate regulation by reduction of greenhouse gas concentrations
● C stock (tonC) ● C sequestration (tonC/a) ● pH ● blue C (tonC) ● PP(ton C/year)
Micro and regional climate regulation
Physical and intellectual interactions with biota, ecosystems, and land-/seascapes [environmental settings]
Physical and experiential interactions
Experiential use of plants, animals and land-/seascapes in different environmental settings
● Extent of marine protected areas (km2/ha) ● Presence of iconic/endangered species (no.) ● In-water activities occurrence (no.) ● Recreation trips (no./year)
● Extent of marine protected areas (km2/ha) ● Presence of iconic/endangered species (no.)
Physical use of land-/seascapes in different environmental settings
Intellectual and representative interactions
Scientific ● Scientific studies (no.) ● Documentaries, educational publications (no.) ● Visits to scientific and artistic visits exhibits (no.) Educational
Heritage, cultural Entertainment ● Documentaries, educational publications (no.) ● Visits to scientific and artistic
visits exhibits (no.) AestheticSpiritual, symbolic and other interactions with
Spiritual and/or emblematic
Symbolic Sacred and/or religious

Mapping and Assessment of Ecosystems and their Services
58 | P a g e
Division Group Class Marine inlets and transitional waters
Coastal waters
Shelf waters Open Ocean
biota, ecosystems, and land-/seascapes [environmental settings]
Other cultural outputs
Existence ● Extent of marine protected areas (km2/ha) ● Presence of iconic/endangered species (no.) Bequest

Mapping and Assessment of Ecosystems and their Services
59 | P a g e
5.5 Lessons learned
5.5.1 Similarities and differences between the ecosystem pilots
Table 13 counts the number of indicators that the pilots delivered in the MAES summary tables on ecosystem services. Clearly, lots of indicators are available to use in the assessments. Table 13 reflects to some extent the state of knowledge on ecosystems. For forest services, 117 indicators are available, which reflects, in part, the importance of forests in delivering many services. The freshwater pilot collected 114 indicators but many indicators have double use as they are relevant to two or more of the ecosystem types rivers, lakes and wetlands so that the actual number of indicators decreases to 68. Similarly, croplands and grasslands share a number of common indicators. The marine pilot delivered 33 indicators for 4 ecosystem types.
A limited share of the indicators for ecosystem services received a green colour code, corresponding to indicators that are widely available and ready to use for reporting under Action 5 of the EU Biodiversity Strategy. Importantly, many indicators characterized as yellow or red are available but these indicators will require additional expertise before they can be used for mapping and assessment. Note also that several marine indicators received a green status, which will facilitate the inclusion of marine ecosystems in the assessments.
Table 13. Total number and break-down of ecosystem services indicators
Forests Agro-ecosystems (cropland and
grassland)
Freshwaterecosystems
(rivers, lakes, ground water, and
wetlands)
Marineecosystems
(Marine inlets and transitional waters,
coastal zones, shelf ecosystems,
and open ocean) Provisioning services
● 13 9 6 0● 18 8 12 3● 7 3 8 0● 0 0 0 2
Regulation and maintenance services
● 5 8 5 13● 15 14 22 1● 30 6 7 4● 13 0 11 3
Cultural services ● 0 1 3 1● 6 12 12 1● 10 6 22 0● 0 0 2 5
Total number of indicators 117 67 110 33
Share of green indicators ● 15% 27% 13% 42%

Mapping and Assessment of Ecosystems and their Services
60 | P a g e
5.5.2 The use of the MAES typology as classification of ecosystems
The first MAES paper (1) introduced a typology of ecosystems, which was the basis on which the thematic pilots have been selected. Each pilot commented on the applicability of this typology for the specific purpose of this study:
• For forests, the typology worked well and no problems were encountered. It is still important to note that the forest ecosystem is defined according to FAO, UNECE and Eurostat definitions. This definition is therefore not necessarily consistent with the spatial information on forests in the CLC dataset or in other land cover data sets. Consequently, there is not a one-to-one link between the CLC classes (particularly Other Wooded Land) and the forest ecosystem. In addition to CLC other sources would be required for a proper inclusion of forest ecosystems in an assessment.
• In agricultural assessment the typologies are usually: arable, permanent crops, and grassland. In MAES arable land and permanent crops are grouped in one agro-ecosystem. An advantage of this choice is that it reduces the complexity of mapping ecosystem services delivered by permanent crops separately. However, this category has its own characteristics that are different from those of a ploughed field and grasslands, which would justify a separate assessment.
• For freshwater ecosystems, several issues are reported. Mapping freshwater ecosystems and defining their boundaries remains challenging. Before assessing ecosystem services, it should be feasible to map the ecosystems, which in some cases is not advanced enough to support the development of specific indicators, and in any case depends on the scale of the study (regional/local) and the availability of data. For example, the delineation of floodplains or riparian areas requires additional work and is hampered by data availability. Enhancing the mapping of these specific ecosystems is needed as a first step to understand their role and services. None of the pilots actually tested the mapping as such to it can be expected that mapping will reveal additional practical problems that need to be addressed later.
• The marine pilot confirmed earlier observations that the MAES typology has some weaknesses, which need further discussion. Contributions could possibly come from the experience of MS, as they will progress with the national mapping and assessment of marine ecosystems and services. At the EU level, the EEA (with its ETC/ICM) is planning to further test this initial proposal as well.
5.5.3 The use of CICES as classification for ecosystem services
The ecosystem pilots have for the first time tested the CICES classification to collect EU-wide and national indicators to map and assess ecosystem services. Here we list the most important conclusions with respect to the use of the CICES classification for a practically designed assessment of ecosystem services:
• The hierarchical structure of CICES is very useful to bundle services at class level on condition that indicators at higher level are available. The hierarchical structure proved to be very useful for, in particular, the marine ecosystems, which typically lag behind terrestrial and freshwater systems in terms of data coverage. Indicators for marine ecosystem services are mostly available at group level. Also for the other pilots, several indicators are available at division or group level. The hierarchical structure of CICES allows better reuse of indicators that are developed under other frameworks or reporting streams. In other words, CICES enables operationalization of ecosystem services and facilitates mainstreaming to other policies.

Mapping and Assessment of Ecosystems and their Services
61 | P a g e
• The hierarchical structure of CICES facilitates comparisons of assessments of ecosystem services across ecosystems and between the different Member States and at different scales. In this context, it is important that Belgium developed an expanded CICES classification at lower levels while ensuring comparability at higher level (14). At lower level, the Belgian CICES suits specific national ecosystem(s) better and is therefore more meaningful for the country but still allows for coherent reporting to the EU29.
• Applying the CICES classification for marine or freshwater ecosystems is less evident. Many classes are not relevant while some classes lead to difficulties in proper interpretation. For freshwater ecosystems conceptual difficulties can be encountered when assessing regulation/maintenance services because of the nature of the water cycle, which underpins almost all regulation services (in all ecosystems), and the lack of knowledge/data for distinguishing between the role of biota and ecosystem in the mediation of waste. In general, interpretations of the classes differ if terrestrial, freshwater or marine systems are considered. Importantly, at several entry points in CICES, users referred to other ecosystems as providers of the service. This shows the importance of developing an integrated approach across connected ecosystems.
• There remain conceptual difficulties with ecosystem services delivered by agriculture. Listing explicitly “cultivated crops” and “reared animals and their products” as ecosystem services brings to double counting according to the SEEA-EEA classification under development (even though the latter is based on CICES). Furthermore, proposed indicators do not discriminate between the share of the contribution to provisioning services supplied by agro-ecosystems and the role of human energy inputs in contributing to total yield.
• how to deal with imported feedstuff and inputs that lead to the final ecosystem service (crop production, reared animals) is not yet clear
• Some users encountered difficulties in distinguishing between the supply and the demand of ecosystem services when reporting indicators under the CICES frame. The concept of ecosystem services exactly bridges the interface between supply and demand. Furthermore, demand for regulating ecosystem services is often difficult to conceptualize. Therefore, it would be useful to develop classifications for both ecosystem functions (which underpin ecosystem services) and for ecosystem benefits or beneficiaries. Such classifications would further allow reusing many more indicators, which are collected at EU or MS level for mapping and assessment of ecosystem services.
• CICES contains some groups that pose problems to users, in particular “water conditions” and “mediation by biota”. Under the MAES framework, condition is referred to as a state of the ecosystem while bio-remediation was interpreted by several as a technique to solve a pollution problem. Mediation by ecosystems seems better accepted as ecosystem service and all pilot contributors have put their indicators under this class.
29 The CICES classification also links to other classification systems such as the MA, TEEB or UK-NEA classifications. A CICES translator is available here: http://openness.hugin.com/example/cices

Mapping and Assessment of Ecosystems and their Services
62 | P a g e
5.6 Key recommendations based on the ecosystem pilots Based on the experiences of the different pilots and making use of the information that is presented in the MAES summary tables, some key recommendations for a cost-effective national assessment of ecosystem services are drawn:
• Go green! Green ecosystem services indicators are available off-the-shelf at national or EU scale. They are collected by different organisations in Member States to report on various EU and national policies. Indicators for ecosystem services delivered by agro-ecosystems are to a wide extent covered by data sets and monitoring schemes that report under the Common Agriculture Policy. Indicators for forest services, depend to a large extent on national forest inventories. Indicators for water are available in national statistical offices or depend on data collected under the Water Framework and Floods directives. Green indicators are available for immediate application (see Table 14)
• Prioritize! Whereas most ecosystem services are delivered by many ecosystems, particular ecosystems clearly produce more of certain services than other ecosystems. This knowledge helps prioritize mapping and assessment efforts of Member States (see Table 14). In addition, certain ecosystem services, but in particular most cultural ecosystem services, are shared by many ecosystems. It avoids double work when mapping and assessment of these services is done in a single, horizontal way across all ecosystems.
• Avoid double counting! Don’t use the same indicator more than once as a proxy for an ecosystem service. Rather use the hierarchical structure of CICES to aggregate ecosystem services to a higher level for which suitable indicators may be available.
Table 14 provides a summary of green and yellow indicators based on the information provided by MAES summary tables of the 4 pilot ecosystems. Where relevant, it assigns to each ecosystem service a leading ecosystem i.e. an ecosystem, which is a major provider of a particular ecosystem service. For example, forests are principal providers of wild food products, biomass for materials and energy, or climate regulation. Equally, agro-ecosystems provide food and biomass and several regulating services that are connected to food production. Freshwater systems are crucially important in all water services. Marine ecosystems are considered separately. Mapping and assessing ecosystem services using the indicators listed in Table 14 would result in a first, inclusive ecosystem assessment at MS scale. In depth assessments per ecosystem type, however, require a more detailed approach and the use of indicators listed in the ecosystem specific MAES cards and summary tables.
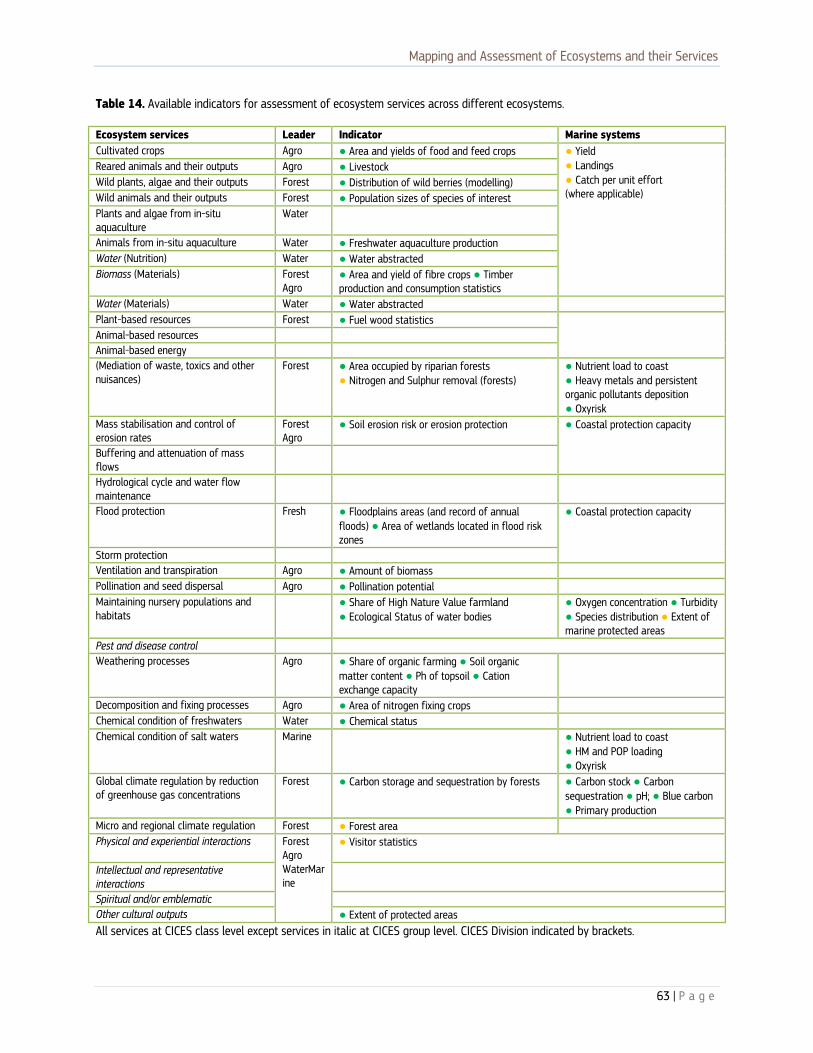
Mapping and Assessment of Ecosystems and their Services
63 | P a g e
Table 14. Available indicators for assessment of ecosystem services across different ecosystems.
Ecosystem services Leader Indicator Marine systems Cultivated crops Agro ● Area and yields of food and feed crops ● Yield
● Landings ● Catch per unit effort (where applicable)
Reared animals and their outputs Agro ● Livestock Wild plants, algae and their outputs Forest ● Distribution of wild berries (modelling) Wild animals and their outputs Forest ● Population sizes of species of interest Plants and algae from in-situ aquaculture
Water
Animals from in-situ aquaculture Water ● Freshwater aquaculture production Water (Nutrition) Water ● Water abstracted Biomass (Materials) Forest
Agro ● Area and yield of fibre crops ● Timber production and consumption statistics
Water (Materials) Water ● Water abstracted Plant-based resources Forest ● Fuel wood statistics Animal-based resources Animal-based energy (Mediation of waste, toxics and other nuisances)
Forest ● Area occupied by riparian forests ● Nitrogen and Sulphur removal (forests)
● Nutrient load to coast ● Heavy metals and persistent organic pollutants deposition ● Oxyrisk
Mass stabilisation and control of erosion rates
Forest Agro
● Soil erosion risk or erosion protection ● Coastal protection capacity
Buffering and attenuation of mass flows
Hydrological cycle and water flow maintenance
Flood protection Fresh ● Floodplains areas (and record of annual floods) ● Area of wetlands located in flood risk zones
● Coastal protection capacity
Storm protection Ventilation and transpiration Agro ● Amount of biomass Pollination and seed dispersal Agro ● Pollination potential Maintaining nursery populations and habitats
● Share of High Nature Value farmland ● Ecological Status of water bodies
● Oxygen concentration ● Turbidity ● Species distribution ● Extent of marine protected areas
Pest and disease control Weathering processes Agro ● Share of organic farming ● Soil organic
matter content ● Ph of topsoil ● Cation exchange capacity
Decomposition and fixing processes Agro ● Area of nitrogen fixing crops Chemical condition of freshwaters Water ● Chemical status Chemical condition of salt waters Marine ● Nutrient load to coast
● HM and POP loading ● Oxyrisk
Global climate regulation by reduction of greenhouse gas concentrations
Forest ● Carbon storage and sequestration by forests ● Carbon stock ● Carbon sequestration ● pH; ● Blue carbon ● Primary production
Micro and regional climate regulation Forest ● Forest area Physical and experiential interactions Forest
Agro WaterMarine
● Visitor statistics
Intellectual and representative interactions
Spiritual and/or emblematic Other cultural outputs ● Extent of protected areas All services at CICES class level except services in italic at CICES group level. CICES Division indicated by brackets.

Mapping and Assessment of Ecosystems and their Services
64 | P a g e
6 NATURAL CAPITAL ACCOUNTING
The development of a methodological approach for Natural Capital Accounting (NCA) is the focus of pilot study 6 under the MAES process (see section 2.2). The objective of this pilot study is to address the second part under Target 2, Action 5 of the EU Biodiversity Strategy to 2020 (see underlined text):
“Member States, with the assistance of the Commission, will map and assess the state of ecosystems and their services in their national territory by 2014, assess the economic value of such services, and promote the integration of these values into accounting and reporting systems at EU and national level by 2020”.
While 2020 is still some time away the conceptual and operational foundations have to be laid now for the above targets to be achievable. This requires a step-by-step approach, which needs to begin with defining key concepts and the building of the bio-physical foundation for subsequent valuation steps. Work under the NCA pilot therefore focused on defining the concept of ‘natural capital’ as well as describing and developing suitable accounting approaches with regard to the state of ecosystems and their services.
In the context of the EU 2020 Biodiversity Strategy the pilot study on Natural Capital Accounting focuses on the ecosystem component of natural capital rather than on geo-physical assets. This provides a direct link to the mapping and assessment of the state of ecosystems and their services. Data compiled under this process will be an important input to the further development of ecosystem (capital) accounts; on the other hand accounting approaches can provide a very useful framework for structuring ecosystem-related data and integrated analysis (see chapter 2 for the importance of a coherent approach across ecosystems) .
Accounting systems only function if they build on clearly categorised, well-structured and comprehensive input data sets. The interest in ecosystem accounting has therefore driven the development of CICES, the ‘Common International Classification of Ecosystem Services’ (see www.cices.eu), which is the approach recommended under MAES for classifying ecosystem services and discussed in section 5.5.2. Other aspects of data that are important for their analytical value are sufficiently detailed spatial referencing and comparability across space and time. Ensuring these two dimensions is a challenging task for ecosystem-related data sets. The reference document on natural capital accounting (currently under consultation) provides information on key methodological considerations in this regard, building inter alia on experience in developing simplified ecosystem capital accounts at EEA.
If set up correctly, ecosystem capital accounting also provides a useful unifying frame for tackling integrated analytical questions. For example, water accounts, carbon accounts and land accounts, and the underlying data, provide relevant information for key pressures on ecosystems and biodiversity, such as fragmentation and degradation. Similarly, the interface between water and land accounts, as well as the use of indicators on accessible water, can help identify areas or ecosystems at risk of water stress. Linked with other accounts or data sets such a system can help to analyse which are the most important pressures (linked to sectoral drivers) that influence state and trends in ecosystem condition.
With appropriate scientific and methodological guidance, data gathered to compose different kind of accounts included in ecosystem capital accounting can support biodiversity policies by collecting information on the pressures on ecosystems. This can help inform policies to reduce pressures, help biodiversity proofing policies and programmes and facilitate the integration of biodiversity into other policies (e.g. agriculture or cohesion policy).

Mapping and Assessment of Ecosystems and their Services
65 | P a g e
Finally, it should be noted that ecosystems provide benefits to people, society and the economy through the provision of ecosystem services – hence the use of the natural capital concept. However, nature also has an intrinsic value beyond its utility to mankind. Both types of values are important to be recognised and reflected in decision making. The wider values of nature were recognised in the recent Rio+20 outcome document, which reaffirms “the intrinsic value of biological diversity, as well as the ecological, genetic, social, economic, scientific, educational, cultural, recreational and aesthetic values of biological diversity and its critical role in maintaining ecosystems that provide essential services, which are critical foundations for sustainable development and human well-being” (para 197 UNCSD 2012).
This means our relationship with nature and its role in decision-making processes should not be reduced to the economic and other benefits it provides. An ethical concern for the value of nature in its own right needs to continue to inform public and private decision-making.
Further information on the pilot study on Natural Capital Accounting, the first draft reference document and the presentations and outcome of a workshop on NCA in June 2013 is available under: http://biodiversity.europa.eu/ecosystem-assessments/events-1/eureca-meetings/natural-capital-accounting-2013/

Mapping and Assessment of Ecosystems and their Services
66 | P a g e
7 TOWARDS INTEGRATED MAPPING AND ASSESSMENT
7.1 Linking biodiversity and ecosystem condition to human well-being One of the essential objectives of Action 5 and of the MAES conceptual framework is to support an analysis that looks at the benefits of preserving biodiversity and maintaining or bringing ecosystems into a healthy condition for human well-being. Target 2 of the EU biodiversity strategy to 2020 is indeed built on the premise that healthy ecosystems, rich in biodiversity, deliver more and multiple ecosystem services than ecosystems, which are degraded or exploited for maximizing the delivery of single or few services. Whereas this paper cannot dwell on the exact nature of the relationships between biodiversity, ecosystem condition and ecosystem services (see Table 15), it does develop part of the evidence base that can be used to help provide such an in-depth assessment. In particular, it explains how to demonstrate the diversity of ecosystem condition and ecosystem services across a large range of environmental conditions (15).
A very practical example to perform an assessment of biodiversity and ecosystem services at national scale is available for Spain30 (6). This document can be used as a state of the art example on how information, which is provided in this report, can be brought together in a single national ecosystem assessment, which unravels the links between biodiversity, ecosystem services and human well-being.
The FP7 project BESAFE, funded by DG RTD is currently finalizing a systematic review of the relationship between biodiversity, ecosystem services and value. These results will become available to the working group during 2014.
Under the new Horizon 2020 program the Commission will fund dedicated research work on the relationship between biodiversity and ecosystem services.
30 http://www.plosone.org/article/info%3Adoi%2F10.1371%2Fjournal.pone.0073249

Mapping and Assessment of Ecosystems and their Services
67 | P a g e
Table 15. Examples of positive interactions between biodiversity (mostly based on species richness) and ecosystem services. Numbers between brackets correspond to citations.
Section Division Group Provisioning Nutrition Biomass
WaterMaterials Biomass Aboveground plant biomass production in grasslands
increases with plant species richness (16) Water
Energy Biomass-based energy sources
In Sweden, biomass production in forests increased with increasing tree species richness (17)
Mechanical energy Regulation & Maintenance
Mediation of waste, toxics and other nuisances
Mediation by biotaMediation by ecosystems
Biodiversity improves water quality through niche portioning (18)
Mediation of flows Mass flows Plant diversity is found to have a negative, though non-significant, correlation with soil erosion (19)
Liquid flowsGaseous / air flows
Maintenance of physical, chemical, biological conditions
Lifecycle maintenance, habitat and gene pool protection
Wild pollinators enhance fruit set of crops (20)Increasing crop genetic diversity has shown to be useful in pest and disease management, and has the potential to enhance pollination services and soil processes (21)
Pest and disease control
Herbivore suppression, enemy enhancement, and crop damage suppression effects are significantly stronger on diversified crops than on crops with none or fewer associated plant species (22)
Soil formation And composition
High-diversity mixtures of perennial grassland plant species stored 500% and 600% more soil C and N than, on average, do monoculture plots of the same species (23).
Water conditions Marine biodiversity loss is increasingly impairing the ocean's capacity to provide food, maintain water quality, and recover from perturbations (24)
Atmospheric composition and climate regulation
Species loss ranks among the major drivers of primary production and decomposition—key processes involved in the carbon cycle (25)
Cultural Physical and intellectual interactions with biota, ecosystems, and land-/seascapes [environmental settings]
Physical and experiential interactions
As biodiversity increases, berry and game production increase (17)
Intellectual and representative interactions
Spiritual, symbolic and other interactions with biota, ecosystems, and land-/seascapes [environmental settings]
Spiritual and/or emblematic Other cultural outputs
Mapping and Assessment of Ecosystems and their Services
68 | P a g e
7.2 A tiered approach to mapping and assessing ecosystem services An analysis of the MESEU project country cases31 and the information provided in this paper suggests the following tiered process in order to make ecosystem services maps comparable across Europe and to support the Member States in mapping ecosystem services. The level of detail of input data and the complexity of the analysis increase from Tier 1 to Tier 3 as illustrated here (see Figure 4) for the production of wild berries in forests, an important provisioning service, which has also relevance as cultural service. The mapping work as such requires expertise in GIS. The choice for an approach depends on available data and resources.
7.2.1 Tier 1 – Ecosystem service mapping using available indicators
The simplest form of an ecosystem services assessment uses data available for most of the European countries (for example CORINE). Most indicators can directly be derived from land use and land-cover data, biodiversity monitoring maps, national forest inventories, etc. and thus represent proxies for a certain ecosystem service. Many indicators in the MAES summary tables are area-based indicators or are spatially-explicit and can thus be used for direct mapping.
7.2.2 Tier 2 – Ecosystem services mapping linking different indicators with land use data
The Tier 1 approach can be further improved if data at MS or EU level are used as a base to derive more complex indicators, which are combined to estimate ecosystem services. Land use data is linked to different datasets according to known relationships between land use and ecosystem services provision and supplemented with local/regional/national data. Based on these relationships, the capacities of different land use to provide ecosystem services can be quantified at different locations and aggregated at different scales. For example, in order to estimate wild berry production, literature data or expert based scores on berry production can be linked to different forest types and mapped at the country scale (up-scaling). Likewise, national production of consumption statistics of wild berries, if available, can be downscaled using the area of different forest types as a spatial surrogate to obtain a map of wild berry production. Many of the indicators reported in the MAES summary cards can in this way be combined with the maps of ecosystems to obtain an up-scaled or down-scaled map of a certain ecosystem services. This procedure requires basic GIS skills (cf. QuickScan)32.
7.2.3 Tier 3 - Model-based approaches to map ecosystem services
The Tier 2 approach can be further refined by modelling biophysical processes in a GIS or in other software instead of linking indicator data through simple relationships. For example, berry production may be assessed by modelling the spatial distribution of wild berry species using climate data as well as other environmental data relevant to the distribution of plant species. In a second step, process based data can be used to assess annual production and in combination with forest types, the result is a spatially resolved model on wild berry production. Constructing a model is time consuming and requires expert knowledge on modelling. Adjusting an existing model to local conditions on the other hand is much easier. Models can be extended by integrating expert knowledge (for example using Bayesian networks), and can be used to assess uncertainty in quantification and valuation. Several tools for tier 3 based mapping and assessment of ecosystem services are available and can be downloaded or consulted free of cost (e.g InVEST, or ARIES).
31 The tiered mapping approach is proposed by Adrienne Grêt-Regamey, Bettina Weibel and Sven-Erik Rabe (Planning of Landscape and Urban Systems, ETH Zürich). 32 http://www.wageningenur.nl/en/project/Interactive-tools-Quick-scan-in-INVALUABLEproject.htm

Mapping and Assessment of Ecosystems and their Services
69 | P a g e
Figure 4. Tiered approach to mapping ecosystem services (An example for wild berry production).
Tier 1
Tier 3
Tier 2

Mapping and Assessment of Ecosystems and their Services
70 | P a g e
Box 3. Regression modelling and prediction of bilberry cover based on NFI data on bilberry cover and on explanatory variables on climate and forest conditions.
Sweden develops a set of regression models to map ecosystem services. One example is bilberry cover, which is recorded on the field plots of the National Forest Inventory. These field data were modelled as a function of nationally mapped variables on topography, soil moisture, climate and forest conditions, which have been estimated using modelling or remote sensing. Subsequently, the model was applied to predict the national spatial distribution of bilberry. In a second step, process based data can be used to assess annual production and in combination with forest types. The result is a spatially resolved model on wild berry production.
Snäll T, Bengtsson J, Moen J, Berglund H & Östergård H. Hotspots and coldspots of mapped ecosystem services. In preparation.
7.3 The Ecosystem Services Partnership Visualization tool: an interactive knowledge platform for ecosystem service maps
Assessing, quantifying, mapping and modelling ecosystem services is becoming more and more urgent due to their recognition as essential for population maintenance both by the scientific community and the policy makers not only at EU level, but also globally. As described above, there is a great variety in methods and models used to map and quantify ecosystem services, classification systems and terminologies (26, 27). Within the Member States ecosystem services indicators and mapping methods used might vary, however, a consistency in them allows for comparability of the outputs (see §7.2). Given this, the mapping and modelling thematic working groups (TWG) of the Ecosystem Services Partnership (ESP) have jointly developed a blueprint for mapping ecosystem services (Crossman et al., 2013). The blueprint systematically organizes all types of information that need to be taken into account for ecosystem services mapping and modelling, serving both as a checklist and as a structure to be followed for putting all the available information together. Using this structure and with the support of the Joint Research Centre of the European Commission (EC-JRC) the ESP is developing a web platform that gathers maps and information on ecosystem service assessments, organizes it in a systematic way and makes it available for data sharing among ES practitioners. This system is currently available under esp-mapping.net (Figure 5).

Mapping and Assessment of Ecosystems and their Services
71 | P a g e
Figure 5. The Ecosystem Services Partnership Visualization tool homepage.
The goal of this system is to serve as a repository for maps of ecosystem services, go beyond simple visualization, provide metadata for the available maps and give users the option to download this information. The tool also allows the users to upload ecosystem service maps, making them available for sharing and allowing for an open dialogue within the ecosystem services community. Specifically, the tool’s consists of:
• An ecosystem services map documentation database. The database consists of multiple attributes –following the blueprint structure (28) - interlinked with many-to-many relationships. The records of the database are published online either by the system administrators or registered users.
• A map viewer. The users can query the database and view the returned results given that the tool allows for: a) Querying the database, b) Map visualization, navigation and download and c) Map and data upload. For each of the uploaded maps the users also declare the level of completion of each map, allowing other users to comment on the existing data and thus promoting an open dialogue among the ecosystem services practitioners. Users can also overlay ecosystem services maps with some base layers like maps of ecosystems, ecoregions, protected areas or other types of layers. A detailed description of the already available background layers is provided in the tool technical guide (Drakou et al. under review).

Mapping and Assessment of Ecosystems and their Services
72 | P a g e
8 CONCLUSIONS AND NEXT STEPS
The work undertaken by the MAES Pilots in 2013 shows that there is a big potential for using data that already exist and combining these data into a coherent and integrated ecosystem assessment. This report presents an extensive list of indicators, which can be used, together with a typology and map of ecosystems, to make a first assessment of ecosystem condition and ecosystem services. The pilot studies have shown that several policies including agriculture, water, marine, forest and nature policies, already contribute data and indicators for ecosystem assessments under Action 5. This would thus facilitate the mainstreaming of biodiversity and ecosystem services, which is embedded in EU 2020 Biodiversity Strategy.
At the same time, the MAES pilot studies highlighted several issues that remain to be resolved in the future. Arguably, this report is the best possible compromise between providing working guidance to the Member States to deliver under Action 5 and a finished guidance document that includes detailed instructions to map and assess all MAES ecosystem types and their services at CICES class level.
Clearly, the activities around Action 5 will require continuous improvement on the road towards 2020:
• In general, the link between science and policy should be strengthened and more support provided to policy-relevant research.
• Data sharing capabilities need to be enhanced in Europe and in particular, data coming from long-term ecological research sites (cf. LTER) and research.
• The links between biodiversity and the delivery of ecosystem services warrant further research and evidence gathering. Whereas to some extent, there remains scientific uncertainty about the exact relationships between biodiversity, ecosystem functioning and ecosystem services, a better availability and usability of biodiversity datasets will provide new insights and will boost the mapping and assessment of ecosystem services, in particular of cultural services that are strongly connected to biodiversity (bird watching, mapping of emblematic species).
• Continuous efforts should go as well to a better integration of Article 17 assessment data for the purposes of mapping and assessing ecosystems and their services. This activity will become even more important when the second round of assessments is finished and when these data will become available.
• Several conceptual issues remain unresolved and require dedicated action. Some important issues under discussion are the typology of marine and some freshwater ecosystems such as floodplains and the role of agro-ecosystems in delivering provisioning ecosystem services in relation to energy inputs that are required to harvest agricultural products.
• Further guidance is needed on upscaling or downscaling data and indicators for condition and services to the desired spatial unit of assessment or reporting.
• There is a need for capacity-building in all Member States in order to create a community of practice in Europe that will contribute to improve the knowledge and evidence for EU environment policy in line with

Mapping and Assessment of Ecosystems and their Services
73 | P a g e
Priority Objective 5 of the General Union Environment Action Programme to 2020 'living well, within the limits of our planet'.33
In response to these challenges, the EU is committed to provide tools that would facilitate the exchange of information and expertise across levels (cf. Ecosystem Services Platform). Information services such as the Biodiversity Information System for Europe (BISE), the Forest Information System for Europe (FISE), the Water Information System for Europe (WISE) and the European climate adaptation platform (CLIMATE-ADAPT) are being developed to facilitate the access and understanding of EU relevant environmental information to a wide public.
Importantly, the new research program Horizon 2020 will promote the open access to data initiative. The possibility for transferring policy-relevant data and metadata to the European Environmental Data Centres is being explored34. Dedicated research on biodiversity and ecosystem services is announced in the working program and specific support will go to enhancing the mapping of ecosystems and their services.
The MESEU project will continue delivering targeted guidance to Member States for mapping and assessment.
Finally, we encourage Member States and stakeholders to submit comments to this report in order to help the working group MAES in delivering better targeted and more complete guidance for mapping and assessment.
33 http://eur-lex.europa.eu/LexUriServ/LexUriServ.do?uri=OJ:L:2013:354:0171:0200:EN:PDF
34 http://www.spiral-project.eu/sites/default/files/The-SPIRAL-handbook-website.pdf

Mapping and Assessment of Ecosystems and their Services
74 | P a g e
REFERENCES
1. Maes J, et al. (2013) Mapping and Assessment of Ecosystems and their Services. An analytical framework for ecosystem assessments under action 5 of the EU biodiversity strategy to 2020. Publications office of the European Union, Luxembourg.
2. Bateman IJ, et al. (2013) Bringing Ecosystem Services into Economic Decision-Making: Land Use in the United Kingdom. Science 341(6141):45-50.
3. Bommarco R, Kleijn D, & Potts SG (2012) Ecological intensification: harnessing ecosystem services for food security. Trends in Ecology and Evolution.
4. Layke C, Mapendembe A, Brown C, Walpole M, & Winn J (2012) Indicators from the global and sub-global Millennium Ecosystem Assessments: An analysis and next steps. Ecological Indicators 17:77-87.
5. Gallaun H, et al. (2010) EU-wide maps of growing stock and above-ground biomass in forests based on remote sensing and field measurements. Forest Ecology and Management 260(3):252-261.
6. Haines-Young R & Potschin M (2013) CICES V4.3 - Report prepared following consultation on CICES Version 4, August-December 2012. EEA Framework Contract No EEA/IEA/09/003.
7. Veen P, Jefferson R, de Smidt J, & van der Straaten J (2009) Grasslands in Europe of high nature value (KNNV Publishing, Zeist, The Netherlands).
8. Santos-Martín F, et al. (2013) Unraveling the Relationships between Ecosystems and Human Wellbeing in Spain. PLoS ONE 8(9).
9. Zulian G, Maes J, & Paracchini M (2013) Linking Land Cover Data and Crop Yields for Mapping and Assessment of Pollination Services in Europe. Land 2(3):472-492.
10. Paracchini ML & Capitani C (2011) Implementation of a EU wide indicator for the rural-agrarian landscape. EUR 25114 EN, Luxembourg: Publications Office of the European Union, p. 89. Available at http://agrienv.jrc.ec.europa.eu/publications/pdfs/EUR_25114.pdf.
11. Wood SA, Guerry AD, Silver JM, & Lacayo M (2013) Using social media to quantify nature-based tourism and recreation. Sci. Rep. 3.
12. De Roo A, et al. (2012) A multi-criteria optimisation of scenarios for the protection of water resources in Europe, JRC Scientific and Policy Report, JRC75919. Publications Office of the European Union.
13. Liquete C, Maes J, La Notte A, & Bidoglio G (2011) Securing water as a resource for society: an ecosystem services perspective. Ecohydrology and Hydrobiology 11:247-259.
14. Turkelboom F, et al. (2013) CICES going local: Ecosystem services classification adapted for a highly populated country. In: Jacobs S., Dendoncker N. and Keune H. (Eds.), Ecosystem Services: Global Issues, Local Practices. New York: Elsevier.
15. Palmer MA & Febria CM (2012) Ecology: The heartbeat of ecosystems. Science 336(6087):1393-1394. 16. Cardinale BJ, et al. (2011) The functional role of producer diversity in ecosystems. American Journal of Botany
98(3):572-592. 17. Gamfeldt L, et al. (2013) Higher levels of multiple ecosystem services are found in forests with more tree
species. Nature Communications 4. 18. Cardinale BJ (2011) Biodiversity improves water quality through niche partitioning. Nature 472(7341):86-91. 19. Shrestha RP, Schmidt-Vogt D, & Gnanavelrajah N (2010) Relating plant diversity to biomass and soil erosion
in a cultivated landscape of the eastern seaboard region of Thailand. Applied Geography 30(4):606-617. 20. Garibaldi LA, et al. (2013) Wild pollinators enhance fruit set of crops regardless of honey bee abundance.
Science 340(6127):1608-1611. 21. Hajjar R, Jarvis DI, & Gemmill-Herren B (2008) The utility of crop genetic diversity in maintaining ecosystem
services. Agriculture, Ecosystems and Environment 123(4):261-270. 22. Letourneau DK, et al. (2011) Does plant diversity benefit agroecosystems? A synthetic review. Ecological
Applications 21(1):9-21.

Mapping and Assessment of Ecosystems and their Services
75 | P a g e
23. Fornara DA & Tilman D (2008) Plant functional composition influences rates of soil carbon and nitrogen accumulation. Journal of Ecology 96(2):314-322.
24. Worm B, et al. (2006) Impacts of Biodiversity Loss on Ocean Ecosystem Services. Science 314(5800):787-790.
25. Hooper DU, et al. (2012) A global synthesis reveals biodiversity loss as a major driver of ecosystem change. Nature 486(7401):105-108.
26. Hauck J, et al. (2013) "Maps have an air of authority": Potential benefits and challenges of ecosystem service maps at different levels of decision making. Ecosystem Services 4:25-32.
27. Wallace KJ (2007) Classification of ecosystem services: Problems and solutions. Biological Conservation 139(3-4):235-246.
28. Crossman ND, et al. (2013) A blueprint for mapping and modelling ecosystem services. Ecosystem Services 4(0):4-14.

Mapping and Assessment of Ecosystems and their Services
76 | P a g e
ABBREVIATIONS
AEI Agri-Environmental schemes ARIES Artificial intelligence for ecosystem services (a model for mapping) Art.17 Article 17 (assessments of habitats and species under the EU Habitats Directive)) BD Bird Directive BISE Biodiversity Information System for Europe CAP Common Agricultural Policy CBD Convention of Biological Diversity CCI Common Context Indicators (for agriculture policy) CFP Common Fishery Policy CGBN Co-ordination Group for Biodiversity and Nature CICES Common International Classification of Ecosystem Services CIF Common Implementation Framework of the biodiversity strategy CIRCABC Communication and Information Resource Centre for Administrations, Businesses and Citizens. CMEF Common Monitoring and Evaluation Framework for monitoring and evaluation of all rural development
interventions DG Directorate-General of the European Commission DG AGRI Directorate-General for Agriculture and Rural Development DG ENV Directorate-General for Environment DG REGIO Directorate-General for Regional and Urban Policy DG RTD Directorate-General for Research and Innovation DOPA Digital Observatory on Protected Areas DPSIR Drivers – Pressures – State – Impact - Response EC European Commission ECRINS European Catchments and Rivers Network System EDO European Draught Observatory EEA European Environment Agency EFAs Ecological Focus Areas EFDAC European Forest Data Centre EIONET European Environment Information and Observation Network ELO European Land Owners ES Ecosystem Service ESP Ecosystem Services Partnership ESTAT Eurostat, Statistical office of the European Union ETC/BD European Topic Centre on Biological Diversity ETC/ICM European Topic Centre on Inland, Coastal and Marine Waters ETC/SIA European Topic Centre Spatial Information and Analysis ETC European Topic Centre EU European Union EUNIS European Nature Information System FACE Federation of Associations for Hunting and Conservation of the European Union. FADN the Farm Accountancy Data Network (FADN), FAO Food and Agriculture Organisation of the United Nations FES Forest Ecosystem Services FSS Farm Structure Survey GES Good Environmental Status GHG Greenhouse Gas Emissions

Mapping and Assessment of Ecosystems and their Services
77 | P a g e
GIS Geographical Information System GMES Global Monitoring for Environmental Security Program, now called Copernicus GW Ground Water HD Habitats Directive HM Heavy Metals HNV High Nature Value farmland Horizon 2020
The EU Framework Programme for Research and Innovation
HRL High Resolution Layer IACS Integrated Administration and Control System ICES International Council for the Exploration of the Sea InVEST Integrated Valuation of Environmental Services and Tradeoffs IPBES Intergovernmental Science-Policy Platform on Biodiversity and Ecosystem Services IUCN International Union for Conservation of Nature JRC Joint Research Centre LC Corine Land Cover LPIS the Land Parcel Identification System LTER Long-term ecological research sites LUCAS Land cover/use statistics MA Millennium Ecosystem Assessment MAES Mapping and Assessment of Ecosystems and their Services MCPFE Ministerial Conference on the Protection of Forests in Europe MESEU Mapping of Ecosystems and their Services in the EU and its member states MODIS Moderate Resolution Imaging Spectroradiometer MS EU Member States MSFD Marine Strategy Framework Directive NEP Net ecological production NFI National Forest Inventory NGO Non-Governmental Organisation NPP Net Primary Production NUTS Nomenclature of territorial units for statistics POP Persistent Organic Pollutants SEBI Streamlining European Biodiversity Indicators SEEA System of Environmental Economic Accounts SFC Standing Forestry Committee SFM sustainable forest management TEEB The Economics of Ecosystems and Biodiversity UK-NEA National Ecosystem Assessment of the United Kingdom UN United Nations UNCLOS United Nations Convention on the Law of the Sea (UNCLOS) UNECE UNECE UNEP United Nations Environment Programme UUA Utilised Agricultural Area (UAA) defined as area used for farming WFD Water Framework Directive WISE Water Information System for Europe WWF World Wide Fund for Nature

Mapping and Assessment of Ecosystems and their Services
78 | P a g e
ANNEX 1: GLOSSARY OF TERMS Assessment: The analysis and review of information derived from research for the purpose of helping someone in a position of responsibility to evaluate possible actions or think about a problem. Assessment means assembling, summarising, organising, interpreting, and possibly reconciling pieces of existing knowledge and communicating them so that they are relevant and helpful to an intelligent but inexpert decision-maker (Parson, 1995).
Assets: Economic resources (TEEB, 2010).
Benefits: Positive change in wellbeing from the fulfilment of needs and wants (TEEB, 2010).
Biodiversity: The variability among living organisms from all sources, including inter alia terrestrial, marine, and other aquatic ecosystems and the ecological complexes of which they are part, this includes diversity within species, between species, and of ecosystems (cf. Article 2 of the Convention on Biological Diversity, 1992).
Biophysical structure: The architecture of an ecosystem as a result of the interaction between the abiotic, physical environment and the biotic communities, in particular vegetation.
Biophysical valuation: A method that derives values from measurements of the physical costs (e.g., surface requirements, labour, biophysical processes, material inputs).
Conservation status (of a natural habitat): The sum of the influences acting on a natural habitat and its typical species that may affect its long-term natural distribution, structure and functions as well as the long-term survival of its typical species (EEC, 1992).
Conservation status (of a species): The sum of the influences acting on the species concerned that may affect the long-term distribution and abundance of its populations (EEC, 1992).
Drivers of change: Any natural or human-induced factor that directly or indirectly causes a change in an ecosystem. A direct driver of change unequivocally influences ecosystem processes and can therefore be identified and measured to differing degrees of accuracy; an indirect driver of change operates by altering the level or rate of change of one or more direct drivers (MA, 2005).
Ecological value: Non-monetary assessment of ecosystem integrity, health, or resilience, all of which are important indicators to determine critical thresholds and minimum requirements for ecosystem service provision (TEEB, 2010).
Economic valuation: The process of expressing a value for a particular good or service in a certain context (e.g., of decision-making) in monetary terms (TEEB, 2010).
Ecosystem: A dynamic complex of plant, animal, and microorganism communities and their non-living environment interacting as a functional unit (MA, 2005). For practical purposes it is important to define the spatial dimensions of concern.
Ecosystem assessment: A social process through which the findings of science concerning the causes of ecosystem change, their consequences for human well-being, and management and policy options are brought to bear on the needs of decision-makers (UK NEA, 2011).
Ecosystem condition: The capacity of an ecosystem to yield services, relative to its potential capacity (MA, 2005). For the purpose of MAES, ecosystem condition is, however, usually used as a synonym for 'ecosystem state'.
Ecosystem degradation: A persistent reduction in the capacity to provide ecosystem services (MA, 2005).

Mapping and Assessment of Ecosystems and their Services
79 | P a g e
Ecosystem function: Subset of the interactions between biophysical structures, biodiversity and ecosystem processes that underpin the capacity of an ecosystem to provide ecosystem services (TEEB, 2010).
Ecosystem process: Any change or reaction, which occurs within ecosystems, physical, chemical or biological. Ecosystem processes include decomposition, production, nutrient cycling, and fluxes of nutrients and energy (MA, 2005).
Ecosystem service: The benefits that people obtain from ecosystems (MA, 2005). The direct and indirect contributions of ecosystems to human well-being (TEEB, 2010). The concept 'ecosystem goods and services' is synonymous with ecosystem services. The service flow in MAES conceptual framework refers to the actually used service.
Ecosystem state: The physical, chemical and biological condition of an ecosystem at a particular point in time which can also be referred to as its quality.
Ecosystem status: An ecosystem state defined among several well-defined categories including its legal status. It is usually measured against time and compared to an agreed target in EU environmental directives (e.g. Habitats Directive, Water Framework Directive, Marine Strategy Framework Directive), e.g. “conservation status”.
Energy inputs: Subsidies added to ecosystems such as fertilizers, fossil fuel, or labour that are required to turn ecosystem functions into ecosystem services and benefits.
Functional traits: A feature of an organism that has demonstrable links to the organism’s function.
Habitat: The physical location or type of environment in which an organism or biological population lives or occurs. Terrestrial or aquatic areas distinguished by geographic, abiotic and biotic features, whether entirely natural or semi-natural.
Human well-being: A context- and situation dependent state, comprising basic material for a good life, freedom and choice, health and bodily well-being, good social relations, security, peace of mind, and spiritual experience (MA, 2005).
Indicator: Observed value representative of a phenomenon to study. In general, indicators quantify information by aggregating different and multiple data. The resulting information is therefore synthesised.
Socio-economic system: Our society (which includes institutions that manage ecosystems, users that use their services and stakeholders that influence ecosystems)
Value: The contribution of an action or object to user-specified goals, objectives, or conditions (MA, 2005).
CBD, 1992.Convention on Biological Diversity. United Nations.
EEC, 1992. Council directive 92/43/EEC of 21 May 1992 on the conservation of natural habitats and of wild fauna and flora.
MA, 2005. Ecosystems and Human Wellbeing: Current State and Trends, Volume 1, Island Press, Washington D.C.
Parson, E.A., 1995. Integrated Assessment and Environmental Policy Making, in Pursuit of Usefulness, Energy Policy, 23(4/5), 463–476.
TEEB, 2010. The Economics of Ecosystems and Biodiversity: Ecological and economic foundation. Earthscan, Cambridge.
UK NEA, 2011. The UK National Ecosystem Assessment Technical Report. UNEP-WCMC, Cambridge

Mapping and Assessment of Ecosystems and their Services
80 | P a g e
Contributing authors:
Joachim Maes1*, Anne Teller2*, Markus Erhard3*, Patrick Murphy2, Maria Luisa Paracchini1, José I. Barredo1, Bruna Grizzetti1, Ana Cardoso1, Francesca Somma1, Jan-Erik Petersen3, Andrus Meiner3, Eva Royo Gelabert3, Nihat Zal3, Peter Kristensen3, Annemarie Bastrup-Birk3, Katarzyna Biala3, Carlos Romao3, Chiara Piroddi1, Benis Egoh1, Christel Fiorina4, Fernando Santos5, Vytautas Naruševičius6, Jan Verboven7, Henrique Pereira8, Jan Bengtsson9, Kremena Gocheva10, Cristina Marta-Pedroso11, Tord Snäll9, Christine Estreguil1, Jesus San Miguel1, Leon Braat12, Adrienne Grêt-Regamey13, Marta Perez-Soba12, Patrick Degeorges4, Guéhanne Beaufaron4, Ana Lillebø14, Dania Abdul Malak15, Camino Liquete16, Sophie Condé17, Jon Moen18, Hannah Östergård19, Bálint Czúcz20, Evangelia G. Drakou1, Grazia Zulian1, Carlo Lavalle1 1 European Commission – Joint Research Centre, Ispra, Italy
2 European Commission – DG Environment, Brussels, Belgium
3 European Environment Agency, Copenhagen, Denmark
4 Ministry of Ecology, Sustainable Development and Energy, Paris, France
5 Autonomous University of Madrid, Madrid, Spain
6 Environmental Protection Agency, Vilnius, Lithuania
7 VLM Regio West, Ghent, Belgium
8 German Centre for Integrative Biodiversity Research (iDiv) Halle-Jena-Leipzig
9 Swedish University of Agricultural Sciences, Uppsala, Sweden
10 Ministry of Environment and Water, Sofia, Bulgaria
11 Instituto Politécnico de Bragança, Portugal
12 Alterra, Wageningen, The Netherlands
13 Institut für Raum- und Landschaftsentwicklung, ETH Zürich, Switzerland
14 University of Aveiro, Portugal
15 ETC/SIA, European Topic Centre for Spatial Information and Analysis, Malaga, Spain
16 ETC/SIA, European Topic Centre for Spatial Information and Analysis, Luxembourg, Luxembourg
17 ETC/BD, European Topic Centre for Biodiversity, Paris, France
18 Umeå University, Umeå, Sweden
19 Swedish Environmental Protection Agency, Stockholm, Sweden
20 Hungarian Academy of Sciences, Institute of Ecology and Botany, Vácrátót, Hungary
Contacting authors: [email protected], [email protected], [email protected]
Cover photo taken by Maria Luisa Paracchini


KH-01-14-171-EN
-N