Embed Size (px)
Citation preview
UPM STRATEGYJussi Pesonen
President and CEO

UPM IN
TRANSFORMATION

| © UPM
0 %
20 %
40 %
60 %
80 %
100 %
Paper
Plywood
Raflatac
Sawmilling
UPM has implemented a major transformation
3
*) excluding special items for 2008, comparable figures for 2015
Sales
EBIT *)
ROE *)
Net debt
Market cap
EUR 9.5bnEUR 513m
3.5%
EUR 4.3bnEUR 4.7bn
2008vertically integrated
paper company
2015six separate businesses
Business portfolio
Increasing share of businesses withstrong long-term fundamentals forprofitability and growth
Sales
Business performance
Continuous improvement in financial,social and environmental performance
0 %
20 %
40 %
60 %
80 %
100 %
Paper ENA
Plywood
Energy
Paper Asia
Raflatac
Biorefining
Muut
Business model
Promotes value creation
EUR 10.1bnEUR 916m
9.5%
EUR 2.1bnEUR 9.2bn
Disciplined capital allocation
Driving value creation

Increase long-term shareholder value
BUSINESS PORTFOLIO
| © UPM
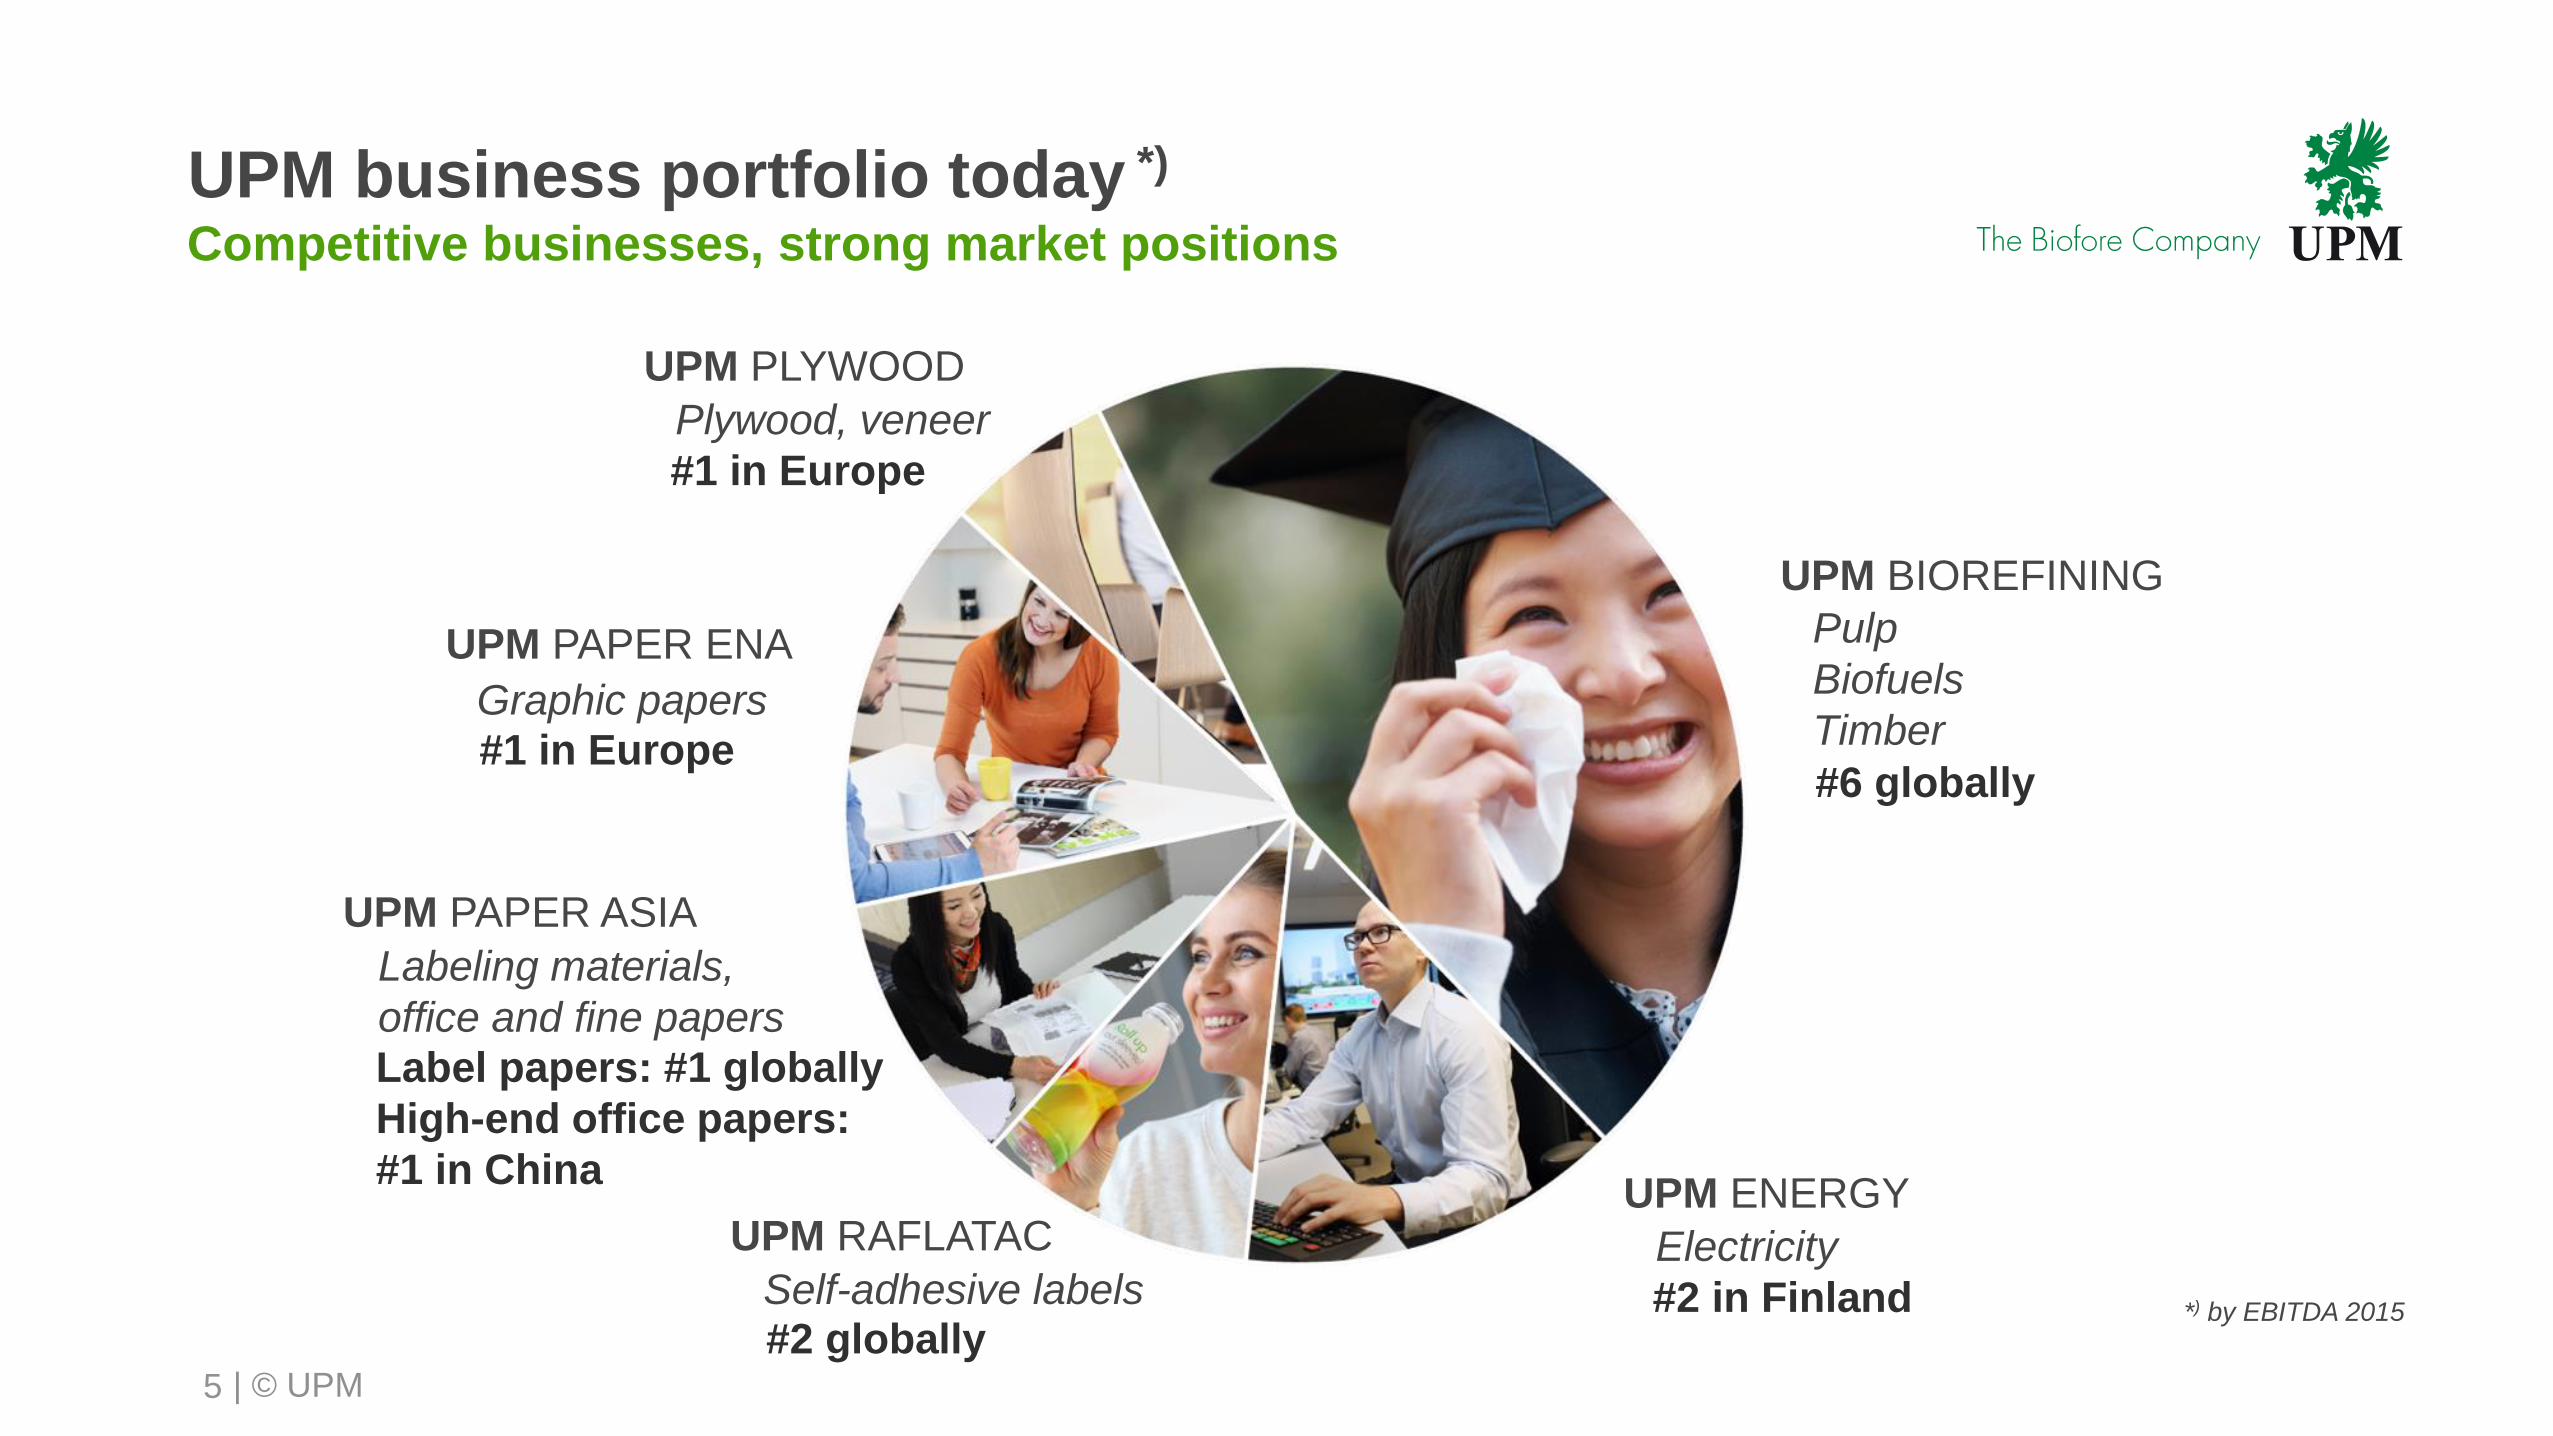
UPM business portfolio today *)
Competitive businesses, strong market positions
5
UPM ENERGY
UPM BIOREFINING
UPM RAFLATAC
UPM PAPER ASIA
UPM PAPER ENA
UPM PLYWOOD
Electricity
Pulp
Biofuels
TimberGraphic papers
Plywood, veneer
Labeling materials,
office and fine papers
Self-adhesive labels*) by EBITDA 2015 #2 in Finland
#6 globally#1 in Europe
#1 in Europe
Label papers: #1 globally
High-end office papers:
#1 in China
#2 globally
| © UPM6
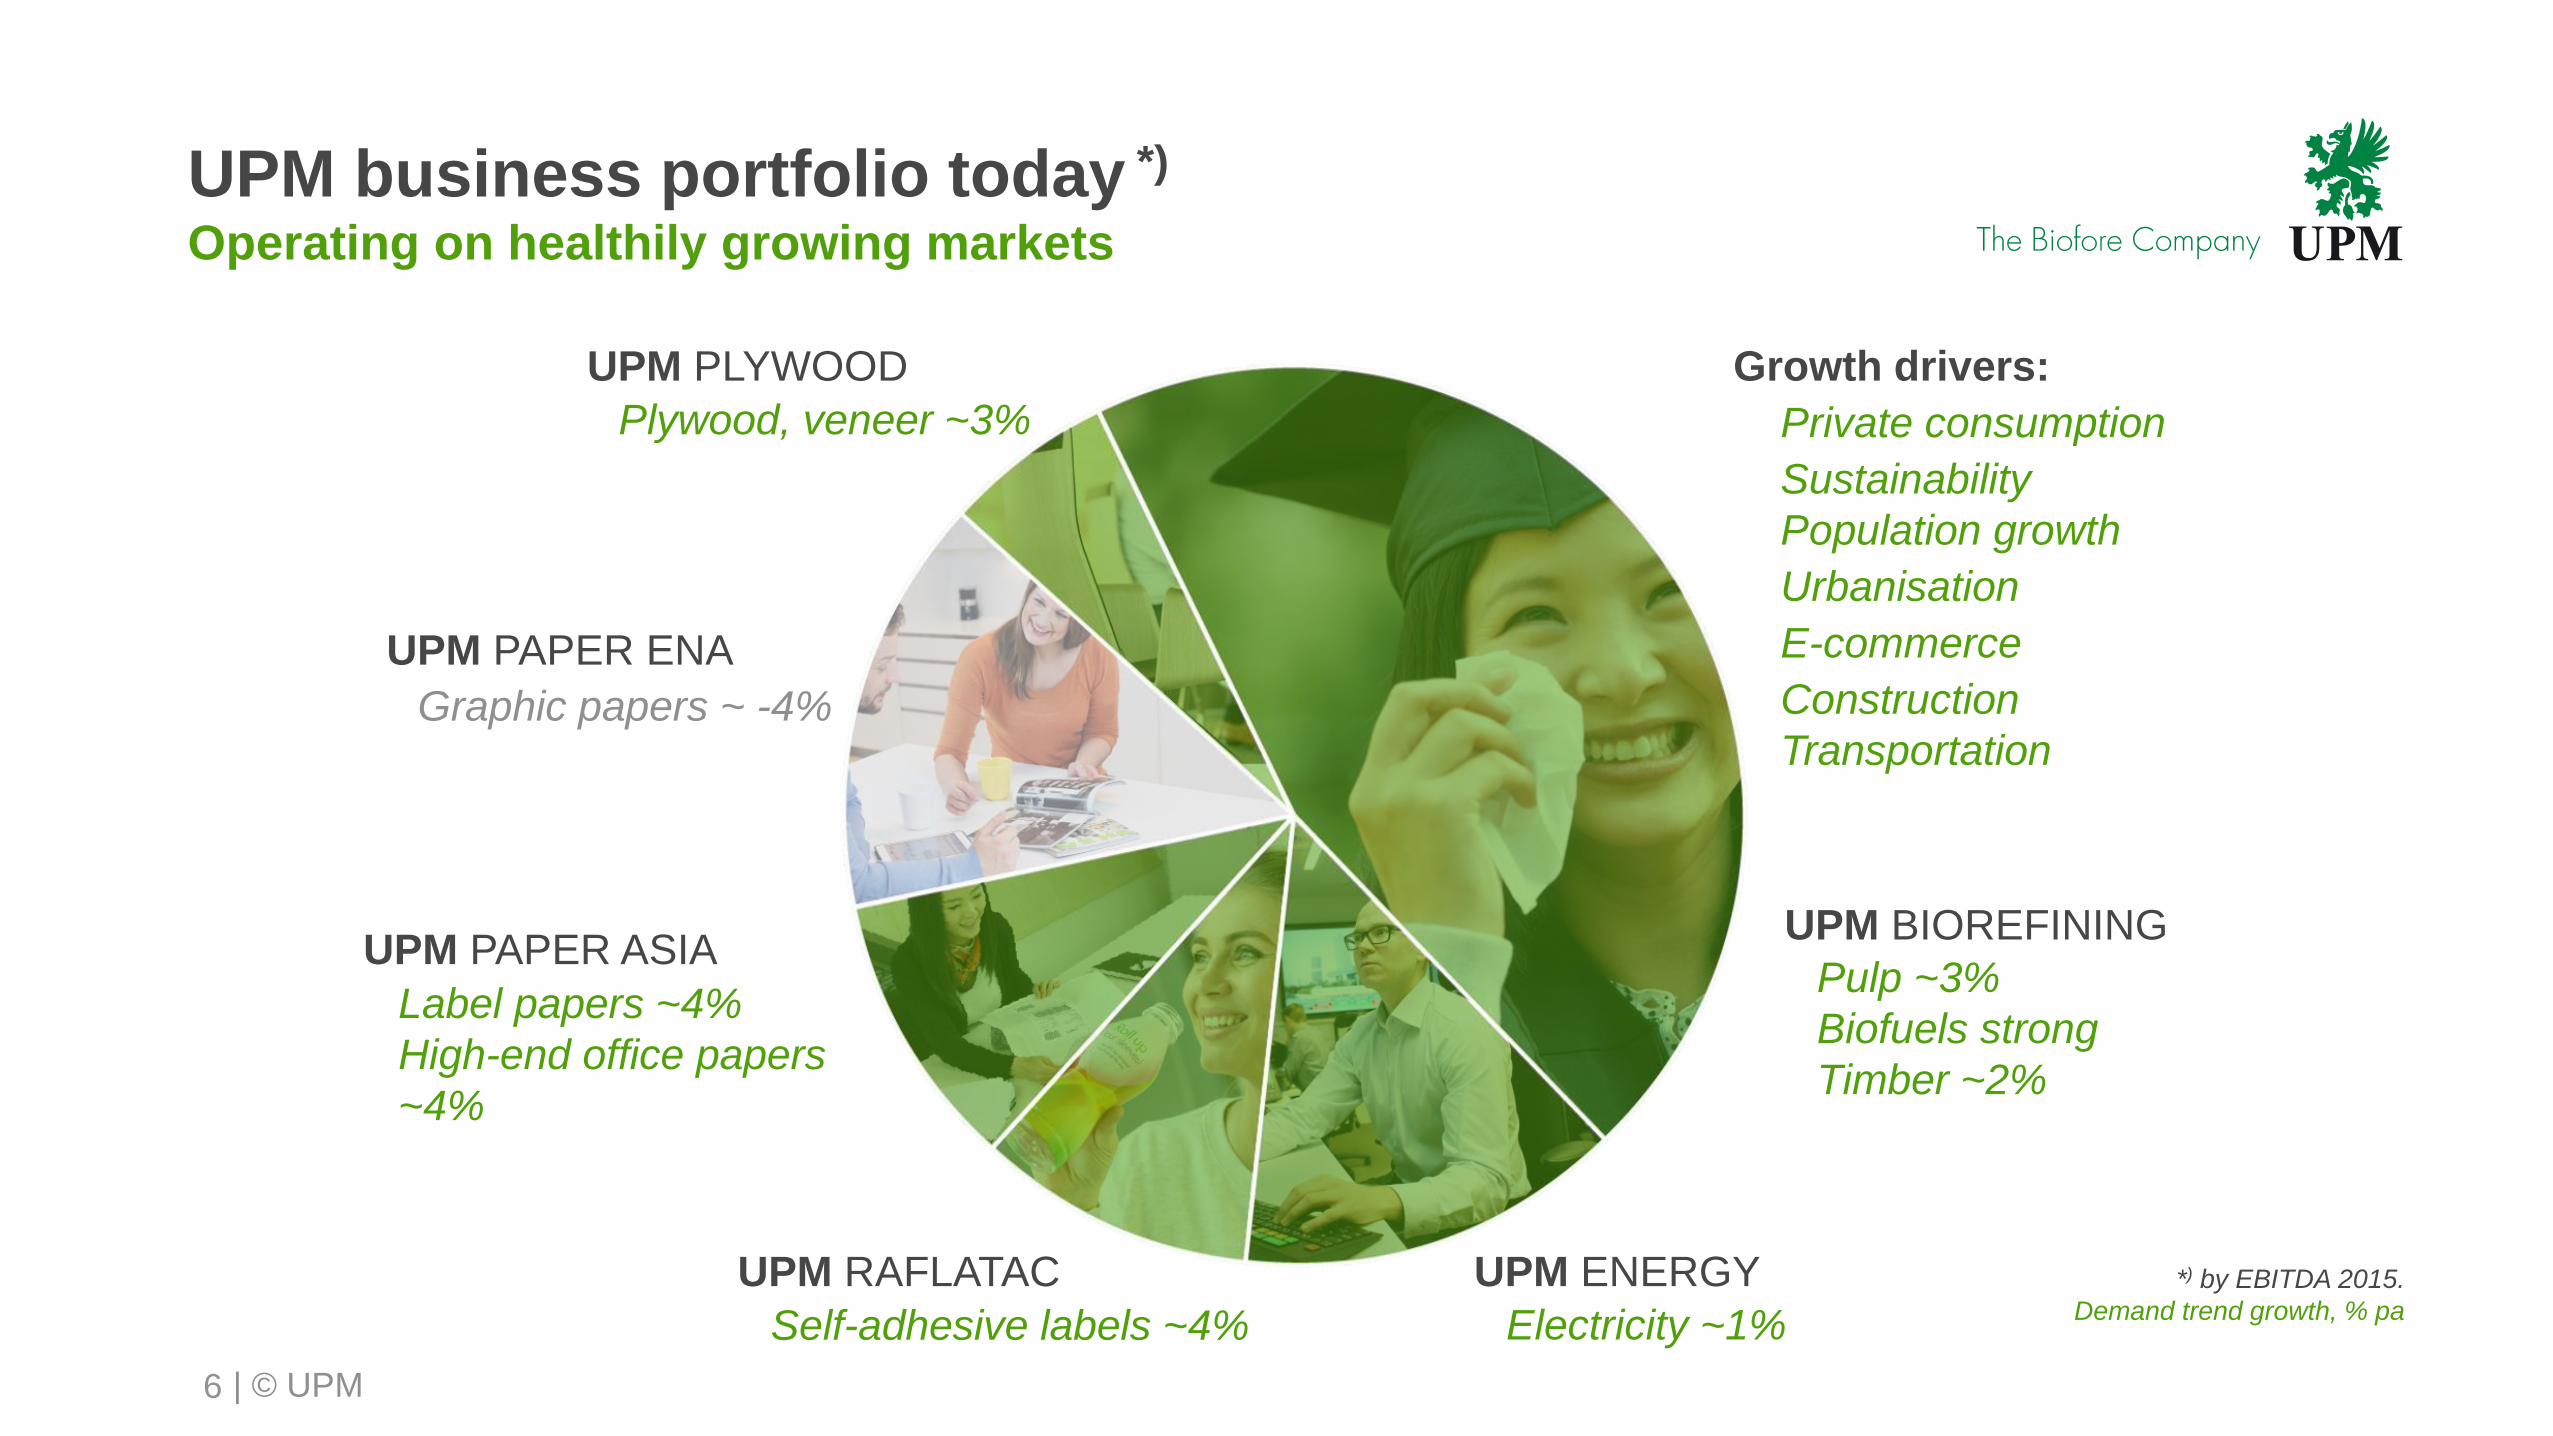
UPM ENERGYUPM RAFLATAC
UPM PAPER ENA
UPM PLYWOOD
Electricity ~1%
Pulp ~3%
Biofuels strong
Timber ~2%
Graphic papers ~ -4%
Plywood, veneer ~3%
Self-adhesive labels ~4%
UPM PAPER ASIAUPM BIOREFINING
Growth drivers:
Private consumption
Sustainability
Population growth
Urbanisation
E-commerce
Construction
Transportation
UPM business portfolio today *)
Operating on healthily growing markets
*) by EBITDA 2015.
Demand trend growth, % pa
Label papers ~4%
High-end office papers
~4%
| © UPM7
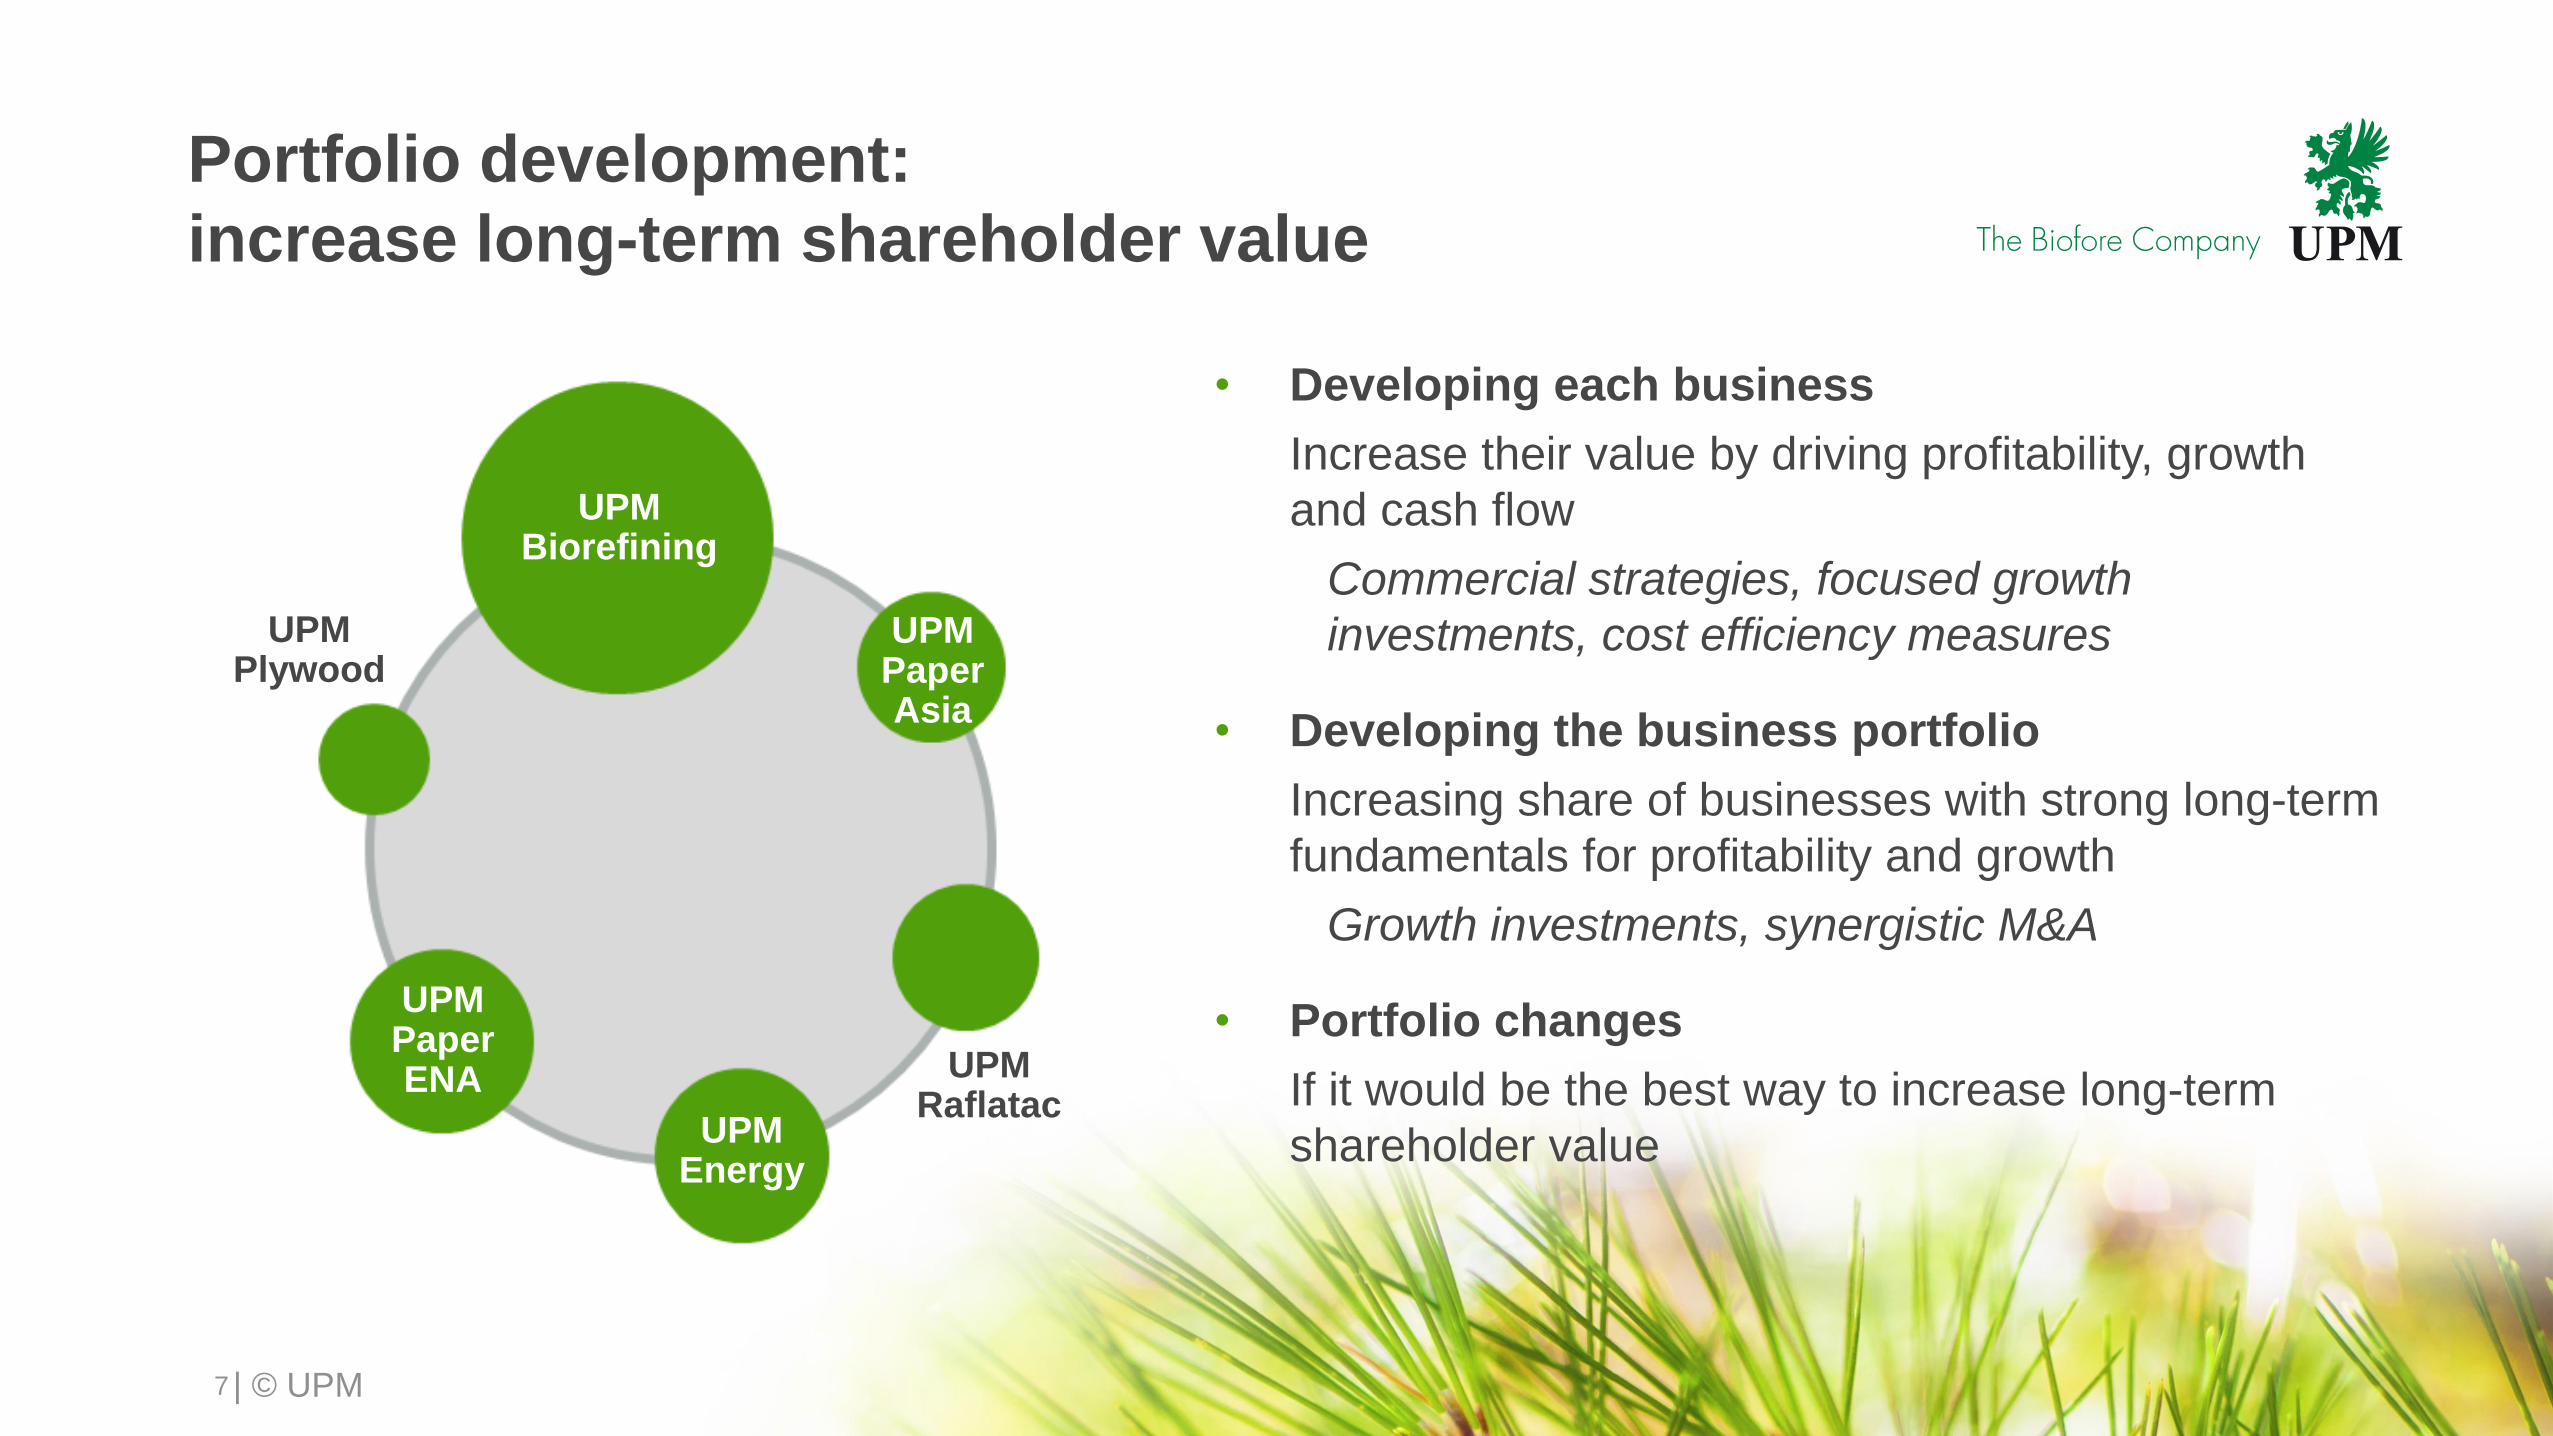
Portfolio development:
increase long-term shareholder value
• Developing each business
Increase their value by driving profitability, growth
and cash flow
Commercial strategies, focused growth
investments, cost efficiency measures
• Developing the business portfolio
Increasing share of businesses with strong long-term
fundamentals for profitability and growth
Growth investments, synergistic M&A
• Portfolio changes
If it would be the best way to increase long-term
shareholder value
UPM Biorefining
UPM Paper Asia
UPM Raflatac
UPM Energy
UPM Paper ENA
UPMPlywood

Improving performance,
opening growth opportunities
and enabling portfolio changes
BUSINESS MODEL
PROMOTES VALUE CREATION
| © UPM9
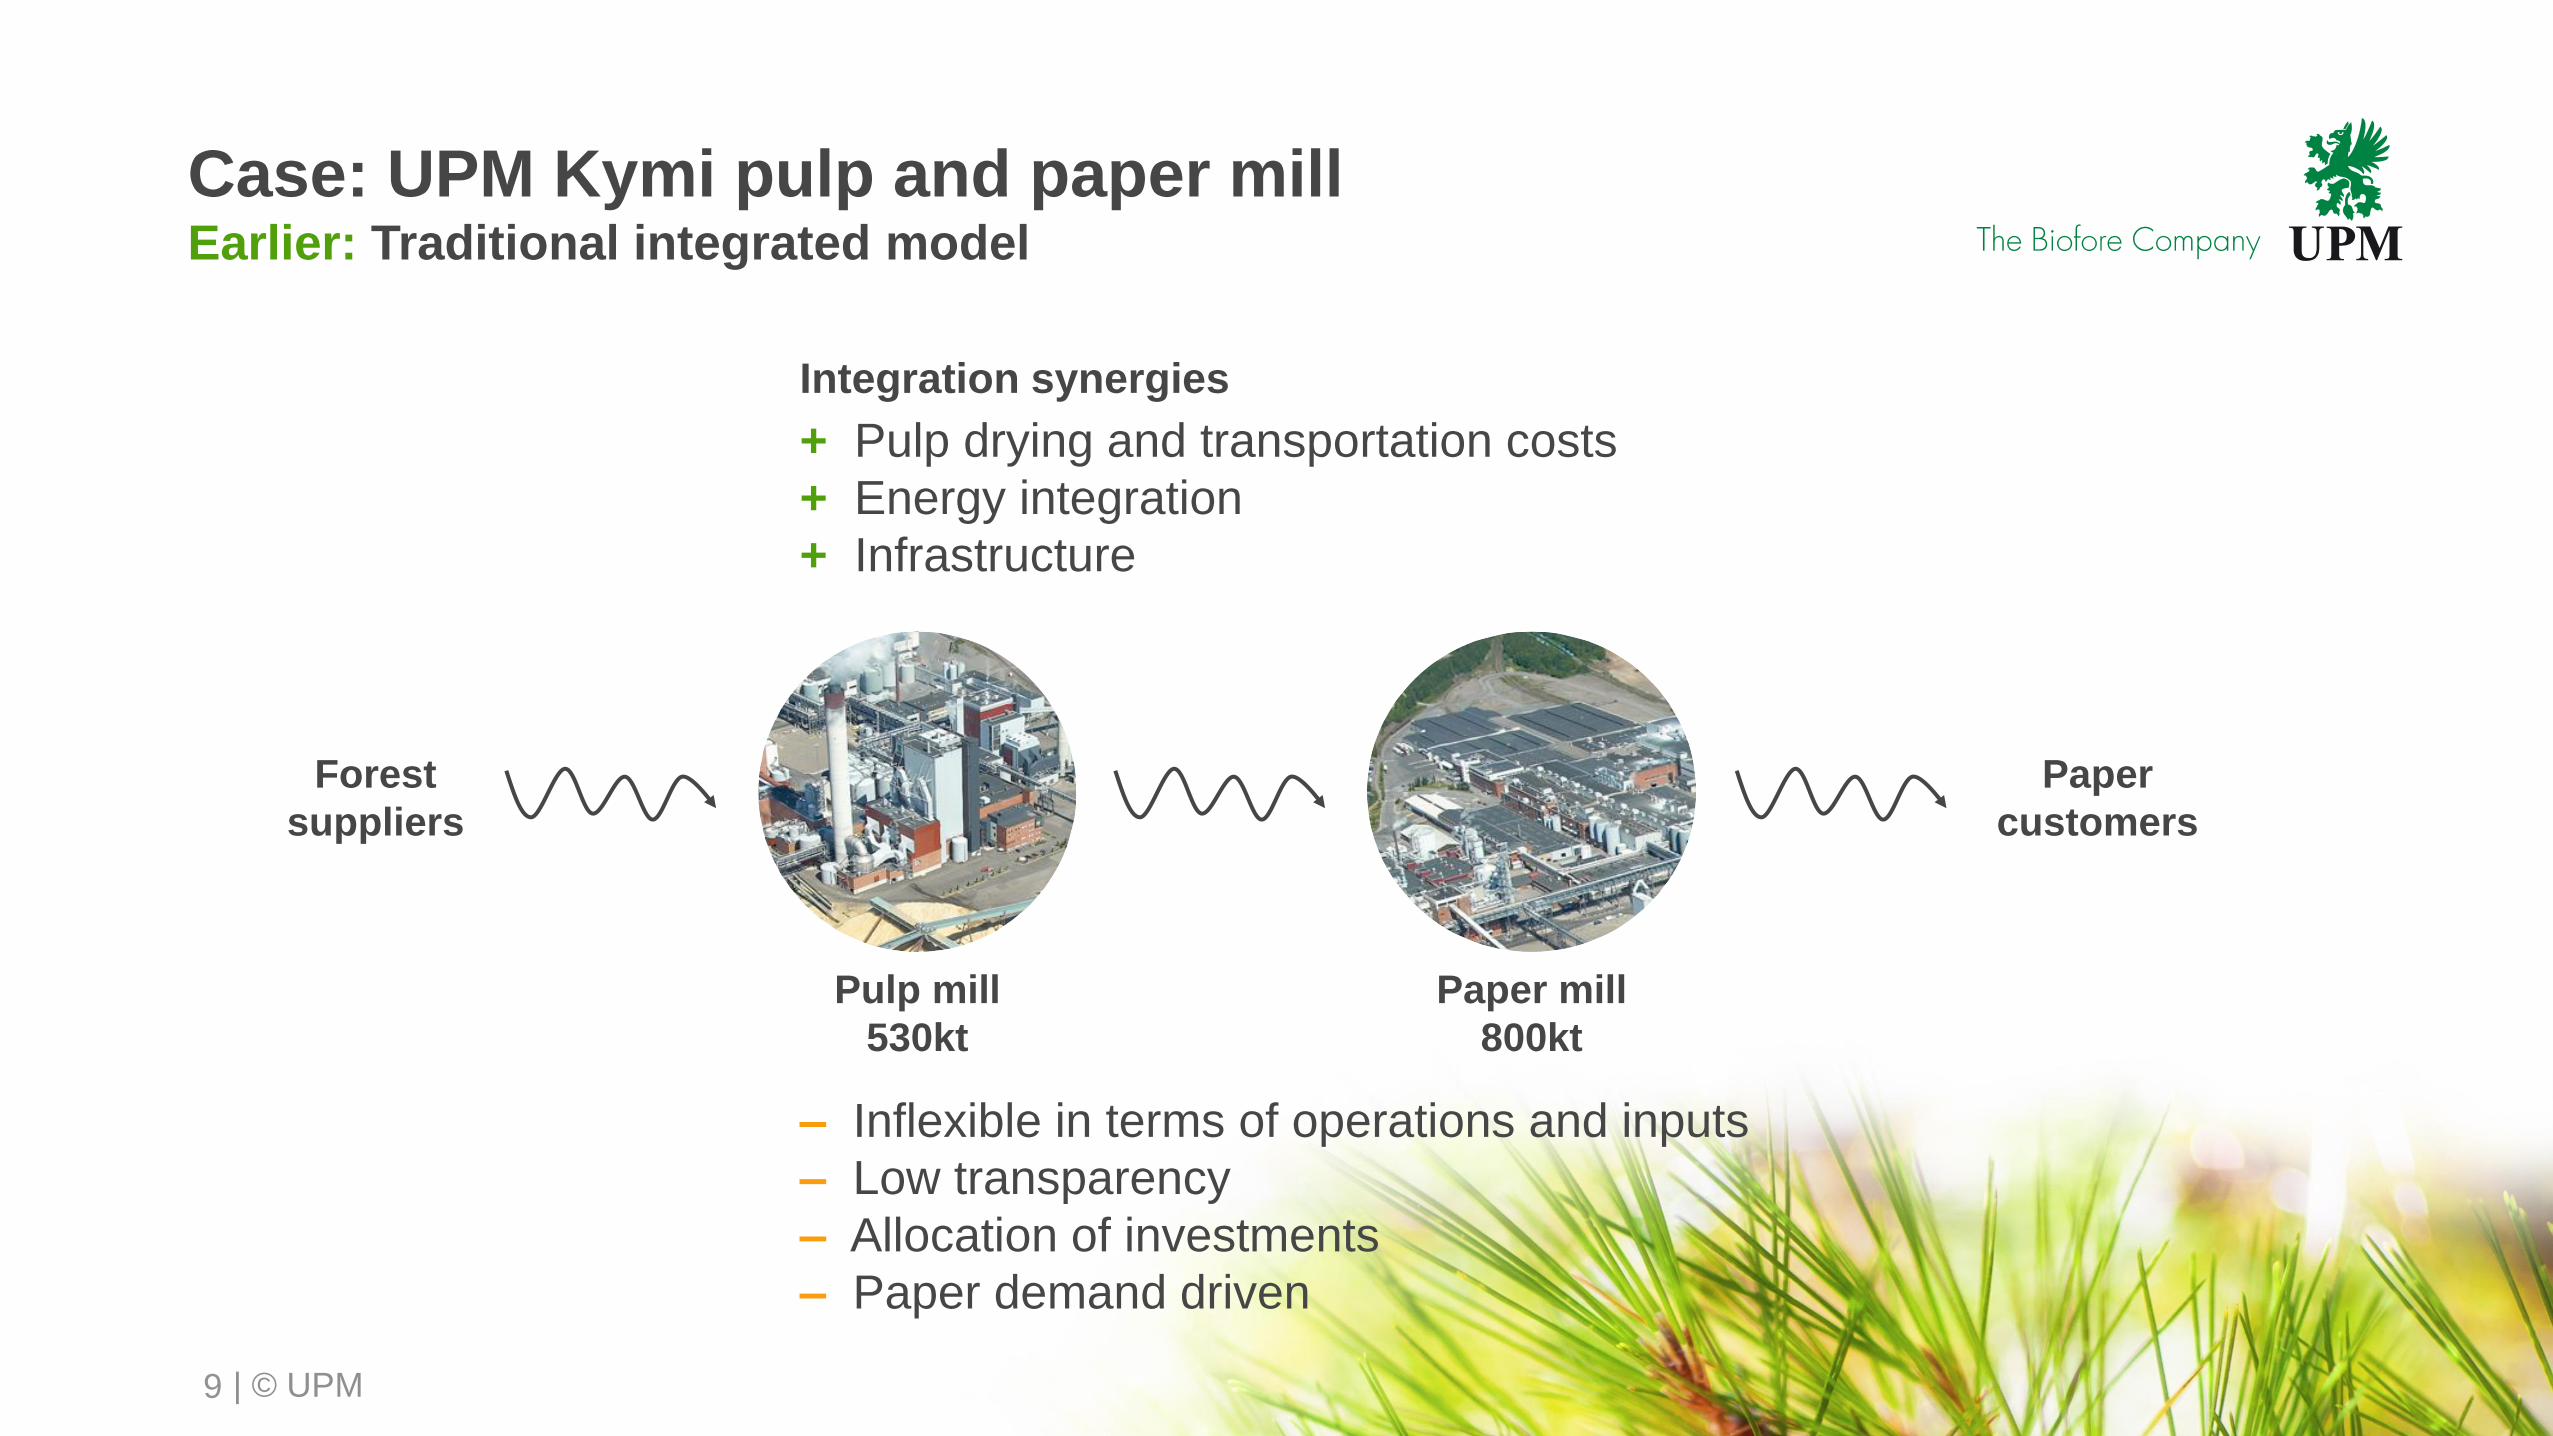
Pulp mill
530kt
Paper mill
800kt
Case: UPM Kymi pulp and paper millEarlier: Traditional integrated model
Forest
suppliers
Paper
customers
Integration synergies
+ Pulp drying and transportation costs
+ Energy integration
+ Infrastructure
– Inflexible in terms of operations and inputs
– Low transparency
– Allocation of investments
– Paper demand driven

| © UPM10
Pulp mill
530kt
UPM Biorefining
Pulp mill
530 + 340 = 870kt
UPM Biorefining
Paper mill
800kt
UPM Paper ENA
Case: UPM Kymi pulp and paper millNow: Separate pulp and paper businesses
Focused
growth
investments
Different paper
end-use trends
Commercial strategies,
product mix and
service development
Customers
Tissue
Spec. papers
Board, etc.
Customers
Advertisers
Printers
Mechants, etc.
P&LP&L
Maintain
synergies
Transparency,
benchmarking, targets,
incentives
Agility,
improved efficiency
Optimised sourcing,
raw material mix
Growing pulp
markets and
end-usesA B C A B C
A B C A B C
Forest, Other Fibre, Other
+ Growing sales
+ Increased EBIT, CF
+ Higher ROCE

| © UPM
Case: market-driven value creation
in the labelling value chain
11
Paper-based
label customers
Traditional integrated forest products model
– Low transparency
– Production push – insensitive to customer needs
– Inflexible in terms of operations and raw materials
Self-adhesive labelsLabel materialsPulp
Focused
growth investments
P&L
Transparency,
benchmarking, targets,
incentives
Agility,
improved efficiency
P&LP&L
UPM RaflatacUPM Paper AsiaUPM Biorefining
Self-adhesive labelsLabel materialsPulp
Commercial strategies,
product and mix
development, R&D
CustomersPaper-based
Film-based
Speciality, etc.
Optimised sourcing,
R&D
A B C
A B C
Paper, Films, Other
A B C
A B C
Fibre, Other
Growing markets and
end-uses, diverse
customer needs
CustomersLabels
Release
Packaging, etc.
A B C
CustomersTissue
Spec. papers
Board, etc.
A B C
Forest, Other+ Growing sales
+ Increased EBIT, CF
+ Higher ROCE

| © UPM
Clear roles and decision making on right level
12
Group
Portfolio strategy
Capital allocation
Business targets
Code of conduct
Responsibility targets
Businesses
Business area strategies
Commercial excellence
Operational excellence
Cost efficiency measures
Focused growth projects
Innovation
Outcomes
Top performance
Competitive advantage
Value creation
Stakeholder value
License to operate
Focused growth investments
Attractive dividend
Consistently strong balance sheet
DISCIPLINED
CAPITAL ALLOCATION

| © UPM
Disciplined capital allocation
Focused growth projects and
attractive dividends financed
from operating cash flow
Consistently strong
balance sheet
Top performance
Industry-leading
balance sheet
Attractive dividend
Strong cash flowFocused
investments
14
| © UPM
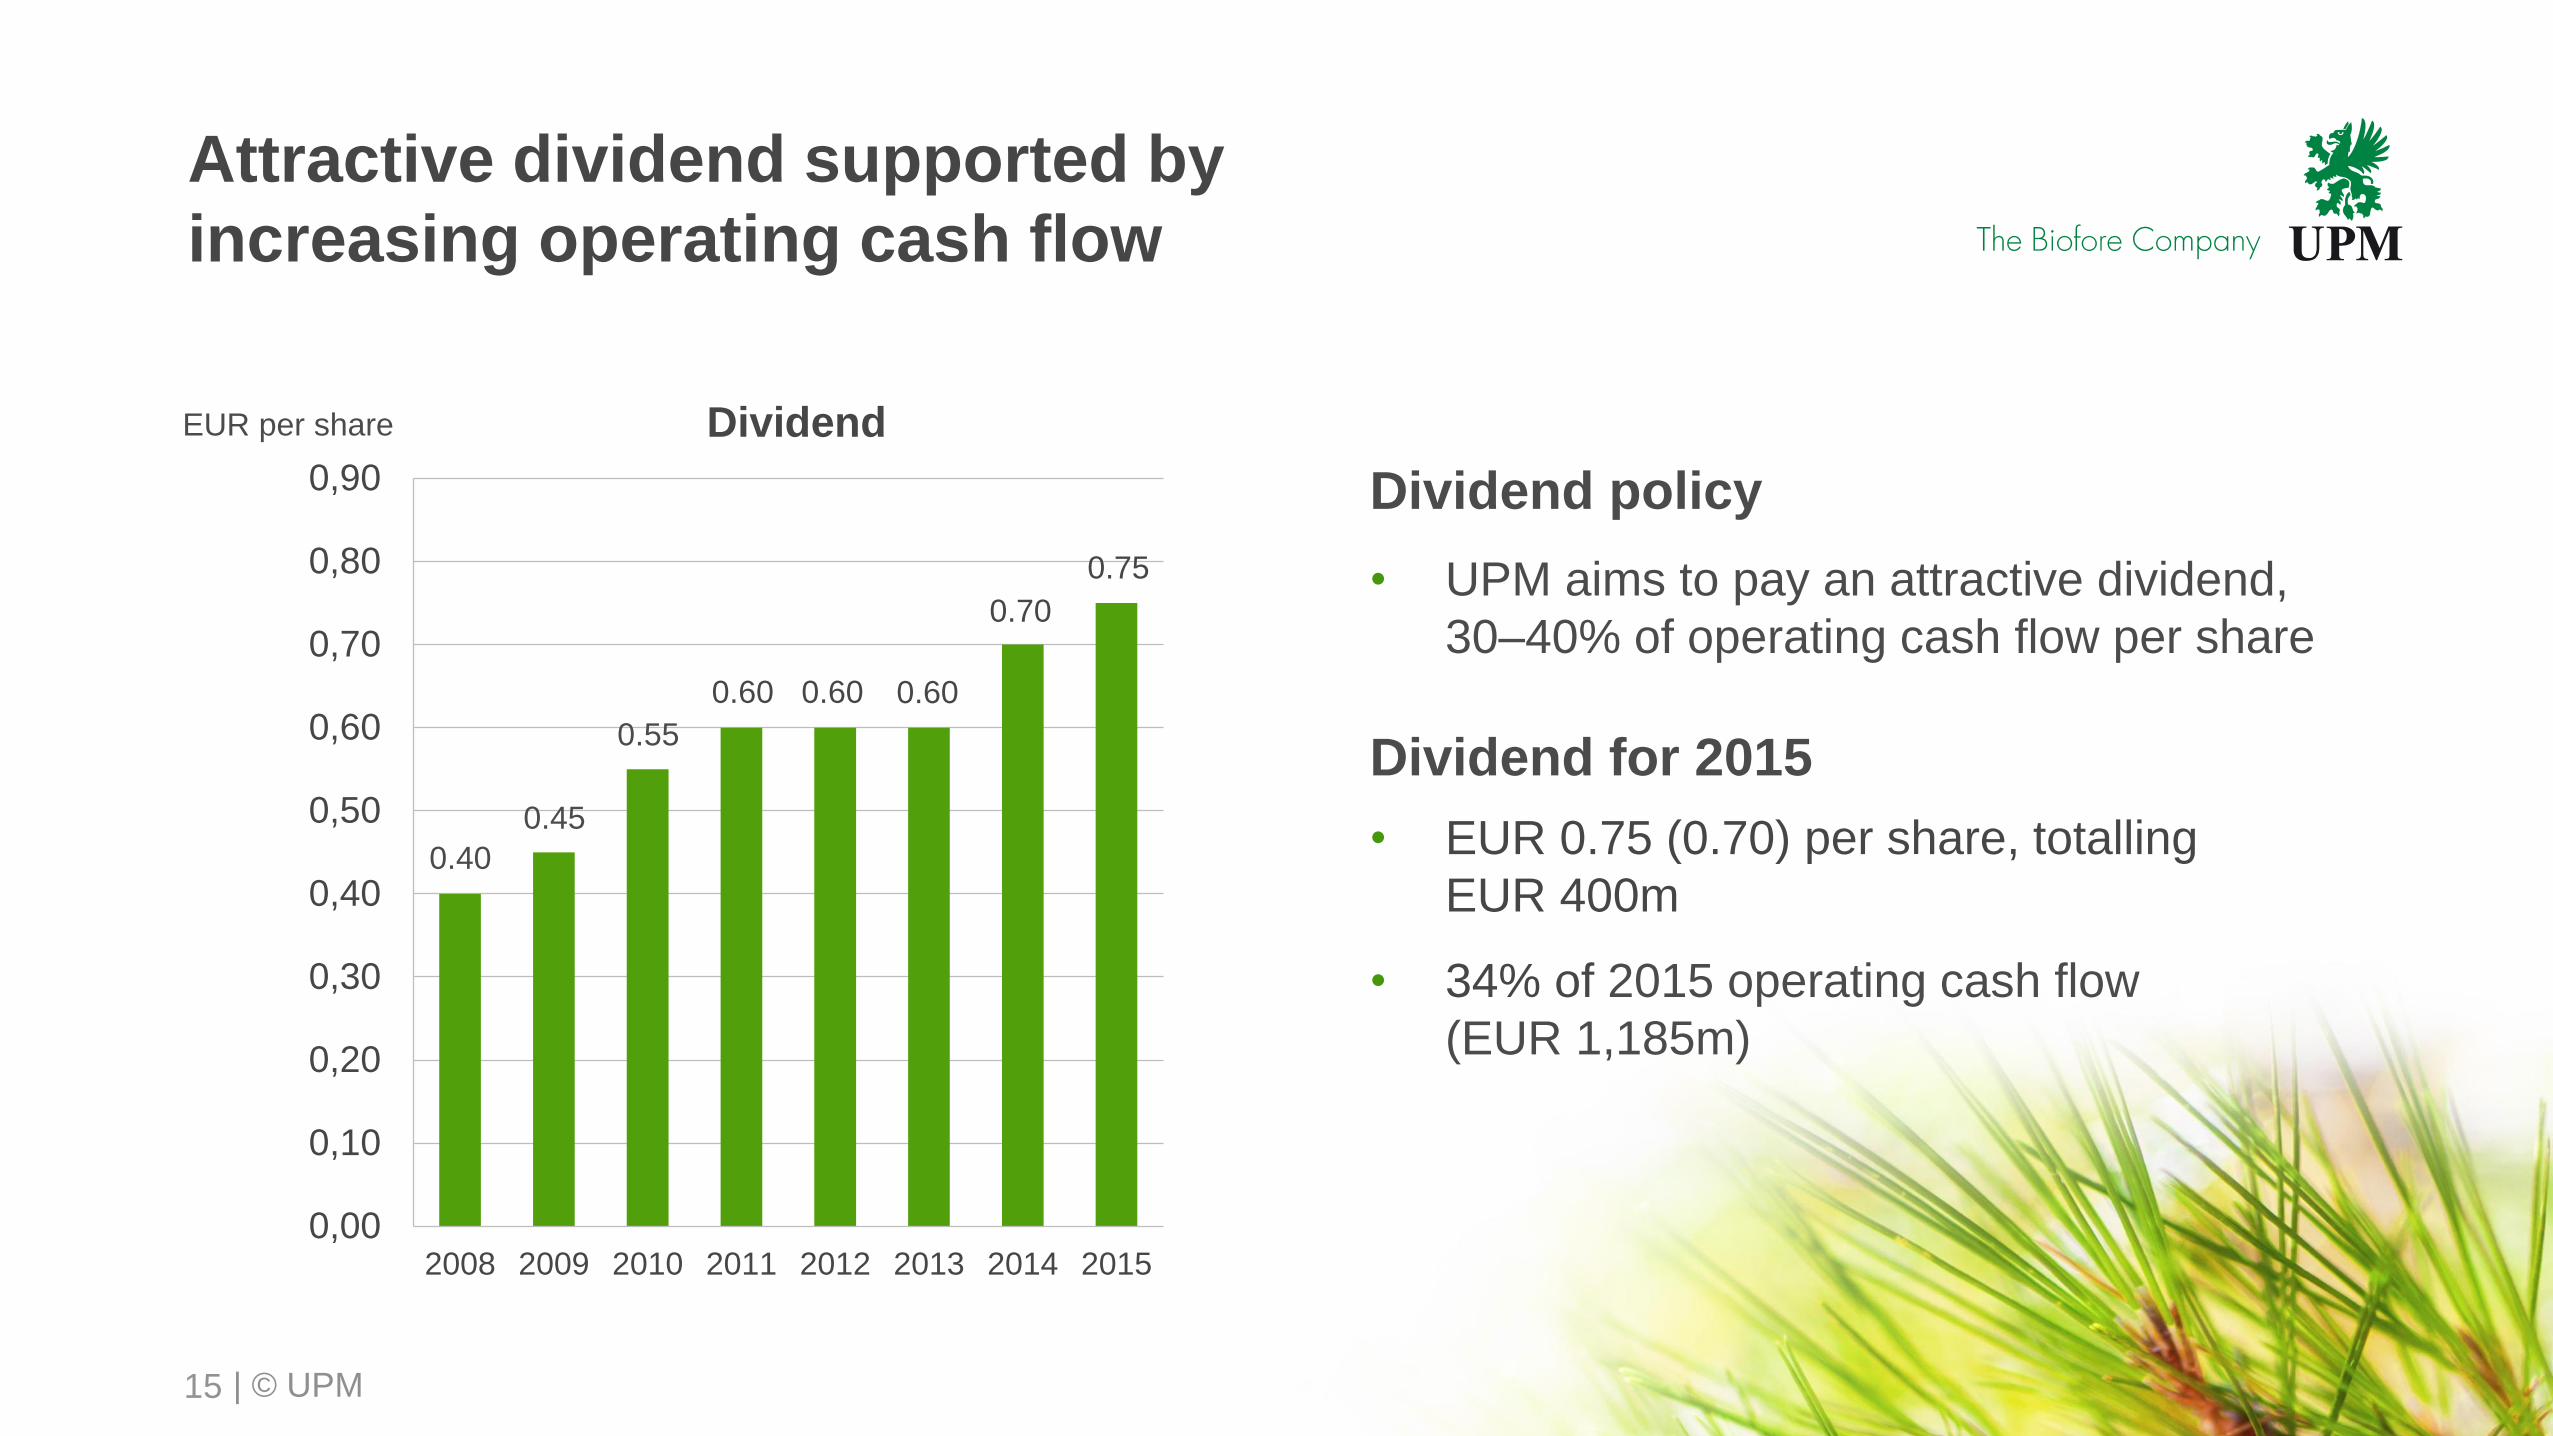
Attractive dividend supported by
increasing operating cash flow
15
0,00
0,10
0,20
0,30
0,40
0,50
0,60
0,70
0,80
0,90
2008 2009 2010 2011 2012 2013 2014 2015
DividendEUR per share
0.40
0.45
0.55
Dividend policy
• UPM aims to pay an attractive dividend,
30–40% of operating cash flow per share
Dividend for 2015
• EUR 0.75 (0.70) per share, totalling
EUR 400m
• 34% of 2015 operating cash flow
(EUR 1,185m)
0.60 0.60 0.60
0.70
0.75

| © UPM
UPM will continue to invest on growth through
focused growth projects with modest total capex
16
Focused growth investments
Good returns and fast payback
Low implementation risk
Financed from operating cash flow
Modest total capex,
attractive returns and continuously
strengthening balance sheet
Low replacement investments
Asset quality in all businesses,
e.g. large competitive pulp mills
UPM Paper ENA
0
200
400
600
800
1 000
1 200
2008 2009 2010 2011 2012 2013 2014 2015 2016E
Operational investments
Strategic investments
Uruguay
acquisition Depreciation
Capital expenditure
Myllykoski
acquisition

| © UPM
0
10
20
30
40
50
60
1 000
1 500
2 000
2 500
3 000
3 500
4 000
2011 2012 2013 2014 2015 Q2/160,0
0,5
1,0
1,5
2,0
2,5
3,0
1 000
1 500
2 000
2 500
3 000
3 500
4 000
2011 2012 2013 2014 2015 Q2/16
UPM aims to maintain strong balance sheet
17
Net debtEURm
Net debt / EBITDA(trailing 12 months)
Net debt
Net debt / EBITDA
1.25
Gearing %
Net debt
Gearing
24
LTM LTM
Net debtEURm
| © UPM
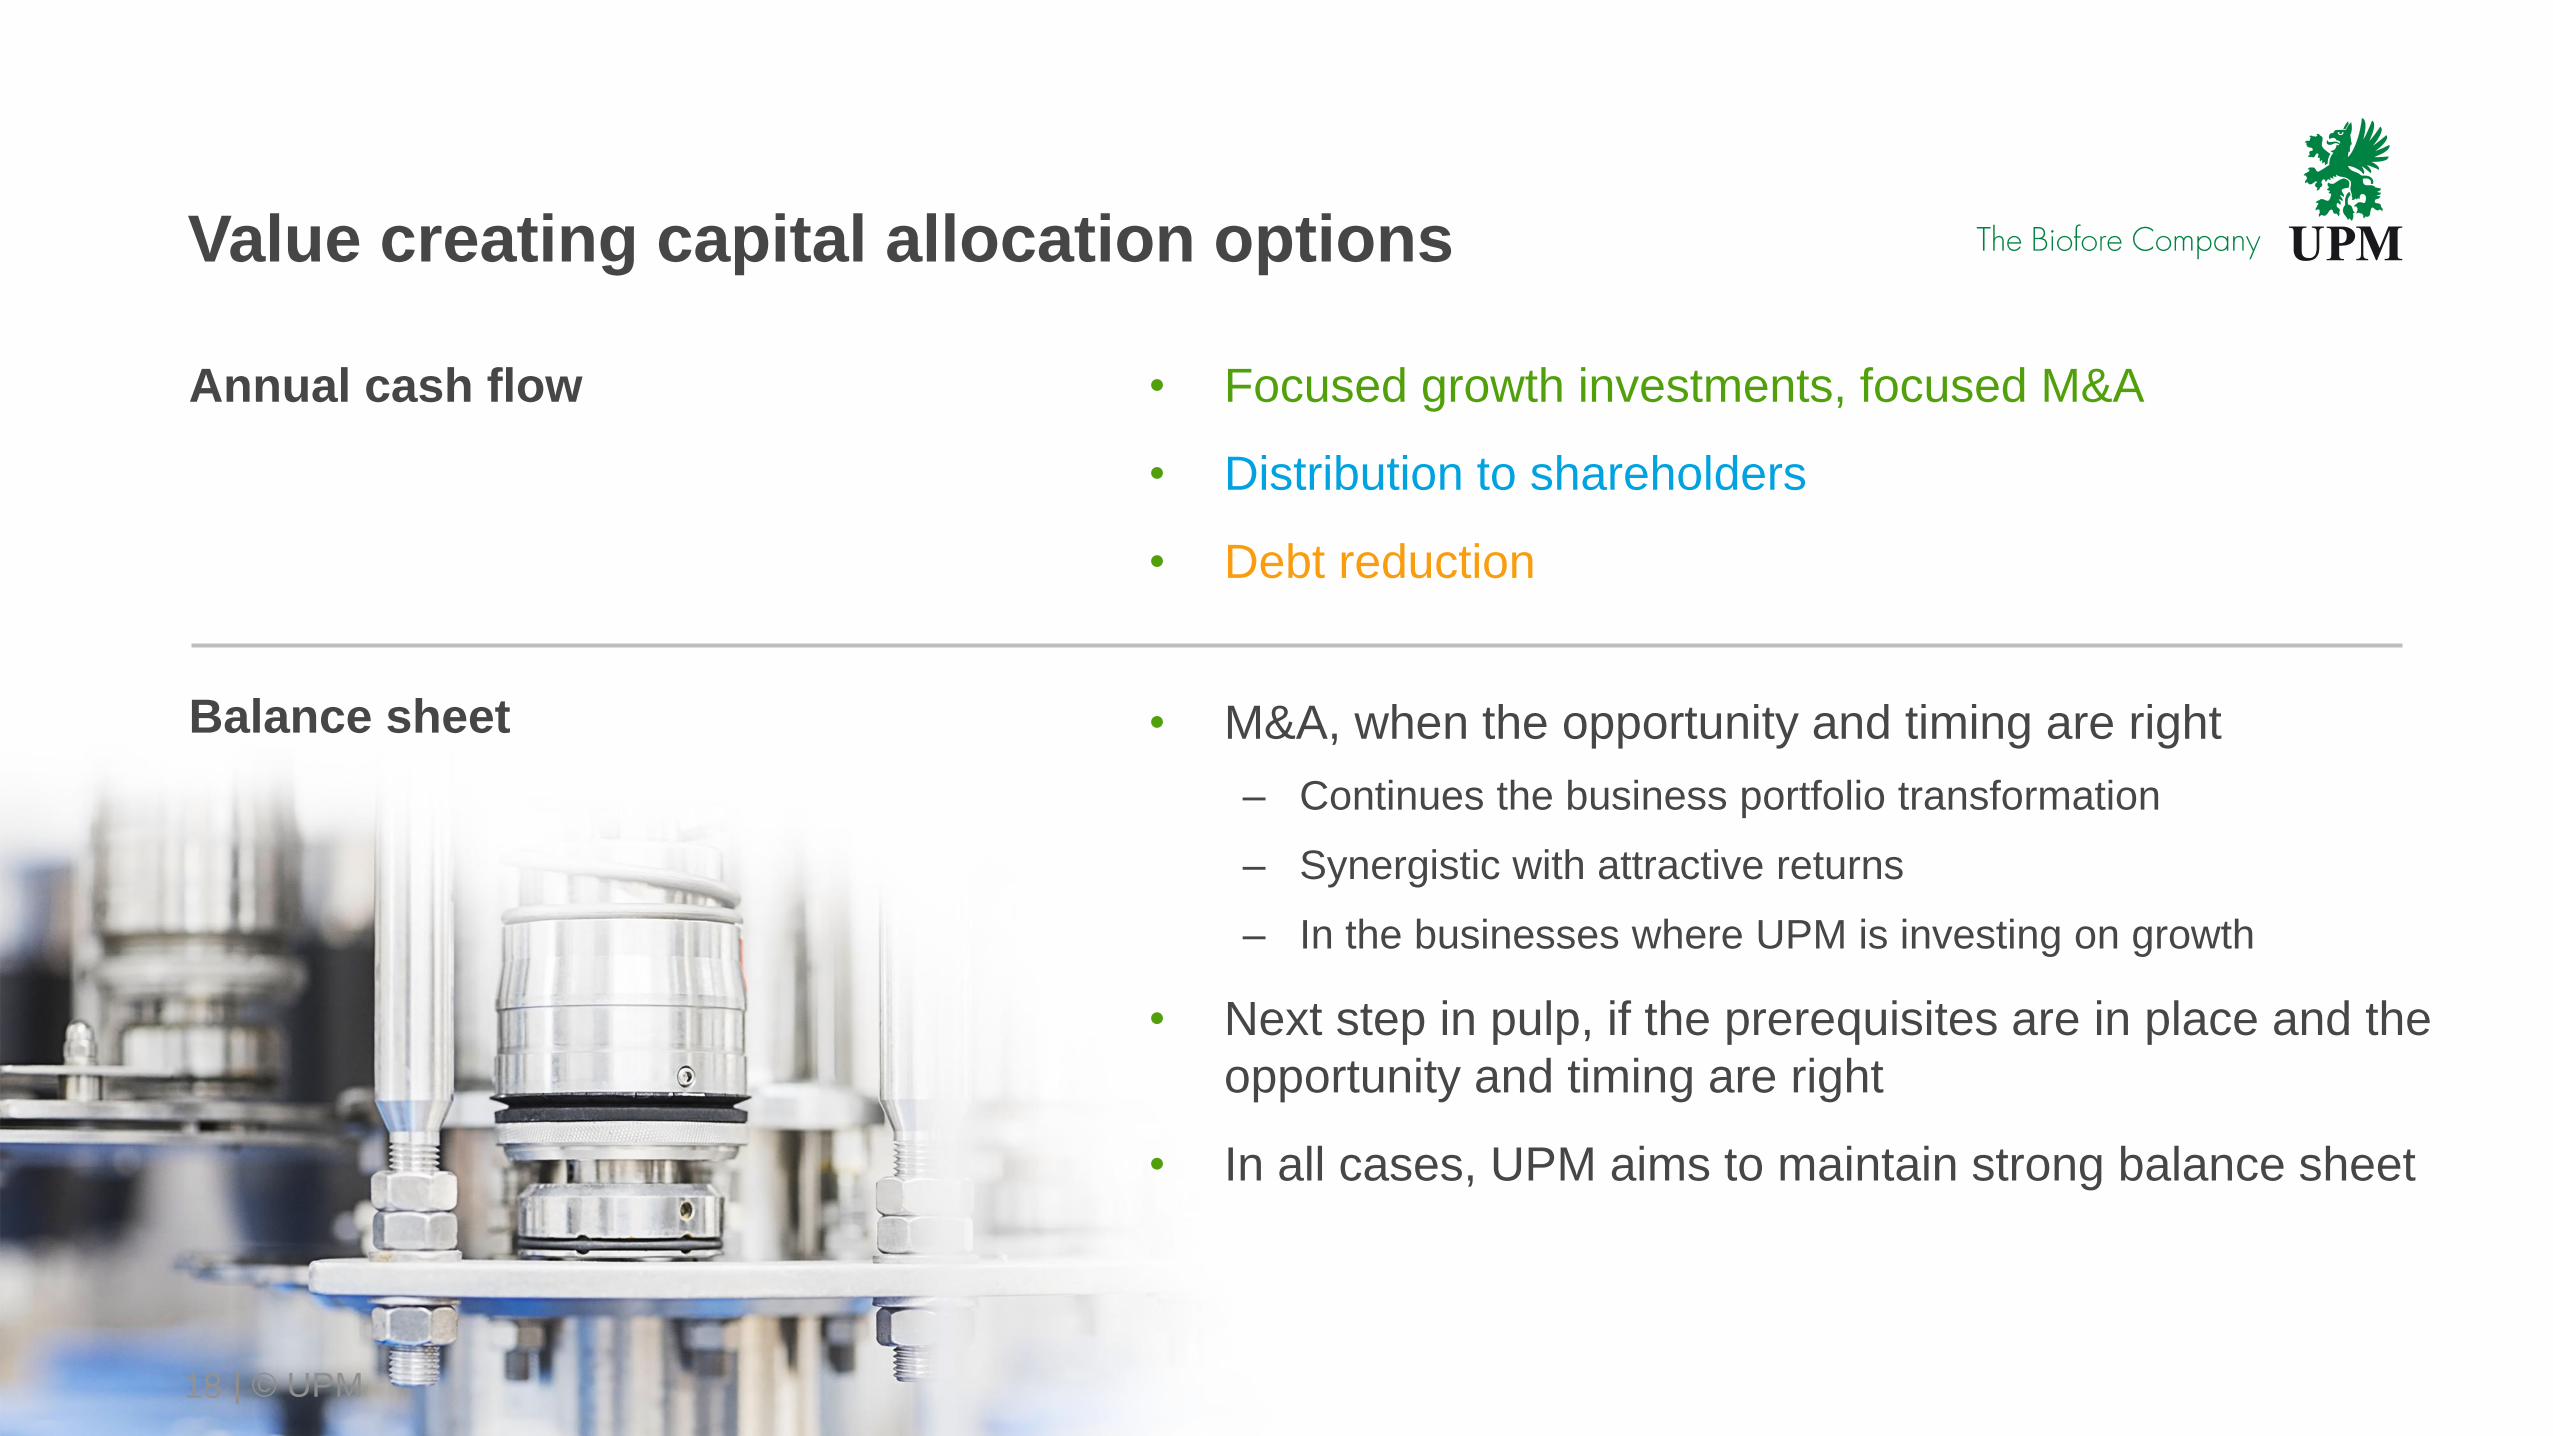
Value creating capital allocation options
Annual cash flow
Balance sheet
• Focused growth investments, focused M&A
• Distribution to shareholders
• Debt reduction
18
• M&A, when the opportunity and timing are right
– Continues the business portfolio transformation
– Synergistic with attractive returns
– In the businesses where UPM is investing on growth
• Next step in pulp, if the prerequisites are in place and the
opportunity and timing are right
• In all cases, UPM aims to maintain strong balance sheet
| © UPM

PORTFOLIO OF
OPPORTUNITIES
| © UPM
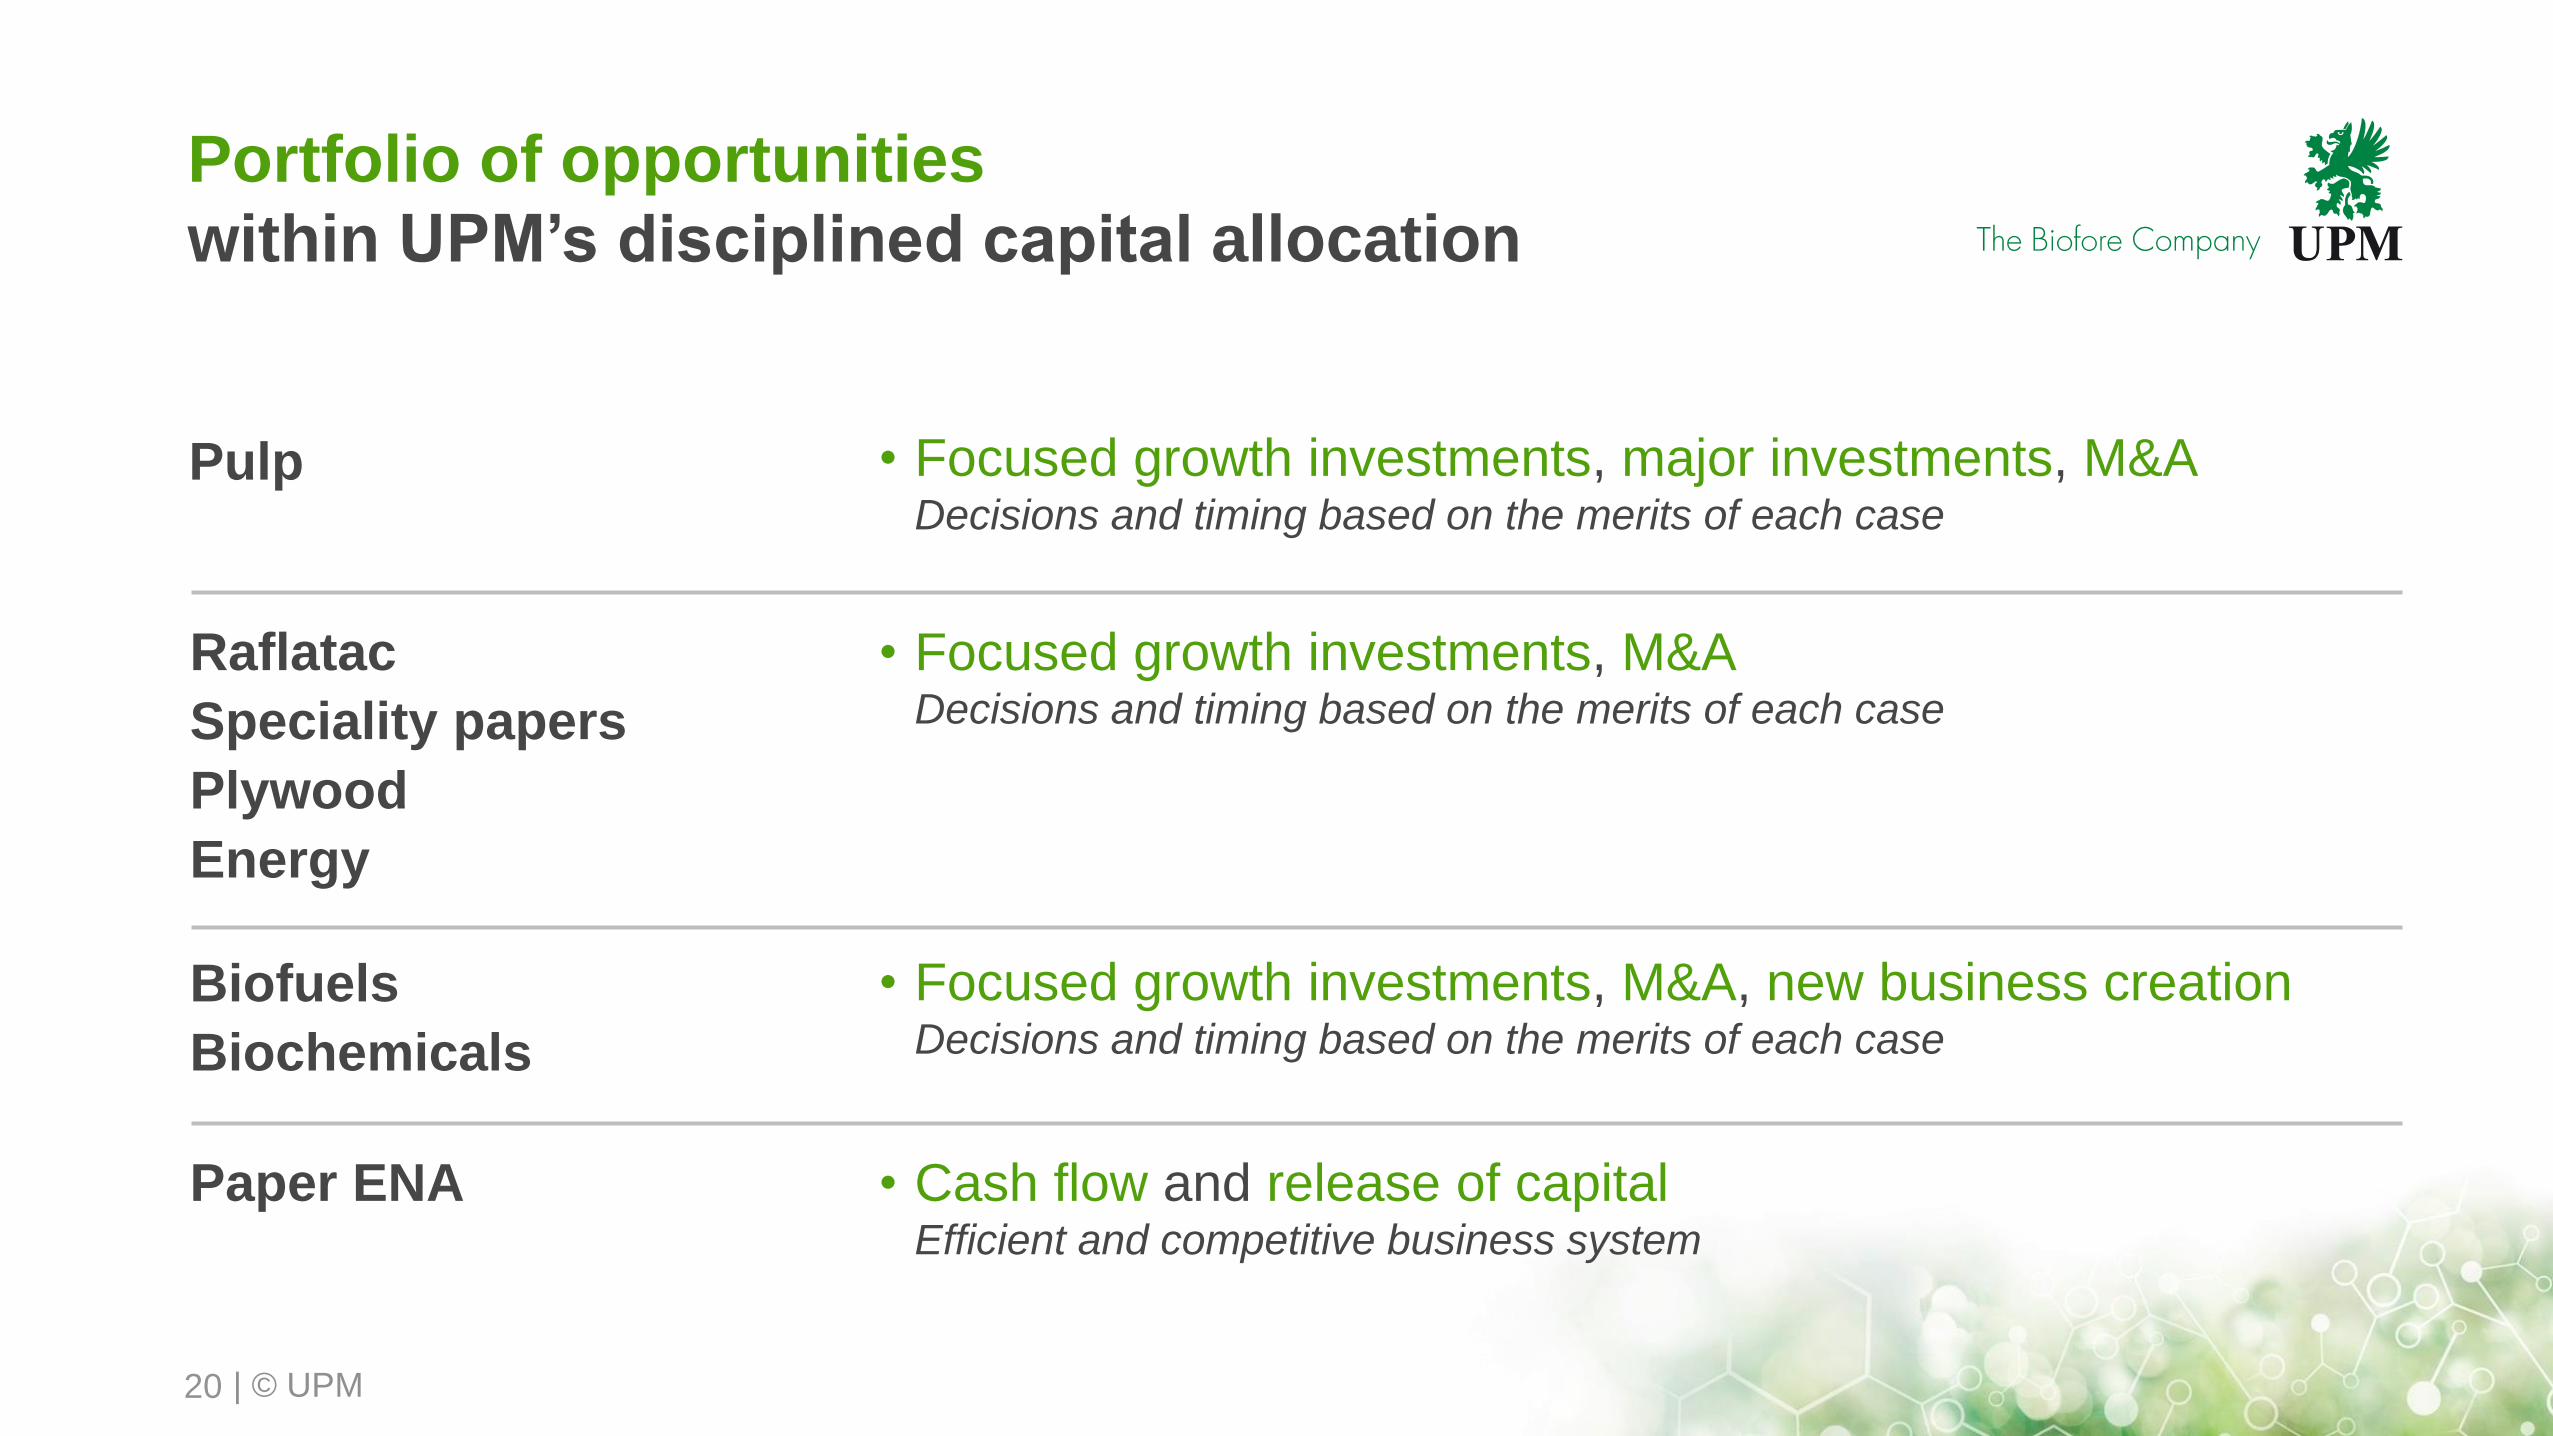
Portfolio of opportunities
within UPM’s disciplined capital allocation
Pulp
20
Raflatac
Speciality papers
Plywood
Energy
Biofuels
Biochemicals
Paper ENA
• Focused growth investments, M&ADecisions and timing based on the merits of each case
• Focused growth investments, M&A, new business creation Decisions and timing based on the merits of each case
• Cash flow and release of capitalEfficient and competitive business system
• Focused growth investments, major investments, M&ADecisions and timing based on the merits of each case

| © UPM
UPM’s transformation and disciplined capital
allocation have increased shareholder value
0
2 000
4 000
6 000
8 000
10 000
12 000
2008 2009 2010 2011 2012 2013 2014 2015 Jul/16*
Enterprise value
0 %
10 %
20 %
30 %
40 %
50 %
60 %
70 %
80 %
90 %
100 %
2008 2009 2010 2011 2012 2013 2014 2015 Jul/16*
Distribution of the enterprise value
21
Market capitalisation
Net debt
EUR million
Market capitalisation
Net debt
*) Net debt as of 30 June 2016