Embed Size (px)
Citation preview

U P L L i m i t e d | A n n u a l R e p o r t 2 0 1 8 - 1 9
Forward-looking statementThis document contains statements about expected future events and financial and operating results of UPL, which are forward-looking. By their nature, forward-looking statements require the Company to make assumptions and are subject to inherent risks and uncertainties. There is significant risk that the assumptions, predictions and other forward-looking statements will not prove to be accurate. Readers are cautioned not to place undue reliance on forward-looking statements as a number of factors could cause assumptions, actual future results and events to differ materially from those expressed in the forward-looking statements. Accordingly, this document is subject to the disclaimer and qualified in its entirety by the assumptions, qualifications and risk factors referred to in the management’s discussion and analysis of the UPL Annual Report 2018-19.
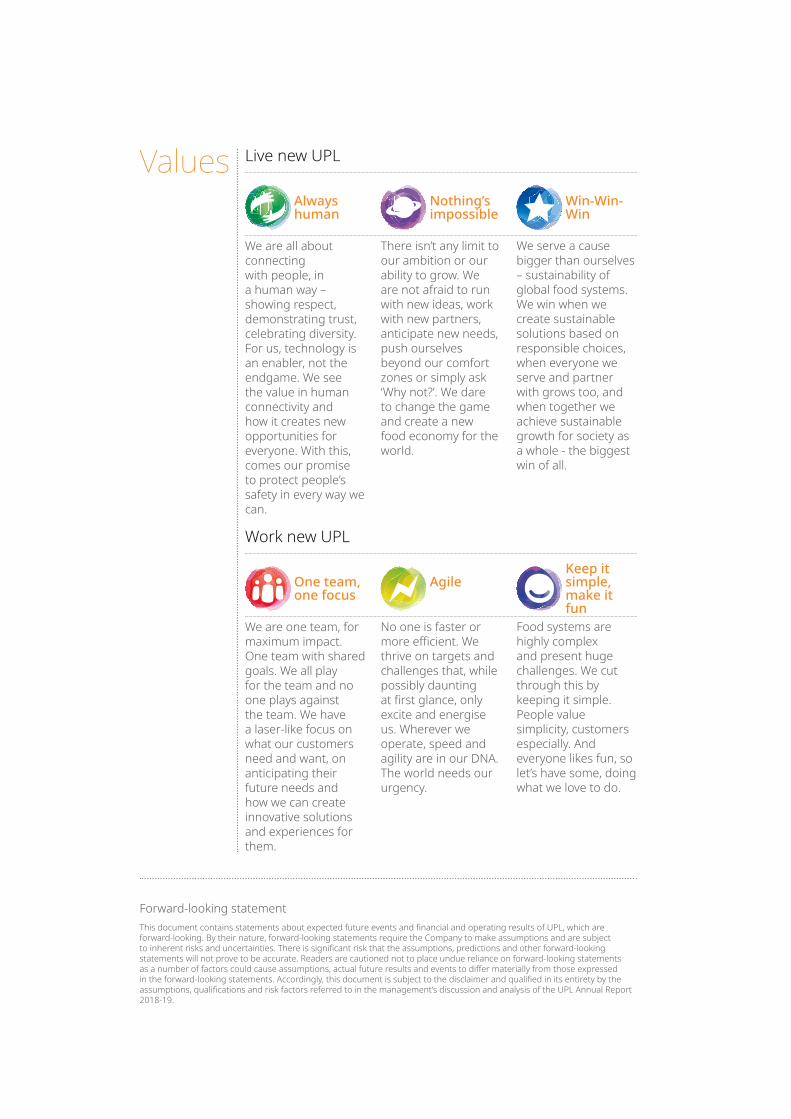
Values Live new UPL
Work new UPL
We are all about connecting with people, in a human way – showing respect, demonstrating trust, celebrating diversity. For us, technology is an enabler, not the endgame. We see the value in human connectivity and how it creates new opportunities for everyone. With this, comes our promise to protect people’s safety in every way we can.
We are one team, for maximum impact. One team with shared goals. We all play for the team and no one plays against the team. We have a laser-like focus on what our customers need and want, on anticipating their future needs and how we can create innovative solutions and experiences for them.
There isn’t any limit to our ambition or our ability to grow. We are not afraid to run with new ideas, work with new partners, anticipate new needs, push ourselves beyond our comfort zones or simply ask ‘Why not?’. We dare to change the game and create a new food economy for the world.
No one is faster or more efficient. We thrive on targets and challenges that, while possibly daunting at first glance, only excite and energise us. Wherever we operate, speed and agility are in our DNA. The world needs our urgency.
We serve a cause bigger than ourselves – sustainability of global food systems. We win when we create sustainable solutions based on responsible choices, when everyone we serve and partner with grows too, and when together we achieve sustainable growth for society as a whole - the biggest win of all.
Food systems are highly complex and present huge challenges. We cut through this by keeping it simple. People value simplicity, customers especially. And everyone likes fun, so let’s have some, doing what we love to do.
Always human
One team, one focus
Nothing’s impossible
Agile
Win-Win-Win
Keep it simple, make it fun

Contents02 OpenAg06 Eight things you need to know about UPL
Limited08 Milestones10 Our attractive performance across the years12 Chairman’s communiqué16 Message from the Global CEO20 Message from the Global COO22 Today’s UPL24 Competence drivers31 The world will need more food32 Sectoral context
33 UPL’s contrarian approach34 UPL’s focus areas35 UPL. First among equals36 UPL’s strategy40 Our geography-wise performance review 46 Management discussion and analysis 54 Risk management process at UPL57 Corporate information58 Notice67 Directors’ report136 Standalonefinancialstatements209 Consolidatedfinancialstatements
UPL in numbers
22,077 Revenues in FY2019 (H in crore)
4,111EBITDA in FY2019 (H in crore)
1,447 NetProfitinFY2019(H in crore)
48Manufacturing Facility locations
1,023Patents granted
>12,400Registrations
>138Countries of presence
5thRank among global crop protection product players (trailing twelve months basis)
10,300+Number of employees
75Number of countries, workforce representation

‘OpenAg’ A new UPL
2 | Annual Report 2018-19
UPL Limited

An open agriculture network for the world that feeds sustainable
growth for all.
No limits, no borders.
Annual Report 2018-19 | 3
UPL Limited
Modern agriculture faces multiple challengesPopulationThe challenge of feeding a growing global population in the midst of growing resource scarcity.
ResilientThe challenge of making agriculture climate-smart and farming more resilient to global warming.
AffordabilityThe challenge of making new agro technologies affordableforeverysinglefarmer,strengtheningprofitabilitywhilereducingenvironmentimpact.
ProductivityThe challenge of enhancing farmer productivity with relevant inputs; minimizing risks associated with traditional farming practices.
ModelAddressing challenges with a new model that convergesdifferentplayersacrossthevalue-chain.
PurposeConnecting farmers to food processors to supermarkets to consumers around a new purpose.
Vision Our vision is to be an icon for growth, technology and innovation. We only have one vision and it is not highlighted by the year.
Mission Change the game – to make every single food product more sustainable.
4 | Annual Report 2018-19
UPL Limited
How OpenAg is equipped to addressThe only way the challenge of growing more food for the world in a declining quantum of land area can be met is through a new model - one that brings togetherdifferentstakeholderstogetheracrossthefoodvaluechain.
From farmers to food processors to supermarkets to consumers – around a new purpose.
A purpose we call ‘OpenAg’.
A purpose where we play a new role by creating a network that changes the way the food system thinks and works - exposing it to new ideas, new possibilities and new solutions.
OpenAg will change the gameAt UPL Limited, OpenAg, will change the game by creating a society where agriculture is valued, outputs are sustainable and farmers are able to prosper.
The acquisition of Arysta LifeScience, has helped by the foundation for ‘OpenAg’.
Annual Report 2018-19 | 5
UPL Limited

Eight things you need to know about UPL Limited.
Theworld’sfifthlargestpost-patent crop protection
products company.
And the world’s fastest growing in this space.
6 | Annual Report 2018-19
UPL Limited
01 PedigreeUPL Limited is a global crop protection company of Indian origin. Founded in 1969 by Mr.R.D.Shroff(Chairman),theCompany is backed by a team of motivated and experienced industry professionals. The Company is listed on the National Stock Exchange and Bombay Stock Exchange in India. The Company’s market capitalisation as on 31st March 2019 stood at H48,693 crore.
02 LeadingUPL acquired Arysta LifeScience, a global provider of innovative crop protection solutions, in early 2019. The acquisition will enhance UPL’s position as a global leader in agricultural solutions with close to US$ 5 billion in combined sales and EBITDA of ~US$ 1 billion as well as a portfolio of more than 12,400 product registrations. UPL has a strong presence in India, the Americas and Western Europe while Arysta has a relatively stronger presence in Africa, Russia and Eastern Europe.
03 Solutions-orientedUPL has transformed from a crop protection products provider to a complete crop solutions partner, enhancing food security across the world. The Company has diversifieditsportfolioacrossseeds,seed treatment solutions, post-harvest solutions and industrial chemicals. UPL’s large basket of crop protection products safeguard crops against pest infestations. It has also created a retail chain in select geographies to provide one-stop solution to farmers.
04 Global presenceUPL’s products are marketed in more than 138 countries, strengthening its global positioning and de-risking the business from an excessive dependence on any single region. The Company accounts for around 14% share of India’s organised crop protection products sector. The Company has or direct global presence in major markets with a direct access to distribution and with sales forces deployed across more than 40 nations.
05 All-encompassingUPL’s product portfolio comprises fungicides, herbicides, insecticides, plant growth regulators, rodenticides, specialty chemicals, nutri-feeds, seeds and seed treatment products. With Arysta under its wing, UPL will bolster its portfolio of BioSolutions and Seed Treatment products. It has also ventured into providing value-added services in select markets.
06 InnovativeUPL’s investments in research and innovation have helped the Company generate 1,023 patents and more than 12,400 product registrations worldwide.
07 ComprehensiveUPL has expanded across the sectoral value-chain, from R&D and registrations to manufacturing, packaging and marketing, making it possible to emerge as one of the most comprehensive crop protection product companies in the world.
08 Awards and achievements2012: ‘Agriculture Leadership’ award forMr.RajjuShroffandMr.VikramShroff
2013: Ernst & Young ‘Entrepreneur of the Year’ award
2015: ‘Lifetime Achievement’ award byAGROWforMr.RajjuShroff
2016: First position in the agrochemical sector for UPL (Dun & Bradstreet’s ‘Top-500 Companies in 2016’)
2017: IIRIM – India Green Manufacturing Challenge 2016 – ‘Silver and Special’ awards (Unit#2)
2018: Frost & Sullivan - TERI Sustainability 4.0 Awards 2018 - 1st Runner-up, Challengers category
Frost & Sullivan and TERI Sustainability 4.0 Awards 2018 - Challengers Award - Large Business, Process Sector
Gold Award ‘Brands for Environment’ for year 2018 - Top 10 Environment Friendly Factories in the country
Gold Award ‘Friendly Green Factory’ for Year 2018 - ‘TOP 20 Clean and Green Factory’ in Country
Gold Award ‘Sustainable development’ for Year 2018 - ‘Top 20 Factory for sustainable development, innovation and Systems’ in the country
Outstanding business award, India Manufacturing Excellence Award (IMEA) 2018 by Frost & Sullivan - GoldCertificateofMerit
India Green Manufacturing Challenge (IGMC) by Frost & Sullivan - Silver Award
National Awards for Manufacturing Competitiveness, (NAMC 2017-2018) - Gold medal.
Annual Report 2018-19 | 7
UPL Limited

1969
2007
1976
2010
1980
2012
1994
2014
Started manufacturing red phosphorus
� Acquired Cerexagri for boosting revenues significantlythroughits global distribution network
� Successfully completed a QIP issue of equity shares
� Entered the crop protection products sector
� Started exporting products
� Acquired RiceCo for leveraging the global sales and marketing network for the rice segment
� Acquired Manzate brand, strengthening its fungicide portfolio
Began production of yellow phosphorus at Ankleshwar
� AcquiredDVAAgroand SIB for gaining entry into Brazil
� Acquired the UK-based MTM Agrochemical to gain access to the European herbicides market
� Commenced operations at the Jhagadia plant, UPL’s largest manufacturing site, with a cumulative capacity of 240,000 metric tonnes per annum
� Crossed H100 billion in revenues
� Introduced Unizeb Gold
Milestones
8 | Annual Report 2018-19
UPL Limited

1996
2016
2005
2017
2006
2018
� Acquired Devrinol for gaining entry and distribution access into the American, Japanese and Rest of World markets
� Set-up a caustic chlorine plant
� Crossed US$ 2 billion in revenues
� Surpassed 5,000 registrations
� Merged Advanta into UPL
� Acquired SWAL to enhance scale and distribution in India with a parallel distribution network
� RegisteredfirstEMR (SAAF)
� US$ 500 million Bonds issued by overseas subsidiary UPL Corporation, under Rule 144A and Regulation S with an investment grade rating from Moody’s, S&P and Fitch
� Acquired Reposo for gaining entry into Argentina
� Acquired Advanta, thereby making an entry into the seeds business
Performance highlights, FY2019
22,077
Revenues (H in crore)
4,111
EBITDA (H in crore)
18.8EBITDA margin (%)
1,447
Netprofit(H in crore)
6.6Netprofitmargin(%)
28.42Earnings per share (H)
21.3RoCE (%)
(OnlyUPLfiguresconsidered,asRoCEcomputationisforUPLconsolidatedfinancials.Arystafinancialstatementsareforaperiodoftwo months and have not been considered as we awaittheAssetValuationreportfortheArystagroup of companies to determine the RoCE for the combined business)
� US$ 300 million Bonds issued by overseas subsidiary UPL Corporation, under Regulation S with an investment grade rating from S&P and Fitch
� Crossed US$ 2.7 billion in revenues
� Crossed 6,000 registrations
� Announced the acquisition of Arysta LifeScience and completed it within six months
Annual Report 2018-19 | 9
UPL Limited
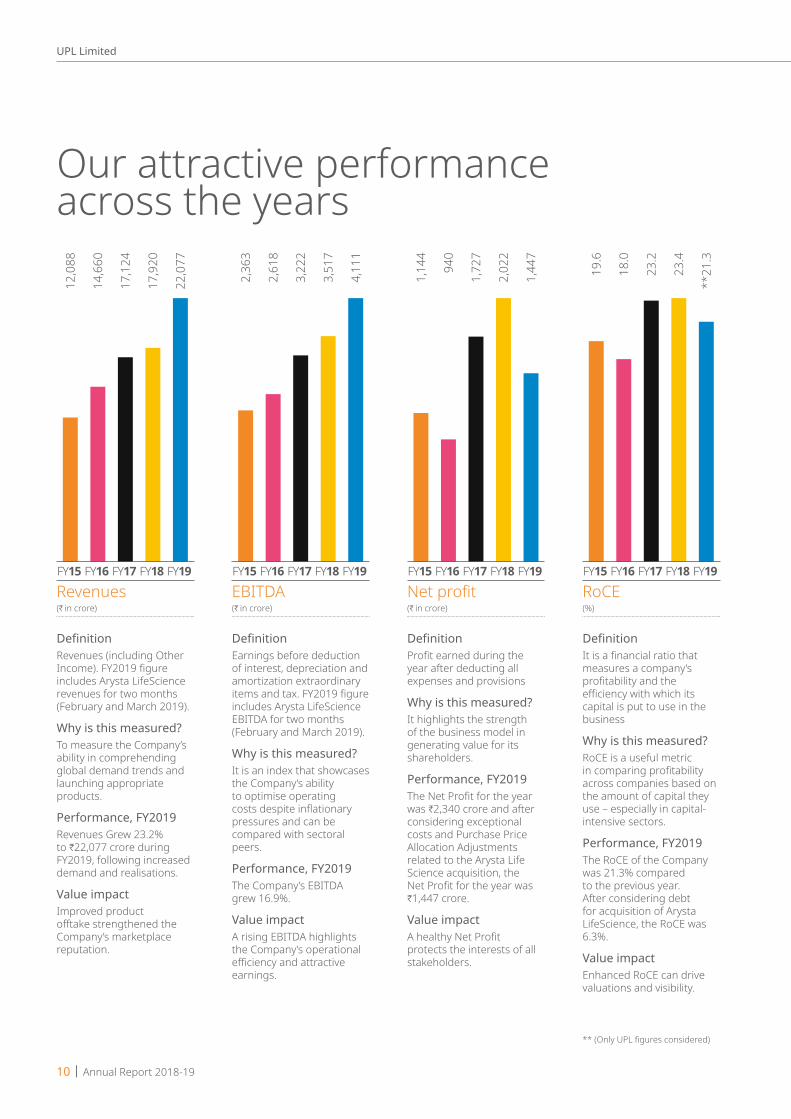
Our attractive performance across the years
Revenues(H in crore)
EBITDA(H in crore)
Netprofit(H in crore)
RoCE(%)
**(OnlyUPLfiguresconsidered)
DefinitionRevenues (including Other Income).FY2019figureincludes Arysta LifeScience revenues for two months (February and March 2019).
Why is this measured?To measure the Company’s ability in comprehending global demand trends and launching appropriate products.
Performance, FY2019Revenues Grew 23.2% to H22,077 crore during FY2019, following increased demand and realisations.
Value impactImproved product offtakestrengthenedtheCompany’s marketplace reputation.
DefinitionEarnings before deduction of interest, depreciation and amortization extraordinary itemsandtax.FY2019figureincludes Arysta LifeScience EBITDA for two months (February and March 2019).
Why is this measured?It is an index that showcases the Company’s ability to optimise operating costsdespiteinflationarypressures and can be compared with sectoral peers.
Performance, FY2019The Company’s EBITDA grew 16.9%.
Value impactA rising EBITDA highlights the Company’s operational efficiencyandattractiveearnings.
DefinitionProfitearnedduringtheyear after deducting all expenses and provisions
Why is this measured?It highlights the strength of the business model in generating value for its shareholders.
Performance, FY2019TheNetProfitfortheyearwas H2,340 crore and after considering exceptional costs and Purchase Price Allocation Adjustments related to the Arysta Life Science acquisition, the NetProfitfortheyearwasH1,447 crore.
Value impactAhealthyNetProfitprotects the interests of all stakeholders.
DefinitionItisafinancialratiothatmeasures a company’s profitabilityandtheefficiencywithwhichitscapital is put to use in the business
Why is this measured?RoCE is a useful metric incomparingprofitabilityacross companies based on the amount of capital they use – especially in capital-intensive sectors.
Performance, FY2019The RoCE of the Company was 21.3% compared to the previous year. After considering debt for acquisition of Arysta LifeScience, the RoCE was 6.3%.
Value impactEnhanced RoCE can drive valuations and visibility.
FY15 FY16 FY17 FY18
12,0
88
14,6
60
17,1
24
17,9
20
22,0
77
FY19 FY15 FY16 FY17 FY18
2,36
3
2,61
8
3,22
2
3,51
7
4,11
1
FY19 FY15 FY16 FY17 FY18
1,14
4
940
1,72
7
2,02
2
1,44
7
FY19 FY15 FY16 FY17 FY18
19.6
18.0
23.2
23.4
**21
.3
FY19
10 | Annual Report 2018-19
UPL Limited
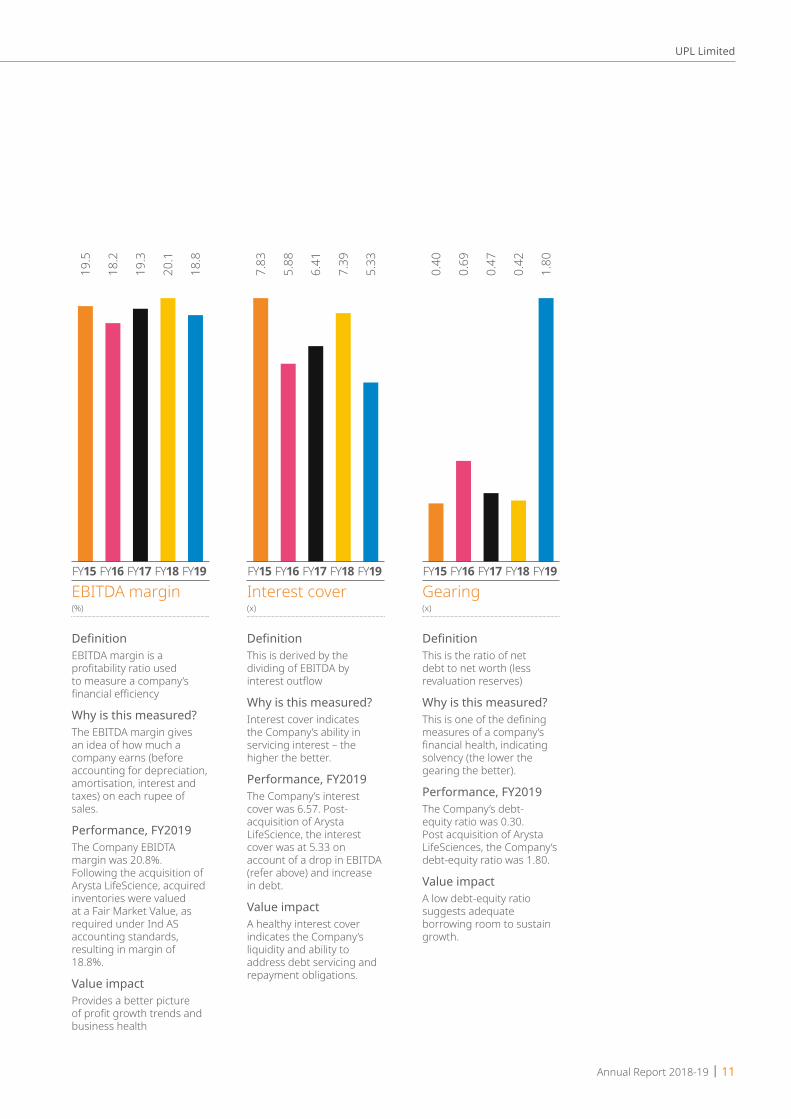
EBITDA margin(%)
Interest cover(x)
Gearing(x)
DefinitionEBITDA margin is a profitabilityratiousedto measure a company’s financialefficiency
Why is this measured?The EBITDA margin gives an idea of how much a company earns (before accounting for depreciation, amortisation, interest and taxes) on each rupee of sales.
Performance, FY2019The Company EBIDTA margin was 20.8%. Following the acquisition of Arysta LifeScience, acquired inventories were valued ataFairMarketValue,asrequired under Ind AS accounting standards, resulting in margin of 18.8%.
Value impactProvides a better picture ofprofitgrowthtrendsandbusiness health
DefinitionThis is derived by the dividing of EBITDA by interestoutflow
Why is this measured?Interest cover indicates the Company’s ability in servicing interest – the higher the better.
Performance, FY2019The Company’s interest cover was 6.57. Post-acquisition of Arysta LifeScience, the interest cover was at 5.33 on account of a drop in EBITDA (refer above) and increase in debt.
Value impactA healthy interest cover indicates the Company’s liquidity and ability to address debt servicing and repayment obligations.
DefinitionThis is the ratio of net debt to net worth (less revaluation reserves)
Why is this measured?Thisisoneofthedefiningmeasures of a company’s financialhealth,indicatingsolvency (the lower the gearing the better).
Performance, FY2019The Company’s debt-equity ratio was 0.30. Post acquisition of Arysta LifeSciences, the Company’s debt-equity ratio was 1.80.
Value impactA low debt-equity ratio suggests adequate borrowing room to sustain growth.
FY15 FY16 FY17 FY18
19.5
18.2
19.3
20.1
18.8
FY19 FY15 FY16 FY17 FY18
7.83
5.88
6.41
7.39
5.33
FY19 FY15 FY16 FY17 FY18
0.40
0.69
0.47
0.42
1.80
FY19
Annual Report 2018-19 | 11
UPL Limited

Chairman’s communiqué
12 | Annual Report 2018-19
UPL Limited

The year under review was one of the most memorable in UPL Limited’s history.The Company acquired Arysta LifeScience in an all-cash US$ 4.2 billion deal, which was completed within a record six months.Thishelpedthecombinedentityemergeasthefifth-largest crop protection products company in the world with combined sales of US$ 4.7 billion in FY2019 (trailing twelve months basis).
Explaining the acquisitionOver the last few years, the global crop protection products industry has undergone consolidation, warranting a greater need for scale across serious players.
Scale enhances economies of scale, ability to attractfreshtalent,abilitytolaunchdifferentiatedproducts and a stronger registration pipeline.
UPL, over the last 25 years, has made 40+ acquisitions and been successful in accelerating growthinaprofitablemanner.
The Arysta LifeScience acquisition represents the largest in our existence and possibly the most important. Arysta LifeScience (formed in 2001) is present in the proprietary post-patent space, a segment growing faster than the mainstream sector.
As the pace of discovery of new active ingredients has declined and an increasing
numberofproductsaregoingoff-patent,ArystaLifeScience possesses one of the world’s best supply chain systems as well as a broad products portfolio comprising herbicides, fungicides, insecticides, bio-solutions and seed treatment targeted at specialty crops and applications.
UPL’s landmark acquisition bodes well for a number of reasons.One, UPL has a strong manufacturing presence with plants in 34 global locations (26 for active ingredients / formulations and eight for seeds). On the other hand, Arysta’s asset-light model outsources most manufacturing operations (with formulation plants in 14 locations), electing to focus largely on marketing. The coming together of the companies will empower UPL to provide strong manufacturing support to Arysta on the one hand and leverage the latter’s deep distribution capability on the other – a win-win.
4.7(US$/billion) Combined sales of the Company (trailing twelve months basis)
34Global manufacturing locations of the Company
Annual Report 2018-19 | 13
UPL Limited

Two, Arysta possesses a proven expertise in the realm of certain proprietary molecules. Following the acquisition, UPL will gain access to these proprietary molecules.
Three, the two companies possess complementary portfolios: UPL’s crop protection products are go-to products for row crops, while Arysta’s products are preferred for the cultivation of specialty crops like horticulture. The complementary product portfolios of the two entities have helped create a company with a larger and relatively de-risked application presence. This was evident in the unconditional approval from 40+ anti-trust regulators, without requiring any portfolio divestments.
Four, the two companies also enjoy a presence in complementary markets. Arysta enjoys a strong presence in Eastern Europe and CIS countries; UPL possesses a similar presence in Western Europe and Latin America. Arysta enjoys a relatively large presence in Africa, Russia and Ukraine, where UPL is less conspicuous. Following the acquisition, UPL will be able to tap deeper into these territories.
Five, following the acquisition, UPL’s product registrations more than doubled - from ~6,150 to more than
12,400. Considering that it takes betweentwotofiveyearstogetaproduct registered, this acquisition has strengthened the Company’s long-term prospects.
Six, both companies complement each other in managing risks and financialresources.Oneoftheprimaryreasons for UPL’s success in Latin America has been its ability to manage market volatility, which holds true for Arysta’s performance in sub-Saharan Africa, where the Company dealt with currency and political risks. The coming together of UPL and Arysta provides a neat complement that will disproportionately strengthen the overall complement.
I am optimistic that this acquisition will broaden UPL’s positioning as a global company of Indian origin. More than 83% of UPL revenues are derived from global markets. UPL has recruited globally and locally, strengthening its terrain familiarity and the ability to take decisions closer to the ground. The result is that the Company reportedsustainableandprofitablegrowth despite monetary, political, climatic, regulatory and economic challenges.
Need for specialised solutionsFalling crop commodity prices over the past few years impacted the demand for crop protection products, resulting in industry consolidation and relevant counter-strategies. Urbanisation and climaticvagariesaffectedsectoralgrowth. Changing climatic conditions are increasing pest disturbance, increasing their population and enhancing their appetite, threatening global food security. The need of the hour is to provide specialised solutions that protect yields and minimize pre- and post-harvest losses.
Scientists have found that globally, pathogensandpestshaveaffectedcrop yields by 10 to 40% for major food crops like wheat, rice, maize, soybean and potato.(Source: University of California’s Division of Agriculture and Natural Resources / International Society for Plant Pathology).
12,400UPL’s product registrations post acquisition
>83%Revenues derived from global markets
OpenAgOur purpose is to create...
An open network for agriculture, activating connections across the world’s agriculture system.
Powering new levels of sustainable growth – for farmers, for producers, for customers and partners, for societies everywhere.
Ours is a world of no borders and no limits. Not a hard-wired linear value chain,butanagile,fluidnetworkofrelationshipsandinterplaysthatleapfrogtraditional boundaries and jump to new opportunities. Where connections are more personal and solutions more personalised.
From crop protection, to biosolutions, to innovative hybrid platforms and beyond… We create more choice, faster access, greater value and sustainability.
We open possibilities and shape the future in an interactive and synergistic way. Agriculture with no borders, growth for all. OpenAg.
14 | Annual Report 2018-19
UPL Limited

Besides, the global population of 7.6 billion is expected to grow to 8.6 billion by 2030 and 9.8 billion by 2050, making it imperative for companies like UPL to come up with specialised crop protection products with greater speed than ever.
This priority is also evident in India, one of the largest agricultural markets of the world. Around 70% of India’s rural households depend primarily on agriculture; around 86% of India’s farmers are categorised as ‘small and marginal’ and own less than 2 hectares, which is the equivalent oftwofootballfields.Anumberofmeasures were undertaken by the Government of India, including enhanced minimum support prices for a number of crops. The Central Government also aims to double farmers’ income by 2022 through measures like Pradhan Mantri Krishi
UPL’s acquisition of Arysta is value-accretiveParameters UPL Arysta Combined entityMarket positioning Seventh-largest agricultural
solutions player with a focus on post-patent products
Tenth-largest agricultural solutions player with a focus on specialty and niche markets
Fifth-largest agricultural solutions player with a healthy mix of product offeringsforrowcropsandspecialty crops
Key geographies India, Western Europe, the US and Latin America
Eastern Europe, Russia, the Middle East, Africa and Latin America
Stronger presence in Latin America, Europe and the rest of the world
Product registrations >6,500 >5,800 >12,400Manufacturing strategy Low-cost manufacturing of
complex active ingredients and formulations
Asset-light model with an emphasis on outsourcing
Blend of in-house manufacturing and outsourcing capabilities
Manufacturing Facility locations
34 14 48
Product portfolio Seeds to post-harvest BioSolutions, seed treatment and late-stage R&D-led pipeline of differentiatedproducts
Comprehensive product portfolio addressing a wide range of crops
Crop focus Corn, soybean, cotton, rice, fruits, vegetables and sugar cane
Fruits, vegetables, cotton, sugarcane,sunflower,cacaoand cereals
Wider basket of crops across all major agricultural regions across the world
Product development Focus on innovative formulations, combinations, mixtures and label extensions
Late-stage product development capabilities and strong ties with innovators of active ingredients
Late-stage product development capabilities combined with innovative formulations, mixtures and combinations, marketed strategically
Sinchayee Yojana, Pradhan Mantri Fasal Bima Yojana and National Food Security Mission, among others.
At UPL, we believe that crop protection products addressing pre- and post-harvest losses play a pivotal role. The Indian Council of Agricultural Research estimated that around 30%-35% of the annual crop yield in India is lost to pests. India’s pesticide consumption is one of the lowest in the world; the average hectare in India consumes just 0.6 kilograms of pesticide compared to 5-7 kilograms per hectare in the US and 11-12 kilograms per hectare in Japan, a large headroom. We believe that the sector has an important role to play at a time when the country is engaged in strengthening farmers’ income.
OverviewFollowing the acquisition of Arysta LifeScience, UPL has evolved from being just a product-based company to a solution-oriented organisation covering all major crops.
The new UPL is attractively positioned to address the existing and emerging needs of farmers across a wider global footprint with a larger basket of products.
We believe that the new UPL will enhance value for its stakeholders. I thank our large family of stakeholders for their trust and assure that we will continue to enhance value for our Company in the foreseeable future.
RD Shroff,Chairman
Annual Report 2018-19 | 15
UPL Limited
16 | Annual Report 2018-19
UPL Limited
Message from the Global CEO of UPL LimitedDear shareholders,
Past 50 yearsAt our recent Flag Day celebration, where UPL marked 100 days since the successful acquisition of Arysta LifeScience, my family and I had the opportunity to reflectonUPL’sincrediblejourneyoverthepast50years.In 1969, we began producing red phosphorus – a bold move at a time when nobody thought it possible to do so in India.With hard work, perseverance and a dedication to doing things better, the UPL team has grown from a small operationinVapi,intotheleadingagri-inputscompanyin India and a globally respected player.I attribute our success to never losing sight of our customers–growers,smallandlarge,whosedailyeffortsbring us the food we so often take for granted. This lies at the heart of our commitment to OpenAg – our philosophy for the future of UPL.
Annual Report 2018-19 | 17
UPL Limited

OpenAccessUPL has always believed in supporting local farms and communities – no matter how big or small or what crops they grow – by giving them access to the best products available. This is a part of our commitment to ensure food security for all, irrespective of which corner of the world people reside in. We findourselvesequallyathomein emerging economies serving a small cocoa farmer in Africa to citrus cooperatives in Brazil to large corn farmers in the American Mid-West.
OpenSolutionsWe can serve all these farmers because of the range of technologies UPL can bring to bear on the challenges they face. We help farmers get their crops established, ensuring the germination and nurturing of their precious seed stock. We help farmers deal with the challenges of climate change, to reduce irrigation needs and plant abiotic stresses. Sometimes this means we help withtheeffectivemanagementof weeds, diseases and other pests that have become resistant to old solutions. At other times, we help with crop finishingandpost-harvestsolutions, to maximise quality and yield while minimising waste in the supply chain. Growers look to UPL to help them do their job, and we relish thechallengeoffindingbetterways to assist them, whether by providing time-tested advice on how to improve farm productivity to using precision AG technology to give them the best data on what they need to dointheirfields.
OpenManufacturingWe believe in connecting UPL with diverse communities and interests worldwide and that these connections create extraordinary value.
We now operate globally with almost 50 active ingredient manufacturing and formulation facilities spread around the world and provide supply reliability through our multi-source strategy. We continue to maintain stringent safety standards and improve the sustainability of our operations, reducing our carbon emissions, water consumption, waste water discharge and solid waste to minimise our environmental footprint.
OpenInnovationWe are engaged in innovation, conducting research and development across more than 25 R&D facilities in four continents and collaborating with leading commercial partners,scientificinstitutionsand universities to continuously understand and meet our customers’ future needs. We are proud to have become a market leader in bringing new biological solutions to the market – helping growers make great strides in biocontrol as well as biostimulation to improve yield and input efficiency–allofwhichiskey for providing even more sustainable options to farmers facingdifferentchallenges.
We are engaged in innovation, conducting research and development across more than 25 R&D facilities in four continents and collaborating with leading commercial partners, scientific institutions and universities to continuously understand and meet our customers’ future needs
18 | Annual Report 2018-19
UPL Limited

OpenHeartsWe also see our mission as contributing to social progress, and actively work to advance the well-being of people everywhere. I am particularly proud of the work we have done in supporting malaria eradicationeffortsinAfrica,supporting rural education projects in India, and our work to eliminate all forms of child labour in seed supplier farms.
UPL’s lifelong vision and commitments to ensure food security for all, supporting local farmers and communities in the process. It is as relevant today as it has ever been.
FY2019 performanceIn FY2019, we delivered revenues of H22,077 crore, EBITDA of H4,111 crore and aNetProfitofH1,447 crore. For the sake of clarity, this includesArystafiguresfortwomonths, as the acquisition was completed on February 1, 2019.IftheArystafiguresarenot considered, UPL posted strong growth of 14% (in revenues), growth in EBITDA of 18% and growth of 10% innetprofit.Iamenthusedthat UPL continues to deliver on its promise of sustainable andprofitablegrowth.Inthecoming years, we will continue to focus on the revenue and cost synergies that we have targeted to achieve, ensuring that the combined Company will be an outperformer in the global agri-inputs space.
Looking to the next 50 yearsEven as we reinvent our business for a new phase of growth–andfirmlyestablishUPL as a global leader in sustainable agriculture and food systems – we take time to think deeply about our Company, our culture and the values that guide our behaviour.
We have got to where we are today because we were guided by a good value system. Similarly, our future success will be routed in us remaining committed to our values, while also being a leader in doing thingsbetteranddifferently.Wehavethereforecodifiedour values, to ensure that we measure ourselves by how we live up to them each day. These are:
Our vision is for UPL to be an icon for growth, technology, and innovation. We will only achieve this by living our values and meeting a standard of behaviour that is truly world-class.
UPL has never compromised on quality. We started as young and idealistic, and remain so. We are always willing to try new things and to see if we can do things better. With the help of our customers, our employees, and our shareholders, we will continue to do so.
Thefireofmyfatherandmother’s bold decision 50 years ago still burns bright within us all. It motivates us to continue to be bold in our ambitions for what is possible, and how UPL can continue to change the world.
I would like to thank all shareholders, other stakeholders and employees for their support over the past 50 years to make this possible.
Thank you
Jai ShroffGlobal Chief Executive Officer
Always human
Nothing’s impossible
Win-Win-Win
One team, one focus
Agile
Keep it simple, make it fun
Annual Report 2018-19 | 19
UPL Limited

Message from the Global COO
Dear shareholders,The year 2018-19 a strategically decisive one in UPL’s existence. In July 2018, the Company announced the acquisition of Arysta LifeScience. Global regulatory approvals were obtained in just six months, with the acquisition closing on February 1, 2019. Following the transaction, UPL’s combined sales (on a trailing twelve-month basis) grew from US$ 2.7 billion to US$ 4.7 billion.
With the combination of UPL and Arysta we have created a formidable global player in agri-inputs, a tier-one company with the scale to win in a consolidating industry landscape.
Both businesses are geographically complementary: UPL enjoys a strong presence in India, the Americas and Western Europe, while Arysta is a market leader in Latin America, South and Eastern Europe, Africa and Japan. The new UPL is a global player with a particularly strong position in the emerging markets. Up to 80% of the increase in agricultural
20 | Annual Report 2018-19
UPL Limited
production in the next 30 years is expected to come from the emerging markets.
UPL’s strengths lie in manufacturing and differentiatedpost-patentproducts, while Arysta focused on specialty products, deep marketing and R&D capabilities. Since closing, UPL has one of the broadest product portfolios in the industry, comprising 12,400+ product registrations globally. We can now provide complete solutions from seed to post-harvest in most key crops and key markets, retaining our leading position in the rapidly growing biosolutions segment. To cement our role as a solution provider for sustainable farming, UPL is building competences to expand the use of digital services and processes. Investments in artificialintelligencetoolstopredict customer needs with higher accuracy, and using robotic sensors to access real-time,on-fieldfarmerdata,aresomeexamplesofthiseffort.
Looking forward, we plan to take advantage of the numerous synergies in revenues and costs. Through cross-selling and an increased customer presence we expect to generate more than $300m in top-line synergies in three years. Cost savings in raw materials, personnel and fixedmanufacturingexpensesare projected to reach more than $200m in two years. We plan to focus deeper on operationalefficiency,bothinmanufacturing, working capital
management and R&D, where we strive to be the industry benchmark.
From the beginning, we knew that the most important decision we would take was building the right team that would take UPL to the next level. Soon after closing, we announced the new leadership team. The best leaders from both legacy companies were selected and empowered to drive the integration. In the initial stage, the team spent a great time listening to employees, customers and partners. We examined the underlying strengths of both organisations to identify the core values of the New UPL. Agility, a ‘nothing is impossible’ mindset, team work, a human approach to leadership, special emphasis on win-win-win partnerships and a strong growth-orientation, were among the principles we highlighted.
Farmers around the world are seekingsolutionstooffsetthe impact of climate change; consumers are asking for
healthier food products and societies are expecting a drastic reduction in the environmental impact of farming. What is our role in society? What motivates us to give our best every day? Where is our industry heading?
Reflectingonthesefundamental questions gave birth to our new purpose: OpenAg.
OpenAg is an open agriculture network for the world, feeding sustainable growth for all. Through OpenAg, we aim to power new levels of sustainable growthforthebenefitoftheentire eco-system comprising farmers, food processors, customers, partners and society at large.
No limits, no borders. With this new purpose, the new UPL emerges as a key contributor to solutions for some of society’s most important challenges.
Exciting times lie ahead.
Diego Lopez Casanello Global Chief Operating Officer
UPL-Present across the value chainSeeds: High-yielding seeds enhance food security.
Crop protection products: Fight pests, protecting harvests.
Soil enhancement technologies: Innovative soil enhancement technologiesoffsetinconsistentwatersupplyeffectsduringcropcycles.
Post-harvest solutions: Post-harvest solutions prevent grain and fruit damage during transportation and storage.
Farmer engagement initiatives: Farmer engagement comprises value-added services to educate farmers and help them address everyday challenges.
Annual Report 2018-19 | 21
UPL Limited

Today’s UPL.A convergence of synergies across geographies, crops and products
22 | Annual Report 2018-19
UPL Limited

UPL � Stronger presence in India, Americas
and Western Europe
� Industry-leading manufacturing capabilities
� Diversifiedportfolioacrossthevaluechain
� Strong registration and product development capabilities
� Robust Balance Sheet and track record of more than 40 successful mergers and acquisitions** UPL mix as of March 31, 2018; Arysta mix as of December 31, 2017
Product mixGeographic mix
Latin America North America Europe RoW
33%
18%13%
36%
Herbicides Fungicides Insecticides Others
29%
26%25%
20%
Arysta � Stronger presence in Africa, Russia
and Eastern Europe
� Unique asset-light model, underscoring high capital utilisation efficiency
� Specialisation in fast-growing market segments and specialty crops
� Proven R&D capabilities
Product mixGeographic mix
Latin America North America Europe RoW
36%
13%39%
12%
Herbicides Fungicides Insecticides Bio solutions Others
34%
17%30%
11%8%
‘New’ UPL � Agloballeaderinthefieldof
agricultural solutions
� R&D-focused and vertically-integrated organisation
� Healthy mix of high-value crops and high-growth geographies
� Well-positioned to achieve sustainable growth
� Convergence of synergistic traits
� >12,400 registrations
� Ability to come up with innovative products in a customer-oriented manner** UPL and Arysta adjusted as of March 31, 2018
Product mixGeographic mix
Latin America North America Europe RoW
34%
16%24%
26%
Herbicides Fungicides Insecticides Bio solutions Others
31%
23%27%
16%3%
Annual Report 2018-19 | 23
UPL Limited

1Competence driver
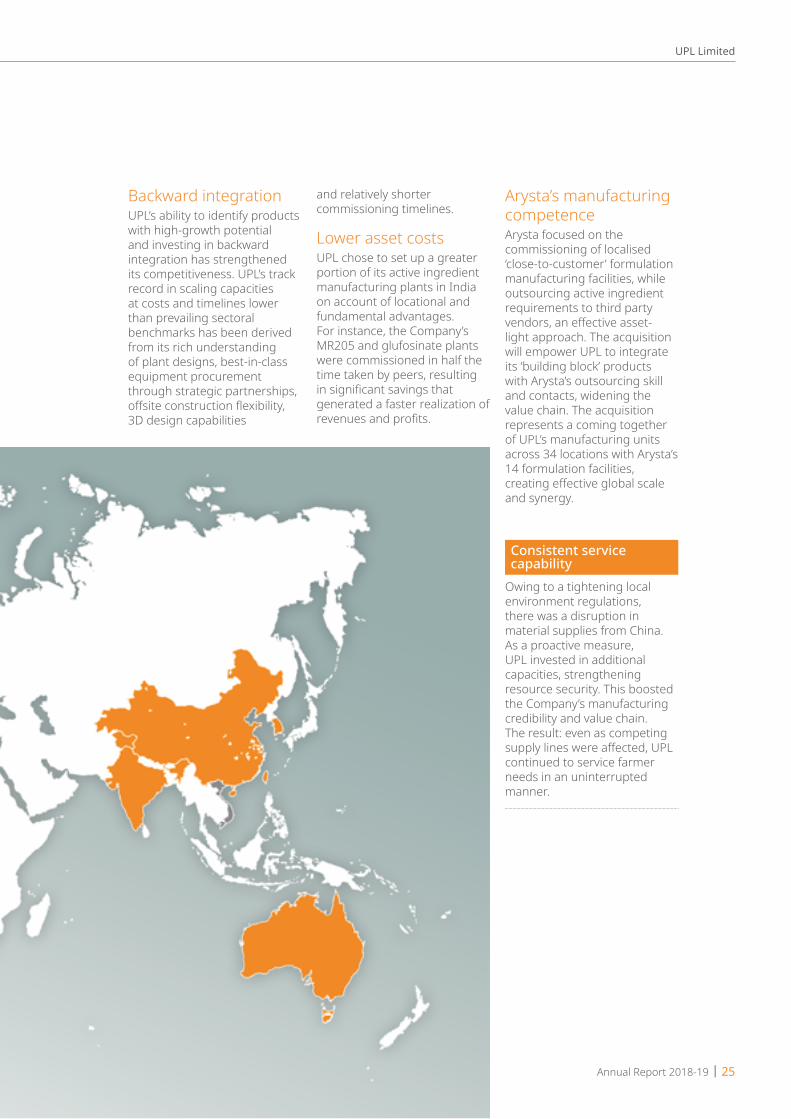
UPL’s best-in-class manufacturing capabilitiesOver thepastfivedecades,UPLhasestablishedagrowingglobalpresence on the back of manufacturing facilities in 48 locations (national and international) engaged in the production of active ingredients and formulations.The Company invested extensively in backward integration, resulting in a significantcostadvantageoverinternationalpeers,strengtheningqualitymanagement and reducing its dependence on just a few vendors.
UPL’s presence Arysta’s presence UPL and Arysta’s presence
24 | Annual Report 2018-19
UPL Limited
Consistent service capability
Owing to a tightening local environment regulations, there was a disruption in material supplies from China. As a proactive measure, UPL invested in additional capacities, strengthening resource security. This boosted the Company’s manufacturing credibility and value chain. The result: even as competing supplylineswereaffected,UPLcontinued to service farmer needs in an uninterrupted manner.
Backward integrationUPL’s ability to identify products with high-growth potential and investing in backward integration has strengthened its competitiveness. UPL’s track record in scaling capacities at costs and timelines lower than prevailing sectoral benchmarks has been derived from its rich understanding of plant designs, best-in-class equipment procurement through strategic partnerships, offsiteconstructionflexibility,3D design capabilities
and relatively shorter commissioning timelines.
Lower asset costsUPL chose to set up a greater portion of its active ingredient manufacturing plants in India on account of locational and fundamental advantages. For instance, the Company’s MR205 and glufosinate plants were commissioned in half the time taken by peers, resulting insignificantsavingsthatgenerated a faster realization of revenuesandprofits.
Arysta’s manufacturing competenceArysta focused on the commissioning of localised ‘close-to-customer’ formulation manufacturing facilities, while outsourcing active ingredient requirements to third party vendors,aneffectiveasset-light approach. The acquisition will empower UPL to integrate its ‘building block’ products with Arysta’s outsourcing skill and contacts, widening the value chain. The acquisition represents a coming together of UPL’s manufacturing units across 34 locations with Arysta’s 14 formulation facilities, creatingeffectiveglobalscaleand synergy.
Annual Report 2018-19 | 25
UPL Limited

2Competence driver
UPL. Deepening its presence in complementary marketsThe acquisition of Arysta is expected to enhance overall value for UPL across the foreseeable future.Arysta will deepen UPL’s presence in Europe and the US, which are challenging markets to enter on account of strict regulatory frameworks (Europe) and consolidated distribution channels (US). Besides, Arysta enjoys a meaningful presence in Africa, Eastern Europe and Japan, while UPL is the market leader in India. These complementary markets will widen theCompany’sgeographicfootprintgloballyandsignificantlyenhancerevenues.In overlapping markets like Latin America (contributing 30%+ of sales for both too) there is a complementarity at work. The two entities focus on differentcrops(UPLonrowcropsandArystaonspecialtycrops),leveragingdifferentdistributionchannels(co-operatives/smalldealersforArystaandlarge growers / dealers for UPL).The result is that the acquisition of Arysta will empower UPL to deepen its presence in new segments. The minimal overlap was validated by 42 countriesgreen-flaggingtheacquisitionfromananti-truststandpointinjustsix months. The result is that UPL more than doubled product registrations from ~6,150+ to ~12,400, widening its crop-cum-product portfolio and deepening its presence in sub-scale and existing geographies.
26 | Annual Report 2018-19
UPL Limited
Strengthening ties with Brazilian farmersThe three principal distribution channels in Brazil comprise agricultural co-operatives, distributors of inputs (or dealers) and direct sale to large farm operations. Following consolidation in the mid-2000s, dealers represent ~60% of the sales of agricultural inputs, while the remainder is sold through co-operatives and direct sale to large farmers. In addition to traditional channels, UPL strengthened its Brazil presence through direct sales to large growers. On the other hand, Arysta strengthened its presence through co-operatives.
UPL and Arysta enjoy complementary crop specialisations. While UPL’s products are preferred by cotton and soybean farmers, Arysta is respected for corn applications. UPL and Arysta balance each other when it comes to fruits and vegetables in Latin America: while UPL’s strength lies in citrus, Arysta’s lies in sugarcane.
By acquiring Arysta, which offersspecialtyapplicationsaswellascost-effectiveproducts,UPL will now be empowered to forge enduring engagements with customers, resulting in a superior value proposition.
Growing stronger together in North AmericaUPL’s objective to reinforce its North America footprint will now be catalysed by Arysta’s strong presence in North American presence (especially in the Midwest where corn is a key crop and in Canada’s wheat belt). In both regions, Arysta enjoys a larger sales team than UPL. Supplementing Arysta’s dominance in wheat, UPL is the go-to brand for rice farmers (through subsidiary RiceCo) as well as fruit and vegetables (predominantly potato),creatinganeffectivecomplement.
In the last few years, UPL has sought to grow its presence in the American Midwest, a region where row crops (corn and soybean) are predominant. The Company positioned itself to address opportunities in the resistance management space with a portfolio of herbicides and fungicides. It has recently launched two brands of the herbicide Glufosinate for soybean and corn to plug these gaps. Glufosinate is the potential alternative to Glyphosate (~US$ 5 billion market globally) as Glyphosate-resistant weeds are increasing.
UPL’s cost-competitive business model, coupled with Arysta’s deep marketing capabilities, should generate sustainable growth in revenues, market share and margins.
Extending into Europe, Africa and CIS countriesArysta enjoys a strong presence in Eastern Europe, Africa and CIS. Deep agricultural fundamentals enabled the region to emerge as a leading producer and exporter of wheat,barley,corn,sunflower,winter oilseed rape, sugar beet and vegetables.
UPL enjoys a longstanding competence in crops like vines, sugar beet and potato; Arysta’s portfolio is geared towards cereals, the largest crop in Europe, rapeseed oil and some specialty fruit crops.
In Africa, Arysta is a market leader in South Africa, Ivory Coast, Burkina Faso and Mozambique, now a competitive advantage for UPL. Arysta’s strong presence in the Central and Eastern Europe (Poland and Hungary) allows UPL to venture into this untapped geography.
By acquiring Arysta, which offers specialty applications as well as cost-effective products, UPL will now be empowered to forge enduring engagements with customers resulting in a superior value proposition.
Annual Report 2018-19 | 27
UPL Limited

3Competence driver
UPL.Offeringfarmersolutions through an integrated portfolioUPL’s product portfolio comprises several post-patent active ingredients. The growth of the Company in these segments has been driven by formulations, mixtures and combination products manufactured at its manufacturing facilities at competitive costs.
UPL+Arysta’s integrated portfolio of crop protection products will target key crops like soybean, corn, fruits and vegetables and cerealsUPL’s crop exposure
Arysta’s crop exposure
Combined entity Key geographies
Corn Corn Corn The US and BrazilSoybean Soybean Soybean The US and BrazilFruits and vegetables
Fruit and vegetables Fruit and vegetables Europe, Brazil and the US
Cotton Cereals Cereals and cotton Europe and BrazilRice Cocoa Rice and cocoa Asia and BrazilSugar beet Sugarcane Sugar beet and sugar cane Europe, Asia and BrazilTree nuts and aquatics
Sunflower Tree nuts, aquatics and Sunflower
North America
Arysta’s portfolio comprises proprietary post-patent and generic molecules. The Company’s strategy is to focus on niche active ingredients and develop R&D-driven formulations and combinations, which address emerging issues faced by agriculturalists. It partnered research-focused companies in Japan, entering into in-licensing arrangements for innovative molecules. Arysta develops proprietary combinations using these molecules in addition to acquisitions strengthening its product pipeline.
Thedifferentiatedproductportfolio of both companies indicates a minimal molecule overlap. Arysta enjoys a strong bio-solutions product portfolio, where UPL dose not posses an adequate presence. The acquisition helped plug gaps and create an integrated portfolio of crop protection products.
UPL’s portfolio has been reinforced with Arysta’s strong presence in the BioSolutions segment. BioSolutions provide novel solutions through a range of biological stimulants,
soil health and foliar nutrition products to help farmers access a better quality output. These unique technologies provide abio-stimulationeffectandimproved nutrition, resulting in healthy plant growth, better yield, quality and tolerance to biotic and abiotic stresses. They help in and Integrated Pest Management (IPM) approach with a wide range of innovative solutions to make farming more sustainableandprofitable.
28 | Annual Report 2018-19
UPL Limited

4Competence driver
UPL. Leverages focused innovation to reinforce status as a global leaderOver the years, UPL has consistently invested in research and innovation.The result is that the Company has evolved from being a generic player into a branded post-patent player with an extensive presence across the value-chain.
Arysta’s portfolio enhances UPL valueUPL Arysta Combined entity
Product development and registration
� Greater focus on innovative formulations, combinations, mixtures and label extensions
� Expertise in securing product registrations, across geographies
� Late-stage development capabilities and access to J-makers
� Strong relationships with innovators of active ingredients
� Access to active ingredients and J-makers
� Late-stage product development of innovative formulations, mixtures and combinations
The Company progressively diversifiedtoemergeasaholistic solutions provider. Consider this: UPL launched 544productsinfiveyearsandrevenues from these products accounted for a 24% share of the Company’s revenues in 2018-19.
Arysta’s portfolio of Bio-Solutions includes more than 700 bio-stimulants, innovative nutrition and bio-control
products. Its portfolio of Bio-Solutions and seed treatment products is complementary toUPL.Arystaisrankedfifthglobally when it comes to seed treatment products and is the fifthlargestinbiocontrol.InBio-stimulants, it ranks second. ArystapossesssignificantR&D capabilities in biocontrol as it requires lower capex than agrochemical active ingredient discovery. It is also associated with a lower rate of
discovery failure since most of the ingredients are naturally-occurring.
Thisdifferentiatedportfolioenhances value for UPL, strengthening its commitment to invest in cutting-edge technologies and solutions for farmers,andtohelpthemfightadversities.
Annual Report 2018-19 | 29
UPL Limited

5Competence driver
The acquisition. Uniting two entities with credible pedigreeUPL was a strong global player with a team size of 7,100+ employees prior to the acquisition. Arysta’s team strength was 3,200+ across the markets of its presence.
The acquisition resulted in a joint synergy related to values and demonstrated performance.
Following the acquisition, UPL segregated its global presence into seven regions; four of which are headed by managers
from Arysta. This ensured leadership participation from both organisations and wider responsibility-sharing.
Following the acquisition announcement, senior team members from both companies chalked out a cultural
integration plan. This catalysed regulatory approvals from 42 countries and accelerated operations as a cohesive unit, eliminating gestation.
Jai ShroffCEO
Diego CasanelloCOO – Crop Protection
Paula PintoGlobal Head – Strategic Alliance and B2B
Hildo BrillemanRegion Head – Europe
Jagdish NainwalRegion Head – LATAM
Farokh N HilloChiefCommercialOfficer
Vicente GongoraRegion Head – North America
Marcel DreyerRegion Head – AMEANZ
Rico ChristensenChiefMarketingOfficer
Sameer TandonRegion Head – India
Fabio TorrettaRegion Head – Brazil
Hisaya KobayashiRegion Head – Asia
30 | Annual Report 2018-19
UPL Limited

The world will need more food…More mouths to feed
7.1 Global population in 2019 (billion)
Arable land (developing countries)
1,900 Per person, 2000, (sq m)
9 Global population in 2050 (billion)
1,400 Per person, 2050, (sq m)
Growing urbanisation
55Percentage of global urban population, 2018
Water scarcity
40%ofworldpopulationtosufferwater scarcity, 2050
68 Percentage of global urban population, 2050
Growing animal protein consumption
300 Global meat production excluding eggs, 2013 (million MT)
455 Global meat production excluding eggs and seafood, 2050 (million MT)
Global economic growth
130% global GDP growth, 2016 to 2050
UPL’s propositionOpenAg
An open agriculture network that ensures sustainable growth for all.No limits, no borders.
People Customer- centricity
Smart R&D Operational and manufacturing excellence
Technology partnerships and mergers and acquisitions
Prudentfinancialmanagement
Increased productivity emphasis
1.66Agricultural productivity growth %, 2017
1.75Required annual agricultural growth % till 2050
Arable land (industrialised countries)
4,800 Per person, 2000 (sq m)
4,000 Per person, 2050 (sq m)
Annual Report 2018-19 | 31
UPL Limited
Sectoral context
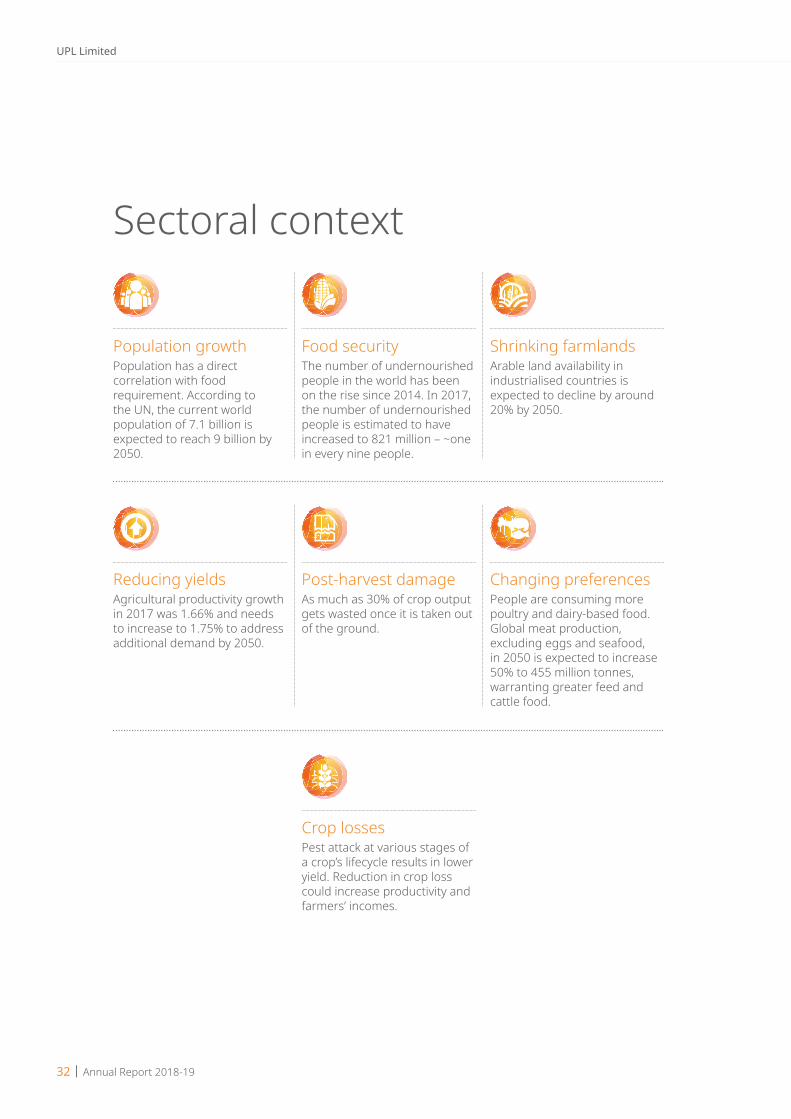
Population growthPopulation has a direct correlation with food requirement. According to the UN, the current world population of 7.1 billion is expected to reach 9 billion by 2050.
Reducing yieldsAgricultural productivity growth in 2017 was 1.66% and needs to increase to 1.75% to address additional demand by 2050.
Food securityThe number of undernourished people in the world has been on the rise since 2014. In 2017, the number of undernourished people is estimated to have increased to 821 million – ~one in every nine people.
Post-harvest damageAs much as 30% of crop output gets wasted once it is taken out of the ground.
Crop lossesPest attack at various stages of a crop’s lifecycle results in lower yield. Reduction in crop loss could increase productivity and farmers’ incomes.
Shrinking farmlandsArable land availability in industrialised countries is expected to decline by around 20% by 2050.
Changing preferencesPeople are consuming more poultry and dairy-based food. Global meat production, excluding eggs and seafood, in 2050 is expected to increase 50% to 455 million tonnes, warranting greater feed and cattle food.
32 | Annual Report 2018-19
UPL Limited

UPL’s contrarian approachMost sectoral players chose to be regionalUPL increased its footprint through a presence in more than 138 countries
Most sectoral players chose to source raw materials from third partiesUPL focused on backward integration comprising key raw material manufacturing and power generation
Most sectoral players focused on producing pesticidesUPL invested in business diversification to emerge as a one-stop crop solution Company
Most sectoral players sought short-term business gainsUPL focused on a long-term business sustainability by strengthening its fundamentals
Most sectoral players were engaged in bottomline enhancementUPL focused on enhancing value for all stakeholders
Most sectoral players prioritised existing productsUPL focused on continuous R&D investment in to introduce innovative products
Most sectoral players were product-centricUPL chose to be farmer-centric
Most sectoral players were reactive in the face of stiffening environmental regulationsUPL proactively undertook environmental conservation initiatives
Most sectoral players neglected the importance of workplace safetyUPL invested in guaranteeing workplace safety and reported TRFR of 0.38, well below the global TRFR standard
Annual Report 2018-19 | 33
UPL Limited

UPL’s focus areas
FarmersThe vast majority of farmers across the world are small holders, with just a hectare or two. Farming accounts for a major source of income for many across the world. UPL has focused on improving farm prosperity by introducing products that could help resist pest attacks and enhance productivity.
EnvironmentUPL has focused intensively on reducing the environmental impact of agriculture through new technologies and simple measures such as helping small farmers in growing the right crop in the right place. UPL’s drought mitigation technology (Zeba) provides significantsavingsforfarmers,reducing water consumption, and storing water in the ground to keep crops hydrated during drought. Since 2015-16, CO2 emissions per tonne of production reduced by 13%, waste disposal per tonne of production reduced by 22%, water consumption per tonne of production reduced by 3% and waste water discharge per tonne of production reduced by 11%. We mitigated the product mix change impact and reduced our environment footprint in our global operations.
PeopleThe Company’s pool of knowledgeable sectoral experts across areas (chemical engineering, project management, operations, farmer engagement, supply chain management, quality control, marketing, strategic direction andfinancialmanagement)hasenabled it to stay ahead of the curve.
InnovationThe Company has established a reputation for being a pioneer intheindustry.Itwasthefirsttomanufacture groundbreaking products like Glufosinate, Pendimethalin and Zeba among others.
R&DAgriculture needs to adapt and change to the pace of our evolving world to fulfillitspromisetohumankind.UPL’sresearch and development aims to provide comprehensive solutions for the unique needs of modern customers. The Company has invested H1,580 crore in R&D over the past four years, which has yielded gains in terms of market share and farmer prosperity. Itfiledover500patentsgloballyforproducts and processes.
TechnologyUPL embraced cutting-edge technologies to enhance operating efficiency.TheCompanywasamongthefirstintheindustrytooptimisedoutput quality and minimize leakage.
34 | Annual Report 2018-19
UPL Limited

The key attributes
associated with UPL
Leadership
Diversified business
Mix of high-value crops and
geographies
Manufacturing expertise
Financial prudence
Brand recall
Governance
First chemical company in the world to implement the OH radical technology for waste water treatment in its Colombia plant
01
First to develop micro-encapsulated seed treatment
02
First to bring emulsion-in-water acaricides
03
First to come up with commercial, flowableencapsulation of a solid active ingredient
04
First crop protection products company to be a part of the Bellwether Index on Nifty 50
05
UPL. First among equals
Annual Report 2018-19 | 35
UPL Limited

UPL’s strategy
Strategic focus
Key enablers
Material issues addressed
Capital impacted
Innovate and excel
Nurturing a culture of process innovation and product excellence, reflectedinthenumber of patents and registrations.
Used cutting-edge technology to manufacture differentiatedproducts
Manufactured, Intellectual and Financial
Cost advantage
Continuous procedural improvement and backward integration helped streamline processes and enhanced cost-competitiveness.
Automated processes, shrunk carbon footprint and reduced costs
Financial and Social
36 | Annual Report 2018-19
UPL Limited

Supplier of choice
Emerged as a supplier of choice on the back of our quality- driven approach and positioned as a one-stop provider of crop protection solutions.
Ensured last-mile reach by strengthening distribution channels
Intellectual, Manufactured and Social
Robust people practices
Facilitated personal and professional development by creating a meritocracy. The Company strives to achieve the highest levels of engagement, aided by numerous initiatives.
Improved employee engagement and transparency
Intellectual and Human
Responsible citizenship
Engaged in community-strengthening initiatives in the realms of education, health and social welfare.
Fostered community development and enhanced prosperity
Social and Natural
Focus on value creation
Graduated from the manufacturer of products to providing holistic solutions to agriculturalists. UPL has become a greater force in the industry by acquiring Arysta LifeScience in FY2019.
Addressed customer needseffectively
Intellectual, Manufactured and Social
Annual Report 2018-19 | 37
UPL Limited

UPL’s performanceUPL’s performance has been the result of a convergence of various forward-looking intentions, initiatives and investments.
ValuecreatedFinancial capital Manufacturing capital
22,077Revenues (H in crore)
48Manufacturing locations
28.42Earnings per share (H)
21.3RoCE (%)
Revenue growthUPL’s revenues have grown at a CAGRof15%overthelastfiveyears leading to H22,077 crore in FY2019.
People managementUPL reported a high people retention rate, not only on an overall basis but also at the senior managerial level
Operational consolidationUPL consolidated its strengths with 25+ acquisitions over the past decade.
Global footprintUPL widened its footprint to more than 138 countries in FY2019.
Manufacturing facilitiesThe Company’s manufacturing capacity grew by 25% from FY2015 to FY2019.
Vertical integrationUPL vertically integrated its business by manufacturing key raw materials reducing third-party dependence.
Corporate governanceUPL’s Board comprised 10 members with diverse industry experiences, strengthening the Company’s managerial bandwidth.
Product registrationsUPL’s product registrations grewby2,546overthepastfiveyears.
38 | Annual Report 2018-19
UPL Limited

Human capital Natural capital
10,300+Number of employees
13Reduction in carbon footprint from baseline 2015-16 (%)
3Reduction in water consumption per tonne of production (%)
2,095Employee cost during FY2019 (H in crore)
Financial capitalThefinancialresourcesthatwe seek are based on funds we mobilise from investors, promoters,banksandfinancialinstitutions in the form of net worth, internal accruals or debt.
Intellectual capitalThe Company’s focus on cost optimisation and operational excellence, as well as its repository of proprietary knowledge account for its intellectual resources.
Manufactured capitalThe Company’s manufacturing infrastructure, technologies and equipment constitute its manufactured capital. The proximity of the Company’s plants to key raw materials is integral to its competence.
Social and relationship capitalThe Company’s relationships with communities and partners (vendors and customers) influenceitsroleasaresponsible corporate citizen.
Human capitalThe Company’s management, employees and contractual workers form an integral part of its workforce, with their cumulative experience and competence, enhancing value.
UPL’s value-accretive resources
Influencersofbusinessfundamentals
Vision, mission and
values
Corporate governance
Code of conduct
Annual Report 2018-19 | 39
UPL Limited

Key developments, FY2019 � Grew revenues by 7% despite excess
inventory in the market place
� Introduced 22 herbicides, 17 fungicides, 23 insecticides, 3 seed treatment and 10 adjacent technology products
Optimism � Government initiatives are aimed
at enhancing farmers’ income and driving productivity
Key brands
� Increasing MSPs of key crops
� Increased weed resistance, enhancing the use of innovative herbicides
OutlookRising per capita income is driving food demand in India, diet preferences shifting from carbohydrates to meat products and organic / diet foods. Rapid urbanisation, growth of nuclear families, dual-income households coupled with a young population and
increasing media penetration, have led to a surge in the demand for packaged foods, alcoholic and non-alcoholic beverages, snacks and savouries, among others.
With a low per hectare consumption of crop protection products, the sector is expected to report considerable growth. Following the acquisition of Arysta, UPL is expected to drive growth in this market through the introduction of innovative crop protection solutions.
IndiaOur geography-wise performance review
Market overviewProduction, of crop protection products in India grew at a CAGR of 4.3% between FY2014 and FY2018. During FY2019, production rose by
2.9%. To feed a rising population, food production needs to increase, warranting the need for more agri-inputs for better quality and higher crop yield.
Although food grain production has grown at a CAGR of 1.8% between FY2014 and FY2018, India loses agricultural produce worth more than US$ 11 billion annually to weeds. At US$ 4.42 billion, the actual economic losses due to weeds were found to be the highest in rice, followed by wheat (US$ 3.376 billion) and soybean (US$ 1.56 billion). However, the average yield loss was the lowest for rice – 14% for transplanted rice and 21% for direct-seeded rice.
UPL is the market leader in India, the country accounting for over 17% of the Company’s overall revenues. The Company has reported 7% growth in revenues derived from India over the previous year (based on proforma revenues i.e. not including Arysta). India houses 16 manufacturing facilities of UPL. During the last year, the Company launched 75 products in the country.
Revenues(H in crore)
Growth over last year(%)
Share of total revenues(%)
3,30
2 **
3,07
8
2,59
5
2,69
6
FY16 FY17 FY18 FY19
7.3
18.6
(3.7
)
2.8
FY16 FY17 FY18 FY1917
18
16
19
FY16 FY17 FY18 FY19** Proforma revenues i.e. not including Arysta
InsecticidesUlala, Phoskill,
Lancer Gold, Atabron and Starthene
HerbicidesSaathi, Iris, Patela
and Lagam
FungicidesSaaf, Avancer Glow, DisectandCuprofix
Crop nutrition/ fumigants and
storageWuxal
40 | Annual Report 2018-19
UPL Limited
Our geography-wise performance review
Latin America
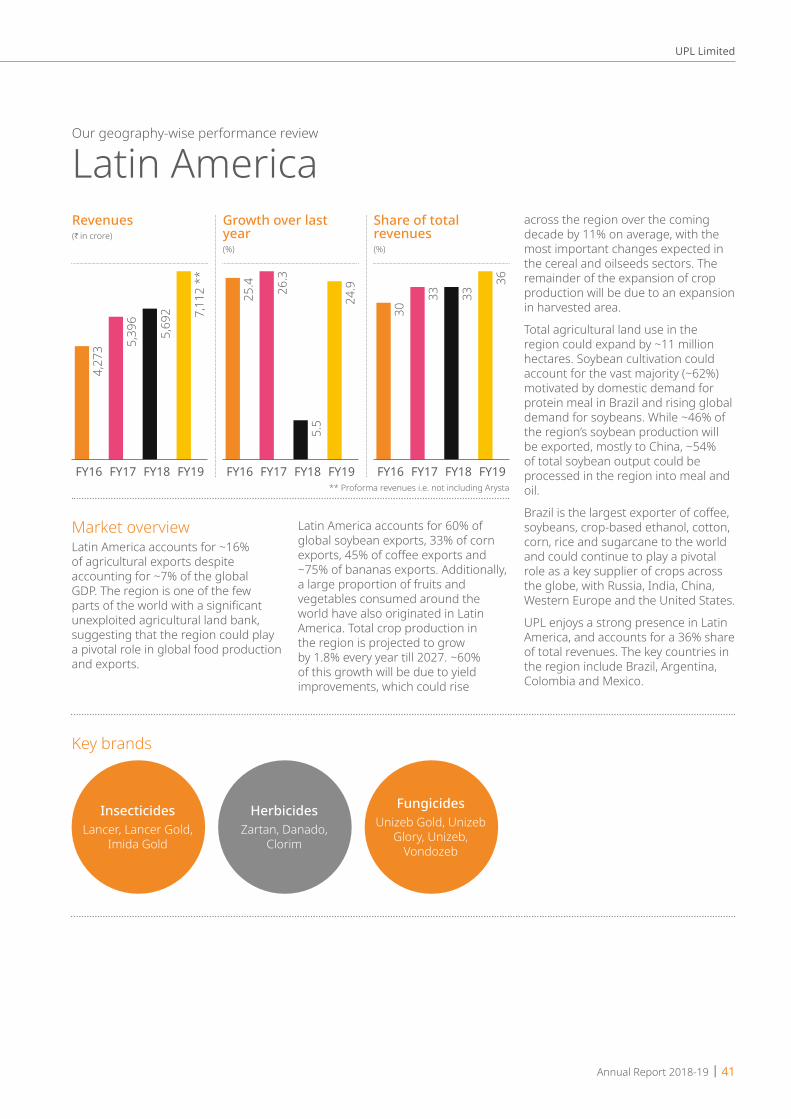
Market overviewLatin America accounts for ~16% of agricultural exports despite accounting for ~7% of the global GDP. The region is one of the few partsoftheworldwithasignificantunexploited agricultural land bank, suggesting that the region could play a pivotal role in global food production and exports.
Latin America accounts for 60% of global soybean exports, 33% of corn exports,45%ofcoffeeexportsand~75% of bananas exports. Additionally, a large proportion of fruits and vegetables consumed around the world have also originated in Latin America. Total crop production in the region is projected to grow by 1.8% every year till 2027. ~60% of this growth will be due to yield improvements, which could rise
across the region over the coming decade by 11% on average, with the most important changes expected in the cereal and oilseeds sectors. The remainder of the expansion of crop production will be due to an expansion in harvested area.
Total agricultural land use in the region could expand by ~11 million hectares. Soybean cultivation could account for the vast majority (~62%) motivated by domestic demand for protein meal in Brazil and rising global demand for soybeans. While ~46% of the region’s soybean production will be exported, mostly to China, ~54% of total soybean output could be processed in the region into meal and oil.
Brazilisthelargestexporterofcoffee,soybeans, crop-based ethanol, cotton, corn, rice and sugarcane to the world and could continue to play a pivotal role as a key supplier of crops across the globe, with Russia, India, China, Western Europe and the United States.
UPL enjoys a strong presence in Latin America, and accounts for a 36% share of total revenues. The key countries in the region include Brazil, Argentina, Colombia and Mexico.
Revenues(H in crore)
Growth over last year(%)
Share of total revenues(%)
7,11
2 **
5,69
2
5,39
6
4,27
3
FY16 FY17 FY18 FY19
24.9
5.5
26.3
25.4
FY16 FY17 FY18 FY19
36
3333
30
FY16 FY17 FY18 FY19** Proforma revenues i.e. not including Arysta
Key brands
InsecticidesLancer, Lancer Gold,
Imida Gold
HerbicidesZartan, Danado,
Clorim
FungicidesUnizeb Gold, Unizeb
Glory, Unizeb, Vondozeb
Annual Report 2018-19 | 41
UPL Limited

Market overviewEurope is an important region for the global agricultural industry, both in terms of land bank as well as production, owing to the variety of natural resources and climatic conditions. Furthermore, the latest technological developments in the contitent sharply increased yields.
Organic farming is gaining popularity, with Spain and Italy accounting for ~1.97 million hectares of organic agricultural land and more than 52,000 organic producers.
Cereals, oilseeds and sugar cultivation areas in the EU-28 are expected to decline during FY2020 to around 70.7 million hectares. A dry autumn hampered sowing, but mild winter
conditions brightened prospects in Europe. On the basis of historical trend of yields, European cereals harvest could reach 308 million tonnes. Oilseeds area is expected to decline by 6% due to lowered rapeseed sowings during FY2020. Oilseed output is fairly stable compared to the previous season’sfigureof~33milliontonnes.Adverse weather conditions lowered sugar production by 17% y-o-y during 2018-19 (~17.6 million tonnes), resultinginadeficitof5%.
UPL posted a strong growth of 16% in terms of revenues derived from Europe. Over a period of time, UPL has extended its footprint across the region to reduce its dependence on aspecificcountry.TheCompanyalsodiversifieditspresenceacrosscrops–sugar beet, oilseeds, fruit (grape and others) and vegetables.
Key developments, FY2019 � Grew revenues by 25%
� Introduced 72 herbicides, 63 fungicides, 75 insecticides, six seed treatment products and 10 adjacent technology products
� Contributed 36% to UPL’s overall revenues, (% are on Proforma revenues i.e. not including Arysta).
Optimism � Access to sugarcane co-operative channelduetoArystaofferingacomplete portfolio for the crop
� Access to new AI’s which enhance the portfolio of key crops like soybean and corn
� Promoting Pronutiva concept across regions and crops
� Access to distribution channels in countries where the legacy UPL had a sub-scale presence
OutlookThe region is expected to remain an important global supplier of various food commodities, accounting for 56-59% of global trade of soybeans and sugar and 30% of the global meat trade by 2027.
Current trade policies in Argentina, such as the removal of export taxes on maize and wheat, should encourage export-oriented production of those crops. With the US classifying cane
ethanol as an advanced renewable fuel, encouraging imports from Brazil, the region’s position as a net exporter of ethanol could strengthen with the value of net trade expanding 11% per annum.
Latin America has pioneered the adoption of agri-business technologies like the direct sowing practice to reduce soil erosion. The result: 81% of Argentina’s land is arable compared to 23% in the US and 10% in Europe. By joining hands with Bayer, UPL expects to widen its customer base in this region.
EuropeRevenues(H in crore)
Growth over last year(%)
Share of total revenues(%)
2,68
5 **
2,30
5
2,14
8
1,92
5
FY16 FY17 FY18 FY19
16.5
7.3
11.6
(5.3
)
FY16 FY17 FY18 FY19
14
131313
FY16 FY17 FY18 FY19** Proforma revenues i.e. not including Arysta
Our geography-wise performance review
42 | Annual Report 2018-19
UPL Limited

Key brands
HerbicidesDevrinol, Metafol and
BeetUP
FungicidesCuprofix,Microthial
and Penncozeb
Key developments, FY2019 � Grew revenues by 16%
� Introduced 89 herbicides, 68 fungicides, 44 insecticides and six adjacent technology products
� Contributed 14% to UPL’s overall revenues. (% are on Proforma revenues i.e. not including Arysta).
OutlookSugar beet production for 2019-20 is forecast at 123
million tonnes (an increase of 9% over 2018-19) and sugar production could reach 18.3 million tonnes (an increase of 4% over 2018-19). Cereal production is expected to grow to 341 million tonnes by 2030, driven by feed offtake,brightenedexportprospects (particularly for wheat) and increasing demand for cereals. However, growth could be restricted due to the limited potential for farmland expansion and decelerated yield growth in the region.
North AmericaRevenues(H in crore)
Growth over last year(%)
Share of total revenues(%)
3,47
8 **
3,08
3
2,88
8
2,61
2
FY16 FY17 FY18 FY19
12.8
6.8
10.6
15.6
FY16 FY17 FY18 FY19
18181818
FY16 FY17 FY18 FY19** Proforma revenues i.e. not including Arysta
Market overviewAcross North America, agriculture has become mechanised and dependent on an integrated system of supporting agri-businesses. Total US food and agricultural exports to Canada and Mexico more than quadrupled between 1993 and 2016, growing from US$ 11 billion to US$ 43 billion, accounting for 25% of all US agriculture exports. The US has the most abundant, varied and productive agricultural system in the world today and is a key driver of economic growth,
providing US$ 2 trillion in annual revenues, employment for 19 million peopleandUS$130billioninprofitformore than 2.6 million businesses.
UPLoffersarangeofproductsfor key crops like rice, tree nuts, aquatics, turfs and ornamentals, fruits and vegetables in North America. The Company gained a foothold in the niche segment of aquatics (crop protection products used to counter weeds in fresh water lakes), horticultural and post-harvest crop protection products.
Key brands
InsecticideBanter
Crop nutrition/ fumigants and
storageWeevilcide
HerbicidesInterline, UltraBlazer, Satellite, Tricor and
Surflan
FungicidesCuprofix,Manzate,
Microthial and SuperTin
Our geography-wise performance review
Annual Report 2018-19 | 43
UPL Limited
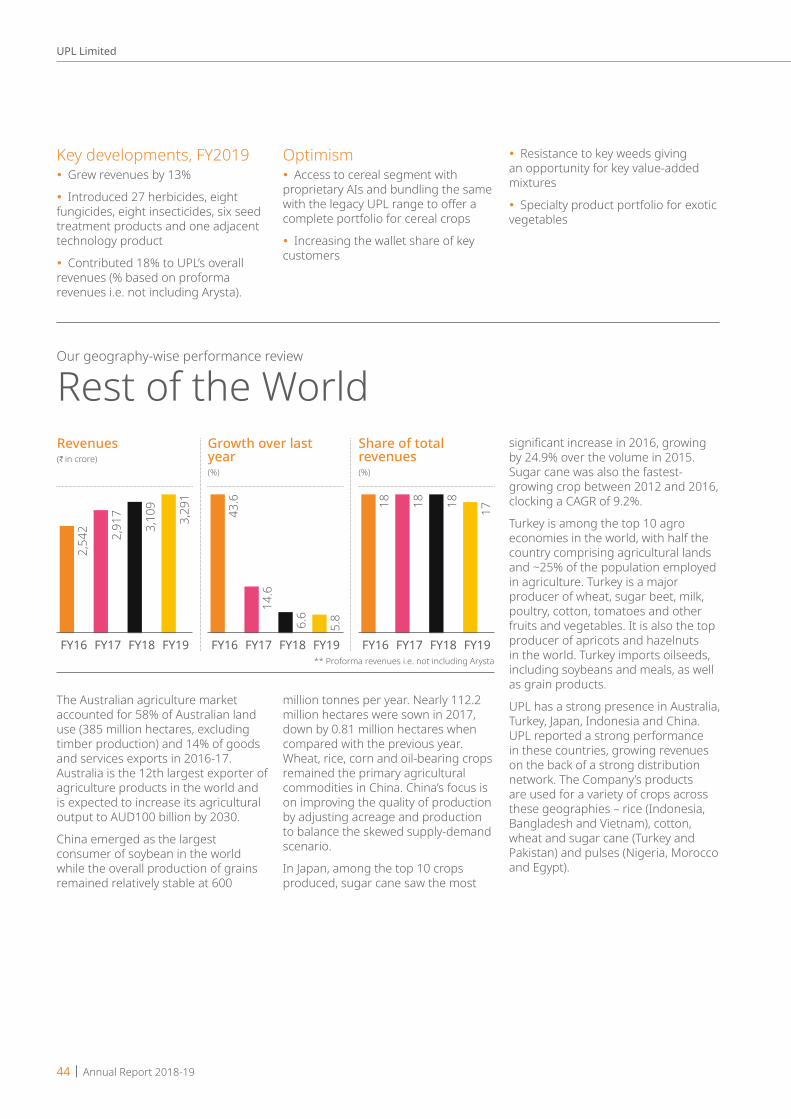
The Australian agriculture market accounted for 58% of Australian land use (385 million hectares, excluding timber production) and 14% of goods and services exports in 2016-17. Australia is the 12th largest exporter of agriculture products in the world and is expected to increase its agricultural output to AUD100 billion by 2030.
China emerged as the largest consumer of soybean in the world while the overall production of grains remained relatively stable at 600
million tonnes per year. Nearly 112.2 million hectares were sown in 2017, down by 0.81 million hectares when compared with the previous year. Wheat, rice, corn and oil-bearing crops remained the primary agricultural commodities in China. China’s focus is on improving the quality of production by adjusting acreage and production to balance the skewed supply-demand scenario.
In Japan, among the top 10 crops produced, sugar cane saw the most
significantincreasein2016,growingby 24.9% over the volume in 2015. Sugar cane was also the fastest-growing crop between 2012 and 2016, clocking a CAGR of 9.2%.
Turkey is among the top 10 agro economies in the world, with half the country comprising agricultural lands and ~25% of the population employed in agriculture. Turkey is a major producer of wheat, sugar beet, milk, poultry, cotton, tomatoes and other fruits and vegetables. It is also the top producer of apricots and hazelnuts in the world. Turkey imports oilseeds, including soybeans and meals, as well as grain products.
UPL has a strong presence in Australia, Turkey, Japan, Indonesia and China. UPL reported a strong performance in these countries, growing revenues on the back of a strong distribution network. The Company’s products are used for a variety of crops across these geographies – rice (Indonesia, BangladeshandVietnam),cotton,wheat and sugar cane (Turkey and Pakistan) and pulses (Nigeria, Morocco and Egypt).
Key developments, FY2019 � Grew revenues by 13%
� Introduced 27 herbicides, eight fungicides, eight insecticides, six seed treatment products and one adjacent technology product
� Contributed 18% to UPL’s overall revenues (% based on proforma revenues i.e. not including Arysta).
Optimism � Access to cereal segment with
proprietary AIs and bundling the same withthelegacyUPLrangetoofferacomplete portfolio for cereal crops
� Increasing the wallet share of key customers
� Resistance to key weeds giving an opportunity for key value-added mixtures
� Specialty product portfolio for exotic vegetables
Rest of the WorldRevenues(H in crore)
Growth over last year(%)
Share of total revenues(%)
3,29
1
3,10
9
2,91
7
2,54
2
FY16 FY17 FY18 FY19
5.86.6
14.6
43.6
FY16 FY17 FY18 FY19
17181818
FY16 FY17 FY18 FY19** Proforma revenues i.e. not including Arysta
Our geography-wise performance review
44 | Annual Report 2018-19
UPL Limited

Key brands
InsecticideKinalux
Crop nutrition/ fumigants and
storageQuickphos
HerbicideAsulox
FungicidePenncozeb
Key developments, FY2019 � Grew revenues by 6%
� Introduced 72 herbicides, 34 fungicides, 71 insecticides, one seed treatment product and six adjacent technology products
� Contributed 17% to UPL’s overall revenues (% on proforma revenues i.e. not including Arysta).
Optimism � Presence in Africa market where
legacy Arysta has been strong
� In-sourcing and leveraging UPL’s manufacturing strength for key AIs where legacy Arysta was buying from a third party.
� Probable band of non-selective herbicides in key Asian geographies, creating an opportunity for legacy UPL brands like Tarang, Lifeline and Fanate
OutlookTheVietnameseagro-industryisexpectedtobenefitfromeconomicandfinancialintegrationinSouthEast Asia (the ASEAN Economic Community) with investments in the agriculturalsupplychain.Vietnamconcluded a free trade agreement with EU, which is likely to boost trade incoffee,riceandseafood.China’sdemand for agricultural products is projected to grow in the near future. Although soybean is likely to remain the dominant import commodity, overseas purchases of corn and higher-valued commodities are also anticipated to expand. The global suppliers on international rice markets are expected to remain the same, principally being Thailand, India andVietnam,whileCambodiaandMyanmar are projected to expand exports over the next decade and capture a greater share of the global export market.
Annual Report 2018-19 | 45
UPL Limited
Management discussion and analysis
46 | Annual Report 2018-19
UPL Limited

Global economic overview The global economy grew by 3.6% in 2018 compared with 3.8% in 2017, against a backdrop of the failure of Brexit negotiations,tightenedfinancialconditions,geopoliticaltensionsandhighercrudeoilprices.Globalgrowthisestimatedat 3.3% in 2019.(Source: World Economic Outlook).
Global economic growth over six yearsYear 2015 2016 2017(E) 2018(E) 2019 (P)Real GDP growth (%) 3.2 3.1 3.8 3.6 3.3
(Source: World Economic Outlook, January 2019) E: Estimated; P: Projected
Indian economic overviewAfter growing at 7.2% in 2017-18, the Indian economy slowed down to 6.8% in 2018-19 (as per the May 2019 estimate of CSO). The principal developments during the year comprised 8.6% increase in per capita income, decline in the nationalinflation,steadyinterestrates,and weaker consumer sentiment inthesecondhalfofthefinancialyear following a large non-banking financialinstitutionannouncingitsinability to meet dues. India is now the sixth largest economy (eleventh largest in 2013-14) that reported an FDI of US$ 239 billion in the last fiveyears.Thecountryalsoreporteda 23-notch jump to a record 77th position in the World Bank’s report on the Ease of Doing Business that captured the performance of 190 countries reporting an improvement in six of 10 parameters. India’s global-rank for ‘getting credit’ as per World Bank’s Ease of Doing Business Index improved from 44 in 2016 to 22 in 2018.
Relevant government initiativesIncreasing MSP: The Government fixedMSPsof22mandatedkharifandrabi crops and FRP for sugarcane. The Central government committed to provide farmers with a 50% return over the cost of production for all mandated crops, strengthening the rural economy.
Pradhan Mantri Kisan Samman Nidhi: A scheme announced by the Central Government promising an annual assured income of H6,000 (US$ 84.5) for any farmer who owns ≤2 hectares of farmland. However, the newly elected government has removed cap on landholding size. The revised Scheme is now expected to
cover around 2 crore more farmers, increasing the coverage of PM-KISAN toaround14.5crorebeneficiaries,with an estimated expenditure by the Central Government of H87,217.50 crore for the year 2019-20.
Direct Benefit Transfer: The DirectBenefitTransferinitiativere-engineered the cash disbursement process in welfare schemes through simplerandfasterflowofinformation/funds to ensure accurate targeting of beneficiaries,removingduplicationand reducing fraud. In 2018-19 alone, this scheme is estimated to have transferred more than H314,465 crore and the gains to have accrued since scheme implementation is estimated at more than H120,000 crore.
PM- AASHA:Thepricedeficiencyscheme for farmers (PM- AASHA) was pared down to H1,400 crore for FY2019 and H1,500 crore for FY2020. A new H3,000 per month pension scheme for unorganised workers with a monthly income ≤H15,000 has a modest outlay of more than H500 crore.
ThefiscaldeficitforFY2019isrevisedto 3.4% of the GDP against 3.3% budgeted earlier. For FY2020 too, the deficitwillremainatthesamelevelinrelation to the GDP as in FY2019 while the 3% FRMB goal is now left to be achieved in FY2021.
Targeted income support scheme: A targeted income support scheme (an approximation of the universal basic schemeflaggedbymany)is,however,beingseenasmoreefficaciousinaddressing the distress in the farming sector and rural India, than the farm loan waivers being implemented by various State Governments.
Other schemes and sops: The sops for the farm sector do not end at the
basic minimum income. In a move to provide supplementary income, the Central Government also focused on allied agricultural activities by extending credit provisions and giving more credence to the animal husbandryandthefisheriessectors.In addition to announcing an outlay of H750 crore and setting up of Rashtriya Kamdhenu Aayog to enhance the production and productivity of cows, it also extended interest subvention to farmers pursuing animal husbandry andfisheriesthroughKisanCreditCard scheme, with an additional 3% for timely repayment. With over 40 million accounts, an extension of KCC is expected to provide further accesstoformalfinance.Moreover,by raising the duration of interest subvention of 2% for farmers hit by natural calamities from one year to the entire period of loan duration and also raising the subvention limit to 5%, it has shown that it can be farmer-friendly.(Source: Financial Express, Live Mint, Economic Times, Reuters, PIB, Union Budget, World Bank, Times Now, dbtbharat.gov.in)
OutlookAssuming no major global and domestic political shocks, India’s markets are expected to perform better in 2019.(Source: CSO, Fitch, Economic Times, Business Standard, IBEF, Business Today, India Today)
Annual Report 2018-19 | 47
UPL Limited
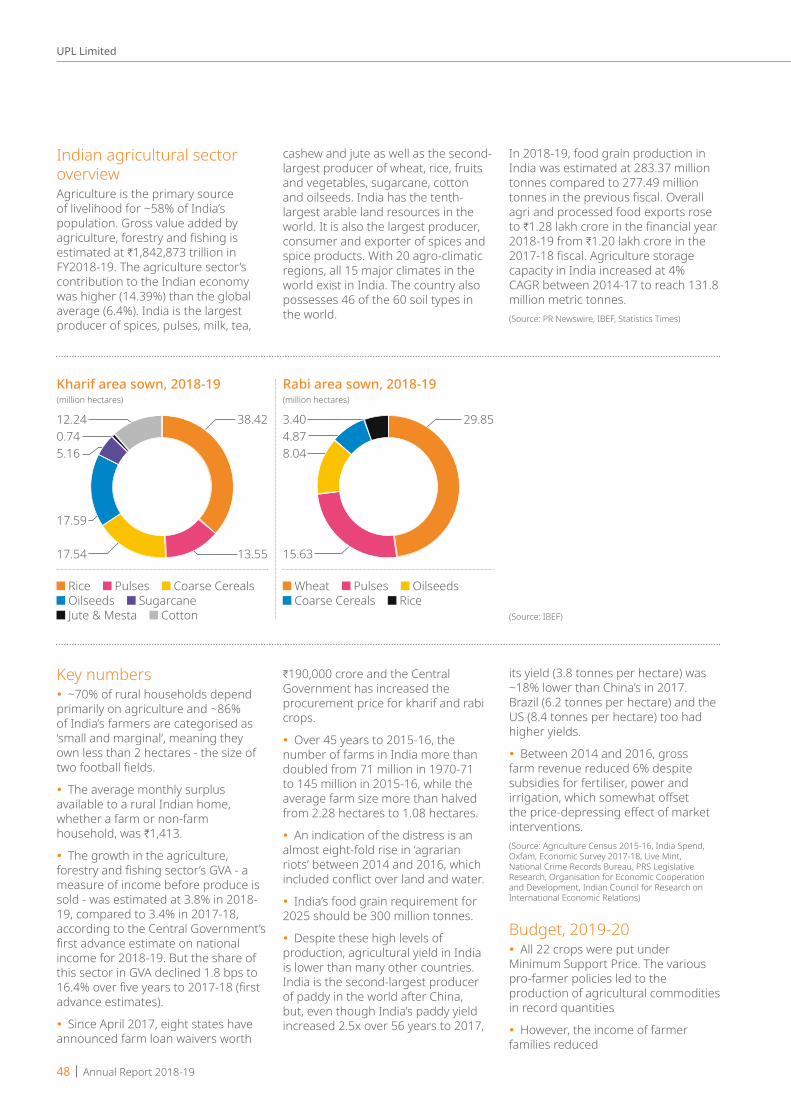
Indian agricultural sector overviewAgriculture is the primary source of livelihood for ~58% of India’s population. Gross value added by agriculture,forestryandfishingisestimated at H1,842,873 trillion in FY2018-19. The agriculture sector’s contribution to the Indian economy was higher (14.39%) than the global average (6.4%). India is the largest producer of spices, pulses, milk, tea,
Key numbers � ~70% of rural households depend
primarily on agriculture and ~86% of India’s farmers are categorised as ‘small and marginal’, meaning they own less than 2 hectares - the size of twofootballfields.
� The average monthly surplus available to a rural Indian home, whether a farm or non-farm household, was H1,413.
� The growth in the agriculture, forestryandfishingsector’sGVA-ameasure of income before produce is sold - was estimated at 3.8% in 2018-19, compared to 3.4% in 2017-18, according to the Central Government’s firstadvanceestimateonnationalincome for 2018-19. But the share of thissectorinGVAdeclined1.8bpsto16.4%overfiveyearsto2017-18(firstadvance estimates).
� Since April 2017, eight states have announced farm loan waivers worth
Rice Pulses Coarse Cereals Oilseeds Sugarcane Jute & Mesta Cotton
Wheat Pulses Oilseeds Coarse Cereals Rice
Kharif area sown, 2018-19(million hectares)
Rabi area sown, 2018-19(million hectares)
cashew and jute as well as the second- largest producer of wheat, rice, fruits and vegetables, sugarcane, cotton and oilseeds. India has the tenth-largest arable land resources in the world. It is also the largest producer, consumer and exporter of spices and spice products. With 20 agro-climatic regions, all 15 major climates in the world exist in India. The country also possesses 46 of the 60 soil types in the world.
H190,000 crore and the Central Government has increased the procurement price for kharif and rabi crops.
� Over 45 years to 2015-16, the number of farms in India more than doubled from 71 million in 1970-71 to 145 million in 2015-16, while the average farm size more than halved from 2.28 hectares to 1.08 hectares.
� An indication of the distress is an almost eight-fold rise in ‘agrarian riots’ between 2014 and 2016, which includedconflictoverlandandwater.
� India’s food grain requirement for 2025 should be 300 million tonnes.
� Despite these high levels of production, agricultural yield in India is lower than many other countries. India is the second-largest producer of paddy in the world after China, but, even though India’s paddy yield increased 2.5x over 56 years to 2017,
In 2018-19, food grain production in India was estimated at 283.37 million tonnes compared to 277.49 million tonnesinthepreviousfiscal.Overallagri and processed food exports rose to H1.28lakhcroreinthefinancialyear2018-19 from H1.20 lakh crore in the 2017-18fiscal.Agriculturestoragecapacity in India increased at 4% CAGR between 2014-17 to reach 131.8 million metric tonnes.(Source: PR Newswire, IBEF, Statistics Times)
its yield (3.8 tonnes per hectare) was ~18% lower than China’s in 2017. Brazil (6.2 tonnes per hectare) and the US (8.4 tonnes per hectare) too had higher yields.
� Between 2014 and 2016, gross farm revenue reduced 6% despite subsidies for fertiliser, power and irrigation,whichsomewhatoffsettheprice-depressingeffectofmarketinterventions.(Source: Agriculture Census 2015-16, India Spend, Oxfam, Economic Survey 2017-18, Live Mint, National Crime Records Bureau, PRS Legislative Research, Organisation for Economic Cooperation and Development, Indian Council for Research on International Economic Relations)
Budget, 2019-20 � All 22 crops were put under
Minimum Support Price. The various pro-farmer policies led to the production of agricultural commodities in record quantities
� However, the income of farmer families reduced
(Source: IBEF)
38.42 29.85
13.55 15.6317.54
17.59
5.16 8.040.74 4.8712.24 3.40
48 | Annual Report 2018-19
UPL Limited

� There has been a need to provide structured income support to the poor farmer families to buy fertilizers and seeds among others
� The support is aimed to help farmers reduce their indebtedness and enable them to live a respectable life
� To provide assured income to small and marginal farmers, the Government introduced a historic yojana Pradhan Mantri Kisan Samman
Food demand driversFood processing: The Indian food processing industry accounts for 32% of the country’s total food market and contributes ~ 8.4% of gross value added in agriculture.
Grocery market: The Indian food and grocery market is the world’s sixth-largest, with retail contributing 70% of the sales. India’s food retail market is expected to touch US$ 827 billion by 2023, up from US$ 487 billion in 2017, growing at a compound annual growth rate (CAGR) of 9.23%,
Growing population: 1.5 million people are added every year to India’s population and it is estimated that India will become the most populous country by 2022.
Rising incomes: India’s per capita income will grow by more than 2x by 2027. Estimated per capita income growth in India stood at 11.1% during FY2018-19. Rising income levels have resulted in more disposable incomes, driving consumption.
Export revenues: The Central Government planned to increase
Nidhi (KISAN). Under the yojana, the eligible farmers, will get direct income support of H6000 per year.
� The income support will be transferred directly to the account of thebeneficiaryfarmerinthreeequalinstallments of H2000 each. It would be fully funded by the Government of India. The scheme is expected tobenefit12crorefarmerfamilies.Around H75,000 crore will be borne bytheCentreeveryyear.Thefirst
export revenues from US$ 37 billion currently to US$ 60 billion by 2022, playing a pivotal role in terms of doubling of farmers’ incomes.(Source: Live Mint, Business Today, PIB)
OutlookThe Indian agricultural market is expected to reach H89,380 billion by 2023,exhibitingafive-yearCAGRof12.2%. India is expected to achieve the ambitious goal of doubling farm incomes - from US$ 1,505.27 in 2015-16 to US$ 3,420.21 by 2022. The agriculture sector in India is expected to gain momentum in the coming years due to increased investments in agricultural infrastructure. India is expectedtobecomeself-sufficientinpulses in the coming few years due to theconcertedeffortsofscientiststoget early-maturing varieties of pulses and the Central Government’s decision to increase minimum support prices.
Global crop protection products market overviewThe market for crop protection products was pegged at US$ 57.5
installment will be issued soon after preparing a list. H20,000 crore will be spentthisfinancialyear.
� PM Kisan will provide assured supplementary income to vulnerable farmer families.
� Besidesthis,farmersaffectedbynatural calamities will be given 3% interest subvention on crop loans.(Source: Ministry of Finance, Union Budget 2018-19, PRS)
billion in 2018, and is expected to reach US$ 66.7 billion by 2023, registering a CAGR of 3.1%. Currently, the herbicide segment constitutes the largest market share (42.7%). This segment is expected to retain its higher position, due to the large-scale adoption of herbicide-resistant crops in North and South America.(Source: Phillips McDougall))
The crop protection products industry has been transforming over the years, with changing crop mix trends and environmental regulations. Growing population, decline in arable land and food security are the primary focus areas for all countries, these factors driving the demand for higher agricultural output, global augmenting the growth of the crop protection products industry. Synthetic pesticides form the largest category within the market for crop protection products, with bio-pesticides accounting for a comparatively smaller share.(Source: Mordor Intelligence)
How India compares with the world � In 2017, 18% of Chinese were employed in agriculture compared
to 43% of Indians, according to World Bank data. Over 26 years till 2017, the proportion fell 37 bps in China, while in India it fell 21 bps, keeping India above the world average of 26.4% of people employed in agriculture.
� India’s spending on agriculture research (as a percentage of agriculture GDP) is 0.3%. China, the US, Brazil and South Africa spent 2x, 4x, 6x and 10x more than India, respectively.(Source: Hindu Business Line)
Annual Report 2018-19 | 49
UPL Limited
Emerging trendsIncreasing food demand and diminishing land area: Global population is increasing exponentially. It has increased nearly fourfold in the past 100 years, and is projected to reach 9.2 billion by 2050. Supplying food to this growing population has become a global concern. By 2030, the per capita farmland is expected to decrease to 1,800 square meters from 2,200squaremetersin2005.Variouscrop pests contribute to yield loss, causing global crop loss of 10-16%, annually. Although new technologies are continuously being developed to fightpestattacks,theyarealsoleadingto the development of new strains ofpeststhataredifficulttokill.Theamount of loss in major crops, due to fungi alone, is enough to feed ~9% of the global population.
Increasing use of herbicides and weed control: The increasing use of herbicides is anticipated to drive the global crop protection products market because of the investments made for development of new varieties ofherbicides,whicharemoreeffectiveand eco-friendly. The increased use of herbicides is a result of the shift in preference of consumers toward
SWOT analysis
fruits and green vegetables owing to increasing awareness of health and fitness.(Source: Mordor Intelligence)
Indian crop protection products market overviewIndia is the fourth-largest global producer of crop protection products, with an estimated market size of ~H197 billion in 2018, after the US, Japan and China. India has also emerged as the thirteenth-largest exporter of crop protection products globally. With more mouths to feed, shrinking arable area, loss of yield due to increased pest attacks, the crop protection products industry in the country is on the rise.
Production of crop protection products grew at a CAGR of 4.3% between 2013-14 and 2017-18, and in 2018-19 it rose by 2.9%. The production capacity of crop protection players in India was pegged at ~292,000 million tonnes in 2018-19.
Paddy accounts for the maximum share of crop protection products consumption (26%-28%), followed by cotton (18% -20%). Andhra Pradesh, Maharashtra, Punjab, Madhya
Pradesh, Chhattisgarh, Gujarat, Tamil Nadu and Haryana account for >70% of the crop protection products used in India. Andhra Pradesh is the leading consumer of crop protection products with a market share of 24%.
Crop protection product exports increased at a CAGR of 12.8% between 2013-14 and 2017-18. In 2018-19, crop protection products exports increased by 11% whereas imports increased by 4.4%, compared to the corresponding period in the previous financialyear.LatinAmerica,NorthAmerica, Europe and Asia have emerged as important markets for the Indian crop protection products industry. Fungicide and herbicide exports grew at CAGRs of 25.5% and 27.5%, respectively, between 2013-14 and 2017-18. In 2018-19, exports of insecticides, fungicides and herbicides increased by 10.2%, 17.2% and 1.8%, respectively. Fungicide and herbicide imports grew at a CAGR of 15.5% and 28.4%, respectively, between 2013-14 and 2017-18. Insecticide imports fell by 3.7% during the same period.
The crop protection products industry is expected to grow at a CAGR of 8.1% to reach H316 billion by 2024.
Strengths
� Low-cost manufacturing
� Availability of cutting-edge technologies
� Ample capacity
Weaknesses
� High expenditure required in R&D
� Dependence on monsoons
� Consumption imbalance
� Capital-intensive processes
� Restrictive norms
� Health hazards
Opportunities
� Focus on innovative farming solutions
� Patent expiry
� Export potential
� Scope for increase in usage
� Rural infrastructure and IT
� Availability of credit facilities
� Increase in MSPs
� Rising labour costs
Threats
� Genetically-modifiedseeds
� Spurious crop protection products
50 | Annual Report 2018-19
UPL Limited

Growth driversIncreasing demand: The total food grain production in India was estimated at 281.37 million tonnes during 2018-19 compared to 277.49 million tonnes in 2017-18. An increasing population and the need for achievingfoodgrainself-sufficiency,are expected to drive growth.
Farmland availability: Rapid urbanisation has had a detrimental impact on land availability. The pressure is to increase yield per hectare, which can be achieved
through increased usage of productivity-enhancing inputs like crop protection products.
Climatic conditions: Farms need an array of inputs to protect crops fromtheeffectsoferraticclimaticconditions. Irregular monsoons, coupled with a lack of irrigation (60% of cultivable land in India is non-irrigated), results in low agricultural yields.
Off-patent molecules: The share ofoff-patentmoleculescomparedto patented molecules and
proprietaryoff-patentmoleculeshas been increasing over the years. Agrochemicals worth US$ 4.1 billion areexpectedtogooff-patentby2020.Thisprovidessignificantexportopportunities for Indian companies, whopossessanexpertiseintheoff-patent segment.
Per capita consumption: India has one of the lowest pesticides consumption in the world. India’s per hectare consumption of just 0.6 Kg compared to US (5-7 Kg/ha) and Japan (11-12 Kg/ha).
Types of key agrochemicals and their primary use
Insecticides
Controls insect pests, which reduce crop yield and quality
Fungicides
Prevents and cures fungal plant diseases
Herbicides
Prevents or reduces weeds, which hamper crop growth and harvest
(Source: CARE)
Insecticides Herbicides Fungicides Others
Domestic market segmentation by type of pesticides
(Source: FICCI, CARE)
Region-wise share of exports of India
(Source: CARE)
53%
24%
19%4%
North America Latin America EMEA Asia Australia
North America Latin America EMEA Asia Australia
13% 17%
23% 21%34% 30%
28% 29%2% 3%
2013-14 2017-18
Annual Report 2018-19 | 51
UPL Limited

71 6738
6810
639
4813
460 58
174
78
7016
610
0
5311
972
5814
073
Exports of key agrochemicals (000’ tonnes)
2013-14 2017-182015-16 2017-18 (Apr-Dec)
2014-15 2016-17 2018-19 (Apr-Dec)
(Source: Ministry of Commerce)
200
180
160
140
120
100
80
60
40
20
0
Insecticides Fungicides Herbicides
Agrochemical markets: 2018/2017 (Distributor level, $M.)Sales ($m.) 2018 2017 Change % 2018/2017Conventional crop protection 57,561 54,319 +6.0Non-crop agrochemical market 7,538 7,311 +3.1Total agrochemicals 65,099 61,630 +5.6
Source: Phillips McDougall
Global market by region and product sector 2018 ($M)Herbicides Insecticides Fungicides Others Total CCP
APAC 6,375 5,784 4,685 645 17,489LATAM 5,653 3,574 4,434 520 14,181Europe 5,340 1,710 4,485 466 12,001NAFTA 6,341 2,566 2,310 406 11,623MEA 899 915 405 48 2,267World 24,608 14,549 16,319 2,085 57,561
Source: Phillips McDougall
Financial analysisThefinancialstatementsoftheCompany were prepared in accordance with Ind-AS. The financialstatementscomplywiththe accounting standards laid down under the Companies (Accounting Standards) Rules, 2006, as amended, and the relevant provisions of the CompaniesAct,2013.Thefinancial
statements were prepared under the historical cost convention on an accrual basis. The accounting policies were consistent with those used in the previous years.
Balance sheet � Net worth increased to H14,645
crore as on 31st March 2019 compared to H9,169 crore as on 31st March 2018.
� Borrowings as on 31st March 2019 stood at H29,142 crore compared to H6,665 crore as on 31st March 2018.
� Total non-current assets as on 31st March 2019 stood at H36,056 crore compared to H8,019 crore as on 31st March 2018.
52 | Annual Report 2018-19
UPL Limited

Profit and loss statement � Revenues increased by 23.2% from
H17,920 crore in FY2018 to H22,077 crore in FY2019.
� EBITDA increased to H4,111 crore in FY2019 compared to H3,517 crore in FY2018.
� NetprofitwasH2,022 crore in FY2018 and H1,447 crore in FY2019.
� Grossprofitmargindecreasedby360 bps from 53.7% in FY2018 to 50.1% in FY2019.
� Total expenses for FY2019 stood at H19,957 crore compared to H15,459 crore in FY2018.
Human resourcesUPL’s prudent HR practices has helped reinforce its market leadership across more than 40 countries. UPL employs professionals from 75 countries around the world and invests in formal and informal training as well as on-the-job learning. UPL transferred key executives across geographies to enrich its international leadership pool. UPL reinforced engagementswithemployeesacrosslevelsbyprovidinganenrichedworkplace,challengingjobprofileandmaintainingongoing dialogue. UPL enjoys one of the highest employee retention rates in the industry.
� Depreciation and amortisation stood at H969 crore in FY2019 compared to H675 crore in FY2018.
Working capital management � Current assets as on 31st March
2019 stood at H26,966 crore compared to H15,004 crore as on 31st March 2018.
� Current ratio as on 31st March 2019 was 1.73 compared to 1.96 as on 31st March 2018.
� Inventories increased from H4,538 crore as on 31st March 2018 to H9,270 crore as on 31st March 2019.
� Short-term loans and advances reduced to H51 crore as on 31st March 2019 compared to H147 crore as on 31st March 2018.
� Current liabilities stood at H15,564 crore as on 31st March 2019 compared to H7,642 crore as on 31st March 2018.
� Cash and bank balances stood at H2,826 crore as on 31st March 2019 compared to H2,859 crore as on 31st March 2018.
Key ratiosParticulars FY2018-19 FY2017-18EBITDA/Revenue (%) 18.8 20.1EBITDA/Net interest (%) 5.33 8.23Debt-equity ratio 199% 72.7%Return on equity (%) 10.4 22.1Book value per share (H) 287 180Earnings per share (H) 28.42 39.79
Annual Report 2018-19 | 53
UPL Limited
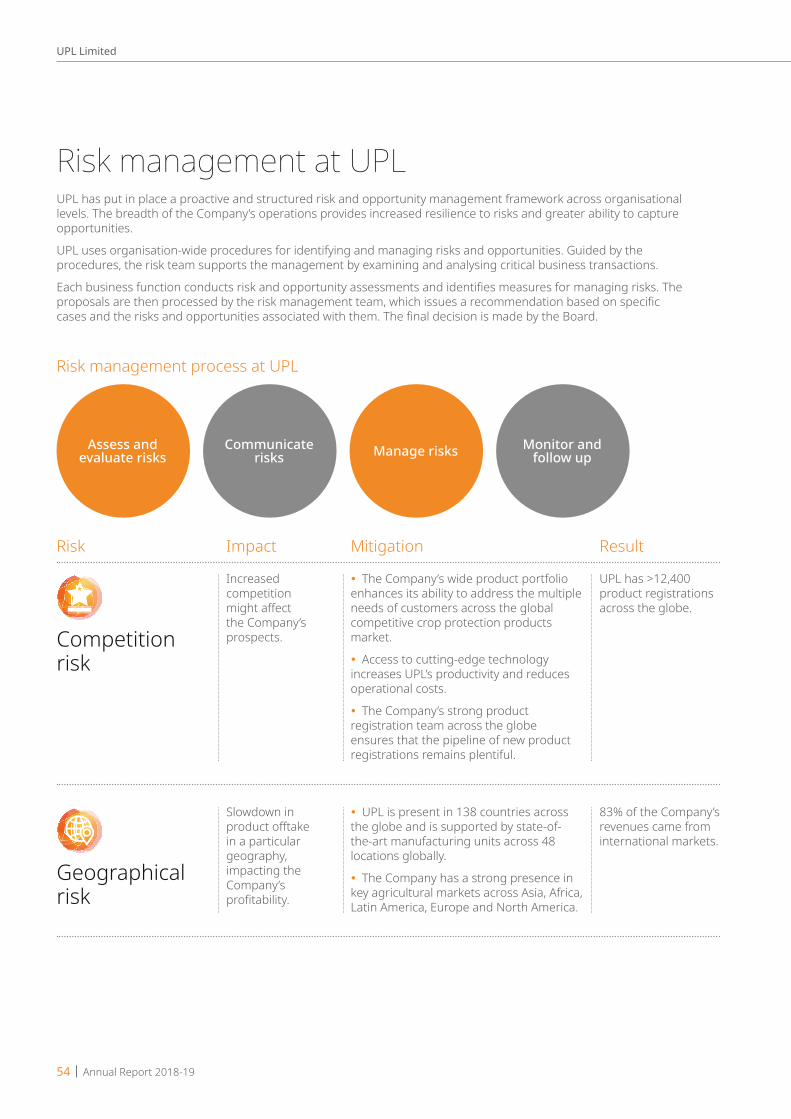
Risk management at UPL
Risk management process at UPL
Assess and evaluate risks
Monitor and follow up
Communicate risks Manage risks
Risk
Competition risk
Impact
Increased competition mightaffectthe Company’s prospects.
Mitigation
� The Company’s wide product portfolio enhances its ability to address the multiple needs of customers across the global competitive crop protection products market.
� Access to cutting-edge technology increases UPL’s productivity and reduces operational costs.
� The Company’s strong product registration team across the globe ensures that the pipeline of new product registrations remains plentiful.
Result
UPL has >12,400 product registrations across the globe.
Geographical risk
Slowdown in productofftakein a particular geography, impacting the Company’s profitability.
� UPL is present in 138 countries across the globe and is supported by state-of-the-art manufacturing units across 48 locations globally.
� The Company has a strong presence in key agricultural markets across Asia, Africa, Latin America, Europe and North America.
83% of the Company’s revenues came from international markets.
UPL has put in place a proactive and structured risk and opportunity management framework across organisational levels. The breadth of the Company’s operations provides increased resilience to risks and greater ability to capture opportunities.
UPL uses organisation-wide procedures for identifying and managing risks and opportunities. Guided by the procedures, the risk team supports the management by examining and analysing critical business transactions.
Eachbusinessfunctionconductsriskandopportunityassessmentsandidentifiesmeasuresformanagingrisks.Theproposalsarethenprocessedbytheriskmanagementteam,whichissuesarecommendationbasedonspecificcasesandtherisksandopportunitiesassociatedwiththem.ThefinaldecisionismadebytheBoard.
54 | Annual Report 2018-19
UPL Limited

Risk Impact Mitigation Result
Industrial risk
Demand slowdown in downstream industries could slow the growth and lead to inventory pile-up.
� The Company is present across all key geographies and multiple crop segments, enabling it to de-risk itself from any regionalorcrop-specificslowdown.Withfood demand rising across the globe, reducing crop loss is the need of the hour.
� TheCompanyofferssolutionsacrossthe value chain starting from seeds to seed treatment products to pre - and post-harvest solutions. It introduced value-added solutions like Adarsh Farm Services and Adarsh Kisan Centre, among others, to emerge as one-stop solution provider for farmers around the world.
During periods when most peers reported lower growth or contraction, UPL consistently increased its revenues
Liquidity risk
Lack of adequate capital could impact the daily operations of the Company.
� UPL’scashprofitreducedfromH2,980 crore during FY2018 to H2,653 crore during FY2019.
� The Company’s working capital cycle stood at 95 days of turnover equivalent during FY2019 (84 days in FY2018).
The Company’s current ratio and quick ratio stood at 1.73 and 1.14, respectively, during FY2019.
R&D risk
Inability to introduce products regularly could impact business sustainability.
� The Company’s 500+ strong R&D team works relentlessly on launching innovative formulations, mixtures and combinations; resulting in a steady stream of post-patent products,whichoffergreaterefficacythanthoseofferedbypeers.
� The Company received 1,023 patents.
The Company’s Innovation Rate in FY2019 was 17%
Marketing risk
Inability to market products successfully could decelerate growth.
� To be closer to customers, UPL set up formulation facilities near key markets, backed by strong distribution channels, ensuring that the Company’s products are well-recognised all over the world.
� UPL analyses grassroots realities to strengthen demand forecasting.
� UPL has strengthened its branding and marketing competence to enhance user confidence.
The Company invested judiciously to promote brands FY2019.
Annual Report 2018-19 | 55
UPL Limited
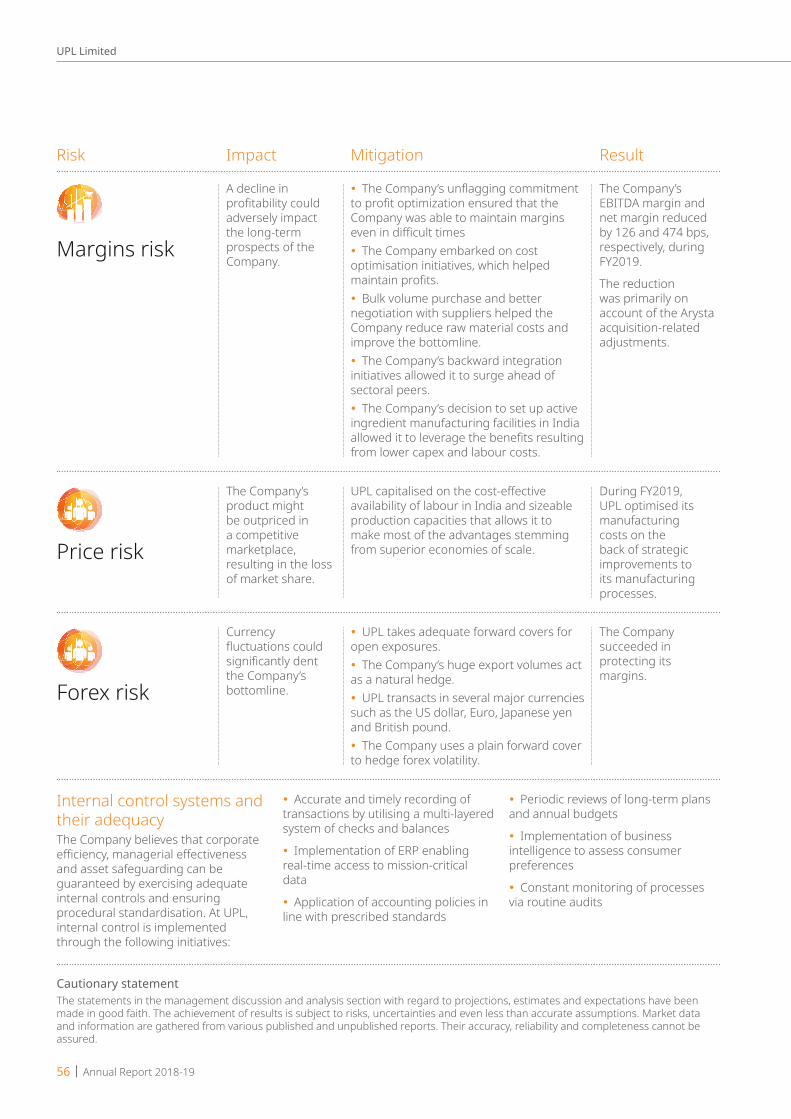
Risk Impact Mitigation Result
Cautionary statementThe statements in the management discussion and analysis section with regard to projections, estimates and expectations have been made in good faith. The achievement of results is subject to risks, uncertainties and even less than accurate assumptions. Market data and information are gathered from various published and unpublished reports. Their accuracy, reliability and completeness cannot be assured.
Internal control systems and their adequacyThe Company believes that corporate efficiency,managerialeffectivenessand asset safeguarding can be guaranteed by exercising adequate internal controls and ensuring procedural standardisation. At UPL, internal control is implemented through the following initiatives:
� Accurate and timely recording of transactions by utilising a multi-layered system of checks and balances
� Implementation of ERP enabling real-time access to mission-critical data
� Application of accounting policies in line with prescribed standards
� Periodic reviews of long-term plans and annual budgets
� Implementation of business intelligence to assess consumer preferences
� Constant monitoring of processes via routine audits
Price risk
The Company’s product might be outpriced in a competitive marketplace, resulting in the loss of market share.
UPLcapitalisedonthecost-effectiveavailability of labour in India and sizeable production capacities that allows it to make most of the advantages stemming from superior economies of scale.
During FY2019, UPL optimised its manufacturing costs on the back of strategic improvements to its manufacturing processes.
Forex risk
Currency fluctuationscouldsignificantlydentthe Company’s bottomline.
� UPL takes adequate forward covers for open exposures. � The Company’s huge export volumes act
as a natural hedge. � UPL transacts in several major currencies
such as the US dollar, Euro, Japanese yen and British pound. � The Company uses a plain forward cover
to hedge forex volatility.
The Company succeeded in protecting its margins.
Margins risk
A decline in profitabilitycouldadversely impact the long-term prospects of the Company.
� TheCompany’sunflaggingcommitmenttoprofitoptimizationensuredthattheCompany was able to maintain margins evenindifficulttimes � The Company embarked on cost
optimisation initiatives, which helped maintainprofits. � Bulk volume purchase and better
negotiation with suppliers helped the Company reduce raw material costs and improve the bottomline. � The Company’s backward integration
initiatives allowed it to surge ahead of sectoral peers. � The Company’s decision to set up active
ingredient manufacturing facilities in India allowedittoleveragethebenefitsresultingfrom lower capex and labour costs.
The Company’s EBITDA margin and net margin reduced by 126 and 474 bps, respectively, during FY2019.
The reduction was primarily on account of the Arysta acquisition-related adjustments.
56 | Annual Report 2018-19
UPL Limited

Corporate information
Board of DirectorsMr. R. D. Shroff - Chairman & Managing DirectorMrs. S. R. Shroff - Vice ChairmanMr. J. R. Shroff - Global CEO of the GroupMr. V. R. Shroff - Executive DirectorMr. A. C. Ashar - Director – FinanceMr. K. Banerjee - Whole - Time Director (Resigned w.e.f. 1st August, 2018)Mr. Pradeep GoyalDr. Reena RamachandranMr. Vinod SethiMr. Hardeep SinghMr. Vasant P. Gandhi
Chief Financial OfficerMr. Anand Vora
Company SecretaryMr. M. B. Trivedi
AuditorsB S R & Co. LLPChartered Accountants
Administrative OfficeUPL House, 610 B/2, Bandra Village, Off Western Express Highway, Bandra (East) Mumbai - 400 051 Phone: 91 22 7152 8000, Fax: 91 22 7152 8886
Registered Office3-11, G.I.D.C., Vapi,Dist. : Valsad, Gujarat-396 195.Tel.: 0260-2400717, Fax: 0260-2401823
BankersDena BankBank of BarodaState Bank of IndiaCanara BankIDBI Bank Ltd.The Karur Vysya Bank Ltd.Axis Bank Ltd.Andhra BankICICI Bank Ltd.Kotak Mahindra Bank Ltd.
Secretarial DepartmentUniphos House, C.D. Marg, Khar (West) Mumbai - 400 052 Phone: 91 22 2646 8000, Fax: 91 22 2604 1010
Debenture TrusteesIDBI Trusteeship Services Limited Asian Building, Ground Floor17. R. Kamani Marg Ballard EstateMumbai - 400 001
UPL Limited
Annual Report 2018-19 | 57

UPL LIMITED(CIN: L24219GJ1985PLC025132)
NoticeNOTICE is hereby given that 35th ANNUAL GENERAL MEETING of the Members of UPL LIMITED will be held on Wednesday, 28th August, 2019 at 11.00 a. m. at Hotel Green View Hall, National Highway No. 8, G.I.D.C., Vapi - 396 195, to transact the following business:
ORDINARY BUSINESS:1. To consider and adopt:
a) The audited standalone financial statement of the Company for the financial year ended on 31st March, 2019 and the Reports of the Board of Directors and Auditors thereon.
b) The audited consolidated financial statements of the Company for the financial year ended on 31st March, 2019 and the Report of the Auditors thereon.
2. To declare dividend on equity shares.
3. To appoint a Director in place of Mr. Jaidev Rajnikant Shroff (DIN: 00191050), Non-Executive Director, who retires by rotation and being eligible, offers himself for re-appointment.
SPECIAL BUSINESS:4. To approve the remuneration of the Cost Auditors for
the financial year ending March 31, 2020
To consider and if thought fit, to pass, the following resolution as an Ordinary Resolution:
“RESOLVED THAT pursuant to the provisions of Section 148 and all other applicable provisions of the Companies Act, 2013 and the Companies (Audit and Auditors) Rules, 2014 (including any statutory modification(s) or re-enactment thereof, for the time being in force), M/s. RA & Co., (Firm Registration No. 000242), Cost Accountants appointed as Cost Auditors by the Board of Directors of the Company, to conduct the audit of the cost records of the Company for the financial year ending March 31, 2020, be paid remuneration amounting to H8,00,000/- (Rupees Eight Lakhs Only) plus Goods and Service Tax, as applicable, and out of pocket expenses if any.”
5. Private placement of Non-Convertible Debentures
To consider and if thought fit, to pass, the following resolution as a Special Resolution:
“RESOLVED THAT pursuant to the provisions of Sections 42, 71 and other applicable provisions, if any, of the Companies Act, 2013 and the Rules made there under, as amended from time to time, consent of the Company be and is hereby accorded to the Board of Directors (hereinafter referred to as the “Board”, which term shall be deemed to include any Committee of the Board constituted to exercise its powers, including the powers conferred by this Resolution) for making offer(s) or invitation(s) to subscribe to Non-Convertible Debentures on private placement basis, in one or more tranches, such that the total amount does not exceed H3,000 crores (Three Thousand Crores only) during a period of one year from the date of passing of this Resolution and that the said borrowing is within the overall borrowing limits of the Company.
RESOLVED FURTHER that the Board be and is hereby authorized to take all such steps as may be necessary, proper and expedient to give effect to this Resolution.”
6. To re-appoint Mr. Pradeep Vedprakash Goyal (DIN: 00008370) as an Independent Director of the Company
To consider and if thought fit to pass with or without modification(s) the following resolution as a Special Resolution:
“RESOLVED THAT pursuant to the provisions of Sections 149, 152 and other applicable provisions, if any, of the Companies Act, 2013 (“Act”) and the Companies (Appointment and Qualification of Directors) Rules, 2014 (including any statutory modification(s) or re-enactment thereof for the time being in force) read with Schedule IV to the Act and Regulation 16(1)(b) of the SEBI (Listing Obligations and Disclosure Requirements) Regulations, 2015, Mr. Pradeep Vedprakash Goyal (DIN: 00008370), and who has submitted a declaration that he meets the criteria of independence as provided in Section 149(6) of the Act and Regulation 16 of the SEBI (Listing Obligations and Disclosure Requirements) Regulations, 2015, as amended from time to time and who is eligible for re-appointment, and in respect of whom the Company has received a notice in writing from a Member under Section 160(1) of the Act proposing his candidature for the office of Director of the Company be and is hereby re-appointed as an Independent Director of the Company to hold office
UPL Limited
58 | Annual Report 2018-19

for a second term of 5 (five) years commencing from August 28, 2019 and whose office shall not be liable to retire by rotation.”
7. To re-appoint Dr. Reena Ramachandran (DIN: 00212371) as an Independent Director of the Company
To consider and if thought fit to pass with or without modification(s) the following resolution as a Special Resolution:
“RESOLVED THAT pursuant to the provisions of Sections 149, 152 and other applicable provisions, if any, of the Companies Act, 2013 (“Act”) and the Companies (Appointment and Qualification of Directors) Rules, 2014 (including any statutory modification(s) or re-enactment thereof for the time being in force) read with Schedule IV to the Act and Regulation 16(1)(b) of the SEBI (Listing Obligations and Disclosure Requirements) Regulations, 2015, Dr. Reena Ramachandran (DIN: 00212371), and who has submitted a declaration that she meets the criteria of independence as provided in Section 149(6) of the Act and Regulation 16 of the SEBI (Listing Obligations and Disclosure Requirements) Regulations, 2015, as amended from time to time and
who is eligible for re-appointment, and in respect of whom the Company has received a notice in writing from a Member under Section 160(1) of the Act proposing her candidature for the office of Director of the Company be and is hereby re-appointed as an Independent Director of the Company to hold office for a second term of 5 (five) years commencing from August 28, 2019 and whose office shall not be liable to retire by rotation.
RESOLVED FURTHER THAT pursuant to Regulation 17(1A) of the Securities and Exchange Board of India (Listing Obligations and Disclosure Requirements) Regulations, 2015, other applicable provisions, if any, of the Companies Act, 2013 and the applicable Rules made thereunder, including any amendment(s), statutory modification(s) and/or re-enactment thereof for the time being in force, approval of the Members of the Company be and is hereby granted to Dr. Reena Ramachandran (DIN 00212371), who has attained the age of seventy five (75) years, to continue to be a Non-Executive Independent Woman Director of the Company to hold office for a second term of 5 (five) years commencing from August 28, 2019.
UPL Limited
Annual Report 2018-19 | 59

1. A MEMBER ENTITLED TO ATTEND AND VOTE AT THE MEETING IS ENTITLED TO APPOINT A PROXY TO ATTEND AND VOTE INSTEAD OF HIMSELF AND SUCH PROXY NEED NOT BE A MEMBER. The instrument appointing proxy in order to be effective should be duly stamped, completed and signed and should be deposited at the Registered Office of the Company not later than 48 hours before the time fixed for the meeting.
A person can act as a proxy on behalf of members not exceeding fifty and holding in the aggregate not more than ten percent of the total share capital of the Company carrying voting rights. A member holding more than ten percent of the total share capital of the Company carrying voting rights may appoint a single person as proxy and such person shall not act as a proxy for any other person or shareholder.
2. All documents referred to in the accompanying Notice are open for inspection at the Registered Office of the Company on all working days except Saturdays between 11.00 a.m. and 1.00 p.m. up to the date of 35th Annual General Meeting.
3. Corporate members intending to send their authorized representatives to attend the Meeting are requested to send to the Company a certified true copy of the Board Resolution authorizing their representative to attend and vote on their behalf at the Meeting.
4. Members/Proxies should bring the Attendance Slip duly filled in for attending the meeting.
5. The Members are requested to kindly send all their correspondence relating to the change of address, transmission/ transposition requests of shares, etc. directly to the Company’s Registrar & Transfer Agents – Link Intime India Pvt. Ltd., Unit: UPL Limited, C 101, 247 Park, L B S. Marg, Vikhroli (West), Mumbai 400 083, quoting their Folio Number and in case their shares are held in dematerialized form, the intimation of change of address should be passed on to their respective Depository Participants.
6. Payment of dividend as recommended by the Directors, if declared at the Meeting, will be made on or after 2nd September, 2019 to the Members whose names stand in the Company’s Register of Members on 29th May, 2019 being the RECORD DATE and to the Beneficiary Holders as per the Beneficiary List provided for the purpose by the National Securities Depository Limited and Central Depository Services (India) Limited.
7. Members seeking any information with regard to Accounts are requested to write to the Company at an early date so as to enable the management to keep the information ready.
8. Pursuant to the provisions of Section 205A of the Companies Act, 1956, unclaimed dividend for the
financial year 1994-95 has been transferred to the General Revenue Account of the Central Government as required by the Companies Unpaid Dividend (Transfer to General Revenue Account of the Central Government) Rules, 1978. Members who have not encashed the Dividend Warrants pertaining to the said period may make their claims to the Registrar of Companies, Gujarat, Ahmedabad by submitting an application in prescribed form.
9. Pursuant to the provisions of Section 205A(5) of the Companies Act, 1956/ Section 124(5) of the Companies Act, 2013 , as amended-
(a) Dividend for the year 1996-97 and from 2003-04 to 2010-11 and Interim Dividend for the year 2011-12 which remained unclaimed for a period of seven years from the date of transfer of same to the unpaid dividend account of the Company have been transferred to the Investor Education and Protection Fund established by the Central Government pursuant to Section 205C of the Companies Act, 1956/ Section 125(1) of the Companies Act, 2013.
(b) Dividend for the years 2011-12 to 2017-18 which remain unclaimed for a period of seven years from the date of transfer of same to the unpaid dividend account of the Company will be transferred to the Investor Education and Protection Fund established by the Central Government pursuant to Section 125(1) of the Companies Act, 2013.
Pursuant to the provisions of Investor Education and Protection Fund (Uploading of information regarding unpaid and unclaimed amounts lying with companies) Rules, 2012, the Company has uploaded the details of unpaid and unclaimed amounts lying with the Company as on 23rd August, 2018, on the website of the Company i.e. www.upl-ltd.com and also on the website of the Ministry of Corporate Affairs.
10. (a) Adhering to the various requirements set out in the Investor Education and Protection Fund Authority (Accounting, Audit, Transfer and Refund) Rules, 2016, as amended, the Company has, during financial year 2018-19, transferred to the IEPF Authority all shares in respect of which dividend had remained unpaid or unclaimed for seven consecutive years or more as on the due date of transfer, i.e. 30th September, 2018. Details of shares transferred to the IEPF Authority are available on the website of the Company and the same can be accessed through the link https://www.upl-ltd.com/pdf/policies/IEPF_News.pdf . The said details have also been uploaded on the website of the IEPF Authority and the same can be accessed through the link www.iepf.gov.in
NOTES:
UPL Limited
60 | Annual Report 2018-19

(b) Members may note that shares as well as unclaimed dividends transferred to IEPF Authority can be claimed back from them. Concerned members/investors are advised to visit the web link http://iepf.gov.in/IEPFA/refund.html or contact Link Intime India Pvt. Ltd. for lodging claim for refund of shares and / or dividend from the IEPF Authority.
11. Members who have not registered their e-mail addresses so far, are requested to register their e-mail address for receiving all communication including Annual Report, Notices, Circulars, etc. from the Company electronically.
12. TheCompany is providing facility of one-way live webcast of the proceedings of the AGM from 11 am (IST) till the conclusion of the AGM. Members can use their remote e-voting login and password to view the proceedings of the AGM by accessing NSDL website where the EVEN number of the Compnay will be displayed.
13. Voting Options
(1) Voting through Electronic Means: Pursuant to provisions of Section 108 of the Companies
Act, 2013 and Rule 20 of the Companies (Management and Administration) Rules, 2014, as amended by the Companies (Management and Administration) Amendment Rules, 2015 and Regulation 44 of Securities and Exchange Board of India (Listing Obligations and Disclosure Requirements) Regulations, 2015 and Secretarial Standard-2 (SS-2) on “General Meetings” issued by the Institutes of Company Secretaries of India, the Company is pleased to provide members facility to exercise their right to vote at the General Meeting by electronic means and the business may be transacted through e-Voting Services. The facility of casting the votes by the members using an electronic voting system from a place other than venue of the General Meeting (“remote e-voting”) will be provided by National Securities Depository Limited (NSDL).
The Company has approached NSDL for providing remote e-voting services through e-voting platform. In this regard, your Demat Account/Folio Number has been enrolled by the Company for your participation in remote e-voting on resolutions placed by the Company on remote e-Voting system.
The Notice of the 35th Annual General Meeting of the Company inter alia indicating the process and manner of remote e-Voting process along with printed Attendance Slip and Proxy Form can be downloaded from the link https://www.evoting.nsdl.com or link https://www.upl-ltd.com
The remote e-voting period commences on August 25, 2019 (9:00 am) and ends on August 27, 2019 (5:00 pm). During this period, shareholders of the Company, holding shares either in physical form or in dematerialized form, as on the cut-off date of 21st August, 2019, may cast their vote by remote e-voting. The remote e-voting module shall be disabled by NSDL
for voting thereafter. Once the vote on a resolution is cast by the shareholder, the shareholder shall not be allowed to change it subsequently.
The voting rights of members shall be in proportion to their shares of the paid up equity share capital of the Company as on the cut-off date i.e. August 21, 2019.
Subject to receipt of requisite number of votes, the Resolutions shall be deemed to be passed on the date of the Meeting, i.e. 28th August, 2019.
The process and manner for remote e-voting are as under:
A. In case a Member receives an email from NSDL [for members whose email IDs are registered with the Company/Depository Participants(s)] :
(i) Open email and open PDF file viz; “UPL remote e-voting.pdf” with your Client ID or Folio No. as password. The said PDF file contains your user ID and password/PIN for remote e-voting. Please note that the password is an initial password.
(ii) Launch internet browser by typing the following URL: https://www.evoting.nsdl.com/
(iii) Click on Shareholder - Login
(iv) Enter user ID and password as initial password/PIN noted in step (i) above. Click Login.
(v) Password change menu appears. Change the password/PIN with new password of your choice with minimum 8 digits/characters or combination thereof. Note new password. It is strongly recommended not to share your password with any other person and take utmost care to keep your password confidential.
(vi) Home page of remote e-voting opens. Click on remote e-voting: Active Voting Cycles.
(vii) Select “EVEN” of “UPL Limited”.
(viii) Now you are ready for remote e-voting as Cast Vote page opens.
(ix) Cast your vote by selecting appropriate option and click on “Submit” and also “Confirm” when prompted.
(x) Upon confirmation, the message “Vote cast successfully” will be displayed.
(xi) Once you have voted on the resolution, you will not be allowed to modify your vote.
(xii) Institutional shareholders (i.e. other than individuals, HUF, NRI etc.) are required to send scanned copy (PDF/JPG Format) of the relevant Board Resolution/ Authority letter etc. together with attested specimen signature of the duly authorized signatory(ies) who are authorized
Annual Report 2018-19 | 61
UPL Limited

to vote, to the Scrutinizer through e-mail to [email protected] with a copy marked to [email protected]
B. In case a Member receives physical copy of the Notice of Annual General Meeting [for members whose email IDs are not registered with the Company/Depository Participant(s) or requesting physical copy]
(i) Initial password is provided as below/at the bottom of the Attendance Slip for the Annual General Meeting.
EVEN (Remote e-voting Event Number) USER ID PASSWORD/PIN
(ii) Please follow all steps from Sl. No. (ii) to (xii) above, to cast vote.
(2) Voting at AGM: The Chairman shall, at the 35th Annual General Meeting,
at the end of discussion on the resolutions on which voting is to be held, allow voting with the assistance of scrutinizer, by use of ballot paper for all those members who are present at the General Meeting but have not cast their votes by availing the remote e-voting facility.
Please note the following: A member may participate in the 35th Annual General
Meeting even after exercising his right to vote through remote e-voting but shall not be allowed to vote again at the General Meeting.
A person, whose name is recorded in the register of members or in the register of beneficial owners maintained by the depositories as on the cut-off date i.e. August 21, 2019 only shall be entitled to avail the facility of remote e-voting as well as voting at the General Meeting through ballot paper.
The Board of Directors have appointed Mr. Jawahar Thacker, Chartered Accountant (Membership No. FCA 030646), as the Scrutinizer to scrutinize the voting and remote e-voting process in a fair and transparent manner.
The Scrutinizer shall after the conclusion of voting at the general meeting, will first count the votes cast at the meeting and thereafter unblock the votes cast through remote e-voting in the presence of at least two witnesses not in the employment of the Company and shall make, not later than 48 hours of the conclusion of the General Meeting, a consolidated scrutinizer’s report of the total votes cast in favour or against, if any, to the
Chairman or a person authorized by him in writing, who shall countersign the same and declare the result of the voting forthwith.
The results of voting will be declared and the same along with the Scrutinizers Report will be published on the website of the Company (www.upl-ltd.com) and the website of NSDL (www.nsdl.com) immediately after the declaration of result by the Chairman and the same will also be communicated to BSE Limited and the National Stock Exchange of India Limited within 48 hours from the conclusion of the Annual General Meeting.
Other information: o Login to remote e-voting website will be disabled
upon five unsuccessful attempts to key-in the correct password. In such an event, you will need to go through ‘Forgot Password’ option available on the site to reset the same.
o Your login id and password can be used by you exclusively for remote e-voting on the resolutions placed by the companies in which you are the shareholder.
o It is strongly recommended not to share your password with any other person and take utmost care to keep it confidential.
o Any person, who acquires shares of the Company and becomes member of the Company after dispatch of the notice and holding shares as on the cut-off date i.e. August 21, 2019, may obtain the login ID and password by sending a request at [email protected] or contact Company’s Registrar & Transfer Agent.
However, If you are already registered with NSDL for remote e-voting then you can use your existing user ID and password/PIN for casting your vote. If you forgot your password, you can reset your password by using “Forgot User Details/Password” option available on www.evoting.nsdl.com or contact NSDL at the toll free no.: 1800-222-990.
o You can also update your mobile number and e-mail id in the user profile details of the folio which may be used for sending future communication(s).
In case of any queries, you may refer to the Frequently Asked Questions (FAQs) for members and remote e-voting user manual for members available at the Downloads sections of https://www.evoting.nsdl.com or contact NSDL at the toll free no.: 1800-222-990.
Mumbai: 17th May, 2019 By Order of the Board of Directors For UPL LIMITEDRegistered Office:3-11, G.I.D.C., Vapi,Dist. Valsad, Gujarat, Rajnikant Devidas ShroffPin - 396 195. Chairman and Managing DirectorCIN: L24219GJ1985PLC025132 (DIN: 00180810)
62 | Annual Report 2018-19
UPL Limited
The Explanatory Statement for Item Nos. 4 to 7 of the accompanying Notice set out hereinabove is as under:
Item No. 4:The Board, on the recommendation of the Audit Committee, has approved the appointment and remuneration of M/S. RA & Co., Cost Auditors to conduct the audit of the cost records of the Company for the financial year ending March 31, 2020.
In accordance with the provisions of Section 148 of the Companies Act, 2013 read with the Companies (Audit and Auditors) Rules, 2014, the remuneration payable to the Cost Auditors has to be ratified by the shareholders of the Company.
Accordingly, consent of the members is sought for passing an Ordinary Resolution as set out at Item No. 4 of the Notice for ratification of the remuneration payable to the Cost Auditors for the financial year ending March 31, 2020.
None of the Directors / Key Managerial Personnel of the Company / their relatives are, in any way, concerned or interested, financially or otherwise, in the resolution set out at Item No. 4 of the Notice.
The Board commends the Ordinary Resolution set out at Item No. 4 of the accompanying Notice for approval by the Members of the Company.
Item No.5:As per Sections 42 and 71 of the Act, read with the Rules framed thereunder, a company offering or making an invitation to subscribe to Non-Convertible Debentures (NCDs) on a private placement basis, is required to obtain the prior approval of the Members by way of a Special Resolution. Such an approval can be obtained once a year for all the offers and invitations made for such NCDs during the year.
NCDs, issued on private placement basis, is a significant source of borrowings for the Company. The approval of the Members is being sought by way of a Special Resolution under Sections 42 and 71 of the Act read with the Rules made thereunder, to enable the Company to offer or invite subscriptions of NCDs on a private placement basis, in one or more tranches for an amount not exceeding H3,000 crores (Rupees Three Thousand Crores Only) during the period of one year from the date of passing of the Resolution at Item No.5, within the overall borrowing limits of the Company, as approved by the Members from time to time.
None of the Directors / Key Managerial Personnel of the Company / their relatives are, in any way, concerned or interested, financially or otherwise, in the resolution set out at Item No. 5 of the Notice.
The Board commends the Special Resolution at Item No.5 of the accompanying Notice for approval by the Members of the Company.
Item Nos. 6 and 7The Members of the Company had appointed Mr. Pradeep Vedpraksh Goyal (DIN: 00008370) and Dr. Reena Ramachandran (DIN: 00212371), as Independent Directors of the Company for 5 (five) consecutive years for a term up to the conclusion of the 35th Annual General Meeting of the Company in the calendar year 2019. The Members may note that pursuant to Section 149(10) of the Companies Act, 2013 (“the Act”) an Independent Director shall hold office for a term of up to 5 (five) consecutive years on the Board of a company but shall be eligible for re-appointment for a further term of up to 5 (five) consecutive years on passing of a special resolution by the Company.
The Nomination and Remuneration Committee of the Board of the Company had unanimously recommended to the Board, the re-appointment of Mr. Pradeep Vedpraksh Goyal and Dr. Reena Ramachandran as Independent Directors for another term not exceeding five (5) consecutive years commencing from 28th August, 2019.
The Nomination and Remuneration Committee, while recommending the re-appointment of Mr. Pradeep Vedpraksh Goyal and Dr. Reena Ramachandran, had considered various factors, such as, the number of meetings of Board of Directors, Committees of the Board and General Meetings attended by them, time devoted and their participation at the meetings; their knowledge; skill; expertise; etc., their contributions in attaining Company’s objectives; their independent judgment in the opinion of the entire Board.
Based on the recommendation made by the Nomination and Remuneration Committee as above, the Board of Directors, at its meeting held on 17th May 2019, has unanimously decided to re-appoint Mr. Pradeep Vedpraksh Goyal and Dr. Reena Ramachandran, not liable to retire by rotation, for another term not exceeding 5 (five) consecutive years with effect from 28th August, 2019.
Mr. Pradeep Vedpraksh Goyal and Dr. Reena Ramachandran have given their consent to be re-appointed as such and also the confirmation that they are not disqualified to act as Director in terms of Section 164 of the Act. Further, they have also provided confirmation under Section 149(7) of the Act that they meet the criteria of independence as prescribed, both, under Section 149(6) of the Act read with relevant Rules and under Regulation 16 of the Securities and Exchange Board of India (Listing Obligations and Disclosure Requirements) Regulations, 2015 and they are independent of the management.
EXPLANATORY STATEMENT PURSUANT TO SECTION 102(1) OF THE COMPANIES ACT, 2013.
Annual Report 2018-19 | 63
UPL Limited
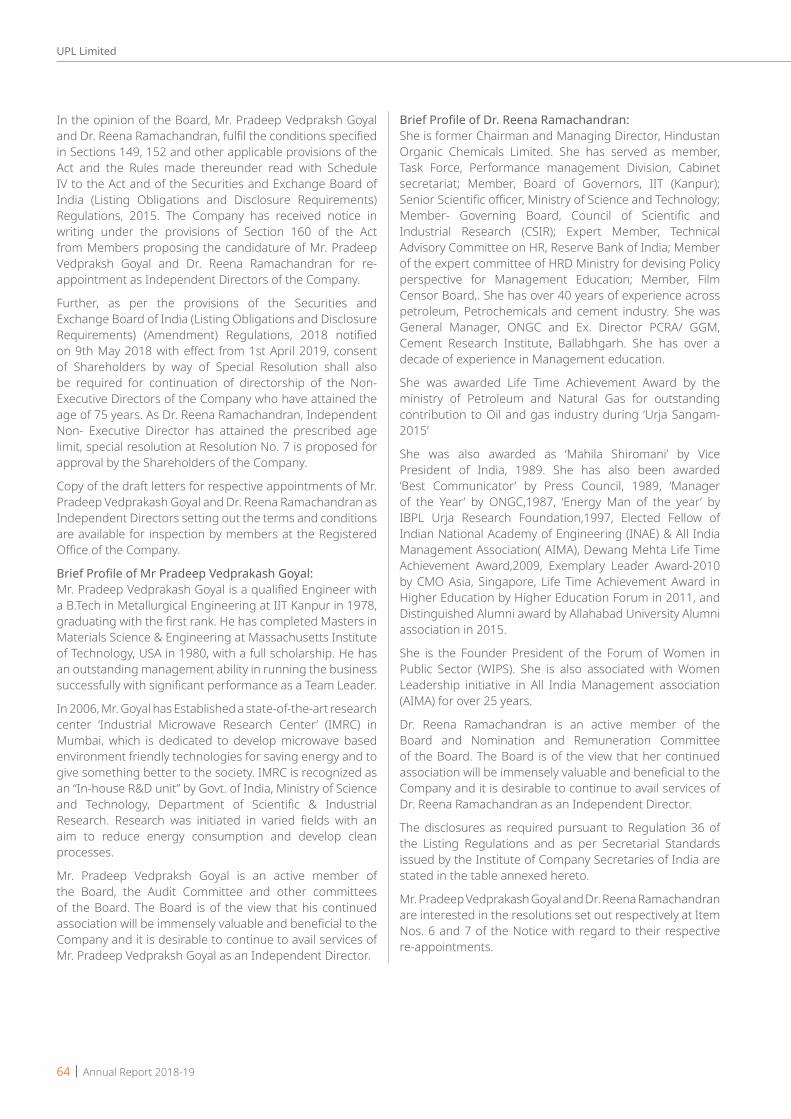
In the opinion of the Board, Mr. Pradeep Vedpraksh Goyal and Dr. Reena Ramachandran, fulfil the conditions specified in Sections 149, 152 and other applicable provisions of the Act and the Rules made thereunder read with Schedule IV to the Act and of the Securities and Exchange Board of India (Listing Obligations and Disclosure Requirements) Regulations, 2015. The Company has received notice in writing under the provisions of Section 160 of the Act from Members proposing the candidature of Mr. Pradeep Vedpraksh Goyal and Dr. Reena Ramachandran for re-appointment as Independent Directors of the Company.
Further, as per the provisions of the Securities and Exchange Board of India (Listing Obligations and Disclosure Requirements) (Amendment) Regulations, 2018 notified on 9th May 2018 with effect from 1st April 2019, consent of Shareholders by way of Special Resolution shall also be required for continuation of directorship of the Non-Executive Directors of the Company who have attained the age of 75 years. As Dr. Reena Ramachandran, Independent Non- Executive Director has attained the prescribed age limit, special resolution at Resolution No. 7 is proposed for approval by the Shareholders of the Company.
Copy of the draft letters for respective appointments of Mr. Pradeep Vedprakash Goyal and Dr. Reena Ramachandran as Independent Directors setting out the terms and conditions are available for inspection by members at the Registered Office of the Company.
Brief Profile of Mr Pradeep Vedprakash Goyal:Mr. Pradeep Vedprakash Goyal is a qualified Engineer with a B.Tech in Metallurgical Engineering at IIT Kanpur in 1978, graduating with the first rank. He has completed Masters in Materials Science & Engineering at Massachusetts Institute of Technology, USA in 1980, with a full scholarship. He has an outstanding management ability in running the business successfully with significant performance as a Team Leader.
In 2006, Mr. Goyal has Established a state-of-the-art research center ‘Industrial Microwave Research Center’ (IMRC) in Mumbai, which is dedicated to develop microwave based environment friendly technologies for saving energy and to give something better to the society. IMRC is recognized as an “In-house R&D unit” by Govt. of India, Ministry of Science and Technology, Department of Scientific & Industrial Research. Research was initiated in varied fields with an aim to reduce energy consumption and develop clean processes.
Mr. Pradeep Vedpraksh Goyal is an active member of the Board, the Audit Committee and other committees of the Board. The Board is of the view that his continued association will be immensely valuable and beneficial to the Company and it is desirable to continue to avail services of Mr. Pradeep Vedpraksh Goyal as an Independent Director.
Brief Profile of Dr. Reena Ramachandran:She is former Chairman and Managing Director, Hindustan Organic Chemicals Limited. She has served as member, Task Force, Performance management Division, Cabinet secretariat; Member, Board of Governors, IIT (Kanpur); Senior Scientific officer, Ministry of Science and Technology; Member- Governing Board, Council of Scientific and Industrial Research (CSIR); Expert Member, Technical Advisory Committee on HR, Reserve Bank of India; Member of the expert committee of HRD Ministry for devising Policy perspective for Management Education; Member, Film Censor Board,. She has over 40 years of experience across petroleum, Petrochemicals and cement industry. She was General Manager, ONGC and Ex. Director PCRA/ GGM, Cement Research Institute, Ballabhgarh. She has over a decade of experience in Management education.
She was awarded Life Time Achievement Award by the ministry of Petroleum and Natural Gas for outstanding contribution to Oil and gas industry during ‘Urja Sangam- 2015’
She was also awarded as ‘Mahila Shiromani’ by Vice President of India, 1989. She has also been awarded ‘Best Communicator’ by Press Council, 1989, ‘Manager of the Year’ by ONGC,1987, ‘Energy Man of the year’ by IBPL Urja Research Foundation,1997, Elected Fellow of Indian National Academy of Engineering (INAE) & All India Management Association( AIMA), Dewang Mehta Life Time Achievement Award,2009, Exemplary Leader Award-2010 by CMO Asia, Singapore, Life Time Achievement Award in Higher Education by Higher Education Forum in 2011, and Distinguished Alumni award by Allahabad University Alumni association in 2015.
She is the Founder President of the Forum of Women in Public Sector (WIPS). She is also associated with Women Leadership initiative in All India Management association (AIMA) for over 25 years.
Dr. Reena Ramachandran is an active member of the Board and Nomination and Remuneration Committee of the Board. The Board is of the view that her continued association will be immensely valuable and beneficial to the Company and it is desirable to continue to avail services of Dr. Reena Ramachandran as an Independent Director.
The disclosures as required pursuant to Regulation 36 of the Listing Regulations and as per Secretarial Standards issued by the Institute of Company Secretaries of India are stated in the table annexed hereto.
Mr. Pradeep Vedprakash Goyal and Dr. Reena Ramachandran are interested in the resolutions set out respectively at Item Nos. 6 and 7 of the Notice with regard to their respective re-appointments.
64 | Annual Report 2018-19
UPL Limited

The relatives of Mr. Pradeep Vedprakash Goyal and Dr. Reena Ramachandran may be deemed to be interested in the resolutions set out respectively at Item Nos. 6 and 7 of the Notice, to the extent of their shareholding interest, if any, in the Company.
Save and except the above, none of the other Directors / Key Managerial Personnel of the Company / their relatives
are, in any way, concerned or interested, financially or otherwise, in these resolutions.
The Board commends the Special Resolutions set out at Item Nos. 6 and 7 of the Notice for approval by the shareholders.
Mumbai: 17th May, 2019 By Order of the Board of Directors For UPL LIMITEDRegistered Office:3-11, G.I.D.C., Vapi,Dist. Valsad, Gujarat, Rajnikant Devidas ShroffPin - 396 195. Chairman and Managing DirectorCIN: L24219GJ1985PLC025132 (DIN: 00180810)
Annual Report 2018-19 | 65
UPL Limited
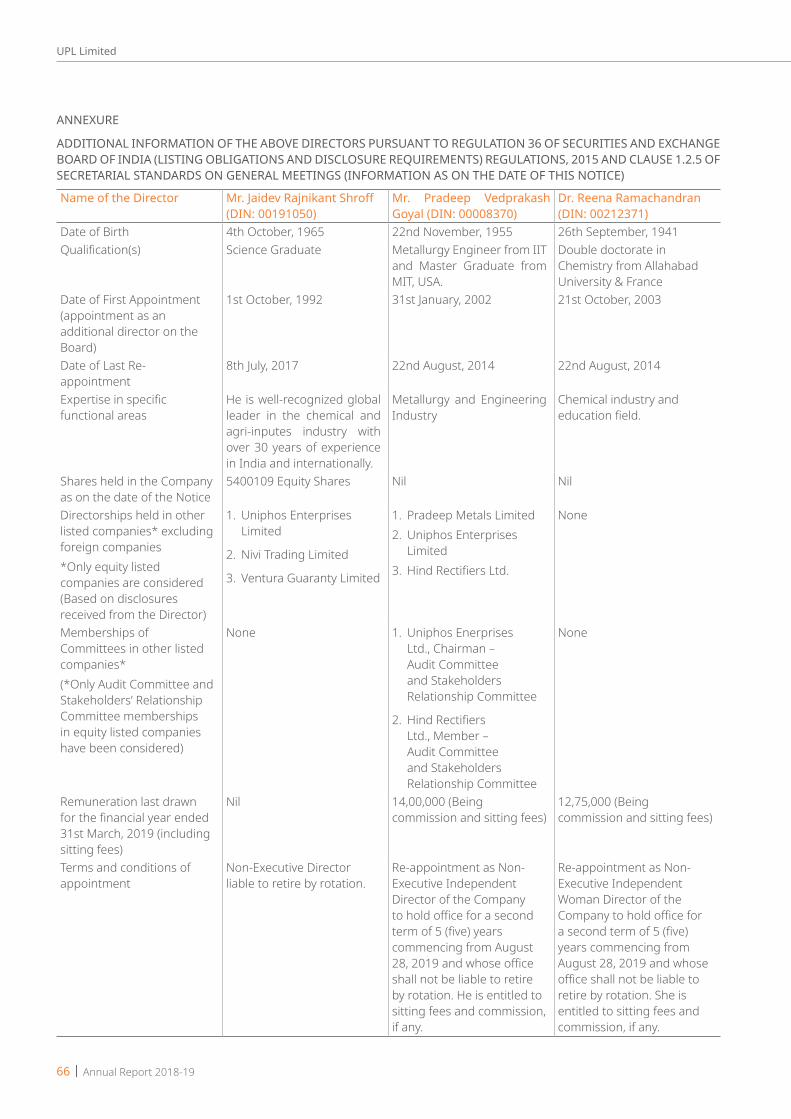
ANNEXURE
ADDITIONAL INFORMATION OF THE ABOVE DIRECTORS PURSUANT TO REGULATION 36 OF SECURITIES AND EXCHANGE BOARD OF INDIA (LISTING OBLIGATIONS AND DISCLOSURE REQUIREMENTS) REGULATIONS, 2015 AND CLAUSE 1.2.5 OF SECRETARIAL STANDARDS ON GENERAL MEETINGS (INFORMATION AS ON THE DATE OF THIS NOTICE)
Name of the Director Mr. Jaidev Rajnikant Shroff(DIN: 00191050)
Mr. Pradeep Vedprakash Goyal (DIN: 00008370)
Dr. Reena Ramachandran(DIN: 00212371)
Date of Birth 4th October, 1965 22nd November, 1955 26th September, 1941Qualification(s) Science Graduate Metallurgy Engineer from IIT
and Master Graduate from MIT, USA.
Double doctorate in Chemistry from Allahabad University & France
Date of First Appointment (appointment as an additional director on the Board)
1st October, 1992 31st January, 2002 21st October, 2003
Date of Last Re-appointment
8th July, 2017 22nd August, 2014 22nd August, 2014
Expertise in specific functional areas
He is well-recognized global leader in the chemical and agri-inputes industry with over 30 years of experience in India and internationally.
Metallurgy and Engineering Industry
Chemical industry and education field.
Shares held in the Company as on the date of the Notice
5400109 Equity Shares Nil Nil
Directorships held in other listed companies* excluding foreign companies *Only equity listed companies are considered (Based on disclosures received from the Director)
1. Uniphos Enterprises Limited
2. Nivi Trading Limited
3. Ventura Guaranty Limited
1. Pradeep Metals Limited2. Uniphos Enterprises
Limited3. Hind Rectifiers Ltd.
None
Memberships of Committees in other listed companies* (*Only Audit Committee and Stakeholders’ Relationship Committee memberships in equity listed companies have been considered)
None 1. Uniphos Enerprises Ltd., Chairman – Audit Committee and Stakeholders Relationship Committee
2. Hind Rectifiers Ltd., Member – Audit Committee and Stakeholders Relationship Committee
None
Remuneration last drawn for the financial year ended 31st March, 2019 (including sitting fees)
Nil 14,00,000 (Being commission and sitting fees)
12,75,000 (Being commission and sitting fees)
Terms and conditions of appointment
Non-Executive Director liable to retire by rotation.
Re-appointment as Non-Executive Independent Director of the Company to hold office for a second term of 5 (five) years commencing from August 28, 2019 and whose office shall not be liable to retire by rotation. He is entitled to sitting fees and commission, if any.
Re-appointment as Non-Executive Independent Woman Director of the Company to hold office for a second term of 5 (five) years commencing from August 28, 2019 and whose office shall not be liable to retire by rotation. She is entitled to sitting fees and commission, if any.
66 | Annual Report 2018-19
UPL Limited
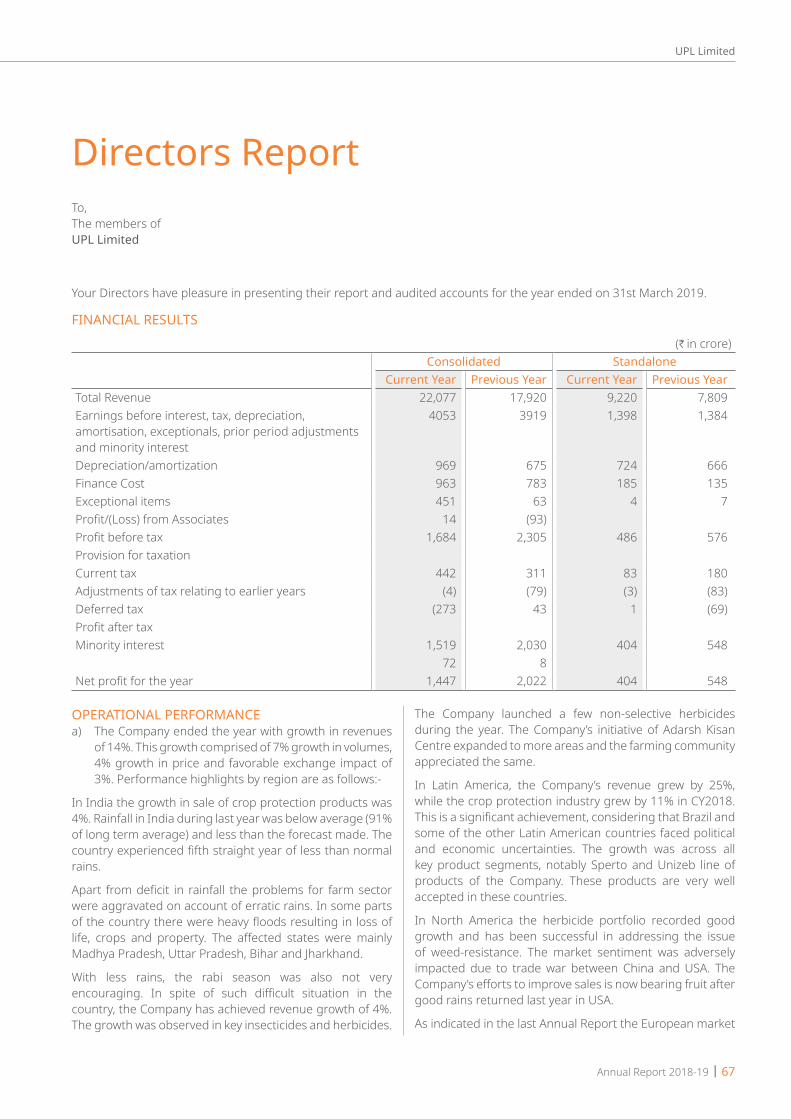
Your Directors have pleasure in presenting their report and audited accounts for the year ended on 31st March 2019.
FINANCIAL RESULTS
Directors ReportTo,The members ofUPL Limited
(H in crore)Consolidated Standalone
Current Year Previous Year Current Year Previous YearTotal Revenue 22,077 17,920 9,220 7,809Earnings before interest, tax, depreciation, amortisation, exceptionals, prior period adjustments and minority interest
4053 3919 1,398 1,384
Depreciation/amortization 969 675 724 666Finance Cost 963 783 185 135Exceptional items 451 63 4 7Profit/(Loss) from Associates 14 (93)Profit before tax 1,684 2,305 486 576Provision for taxationCurrent tax 442 311 83 180Adjustments of tax relating to earlier years (4) (79) (3) (83)Deferred tax (273 43 1 (69)Profit after taxMinority interest 1,519 2,030 404 548
72 8Net profit for the year 1,447 2,022 404 548
OPERATIONAL PERFORMANCEa) The Company ended the year with growth in revenues
of 14%. This growth comprised of 7% growth in volumes, 4% growth in price and favorable exchange impact of 3%. Performance highlights by region are as follows:-
In India the growth in sale of crop protection products was 4%. Rainfall in India during last year was below average (91% of long term average) and less than the forecast made. The country experienced fifth straight year of less than normal rains.
Apart from deficit in rainfall the problems for farm sector were aggravated on account of erratic rains. In some parts of the country there were heavy floods resulting in loss of life, crops and property. The affected states were mainly Madhya Pradesh, Uttar Pradesh, Bihar and Jharkhand.
With less rains, the rabi season was also not very encouraging. In spite of such difficult situation in the country, the Company has achieved revenue growth of 4%. The growth was observed in key insecticides and herbicides.
The Company launched a few non-selective herbicides during the year. The Company’s initiative of Adarsh Kisan Centre expanded to more areas and the farming community appreciated the same.
In Latin America, the Company’s revenue grew by 25%, while the crop protection industry grew by 11% in CY2018. This is a significant achievement, considering that Brazil and some of the other Latin American countries faced political and economic uncertainties. The growth was across all key product segments, notably Sperto and Unizeb line of products of the Company. These products are very well accepted in these countries.
In North America the herbicide portfolio recorded good growth and has been successful in addressing the issue of weed-resistance. The market sentiment was adversely impacted due to trade war between China and USA. The Company’s efforts to improve sales is now bearing fruit after good rains returned last year in USA.
As indicated in the last Annual Report the European market
Annual Report 2018-19 | 67
UPL Limited

has begun improving. Southern Europe witnessed wet weather resulting in growth in sale of fungicides. Also, the sugar beet season has been good, and this has driven sales of herbicides and fungicides.
As regards rest of the world, the revenue growth has been 6%. Africa and South East Asia countries have been the growth drivers in this region. The herbicide sales are improving in these markets. However, in Australia the extended drought impacted sales.
ACQUISITION OF ARYSTA LIFESCIENCEDuring the year the Company through its subsidiary, UPL Corporation Limited in Mauritius, acquired Arysta LifeScience. Arysta had a turnover close to US$ 2 billion. It too is a global provider of innovative crop protection solutions, including bio-solutions and seed treatment. Further, there is minimal overlap in the product portfolios of UPL and Arysta. The product portfolios of both companies are complementary, leading to significant cross-selling opportunities. In terms of regional presence, Arysta’s stronger presence in Africa and Eastern Europe means that the combined entity will be able to offer a wide basket of solutions for various raw crops and specialty crops across a broad swathe of countries. This will comprise of crop protection products, bio-solutions and seed treatment products. This will encompass all aspects of crop life cycle, starting from seed up to post harvest. This acquisition will result in enhanced R&D capabilities for the group.
The acquisition was made for US$ 4.2 billion. This was funded through a combination of fresh equity and debt at UPL Corporation level. The debt of US$ 3 billion was provided by a syndicate of banks. The Company obtained all the regulatory approvals necessary to complete the acquisition in a period of six months.
With this acquisition the Company will be among top five global crop protection product companies.
FUTURE OUTLOOKWe expect the global crop protection industry to generate higher volumes in 2019, supported by improvement in prices. UPL is ideally positioned to take advantage of these upsides. The acquisition of Arysta LifeScience is opportune in that sense. Arysta brings with it a vast marketing network, multiple distribution channels, access to newer markets, a much wider and complementary product portfolio, making the future of the combined Company very bright. Arysta’s strong presence in fast growing segments like bio-solutions and seed treatment will ensure that the Company is future ready. The Company has established its brand image in the market as a trusted supplier, which guarantees quality products at competitive prices. The Company devises its marketing strategies in a manner that ensures a win-win scenario for all stakeholders at all times. Overall a very bright and promising future is expected for the Company.
DIVIDENDYour Directors have recommended dividend of 400% i.e. H8 per Equity Share of H2 each for the financial year ended 31st
March, 2019, which if approved at the forthcoming Annual General Meeting, will be paid to all those Equity Shareholders of the Company whose names appear in the Register of Members as on 29th May, 2019 and whose names appear as beneficial owners as per the beneficiary list furnished for the purpose by National Securities Depository Limited and Central Depository Services (India) Limited.
DIVIDEND DISTRIBUTION POLICYPursuant to Regulation 43A of the SEBI (Listing Obligations and Disclosure Requirements) Regulations, 2015 (“LODR”) the Company has formulated its Dividend Distribution Policy and the same is uploaded on the website of the Company which can be accessed at https://www.upl-ltd.com/policies-compliances-announcements.
BONUS SHARESTo mark the golden jubilee of the Company, your Directors have announced issue of Bonus Shares in the ratio of one bonus share for every two shares held by the member. The same will be subject to the approval of the members and for this a separate Extra Ordinary General Meeting will be held. On approval by the members, the Bonus Shares will be issued to those members whose names appear in the register of members as on the record date which will be announced after the said Extra Ordinary General Meeting and to those members whose names appear as beneficial owners as per the beneficiary list furnished for the purpose by National Securities Depository Limited and Central Depositary Services (India) Limited.
FINANCE(a) Fixed Deposits The Company has not accepted fixed deposits during
the year. There are no fixed deposits outstanding as at 31st March, 2019.
(b) Particulars of Loans, Guarantees or Investments The details of Loans, Guarantees or Investments are
given in the notes to the Financial Statements.
(c) Changes in Paid-up Share Capital During the year the Company has issued and allotted
the following shares:
(i) 9,589 equity shares of H2 each to Employees under Employee Stock Option Plan of the Company.
CREDIT RATINGThe Company has a good reputation for prudent financial management and ability to meet its financial commitments. The Company’s credit facilities in India have been rated by CARE as CARE AA+(Negative) for long term facilities and CARE A1+ for short term facilities and by CRISIL as CRISIL AA+(Negative) for long term facilities and CRISIL A1+ for short term facilities. Company’s commercial paper are rated by CARE as CARE A1+ and by CRISIL as CRISIL A1+. Company’s non-convertible debentures are rated by CARE as CARE AA+ (Negative) and by Brickwork Ratings as BWR AA+(Stable).
68 | Annual Report 2018-19
UPL Limited
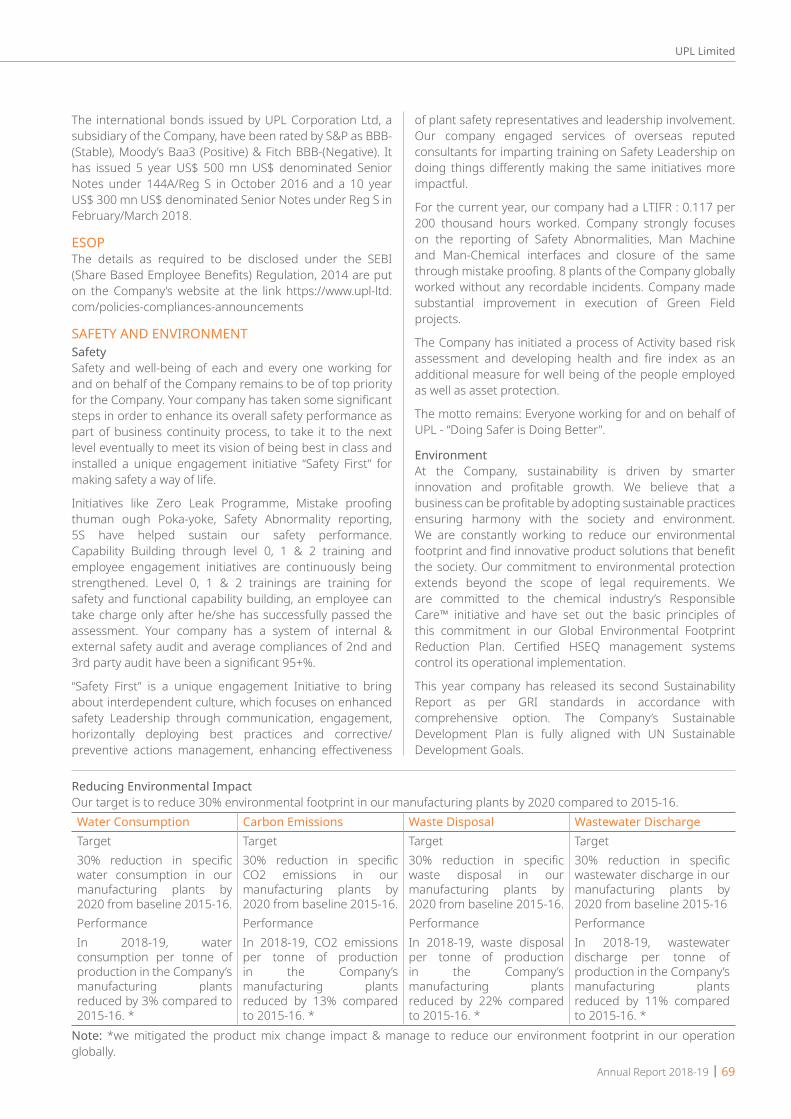
The international bonds issued by UPL Corporation Ltd, a subsidiary of the Company, have been rated by S&P as BBB-(Stable), Moody’s Baa3 (Positive) & Fitch BBB-(Negative). It has issued 5 year US$ 500 mn US$ denominated Senior Notes under 144A/Reg S in October 2016 and a 10 year US$ 300 mn US$ denominated Senior Notes under Reg S in February/March 2018.
ESOPThe details as required to be disclosed under the SEBI (Share Based Employee Benefits) Regulation, 2014 are put on the Company’s website at the link https://www.upl-ltd.com/policies-compliances-announcements
SAFETY AND ENVIRONMENTSafetySafety and well-being of each and every one working for and on behalf of the Company remains to be of top priority for the Company. Your company has taken some significant steps in order to enhance its overall safety performance as part of business continuity process, to take it to the next level eventually to meet its vision of being best in class and installed a unique engagement initiative “Safety First” for making safety a way of life.
Initiatives like Zero Leak Programme, Mistake proofing thuman ough Poka-yoke, Safety Abnormality reporting, 5S have helped sustain our safety performance. Capability Building through level 0, 1 & 2 training and employee engagement initiatives are continuously being strengthened. Level 0, 1 & 2 trainings are training for safety and functional capability building, an employee can take charge only after he/she has successfully passed the assessment. Your company has a system of internal & external safety audit and average compliances of 2nd and 3rd party audit have been a significant 95+%.
“Safety First” is a unique engagement Initiative to bring about interdependent culture, which focuses on enhanced safety Leadership through communication, engagement, horizontally deploying best practices and corrective/preventive actions management, enhancing effectiveness
of plant safety representatives and leadership involvement. Our company engaged services of overseas reputed consultants for imparting training on Safety Leadership on doing things differently making the same initiatives more impactful.
For the current year, our company had a LTIFR : 0.117 per 200 thousand hours worked. Company strongly focuses on the reporting of Safety Abnormalities, Man Machine and Man-Chemical interfaces and closure of the same through mistake proofing. 8 plants of the Company globally worked without any recordable incidents. Company made substantial improvement in execution of Green Field projects.
The Company has initiated a process of Activity based risk assessment and developing health and fire index as an additional measure for well being of the people employed as well as asset protection.
The motto remains: Everyone working for and on behalf of UPL - “Doing Safer is Doing Better”.
EnvironmentAt the Company, sustainability is driven by smarter innovation and profitable growth. We believe that a business can be profitable by adopting sustainable practices ensuring harmony with the society and environment. We are constantly working to reduce our environmental footprint and find innovative product solutions that benefit the society. Our commitment to environmental protection extends beyond the scope of legal requirements. We are committed to the chemical industry’s Responsible Care™ initiative and have set out the basic principles of this commitment in our Global Environmental Footprint Reduction Plan. Certified HSEQ management systems control its operational implementation.
This year company has released its second Sustainability Report as per GRI standards in accordance with comprehensive option. The Company’s Sustainable Development Plan is fully aligned with UN Sustainable Development Goals.
Reducing Environmental ImpactOur target is to reduce 30% environmental footprint in our manufacturing plants by 2020 compared to 2015-16.Water Consumption Carbon Emissions Waste Disposal Wastewater DischargeTarget Target Target Target30% reduction in specific water consumption in our manufacturing plants by 2020 from baseline 2015-16.
30% reduction in specific CO2 emissions in our manufacturing plants by 2020 from baseline 2015-16.
30% reduction in specific waste disposal in our manufacturing plants by 2020 from baseline 2015-16.
30% reduction in specific wastewater discharge in our manufacturing plants by 2020 from baseline 2015-16
Performance Performance Performance PerformanceIn 2018-19, water consumption per tonne of production in the Company’s manufacturing plants reduced by 3% compared to 2015-16. *
In 2018-19, CO2 emissions per tonne of production in the Company’s manufacturing plants reduced by 13% compared to 2015-16. *
In 2018-19, waste disposal per tonne of production in the Company’s manufacturing plants reduced by 22% compared to 2015-16. *
In 2018-19, wastewater discharge per tonne of production in the Company’s manufacturing plants reduced by 11% compared to 2015-16. *
Note: *we mitigated the product mix change impact & manage to reduce our environment footprint in our operation globally.
Annual Report 2018-19 | 69
UPL Limited

We have taken following initiatives this year to make our operating plant sustainable:
Specific Water Reduction InitiativesSustainable industrial water management plays a vital role in achieving future water security in a world where water stress will increase. The optimum utilization of all natural resources is an integral part of the Company’s commitment to sustainable development. Aiming to decrease water demand in our operating plants, following initiatives has been taken this year:
• Reduced 3 % water as compared to our baseline 2015-16 after mitigating product mix change impact
• Recycling of 140 KLD STP treated water in DVACl plant’s Cooling Tower at Unit-0
• Saved 2KLD water through evaporative condenser in IKI plant at Unit-1`
• Installed full fledge rain water harvesting system at Unit-4 Halol
• Increased efficiency of steam condensate recovery system.
• Installed latest technology in Unit -1 & Unit-5 to recycle & reuse treated wastewater into cooling tower to decrease water demand.
Specific Carbon Emissions Reduction InitiativesGreenhouse gases trap heat and make the planet warmer. Human activities are responsible for almost all of the increase in greenhouse gases in the atmosphere. Climate change due to greenhouse gas emissions will have a growing impact on our business. Aiming to decrease carbon emissions in our operating plants, following initiatives has been taken this year:
• Reduced 13 % CO2 emissions as compared to our baseline 2015-16 after mitigating product mix change impact.
• Signed & executed green power purchase agreement for Unit-1 and Unit-5
• Installed Waste heat recovery system in fume incinerator of Unit-2
• Improved chiller performance by Increasing capacity of evaporator and replacement shell and tube type condenser with evaporative condenser at Unit-1
• Power generation from back pressure turbine at Unit-2 and Unit-5
• Installed Waste Heat recovery to condensate to preheat power plant boiler feed water leading to reduce coal consumption by 1620 MT/annum
Specific Waste Reduction InitiativesWe have taken special care to reduce, recycle and eliminate hazardous as well as non-hazardous solid waste. Aiming to decrease waste disposal from our operating plants, following initiatives has been taken this year:
• Reduced 22 % specific waste disposal as compared to baseline 2015-16 from our operating plants after mitigating product mix change impact.
• Reduced incinerable liquid waste by yield improvement at Unit-0 and Unit-1.
• Successful commissioning of Lime bulker handling facility in ammonia plant at Unit-1 to reduce lime dusting waste.
• Improved loss on drying (LOD) of ETP waste at Unit- 5 and Unit-10 to reduce moisture content in waste quantity by installing Volute.
Specific Wastewater Reduction InitiativesAiming to decrease wastewater discharge from our operating plants, following initiatives has been taken this year:
• Reduced 11% specific wastewater discharge from 2015-16 baseline by operational excellence after mitigating product mix change impact.
• Achieved Zero Liquid discharge (ZLD) at Unit-10 Tarapur plant.
• Enhanced overall 61% wastewater treatment capacity.
• Installation of new system in cooling towers to avoid frequent blow down in Unit-3
• Dedicated technology group worked to achieve the environmental excellence and management standards thereby resulting in reduction of environmental footprint.
International Sustainability RatingGlobal risk and opportunities from natural resource scarcity to changing governance standards, from global workforce management to continuous evolving regulatory landscape, Environment Social and Governance (ESG) factors holds the potential to impact short term or long-term risk of an organisation. ESG risks and opportunities assessment assist company’s management to integrate these factors into the business portfolio and management evaluation process to mitigate the impact and embrace upon the arising opportunities.
The Company believes in continuous improvement for growth and transparently communicating the performance to our investors and other stakeholders at large. This year we participated in rating indices like FTSE Russell and DJSI which undertakes a comprehensive exercise of evaluating various ESG parameters of the Company.
Dow Jones Sustainability IndexS&P Dow Jones Indices partners with RobecoSAM, a specialist in sustainability investing, to provide investors with objective benchmarks for managing their sustainability investment portfolios. The DJSI allow the creation of portfolios of companies that fulfil certain sustainability criteria better than most of their peers within a given industry. It aims to represent the top 10% of the largest 800 companies
70 | Annual Report 2018-19
UPL Limited

in 20 emerging markets based on long-term economic, environmental and social criteria and the Company was selected in the top 10% companies which were invited to participate in the DJSI Emerging market index.
Our DJSI score in 2018 has improved 57% from 2017 score.
FTSE Russell index Series:FTSE Russell is a British provider of stock market indices and associated data services, wholly owned by the London Stock Exchange (LSE). FTSE Russell has been at the forefront of innovating ESG indexing for nearly two decades. The FTSE4Good Index Series is a market-leading tool for investors seeking to invest in companies that demonstrate good sustainability practices.
Our FTSE score in 2018 has improved 70% from 2017 score. Therefore, the Company was awarded and listed in FTSE 4 Good Index for strong environmental, social and governance practices which were measured against globally recognised standards.
To understand more depth details about our sustainability practices. We have launched specific website for sustainability along with our corporate website on following link http://sustainability.upl-ltd.com/
RESEARCH AND DEVELOPMENTCompany’s Research and Development Centres located across the Globe play vital role in accomplishing company’s mission of manufacturing and supplying crop protection and specialty products worldwide.
Highly equipped Research and Development Centres have best facilities and high qualified scientific staff. Products and processes are designed and developed at these Centres so that technical products are produced in a cost-effective way. At the same time care is taken that products and processes are environmentally friendly.
Company’s commitment to safe practices and products leads to designing of products and processes which are safe to use. Principles of Green Chemistry are followed by these scientists for the research and development work.
Company’s Research and Development Centres are developing innovative combinations for effective pest management across the Globe. The developed products are tested for chemical properties, toxicity, impurity profile, bio-efficacy, residue and packaging and so on. The required data is generated at Research and Development Centres and then get the products tested at GLP laboratory to generate the data for submission to the regulatory authority of the country.
Company respects Intellectual Property of others and creates its own Intellectual property for the products and processes developed by the Research and Development Centres. Patents are obtained in the countries of interest and appropriate measures are taken to safeguard the IP.
CORPORATE SOCIAL RESPONSIBILITYThe Company’s work for economic and social growth of
community started almost 50 years back because it believes that humankind is one community, where each member is responsible for the wellbeing of the other.
The Company’s manufacturing plants are in 4 states of India – Gujarat, Maharashtra, J&K and West Bengal. Many of its development interventions are focused in these states, but the Company has taken many initiatives of national importance beyond neighbouring communities too.
The Company believes in holistic and sustainable growth of society. Its commitment and interventions cater all the segment of the society and have been classified in 4 focus areas. They are:1. Institutions of Excellence 2. Sustainable Livelihood3. Nature Conservation4. Local and National Need
The Company has built institutions of excellence to RAISE RESPONSIBLE AND SKILLED HUMAN CAPITAL in the region through Academic excellence, Holistic growth and Vocational & life skills. It has built and is managing
1. Sandra Shroff Gnyan Dham School, Vapi - 1,600 students /year
2. Gnyan Dham Eklavya Model Residential School, Ahwa - 350 students /year
3. Sandra Shroff ROFEL College of Nursing, Vapi - 55 students / year
4. Shroff S Rotary Institute of Chemical Technology (SRICT), Vataria, Ankleshwar - 330 students / year
5. UPL Center for Agriculture Excellence - 15,181 farmers trained.
This has resulted in continuous learning and development of around 2,500 students every year and more than 15,000 farmers trained till date.
Its Agriculture development initiative in CSR has empowered the farming community to experience a BETTER QUALITY OF LIFE through Enhanced profitability, Better nutrition and Capacity building. The Company has 9 initiative in 81 villages covering 3,111 farmer families.
The Skill development and entrepreneurship empowers youth and women to increase their INCOME EARNING CAPACITIES through 1) Developing and strengthening skills, 2) Improving resource accessibility and 3) Providing institutional support. It has 4 initiatives and Around 3,700 youth and women from 50 villages were trained/skilled.
The Company is working to empower rural women through formation and strengthening of Self Help Groups (SHG) and promoting entrepreneurial culture among the groups. This initiative not only empowers women financially, but also leads to their social and cultural growth. The Company is working with 1364 Women Members of 113 SHGs from 36 Villages.
Annual Report 2018-19 | 71
UPL Limited
The Company is working with various stakeholders to IMPROVE THE NATURAL HABITAT in the region through Information dissemination, Increased awareness and Focused efforts to preserve and protect the environment. The highlights are
• 85 Eco Clubs in community school with 3,396 members.
• Work on Sarus conservation project which has reached to 36 villages with 83 RSPG (Rural Sarus Protection Group) members
• 84,633 saplings and 1,20,000 Mangroves planted under social forestry.
• 6 group wells constructed, and 5 ponds deepened under water conservation.
• Conducted Green Ganesha workshop in 77 schools covering 8,590 students
• This year partnered to support Deer & Ungulate breeding project.
The Company works with individuals and organizations to ensure that GROWTH AND DEVELOPMENT NEEDS OF THE NATION ARE MET through 1) Proactive interventions in the interest of the nation, 2) Support to Trusts and Institutions and 3) Relief and Rehabilitation efforts. To achieve the above, many initiatives are taken with active support and involvement of all stakeholders.
• Worked on building capacity of NGOs/CBOs in Mumbai by empowering 6 organisation in 1st phase and will be starting 2nd phase with new set of organisations.
• Made 47 sanitation blocks, mostly in community schools. 9,225 students and 3,000 commuters/ day are using said facility.
• A total of 37,415 participants have been trained (on women and highway safety).
• Working with 436 farmer families from 2 villages under Vandri cluster development.
• Supporting Global Parli project, which is a successful example of how India’s villages can be transformed through revival and empowerment. Progressive, economically viable and prosperous villages can be a reality through right interventions.
• Supported Farmer Producer Company (FPC) in Motihari, Bihar - 3 FPCs in Motihari were provided with Cattle Feed Pallet Manufacturing plant each, 3 FPCs were provided with a Turmeric Processing Plant each and 4 FPCs have been given a financial aid to establish Jaggery Manufacturing units to enhance the farmers income levels.
• Partnership with Save the Children India (SCI) to support Special Care Centre which is a school for hearing impaired and intellectually disabled children that provides holistic education, nutrition and transportation, in a healthy nurturing and learning
environment. SCI is working towards betterment, empowerment and rights of special children.
• Supported Prayas Society for implementing the project “Asptal – Sansad Mobile Swasthya (SMS) Seva” at Hamirpur, Himachal Pradesh.
• Supported 6 Cerebral Palsy Athletes and staff to participate in the World CP Games in Sant Cugat, Spain from Aug 6-12, 2018. The Company is proud that one participant from India bagged 2 gold medals at the event.
A study done by International Labour Organization (ILO) found that India has one of the highest numbers of working children worldwide, with more than 5 million working in agriculture alone. A large number of Indian farmers are small and marginal, and they frequently resort to child labor to manage their fields. Child labour deprives children of their childhood and is harmful to their physical and mental development. United Against Child Labour (Project UACL) is Company’s proactive initiative to eliminate all forms of child labour in seed supplier farms and to ensure education for all children. The Company has adopted a multi-pronged strategy towards this objective which includes advocacy, engagement, awareness and legal contract.
VIA70 – Company’s citizen centric application for Mumbai is a part of an honest, non-political and non-profitable attempt to create a model for integrating urban citizens of India with the governance of their locality. The Company is trying to create a model for improved urban governance in the form of a citizen centric application. This application aims to bring transparency to the citizens about their rights and the public workers available for them to approach.
The Company is working on fostering the spirit of community development amongst the employees through employee volunteering known as We Are United (WAU). WAU is a well-structured employee volunteering program through which employees get an opportunity to use their talents and passion for the benefit of the community. Most of the activities undertaken by the WAU volunteers are around Company’s manufacturing locations and corporate office. In year 2018-2019 a total of 147 employee volunteers from India have spent 4,863 hrs for community work.
UPL Company is working in 6 countries with more than 70 development programs and benefitting around 60 communities.
UPL Brazil works on a complimentary education program empowering the local youth to lead meaningful lives. UCPL Colombia is responding to surrounding communities “whole life cycle” need by promoting the social and economic development through education, entrepreneurship and the conservation of the environment. UPL Argentina has established Social Security office at plant for every neighbor community (in the past they need to travel 46 km to have access to social security office). UPL Mexico has been collecting and distributing winter clothing to the poorest of the poor since 2015.
72 | Annual Report 2018-19
UPL Limited
VIGIL MECHANISM / WHISTLEBLOWER POLICYThe Company has in place whistleblower policy to deal with any fraud, irregularity, or mismanagement in the Company. The Company has posted this policy on its website and the link is https://www.upl-ltd.com/policies-compliances-announcements.
The Chairman of the Audit Committee oversees this policy. As per the policy, any employee or director can directly communicate with the Chairman of the Audit Committee to report any actual/suspected fraud or non-compliance.
In the past, the Company has taken all efforts to create awareness among the employees about the Policy. The Company also made all efforts to create awareness about the policy among the employees, who have joined during the year. The policy ensures complete protection and no victimization or discrimination to the whistleblower. Total confidentiality of the proceedings of the policy is maintained.
PREVENTION OF SEXUAL HARASSMENT OF WOMEN AT THE WORKPLACEThe Company takes the safety and mental health of the employees very seriously. The Company has implemented a strict policy as required under the Sexual Harassment at Workplace (Prevention, Prohibition and Redressal) Act, 2013 and the rules framed thereunder. As the Company moves into a modern era, the Company has implemented this policy for not just women employees but have made it gender neutral. Currently, under this policy, all the employees- permanent, temporary and contractual are protected from any form of Sexual Harassment. All employees are mandated to attend a classroom training and confirm their adherence to the rules as mentioned on Company’s website. In Financial Year 2018-19, a total of 389 employees were trained on POSH workshop conducted by Company’s external partners and 3500 employees acknowledged to comply with the POSH policy. A knowledgeable and experienced internal committee comprising mainly of women and an unbiased party is currently functional to attend and redress complaints that arise under this policy. Further, there are sub committees at unit locations to ensure strict adherence of this policy and make a workplace free from biases and prejudices.
INTERNAL CONTROL SYSTEMS AND THEIR ADEQUACY The Company has robust systems for internal audit, risk assessment and mitigation with well-established processes both at the business and corporate levels. The Company has an inhouse independent Internal Audit Department with a team of qualified professionals, headed by Global Head - Internal Audit.
The scope and authority of the internal audit department is derived from the annual audit plan approved by the audit committee at the beginning of year. Reviews are conducted on an on-going basis, based on a comprehensive risk-based audit plan. Every quarter, the audit committee is presented with key internal controls issues/audit observations and
action taken update on the internal control issues/audit observations highlighted in the previous Audit Committee presentations.
Internal Audit function plays a key role in providing to both the management and to the audit committee of the board, an objective view and re-assurance of the overall internal control systems and effectiveness of the risk management processes and the status of compliances with operating systems, internal policies and regulatory requirements across the Company including its subsidiaries. Internal audit also assesses opportunities for improvement in business processes, systems and controls and provides recommendations designed to add value to the operations.
The Company has adequate internal controls in place across various business units and functions, which improves the efficiency, management effectiveness and safeguards assets of the organisation. The internal control is implemented through following initiatives:
• Accurate and timely recording of transactions with multi-layered system of checks and balances
• Implementation of ERP enabling real time data access
• Implementation of accounting policies in line with prescribed standards
• Periodic reviews of long-term plans and annual budgets
• Constant monitoring of processes and routine audits
Internal Controls over Financial Reporting:The Company has developed and implemented a Risk & Control Framework to ensure internal controls over financial reporting. This framework includes testing & monitoring over entity level controls, process level controls & IT general controls. The entity level controls includes testing & monitoring compliance to policies like code of conduct, conflict of interest, whistle blower policy, Organization structure, Insider trading policy, HR policy & IT security policy. The process level controls includes risk control matrix for monitoring key business processes (like order to cash, procure to pay, financial closure process, treasury management, hire to retire, taxation, etc.)
On a periodic basis testing of entity level, process level controls & IT general controls is carried out and status of testing of controls is presented to the Audit Committee. During the year, all the controls were tested and no key reportable weaknesses in design and effectiveness was observed. The Company strives to ensure robust internal controls over financial reporting.
RISK MANAGEMENT FRAMEWORKThe Company has robust governance structure and risk management framework to identify and manage business risks in a proactive manner and at the same time enables the management to take advantage of any business opportunity arising.
Pursuant to Regulation 21 of the SEBI (Listing Obligation
Annual Report 2018-19 | 73
UPL Limited
and Disclosure Requirements) Regulation 2015, a Risk Management Committee is appointed consisting of three Executive / Promoter Directors of the Company. The Committee gets regular inputs from Senior Executives engaged in different functions and thereafter various risks are identified and mitigating plans are developed to resolve the same. If any identified risk is likely to have significant impact on the Company’s operations, the Committee provides for support to the relevant executives and develops a detailed mitigation plan to overcome adverse effects of such risk. There is continuous monitoring by the Committee to ensure that the mitigation plans are effectively met in case such risks arises.
Some of the key Business Risks and their mitigation plans were discussed in the Board reports of earlier years. They are:-i) Industry Risksii) R&D Risksiii) Currency Fluctuation Risksiv) Liquidity Risksv) HR Risksvi) Reputation Risks
Some of the other significant business risks identified and their mitigation plans are as under:-
i) Input Availability Risks – Of late China which is a key supplier of some of the essential inputs for the Company curtailed production and supply of the same in the international market due to environment concerns. This affected the production plan of the Company for some of its products. Efficient running of the plants require timely availability of various inputs. The Company however saw this as a great business opportunity and set up its own manufacturing plants to ensure regular supply of all inputs and thereby earning higher margins for its products. The Company has now achieved higher level of backward integration for its operations and is less dependent on outside supply. To further mitigate this risk the Company also identified and developed more than one alternative reliable sources of supply for such inputs. The Company does not expect this risk to be a major concern for its smooth operations.
ii) Acquisition Risk - Recently the Company has acquired, through its Mauritius subsidiary, Arysta LifeScience. The cost of acquisition of the same was US$ 4.2 billion. The Company has borrowed US$ 3 billion from a syndicate of banks and this has resulted into high gearing. Apart from the finance related risks, integration of two cultures and the working systems of staff of both the companies need to be aligned, otherwise this may lead to chaos and mis-management and loss of business and reputation. However, the Company considers this acquisition to be a great opportunity and a quantum leap of its business. Restructuring of the two entities will substantially reduce the administrative costs and the manpower cost. The combined turnover will increase
manifold with improved margins. The Company has negotiated the terms of the borrowings such that it does not have to face any liquidity problem and enough cash generation will be available at the time of repayment of loan. To mitigate the risk of two different cultures and working systems of employees, the Company has set up a special integration team. In the past the Company has made many international acquisitions very successfully and the acquired companies have blended very well in the main stream. The CEO of the Group is personally involved to keep track of the integration activities. The Company does not expect this risk to be serious. in fact, with this acquisition the Company will be in the top five global crop protection product companies in the world.
iii) Cyber Security Risks - In today’s world there is more and more reliance on IT systems. The Company’s operations are spread out across the globe and are well connected with widespread use of internet. All communication equipment’s such as mobiles, laptops, tablets etc. are widely used in all functions of the Company. Due to this, there are constant security threats to the data and possibility of misuse. Such cyber-attacks will result in loss of confidential data and also result in loss of business as well as reputation of the Company. To counter these risks, it is important to take suitable preventive measures to ensure data security at all times. The Company’s IT systems are fully geared to meet the threat of any such attacks. Adequate control measures are also taken to ensure data security by continuous monitoring of data, security systems, limiting access to only necessary persons, event monitoring etc. Strong firewalls are in place and disaster recovery systems are established along with layers of security controls across locations in the system.
The Government has also responded to such threats by introducing legislation relating to cyber security. The Directors are made responsible for ensuring data security of the Company and taking adequate steps to ensure cyber security. The Company has also been vigilant against possible cyber-attacks and has taken preventive remedial measures to counter such attacks. The Risk Management Committee of the Board is appraised of steps taken to mitigate cyber security risks. Even though there have been many cyber threats all over the world such as Ransomware and other hacking threats, the Company is not impacted by the same because of strong data security measures taken.
SUBSIDIARY COMPANIES / ASSOCIATE COMPANIES The Company has a large number of subsidiary companies and associates, spread all across the globe.
Crop protection product companies need registrations to enable them to sell their products in different countries in the world. These registrations are granted by local government body of each country to a local entity established in that country. For example, in India, Central Insecticide Board gives such registration to Indian Companies. In
74 | Annual Report 2018-19
UPL Limited
each country there are similar government authorities granting registration to the local companies for sale of agrochemicals. Further such registrations are mandatorily required for sale of each agrochemical for each pack size and technical content. Thus for same agrochemicals, multiple registrations will be required for different technical content and difference pack size.
The Company has a very large portfolio of various agrochemicals. To expand its market reach and explore various geographies beyond the national frontiers, it has established a large number of subsidiary companies in different countries of the world. This will enable the Company to supply and market its products to such countries. Till last year the Company had approximately 80 overseas subsidiary and associate companies, apart from a few Indian subsidiaries. With the acquisition of Arysta LifeScience the number has gone up to more than 200 overseas subsidiary and associate companies. Some of these subsidiaries may not be relevant and the Company has undertaken restructuring exercise to wind up companies that are dormant or where there are more than adequate number of subsidiary companies in a country. This restructuring exercise when completed will result in significant cost reduction, apart from having better administrative and financial control and avoidance of duplication of efforts and at the same time catering to larger number of customers with more inclusive crop protection solutions.
The details of essential parameters of each such subsidiary / associate company like share capital, assets, liabilities, turnover, profits before and after tax are given separately in the report and members can refer to the same.
Most of these overseas subsidiaries and associate companies are marketing arms and their main activity is confined to marketing by servicing their local market with greater efficiency and ensuring timely availability of different products of the Company. Some other entities are holding companies which hold investments in other group entities.
There are a few companies whose activities are not confined to marketing / investment. Some of the companies are engaged in manufacturing or formulation or seeds or other products. They are:-1. United Phosphorus (India) LLP ,India2. Optima Farm Solutions Limited ,India3. UPL Europe Limited ,U.K.4. Cerexagri B.V. ,Netherlands5. Cerexagri S.A.S. ,France6. United Phosphorus Inc. ,USA7. Upl do Brasil Industria e Comércio de Insumos
Agropecuários S.A. ,Brazil8. UPL Argentina S A ,Argentina9. UPL Colombia SAS ,Colombia10. UPL Vietnam Co. Limited ,Vietnam11. Arysta LifeScience India Limited ,India
12. Arysta LifeScience South Africa (Pty) Ltd ,South Africa13. Arysta LifeScience S.A.S. ,France14. Arysta LifeScience Ougrée Production Sprl ,Belgium15. Wyjolab S.A. ,France16. Natural Plant Protection S.A.S. ,France17. Laboratoires Goëmar SAS ,France18. Arysta LifeScience Korea Ltd. ,Korea19. Arysta LifeScience Vietnam Co., Ltd. ,Vietnam20. Callivoire SGFD S.A. ,COTE D’IVOIRE21. UPL Agricultural Solutions Italy Srl ,Italy22. Arysta LifeScience do Brasil Indústria Química e
Agropecuária SA ,Brazil23. Grupo Bioquimico Mexicano, S.A. de C.V. ,Mexico24. Arysta LifeScience Colombia S.A.S ,Colombia25. Arysta LifeScience Mexico, S.A. de C.V. ,Mexico
During the year Arysta LifeScience was acquired by the Company at its Mauritius subsidiary level. Apart from this, some of the companies which became or ceased to be subsidiaries are as under:
a) New Subsidiaries :
Decco Gida Tanm ve Zirai Urunler San. Tic A.S.
b) Cessations of Subsidiaries -
a. Blue Star B V (merged)
b. DVA Technology Argentina SA(Liquidated).
MATERIAL SUBSIDIARYThe Company has one unlisted material subsidiary as per the parameters laid down by the Companies Act, 2013, namely, UPL Corporation Limited in Mauritius.
The said subsidiary does trading business and also holds investments for the group. The Turnover is H1,692 Cr and the Profit before tax is H393 Cr. The said subsidiary has not sold, disposed off or leased assets of more than 20% of its assets during the current year.
Pursuant to Regulation 24(1) of SEBI (Listing Obligations and Disclosure Requirements) Regulations, 2015, Mr. Hardeep Singh, an Independent Director of the Company has been appointed as a Director on the Board of UPL Corporation Limited.
RELATED PARTY TRANSACTIONSAll Related Party Transactions entered into during the year were on arm’s length basis and were in the ordinary course of business. There are no materially significant related party transactions made by the Company with Promoters, Directors, Key Managerial Personnel or other designated persons which may have a potential conflict with the interest of the Company at large.
All Related Party Transactions are approved by the Audit Committee. Prior omnibus approval is obtained from the Audit Committee in respect of the transactions which are
Annual Report 2018-19 | 75
UPL Limited
repetitive in nature. The transactions entered into pursuant to the omnibus approval so granted are reviewed on a quarterly basis by the audit committee.
The policy on Related Party Transactions as approved by the Board is uploaded on the Company’s website. The same can be accessed on https://www.upl-ltd.com/ policies-compliances-announcements.
INSURANCEAll the properties and operations of the Company have been adequately insured.
SIGNIFICANT AND MATERIAL ORDERS PASSED BY THE REGULATORS OR COURTS:There are no significant and material order passed by the Regulators or Courts.
AUDITORS:a) Statutory Auditors At the 33rd Annual General Meeting of the Company
held on 8th July, 2017, the Members of the Company have approved the appointment of B S R & Co. LLP, Chartered Accountants (ICAI Firm Registration Number 101248W/W-100022) as the Statutory Auditors of the Company pursuant to Section 139 of the Companies Act, 2013 for a term of 5 (five) years from the Company’s financial year 2017-18, to hold office from the conclusion of 33rd Annual General Meeting of the Company.
The report of the Statutory Auditors along with the Notes to Schedules forms part of the Annual Report and contains an Unmodified Opinion without any qualification, reservation or adverse remark.
b) Cost Auditors Pursuant to Section 148 of the Companies Act, 2013
read with The Companies (Cost Records and Audit) Amendment Rules, 2014, the cost account records maintained by the Company are required to be audited. Your Directors had, on the recommendation of the Audit Committee, appointed Messrs RA & Co., Cost Accountants to audit the cost accounts of the Company for the financial year 2019-20 on a remuneration of H8.00 lakhs. The Cost Auditors have submitted a certificate of their eligibility for such appointment. As required under the Companies Act, 2013, the remuneration payable to the cost auditor is required to be placed before the Members in a general meeting for their ratification. Accordingly, a Resolution seeking Member’s ratification for the remuneration payable to Messrs RA & Co., Cost Auditors is included at Item No. 4 of the Notice convening the Annual General Meeting.
For the year 2018-19, the due date for filing the Cost Audit Report is 27th September, 2019 and the same will be filed in due course. The Cost Audit Report for the year 2017-18 was filed on 24th August, 2018.
c) Secretarial Auditors Pursuant to the provisions of Section 204 of the
Companies Act, 2013 and The Companies (Appointment and Remuneration of Managerial Personnel) Rules, 2014, the Company has appointed Messrs N.L. Bhatia & Associates, a firm of Company Secretaries in Practice to undertake the Secretarial Audit of the Company. The Report of the Secretarial Audit Report is annexed herewith as “Annexure 3”.
REPORTING OF FRAUD:The Auditors of the Company have not reported any fraud as specified under section 143 (12) of the Companies Act, 2013.
DEPOSITORY SYSTEM99.03% of the total paid-up equity shares of the Company are dematerialised as on 31st March, 2019.
DIRECTORSIn accordance with the provisions of section 152 of the Companies Act, 2013, and Articles of Association of the Company, Mr. Jaidev Rajnikant Shroff (DIN: 00191050) Director of the Company, retires by rotation at the forthcoming Annual General Meeting of the Company and being eligible, offer himself for re-appointment.
The earlier appointments of Mr. Pradeep Goyal (DIN: 00008370) and Dr. Reena Ramachandran (DIN: 00212371), the Independent Directors of the Company expire on the conclusion of forthcoming 35th Annual General Meeting of the members of the Company to be held on Wednesday, 28th August, 2019. The Board of Directors has re-appointed Mr. Pradeep Goyal (DIN: 00008370) and Dr. Reena Ramachandran (DIN: 00212371), Independent Directors for further period of 5 (five) years, with effect from 28th August, 2019, subject to the approval of the Members by Special Resolution and upon the terms and conditions as set out in the notice convening the 35th Annual General Meeting of the Company.
The Company has received notices in writing from members along with the deposit of requisite amount under Section 160 of the Companies Act, 203 proposing the candidature of these Directors for the office of Directors of the Company.
The special resolutions seeking approval of the Members of the Company for the re-appointment of Mr. Pradeep Goyal (DIN: 00008370) and Dr. Reena Ramachandran (DIN: 00212371) have been incorporated in the notice of the 35th Annual General Meeting of the Company along with brief details about them.
The information of Directors seeking re-appointment as required pursuant to Regulation 36(3) of SEBI (Listing Obligations and Disclosure Requirements) Regulations, 2015, is provided in the notice convening the 35th Annual General Meeting of the Company.
All the independent directors have given declaration that they meet the criteria of independence laid down under section 149 (6) of the Companies Act, 2013 and Regulation 16(b) of SEBI (Listing Obligations and Disclosure Requirements) Regulations, 2015.
76 | Annual Report 2018-19
UPL Limited
During the year Mr. Kalyan Mohan Banerjee has resigned from the Board of Directors of the Company with effect from 1st August, 2018.
The earlier appointment of Mr. Vinod Rajindranath Sethi (DIN: 00106598), the Independent Director of the Company expires on the conclusion of forthcoming 35th Annual General Meeting of the members of the Company to be held on Wednesday, 28th August, 2019. Mr. Sethi has expressed his unwillingness to seek fresh re-appointment for further period.
The Board takes this opportunity to place on record its deep sense of appreciation for the support and invaluable contribution made by Mr. Kalyan Mohan Banerjee and Mr. Vinod Rajindranath Sethi during their tenure as Directors of the Company.
EVALUATION OF THE BOARD’S PERFORMANCE:Pursuant to the provisions of the Companies Act 2013 and Regulations 17(10) and 25(4)(a) of the Listing Regulations, the evaluation process for performance of the Board, various Committees and Directors was carried out. Structured questionnaire was prepared after taking into consideration inputs received from the Directors covering various aspects of the Board functioning, Board culture, duties, responsibilities and performance by Individual Directors, their adherence to the Code of Conduct, reliability and timeliness of flow of information, independence of judgement etc.
Evaluation of Independent Directors was carried out by taking into account various parameters such as Directors contribution, attendance, expertise, knowledge of the subject, decision making capability and other related factors.
The meeting of Independent Directors was held on 31st January 2019 and at the said meeting the performance of evaluation of all the Directors of the Company including the Chairman was reviewed. The Independent Directors were fully satisfied with the performance of the Board, various committees, other Directors and Senior Management of the Company for running it in a highly professional manner. They also appreciated the knowledge and expertise of the Chairman and his exemplary leadership qualities which demonstrate positive attributes in following the highest standards of Corporate values and culture of the Company.
REMUNERATION POLICY:The Remuneration Policy has been disseminated on the Company’s website at the link https://www.upl-ltd.com/policies-compliances-announcements
FAMILIARIZATION PROGRAMME FOR THE INDEPENDENT DIRECTORS:Pursuant to the SEBI Regulations, the familiarization program for the Independent Directors is worked out, with respect to their roles and responsibilities, nature of the industry in which the Company operates, its business model, risks and opportunities of the Company, etc. The
Program is aligned with the requirements under the Act and other related regulations.
Under this familiarization program the Independent Directors are informed about the business plans and operations, the corporate philosophy and the vision and mission of the Company. They are taken through various financial parameters, control mechanism, budgeting system, adherence to compliances and other important matters. At the time of the appointment of Independent Directors the formal letter of appointment is issued to each of them giving details of their duties and responsibilities in the Company. During their tenure as Independent Directors, they are appraised of various policies of the Company such as CSR, Plant Safety, HR, Succession Policy for Directors and Senior Management. As the Company has worldwide operations, they are also updated with various strategic initiatives in the matters of operations of the Company. Factory visits of various plants in India and abroad are arranged and the safety measures taken by the Company at various plants to protect the personnel, property and environment are informed in detail to them. To update their knowledge in line with the latest changes in legislation and business practices, eminent faculty members are invited by the Company to address them.
Details of familiarization program of Independent Directors with the Company are available on the website of the Company https://www.upl-ltd.com/policies-compliances-announcements.
HUMAN RESOURCES:As on 31st March, 2019, the Company has 4,703 employees in India, and 11,411 employees globally.
The Company continuously strives to be the best globally. The Company believes that the core foundation of this vision is the people. The HR strategy is committed to creating an engaging workforce and an inspirational leadership that continuously powers this vision. With a welcome addition of 3,400 new associates, the Company has undertaken a comprehensive exercise to reinvent its HR systems to respond to this complexity with greater strength.
Powering the New Organisation with a New Purpose With the Arysta acquisition, the Company became globally the number one organisation in the post-patent space. It has a stronger portfolio, wider geographical reach and an employee base that went up more than 50%. A stronger organisation evolved a new purpose that energises all its associates around a new identity.
OpenAg- No limits, No Borders. The concept enabled the Company as an open organisation which is committed to sustainable agriculture globally. It is anchored around openness – Open Hearts, Open Collaboration, Open Intelligence, Open Access and Open Innovation. The concept of openness to new ideas, new concepts, looking beyond the horizons, openness to diversity and inclusion of new associates rallied the Company’s associates around this purpose. It played a key role in re-
Annual Report 2018-19 | 77
UPL Limited

aligning their identity in the transformed Company.
The work on defining the new values, corresponding behaviors and the new culture has already progressed well. This comprises of:
a) Building the Post-Acquisition Organisation Structure The Company has built a newer organisation structure
for a $5 billion enterprise staffed with the right level of competent professionals. Timely planning and good stakeholder involvement were key to the success of this organisational change.
b) Creating a Consistent Employee Experience: Launching my UPL An employee’s way of life is defined by the organizational
processes and systems. These are then translated into workflows. The Company is known for consistently improving the quality of employee experience through out his service span . This takes place through the HR ERP systems. The Company is going ahead with the implementation of “myUPL”- a one stop employee self-service and transaction portal on the Success Factors platform. This is a great initiative in connecting employees across borders. The consistency in employee experience will make the integration process much more effective.
c) Creating a High Performance Work System The integrated organization has made newer and
bolder commitments to all stakeholders.To fulfill the same goal setting modules are rolled out on myUPL. It focuses on key goals and completely does away with routine activities. All employees are expected to focus on the high-impact goals. To support the same, the goal library of Success Factors and the goal cascade functionality is deployed.
d) Harnessing People Synergy in the new Organization As part of building the new integrated organisation, all
role overlaps, and role redundancies were identified. This ensures exploring opportunities to deploy new talent in newly devised roles.
Way Forward
a) Cascading new values and behaviors The Company’s integration plans revolve around how
the Company merges two different cultures effectively. The Company formulated the best values and purpose to come up with a new brand for Company’s integrated organization. For this the Company has scheduled top team effectiveness programs to contextualize the values and behaviors of various business functions.
b) Cultural baselining The Company understands the complexity of the
cultural differences and the challenges that it might pose during integration. Towards this, the Company has operationalised concepts that will make the transition easier powered by a dynamic strategy that anchors on culture, and integration. The Company’s efforts will help
bring the people together and make them feel more integrated in the Company so that they move in a positive direction. The Company will provide the people trainings and career guidance that they may need.
c) Building internal talent for leadership succession As the HR processes for managing transition fall in place,
there would be a focus on refining the competency framework for the new organisation. That would provide a starting point for initiating talent assessment and using that as an input, to build succession pipeline for key leadership roles.
PARTICULARS OF EMPLOYEESThe information required under Section 197(12) of the Companies Act, 2013 read with Rule 5(1) and 5(2) of the Companies (Appointment and Remuneration of Managerial Personnel) Rules, 2014 are given in the Annexures 4 and 5 hereunder and forms part of this Report.
ENERGY CONSERVATION, TECHNOLOGY ABSORPTION AND FOREIGN EXCHANGE EARNINGS AND OUTGOThe particulars relating to energy conservation, technology absorption, foreign exchange earnings and outgo, as required to be disclosed under sections 134(3)(m) of the Companies Act, 2013 read with Rule 8(3) of the Companies (Accounts) Rules, 2014 are provided in Annexure 6 to this Report.
DIRECTORS RESPONSIBILITY STATEMENTTo the best of their knowledge and belief and according to the information and explanations obtained by them, the directors make the following statements in terms of Section 134(3)(c) of the Companies Act, 2013:
a) That in the preparation of the annual financial statements for the year ended 31st March, 2019, the applicable accounting standards have been followed along with proper explanation relating to material departures, if any.
b) That such accounting policies as mentioned in Note 2.1 of the Notes to the Financial Statements have been selected and applied consistently and judgement and estimates have been made that are reasonable and prudent so as to give a true and fair view of the state of affairs of the Company as at 31st March, 2019 and of the profit of the Company for the year ended on that date.
c) That proper and sufficient care has been taken for the maintenance of adequate accounting records in accordance with the provisions of the Companies Act, 2013 for safeguarding the assets of the Company and for preventing and detecting fraud and other irregularities.
d) That the annual financial statements have been prepared on a going concern basis.
e) That proper internal financial controls were in place
78 | Annual Report 2018-19
UPL Limited
and that the financial controls were adequate and were operating effectively.
f) That systems to ensure compliance with the provisions of all applicable laws were in place and were adequate and operating effectively.
CORPORATE GOVERNANCEYour Company and its Board has been complying with Corporate Governance practices as set out in a separate report, in pursuance of requirement of para C of Schedule V of SEBI (Listing Obligations and Disclosure Requirements) Regulations, 2015. The Management Discussions and Analysis Report forms part of this Report. Auditor’s certificate confirming compliance of the Corporate Governance as stipulated under the said Regulations is also attached to this Report.
Dealing with securities which have remained unclaimedMembers are hereby informed that as per Regulation 39(4) read with Schedule VI of the SEBI Regulations, the Company is in the process of sending reminders to those Members whose share certificates have remained unclaimed, to contact the Company immediately in the matter. The Registrar and Transfer Agent M/s Link Intime India Pvt. Ltd. is in the process of compiling the data for unclaimed shares. The Company, now after following the prescribed procedure will dematerialize unclaimed shares which are retained with the Company. These shares would be held by the Company on behalf of the holders of such shares in an “Unclaimed Suspense Account” to be opened with a depository. At the end of seven years, hereof, these shares shall be transferred by the Company to the IEPF. Dividends remaining unclaimed in respect of such shares shall also be held in a separate suspense account and would likewise be transferred to IEPF at the end of seven years.
Members may note that the lawful claimant in respect of these shares / dividend will be able to claim such shares dividend from the Company till such time they remain in the unclaimed suspense account as aforesaid.
COMPLIANCE WITH SECRETARIAL STANDARDSThe Board of Directors affirms that the Company has complied with the applicable Secretarial Standards issued by the Institute of Companies Secretaries of India relating to the meetings of the Board and General Meetings.
BUSINESS RESPONSIBILITY REPORTINGA separate section of Business Responsibility forms part of this Annual Report as required under Regulation 34(2)(f) of SEBI (Listing Obligations and Disclosure Requirements) Regulations, 2015.
CONSOLIDATED FINANCIAL STATEMENTSConsolidated Financial statements are prepared for the year 2018-19 in compliance with the provisions of the Companies Act, applicable Accounting Standards and as prescribed under the SEBI regulations. The consolidated statements are prepared on the basis of audited financial statements of the Company, its subsidiaries, associates and joint ventures. These consolidated financial statements along with the Auditors Report thereon form part of the Company’s Annual Report. They are also put up on the website of the Company https://www.upl-ltd.com/ policies-compliances-announcements.
COPY OF THE ANNUAL RETURNPursuant to the Section 92(3) of the Companies Act, 2013 a copy of Annual Return has been placed on the website of the Company and the web link of such Annual Return is https://www.upl-ltd.com/ policies-compliances-announcements
LISTING OF THE COMPANY’S EQUITY SHARESThe equity shares of the Company are listed on the BSE Ltd. and National Stock Exchange of India Ltd. There is no default in paying annual listing fees.
ACKNOWLEDGEMENT:The Directors are thankful to all the stakeholders and various government agencies and ministries for their continued support.
CAUTIONARY STATEMENT:Statements in the Director’s Report and the Management Discussion and Analysis describing the Company’s objectives, expectations or predictions, may be forward looking within the meaning of applicable securities laws and regulations. Actual results may differ materially from those expressed in the statement. Important factors that could influence the Company’s operations include: global and domestic demand and supply conditions, availability of critical materials and their cost, changes in government policies and tax laws, economic development of the country, and other factors which are material to the business operations of the Company.
Mumbai On behalf of the Board of Directors17th May 2019
Registered Office:3-11, G.I.D.C., Vapi Rajnikant Devidas ShroffDist. Valsad, Gujarat Chairman & Managing DirectorPin: 396195 (DIN: 00180810)
Annual Report 2018-19 | 79
UPL Limited
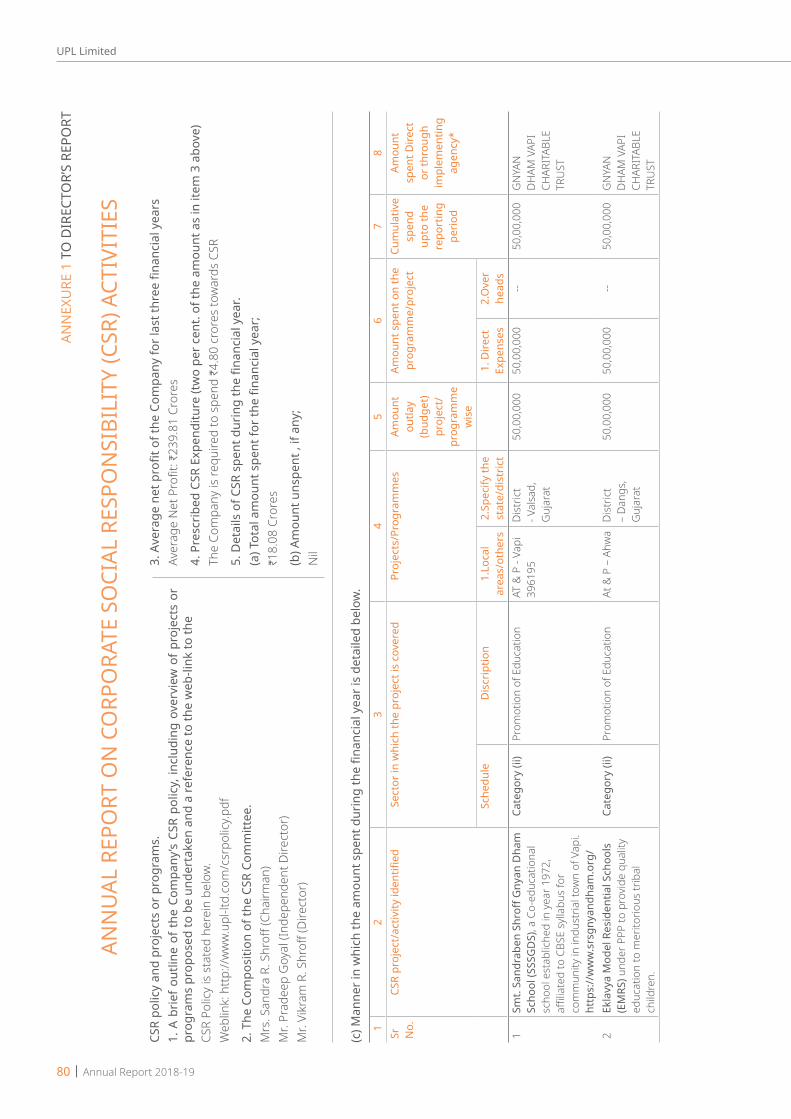
CSR
polic
y an
d pr
ojec
ts o
r pro
gram
s.
1. A
brie
f out
line
of th
e Co
mpa
ny’s
CSR
polic
y, in
clud
ing
over
view
of p
roje
cts
or
prog
ram
s pr
opos
ed to
be
unde
rtak
en a
nd a
refe
renc
e to
the
web
-link
to th
eCS
R Po
licy
is st
ated
her
ein
belo
w.W
eblin
k: h
ttp://
ww
w.up
l-ltd
.com
/csr
polic
y.pdf
2. T
he C
ompo
sitio
n of
the
CSR
Com
mitt
ee.
Mrs
. San
dra
R. S
hroff
(Cha
irman
)M
r. Pr
adee
p G
oyal
(Ind
epen
dent
Dire
ctor
)M
r. Vi
kram
R. S
hroff
(Dire
ctor
)
3. A
vera
ge n
et p
rofit
of t
he C
ompa
ny fo
r las
t thr
ee fi
nanc
ial y
ears
Aver
age
Net
Pro
fit: H
239.
81 C
rore
s
4. P
resc
ribed
CSR
Exp
endi
ture
(tw
o pe
r cen
t. of
the
amou
nt a
s in
item
3 a
bove
)Th
e Co
mpa
ny is
requ
ired
to s
pend
H4.
80 c
rore
s to
war
ds C
SR
5. D
etai
ls o
f CSR
spe
nt d
urin
g th
e fin
anci
al y
ear.
(a) T
otal
am
ount
spe
nt fo
r the
fina
ncia
l yea
r;H18
.08
Cror
es
(b) A
mou
nt u
nspe
nt ,
if an
y;N
il
ANN
EXU
RE 1
TO
DIR
ECTO
R’S
REPO
RT
ANN
UAL
REP
ORT
ON
CO
RPO
RATE
SO
CIAL
RES
PON
SIBI
LITY
(CSR
) ACT
IVIT
IES
(c) M
anne
r in
whi
ch th
e am
ount
spe
nt d
urin
g th
e fin
anci
al y
ear i
s de
taile
d be
low
.
12
34
56
78
Sr
No.
CSR
proj
ect/
activ
ity id
entifi
edSe
ctor
in w
hich
the
proj
ect i
s co
vere
dPr
ojec
ts/P
rogr
amm
esAm
ount
ou
tlay
(bud
get)
proj
ect/
prog
ram
me
wis
e
Amou
nt s
pent
on
the
prog
ram
me/
proj
ect
Cum
ulat
ive
spen
d up
to th
e re
port
ing
perio
d
Amou
nt
spen
t Dire
ct
or th
roug
h im
plem
entin
g ag
ency
*
Sche
dule
Dis
crip
tion
1.Lo
cal
area
s/ot
hers
2.Sp
ecify
the
stat
e/di
stric
t1.
Dire
ct
Expe
nses
2.O
ver
head
s1
Smt.
Sand
rabe
n Sh
roff
Gny
an D
ham
Sc
hool
(SSS
GD
S), a
Co-
educ
atio
nal
scho
ol e
stab
liche
d in
yea
r 197
2,
affilia
ted
to C
BSE
sylla
bus
for
com
mun
ity in
indu
stria
l tow
n of
Vap
i. ht
tps:
//w
ww
.srs
gnya
ndha
m.o
rg/
Cate
gory
(ii)
Prom
otio
n of
Edu
catio
nAT
& P
- Va
pi
3961
95Di
stric
t - V
alsa
d,
Guj
arat
50,0
0,00
050
,00,
000
--50
,00,
000
GN
YAN
DH
AM V
API
CHAR
ITAB
LE
TRU
ST
2Ek
lavy
a M
odel
Res
iden
tial S
choo
ls
(EM
RS) u
nder
PPP
to p
rovid
e qu
ality
ed
ucat
ion
to m
erito
rious
trib
al
child
ren.
Cate
gory
(ii)
Prom
otio
n of
Edu
catio
nAt
& P
– A
hwa
Dist
rict
– Da
ngs,
Guj
arat
50,0
0,00
050
,00,
000
--50
,00,
000
GN
YAN
DH
AM V
API
CHAR
ITAB
LE
TRU
ST
80 | Annual Report 2018-19
UPL Limited
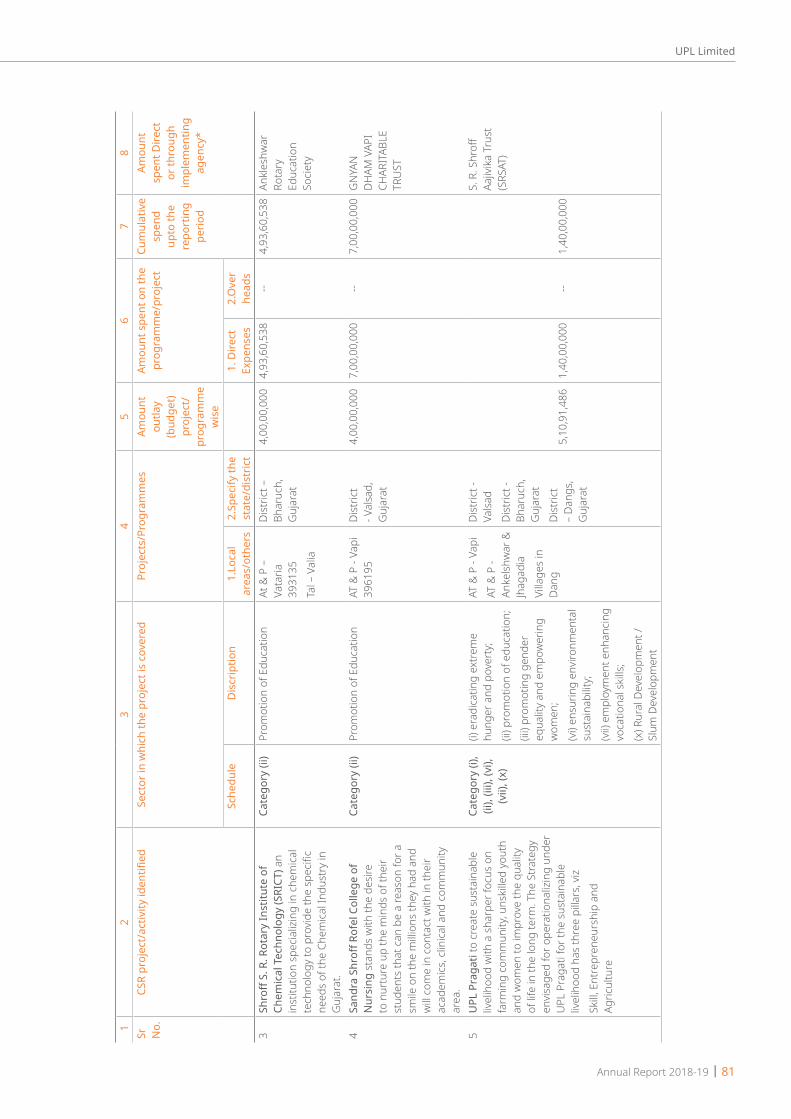
12
34
56
78
Sr
No.
CSR
proj
ect/
activ
ity id
entifi
edSe
ctor
in w
hich
the
proj
ect i
s co
vere
dPr
ojec
ts/P
rogr
amm
esAm
ount
ou
tlay
(bud
get)
proj
ect/
prog
ram
me
wis
e
Amou
nt s
pent
on
the
prog
ram
me/
proj
ect
Cum
ulat
ive
spen
d up
to th
e re
port
ing
perio
d
Amou
nt
spen
t Dire
ct
or th
roug
h im
plem
entin
g ag
ency
*
Sche
dule
Dis
crip
tion
1.Lo
cal
area
s/ot
hers
2.Sp
ecify
the
stat
e/di
stric
t1.
Dire
ct
Expe
nses
2.O
ver
head
s3
Shro
ff S.
R. R
otar
y In
stitu
te o
f Ch
emic
al T
echn
olog
y (S
RICT
) an
inst
itutio
n sp
ecia
lizin
g in
che
mica
l te
chno
logy
to p
rovid
e th
e sp
ecifi
c ne
eds
of th
e Ch
emica
l Ind
ustr
y in
G
ujar
at.
Cate
gory
(ii)
Prom
otio
n of
Edu
catio
nAt
& P
–
Vata
ria
3931
35Ta
l – V
alia
Dist
rict –
Bh
aruc
h,
Guj
arat
4,00
,00,
000
4,93
,60,
538
--4,
93,6
0,53
8An
kles
hwar
Ro
tary
Ed
ucat
ion
Socie
ty
4Sa
ndra
Shr
off R
ofel
Col
lege
of
Nur
sing
sta
nds
with
the
desir
e to
nur
ture
up
the
min
ds o
f the
ir st
uden
ts th
at c
an b
e a
reas
on fo
r a
smile
on
the
milli
ons
they
had
and
w
ill co
me
in c
onta
ct w
ith in
thei
r ac
adem
ics, c
linica
l and
com
mun
ity
area
.
Cate
gory
(ii)
Prom
otio
n of
Edu
catio
nAT
& P
- Va
pi
3961
95Di
stric
t - V
alsa
d,
Guj
arat
4,00
,00,
000
7,00
,00,
000
--7,
00,0
0,00
0G
NYA
N
DHAM
VAP
I CH
ARIT
ABLE
TR
UST
5U
PL P
raga
ti to
cre
ate
sust
aina
ble
livel
ihoo
d w
ith a
sha
rper
focu
s on
fa
rmin
g co
mm
unity
, uns
kille
d yo
uth
and
wom
en to
impr
ove
the
qual
ity
of li
fe in
the
long
term
. The
Stra
tegy
en
visag
ed fo
r ope
ratio
naliz
ing
unde
r U
PL P
raga
ti fo
r the
sus
tain
able
liv
elih
ood
has
thre
e pi
llars
, viz
Skill,
Ent
repr
eneu
rshi
p an
d Ag
ricul
ture
Cate
gory
(i),
(ii),
(iii),
(vi),
(v
ii), (
x)
(i) e
radi
catin
g ex
trem
e hu
nger
and
pov
erty
;(ii
) pro
mot
ion
of e
duca
tion;
(ii
i) pr
omot
ing
gend
er
equa
lity
and
empo
wer
ing
wom
en;
(vi)
ensu
ring
envir
onm
enta
l su
stai
nabi
lity;
(vii)
em
ploy
men
t enh
ancin
g vo
catio
nal s
kills
;(x
) Rur
al D
evel
opm
ent /
Sl
um D
evel
opm
ent
AT &
P -
Vapi
AT &
P -
Anke
lshw
ar &
Jh
agad
iaVi
llage
s in
Da
ng
Dist
rict -
Va
lsad
Dist
rict -
Bh
aruc
h,
Guj
arat
Dist
rict
– Da
ngs,
Guj
arat
5,10
,91,
486
1,40
,00,
000
--1,
40,0
0,00
0
S. R
. Shr
off
Aajiv
ika
Trus
t (S
RSAT
)
Annual Report 2018-19 | 81
UPL Limited
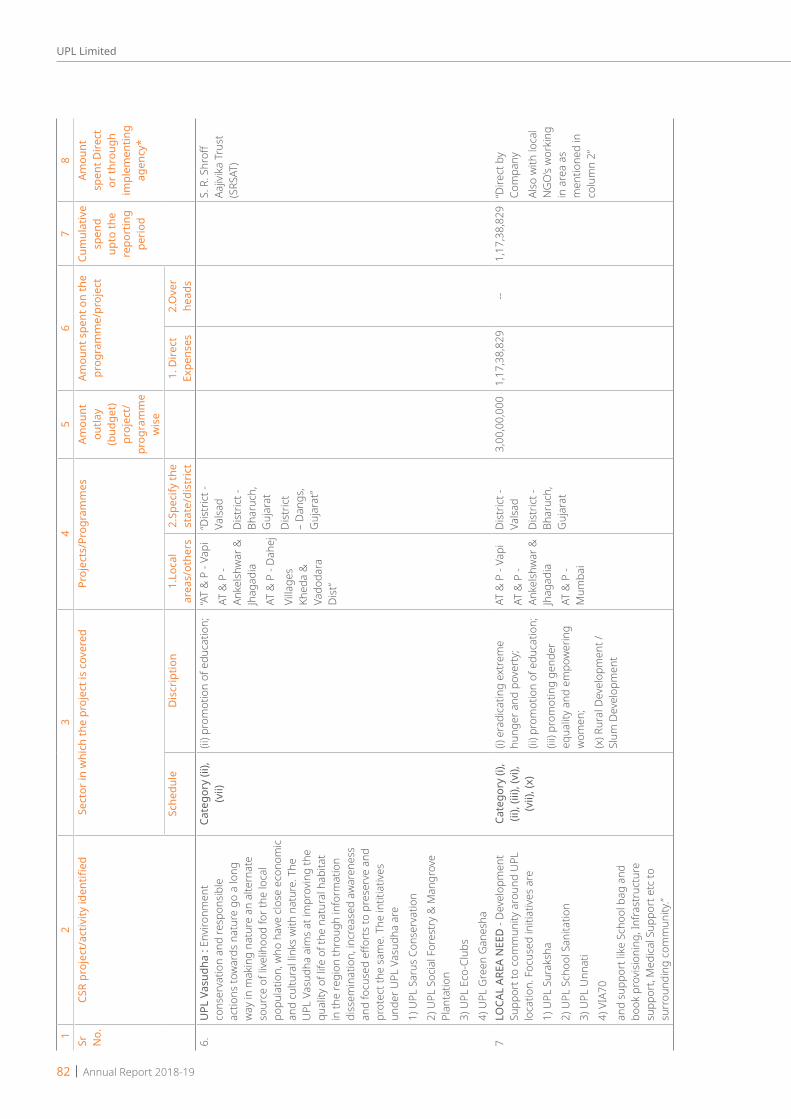
12
34
56
78
Sr
No.
CSR
proj
ect/
activ
ity id
entifi
edSe
ctor
in w
hich
the
proj
ect i
s co
vere
dPr
ojec
ts/P
rogr
amm
esAm
ount
ou
tlay
(bud
get)
proj
ect/
prog
ram
me
wis
e
Amou
nt s
pent
on
the
prog
ram
me/
proj
ect
Cum
ulat
ive
spen
d up
to th
e re
port
ing
perio
d
Amou
nt
spen
t Dire
ct
or th
roug
h im
plem
entin
g ag
ency
*
Sche
dule
Dis
crip
tion
1.Lo
cal
area
s/ot
hers
2.Sp
ecify
the
stat
e/di
stric
t1.
Dire
ct
Expe
nses
2.O
ver
head
s6.
UPL
Vas
udha
: En
viron
men
t co
nser
vatio
n an
d re
spon
sible
ac
tions
tow
ards
nat
ure
go a
long
w
ay in
mak
ing
natu
re a
n al
tern
ate
sour
ce o
f live
lihoo
d fo
r the
loca
l po
pula
tion,
who
hav
e clo
se e
cono
mic
and
cultu
ral l
inks
with
nat
ure.
The
U
PL V
asud
ha a
ims
at im
prov
ing
the
qual
ity o
f life
of t
he n
atur
al h
abita
t in
the
regi
on th
roug
h in
form
atio
n di
ssem
inat
ion,
incr
ease
d aw
aren
ess
and
focu
sed
effor
ts to
pre
serv
e an
d pr
otec
t the
sam
e. T
he in
titia
tives
un
der U
PL V
asud
ha a
re1)
UPL
Sar
us C
onse
rvat
ion
2) U
PL S
ocia
l For
estr
y &
Man
grov
e Pl
anta
tion
3) U
PL E
co-C
lubs
4) U
PL G
reen
Gan
esha
Cate
gory
(ii),
(v
ii)(ii
) pro
mot
ion
of e
duca
tion;
“A
T &
P -
Vapi
AT &
P -
Anke
lshw
ar &
Jh
agad
iaAT
& P
- Da
hej
Villa
ges
Khed
a &
Va
doda
ra
Dist
”
“Dist
rict -
Va
lsad
Dist
rict -
Bh
aruc
h,
Guj
arat
Dist
rict
– Da
ngs,
Guj
arat
”
S. R
. Shr
off
Aajiv
ika
Trus
t (S
RSAT
)
7LO
CAL
AREA
NEE
D -
Deve
lopm
ent
Supp
ort t
o co
mm
unity
aro
und
UPL
lo
catio
n. F
ocus
ed in
itiat
ives
are
1) U
PL S
urak
sha
2) U
PL S
choo
l San
itatio
n3)
UPL
Unn
ati
4) V
IA70
and
supp
ort l
ike
Scho
ol b
ag a
nd
book
pro
visio
ning
, Inf
rast
ruct
ure
supp
ort,
Med
ical S
uppo
rt e
tc to
su
rrou
ndin
g co
mm
unity
.”
Cate
gory
(i),
(ii),
(iii),
(vi),
(v
ii), (
x)
(i) e
radi
catin
g ex
trem
e hu
nger
and
pov
erty
;(ii
) pro
mot
ion
of e
duca
tion;
(ii
i) pr
omot
ing
gend
er
equa
lity
and
empo
wer
ing
wom
en;
(x) R
ural
Dev
elop
men
t /
Slum
Dev
elop
men
t
AT &
P -
Vapi
AT &
P -
Anke
lshw
ar &
Jh
agad
iaAT
& P
- M
umba
i
Dist
rict -
Va
lsad
Dist
rict -
Bh
aruc
h,
Guj
arat
3,00
,00,
000
1,17
,38,
829
--1,
17,3
8,82
9“D
irect
by
Com
pany
Also
with
loca
l N
GO
’s w
orki
ng
in a
rea
as
men
tione
d in
co
lum
n 2”
82 | Annual Report 2018-19
UPL Limited
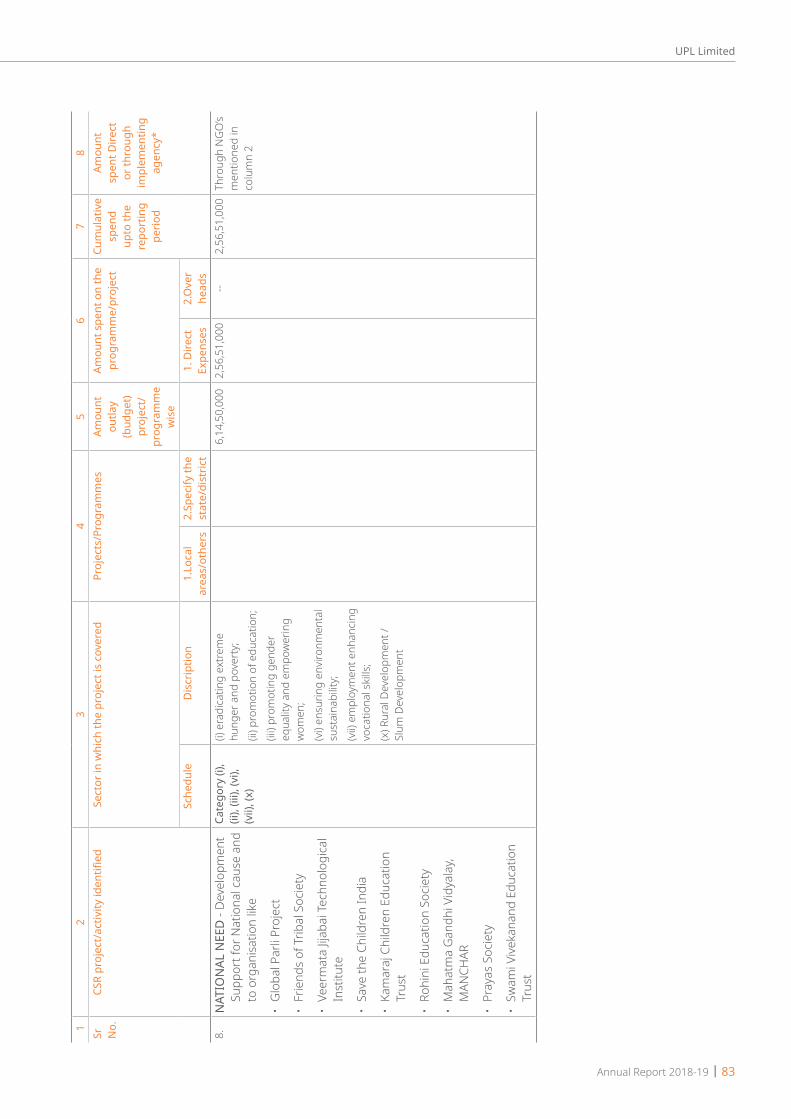
12
34
56
78
Sr
No.
CSR
proj
ect/
activ
ity id
entifi
edSe
ctor
in w
hich
the
proj
ect i
s co
vere
dPr
ojec
ts/P
rogr
amm
esAm
ount
ou
tlay
(bud
get)
proj
ect/
prog
ram
me
wis
e
Amou
nt s
pent
on
the
prog
ram
me/
proj
ect
Cum
ulat
ive
spen
d up
to th
e re
port
ing
perio
d
Amou
nt
spen
t Dire
ct
or th
roug
h im
plem
entin
g ag
ency
*
Sche
dule
Dis
crip
tion
1.Lo
cal
area
s/ot
hers
2.Sp
ecify
the
stat
e/di
stric
t1.
Dire
ct
Expe
nses
2.O
ver
head
s8.
NAT
ION
AL N
EED
- De
velo
pmen
t Su
ppor
t for
Nat
iona
l cau
se a
nd
to o
rgan
isatio
n lik
e
• G
loba
l Par
li Pr
ojec
t
• Fr
iend
s of
Trib
al S
ocie
ty
• Ve
erm
ata
Jijab
ai T
echn
olog
ical
Inst
itute
• Sa
ve th
e Ch
ildre
n In
dia
• Ka
mar
aj C
hild
ren
Educ
atio
n Tr
ust
• Ro
hini
Edu
catio
n So
ciety
• M
ahat
ma
Gan
dhi V
idya
lay,
MAN
CHAR
• Pr
ayas
Soc
iety
• Sw
ami V
iveka
nand
Edu
catio
n Tr
ust
Cate
gory
(i),
(ii),
(iii),
(vi),
(v
ii), (
x)
(i) e
radi
catin
g ex
trem
e hu
nger
and
pov
erty
;(ii
) pro
mot
ion
of e
duca
tion;
(iii)
prom
otin
g ge
nder
eq
ualit
y an
d em
pow
erin
g w
omen
;(v
i) en
surin
g en
viron
men
tal
sust
aina
bilit
y;(v
ii) e
mpl
oym
ent e
nhan
cing
voca
tiona
l ski
lls;
(x) R
ural
Dev
elop
men
t /
Slum
Dev
elop
men
t
6,14
,50,
000
2,56
,51,
000
--2,
56,5
1,00
0Th
roug
h N
GO
’s m
entio
ned
in
colu
mn
2
Annual Report 2018-19 | 83
UPL Limited

We, UPL Limited and our subsidiaries (together constituting the UPL Group), take initiative to contribute to harmonious and sustainable development of the society through all our business activities that we carry out in various countries across the globe. We recognize that business enterprises are economic organs of society that draw on various societal resources for its functioning and growth, It is our core belief therefore that a company’s performance must be measured not only by its bottom line but also with respect to the social contributions made by the Company while achieving its financial goals.
A. CSR Vision To be a catalyst for a more equitable and inclusive society by supporting long term sustainable transformation and social integration.
B. CSR MissionWe will achieve our vision by Implementing need based projects through participatory
approach. Focusing on building capacity to make community Self-
Reliance Developing partnership. Transferring knowledge
C. CSR ValuesThe values that will govern to achiev our vision are Care Excellence and Sustainability
D. CSR focus areasOur CSR initiative is called as UPL Pragati which means PROGRESS and is in line with our stated Vision. Our CSR activities will focus not just around our Factory and offices, but also in other geographies based on the needs of the communities. The Six CSR focus areas for community to progress are:
1. Education and Empowerment Education is a basic human right pivotal to personal and
societal development and so is an integral part of our CSR work. Under education we will work and support promotion of education, including primary education, higher education and employment oriented course especially among women, elderly, and the differently abled.
2. Employability and Entrepreneurship A major factor contributing to rural youth
underemployment is skills mismatch with huge skills deficit in limited job growth and expansion. We will work on enhancing vocation skills especially among youths, women, and the differently abled. We will also work on livelihood enhancement projects through Self Help
Group and Entrepreneurship development Programme with women and economically backward groups.
3. Agriculture Development Agriculture in India is both, a source of livelihood and
food security for a vast majority of vulnerable sections of society. A higher priority to agriculture will be given under livelihood enhancement rural development projects so as to achieve the goals of reducing poverty and malnutrition as well as of inclusive growth. We will adopt a framework of UPL KhedutPragati Programme for our Agriculture development intervention and will work on farmers Capacity building, Lab to land and Technology intervention.
Under Nature conservation we will work on UPL Vasudha Project by nurturing and strengthening Eco and Environment club in schools, Tree Plantation, Species conservation, Soil & Water Conservation etc. Our Environment and Nature conservation activities will lead to environmental sustainability, ecological balance, protection of flora and fauna, animal welfare, agroforestry, conservation of natural resources and maintaining quality of soil, air and water;
4. Health and Sanitation We will work on providing better healthcare facilities
by partially funding and running hospital, health projects, public health programmes, Health awareness programmes, health check-up programme, Blood donation programme, provision of medicine & treatment facilities, program for preventing diseases and building immunity etc
We will also work on aspects of water, sanitation and hygiene because of which the health and financial burden on poor people is high. We will work on awareness programme, construction of toilet in schools and construction of toilet for general needy community.
5. National / Local area need We will work on specific local area needs around our
Factory locations.
We will respond to national need, which also include relief or rebuild which can arise from natural calamities.
E. CSR Implementation In accordance with sub-section (1) of section 135 of the
Companies Act 2013, UPL has set up a CSR committee to advise on the Company’s CSR policy, and monitor the CSR activities of UPL Limited. All projects are identified as per needs of community.
F. CSR Resource contribution Minimum 2% of the average of net profit made by the
Company during immediately preceding three financial years as per Companies Act 2013.
CSR Policy
84 | Annual Report 2018-19
UPL Limited

SECRETARIAL AUDIT REPORTFORM NO. MR-3
FOR THE FINANCIAL YEAR ENDED MARCH 31, 2019[Pursuant to Section 204(1) of the Companies Act, 2013 and Rule No. 9 of the Companies
(Appointment and Remuneration of Managerial Personnel) Rules, 2014]
To,The MembersUPL Limited
We have conducted the secretarial audit of the compliance of applicable statutory provisions and the adherence to good corporate practices by UPL Limited (hereinafter called the company). Secretarial Audit was conducted in a manner that provided us a reasonable basis for evaluating the corporate conducts/statutory compliances and expressing my opinion thereon.
Based on our verification of the company’s books, papers, minute books, forms and returns filed and other records maintained by the company and also the information provided by the Company, its officers, agents and authorized representatives during the conduct of secretarial audit, We hereby report that in our opinion, the company has, during the audit period covering the financial year ended on March 31, 2019 complied with the statutory provisions listed hereunder and also that the Company has proper Board-processes and compliance mechanism in place to the extent, in the manner and subject to the reporting made hereinafter:
We have examined the books, papers, minute books, forms and returns filed and other records maintained by the Company for the financial year ended on March 31, 2019 according to the provisions of:
(1) The Companies Act, 2013 (the Act) and the Rules made thereunder;
(2) The Securities Contracts (Regulation) Act, 1956 (‘SCRA’) and the Rules made thereunder;
(3) The Depositories Act, 1996 and the Regulations and bye-laws framed thereunder;
(4) Foreign Exchange Management Act, 1999 and the Rules and Regulations made thereunder to the extent of Foreign Direct Investment;
(5) The following Regulations and Guidelines prescribed under the Securities and Exchange Board of India Act, 1992 (‘SEBI Act’):-
a) The Securities and Exchange Board of India (Substantial Acquisition of Shares and Takeovers) Regulations, 2011;
b) The Securities and Exchange Board of India
(Prohibition of Insider Trading) Regulations, 2015;
c) The Securities and Exchange Board of India (Issue and Listing of Debt Securities) Regulations, 2008,
d) The Securities and Exchange Board of India (Share Based Employee Benefits) Regulations, 2014.
e) The Securities and Exchange Board of India (Listing Obligation and Disclosure Requirement) Regulations, 2015.
6) Other Laws applicable to the Company;
a) Narcotic Drugs and Psychotropic Substances Act, 1985
b) The Insecticides Act,1968
c) Factories Act, 1948 and Rules made thereunder
d) Explosives Act, 1889 - Gas Cylinder Rules, 1981
e) Petroleum Act, 1934, Rules, 1976
f) Industrial Employment (Standing Orders)Act, 1946 & Rules 1957
g) Payment of Bonus Act 1965, & Rules, 1965
h) Maternity Benefit Act 1961 & Rules
i) Employees Compensation Act, 1923 & Rules.
j) Minimum Wages Act, 1948, M.W(C) Rules, 1950
k) Child Labour (P&R) Act 1986 & Rules.
l) Air(Prevention and Control of Pollution) Act 1981
m) Water(Prevention and Control of Pollution) Act 1974
n) The Noise (Regulation and Control) Rules 2000
o) Ozone Depleting Substances (Regulation & Control)Rules 2000
p) The Chemical Accidents (Emergency Planning, Preparedness and Response) Rules 1996
q) Payment of Wages Act 1936
r) Employees State Insurance Act 1948 and Rules and Regulations
ANNEXURE 2 TO DIRECTOR’S REPORT
Annual Report 2018-19 | 85
UPL Limited
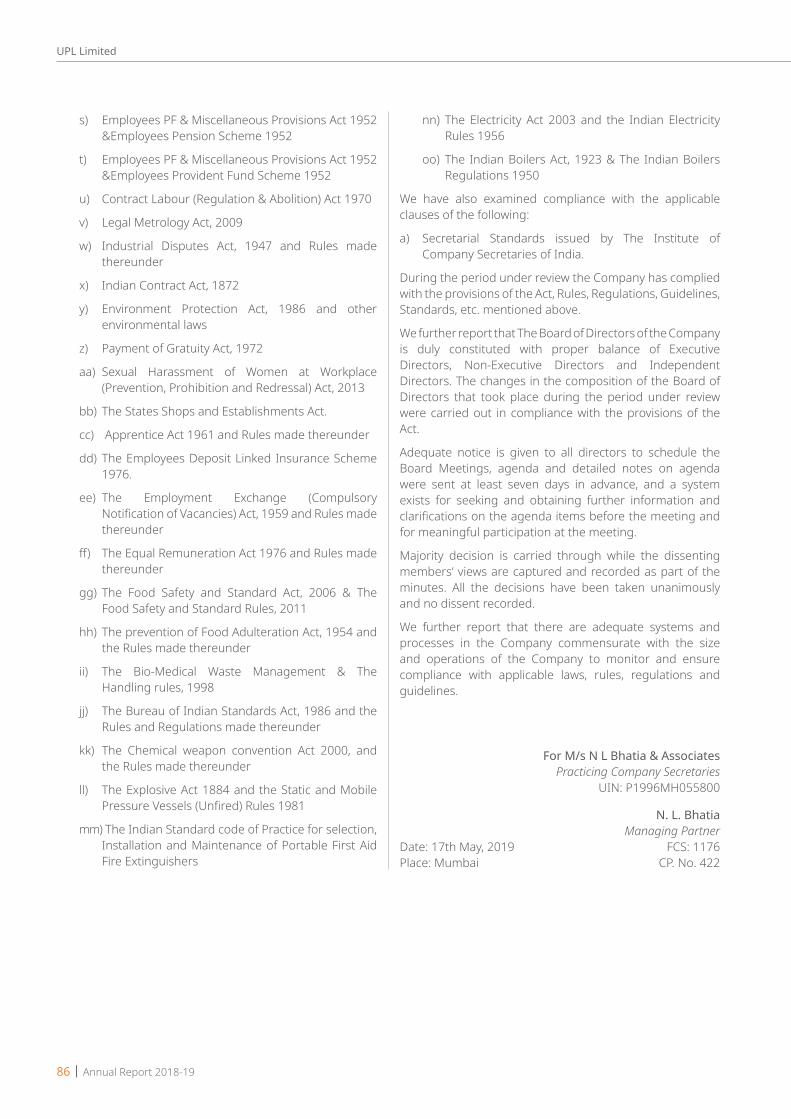
s) Employees PF & Miscellaneous Provisions Act 1952 &Employees Pension Scheme 1952
t) Employees PF & Miscellaneous Provisions Act 1952 &Employees Provident Fund Scheme 1952
u) Contract Labour (Regulation & Abolition) Act 1970
v) Legal Metrology Act, 2009
w) Industrial Disputes Act, 1947 and Rules made thereunder
x) Indian Contract Act, 1872
y) Environment Protection Act, 1986 and other environmental laws
z) Payment of Gratuity Act, 1972
aa) Sexual Harassment of Women at Workplace (Prevention, Prohibition and Redressal) Act, 2013
bb) The States Shops and Establishments Act.
cc) Apprentice Act 1961 and Rules made thereunder
dd) The Employees Deposit Linked Insurance Scheme 1976.
ee) The Employment Exchange (Compulsory Notification of Vacancies) Act, 1959 and Rules made thereunder
ff) The Equal Remuneration Act 1976 and Rules made thereunder
gg) The Food Safety and Standard Act, 2006 & The Food Safety and Standard Rules, 2011
hh) The prevention of Food Adulteration Act, 1954 and the Rules made thereunder
ii) The Bio-Medical Waste Management & The Handling rules, 1998
jj) The Bureau of Indian Standards Act, 1986 and the Rules and Regulations made thereunder
kk) The Chemical weapon convention Act 2000, and the Rules made thereunder
ll) The Explosive Act 1884 and the Static and Mobile Pressure Vessels (Unfired) Rules 1981
mm) The Indian Standard code of Practice for selection, Installation and Maintenance of Portable First Aid Fire Extinguishers
nn) The Electricity Act 2003 and the Indian Electricity Rules 1956
oo) The Indian Boilers Act, 1923 & The Indian Boilers Regulations 1950
We have also examined compliance with the applicable clauses of the following:
a) Secretarial Standards issued by The Institute of Company Secretaries of India.
During the period under review the Company has complied with the provisions of the Act, Rules, Regulations, Guidelines, Standards, etc. mentioned above.
We further report that The Board of Directors of the Company is duly constituted with proper balance of Executive Directors, Non-Executive Directors and Independent Directors. The changes in the composition of the Board of Directors that took place during the period under review were carried out in compliance with the provisions of the Act.
Adequate notice is given to all directors to schedule the Board Meetings, agenda and detailed notes on agenda were sent at least seven days in advance, and a system exists for seeking and obtaining further information and clarifications on the agenda items before the meeting and for meaningful participation at the meeting.
Majority decision is carried through while the dissenting members’ views are captured and recorded as part of the minutes. All the decisions have been taken unanimously and no dissent recorded.
We further report that there are adequate systems and processes in the Company commensurate with the size and operations of the Company to monitor and ensure compliance with applicable laws, rules, regulations and guidelines.
For M/s N L Bhatia & AssociatesPracticing Company Secretaries
UIN: P1996MH055800
N. L. BhatiaManaging Partner
Date: 17th May, 2019 FCS: 1176Place: Mumbai CP. No. 422
86 | Annual Report 2018-19
UPL Limited
To,The MembersUPL Limited
Our report of even date is to be read along with this letter.
(1) Maintenance of Secretarial record is the responsibility of the management of the Company. Our responsibility is to express an opinion on these secretarial records based on our audit.
(2) We have followed the audit practices and processes as were appropriate to obtain reasonable assurance about the correctness of the contents of the secretarial records. The verification was done on test basis to ensure that correct facts are reflected in secretarial records. We believe that the processes and practices, we followed provide a reasonable basis for our opinion.
(3) We have not verified the correctness and appropriate of financial records and Books of Accounts of the Company.
(4) Wherever required we have obtained the Management representation about the compliance of Laws, Rules and Regulations and happening of events etc.
(5) The compliance of the provisions of Corporate and Other Applicable Laws, Rules, Regulations, Standards is the responsibility of Management. Our examination was limited to the verification of procedures on test basis.
(6) The Secretarial Audit report is neither an assurance as to the future viability of the Company nor the efficacy or effectiveness with which the Management has conducted the affairs of the Company.
For N. L. Bhatia & AssociatesPractising Company Secretaries
UIN: P1996MH055800
N. L. BhatiaManaging Partner
Date: 17th May, 2019 FCS: 1176Place: Mumbai CP. No. 422
Annual Report 2018-19 | 87
UPL Limited
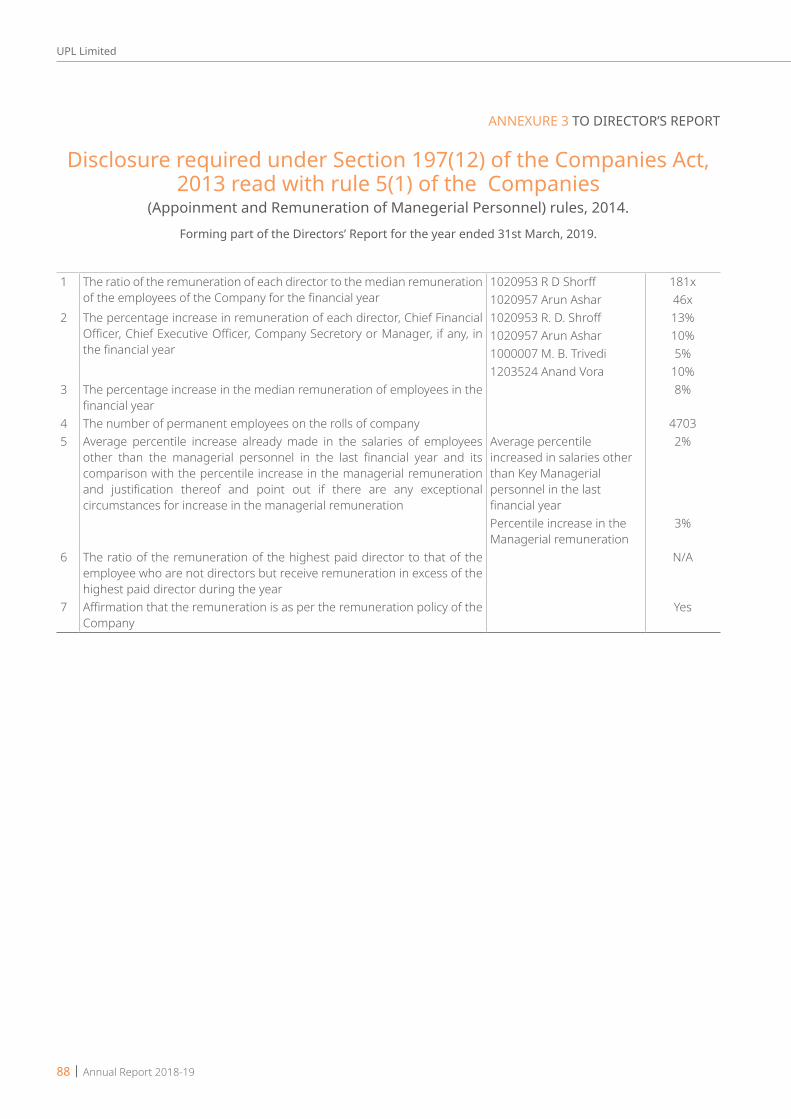
ANNEXURE 3 TO DIRECTOR’S REPORT
Disclosure required under Section 197(12) of the Companies Act, 2013 read with rule 5(1) of the Companies
(Appoinment and Remuneration of Manegerial Personnel) rules, 2014.Forming part of the Directors’ Report for the year ended 31st March, 2019.
1 The ratio of the remuneration of each director to the median remuneration of the employees of the Company for the financial year
1020953 R D Shorff 181x1020957 Arun Ashar 46x
2 The percentage increase in remuneration of each director, Chief Financial Officer, Chief Executive Officer, Company Secretory or Manager, if any, in the financial year
1020953 R. D. Shroff 13%1020957 Arun Ashar 10%1000007 M. B. Trivedi 5%1203524 Anand Vora 10%
3 The percentage increase in the median remuneration of employees in the financial year
8%
4 The number of permanent employees on the rolls of company 47035 Average percentile increase already made in the salaries of employees
other than the managerial personnel in the last financial year and its comparison with the percentile increase in the managerial remuneration and justification thereof and point out if there are any exceptional circumstances for increase in the managerial remuneration
Average percentile increased in salaries other than Key Managerial personnel in the last financial year
2%
Percentile increase in the Managerial remuneration
3%
6 The ratio of the remuneration of the highest paid director to that of the employee who are not directors but receive remuneration in excess of the highest paid director during the year
N/A
7 Affirmation that the remuneration is as per the remuneration policy of the Company
Yes
88 | Annual Report 2018-19
UPL Limited
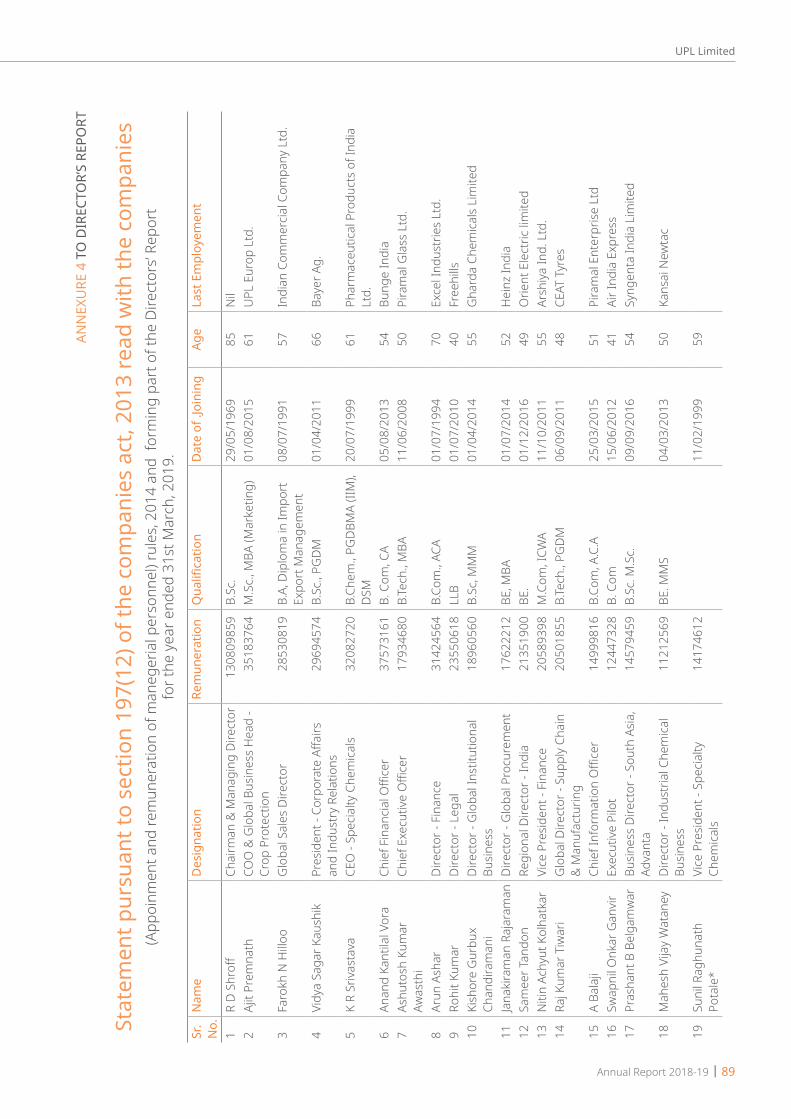
Stat
emen
t pur
suan
t to
sect
ion
197(
12) o
f the
com
pani
es a
ct, 2
013
read
with
the
com
pani
es
(App
oinm
ent a
nd re
mun
erat
ion
of m
aneg
eria
l per
sonn
el) r
ules
, 201
4 an
d fo
rmin
g pa
rt o
f the
Dire
ctor
s’ Re
port
for t
he y
ear e
nded
31s
t Mar
ch, 2
019.
ANN
EXU
RE 4
TO
DIR
ECTO
R’S
REPO
RT
Sr.
No.
Nam
eD
esig
natio
nRe
mun
erat
ion
Qua
lifica
tion
Dat
e of
.Joi
ning
Age
Last
Em
ploy
emen
t
1R
D Sh
roff
Chai
rman
& M
anag
ing
Dire
ctor
1308
0985
9B.
Sc.
29/0
5/19
6985
Nil
2Aj
it Pr
emna
thCO
O &
Glo
bal B
usin
ess
Hea
d -
Crop
Pro
tect
ion
3518
3764
M.S
c., M
BA (M
arke
ting)
01/0
8/20
1561
UPL
Eur
op L
td.
3Fa
rokh
N H
illoo
Glo
bal S
ales
Dire
ctor
2853
0819
B.A,
Dip
lom
a in
Impo
rt
Expo
rt M
anag
emen
t08
/07/
1991
57In
dian
Com
mer
cial C
ompa
ny L
td.
4Vi
dya
Saga
r Kau
shik
Pres
iden
t - C
orpo
rate
Affa
irs
and
Indu
stry
Rel
atio
ns29
6945
74B.
Sc.,
PGDM
01/0
4/20
1166
Baye
r Ag.
5K
R Sr
ivast
ava
CEO
- Sp
ecia
lty C
hem
icals
3208
2720
B.Ch
em.,
PGDB
MA
(IIM
), DS
M20
/07/
1999
61Ph
arm
aceu
tical
Pro
duct
s of
Indi
a Lt
d.6
Anan
d Ka
ntila
l Vor
aCh
ief F
inan
cial O
ffice
r37
5731
61B.
Com
, CA
05/0
8/20
1354
Bung
e In
dia
7As
huto
sh K
umar
Aw
asth
iCh
ief E
xecu
tive
Offi
cer
1793
4680
B.Te
ch.,
MBA
11/0
6/20
0850
Pira
mal
Gla
ss L
td.
8Ar
un A
shar
Dire
ctor
- Fi
nanc
e31
4245
64B.
Com
., AC
A01
/07/
1994
70Ex
cel I
ndus
trie
s Lt
d.9
Rohi
t Kum
arDi
rect
or -
Lega
l23
5506
18LL
B01
/07/
2010
40Fr
eehi
lls10
Kish
ore
Gur
bux
Chan
dira
man
iDi
rect
or -
Glo
bal I
nstit
utio
nal
Busin
ess
1896
0560
B.Sc
, MM
M01
/04/
2014
55G
hard
a Ch
emica
ls Li
mite
d
11Ja
naki
ram
an R
ajar
aman
Dire
ctor
- G
loba
l Pro
cure
men
t17
6222
12BE
, MBA
01/0
7/20
1452
Hei
nz In
dia
12Sa
mee
r Tan
don
Regi
onal
Dire
ctor
- In
dia
2135
1900
BE.
01/1
2/20
1649
Orie
nt E
lect
ric li
mite
d13
Niti
n Ac
hyut
Kol
hatk
arVi
ce P
resid
ent -
Fin
ance
2058
9398
M.C
om, I
CWA
11/1
0/20
1155
Arsh
iya In
d. L
td.
14Ra
j Kum
ar T
iwar
iG
loba
l Dire
ctor
- Su
pply
Chai
n &
Man
ufac
turin
g20
5018
55B.
Tech
., PG
DM06
/09/
2011
48CE
AT T
yres
15A
Bala
jiCh
ief I
nfor
mat
ion
Offi
cer
1499
9816
B.Co
m, A
.C.A
25/0
3/20
1551
Pira
mal
Ent
erpr
ise L
td16
Swap
nil O
nkar
Gan
virEx
ecut
ive P
ilot
1244
7328
B. C
om15
/06/
2012
41Ai
r Ind
ia E
xpre
ss17
Pras
hant
B B
elga
mw
arBu
sines
s Di
rect
or -
Sout
h As
ia,
Adva
nta
1457
9459
B.Sc
. M.S
c.09
/09/
2016
54Sy
ngen
ta In
dia
Lim
ited
18M
ahes
h Vi
jay
Wat
aney
Dire
ctor
- In
dust
rial C
hem
ical
Busin
ess
1121
2569
BE. M
MS
04/0
3/20
1350
Kans
ai N
ewta
c
19Su
nil R
aghu
nath
Po
tale
*Vi
ce P
resid
ent -
Spe
cialty
Ch
emica
ls14
1746
1211
/02/
1999
59
Annual Report 2018-19 | 89
UPL Limited

Sr.
No.
Nam
eD
esig
natio
nRe
mun
erat
ion
Qua
lifica
tion
Dat
e of
.Joi
ning
Age
Last
Em
ploy
emen
t
20P.S
ures
h Re
ddy
*Bu
sines
s H
ead
1431
1741
B.Sc
. M.S
c. A
gricu
lture
15/0
7/20
0353
Fmc
Indi
a Pv
t. Lt
d21
Sand
eep
Chow
dhur
y *
Seni
or G
ener
al M
anag
er -
Lega
l10
9636
70M
BA /
B.Te
ch /
Dipl
oma
01/0
4/20
1744
ADVA
NTA
SEE
DS D
MCC
22M
B T
rived
iCo
mpa
ny S
ecre
tary
1027
9288
CA, C
S17
/07/
1978
66S.
V. G
hata
lia &
Co.
23Ra
hul R
Jadh
avSr
. Gen
eral
Man
ager
- Ac
coun
ts10
7476
68M
.CO
M01
/09/
1992
50Ba
yer I
nida
Ltd
24S
Bala
subr
aman
ian
Dire
ctor
- En
viron
men
t Bu
sines
s20
5627
70M
.SC
01/1
2/19
9454
M/S
.Jeen
a &
Co
25Am
ul M
Des
aiDi
rect
or -
Man
ufac
turin
g10
2215
1420
/03/
1990
5926
K M
Ban
erje
eEx
ecut
ive D
irect
or10
9925
55B.
Tech
01/0
7/19
7776
27As
hish
Dob
hal
Seni
or G
ener
al M
anag
er -
Glo
bal S
ales
Ope
ratio
ns10
3558
36M
.Sc
04/0
3/20
0343
28Sh
yam
Sun
der P
eriw
alVi
ce P
resid
ent -
Inte
rnal
Aud
it10
3211
94CS
08/0
3/20
0451
Otis
Ela
vato
r Co
(I)29
D M
elw
yn M
oses
Dire
ctor
- M
anuf
actu
ring
1001
2349
BE M
echa
nica
l En
gine
erin
g15
/10/
2004
47M
erisa
nt I.
P.Ltd
30Su
bhat
Kum
ar Ji
ndal
Seni
or G
ener
al M
anag
er -
Man
ufac
turin
g11
8657
88BE
Che
mica
l Eng
inee
ring
02/0
6/20
1551
Lanx
ess
Indi
a Pv
t/ Lt
d
31Sh
reni
k M
ehta
Glo
bal P
ortfo
lio L
ead
- Fu
ngici
des
1131
0907
Post
Gra
duat
ion
Fina
nce
18/0
4/20
1643
DCM
Shr
iram
32M
ritun
jay
Chau
bey
Vice
Pre
siden
t - E
nviro
nmen
t10
2536
02BE
/Ph.
D.01
/07/
2016
47U
nile
ver
33Pa
rasu
Vee
ra U
ppar
aH
ead
- Tec
hnol
ogy
& B
usin
ess
Deve
lopm
ent,
Spec
ialty
Ch
emica
ls
1043
3916
BTEC
H /
MTE
CH /
PHD
22/0
8/20
1646
Relia
nce
Indu
strie
s Lt
d.
34Vi
shal
Sod
haG
loba
l Hea
d - I
PR11
4385
35BS
C / M
SC /
PHD
/ LLB
09/0
9/20
1642
Apot
ex P
harm
ache
m In
dia
Pvt.
Ltd.
35M
anee
sh B
halla
Hea
d - P
roje
cts
1320
4887
BE /
MFM
17/1
1/20
1651
Relia
nce
Indu
strie
s Li
mite
d36
Sanj
ay S
ingh
Glo
bal C
hief
Hum
an R
esou
rce
Offi
cer
1101
7171
MBA
05/0
9/20
1850
CG P
OW
ER A
ND
INDU
STRI
AL
SOLU
TIO
NS
LIM
ITED
Not
e:
1)
Gro
ss re
mun
erat
ion
show
n ab
ove
is su
bjec
t to
tax
and
com
prise
s sa
lary
, allo
wan
ces,
com
miss
ion,
ince
ntive
s, m
onet
ary
valu
e of
per
quisi
tes,
com
pany
’s co
ntrib
utio
n to
pro
viden
t fun
d an
d su
pera
nnua
tion
fund
.
In a
ddtio
n to
the
abov
e, e
mpl
oyee
s ar
e al
so e
ntitl
ed to
gra
tuity
, med
ical b
enefi
ts e
tc. i
n ac
cord
ance
with
Com
pany
’s ru
les.
2)
Non
e of
the
abov
e em
ploy
ee, a
long
with
the
spou
se a
nd d
epen
dant
chi
ldre
n ho
ld m
ore
than
2%
of t
he e
quity
sha
res
of th
e Co
mpa
ny.
3)
Mr.
R. D
. Shr
off is
a re
lativ
e of
the
Dire
ctor
s of
the
Com
pany
nam
ely,
Mrs
. S. R
. Shr
off, M
r. J.
R. S
hroff
and
Mr.
V. R
. Shr
off4)
Al
l em
ploe
es a
re p
erm
anen
t em
ploy
ees
of th
e Co
mpa
ny5)
*
Empl
oyed
for t
he p
art o
f the
yea
r.
90 | Annual Report 2018-19
UPL Limited

ANNEXURE 5 TO DIRECTOR’S REPORT
Conservation of Energy, Technology Absorption,Adaptation and Foreign Exchange Earnings and Outgo
Section 134(3)(m) of the Companies act, 2013 read with Rule 8(3) of the Companies (Accounts) Rules, 2014
A. Conservation of Energy 2018-19 i. The following Energy conservation measures
were taken during the year 2018-19. The Company has dedicated ‘Energy Cell’ which
is continuously working for achieving Energy excellence, by identifying and implementing new and innovative measures across The Company’s plants. The Team closely monitors specific energy consumption pattern across all manufacturing sites. It also conducts Periodic Internal & external energy audits. This has resulted in reduction of energy and CO2 footprint. Energy Cell is also involved in building internal capability by imparting Trainings and demonstration of new technologies.
Key Focus area has been on heat integration in processes and waste heat recovery.
Major Energy saving initiatives are mentioned below;
1. Reduced utility cost of product by utility changeover from chilled water to cooling water in process.
2. Increment in mean time between cleaning and power reduction by Installation of VFD for ID blower.
3. Purchasing steam from community boiler.
4. Smart sensor for motor condition monitoring through cloud.
5. Excess steam sale to neighbor plants.
6. Power Purchase from Renewable sources. (5.7 MW from Wind)
7. Waste heat recovery from boiler flue gases by installing condensing economizer.
8. Reduced downtime & improved power generation capacity of power plant by installing surface condenser inline ball cleaning system.
9. 4 Effect MEE plant in place of single stage evaporation.
10. Roof top solar photo voltaic power generation of 760 KW.
11. Installed Back Pressure Turbine at multilocation to utilize kinetic energy, in place of steam PRV station.
12. We have installed Rain Water Harvesting system across The Company’s units. This will not only harvest rain water but also save pumping power.
ii. Steps taken by the Company to utilize alternate source & reduce energy consumption.
1. To purchase additional Renewable Wind power purchase and achieve total 10 MWe.
2. To purchase Renewable Solar Photo voltaic power @ 10 MWe.
3. To recover Kinetic energy of PRV station and generate power using Back pressure Turbine. We have installed 4 such Turbines and 5 more are under process. Total power generation potential is @ 32 MW.
4. To implement horizontal deployment of innovative measures, like process pinch, Heat integration, achieving higher overall efficiency, Closed loop condensate & Flash recovery system, Evaporative condenser etc.
5. To achieve ISO 50001, Energy management system for PL01.
iii. Capital Investment on energy conservation equipment’s:
1. A total of 24 Crores was invested into installation of energy efficient equipment. All future projects are being evaluated and approved based on the lowest energy and carbon foot print.
2. The Company’s units have been recipients of multiple awards as a recognition of our energy conservation measures and Sustainability.
B. Technology Absorption, Adaptation and Innovation i. Following initiatives were taken by the Company
towards the technology absorption, adaptation and innovation:
1. A second plant for an important herbicide was commissioned. The plant operates on a process which is designed to be cost effective by way of reduction in number of steps, raw materials cost and operational cost.
2. The production of an herbicide active ingredient was started on commercial scale
Annual Report 2018-19 | 91
UPL Limited

for manufacture and commercialization of a combination formulation meant mainly for corn crop.
3. A process for producing an intermediate of a previously commercialised herbicide, was commercialized after successful development with desired yield and quality. The intermediate is now produced in-house
4. Production of three specialty chemicals on a commercial scale was started and products with desired quality and yield are being produced.
5. The manufacturing process for an herbicide safener was improved to make it more cost effective and improved production yield.
6. Many new pesticide formulations were commercialized for launch both in the domestic and international markets.
7. Processes for several active ingredients were developed successfully at Research and Development Centres for future commercialization.
8. A large number of formulations of various active ingredients were successfully developed in the Research and Development Centres for future introduction
9. Processes were developed for the intermediates of at least three technical as an initiative to be self-dependent
10. The quality of many actives and formulation products were improved and the process implemented in the plant
11. Collaborative work with external agencies like Universities, Research Institutes and scientists in their individual capacity has resulted into innovations and new technology implementation at product and process stages and has been useful in upgradation of the existing technologies
ii. Benefits derived by the Company: i. A second plant for an herbicide production was
commissioned to increase in-house production of the technical active. This will result in sustained quality of the product and make the Company less dependent on vendors
ii. An herbicide active ingredient to be used in a combination formulation was produced in-house. This will result in cost-reduction and assured quality of the formulation
iii. New products introduced globally, resulting in business expansion
iv. Accomplishment of process development for several active ingredients will be helpful in the future implementation in the plants at commercial scale
v. Industrial process development and execution will result in expansion in revenue
vi. Production of Industrial chemicals and Specialty Chemicals will result in more revenue generation
vii. Process development of active ingredients with backward integration will result in cost-effectiveness and quality products
viii. Several pre-mix formulations are developed which will result into market launches in future
ix. For the existing technical products, improvement in quality and/or increase in yield have been worked out
x. The marketed formulations have been worked upon for improved quality and cost effectiveness
xi. Patent protection for the products and processes will help in reduced competition
xii. There have been increasing number of regulatory approvals in many countries for many products which will help in faster product launches
iii. Expenditure incurred on R & DCapital 1158.93 LacsRecurring 20371.44 LacsTotal 21530.37 LacsTotal R & D expenditure - 2.54% (as a percentage of turnover)
C. Foreign Exchange Earnings and Outgo: 1. Total Foreign Exchange earned H519,521 Lacs2. Total Foreign Exchange outgo H340,978 Lacs
92 | Annual Report 2018-19
UPL Limited

1. Company’s Philosophy on Code of Corporate Governance
The Company’s philosophy on Corporate Governance relates to providing maximum service to all its stakeholders. It intends to enhance shareholder value by undertaking the best possible Corporate Governance practices. A high standard of Corporate Governance is maintained by being transparent, accountable and being in continuous interaction with shareholders, employees, lending institutions, banks, governmental agencies and all the dealers.
The Company’s products are marketed not only in India
but also across the globe. The Company is, therefore, conscious of the fact that the management and the employees need to work ethically to achieve success.
2. Board of Directors The Board of Directors consists of 10 Directors as on
31st March, 2019.
Five Board Meetings were held during the year, in accordance with the minimum requirement of four meetings. The dates on which the meetings were held are as follows: 27th April, 2018, 20th July, 2018, 31st July, 2018, 26th October, 2018 and 31st January, 2019.
Report onCorporate Governance
Composition and category of directors, other Directorships and Committee memberships as on 31st March, 2019:Name of the Director Category Attendance
ParticularsNo. of other directorships and Committee
member/ChairmanshipNo. of Shares
and Convertible Instruments heldBy non-executive
directors
Board Meeting
Last AGM
Other Directorships
Committee Memberships
Committee Chairmanships
Mr. Rajnikant Devidas Shroff @ DIN: 00180810
Promoter and Executive Chairman and Managing Director
5 Present 8 1 - N. A
Mrs. Sandra Rajnikant Shroff @DIN: 00189012
Promoter and Non-Executive Vice Chairman
3 Present 7 - - Nil
Mr. Jaidev Rajnikant Shroff @DIN: 00191050
Promoter and Non-Executive Director
4 Present 3 - - 54,00,109 Equity Shares .
Mr. Vikram Rajnikant Shroff @DIN: 00191472
Promoter and Non-Executive Director
5 Absent 4 - - 45,02,883 Equity Shares.
Mr. Arun Chandrasen AsharDIN: 00192088
Non-Promoter and Executive Director
5 Present 7 4 1 N.A
Mr. Kalyan Mohan Benerjee #DIN: 00276866
Non-Promoter and Executive Director
1 N.A. 1 - - N.A
Mr.Pradeep Vedprakash GoyalDIN: 00008370
Independent and Non-Executive Director
5 Absent 3 2 2 Nil
Dr. Reena RamachandranDIN: 00212371
Independent and Non-Executive Director
5 Present 1 1 - Nil
Mr. Pradip Pranjivan Madhavji #DIN: 00549826
Independent and Non-Executive Director
1 N.A. 2 2 1 Nil
Mr. Vinod Rajindranath SethiDIN: 00106598
Independent and Non-Executive Director
5 Absent 2 1 - Nil
Mr. Hardeep SinghDIN: 00088096
Independent and Non-Executive Director
5 Present 3 2 1 32,538 Equity Shares.
Mr. Vasant Prakash GandhiDIN: 00863653
Independent and Non-Executive Director
5 Present 1 1 1 Nil
Annual Report 2018-19 | 93
UPL Limited

Notes:* Excludes Directorship in private limited companies, foreign companies and companies under Section 8 of the Companies Act, 2013.@ Mr. Rajnikant Devidas Shroff and Mrs. Sandra Rajnikant Shroff are spouse of each other and father and mother respectively of Mr. Jaidev Rajnikant Shroff and Mr. Vikram Rajnikant Shroff. Mr. Jaidev Rajnikant Shroff and Mr. Vikram Rajnikant Shroff are sons of Mr. Rajnikant Devidas Shroff and Mrs. Sandra Rajnikant Shroff and brothers of each other.# Resigned during the year.The details of familiarization programmes imparted to Independent Directors have been disclosed on the Company’s website www.upl-ltd.com
3. Audit Committee Terms of reference: The terms of reference of Audit Committee are as per
SEBI (Listing Obligations and Disclosure Requirements) Regulations, 2015 and Companies Act, 2013. The broad terms of reference of Audit Committee as adopted by the Board are as under:
1. Oversight of the Company’s financial reporting process and the disclosure of its financial information to ensure that the financial statement is correct, sufficient and credible;
2. Recommendation for appointment, remuneration and terms of appointment of auditors of the Company;
3. Approval of payment to statutory auditors for any other services rendered by the statutory auditors;
4. Reviewing, with the management, the annual financial statements and auditor’s report thereon before submission to the board for approval, with particular reference to:
a. Matters required to be included in the Director’s Responsibility Statement to be included in the Board’s report in terms of clause (c) of sub-section 3 of section 134 of the Companies Act, 2013;
b. Changes, if any, in accounting policies and practices and reasons for the same;
c. Major accounting entries involving estimates based on the exercise of judgment by the management;
d. Significant adjustments made in the financial statements arising out of audit findings;
e. Compliance with listing and other legal requirements relating to financial statements;
f. Disclosure of any related party transactions;
g. Modified opinion(s) in the draft audit report;
5. Reviewing, with the management, the quarterly financial statements before submission to the board for approval;
6. Reviewing, with the management, the statement of uses/application of funds raised through an issue (public issue, rights issue, preferential issue,
etc.), the statement of funds utilised for purposes other than those stated in the offer document/prospectus/notice and the report submitted by the monitoring agency monitoring the utilisation of proceeds of a public or rights issue, and making appropriate recommendations to the Board to take up steps in this matter;
7. Reviewing and monitoring the auditor’s independence and performance, and effectiveness of the audit process;
8. Approval or any subsequent modification of transactions of the Company with related parties;
9. Scrutiny of inter-corporate loans and investments;
10. Valuation of undertakings or assets of the Company, wherever it is necessary;
11. Evaluation of internal financial controls and risk management systems;
12. Reviewing, with the management, performance of statutory and internal auditors and adequacy of the internal control systems;
13. Reviewing the adequacy of internal audit function, if any, including the structure of the internal audit department, staffing and seniority of the official heading the department, reporting structure coverage and frequency of internal audit;
14. Discussion with internal auditors of any significant findings and follow up there on;
15. Reviewing the findings of internal investigations by the internal auditors into matters where there is suspected fraud or irregularity or a failure of internal control systems of a material nature and reporting the matter to the Board;
16. Discussion with statutory auditors, before the audit commences, about the nature and scope of audit as well as post-audit discussion to ascertain any area of concern;
17. Looking into the reasons for substantial defaults in the payment to the depositors, debenture holders, shareholders (in case of non-payment of declared dividends) and creditors;
18. Reviewing the functioning of the Whistle Blower mechanism;
94 | Annual Report 2018-19
UPL Limited
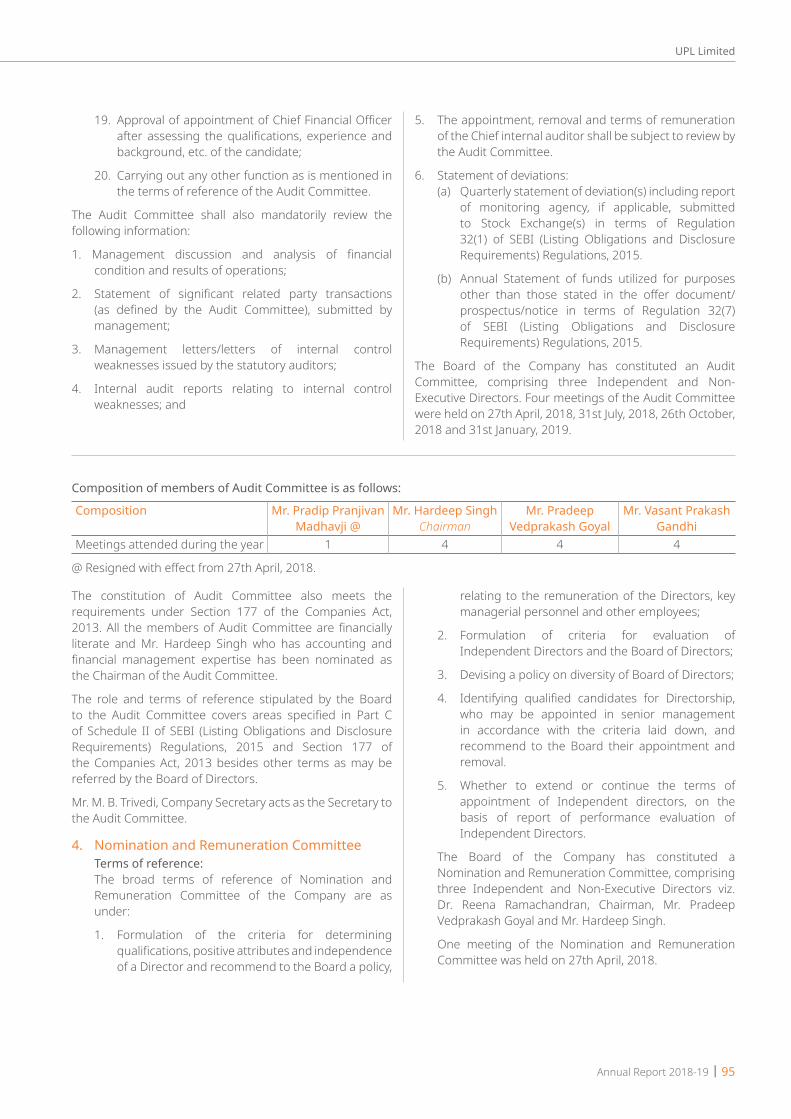
19. Approval of appointment of Chief Financial Officer after assessing the qualifications, experience and background, etc. of the candidate;
20. Carrying out any other function as is mentioned in the terms of reference of the Audit Committee.
The Audit Committee shall also mandatorily review the following information:
1. Management discussion and analysis of financial condition and results of operations;
2. Statement of significant related party transactions (as defined by the Audit Committee), submitted by management;
3. Management letters/letters of internal control weaknesses issued by the statutory auditors;
4. Internal audit reports relating to internal control weaknesses; and
5. The appointment, removal and terms of remuneration of the Chief internal auditor shall be subject to review by the Audit Committee.
6. Statement of deviations: (a) Quarterly statement of deviation(s) including report
of monitoring agency, if applicable, submitted to Stock Exchange(s) in terms of Regulation 32(1) of SEBI (Listing Obligations and Disclosure Requirements) Regulations, 2015.
(b) Annual Statement of funds utilized for purposes other than those stated in the offer document/prospectus/notice in terms of Regulation 32(7) of SEBI (Listing Obligations and Disclosure Requirements) Regulations, 2015.
The Board of the Company has constituted an Audit Committee, comprising three Independent and Non-Executive Directors. Four meetings of the Audit Committee were held on 27th April, 2018, 31st July, 2018, 26th October, 2018 and 31st January, 2019.
Composition of members of Audit Committee is as follows:
Composition Mr. Pradip Pranjivan Madhavji @
Mr. Hardeep SinghChairman
Mr. Pradeep Vedprakash Goyal
Mr. Vasant Prakash Gandhi
Meetings attended during the year 1 4 4 4
@ Resigned with effect from 27th April, 2018.
The constitution of Audit Committee also meets the requirements under Section 177 of the Companies Act, 2013. All the members of Audit Committee are financially literate and Mr. Hardeep Singh who has accounting and financial management expertise has been nominated as the Chairman of the Audit Committee.
The role and terms of reference stipulated by the Board to the Audit Committee covers areas specified in Part C of Schedule II of SEBI (Listing Obligations and Disclosure Requirements) Regulations, 2015 and Section 177 of the Companies Act, 2013 besides other terms as may be referred by the Board of Directors.
Mr. M. B. Trivedi, Company Secretary acts as the Secretary to the Audit Committee.
4. Nomination and Remuneration Committee Terms of reference: The broad terms of reference of Nomination and
Remuneration Committee of the Company are as under:
1. Formulation of the criteria for determining qualifications, positive attributes and independence of a Director and recommend to the Board a policy,
relating to the remuneration of the Directors, key managerial personnel and other employees;
2. Formulation of criteria for evaluation of Independent Directors and the Board of Directors;
3. Devising a policy on diversity of Board of Directors;
4. Identifying qualified candidates for Directorship, who may be appointed in senior management in accordance with the criteria laid down, and recommend to the Board their appointment and removal.
5. Whether to extend or continue the terms of appointment of Independent directors, on the basis of report of performance evaluation of Independent Directors.
The Board of the Company has constituted a Nomination and Remuneration Committee, comprising three Independent and Non-Executive Directors viz. Dr. Reena Ramachandran, Chairman, Mr. Pradeep Vedprakash Goyal and Mr. Hardeep Singh.
One meeting of the Nomination and Remuneration Committee was held on 27th April, 2018.
Annual Report 2018-19 | 95
UPL Limited

Composition of members of Nomination and Remuneration Committee is as follows:Composition Dr. (Mrs.) Reena
Ramachandran,Chairman
Mr. Pradeep Vedprakash Goyal
Mr. Pradip Pranjivan
Madhavji@
Mr. Hardeep Singh
Meeting attended during the year 1 1 1 1@ Resigned with effect from 27th April, 2018.
Performance evaluation criteria for Independent Directors:Qualifications, meeting the independence criteria, observing ethical standards, integrity, exercise of responsibilities, safeguarding interest of all stakeholders, skills and knowledge updation, adhering to Company’s Code of conduct, regular attendance and active participation at the meetings of the Company, maintaining confidentiality, transparency, assistance in implementing best corporate governance practices and absence of conflict of interest with business of the Company.
5. Remuneration of Directors:The Board has, on the recommendation of the Nomination and Remuneration Committee, framed and adopted the policy for selection and appointment of Directors,
senior management and their remuneration. The policy lays down criteria for selection of Directors and senior management such as expertise, experience and integrity of the Directors, independent nature of the Directors, personal and professional standing, diversity of the Board, etc. The remuneration policy lays down the entitlements of remuneration to Non-Executive Directors such as sitting fees, commission and other reimbursement. Remuneration to the Managing Director and other Executive Directors will consist of monthly salary, allowances, perquisites, bonus, commission and other retiral benefits. In respect of senior management, the remuneration will be based on the performance, working of the Company, targets achieved, KPI, industry benchmark and current compensation trends in the industry.
Details of the remuneration to all the Directors for the year:The aggregate value of salary, perquisites and commission for the year ended 31st March, 2019 to three Whole-time Directors is as follows:
H In lacsName of Director Salary Perquisites Retirement
BenefitsCommission Total
Mr. Rajnikant Devidas Shroff Chairman and Managing Director
510 211 162 450 1333
Mr. Kalyan Mohan Banerjee @ Whole-time Director
8 44 3 15 70
Mr. Arun Chandrasen Ashar Whole- time Director
126 77 40 60 303
@ Resigned with effect from 1st August, 2018.
The Company has paid the sitting fees for the year ended 31st March, 2019 to Independent and Non-Executive Directors for attending Board Meeting, Audit Committee Meetings, Remuneration Committee Meeting, CSR Committee Meeting and Stakeholders Relationship Committee Meeting as follows:
Mr. Pradeep Vedprakash Goyal H4,00,000/-, Dr. Reena Ramachandran H2,75,000/-, Mr. Pradip Pranjivan Madhavji H90,000/-, Mr. Vinod R. Sethi H2,50,000/-, Mr. Hardeep Singh H3,25,000/-and Mr. Vasant P. Gandhi H3,25,000/-.
In addition, the Company has paid commission to Independent and Non-Executive Directors of H10 lacs each to Mr. Pradeep Goyal, Dr. Reena Ramachandran, Mr. Pradip Madhavji, Mr. Vinod Rajindranath Sethi, Mr. Hardeep Singh and Mr. Vasant Prakash Gandhi.
Remuneration of the executive directors are broadly divided into fixed and variable components. The fixed components comprises of salary, allowances, perquisites, amenities and
retirement benefits. The variable components comprises of performance based annual commission. The performance criteria are individual performance based on annual targets, Company’s performance and recent compensation trends in the industry.
The appointment of executive directors is for a period of five years. The service agreement provides for a notice period of three months on either side.
6. Stakeholders Relationship CommitteeThe Board of the Company has constituted a Stakeholders Relationship Committee, comprising one Independent, one Promoter and one Executive Director to look into the redressal of grievances of security holders including complaints related to transfer of shares, non-receipt of balance sheet, non-receipt of declared dividends. One meeting of the Stakeholders Relationship Committee was held on 31st January, 2019.
96 | Annual Report 2018-19
UPL Limited

Composition of members of Stakeholders Relationship Committee is as follows:Composition Mr. Pradip Pranjivan
Madhavji @
Mr. Pradeep Vedprakash Goyal
Chairman
Mrs. Sandra Rajnikant Shroff
Mr. Arun Chandrasen Ashar
Meeting attended during the year - 1 1 1@ Resigned with effect from 27th April, 2018.
Compliance Officer:Mr. M. B. Trivedi, Company Secretary
The Company also has its separate shares transfer committee consisting of Mrs. Sandra Rajnikant Shroff and Mr. Arun Chandrasen Ashar, Directors and two other senior executives of the Company. This committee normally meets weekly to approve transfer of shares, issue of duplicate certificates, redressal of Stakeholders Grievances, among others. Share certificates submitted for dematerialisation and request for rematerialisation were also approved by the committee.
No complaint was pending at the beginning of the year and the total number of complaints received during the year under review were 81 of which 62 complaints were addressed to the satisfaction of shareholders on or before 31st March, 2019 and 19 complaint were pending as on or before 31st March, 2019.
Twenty-one requests for transfers were pending for approval as on 31st March, 2019, out of which nine were processed under objections on or before 15th May, 2019 and twelve was approved and dealt with on 8th April, 2019.
7. General Body Meetings (A) Annual General Meetings: Location and time for last three Annual General Meetings were:Year AGM Location Date Time2015-16 32nd AGM Hotel Green View Hall
N. H. No. 8, Vapi, Gujarat - 396 195.29/06/2016 10.00 a.m.
2016-17 33rd AGM Hotel Green View HallN. H. No. 8, Vapi, Gujarat - 396 195.
08/07/2017 11.00 a.m.
2017-18 34th AGM Hotel Green View HallN. H. No. 8, Vapi, Gujarat - 396 195.
23/08/2018 11.00 a.m.
The following special resolutions were passed by the members during the last three Annual General Meetings:
2015-16a) Private placement of Non-Convertible Debentures.
2016-17a) Private placement of Non-Convertible Debentures.
b) Approval of UPL Limited -Employees Stock Option Plan 2017.
c) Grant of options to the employees of the Subsidiary Company(ies) of the Company under Employees Stock Option Plan 2017.
2017-18a) Private placement of Non-Convertible Debentures.
b) Re-appointment of Mr. Rajnikant Devidas Shroff as Chairman and Managing Director for a further period of five years from the expiry of his present term of office, i.e., with effect from 1st October, 2018 and of payment of remuneration.
c) Re-appointment of Mr. Arun Chandrasen Ashar as Whole-time Director designated as Director-Finance for a further period of five years from the expiry of his present term of office, i.e., with effect from 1st October, 2018 and of payment of remuneration.
The following special resolutions were passed by the members during Extra-Ordinary General Meeting of the members of the Company held on 22nd March, 2019.
a) Continuation of Directorship by Mrs. Sandra Rajnikant Shroff (DIN: 00189012) as Non-Executive Director of the Company, liable to retire by rotation.
b) Continuation of Directorship by Dr. Reena Ramachandran (DIN: 00212371) as an Independent Non-Executive Woman Director of the Company.
Details of resolution passed through postal ballot, the persons who conducted the postal ballot exercise and details of voting pattern
Annual Report 2018-19 | 97
UPL Limited

2018-19• No resolution, pursuant to Section 110 of the Companies
Act, 2013 read with Companies (Management & Administration) Rules, 2014, was passed through Postal Ballot during the year.
• None of the resolutions, pursuant to Section 110 of the Companies Act, 2013 read with Companies (Management & Administration) Rules, 2014, are proposed to be passed in the ensuing Annual General Meeting which require passing a special resolution through Postal Ballot.
8. Means of communication The quarterly and annual results are published by
the Company in the English and Gujarati editions of the The Economics Times/DNA/Business Standard/Business Line/The Financial Express/Western Times
and are also displayed on the corporate website, www.upl-ltd.com. The Company’s website also contains a separate dedicated section called ‘Investors’ wherein shareholder-related information like the Annual Report of the Company, shareholding pattern among others, are available. Official news releases are sent to the Stock Exchanges at BSE Ltd. and National Stock Exchange of India Ltd., where the equity shares of the Company are listed.
Further, the Company also holds an Analysts’ meet after the audited Annual Financial Statements have been adopted by the Board of Directors, where information is disseminated and analyzed. The presentation made at this meet has been posted on the corporate website, www.upl-ltd.com.
The Management Discussion and Analysis (MD&A) forms a part of the annual report.
9. General Shareholder Information9.1. Annual General MeetingDate 28th August, 2019 at 11.00 a.m.Venue : Hotel Green View Hall
N. H. No. 8, Vapi - 396195, Gujarat.9.2. Financial calendarAnnual General Meeting – 28th August, 2019Results for quarter ending June 30th, 2019 On or before 14th August, 2019Results for quarter ending September 30th, 2019
On or before 14th November, 2019
Results for quarter ending December31st, 2019
On or before 14th February, 2020
Results for quarter/ year ending March 31st, 2020
Last week of April, 2020/May, 2020.
9.3. Dividend payment date On or after 2nd September, 20199.4. (a) Listing of Equity Shares on Stock
Exchanges atBSE Limited, Phiroze Jeejeebhoy Towers, Dalal Street, Mumbai – 400 001 and National Stock Exchange of India Ltd. Exchange Plaza, C/1,Block G, Bandra Kurla Complex, Bandra (East), MUMBAI 400 051
(b) Listing of GDR on the Stock Exchange at 42103942 GDR, arising out of amalgamation of erstwhile Advanta Ltd. with the Company, are listed at Singapore Stock Exchange Ltd.
The Company has paid the annual listing fees to each of the stock exchange.9.5. (a) Security Code/Symbol BSE Ltd.: 512070
National Stock Exchange of India Ltd.: UPLSingapore Stock Exchange Ltd.: BYS
(b) Demat ISIN Number in NSDL & CDSL for Equity Shares of H2/- each
INE628A01036
98 | Annual Report 2018-19
UPL Limited
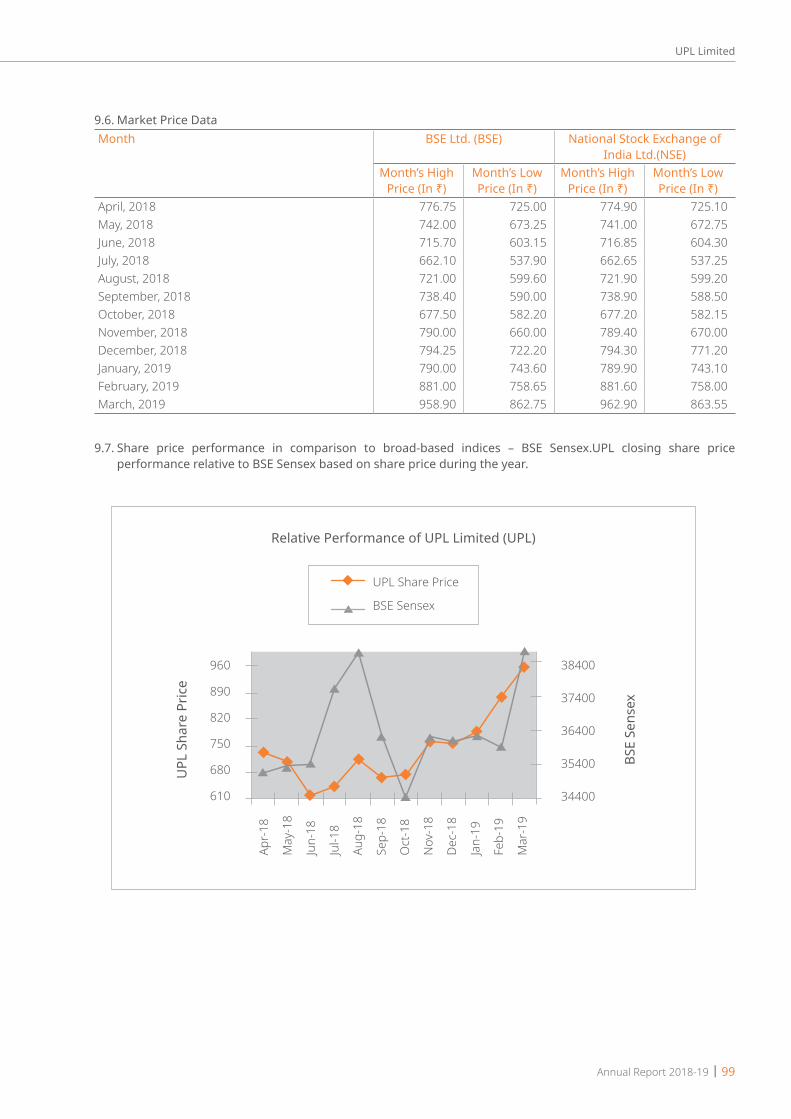
9.6. Market Price Data Month BSE Ltd. (BSE) National Stock Exchange of
India Ltd.(NSE)Month’s High
Price (In ₹)Month’s LowPrice (In ₹)
Month’s High Price (In ₹)
Month’s Low Price (In ₹)
April, 2018 776.75 725.00 774.90 725.10May, 2018 742.00 673.25 741.00 672.75June, 2018 715.70 603.15 716.85 604.30July, 2018 662.10 537.90 662.65 537.25August, 2018 721.00 599.60 721.90 599.20September, 2018 738.40 590.00 738.90 588.50October, 2018 677.50 582.20 677.20 582.15November, 2018 790.00 660.00 789.40 670.00December, 2018 794.25 722.20 794.30 771.20January, 2019 790.00 743.60 789.90 743.10February, 2019 881.00 758.65 881.60 758.00March, 2019 958.90 862.75 962.90 863.55
9.7. Share price performance in comparison to broad-based indices – BSE Sensex.UPL closing share price performance relative to BSE Sensex based on share price during the year.
Relative Performance of UPL Limited (UPL)
UPL
Sha
re P
rice
BSE
Sens
ex
960
890
820
750
680
610
38400
37400
36400
35400
34400
UPL Share Price
BSE Sensex
Apr-
18
May
-18
Jun-
18
Jul-1
8
Aug-
18
Sep-
18
Oct
-18
Nov
-18
Dec-
18
Jan-
19
Feb-
19
Mar
-19
Annual Report 2018-19 | 99
UPL Limited
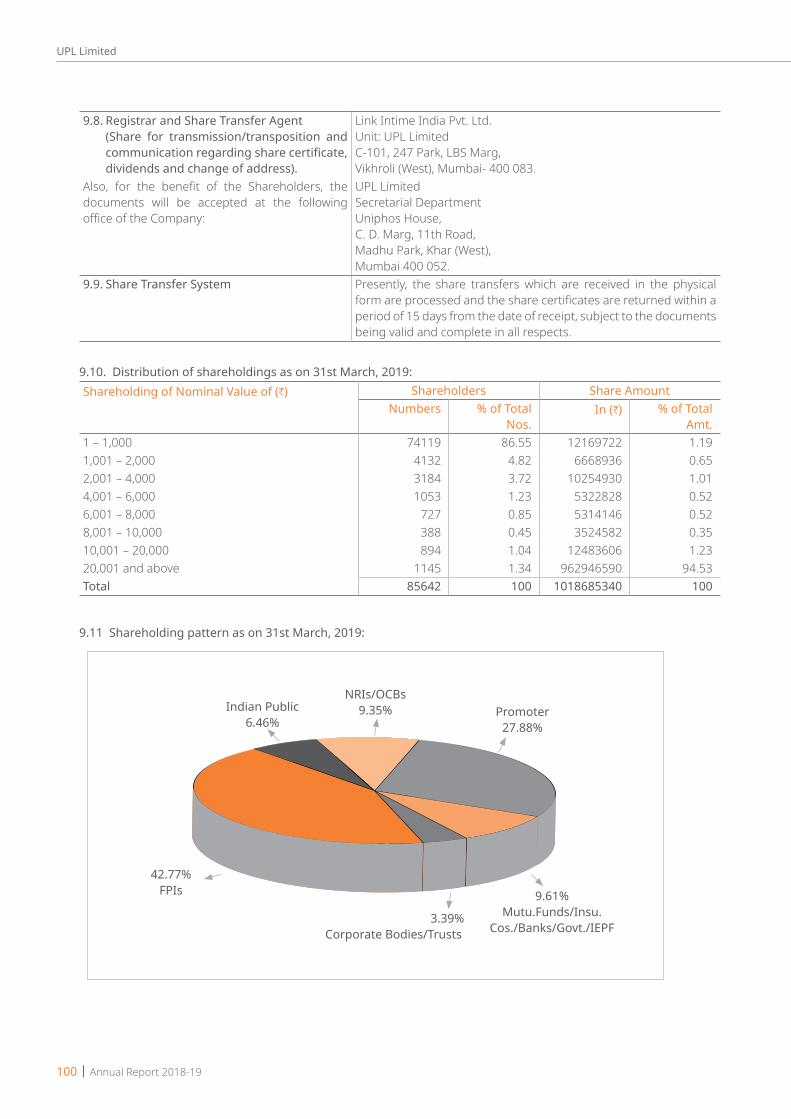
9.10. Distribution of shareholdings as on 31st March, 2019: Shareholding of Nominal Value of (H) Shareholders Share Amount
Numbers % of Total Nos.
In (H) % of Total Amt.
1 – 1,000 74119 86.55 12169722 1.191,001 – 2,000 4132 4.82 6668936 0.652,001 – 4,000 3184 3.72 10254930 1.014,001 – 6,000 1053 1.23 5322828 0.526,001 – 8,000 727 0.85 5314146 0.528,001 – 10,000 388 0.45 3524582 0.3510,001 – 20,000 894 1.04 12483606 1.2320,001 and above 1145 1.34 962946590 94.53Total 85642 100 1018685340 100
9.8. Registrar and Share Transfer Agent (Share for transmission/transposition and
communication regarding share certificate, dividends and change of address).
Link Intime India Pvt. Ltd.Unit: UPL LimitedC-101, 247 Park, LBS Marg,Vikhroli (West), Mumbai- 400 083.
Also, for the benefit of the Shareholders, the documents will be accepted at the following office of the Company:
UPL LimitedSecretarial Department Uniphos House, C. D. Marg, 11th Road,Madhu Park, Khar (West), Mumbai 400 052.
9.9. Share Transfer System Presently, the share transfers which are received in the physical form are processed and the share certificates are returned within a period of 15 days from the date of receipt, subject to the documents being valid and complete in all respects.
9.11 Shareholding pattern as on 31st March, 2019:
Indian Public6.46%
NRIs/OCBs9.35% Promoter
27.88%
9.61%Mutu.Funds/Insu.
Cos./Banks/Govt./IEPF3.39%
Corporate Bodies/Trusts
42.77%FPIs
100 | Annual Report 2018-19
UPL Limited

9.12. Dematerialization of shares 99.03% of the outstanding shares have been dematerialized up to 31st March, 2019. Trading in Equity Shares of the Company is permitted only in dematerialized form w.e.f. 28th August, 2000 as per notification issued by the Securities and Exchange Board of India (SEBI).
Liquidity: The shares of the Company are among the most liquid and actively traded shares. Relevant data for the average daily turnover for the financial year 2018–2019 is given below:
BSE Ltd. (BSE)
National Stock Exchange of India Ltd.
(NSE)
BSE+NSE
In no. of shares (in thousand) 152.02 2070.82 2222.84
(Source: This information is compiled from the data available from the websites of BSE and NSE)
9.13. Outstanding GDR/Warrants and Convertible Bonds, their conversion dates and their likely impact on the equity
As on 31st March, 2019 there are Outstanding GDRs represent 42353062 shares (8.32%).
9.14 Commodity price risk or Foreign Exchange Risk and Hedging activities
The Company has exports of finished products and imports by sourcing of raw materials from outside India. The international trade is primarily in USD and Euro which are major convertible currencies, and to that extent the exposure to forex exchange risk exists. However, the Company exports and imports are in same currencies, there is a natural hedge for these currencies. To mitigate this foreign exchange risk, the Company works out the net open position relating to trade operations and such net open positions are hedged by taking simple Forward Contracts for a period not exceeding twelve months. Similarly, for exposure on account of capital operations in Foreign Currency, the net open position is hedged by taking Forward Contracts for a period not exceeding twelve months. The Company has a Risk Management Policy in place which as approved by the Board of Directors, which monitors foreign currency risk on a continuous basis. The various derivative transactions relating to Foreign Exchange and all the outstanding Derivative Contracts are periodically reported to and ratified by the Board of Directors.
9.15 Plant locations The Company’s plants in India are located at Vapi, Ankleshwar, Jhagadia, Halol, Jammu, Haldia, Tarapore and Hyderabad.
9.16 Address for Correspondence (i) Investor correspondence
For Shares held in Physical Form Link Intime India Pvt. Ltd.Unit: UPL LimitedC-101, 247 Park, LBS Marg,Vikhroli (West), Mumbai- 400 083.Telephone No(s): 91-22-49186270Fax No.: 91-22-49186060Email: [email protected]: www.linkintime.co.inAlso, for the benefit of the Shareholders, the documents will continue to be accepted at the following office of the Company:
Annual Report 2018-19 | 101
UPL Limited

UPL LimitedSecretarial DepartmentUniphos House, C. D. Marg, 11th Road,Madhu Park, Khar (West), Mumbai 400 052.Telephone No.: 91-22-26468009/10For Shares held in Demat formTo the Depository Participant(s)
(ii) Any query on Annual Report Mr. M. B. Trivedi, Company SecretaryUPL LimitedLegal & Secretarial DepartmentUniphos House, C. D. MargMadhu Park, Khar (West), Mumbai 400 052.E-Mail : [email protected]
(iii) Exclusive e-mail ID of the grievance redressal division
(iv) Corporate website www.upl-ltd.com
10. Other Disclosures: (a) Disclosures on materially significant related party
transactions that may have potential conflict with the interests of the Company at large.
During the year, the Company had no materially significant related party transactions which were considered to have potential conflict with the interests of the Company at large.
(b) Details of non-compliance by the Company, penalties, strictures imposed on the Company by Stock Exchanges or SEBI, or any statutory authority, on any matter related to capital markets, during the last three years.
None.
(c) Details of establishment of vigil mechanism, whistle Blower Policy and affirmation that no personnel has been denied access to the audit committee.
The Company has devised an effective whistle blower mechanism enabling stakeholders, including individual employees and their representative bodies, to communicate their concerns about illegal or unethical practices freely. The Company has also established a vigil mechanism for directors and employees to report concerns about unethical behaviour, actual or suspected fraud or violation of the Company’s code of conduct or ethics policy and placed on the website of the Company www.uplonline.com and no personnel has been denied access to the audit committee.
(d) Details of compliance with mandatory requirements and adoption of the non-mandatory requirements.
Mandatory Requirements
The Company has complied with the mandatory requirements of para C (10) (d) of Schedule V SEBI (Listing Obligations and Disclosure Requirements) Regulation, 2015.
(e) Policy for determining ‘material’ subsidiary has been disclosed on the Company’s website www.upl-ltd.com.
(f) Policy on dealing with related party transaction has been disclosed on the Company’s website www.upl-ltd.com.
11. There are no non-compliance of any requirements of Corporate Governance Report of sub-paras (2) to (10) above.
12. Discretionary Requirements as specified in Part E of Schedule II
A. Chairman of the Board
The Chairman of the Board is Executive.
B. Shareholder Rights – Half yearly results
As the Company’s half yearly results are published in English newspapers circulated all over India and in a Gujarati newspaper (circulated in Gujarat) and also posted on the website of the Company www.upl-ltd.com, the same are not sent to the households of the shareholders of the Company.
102 | Annual Report 2018-19
UPL Limited
C. Modified opinion in audit report
There are no modified opinion contained in the Audit Report.
D. Separate Posts of Chairman and Chief Executive Officer
The Posts of Chairman and Managing Director are not separate.
E. Reporting of Internal Auditors
The Internal Auditors of the Company report directly to the Audit Committee.
13. The Company has complied with Corporate Governance requirements specified in Regulations 17 to 27 and clauses (b) to (i) of sub-regulation (2) of Regulation 46 of SEBI (Listing Obligations and Disclosure Requirements) Regulation, 2015.
On behalf of the Board of Directors
Mumbai, Rajnikant Devidas ShroffMay , 2019 (Chairman and Managing Director)
(DIN: 00180810)
DeclarationAs provided under Clause D of Schedule V pursuant to Regulation 34(3) of SEBI (Listing Obligations and Disclosure Requirements) Regulations, 2015, the Members of Board of Directors and Senior Management Personnel have affirmed compliance with the Code of Conduct of Board of Directors and Senior Management laid down by the Company for the year ended 31st March, 2019
On behalf of the Board of Directors of UPL Limited
Rajnikant Devidas ShroffMumbai, (Chairman and Managing Director)May 17, 2019 (DIN: 00180810)
Annual Report 2018-19 | 103
UPL Limited

We, Rajnikant Devidas Shroff, Chairman and Managing Director and Anand Vora, Chief Financial Officer do hereby certify that in respect of annual accounts and cash flow statement for the year 2018-2019.
A We have reviewed financial statements and the cash flow statement for the year and that to the best of our knowledge and belief:
(1) these statements do not contain any materially untrue statement or omit any material fact or contain statements that might be misleading;
(2) these statements together present a true and fair view of the Company’s affairs and are in compliance with existing accounting standards, applicable laws and regulations.
B. There are, to the best of our knowledge and belief, no transactions entered into by the Company during the year which are fraudulent, illegal or violative of the Company’s code of conduct.
C. We accept responsibility for establishing and maintaining internal controls for financial reporting and that we have evaluated the effectiveness of internal control systems of the Company pertaining to financial reporting and we have disclosed to the auditors and the Audit Committee, deficiencies in the design or operation of such internal controls, if any, of which we are aware and the steps we have taken or propose to take to rectify these deficiencies.
D. We have indicated to the auditors and the Audit Committee
(1) significant changes in internal control over financial reporting during the year;
(2) significant changes in accounting policies during the year and that the same have been disclosed in the notes to the financial statements; and
(3) instances of significant fraud of which we have become aware and the involvement therein, if any, of the management or an employee having a significant role in the Company’s internal control system over financial reporting.
RAJNIKANT DEVIDAS SHROFF ANAND VORAChairman and Managing Director Chief Financial Officer
Compliance CertificatePursuant to Regulation 17(8) of SEBI (Listing Obligations and Disclosure Requirements) Regulations, 2015
104 | Annual Report 2018-19
UPL Limited

To,The Members of UPL LimitedUPL House610 B/2, Bandra VillageOff Western Express Highway Bandra (East)Mumbai 400 05117 May 2019
Independent Auditors’ Certificate on Compliance with the Corporate Governance requirements under SEBI (Listing Obligations and Disclosure Requirements) Regulations, 2015 and 2018.
1. This Certificate is issued in accordance with the terms of our agreement dated 09 March 201 9.
2. This Report contains details of compliance of conditions of Corporate Governance by UPL Limited (‘The Company’) for the year ended 31 March 2019, as stipulated in Regulations 17- 27, clause (b) to (i) of Regulation 46 (2) and paragraphs C, D and E of Schedule V of Securities and Exchange Board of India (Listing Obligation and Disclosure Requirements) Regulations, 2015 and 2018 (‘Listing Regulations’) pursuant to the Listing Agreement of the Company with Stock Exchanges.
Management’s Responsibility for compliance with the conditions of Listing Regulations3. The compliance with the terms and conditions contained in the Corporate Governance is the responsibility of the
Management of the Company including the preparation and maintenance of all relevant supporting records and documents.
Auditor’s Responsibility4. Our examination was limited to procedures and implementation thereof adopted by the Company for ensuring the
compliance of the conditions of Corporate Governance. It is neither an audit nor an expression of opinion on the financial statements of the Company.
5. Pursuant to the requirements of the Listing Regulations, it is our responsibility to provide a reasonable assurance Whether the Company has complied with the conditions of Corporate Governance as stipulated in Listing Regulations for the year ended 31 March 2019.
6. We conducted our examination in accordance with the Guidance Note on Reports or Certifications for Special Purposes issued by the Institute of Chartered Accountant of India. The Guidance Note requires that we comply with the ethical requirements of the Code of Ethics issued by the Institute of Chartered Accountants of India.
7. We have complied with the relevant applicable requirements of the Standard on Quality Control (SQC) 1, Quality Control for Firms that Perform Audits and Reviews of Historical Financial Information, and Other Assurance and Related Services Engagements.
Opinion8. In our opinion, and to the best of our information and according to explanations given to us, we certify that the Company
has complied with the conditions of Corporate Governance as stipulated in the above-mentioned Listing Regulations.
9. We state that such compliance is neither an assurance as to the future viability of the Company nor the efficiency or effectiveness with which the management has conducted the affairs of the Company .
Auditor’s certificate on Corporate Governance
Annual Report 2018-19 | 105
UPL Limited

Restriction on Use10. The certificate is addressed and provided to the members of the Company solely for the purpose to enable the Company
to comply with the requirement of the Listing Regulations, and it should not be used by any other person or for any other purpose. Accordingly, we do not accept or assume any liability or any duty of care for any other purpose or to any other person to whom this certificate is shown or into whose hands it may come without our prior consent in writing.
Yours faithfully,
For B S R & Co. LLPChartered AccountantsICAI Firm Registration Number: 101248W/W-100022
Bhavesh DhupeliaMembership No: 042070Certificate UDIN No: 19042070AAAAA07139Partner
17 May 2019Mumbai
106 | Annual Report 2018-19
UPL Limited
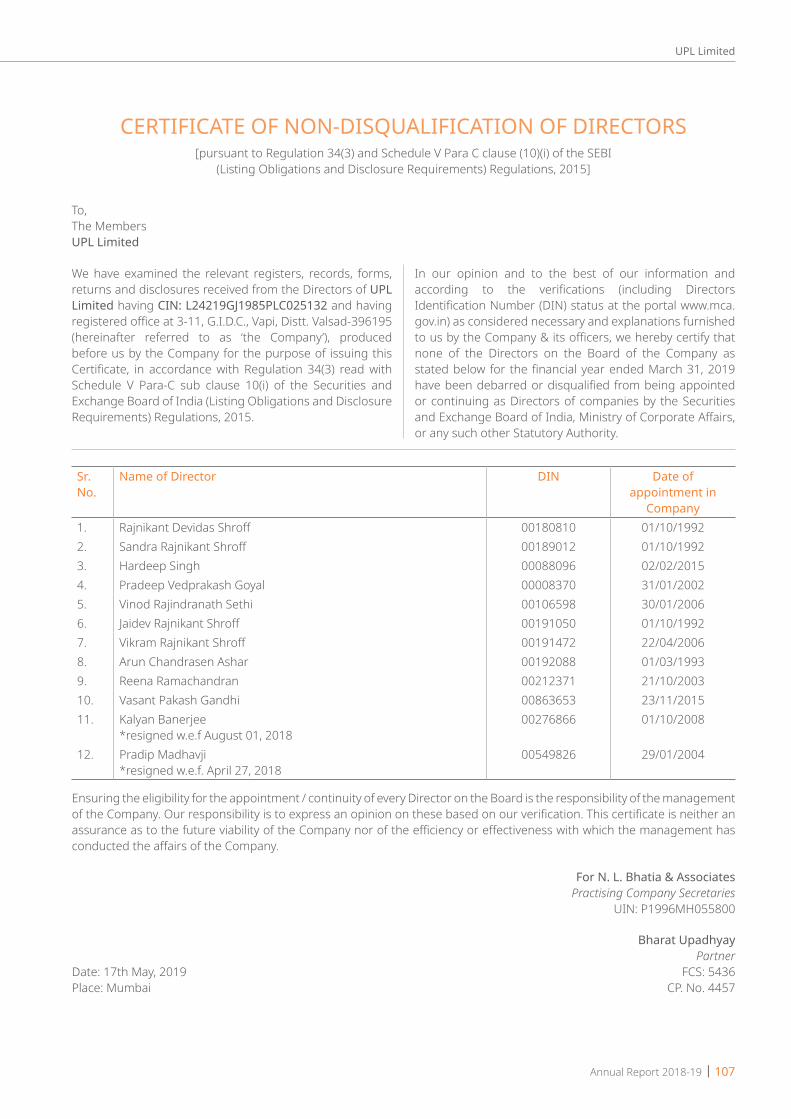
CERTIFICATE OF NON-DISQUALIFICATION OF DIRECTORS[pursuant to Regulation 34(3) and Schedule V Para C clause (10)(i) of the SEBI
(Listing Obligations and Disclosure Requirements) Regulations, 2015]
To,The MembersUPL Limited
We have examined the relevant registers, records, forms, returns and disclosures received from the Directors of UPL Limited having CIN: L24219GJ1985PLC025132 and having registered office at 3-11, G.I.D.C., Vapi, Distt. Valsad-396195 (hereinafter referred to as ‘the Company’), produced before us by the Company for the purpose of issuing this Certificate, in accordance with Regulation 34(3) read with Schedule V Para-C sub clause 10(i) of the Securities and Exchange Board of India (Listing Obligations and Disclosure Requirements) Regulations, 2015.
In our opinion and to the best of our information and according to the verifications (including Directors Identification Number (DIN) status at the portal www.mca.gov.in) as considered necessary and explanations furnished to us by the Company & its officers, we hereby certify that none of the Directors on the Board of the Company as stated below for the financial year ended March 31, 2019 have been debarred or disqualified from being appointed or continuing as Directors of companies by the Securities and Exchange Board of India, Ministry of Corporate Affairs, or any such other Statutory Authority.
Sr. No.
Name of Director DIN Date of appointment in
Company1. Rajnikant Devidas Shroff 00180810 01/10/19922. Sandra Rajnikant Shroff 00189012 01/10/19923. Hardeep Singh 00088096 02/02/20154. Pradeep Vedprakash Goyal 00008370 31/01/20025. Vinod Rajindranath Sethi 00106598 30/01/20066. Jaidev Rajnikant Shroff 00191050 01/10/19927. Vikram Rajnikant Shroff 00191472 22/04/20068. Arun Chandrasen Ashar 00192088 01/03/19939. Reena Ramachandran 00212371 21/10/200310. Vasant Pakash Gandhi 00863653 23/11/201511. Kalyan Banerjee
*resigned w.e.f August 01, 201800276866 01/10/2008
12. Pradip Madhavji*resigned w.e.f. April 27, 2018
00549826 29/01/2004
Ensuring the eligibility for the appointment / continuity of every Director on the Board is the responsibility of the management of the Company. Our responsibility is to express an opinion on these based on our verification. This certificate is neither an assurance as to the future viability of the Company nor of the efficiency or effectiveness with which the management has conducted the affairs of the Company.
For N. L. Bhatia & AssociatesPractising Company Secretaries
UIN: P1996MH055800
Bharat UpadhyayPartner
Date: 17th May, 2019 FCS: 5436Place: Mumbai CP. No. 4457
Annual Report 2018-19 | 107
UPL Limited

Business Responsibility ReportFor the year 2018-2019
Section A: General Information about the Company1. Corporate Identity Number (CIN) of the Company L24219GJ1985PLC0251322. Name of the Company UPL Limited3. Registered Address 3-11, GIDC, VAPI, DIST VALSAD, GUJARAT4. Website www.upl-ltd.com5. E-mail id [email protected]. Financial Year Reported April 2018 to March 20197. Sector(s) that the Company is engaged in (industrial activity code-wise) 2021 - Agrochemicals8. List three key products/services that the Company manufactures/
provides (as in balance sheet)a) Industrial chemicals
b) Agrochemicalsc) Hybrid seeds
9. Total number of locations where business activity is undertaken by the Company:a. Number of International Locations 75b. Number of National Locations 26 Depots & 10 companies
10. Markets served by the Company – Local/State/National/International: a. Global Market, 120 countries in the world
Section B: Financial Details of the Company1. Paid Up Capital (INR) H102 crores2. Total Turnover (INR) 8,660 crores3. Total Profit after Taxes (INR) 405 crores4. Total Spending on Corporate Social Responsibility
(CSR as percentage of Profit after Tax)18.00 crores(4.44% of Profit after Tax)
5. List of activities in which the expenditure in 4 above has been incurred. Ø National Institutions (Gnyandham, EMRS, Nursing, SRICT, U-CAE)
Ø Sustainable LivelihoodØ Nature conservationØ National & Local Area needs
Section C: Other Details 1. Does the Company have any Subsidiary Company/Companies? Yes. The Company has subsidiaries
2. Do the Subsidiary Company/Companies participate in the BR Initiatives of the parent company? If yes, then indicate the number of such subsidiary company(s)
No. The subsidiaries conduct BR initiatives independently.
3. Do any other entity / entities (e.g. Supplier, distributor etc.) that the Company does business with, participate in the BR initiatives of the Company? If yes indicate the percentage of such entities? (Less than 30%, 30 – 60% and More than 60%)
Yes. All the Supplier/ Vendors which cater to the needs of UPL in terms of good and services as well as our affiliates globally come under the purview of our Supplier Code of Conduct. These entity include our supplier, contractors, contract manufacturers, tollers and joint venture partners whom share a contractual and commercial relationship with us. The policy specifies lays down our expectations from our value chain partners.
108 | Annual Report 2018-19
UPL Limited

Section D: BR Information1. Details of Director/Directors responsible for BR a) Details of the Director/Director responsible for implementation of the Business Responsibility policy/policies
Name DIN Number DesignationMr. R. D. Shroff 00180810 Chairman & Managing Director
b) Details of the Business Responsibility Head
DIN Number (if applicable) 00180810Name Mr. R. D. ShroffDesignation Chairman & Managing DirectorTelephone number 2271528000E-mail ID [email protected]
2. Principle-wise (as per NVGs) BR Policy/Policies a) Details of compliance (Reply in Y/N)
No. Questions P1 P2 P3 P4 P5 P6 P7 P8 P91 Do you have policy/policies for… Y Y Y Y Y Y Y Y Y2 Has the policy been formulated
in consultation with relevant stakeholders?
Y Y Y Y Y Y Y Y YYes, all the policies have been developed in consultation with the Management of the Company.
3 Does the policy conform to any national /international standards? If yes, specify? (50 words)
Y Y Y Y Y Y Y Y YThe policies are formulated as per principles of National Voluntary Guidelines (NVG)
4 Has the policy been approved by the Board?If yes, has it been signed by the MD/owner/CEO/appropriate Board Director?
Y Y Y Y Y Y Y Y YThe policies are approved by the board and signed by the heads of the respective department responsible for the implementation of the policies.
5 Does the Company have a specified committee of the Board/ Director/Official to oversee the implementation of the policy?
Y Y Y Y Y Y Y Y Y
6 Indicate the link to view the policy online?
Y Y Y Y Y Y Y Y YThe policies are available on our internet portal which can be viewed at http://www.upl-ltd.com
7 Has the policy been formally communicated to all relevant internal and external stakeholders?
Y Y Y Y Y Y Y Y Y
8 Does the Company have in-house structure to implement its policy/policies?
Y Y Y Y Y Y Y Y Y
9 Does the Company have a grievance redressal mechanism related to the policy/policies to address stakeholders’ grievances related to policy/policies?
Y Y Y Y Y Y Y Y Y
10 Has the Company carried out independent audit/evaluation of the working of this policy by an internal or external agency?
Y Y Y Y Y Y Y Y Y
Annual Report 2018-19 | 109
UPL Limited

b) If answer against any principle, is ‘No’, please explain why: (Tick up to 2 options):
No. Questions P1 P2 P3 P4 P5 P6 P7 P8 P91 The Company has not understood
the principles2 The Company is not at a stage where
it finds itself in a position to formulate and implement the policies on specified principles
3 The Company does not have financial or manpower resources available for the task
4 It is planned to be done in the next 6 months
5 It is planned to be done in the next year
6 Any other reason (please specify)
3. Governance related to BRa) Indicate the frequency with which the Board of
Directors, Committee of the Board or CEO to assess the BR performance of the Company. Within 3 months, 3-6 months, Annually, More than 1 year.
The board of directors meet annually to access the BR related performance.
b) Does the Company publish a BR or a Sustainability Report? What is the hyperlink for viewing this report? How frequently it is published?
Yes, UPL Ltd publishes a Business Responsibility Report. The report is part of the annual report of FY 2017-18
Section E: Principle Wise PerformancePrinciple 1: Businesses should conduct and govern themselves with Ethics, Transparency and AccountabilityA. Does the policy relating to ethics, bribery and corruption
cover only the Company? Yes/ No. Does it extend to the Group/Joint Ventures/ Suppliers/Contractors/NGOs /Others?
Yes. Ethics & transparency is in the core of all our business practices and activities. Being a responsible brand we have policies in place that establish a robust mechanism to ensure ethical conduct and transparency. Clauses pertaining to our anti-bribery, conflict of interest, compliance with Government rules, intellectual property, confidentiality, advertising, fair dealings and equal opportunity are covered in our Code of Conduct. This Code extends to all employees, directors and senior management personnel. Our strict adherence to ethical practices trickles down to our value chain through a separate code of conduct guidance for our suppliers, contractors, contract manufacturers, tollers and joint venture partners. This policy guideline lays down principles with respect to ethics, intellectual property, legal requirements, employment practices, health, safety, environmental and quality practices, conflict minerals, procurement from civil war zones, communications, monitoring and compliance.
B. How many stakeholder complaints have been received in the past financial year and what percentage was satisfactorily resolved by the management? If so, provide details thereof, in about 50 words or so.
The Company has incorporated a stakeholder relationship committee which comprises of three independent directors. UPL’s whistle blower policy is applicable to all our relevant stakeholders. In the current financial year we have received 01 number of complains and same was resloved.
Principle 2: Businesses should provide goods and services that are safe and contribute to sustainability throughout their life cycle1. List up to 3 products or services whose design has
incorporated social or environmental concerns, risks, and/or opportunities.
UPL understands impacts of its business on environment & society and takes responsibility to develop its products, favoring betterment of environment and society. In every action of the Company, the farmer is at the beginning and in the center of our activities. UPL invests in cost efficient products for our beneficiaries. Our products are energy efficient & consumes lower resources during utilization resulting in creating positive environmental footprint. Following are the three key products whose design address social and environmental concerns:
a. Herbicide b. Insecticide c. Fungicide UPL believes in adapting new technologies which has a
positive impact on environment and social dimensions along with economic dimensions. UPL has an in-house team for the evaluation and development of new technologies which helps us to make our processes more efficient.
Following are some technological upgradation adopted by UPL;
110 | Annual Report 2018-19
UPL Limited

• We have implemented DAF-MBBR technology to reduce physical and organic impurities of wastewater
• We have implemented Zero Liquid discharge (ZLD) system at Unit-10 Tarapur (Maharashtra) to make it ZLD Plant
• We have started recycling 140 m3/day Sewage treated plant water in DVACl plant’s cooling tower at Unit-0 Vapi, Gujarat.
• Installed rain water Harvesting system at Unit-4 Halol
• Installed Scaleban technology to recycle & reuse ETP treated wastewater in cooling tower at Unit- 1 Ankleshwar and Unit-5 Jhagadia, Gujarat
• We have signed and executed Green power purchase agreement of total 4.2 MWh wind energy for Unit-1 Ankleshwar and Unit-5 Jhagadia, Gujarat.
• Improved Loss on dry (LOD) of ETP waste at Unit-5 Jhagadia (Gujarat) and Unit-10 Tarapur (Maharashtra) to reduce moisture content by installing Volute dewatering system
1. For each product, provide the following details in respect of resources (energy, water, raw material etc.) per unit of product.(i) Reduction during sourcing/production/ distribution
achieved since the previous year throughout the value chain?
The Company is actively working on its products to reduce overall impacts through incorporation of advance and effective technologies, few of the achievements are mentioned below.
1. In reporting year, we have recycled around 12% of water by various water recycling system like Reverse Osmosis (RO), Rain water Harvesting, steam condensate recovery and STP treated effluent recycling.
2. By Using renewable energy through Green Power purchase agreement, we have reduced around 6755 tons CO2
(ii) Reduction during usage by consumers (energy, water) has been achieved since the previous year?
The Company is committed to reduce its environmental and social footprints through its activities. We thoughtfully design our products keeping our customers in mind and their requirements. We train farmers through our CSR activities on modern agricultural techniques which helps them to reduce their overall water consumption and electricity consumption.
2. Does the Company have procedures in place for sustainable sourcing (including transportation)? If yes, what percentage of your inputs was sourced sustainably? Provide details thereof, in about 50 words or so.
Yes, the Company has a sustainable procurement policy in place which is a guidance to our internal team and for suppliers/ vendors before onboarding them. Our internal team performs audits and our suppliers/ vendors also sign a declaration on “commitment to sustainability” which is the agreement from their side to maintain the laws and standards set by the Company.
The Company is also working with its Global Sustainability team to design sustainable practices, particularly for its supply chain. These practices primarily focus on improvements in process to improve energy efficiency, waste management, water management, and compliances regarding sustainability.
3. Has the Company taken any steps to procure goods and services from local & small producers, including communities surrounding their place of work? If yes, what steps have been taken to improve their capacity and capability of local and small vendors?
Yes, the Company understands the importance of development of its local suppliers and vendors and takes special initiatives to build their capacity and capability. UPL has training calendar in place on sustainable practices for suppliers and vendors, this includes physical interactions and online training modules.
We connect with local suppliers and vendors located nearby our plants to procure most of our packaging materials, this includes materials as Plastic bottles, Corrugated boxes, Fiber drums, Flexible laminates, HDPE Woven bags, etc. UPL also procures raw materials locally such as MnSO4, Salt, Caustic soda, Chlorine, Hydrated Lime, ZnSO4, 3-4 DCA, Specialized Starch, China clay, Mg turning, Ethanol, Sulphur, Ammonia, Chloral, Acids etc.
4. Does the Company have mechanism to recycle products and waste? If yes, what is the percentage of recycling waste and products?
Yes, UPL has mechanisms in place to recycle its waste, most of our plants are “Zero Liquid Discharge”. We recycled certain waste by 100%, which includes Ammonium chloride, Ammonium acetate, Methyl chloride, sodium sulfate, ammonium sulphate, calcium chloride, hydrochloric acid, MDC residue, HNO3, etc. Product recoveries are above 95 %, however some products are recovered 100%.
Other waste is treated as per required process and disposed safely.
Principle 3: Businesses should promote the wellbeing of all employees1. Please indicate the total number of employees-
Total number of employees as on 31st March, 2019 is 4,703.
2. Please indicate the total number of employees hired on temporary/contractual/casual basis –
Annual Report 2018-19 | 111
UPL Limited

Total number of employees hired on temporary/ contractual/ casual basis as on 31st March, 2019 is 7,773.
3. Please indicate the number of permanent women employees –
Total number of permanent women employees as on 31st March, 2019 is 166.
4. Please indicate the number of permanent employees with disability –
Total number of permanent employees with disability as on 31st March, 2019 is 22.
5. Do you have an employee association that is recognized by management?
The Company does not have any recognized employee association.
6. What percentage of your permanent employees are a member of this recognized employee association?
Not Applicable
7. Please indicate the Number of complaints relating to child labour, forced labour, involuntary labour, sexual harassment in the last financial year and pending, as on the end of the financial year.
The Company has implemented a policy on sexual harassment, UPL has initiated e-learning program for awareness of the policy and was mandated for employees. The Company has incorporated a corporate level committee to monitor the implementation of this policy with a presiding officer along with a unit level committee at all manufacturing units. This committee consist of male and female members both.
We also have a Child Labor Policy which is strictly followed and it is applicable to all contract and permanent workforce.Category No. of
complaints during financial year
No. of complaints pending at the end of the financial year
Child Labour / Forced Labour / Involuntary Labour
Nil Nil
Sexual Harassment
Nil Nil
Discriminatory employment
Nil Nil
8. What percentage of your under mentioned employees were given safety & skill up-gradation training in the last year?
UPL takes safety of its employees very seriously and has taken up programmes to train our workforce on how to main occupation health and safety.
Safety – 14 PSM elements are the basis for Safety Processes. Trainings are provided accordingly to the workforce. Our internal team has developed few rituals on safety which is followed with full respect.
• Daily Safety Talk: Daily briefing on safety before start of the shift.
• Monthly we cover a particular safety theme by the unit safety representative.
The Company also invests in trainings to upgrade the skills of our employees based on requirements and demand. A Calendar based training program is published for both behavior and functional development of the employees. Based on the availability and nominations the employees are provided with the trainings and certifications. No employee in manufacturing functions can take charge of respective activities unless they have undergone Level 0, 1 & 2 training minimum duration for which is 23 days. This training basically is intended for safety and functional expertise including safety in operating related functions.
Company has several other training programmes which essentially addresses the areas of safety on various activities like construction safety, Chemical safety, emergency response, Process Safety Management, electrical safety etc. UPL does not differentiate between company employees or contractual employees.
UPL has a defined Health and Safety policy which is available on the Intranet and accessible to all employees.
112 | Annual Report 2018-19
UPL Limited
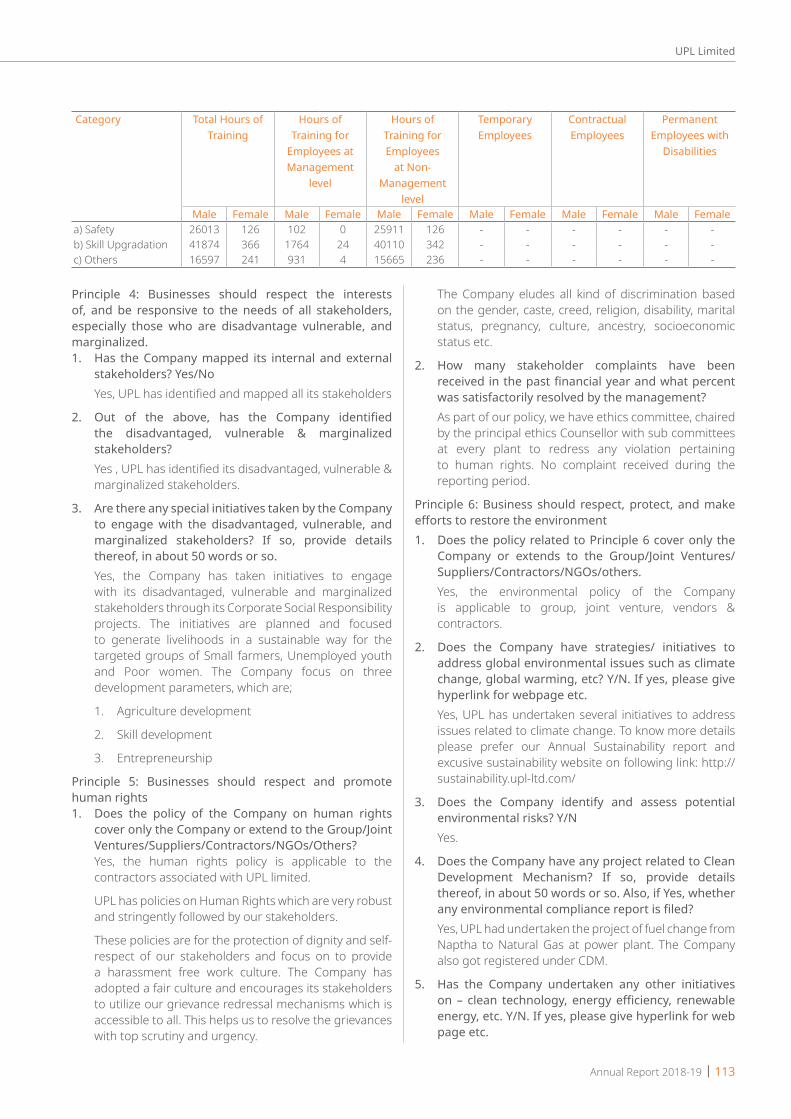
Category Total Hours of Training
Hours of Training for
Employees at Management
level
Hours of Training for Employees
at Non-Management
level
Temporary Employees
Contractual Employees
Permanent Employees with
Disabilities
Male Female Male Female Male Female Male Female Male Female Male Femalea) Safety 26013 126 102 0 25911 126 - - - - - -b) Skill Upgradation 41874 366 1764 24 40110 342 - - - - - -c) Others 16597 241 931 4 15665 236 - - - - - -
Principle 4: Businesses should respect the interests of, and be responsive to the needs of all stakeholders, especially those who are disadvantage vulnerable, and marginalized.1. Has the Company mapped its internal and external
stakeholders? Yes/No Yes, UPL has identified and mapped all its stakeholders
2. Out of the above, has the Company identified the disadvantaged, vulnerable & marginalized stakeholders?
Yes , UPL has identified its disadvantaged, vulnerable & marginalized stakeholders.
3. Are there any special initiatives taken by the Company to engage with the disadvantaged, vulnerable, and marginalized stakeholders? If so, provide details thereof, in about 50 words or so.
Yes, the Company has taken initiatives to engage with its disadvantaged, vulnerable and marginalized stakeholders through its Corporate Social Responsibility projects. The initiatives are planned and focused to generate livelihoods in a sustainable way for the targeted groups of Small farmers, Unemployed youth and Poor women. The Company focus on three development parameters, which are;
1. Agriculture development
2. Skill development
3. Entrepreneurship
Principle 5: Businesses should respect and promote human rights1. Does the policy of the Company on human rights
cover only the Company or extend to the Group/Joint Ventures/Suppliers/Contractors/NGOs/Others?
Yes, the human rights policy is applicable to the contractors associated with UPL limited.
UPL has policies on Human Rights which are very robust and stringently followed by our stakeholders.
These policies are for the protection of dignity and self-respect of our stakeholders and focus on to provide a harassment free work culture. The Company has adopted a fair culture and encourages its stakeholders to utilize our grievance redressal mechanisms which is accessible to all. This helps us to resolve the grievances with top scrutiny and urgency.
The Company eludes all kind of discrimination based on the gender, caste, creed, religion, disability, marital status, pregnancy, culture, ancestry, socioeconomic status etc.
2. How many stakeholder complaints have been received in the past financial year and what percent was satisfactorily resolved by the management?
As part of our policy, we have ethics committee, chaired by the principal ethics Counsellor with sub committees at every plant to redress any violation pertaining to human rights. No complaint received during the reporting period.
Principle 6: Business should respect, protect, and make efforts to restore the environment1. Does the policy related to Principle 6 cover only the
Company or extends to the Group/Joint Ventures/Suppliers/Contractors/NGOs/others.
Yes, the environmental policy of the Company is applicable to group, joint venture, vendors & contractors.
2. Does the Company have strategies/ initiatives to address global environmental issues such as climate change, global warming, etc? Y/N. If yes, please give hyperlink for webpage etc.
Yes, UPL has undertaken several initiatives to address issues related to climate change. To know more details please prefer our Annual Sustainability report and excusive sustainability website on following link: http://sustainability.upl-ltd.com/
3. Does the Company identify and assess potential environmental risks? Y/N
Yes.
4. Does the Company have any project related to Clean Development Mechanism? If so, provide details thereof, in about 50 words or so. Also, if Yes, whether any environmental compliance report is filed?
Yes, UPL had undertaken the project of fuel change from Naptha to Natural Gas at power plant. The Company also got registered under CDM.
5. Has the Company undertaken any other initiatives on – clean technology, energy efficiency, renewable energy, etc. Y/N. If yes, please give hyperlink for web page etc.
UPL Limited
Annual Report 2018-19 | 113

Yes, the Company has taken various initiatives to make its processes clean and energy efficient, details are as mentioned below;
1. Clean technology adopted for manufacturing
• Membrane cell Technology for caustic chlorine manufacturing
• CS2 manufacturing using natural gas
• Use of natural gas in Boiler
• Recycle of steam condensate
• Installed water recycling system (RO) & water recycled in to process
• MDC residue (Spent solvent) Sold to recyclers /end users
• Use of energy efficient LED lighting system across UPL sites
2. Recovery of products from Waste streams
• Sodium sulphate from waste ML
• NaSH from H2S scrubber
• Calcium chloride, ammonia and di calcium phosphate sludge from ML
• Recovery of Sodium Sulphate from effluent
• Recovery of HNO3 & H2SO4 from ML
• Manufacture NaSH as by-product from CS2 plant by utilizing excess H2S gas which was previously sent for thermal destruction in TGTU
• Mn(OH)2 recovered from ML
• Recycle of drums for packaging
6. Are the Emissions/Waste generated by the Company within the permissible limits given by CPCB/SPCB for the financial year being reported?
UPL always monitors its waste generation limits, this helps the Company to ensure that generated waste is within the limits provided by Central Pollution Control Board (CPCB)/ State Pollution Control Board (SPCB).
7. Number of show cause/ legal notices received from CPCB/SPCB which are pending (i.e. not resolved to satisfaction) as on end of Financial Year.
Nil
Principle 7: Businesses, when engaged in influencing public and regulatory policy, should do so in a responsible manner1. Is your company a member of any trade and chamber
or association? If Yes, Name only those major ones that your business deals with:
Yes, the Company is member of various trade associations and chambers which helps UPL to identify and understand the common concerns of the business
and its impacts on the communities. UPL is currently a part of the following associations:
I. Vapi Industrial Association
II. Indian Merchant Chambers
III. Crop Care Federation of India
IV. Asmechem
V. Centigro Environment of Agriculture
VI. CII
2. Have you advocated/lobbied through above associations for the advancement or improvement of public good? Yes/No; if yes specify the broad areas ( drop box: Governance and Administration, Economic Reforms, Inclusive Development Policies, Energy security, Water, Food Security, Sustainable Business Principles, Others)
Yes, the Company lobbies with industry association and also with Government bodies to resolve the issues related to chemical and pesticide industry. UPL gets actively involved at industry forums and with Ministry through meetings and dialogues providing valuable suggestions favoring business and public good.
Company has lobbied or advocated through public associations on the below topics:
I. Problems of Chemical Industries in Gujarat and India
II. Customs and Excise laws effecting faster industrial development
III. Environment and pollution matters
IV. Agriculture and Agro Chemical inputs
V. Fight against foreign funded NGO’s
VI. Promoting and educating public about advantage of scientific agriculture and use of agro chemicals
VII. Other matters connected with government policy “Make in India”
VIII. Removal of hurdles and exports
Principle 8: Businesses should support inclusive growth and equitable development1. Does the Company have specified programmes/
initiatives/projects in pursuit of the policy related to Principle 8? If yes details thereof.
UPL Philosophy always believes in holistic and sustainable growth of society. Three simple words, which lie at the core of the UPL philosophy (Doing Things Better), have been the guiding force in all our community interventions. All our CSR programs are determined with the trust that humankind is one community, where each member is responsible for the wellbeing of the other, hence our interventions are
UPL Limited
114 | Annual Report 2018-19
not restricted to the development of our neighboring communities only. We work on programs that cater to the wider national interest, our CSR efforts are focused in Gujarat and they have also touched lives in many other states including Maharashtra, West Bengal, Kashmir, Tamil Nadu and Himachal Pradesh.
Our commitment and interventions cater all the segment of the society and have been classified in 4 focus areas, they are:
• Institutions for Nation Buildings
• Sustainable Livelihoods
• Nature Conservation
• Local and National Needs
For more detail’s login to https://www.upl-ltd.com/sustainability
2. Are the programmes/projects undertaken through in-house team/own foundation/external NGO/government structures/any other organization?
Yes, the Company has a dedicated in-house experienced CSR team/ UPL promoted foundation to make the blueprint and execute the CSR programmes. UPL also engages with third parties, Government organizations, NGO’s and CBO’s to perform specific programmes based on community needs and requirements.
3. Have you done any impact assessment of your initiative?
Yes, the Company conducts third-party impact assessment for all the CSR initiatives to measure the long-term impact of the interventions in a period of three years. Lately, the Company has conducted the study in 2016 where the results were very encouraging both at the macro and micro level. Few highlights of the assessment are pointed as below:
a. Impact on Financial wellbeing of neighboring community:
i. Under skill development initiatives, an average monthly income of youth in the region increased from ₹4,750 to ₹7,750 after getting trained from the center and getting gainfully employed. which is an increment of 63%.
ii. Under women empowerment program, the study found that an average monthly income of an SHG member is ₹3,155 as compared to a non SHG members ₹1,500, where both were engaging in income generation activity.
iii. Under skill based entrepreneurial development program, an average monthly income
increased from ₹1,240 to ₹2,060 after getting trained, which is an increment of 66%.
iv. 18% increase in land productivity there by improving the profitability from paddy farming. Profits per acre from paddy increased from ₹ 1,472 to ₹3,199 after SRI application.
v. Under the initiative of Kitchen Garden development, weekly expense on green vegetables reduced from ₹146 to ₹99 after the interventions.
vi. The average monthly income of a nursing graduate of Sandra Shroff ROFEL College of Nursing, Vapi is ₹23,200 as compared to that of a simple graduate who gainfully employed ₹14,333/
b. Impact on Socio Cultural Environment i. Women members experience enhances self-
reliance, self-expression and advocacy, 100% of the women have advocated the program to others and have successfully enrolled more women in to SHGs. All the SHGs have experienced an increase in decision making powers in social and economic domains.
ii. 67% students feel more empowered to take decisions, while 44% felt their social status has improved after graduating from SRICT.
c. Impact on Human Resource Development i. 69% of the youth experienced improvement in
knowledge and skills at the skill development institute.
ii. 100% respondent children know the important of wearing footwear, washing hands, using dustbins and brushing teeth under School Sanitation program.
iii. 56% members improved their skills, 31% improved their knowledge and 13% experienced enhanced confidence in Valsad under women empowerment initiatives.
Additionally, the in-house team conducts need assessment survey before execution of the programmes/ projects and performs regular internal monitoring to validate the initiative in between.
4. What is your company’s direct contribution to community development projects Amount in INR and the details of the projects undertaken.
Direct contribution to community development projects is ₹ 18.00 crores which is 4.4 % of profit after tax.
UPL Limited
Annual Report 2018-19 | 115
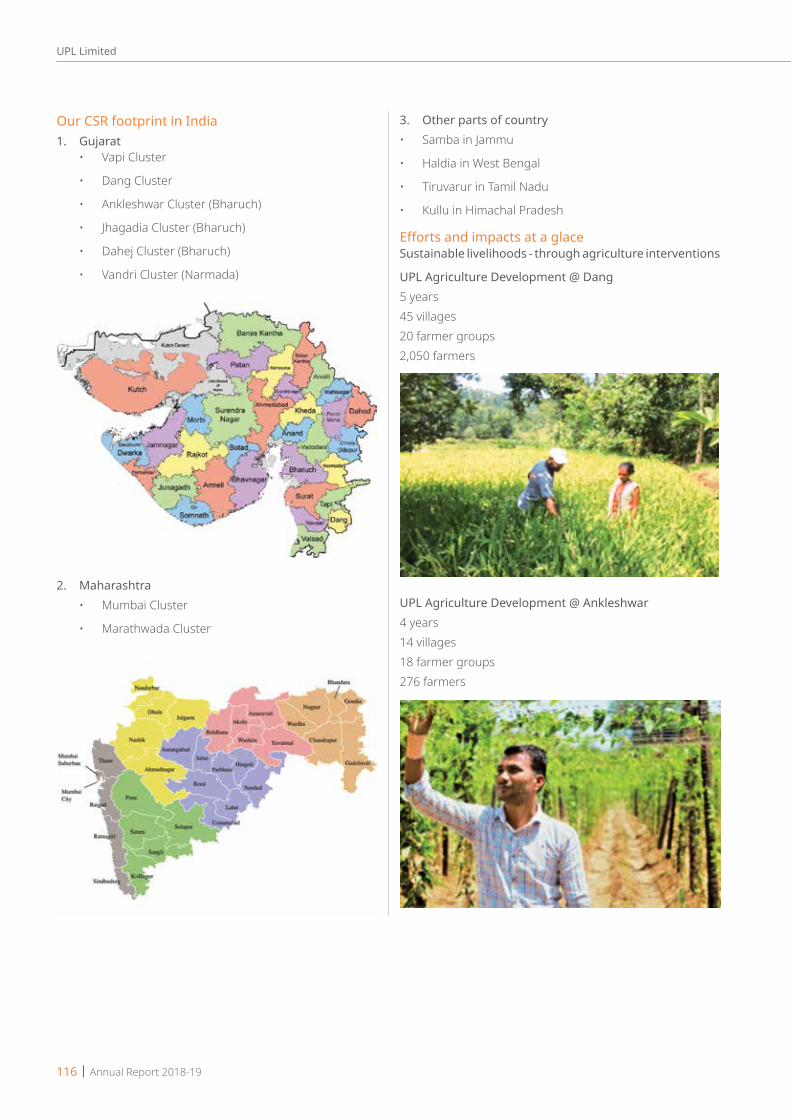
Our CSR footprint in India1. Gujarat • Vapi Cluster
• Dang Cluster
• Ankleshwar Cluster (Bharuch)
• Jhagadia Cluster (Bharuch)
• Dahej Cluster (Bharuch)
• Vandri Cluster (Narmada)
2. Maharashtra • Mumbai Cluster
• Marathwada Cluster
3. Other parts of country• Samba in Jammu
• Haldia in West Bengal
• Tiruvarur in Tamil Nadu
• Kullu in Himachal Pradesh
Efforts and impacts at a glaceSustainable livelihoods - through agriculture interventions
UPL Agriculture Development @ Dang5 years 45 villages 20 farmer groups2,050 farmers
UPL Agriculture Development @ Ankleshwar4 years 14 villages 18 farmer groups276 farmers
UPL Limited
116 | Annual Report 2018-19

UPL Agriculture Development @ Jhagadia4 years 13 villages9 farmer groups145 farmers
UPL Agriculture Development @ Vapi3 years 10 villages10 farmer groups200 farmers
UPL AKRSP(I) SRI6 years 25 villages 1,500 farmers
Livelihood Enhancement of Tribals (Waghai block)2 years2 villages
UPL BoriBagicha4 years 58 villages 2,191 farmers
Animal Husbandry3 years21 villages 185 households 1,992 artificial insemination
UPL Limited
Annual Report 2018-19 | 117

Agriculture Market Linkage 1 year (pilot phase)
UPL Agriculture Development @ Vandri3 Years 4 Villages 436 Farmers
UPL Centre for Agriculture Excellence17 Years 15181 Farmers
Sustainable livelihood through skill development of youth and womenUPL Niyojaniy (Skill development program for dropouts)5 Years1327 Youth Trained 798 Placed in Industries
Skill Based Entrepreneurial Development Program5 Years 1054 Participants trained
UPL Limited
118 | Annual Report 2018-19
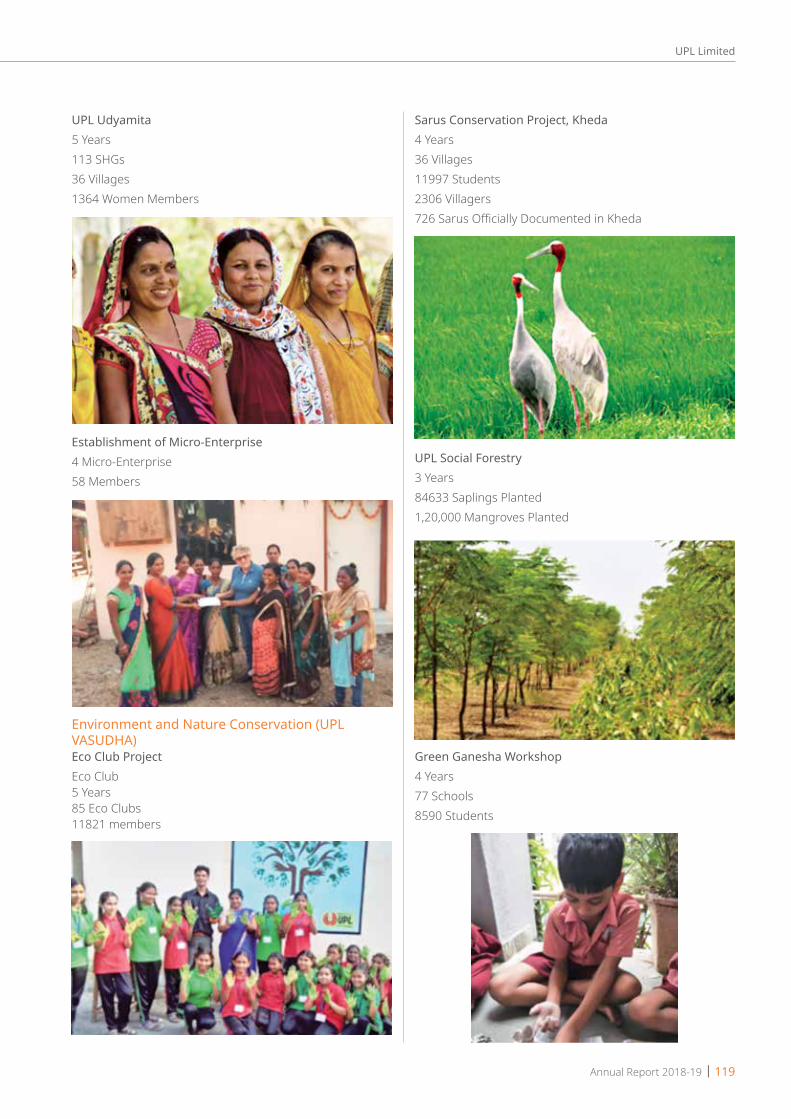
UPL Udyamita5 Years 113 SHGs36 Villages 1364 Women Members
Establishment of Micro-Enterprise 4 Micro-Enterprise58 Members
Environment and Nature Conservation (UPL VASUDHA)Eco Club ProjectEco Club5 Years 85 Eco Clubs 11821 members
Sarus Conservation Project, Kheda4 Years 36 Villages 11997 Students 2306 Villagers 726 Sarus Officially Documented in Kheda
UPL Social Forestry 3 Years 84633 Saplings Planted 1,20,000 Mangroves Planted
Green Ganesha Workshop4 Years 77 Schools 8590 Students
UPL Limited
Annual Report 2018-19 | 119

Water Conservation/ Resource Development Activities 1 Year7 Group Wells, 2 Check dam5 Deepening Ponds 25812 Cubic meter water conserved
Projects of Local and National Interests UPL School Sanitation 4 years 47 school sanitation blocks built9,225 students are using the facility regularly3,000 commuters/ day are using the facility
Safety Trainings 5 years 37,415 participants trained
UPL Unnati 3 years9 Community Based Organizations empowered
United Against Child Labour 1 year131 volunteers associated 3,010 growers made aware
Support to Motihari Farmer Producer Company(FPC)10 FPCs formed3,000 farmer members
UPL Limited
120 | Annual Report 2018-19

Global Parli 3 years 106 villages 726 farmers
Vandri Cluster Development3 years4 villages436 farmer families
UPL Deer & Ungulate Breeding Project1 Year
Project “Asptal” – Mobile Medical Service at Hamirpur, Himachal Pradesh1 Year 1 Medical Unit
Support to Seva Yagna Samiti, Bharuch for Neonatal Care 2 Years198 new-born treated
UPL Limited
Annual Report 2018-19 | 121

Employee Engagement Program of UPL (We are United)
Financial Year No. of volunteers Volunteer Hours Man-days devoted for Community Development Program
2014-2015 102 2727 3412015-2016 152 3871 4842016-2017 123 3866 4832017-2018 125 3023 3782018-2019 147 4863 608Total 18350 2294
Institutions for Nation Building:Smt. Sandraben Shroff GnyanDham School, Vapi46 years1600 students/year
5. Have you taken steps to ensure that this community development initiative is successfully adopted by the community? Please explain in 50 words, or so.
Our approaches of CSR initiatives emphasis on community participation in all stages of the project cycle. All our interventions focus on the needs, strengths and growth of the community. The below diagram explains the approaches, we adopt to implement any interventions
Need Assessment
Capacity Building to Farmers Group,
& Institution
Participatory Planning
Institution Building
Participatory Monitoring & Hand holding
Implementation through the community
UPL Limited
122 | Annual Report 2018-19

Figure: 1. Left above-Net Planning with community, 2. Right above- Transect walk –PRA, 3 & 4: Below Left & Right: Technical Survey and physical verification at ground (at Vandri)
Multiple interventions have been designed and implemented in Dang district to provide sustainable livelihood through improved agricultural practices, where all the interventions were planned and implemented with the support of farmers groups at the village level.
In Vandri Cluster development program, each activity was implemented through community from planning to final execution. It was ensured that the communities were involved in planning, procuring, implementing and ensuring quality of work implementation. Apart from their participation, they also contributed financially/through labour for individual work (25 %) and community work (10%). The whole project owned by the community at Vandri.
Principle 9: Businesses should engage with and provide value to their customers and consumers in a responsible manner
1. What percentage of customer complaints/consumer cases are pending as on the end of financial year.
AT UPL, several internal mechanisms have been devised to track and attend to any consumer/customer complaints that arise. ERP systems track any complaint
entered from the front -end sales team and ensure auto escalation if the same is not addressed expeditiously.
2. Does the Company display product information on the product label, over and above what is mandated as per local laws? Yes/No/N.A. /Remarks(additional information)
UPL is a responsible corporate and our product labels display all information that is essential to ensure safe and efficacious use of our products. Product labels are compliant with all CIB regulations and legal metrology guidelines.
3. Is there any case filed by any stakeholder against the Company regarding unfair trade practices, irresponsible advertising and/or anti-competitive behavior during the last five years and pending as on end of financial year. If so, provide details thereof, in about 50 words or so.
No such cases were filed against the Company.
4. Did your company carry out any consumer survey/ consumer satisfaction trends?
The Company strives to meet customer needs and
UPL Limited
Annual Report 2018-19 | 123
provide best possible solutions to help them tide of their agriculture problems. Customer/consumer feedback is taken on a regular basis by deploying different kinds of surveys.
Both inhouse surveys as well as third party surveys through market research agencies were carried out. Internal surveys focussed mainly on dealer and farmer satisfaction and insights on need gaps.
An inhouse Survey with customers was carried out as a part of the manufacturing excellence by the factory team in Punjab, Haryana, Gujarat, Maharashtra to understand satisfaction with UPL products and services in terms of quality of packaging, delivery and product efficacy. The survey revealed high levels of satisfaction. Some shortcomings that were identified were acted upon systematically in a phase wise manner.
Inhouse customer surveys are also done by UPL Adarsha Kisan Center on regular basis with Farmer and Dealer to understand satisfaction levels and concerns if any.
The Company has its call centers at various locations in India like Mumbai, Visakhapatnam and Chandigarh under the brand of “Adarsh Kisan Center”(AKC). Our customers can connect with us through a toll-free number provided on all product packaging, they can lodge a complaint against any of our products or services as well. All the queries and complaints from customers are taken on priority and resolved. In case if a customer requires further assistance, the case is escalated to the field executive team of UPL, a person from our field team visits the location and resolves the issue personally. We use our call centers to take feedback from registered farmers at AKC, this scope of survey is broad which includes product availability, usage and market access of harvest.
External Surveys through Market Research agencies were done with farmers to understand insights on product usage, need gaps, and farmer satisfaction. Quality, ease of use, value for money when compared to competing brands were also measured.
UPL Limited
124 | Annual Report 2018-19

Stat
emen
t of A
OC
1 Fo
rm
(Pur
suan
t to
first
pro
viso
to s
ub-s
ectio
n (3
) of s
ectio
n 12
9 re
ad w
ith ru
le 5
of C
ompa
nies
(Acc
ount
s) R
ules
, 201
4)
St
atem
ent c
onta
inin
g sa
lient
feat
ures
of t
he fi
nanc
ial s
tate
men
t of s
ubsi
diar
ies
Pa
rt A
Sub
sidi
arie
s
(Info
rmat
ion
in re
spec
t of e
ach
subs
idia
ry to
be
pres
ente
d w
ith a
mou
nts
in H
)Am
ount
in c
rore
s (H
)Sr
. N
o.N
ame
of S
ubsi
diar
yRe
port
ing
perio
d fo
r the
sub
sidi
ary
conc
erne
d, if
di
ffere
nt fr
om
the
hold
ing
com
pany
’s re
port
ing
perio
d
Repo
rtin
g cu
rren
cy E
xcha
nge
rate
(C
losi
ng
Rate
)
Shar
e ca
pita
l Re
serv
es &
su
rplu
sTo
tal
asse
tsTo
tal
Liab
ilitie
s In
vest
men
ts
(exc
ludi
ng
inve
stm
ents
m
ade
in
subs
idia
ries)
Turn
over
Profi
t be
fore
ta
xatio
n
Prov
isio
n fo
r ta
xatio
n
Profi
t af
ter
taxa
tion
Prop
osed
D
ivid
end
% o
f sha
re-
hold
ing
1Sh
roffs
Uni
ted
Chem
icals
Lim
ited
INR
1.0
0 0
0
0
0
-
0
0
(0)
0
- 10
0%
2SW
AL C
orpo
ratio
n Li
mite
dIN
R 1
.00
1
108
5
77
468
-
634
1
8 (6
) 1
3 -
100%
3U
nite
d Ph
osph
orus
(Ind
ia)
LLP
INR
1.0
0 2
3
5 8
17
781
-
1,5
83
32
(11)
20
- 10
0%
4U
nite
d Ph
osph
orus
Glo
bal
LLP
INR
1.0
0 0
0
0
0
-
- 0
(0
) 0
-
100%
5O
ptim
a Fa
rm S
olut
ions
Li
mite
dIN
R 1
.00
2
38
43
4
- 1
32
17
(5)
12
- 10
0%
6U
PL E
urop
e Li
mite
dEU
R 7
7.66
4
,178
8
86
18,
421
13,
357
- 8
64
7
(21)
(14)
- 78
%7
UPL
Deu
tsch
land
Gm
bHEU
R 7
7.66
0
4
6 3
67
321
-
368
3
7 (1
2) 2
5 -
78%
8U
PL P
olsk
a Sp
z.o
.o.
PLN
18.
05
0
(0)
0
0
- -
(0)
- (0
) -
78%
9U
PL B
enel
ux B
.V.
EUR
77.
66
0
117
2
37
121
-
285
3
1 (8
) 2
4 -
78%
10Ce
rexa
gri B
.V.
EUR
77.
66
176
2
46
987
5
66
- 9
72
32
(8)
24
- 78
%11
Blue
Sta
r B.V
.EU
R 7
7.66
-
- -
- -
- (0
) -
(0)
- -
12U
nite
d Ph
osph
orus
Hol
ding
s Co
oper
atie
f U.A
.EU
R 7
7.66
6
,998
(1
08)
13,
694
6,8
04
- 3
(1
09)
(6)
(115
) -
78%
13U
nite
d Ph
osph
orus
Hol
ding
s B.
V.EU
R 7
7.66
0
4
,447
6
,438
2
,015
2
3 3
(1
6) 5
(1
0) -
78%
14De
cco
Wor
ldw
ide
Post
-Har
vest
Hol
ding
s Co
oper
atie
f U.A
.
EUR
77.
66
29
(0)
29
1
- 3
(0
) -
(0)
- 78
%
15De
cco
Wor
ldw
ide
Post
-H
arve
st H
oldi
ngs
B.V.
EUR
77.
66
0
37
170
1
32
- 3
(4
) -
(4)
- 78
%
16U
nite
d Ph
osph
orus
Hol
ding
, Br
azil
B.V.
EUR
77.
66
0
2,9
10
3,1
30
310
8
9 3
(1
5) 3
(1
2) -
78%
17U
PL It
alia
S.R
.L.
EUR
77.
66
1
63
332
2
69
- 3
09
19
(6)
14
- 78
%18
UPL
Iber
ia, S
.A.
EUR
77.
66
2
57
127
6
8 -
207
2
0 (5
) 1
5 -
78%
19De
cco
Iber
ica P
ostc
osec
ha,
S.A.
U.EU
R 7
7.66
1
1
01
133
3
0 -
140
2
1 (5
) 1
6 -
78%
20Tr
anst
erra
Inve
st, S
. L. U
.EU
R 7
7.66
6
7 (1
1) 6
05
549
-
- (3
) (2
) (5
) -
78%
21Ce
rexa
gri S
.A.S
.EU
R 7
7.66
1
03
231
4
65
131
-
410
1
3 (0
) 1
2 -
78%
22N
eo-F
og S
.A.
EUR
77.
66
2
24
33
7
- 3
3 1
0 (3
) 7
-
78%
Annual Report 2018-19 | 125
UPL Limited

Amou
nt in
cro
res
(H)
Sr.
No.
Nam
e of
Sub
sidi
ary
Repo
rtin
g pe
riod
for t
he s
ubsi
diar
y co
ncer
ned,
if
diffe
rent
from
th
e ho
ldin
g co
mpa
ny’s
repo
rtin
g pe
riod
Repo
rtin
g cu
rren
cy E
xcha
nge
rate
(C
losi
ng
Rate
)
Shar
e ca
pita
l Re
serv
es &
su
rplu
sTo
tal
asse
tsTo
tal
Liab
ilitie
s In
vest
men
ts
(exc
ludi
ng
inve
stm
ents
m
ade
in
subs
idia
ries)
Turn
over
Profi
t be
fore
ta
xatio
n
Prov
isio
n fo
r ta
xatio
n
Profi
t af
ter
taxa
tion
Prop
osed
D
ivid
end
% o
f sha
re-
hold
ing
23U
PL F
ranc
e EU
R 7
7.66
2
7 8
4 2
51
140
-
466
3
1 (9
) 2
2 -
78%
24U
nite
d Ph
osph
orus
Sw
itzer
land
Lim
ited
CHF
69.
44
1
1
1
0
- -
0
(0)
0
- 78
%
25Ag
roda
n, A
pSDK
K 1
0.40
3
0
3
0
-
- 0
(0
) 0
-
78%
26De
cco
Italia
SRL
EUR
77.
66
8
41
73
24
- 4
4 4
(1
) 3
-
78%
27Li
mite
d Li
abilit
y Co
mpa
ny
“UPL
” RU
B 1
.07
19
(6)
76
63
- 3
1 (2
) 4
2
-
78%
28De
cco
Port
ugal
Pos
t Har
vest
, U
nipe
ssoa
l LDA
(for
mer
ly kn
own
as U
PL P
ortu
gal
Uni
pess
oal L
DA)
EUR
77.
66
0
(0)
0
0
- 1
0
(0
) 0
-
78%
29U
nite
d Ph
osph
orus
Inc.
USD
69.
16
6,7
05
(4,6
80)
10,
996
8,9
78
7
3,6
17
(5,9
24)
17
(5,9
08)
- 78
%30
UPI
Fin
ance
LLC
USD
69.
16
- -
- -
- -
- -
- -
78%
31Ce
rexa
gri,
Inc.
(PA)
USD
69.
16
- -
- -
- -
- -
- -
78%
32U
PL D
elaw
are,
Inc.
USD
69.
16
- -
- -
- -
- -
- -
78%
33Ca
negr
ass
LLC
USD
69.
16
- -
- -
- -
- -
- -
55%
34De
cco
US
Post
-Har
vest
Inc
USD
69.
16
0
46
177
1
31
- 2
44
(47)
11
(36)
- 78
%35
Esse
ntiv
LCC
USD
69.
16
- -
- -
- -
- -
- -
39%
36Ri
ceCo
LLC
USD
69.
16
- -
- -
- -
- -
- -
78%
37Ri
ceco
Inte
rnat
iona
l, In
c.U
SD 6
9.16
0
2
66
302
3
6 -
128
2
2 -
22
- 78
%38
UPL
Cor
pora
tion
Lim
ited
USD
69.
16
125
1
1,30
1 4
0,68
2 2
9,29
0 3
5 1
,692
3
93
(8)
385
-
78%
39U
PL L
imite
dU
SD 6
9.16
-
- -
- -
- -
- -
- -
40U
PL M
anag
emen
t DM
CCU
SD 6
9.16
0
1
57
193
3
6 -
188
2
7 -
27
- 78
%41
UPL
Lim
ited
USD
69.
16
0
2,9
57
3,9
38
1,0
25
44
2,8
02
523
-
523
-
78%
42U
PL A
gro
S.A.
de
C.V.
MXN
3.5
8 5
3 (4
2) 4
22
411
-
487
(8
) 0
(8
) -
78%
43De
cco
Jifki
ns M
exico
Sap
iM
XN 3
.58
0
(12)
10
22
- 1
0 (4
) -
(4)
- 78
%44
Perr
ey P
artic
ipaç
ões
S.A
BRL
17.
75
- -
- -
- -
- -
- -
78%
45U
niph
os In
dust
ria e
Co
mer
cio d
e Pr
odut
os
Qui
mico
s Lt
da.
BRL
17.
75
1,9
08
(894
) 1
,021
8
-
- (6
8) (7
) (7
5) -
78%
46U
pl d
o Br
asil
Indu
stria
e
Com
ércio
de
Insu
mos
Ag
rope
cuár
ios
S.A.
BRL
17.
75
1,3
06
355
7
,248
5
,587
-
4,4
46
(168
) 5
5 (1
13)
- 78
%
47U
PL C
osta
Rica
S.A
. CR
C 0
.11
0
(13)
225
2
37
- 3
32
2
- 2
-
78%
48U
PL B
olivi
a S.
R.L
BOB
10.
01
4
(11)
106
1
13
- 5
1 (8
) -
(8)
- 78
%49
UPL
Par
agua
y S.
A.PY
G 0
.01
5
(5)
121
1
22
- 7
0 4
-
4
- 78
%50
Icon
a Sa
nlui
s S
.A.
USD
69.
16
2
(26)
14
38
- -
(6)
- (6
) -
78%
51DV
A Te
chno
logy
Arg
entin
a S.
A.BR
L 1
7.75
-
- -
- -
- -
- -
- -
52U
PL A
rgen
tina
S A
USD
69.
16
227
(4
34)
414
6
22
- 3
56
(214
) -
(214
) -
78%
53De
cco
Chile
SpA
CLP
0.1
0 0
1
9 3
2 1
3 -
53
10
(3)
7
- 78
%
126 | Annual Report 2018-19
UPL Limited
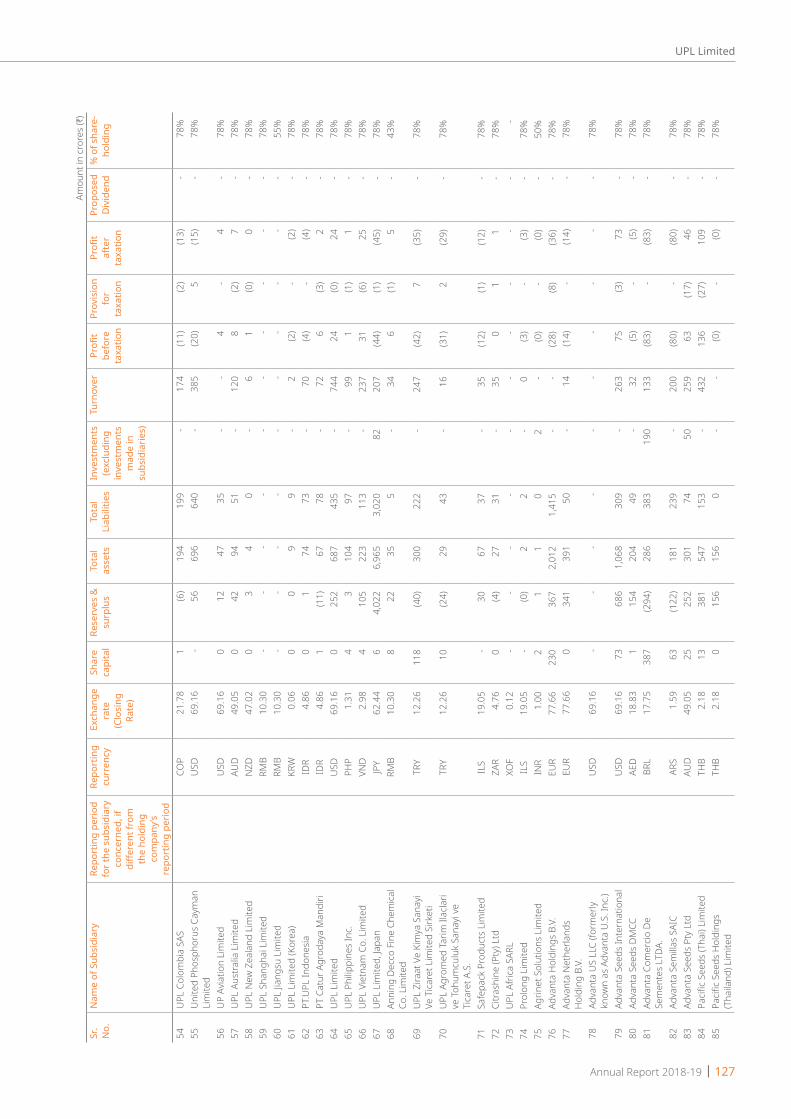
Amou
nt in
cro
res
(H)
Sr.
No.
Nam
e of
Sub
sidi
ary
Repo
rtin
g pe
riod
for t
he s
ubsi
diar
y co
ncer
ned,
if
diffe
rent
from
th
e ho
ldin
g co
mpa
ny’s
repo
rtin
g pe
riod
Repo
rtin
g cu
rren
cy E
xcha
nge
rate
(C
losi
ng
Rate
)
Shar
e ca
pita
l Re
serv
es &
su
rplu
sTo
tal
asse
tsTo
tal
Liab
ilitie
s In
vest
men
ts
(exc
ludi
ng
inve
stm
ents
m
ade
in
subs
idia
ries)
Turn
over
Profi
t be
fore
ta
xatio
n
Prov
isio
n fo
r ta
xatio
n
Profi
t af
ter
taxa
tion
Prop
osed
D
ivid
end
% o
f sha
re-
hold
ing
54U
PL C
olom
bia
SAS
COP
21.
78
1
(6)
194
1
99
- 1
74
(11)
(2)
(13)
- 78
%55
Uni
ted
Phos
phor
us C
aym
an
Lim
ited
USD
69.
16
- 5
6 6
96
640
-
385
(2
0) 5
(1
5) -
78%
56U
P Av
iatio
n Li
mite
dU
SD 6
9.16
0
1
2 4
7 3
5 -
- 4
-
4
- 78
%57
UPL
Aus
tralia
Lim
ited
AUD
49.
05
0
42
94
51
- 1
20
8
(2)
7
- 78
%58
UPL
New
Zea
land
Lim
ited
NZD
47.
02
0
3
4
0
- 6
1
(0
) 0
-
78%
59U
PL S
hang
hai L
imite
d RM
B 1
0.30
-
- -
- -
- -
- -
- 78
%60
UPL
Jian
gsu
Lim
ited
RMB
10.
30
- -
- -
- -
- -
- -
55%
61U
PL L
imite
d (K
orea
) KR
W 0
.06
0
0
9
9
- 2
(2
) -
(2)
- 78
%62
PT.U
PL In
done
sia
IDR
4.8
6 0
1
7
4 7
3 -
70
(4)
- (4
) -
78%
63PT
Cat
ur A
grod
aya
Man
diri
IDR
4.8
6 1
(1
1) 6
7 7
8 -
72
6
(3)
2
- 78
%64
UPL
Lim
ited
USD
69.
16
0
252
6
87
435
-
744
2
4 (0
) 2
4 -
78%
65U
PL P
hilip
pine
s In
c.PH
P 1
.31
4
3
104
9
7 -
99
1
(1)
1
- 78
%66
UPL
Vie
tnam
Co.
Lim
ited
VND
2.9
8 4
1
05
223
1
13
- 2
37
31
(6)
25
- 78
%67
UPL
Lim
ited,
Japa
nJP
Y 6
2.44
6
4
,022
6
,965
3
,020
8
2 2
07
(44)
(1)
(45)
- 78
%68
Anni
ng D
ecco
Fin
e Ch
emica
l Co
. Lim
ited
RMB
10.
30
8
22
35
5
- 3
4 6
(1
) 5
-
43%
69U
PL Z
iraat
Ve
Kim
ya S
anay
i Ve
Tica
ret L
imite
d Si
rket
iTR
Y 1
2.26
1
18
(40)
300
2
22
- 2
47
(42)
7
(35)
- 78
%
70U
PL A
grom
ed Ta
rim Il
acla
ri ve
Toh
umcu
luk
Sana
yi ve
Ti
care
t A.S
.
TRY
12.
26
10
(24)
29
43
- 1
6 (3
1) 2
(2
9) -
78%
71Sa
fepa
ck P
rodu
cts
Lim
ited
ILS
19.
05
- 3
0 6
7 3
7 -
35
(12)
(1)
(12)
- 78
%72
Citr
ashi
ne (P
ty) L
tdZA
R 4
.76
0
(4)
27
31
- 3
5 0
1
1
-
78%
73U
PL A
frica
SAR
LXO
F 0
.12
- -
- -
- -
- -
- -
-74
Prol
ong
Lim
ited
ILS
19.
05
- (0
) 2
2
-
0
(3)
- (3
) -
78%
75Ag
rinet
Sol
utio
ns L
imite
dIN
R 1
.00
2
1
1
0
2
- (0
) -
(0)
- 50
%76
Adva
nta
Hol
ding
s B.
V.EU
R 7
7.66
2
30
367
2
,012
1
,415
-
- (2
8) (8
) (3
6) -
78%
77Ad
vant
a N
ethe
rland
s H
oldi
ng B
.V.
EUR
77.
66
0
341
3
91
50
- 1
4 (1
4) -
(14)
- 78
%
78Ad
vant
a U
S LL
C (fo
rmer
ly kn
own
as A
dvan
ta U
.S. I
nc.)
USD
69.
16
- -
- -
- -
- -
- -
78%
79Ad
vant
a Se
eds
Inte
rnat
iona
lU
SD 6
9.16
7
3 6
86
1,0
68
309
-
263
7
5 (3
) 7
3 -
78%
80Ad
vant
a Se
eds
DMCC
AE
D 1
8.83
1
1
54
204
4
9 -
32
(5)
- (5
) -
78%
81Ad
vant
a Co
mer
cio D
e Se
men
tes
LTDA
.BR
L 1
7.75
3
87
(294
) 2
86
383
1
90
133
(8
3) -
(83)
- 78
%
82Ad
vant
a Se
milla
s SA
ICAR
S 1
.59
63
(122
) 1
81
239
-
200
(8
0) -
(80)
- 78
%83
Adva
nta
Seed
s Pt
y Lt
d AU
D 4
9.05
2
5 2
52
301
7
4 5
0 2
59
63
(17)
46
- 78
%84
Pacifi
c Se
eds
(Tha
i) Li
mite
dTH
B 2
.18
13
381
5
47
153
-
432
1
36
(27)
109
-
78%
85Pa
cific
Seed
s H
oldi
ngs
(Tha
iland
) Lim
ited
THB
2.1
8 0
1
56
156
0
-
- (0
) -
(0)
- 78
%
Annual Report 2018-19 | 127
UPL Limited

Amou
nt in
cro
res
(H)
Sr.
No.
Nam
e of
Sub
sidi
ary
Repo
rtin
g pe
riod
for t
he s
ubsi
diar
y co
ncer
ned,
if
diffe
rent
from
th
e ho
ldin
g co
mpa
ny’s
repo
rtin
g pe
riod
Repo
rtin
g cu
rren
cy E
xcha
nge
rate
(C
losi
ng
Rate
)
Shar
e ca
pita
l Re
serv
es &
su
rplu
sTo
tal
asse
tsTo
tal
Liab
ilitie
s In
vest
men
ts
(exc
ludi
ng
inve
stm
ents
m
ade
in
subs
idia
ries)
Turn
over
Profi
t be
fore
ta
xatio
n
Prov
isio
n fo
r ta
xatio
n
Profi
t af
ter
taxa
tion
Prop
osed
D
ivid
end
% o
f sha
re-
hold
ing
86PT
Adv
anta
See
ds In
done
siaID
R 4
.86
11
(20)
53
62
- 8
9 3
(1
) 3
-
78%
87Ad
vant
a Se
eds
Ukr
aine
LLC
UAH
2.5
4 0
4
5
0
-
2
(2)
- (2
) -
78%
88U
PL L
imite
d M
aurit
ius
(For
mel
y kn
own
as U
PL A
gro
Lim
ited
Mau
ritiu
s)
USD
69.
16
0
491
1
,783
1
,291
-
2,4
88
412
-
412
-
78%
89Ri
ceco
Inte
rnat
iona
l Ba
ngla
desh
Ltd
BDT
0.8
2 0
2
7
5
-
18
2
(1)
1
- 78
%
90U
niph
os M
alay
sia S
dn B
hdM
YR 1
6.94
2
(0
) 2
0
-
- 0
-
0
- 78
%91
Decc
o G
ıda
Tarım
ve
Zira
i Ü
rünl
er S
an. T
ic A.
S.
TRY
12.
26
4
3
36
29
- 3
3 4
(1
) 3
-
78%
92Ar
ysta
Life
Scie
nce
Aust
ralia
Pt
y Lt
d.AU
D 4
9.05
2
7
8 2
01
121
-
51
9
(3)
6
- 78
%
93Ar
ysta
Life
Scie
nce
Iber
ia S
LUEU
R 7
7.66
1
8 2
8 1
29
83
- 5
9 9
(2
) 7
-
78%
94Ar
ysta
Life
Scie
nce
Fran
ce
SAS
EUR
77.
66
3
(37)
177
2
10
- 8
7 (4
) -
(4)
- 78
%
95Ar
ysta
Life
scie
nce
Italia
SrL
EUR
77.
66
0
74
256
1
82
- 1
2
(0
) 2
-
78%
96Ar
ysta
Life
Scie
nce
Bene
lux
SPRL
EUR
77.
66
95
577
1
,337
6
65
- 4
45
136
(4
4) 9
2 -
78%
97AN
ESA
S.A.
EUR
77.
66
85
32
117
0
-
- (0
) -
(0)
- 78
%98
Arys
ta L
ifeSc
ienc
e (M
aurit
ius)
Lt
dU
SD 6
9.16
3
49
94
582
1
39
- 9
0 1
4 (0
) 1
4 -
78%
99Ar
ysta
Life
Scie
nce
Sout
h Af
rica
(Pty
) Ltd
ZAR
4.7
6 0
1
35
758
6
50
27
136
(6
) 2
(4
) -
78%
100
Arys
ta L
ifeSc
ienc
e Ar
gent
ina
S.A.
U
SD 6
9.16
2
56
(76)
317
1
36
- 9
(1
0) (2
) (1
3) -
78%
101
Arys
ta L
ifeSc
ienc
e do
Br
asil
Indú
stria
Quí
mica
e
Agro
pecu
ária
SA
BRL
17.
75
569
5
34
2,9
17
1,8
25
10
157
(4
6) 1
4 (3
2) -
68%
102
Volca
no A
groc
ienc
ia
Indu
stria
e C
omer
cio d
e De
fens
ivos
Agric
olas
Ltd
a
BRL
17.
75
9
(3)
14
9
- -
(0)
- (0
) -
78%
103
Arys
ta L
ifeSc
ienc
e Ch
ile S
.A.
USD
69.
16
66
241
3
73
66
- 3
9 4
(1
) 3
-
78%
104
Arys
ta L
ifeSc
ienc
e Co
lom
bia
S.A.
SCO
P 2
1.78
0
0
0
0
-
0
0
(0)
0
- 78
%
105
Arys
ta L
ifeSc
ienc
e M
exico
, S.
A.de
C.V
MXN
3.5
8 4
4 2
67
815
5
05
- 8
5 (1
6) 1
0 (6
) -
78%
106
Gru
po B
ioqu
imico
Mex
icano
, S.
A. d
e C.
V.M
XN 3
.58
220
5
23
897
1
54
- 4
6 1
3 (2
) 1
1 -
78%
107
Arys
ta L
ifeSc
ienc
e Co
sta
Rica
SA.
CRC
0.1
1 0
(1
) 1
1 1
2 -
2
0
(0)
0
- 78
%
108
Mac
Derm
id (S
hang
hai)
Chem
ical L
td.
RMB
10.
30
8
(1)
7
0
- -
(0)
- (0
) -
78%
128 | Annual Report 2018-19
UPL Limited
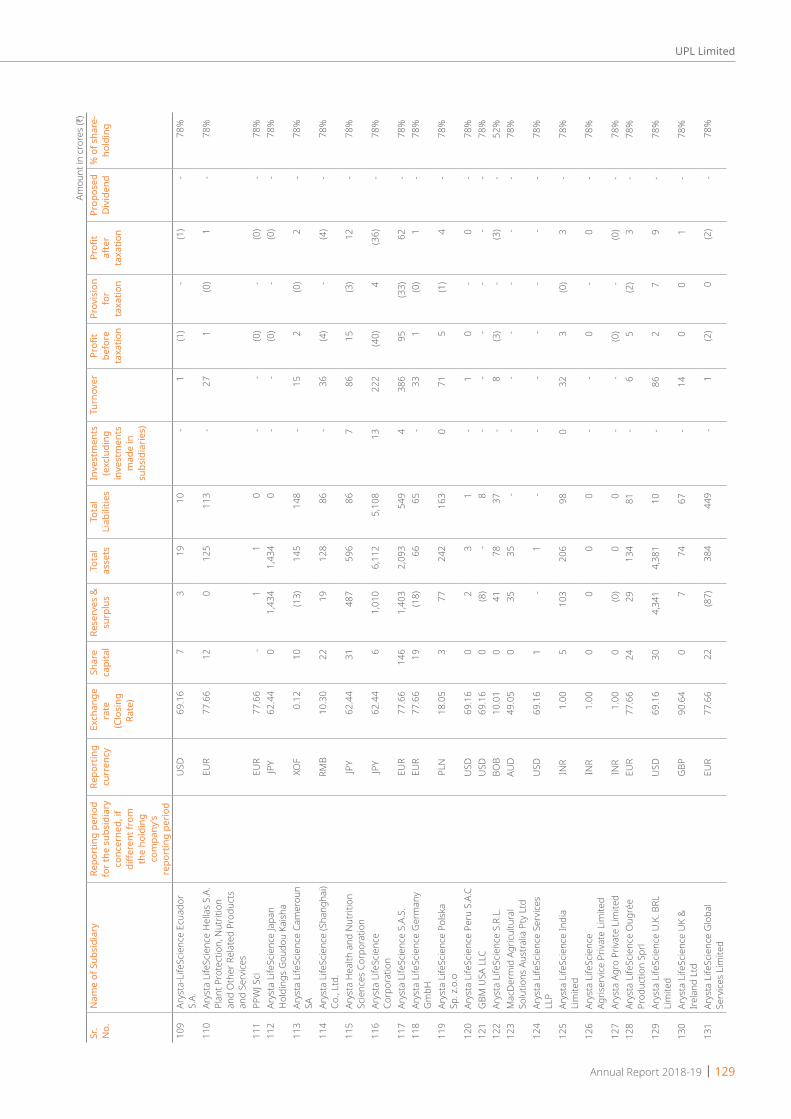
Amou
nt in
cro
res
(H)
Sr.
No.
Nam
e of
Sub
sidi
ary
Repo
rtin
g pe
riod
for t
he s
ubsi
diar
y co
ncer
ned,
if
diffe
rent
from
th
e ho
ldin
g co
mpa
ny’s
repo
rtin
g pe
riod
Repo
rtin
g cu
rren
cy E
xcha
nge
rate
(C
losi
ng
Rate
)
Shar
e ca
pita
l Re
serv
es &
su
rplu
sTo
tal
asse
tsTo
tal
Liab
ilitie
s In
vest
men
ts
(exc
ludi
ng
inve
stm
ents
m
ade
in
subs
idia
ries)
Turn
over
Profi
t be
fore
ta
xatio
n
Prov
isio
n fo
r ta
xatio
n
Profi
t af
ter
taxa
tion
Prop
osed
D
ivid
end
% o
f sha
re-
hold
ing
109
Arys
ta-L
ifeSc
ienc
e Ec
uado
r S.
A.U
SD 6
9.16
7
3
1
9 1
0 -
1
(1)
- (1
) -
78%
110
Arys
ta L
ifeSc
ienc
e H
ella
s S.
A.
Plan
t Pro
tect
ion,
Nut
ritio
n an
d O
ther
Rel
ated
Pro
duct
s an
d Se
rvice
s
EUR
77.
66
12
0
125
1
13
- 2
7 1
(0
) 1
-
78%
111
PPW
J Sci
EUR
77.
66
- 1
1
0
-
- (0
) -
(0)
- 78
%11
2Ar
ysta
Life
Scie
nce
Japa
n H
oldi
ngs
Gou
dou
Kaish
aJP
Y 6
2.44
0
1
,434
1
,434
0
-
- (0
) -
(0)
- 78
%
113
Arys
ta L
ifeSc
ienc
e Ca
mer
oun
SAXO
F 0
.12
10
(13)
145
1
48
- 1
5 2
(0
) 2
-
78%
114
Arys
ta L
ifeSc
ienc
e (S
hang
hai)
Co.,
Ltd.
RMB
10.
30
22
19
128
8
6 -
36
(4)
- (4
) -
78%
115
Arys
ta H
ealth
and
Nut
ritio
n Sc
ienc
es C
orpo
ratio
nJP
Y 6
2.44
3
1 4
87
596
8
6 7
8
6 1
5 (3
) 1
2 -
78%
116
Arys
ta L
ifeSc
ienc
e Co
rpor
atio
nJP
Y 6
2.44
6
1
,010
6
,112
5
,108
1
3 2
22
(40)
4
(36)
- 78
%
117
Arys
ta L
ifeSc
ienc
e S.
A.S.
EUR
77.
66
146
1
,403
2
,093
5
49
4
386
9
5 (3
3) 6
2 -
78%
118
Arys
ta L
ifeSc
ienc
e G
erm
any
Gm
bHEU
R 7
7.66
1
9 (1
8) 6
6 6
5 -
33
1
(0)
1
- 78
%
119
Arys
ta L
ifeSc
ienc
e Po
lska
Sp. z
.o.o
PLN
18.
05
3
77
242
1
63
0
71
5
(1)
4
- 78
%
120
Arys
ta L
ifeSc
ienc
e Pe
ru S
.A.C
USD
69.
16
0
2
3
1
- 1
0
-
0
- 78
%12
1G
BM U
SA L
LCU
SD 6
9.16
0
(8
) -
8
- -
- -
- -
78%
122
Arys
ta L
ifeSc
ienc
e S.
R.L.
BOB
10.
01
0
41
78
37
- 8
(3
) -
(3)
- 52
%12
3M
acDe
rmid
Agr
icultu
ral
Solu
tions
Aus
tralia
Pty
Ltd
AUD
49.
05
0
35
35
- -
- -
- -
- 78
%
124
Arys
ta L
ifeSc
ienc
e Se
rvice
s LL
PU
SD 6
9.16
1
-
1
- -
- -
- -
- 78
%
125
Arys
ta L
ifeSc
ienc
e In
dia
Lim
ited
INR
1.0
0 5
1
03
206
9
8 0
3
2 3
(0
) 3
-
78%
126
Arys
ta L
ifeSc
ienc
e Ag
riser
vice
Priva
te L
imite
dIN
R 1
.00
0
0
0
0
- -
0
- 0
-
78%
127
Arys
ta A
gro
Priva
te L
imite
d IN
R 1
.00
0
(0)
0
0
- -
(0)
- (0
) -
78%
128
Arys
ta L
ifeSc
ienc
e O
ugré
e Pr
oduc
tion
Sprl
EUR
77.
66
24
29
134
8
1 -
6
5
(2)
3
- 78
%
129
Arys
ta L
ifeSc
ienc
e U.
K. B
RL
Lim
ited
USD
69.
16
30
4,3
41
4,3
81
10
- 8
6 2
7
9
-
78%
130
Arys
ta L
ifeSc
ienc
e U
K &
Ire
land
Ltd
GBP
90.
64
0
7
74
67
- 1
4 0
0
1
-
78%
131
Arys
ta L
ifeSc
ienc
e G
loba
l Se
rvice
s Li
mite
dEU
R 7
7.66
2
2 (8
7) 3
84
449
-
1
(2)
0
(2)
- 78
%
Annual Report 2018-19 | 129
UPL Limited
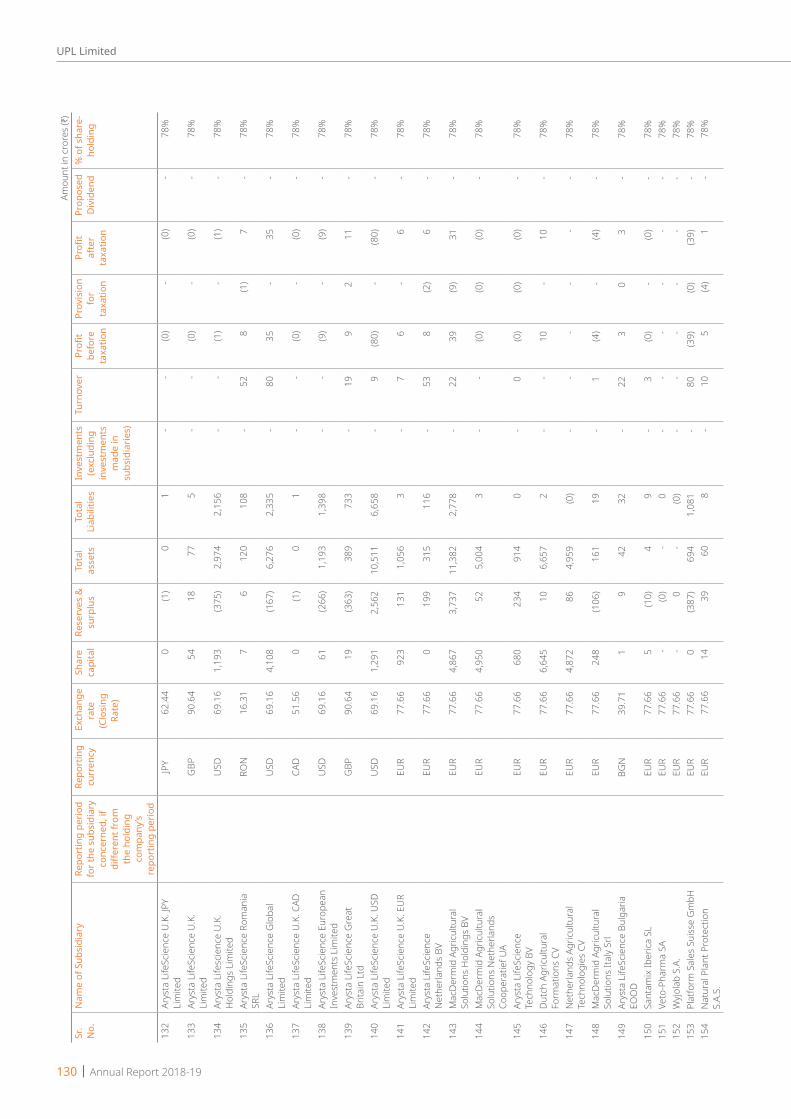
Amou
nt in
cro
res
(H)
Sr.
No.
Nam
e of
Sub
sidi
ary
Repo
rtin
g pe
riod
for t
he s
ubsi
diar
y co
ncer
ned,
if
diffe
rent
from
th
e ho
ldin
g co
mpa
ny’s
repo
rtin
g pe
riod
Repo
rtin
g cu
rren
cy E
xcha
nge
rate
(C
losi
ng
Rate
)
Shar
e ca
pita
l Re
serv
es &
su
rplu
sTo
tal
asse
tsTo
tal
Liab
ilitie
s In
vest
men
ts
(exc
ludi
ng
inve
stm
ents
m
ade
in
subs
idia
ries)
Turn
over
Profi
t be
fore
ta
xatio
n
Prov
isio
n fo
r ta
xatio
n
Profi
t af
ter
taxa
tion
Prop
osed
D
ivid
end
% o
f sha
re-
hold
ing
132
Arys
ta L
ifeSc
ienc
e U.
K. JP
Y Li
mite
dJP
Y 6
2.44
0
(1
) 0
1
-
- (0
) -
(0)
- 78
%
133
Arys
ta L
ifeSc
ienc
e U.
K.
Lim
ited
GBP
90.
64
54
18
77
5
- -
(0)
- (0
) -
78%
134
Arys
ta L
ifesc
ienc
e U.
K.
Hol
ding
s Li
mite
dU
SD 6
9.16
1
,193
(3
75)
2,9
74
2,1
56
- -
(1)
- (1
) -
78%
135
Arys
ta L
ifeSc
ienc
e Ro
man
ia
SRL
RON
16.
31
7
6
120
1
08
- 5
2 8
(1
) 7
-
78%
136
Arys
ta L
ifeSc
ienc
e G
loba
l Li
mite
dU
SD 6
9.16
4
,108
(1
67)
6,2
76
2,3
35
- 8
0 3
5 -
35
- 78
%
137
Arys
ta L
ifeSc
ienc
e U.
K. C
AD
Lim
ited
CAD
51.
56
0
(1)
0
1
- -
(0)
- (0
) -
78%
138
Arys
ta L
ifeSc
ienc
e Eu
rope
an
Inve
stm
ents
Lim
ited
USD
69.
16
61
(266
) 1
,193
1
,398
-
- (9
) -
(9)
- 78
%
139
Arys
ta L
ifeSc
ienc
e G
reat
Br
itain
Ltd
GBP
90.
64
19
(363
) 3
89
733
-
19
9
2
11
- 78
%
140
Arys
ta L
ifeSc
ienc
e U.
K. U
SD
Lim
ited
USD
69.
16
1,2
91
2,5
62
10,
511
6,6
58
- 9
(8
0) -
(80)
- 78
%
141
Arys
ta L
ifeSc
ienc
e U.
K. E
UR
Lim
ited
EUR
77.
66
923
1
31
1,0
56
3
- 7
6
-
6
- 78
%
142
Arys
ta L
ifeSc
ienc
e N
ethe
rland
s BV
EUR
77.
66
0
199
3
15
116
-
53
8
(2)
6
- 78
%
143
Mac
Derm
id A
gricu
ltura
l So
lutio
ns H
oldi
ngs
BVEU
R 7
7.66
4
,867
3
,737
1
1,38
2 2
,778
-
22
39
(9)
31
- 78
%
144
Mac
Derm
id A
gricu
ltura
l So
lutio
ns N
ethe
rland
s Co
oper
atie
f UA
EUR
77.
66
4,9
50
52
5,0
04
3
- -
(0)
(0)
(0)
- 78
%
145
Arys
ta L
ifeSc
ienc
e Te
chno
logy
BV
EUR
77.
66
680
2
34
914
0
-
0
(0)
(0)
(0)
- 78
%
146
Dutc
h Ag
ricul
tura
l Fo
rmat
ions
CV
EUR
77.
66
6,6
45
10
6,6
57
2
- -
10
- 1
0 -
78%
147
Net
herla
nds
Agric
ultu
ral
Tech
nolo
gies
CV
EUR
77.
66
4,8
72
86
4,9
59
(0)
- -
- -
- -
78%
148
Mac
Derm
id A
gricu
ltura
l So
lutio
ns It
aly
Srl
EUR
77.
66
248
(1
06)
161
1
9 -
1
(4)
- (4
) -
78%
149
Arys
ta L
ifeSc
ienc
e Bu
lgar
ia
EOO
DBG
N 3
9.71
1
9
4
2 3
2 -
22
3
0
3
- 78
%
150
Sant
amix
Iber
ica S
LEU
R 7
7.66
5
(1
0) 4
9
-
3
(0)
- (0
) -
78%
151
Veto
-Pha
rma
SAEU
R 7
7.66
-
(0)
- 0
-
- -
- -
- 78
%15
2W
yjola
b S.
A.EU
R 7
7.66
-
0
- (0
) -
- -
- -
- 78
%15
3Pl
atfo
rm S
ales
Sui
sse
Gm
bHEU
R 7
7.66
0
(3
87)
694
1
,081
-
80
(39)
(0)
(39)
- 78
%15
4N
atur
al P
lant
Pro
tect
ion
S.A.
S.EU
R 7
7.66
1
4 3
9 6
0 8
-
10
5
(4)
1
- 78
%
130 | Annual Report 2018-19
UPL Limited
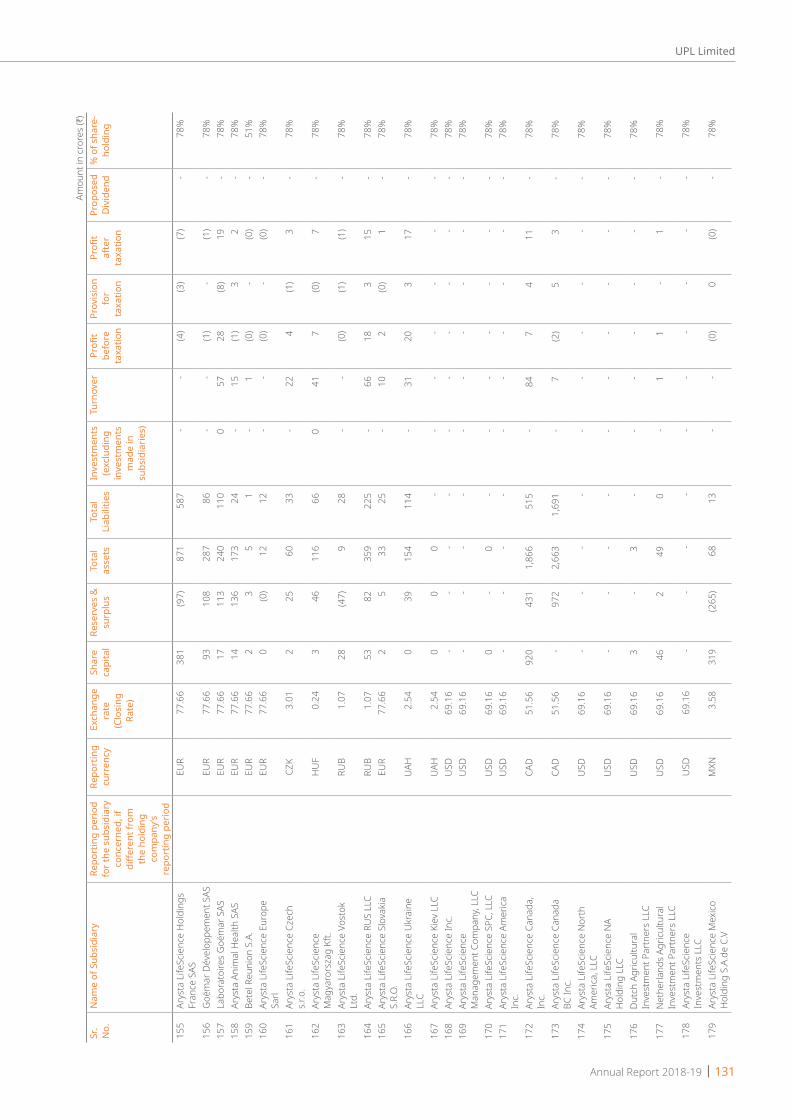
Amou
nt in
cro
res
(H)
Sr.
No.
Nam
e of
Sub
sidi
ary
Repo
rtin
g pe
riod
for t
he s
ubsi
diar
y co
ncer
ned,
if
diffe
rent
from
th
e ho
ldin
g co
mpa
ny’s
repo
rtin
g pe
riod
Repo
rtin
g cu
rren
cy E
xcha
nge
rate
(C
losi
ng
Rate
)
Shar
e ca
pita
l Re
serv
es &
su
rplu
sTo
tal
asse
tsTo
tal
Liab
ilitie
s In
vest
men
ts
(exc
ludi
ng
inve
stm
ents
m
ade
in
subs
idia
ries)
Turn
over
Profi
t be
fore
ta
xatio
n
Prov
isio
n fo
r ta
xatio
n
Profi
t af
ter
taxa
tion
Prop
osed
D
ivid
end
% o
f sha
re-
hold
ing
155
Arys
ta L
ifeSc
ienc
e H
oldi
ngs
Fran
ce S
ASEU
R 7
7.66
3
81
(97)
871
5
87
- -
(4)
(3)
(7)
- 78
%
156
Goë
mar
Dév
elop
pem
ent S
ASEU
R 7
7.66
9
3 1
08
287
8
6 -
- (1
) -
(1)
- 78
%15
7La
bora
toire
s G
oëm
ar S
ASEU
R 7
7.66
1
7 1
13
240
1
10
0
57
28
(8)
19
- 78
%15
8Ar
ysta
Ani
mal
Hea
lth S
ASEU
R 7
7.66
1
4 1
36
173
2
4 -
15
(1)
3
2
- 78
%15
9Be
tel R
euni
on S
.A.
EUR
77.
66
2
3
5
1
- 1
(0
) -
(0)
- 51
%16
0Ar
ysta
Life
Scie
nce
Euro
pe
Sarl
EUR
77.
66
0
(0)
12
12
- -
(0)
- (0
) -
78%
161
Arys
ta L
ifeSc
ienc
e Cz
ech
s.r.o
.CZ
K 3
.01
2
25
60
33
- 2
2 4
(1
) 3
-
78%
162
Arys
ta L
ifeSc
ienc
e M
agya
rors
zag
Kft.
HU
F 0
.24
3
46
116
6
6 0
4
1 7
(0
) 7
-
78%
163
Arys
ta L
ifeSc
ienc
e Vo
stok
Lt
d.RU
B 1
.07
28
(47)
9
28
- -
(0)
(1)
(1)
- 78
%
164
Arys
ta L
ifeSc
ienc
e RU
S LL
CRU
B 1
.07
53
82
359
2
25
- 6
6 1
8 3
1
5 -
78%
165
Arys
ta L
ifeSc
ienc
e Sl
ovak
ia
S.R.
O.
EUR
77.
66
2
5
33
25
- 1
0 2
(0
) 1
-
78%
166
Arys
ta L
ifeSc
ienc
e U
krai
ne
LLC
UAH
2.5
4 0
3
9 1
54
114
-
31
20
3
17
- 78
%
167
Arys
ta L
ifeSc
ienc
e Ki
ev L
LCUA
H 2
.54
0
0
0
- -
- -
- -
- 78
%16
8Ar
ysta
Life
Scie
nce
Inc.
USD
69.
16
- -
- -
- -
- -
- -
78%
169
Arys
ta L
ifeSc
ienc
e M
anag
emen
t Com
pany
, LLC
USD
69.
16
- -
- -
- -
- -
- -
78%
170
Arys
ta L
ifeSc
ienc
e SP
C, L
LCU
SD 6
9.16
0
-
0
- -
- -
- -
- 78
%17
1Ar
ysta
Life
Scie
nce
Amer
ica
Inc.
USD
69.
16
- -
- -
- -
- -
- -
78%
172
Arys
ta L
ifeSc
ienc
e Ca
nada
, In
c.CA
D 5
1.56
9
20
431
1
,866
5
15
- 8
4 7
4
1
1 -
78%
173
Arys
ta L
ifeSc
ienc
e Ca
nada
BC
Inc.
CAD
51.
56
- 9
72
2,6
63
1,6
91
- 7
(2
) 5
3
-
78%
174
Arys
ta L
ifeSc
ienc
e N
orth
Am
erica
, LLC
USD
69.
16
- -
- -
- -
- -
- -
78%
175
Arys
ta L
ifeSc
ienc
e N
A H
oldi
ng L
LCU
SD 6
9.16
-
- -
- -
- -
- -
- 78
%
176
Dutc
h Ag
ricul
tura
l In
vest
men
t Par
tner
s LL
CU
SD 6
9.16
3
-
3
- -
- -
- -
- 78
%
177
Net
herla
nds
Agric
ultu
ral
Inve
stm
ent P
artn
ers
LLC
USD
69.
16
46
2
49
0
- 1
1
-
1
- 78
%
178
Arys
ta L
ifeSc
ienc
e In
vest
men
ts L
LCU
SD 6
9.16
-
- -
- -
- -
- -
- 78
%
179
Arys
ta L
ifeSc
ienc
e M
exico
H
oldi
ng S
.A.d
e C.
VM
XN 3
.58
319
(2
65)
68
13
- -
(0)
0
(0)
- 78
%
Annual Report 2018-19 | 131
UPL Limited
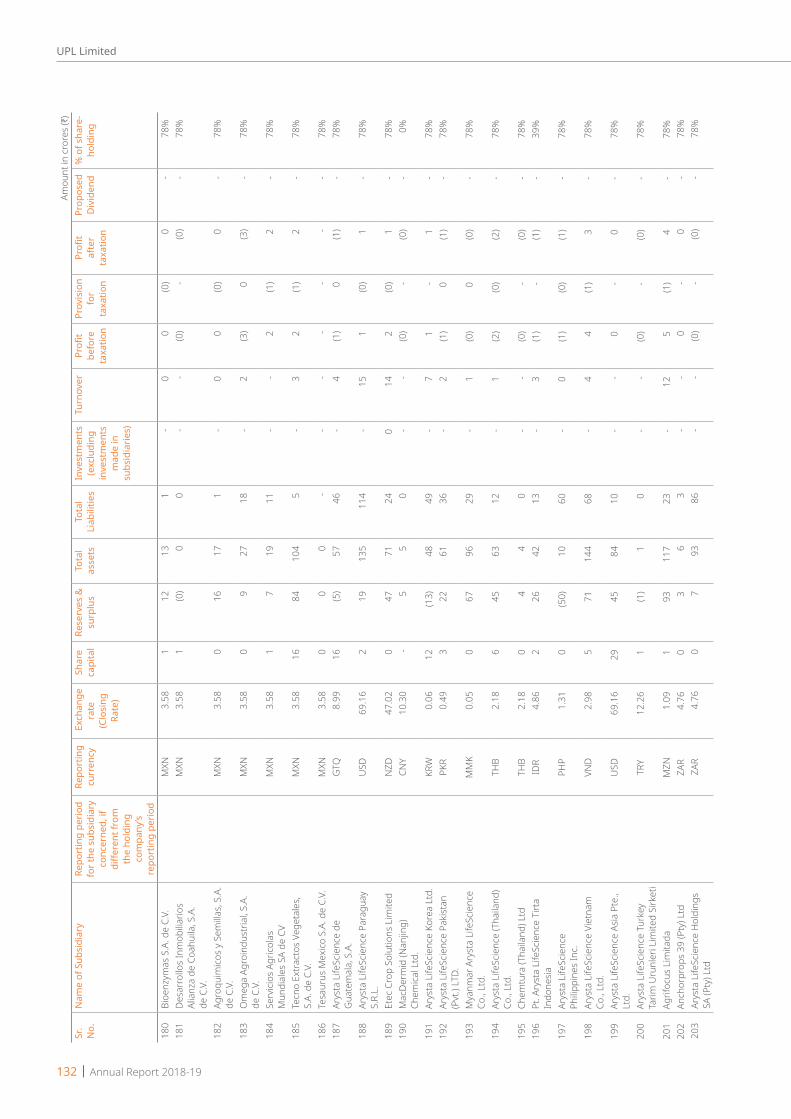
Amou
nt in
cro
res
(H)
Sr.
No.
Nam
e of
Sub
sidi
ary
Repo
rtin
g pe
riod
for t
he s
ubsi
diar
y co
ncer
ned,
if
diffe
rent
from
th
e ho
ldin
g co
mpa
ny’s
repo
rtin
g pe
riod
Repo
rtin
g cu
rren
cy E
xcha
nge
rate
(C
losi
ng
Rate
)
Shar
e ca
pita
l Re
serv
es &
su
rplu
sTo
tal
asse
tsTo
tal
Liab
ilitie
s In
vest
men
ts
(exc
ludi
ng
inve
stm
ents
m
ade
in
subs
idia
ries)
Turn
over
Profi
t be
fore
ta
xatio
n
Prov
isio
n fo
r ta
xatio
n
Profi
t af
ter
taxa
tion
Prop
osed
D
ivid
end
% o
f sha
re-
hold
ing
180
Bioe
nzym
as S
.A. d
e C.
V.M
XN 3
.58
1
12
13
1
- 0
0
(0
) 0
-
78%
181
Desa
rrol
los
Inm
obilia
rios
Alia
nza
de C
oahu
ila, S
.A.
de C
.V.
MXN
3.5
8 1
(0
) 0
0
-
- (0
) -
(0)
- 78
%
182
Agro
quim
icos
y Se
milla
s, S.
A.
de C
.V.
MXN
3.5
8 0
1
6 1
7 1
-
0
0
(0)
0
- 78
%
183
Om
ega
Agro
indu
stria
l, S.
A.
de C
.V.
MXN
3.5
8 0
9
2
7 1
8 -
2
(3)
0
(3)
- 78
%
184
Serv
icios
Agr
icola
s M
undi
ales
SA
de C
VM
XN 3
.58
1
7
19
11
- -
2
(1)
2
- 78
%
185
Tecn
o Ex
tract
os V
eget
ales
, S.
A. d
e C.
V.M
XN 3
.58
16
84
104
5
-
3
2
(1)
2
- 78
%
186
Tesa
urus
Mex
ico S
.A. d
e C.
V.M
XN 3
.58
0
0
0
- -
- -
- -
- 78
%18
7Ar
ysta
Life
Scie
nce
de
Gua
tem
ala,
S.A
.G
TQ 8
.99
16
(5)
57
46
- 4
(1
) 0
(1
) -
78%
188
Arys
ta L
ifeSc
ienc
e Pa
ragu
ay
S.R.
L.U
SD 6
9.16
2
1
9 1
35
114
-
15
1
(0)
1
- 78
%
189
Etec
Cro
p So
lutio
ns L
imite
dN
ZD 4
7.02
0
4
7 7
1 2
4 0
1
4 2
(0
) 1
-
78%
190
Mac
Derm
id (N
anjin
g)
Chem
ical L
td.
CNY
10.
30
- 5
5
0
-
- (0
) -
(0)
- 0%
191
Arys
ta L
ifeSc
ienc
e Ko
rea
Ltd.
KRW
0.0
6 1
2 (1
3) 4
8 4
9 -
7
1
- 1
-
78%
192
Arys
ta L
ifeSc
ienc
e Pa
kist
an
(Pvt
.) LT
D.PK
R 0
.49
3
22
61
36
- 2
(1
) 0
(1
) -
78%
193
Mya
nmar
Ary
sta
Life
Scie
nce
Co.,
Ltd.
MM
K 0
.05
0
67
96
29
- 1
(0
) 0
(0
) -
78%
194
Arys
ta L
ifeSc
ienc
e (T
haila
nd)
Co.,
Ltd.
THB
2.1
8 6
4
5 6
3 1
2 -
1
(2)
(0)
(2)
- 78
%
195
Chem
tura
(Tha
iland
) Ltd
THB
2.1
8 0
4
4
0
-
- (0
) -
(0)
- 78
%19
6Pt
. Ary
sta
Life
Scie
nce
Tirt
a In
done
siaID
R 4
.86
2
26
42
13
- 3
(1
) -
(1)
- 39
%
197
Arys
ta L
ifeSc
ienc
e Ph
ilippi
nes
Inc.
PHP
1.3
1 0
(5
0) 1
0 6
0 -
0
(1)
(0)
(1)
- 78
%
198
Arys
ta L
ifeSc
ienc
e Vi
etna
m
Co.,
Ltd.
VND
2.9
8 5
7
1 1
44
68
- 4
4
(1
) 3
-
78%
199
Arys
ta L
ifeSc
ienc
e As
ia P
te.,
Ltd.
USD
69.
16
29
45
84
10
- -
0
- 0
-
78%
200
Arys
ta L
ifeSc
ienc
e Tu
rkey
Ta
rim U
runl
eri L
imite
d Si
rket
iTR
Y 1
2.26
1
(1
) 1
0
-
- (0
) -
(0)
- 78
%
201
Agrif
ocus
Lim
itada
MZN
1.0
9 1
9
3 1
17
23
- 1
2 5
(1
) 4
-
78%
202
Anch
orpr
ops
39 (P
ty) L
tdZA
R 4
.76
0
3
6
3
- -
0
- 0
-
78%
203
Arys
ta L
ifeSc
ienc
e H
oldi
ngs
SA (P
ty) L
tdZA
R 4
.76
0
7
93
86
- -
(0)
- (0
) -
78%
132 | Annual Report 2018-19
UPL Limited

Amou
nt in
cro
res
(H)
Sr.
No.
Nam
e of
Sub
sidi
ary
Repo
rtin
g pe
riod
for t
he s
ubsi
diar
y co
ncer
ned,
if
diffe
rent
from
th
e ho
ldin
g co
mpa
ny’s
repo
rtin
g pe
riod
Repo
rtin
g cu
rren
cy E
xcha
nge
rate
(C
losi
ng
Rate
)
Shar
e ca
pita
l Re
serv
es &
su
rplu
sTo
tal
asse
tsTo
tal
Liab
ilitie
s In
vest
men
ts
(exc
ludi
ng
inve
stm
ents
m
ade
in
subs
idia
ries)
Turn
over
Profi
t be
fore
ta
xatio
n
Prov
isio
n fo
r ta
xatio
n
Profi
t af
ter
taxa
tion
Prop
osed
D
ivid
end
% o
f sha
re-
hold
ing
204
Callie
tha
Inve
stm
ents
(Pty
) Lt
dZA
R 4
.76
0
16
23
7
- -
- -
- -
78%
205
Volca
no A
gros
cienc
e (P
ty)
Ltd
ZAR
4.7
6 0
1
24
151
3
7 1
0 4
2 1
(1
) 1
-
78%
206
Volca
no C
hem
icals
(Pty
) Ltd
ZAR
4.7
6 0
0
0
-
- -
- -
- -
78%
207
Kem
pton
Che
mica
ls (P
ty) L
tdZA
R 4
.76
- -
- -
- -
- -
- -
78%
208
Side
wal
k Tr
adin
g (P
ty) L
tdZA
R 4
.76
0
(0)
0
0
- -
(0)
- (0
) -
78%
209
Arys
ta L
ifeSc
ienc
e Ke
nya
Ltd.
KES
0.6
9 0
6
5
3 4
7 -
12
2
(0)
1
- 78
%21
0Ar
ysta
Life
Scie
nce
Tanz
ania
Lt
dTZ
S 0
.03
0
(3)
15
17
- 2
(0
) (0
) (1
) -
78%
211
Arys
ta L
ifeSc
ienc
e Eg
ypt L
tdEG
P 3
.99
1
1
3
1
- 0
(0
) (0
) (0
) -
78%
212
Arys
ta L
ifeSc
ienc
e To
go S
AUXO
F 0
.12
5
(2)
4
2
- 0
(0
) (0
) (0
) -
78%
213
Calli
Gha
na L
td.
GH
S 1
2.93
1
(1
0) 2
3 3
3 -
3
(1)
- (1
) -
78%
214
Calliv
oire
SG
FD S
.A.
XOF
0.1
2 2
4
5 1
51
104
-
21
(2)
1
(1)
- 78
%21
5M
ali P
rote
ctio
n De
s Cu
lture
s (M
.P.C.
) SA
XOF
0.1
2 4
3
1
23
116
-
42
3
0
3
- 66
%
216
Agrip
har P
olan
d Sp
. Zoo
PLN
18.
05
0
(0)
- 0
-
- (0
) -
(0)
- 78
%21
7Ar
ysta
Life
Scie
nce
Switz
erla
nd S
arl
CHF
69.
44
0
0
0
0
- -
(0)
(0)
(0)
- 78
%
218
Arys
ta L
ifeSc
ienc
e Ce
ntro
Amer
ica, S
.A.
GTQ
8.9
9 0
-
0
- -
- -
- -
- 78
%
219
Arve
sta
Corp
orat
ion
USD
69.
16
- -
- -
- -
- -
- -
78%
220
Arys
ta L
ifeSc
ienc
e Re
gist
ratio
ns G
reat
Brit
ain
Ltd
GBP
90.
64
- -
- -
- -
- -
- -
78%
221
Agrip
har S
DN B
HD
MYR
16.
94
- -
- -
- -
- -
- -
78%
222
Agrip
har d
e Co
sta
Rica
SA
CRC
0.1
1 -
- -
- -
- -
- -
- 78
%22
3Ag
ripha
r de
Colo
mbi
a SA
SCO
P 2
1.78
-
- -
- -
- -
- -
- 78
%22
4In
dust
rias
Agrip
har S
AG
TQ 8
.99
- -
- -
- -
- -
- -
78%
225
Agrip
raza
Ltd
a.EU
R 7
7.66
-
- -
- -
- -
- -
- 78
%22
6Ar
ysta
Life
Scie
nce
Corp
orat
ion
Repu
blica
Do
min
icana
, SRL
USD
69.
16
- -
- -
- -
- -
- -
78%
227
Gru
po B
ioqu
imico
Mex
icano
Re
publ
ica D
omin
icana
SA
DOP
1.3
6 -
- -
- -
- -
- -
- 78
%
228
Arys
ta L
ifeSc
ienc
e Ec
uado
r S.
A.U
SD 6
9.16
-
- -
- -
- -
- -
- 78
%
229
Arve
sta
Para
guay
S.A
.U
SD 6
9.16
-
- -
- -
- -
- -
- 78
%23
0Ar
ysta
Agr
oqui
mico
s y
Fert
ilzan
tes
Uru
guay
SA
USD
69.
16
- -
- -
- -
- -
- -
78%
231
Arys
ta L
ifeSc
ienc
e U.
K. U
SD-
2 Li
mite
dG
BP 9
0.64
-
- -
- -
- -
- -
- 78
%
Annual Report 2018-19 | 133
UPL Limited
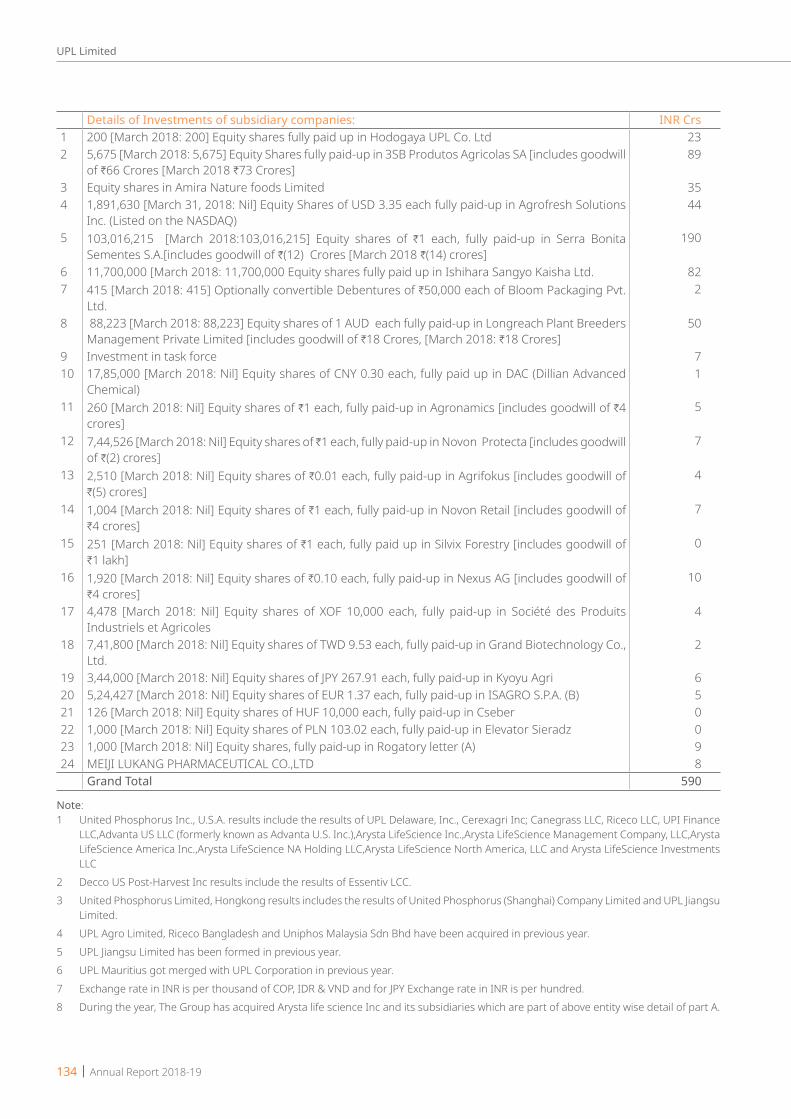
Details of Investments of subsidiary companies: INR Crs1 200 [March 2018: 200] Equity shares fully paid up in Hodogaya UPL Co. Ltd 23 2 5,675 [March 2018: 5,675] Equity Shares fully paid-up in 3SB Produtos Agricolas SA [includes goodwill
of H66 Crores [March 2018 H73 Crores] 89
3 Equity shares in Amira Nature foods Limited 35 4 1,891,630 [March 31, 2018: Nil] Equity Shares of USD 3.35 each fully paid-up in Agrofresh Solutions
Inc. (Listed on the NASDAQ) 44
5 103,016,215 [March 2018:103,016,215] Equity shares of H1 each, fully paid-up in Serra Bonita Sementes S.A.[includes goodwill of H(12) Crores [March 2018 H(14) crores]
190
6 11,700,000 [March 2018: 11,700,000 Equity shares fully paid up in Ishihara Sangyo Kaisha Ltd. 827 415 [March 2018: 415] Optionally convertible Debentures of H50,000 each of Bloom Packaging Pvt.
Ltd.2
8 88,223 [March 2018: 88,223] Equity shares of 1 AUD each fully paid-up in Longreach Plant Breeders Management Private Limited [includes goodwill of H18 Crores, [March 2018: H18 Crores]
50
9 Investment in task force 7 10 17,85,000 [March 2018: Nil] Equity shares of CNY 0.30 each, fully paid up in DAC (Dillian Advanced
Chemical) 1
11 260 [March 2018: Nil] Equity shares of H1 each, fully paid-up in Agronamics [includes goodwill of H4 crores]
5
12 7,44,526 [March 2018: Nil] Equity shares of H1 each, fully paid-up in Novon Protecta [includes goodwill of H(2) crores]
7
13 2,510 [March 2018: Nil] Equity shares of H0.01 each, fully paid-up in Agrifokus [includes goodwill of H(5) crores]
4
14 1,004 [March 2018: Nil] Equity shares of H1 each, fully paid-up in Novon Retail [includes goodwill of H4 crores]
7
15 251 [March 2018: Nil] Equity shares of H1 each, fully paid up in Silvix Forestry [includes goodwill of H1 lakh]
0
16 1,920 [March 2018: Nil] Equity shares of H0.10 each, fully paid-up in Nexus AG [includes goodwill of H4 crores]
10
17 4,478 [March 2018: Nil] Equity shares of XOF 10,000 each, fully paid-up in Société des Produits Industriels et Agricoles
4
18 7,41,800 [March 2018: Nil] Equity shares of TWD 9.53 each, fully paid-up in Grand Biotechnology Co., Ltd.
2
19 3,44,000 [March 2018: Nil] Equity shares of JPY 267.91 each, fully paid-up in Kyoyu Agri 6 20 5,24,427 [March 2018: Nil] Equity shares of EUR 1.37 each, fully paid-up in ISAGRO S.P.A. (B) 5 21 126 [March 2018: Nil] Equity shares of HUF 10,000 each, fully paid-up in Cseber 0 22 1,000 [March 2018: Nil] Equity shares of PLN 103.02 each, fully paid-up in Elevator Sieradz 0 23 1,000 [March 2018: Nil] Equity shares, fully paid-up in Rogatory letter (A) 9 24 MEIJI LUKANG PHARMACEUTICAL CO.,LTD 8
Grand Total 590
Note:1 United Phosphorus Inc., U.S.A. results include the results of UPL Delaware, Inc., Cerexagri Inc; Canegrass LLC, Riceco LLC, UPI Finance
LLC,Advanta US LLC (formerly known as Advanta U.S. Inc.),Arysta LifeScience Inc.,Arysta LifeScience Management Company, LLC,Arysta LifeScience America Inc.,Arysta LifeScience NA Holding LLC,Arysta LifeScience North America, LLC and Arysta LifeScience Investments LLC
2 Decco US Post-Harvest Inc results include the results of Essentiv LCC.3 United Phosphorus Limited, Hongkong results includes the results of United Phosphorus (Shanghai) Company Limited and UPL Jiangsu
Limited.4 UPL Agro Limited, Riceco Bangladesh and Uniphos Malaysia Sdn Bhd have been acquired in previous year.5 UPL Jiangsu Limited has been formed in previous year.6 UPL Mauritius got merged with UPL Corporation in previous year.7 Exchange rate in INR is per thousand of COP, IDR & VND and for JPY Exchange rate in INR is per hundred.8 During the year, The Group has acquired Arysta life science Inc and its subsidiaries which are part of above entity wise detail of part A.
134 | Annual Report 2018-19
UPL Limited
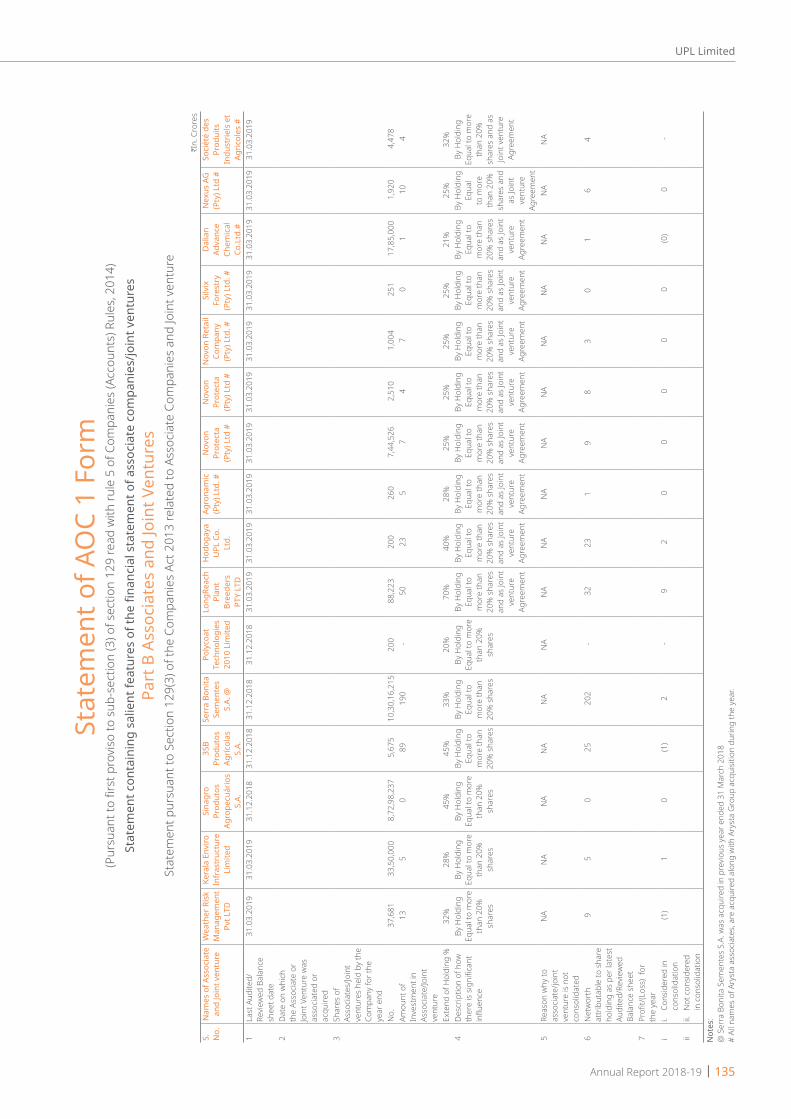
Stat
emen
t of A
OC
1 Fo
rm
(Pur
suan
t to
first
pro
viso
to s
ub-s
ectio
n (3
) of s
ectio
n 12
9 re
ad w
ith ru
le 5
of C
ompa
nies
(Acc
ount
s) R
ules
, 201
4)
Stat
emen
t con
tain
ing
salie
nt fe
atur
es o
f the
fina
ncia
l sta
tem
ent o
f ass
ocia
te c
ompa
nies
/join
t ven
ture
s
Part
B A
ssoc
iate
s an
d Jo
int V
entu
res
St
atem
ent p
ursu
ant t
o Se
ctio
n 12
9(3)
of t
he C
ompa
nies
Act
201
3 re
late
d to
Ass
ocia
te C
ompa
nies
and
Join
t ven
ture
HIn
. Cro
res
S. No.
Nam
es o
f Ass
ocia
te
and
Join
t ven
ture
Wea
ther
Ris
k M
anag
emen
t Pv
t LTD
Kera
la E
nviro
In
fras
truc
ture
Li
mite
d
Sina
gro
Prod
utos
Ag
rope
cuár
ios
S.A.
3SB
Prod
utos
Ag
rícol
as
S.A.
Serr
a Bo
nita
Se
men
tes
S.A.
@
Poly
coat
Te
chno
logi
es
2010
Lim
ited
Long
Reac
h Pl
ant
Bree
ders
PT
Y LT
D
Hod
ogay
a U
PL C
o.
Ltd.
Agro
nam
ic
(Pty
) Ltd
. #N
ovon
Pr
otec
ta
(Pty
) Ltd
#
Nov
on
Prot
ecta
(P
ty) L
td #
Nov
on R
etai
l Co
mpa
ny
(Pty
) Ltd
. #
Silv
ix
Fore
stry
(P
ty) L
td. #
Dal
ian
Adva
nce
Chem
ical
Co
.Ltd
.#
Nex
us A
G
(Pty
) Ltd
#So
ciét
é de
s Pr
odui
ts
Indu
strie
ls e
t Ag
ricol
es #
1La
st A
udite
d/Re
view
ed B
alan
ce
shee
t dat
e
31.0
3.20
1931
.03.
2019
31.1
2.20
1831
.12.
2018
31.1
2.20
1831
.12.
2018
31.0
3.20
1931
.03.
2019
31.0
3.20
1931
.03.
2019
31.0
3.20
1931
.03.
2019
31.0
3.20
1931
.03.
2019
31.0
3.20
1931
.03.
2019
2Da
te o
n w
hich
th
e As
socia
te o
r Jo
int V
entu
re w
as
asso
ciate
d or
ac
quire
d3
Shar
es o
f As
socia
tes/
Join
t ve
ntur
es h
eld
by th
e Co
mpa
ny fo
r the
ye
ar e
ndN
o. 3
7,68
1 3
3,50
,000
8
,72,
98,2
37
5,6
75
10,
30,1
6,21
5 20
0 8
8,22
3 2
00
260
7
,44,
526
2,5
10
1,0
04
251
1
7,85
,000
1
,920
4
,478
Am
ount
of
Inve
stm
ent i
n As
socia
te/Jo
int
vent
ure
13
5
0
89
190
-
5
0 2
3 5
7
4
7
0
1
1
0 4
Exte
nd o
f Hol
ding
%32
%28
%45
%45
%33
%20
%70
%40
%28
%25
%25
%25
%25
%21
%25
%32
%4
Desc
riptio
n of
how
th
ere
is sig
nific
ant
influ
ence
By H
oldi
ng
Equa
l to
mor
e th
an 2
0%
shar
es
By H
oldi
ng
Equa
l to
mor
e th
an 2
0%
shar
es
By H
oldi
ng
Equa
l to
mor
e th
an 2
0%
shar
es
By H
oldi
ng
Equa
l to
mor
e th
an
20%
sha
res
By H
oldi
ng
Equa
l to
mor
e th
an
20%
sha
res
By H
oldi
ng
Equa
l to
mor
e th
an 2
0%
shar
es
By H
oldi
ng
Equa
l to
mor
e th
an
20%
sha
res
and
as Jo
int
vent
ure
Agre
emen
t
By H
oldi
ng
Equa
l to
mor
e th
an
20%
sha
res
and
as Jo
int
vent
ure
Agre
emen
t
By H
oldi
ng
Equa
l to
mor
e th
an
20%
sha
res
and
as Jo
int
vent
ure
Agre
emen
t
By H
oldi
ng
Equa
l to
mor
e th
an
20%
sha
res
and
as Jo
int
vent
ure
Agre
emen
t
By H
oldi
ng
Equa
l to
mor
e th
an
20%
sha
res
and
as Jo
int
vent
ure
Agre
emen
t
By H
oldi
ng
Equa
l to
mor
e th
an
20%
sha
res
and
as Jo
int
vent
ure
Agre
emen
t
By H
oldi
ng
Equa
l to
mor
e th
an
20%
sha
res
and
as Jo
int
vent
ure
Agre
emen
t
By H
oldi
ng
Equa
l to
mor
e th
an
20%
sha
res
and
as Jo
int
vent
ure
Agre
emen
t
By H
oldi
ng
Equa
l to
mor
e th
an 2
0%
shar
es a
nd
as Jo
int
vent
ure
Agre
emen
t
By H
oldi
ng
Equa
l to
mor
e th
an 2
0%
shar
es a
nd a
s Jo
int v
entu
re
Agre
emen
t
5Re
ason
why
to
asso
ciate
/join
t ve
ntur
e is
not
cons
olid
ated
NA
NA
NA
NA
NA
NA
NA
NA
NA
NA
NA
NA
NA
NA
NA
NA
6N
etw
orth
at
trib
utab
le to
sha
re
hold
ing
as p
er la
test
Au
dite
d/Re
view
ed
Bala
nce
shee
t
9
5
0
25
202
-
3
2 23
19
83
01
64
7Pr
ofit/(
Loss
) fo
r th
e ye
ari
i. Co
nsid
ered
in
cons
olid
atio
n (1
) 1
0
(1
) 2
-
9
2
0
0
0
0
0
(0
) 0
-
iiii.
Not
con
sider
ed
in c
onso
lidat
ion
Not
es:
@ S
erra
Bon
ita S
emen
tes
S.A.
was
acq
uire
d in
pre
vious
yea
r end
ed 3
1 M
arch
201
8 #
All n
ames
of A
ryst
a as
socia
tes,
are
acqu
ired
alon
g w
ith A
ryst
a G
roup
acq
uisit
ion
durin
g th
e ye
ar.
Annual Report 2018-19 | 135
UPL Limited
136 | Annual Report 2018-19
UPL Limited
Independent Auditors’ Report
To the members of UPL limited
Report on the Audit of the Standalone Financial Statements OpinionWe have audited the standalone financial statements of UPL Limited (“the Company”), which comprise the standalone balance sheet as at 31 March 2019, and the standalone statement of profit and loss (including other comprehensive income), standalone statement of changes in equity and standalone statement of cash flows for the year then ended, and notes to the standalone financial statements, including a summary of the significant accounting policies and other explanatory information.
In our opinion and to the best of our information and according to the explanations given to us, the aforesaid standalone financial statements give the information required by the Companies Act, 2013 (“the Act”) in the manner so required and give a true and fair view in conformity with the accounting principles generally accepted in India, of the state of affairs of the Company as at 31 March 2019, and profit and other comprehensive income, changes in equity and its cash flows for the year ended on that date.
Basis for OpinionWe conducted our audit in accordance with the Standards on Auditing (SAs) specified under section 143(10) of the Act. Our responsibilities under those SAs are further described in the Auditor’s Responsibilities for the Audit of the Standalone Financial Statements section of our report. We are independent of the Company in accordance with the Code of Ethics issued by the Institute of Chartered Accountants of India together with the ethical requirements
that are relevant to our audit of the standalone financial statements under the provisions of the Act and the Rules thereunder, and we have fulfilled our other ethical responsibilities in accordance with these requirements and the Code of Ethics. We believe that the audit evidence we have obtained is sufficient and appropriate to provide a basis for our opinion.
Emphasis of matterWe draw attention to Note 45 of the standalone financial statements, relating to the accounting treatment of goodwill aggregating Rs. 3,697 crores arising on amalgamation of erstwhile Advanta limited with the Company accounted during the year ended 31 March 2017 and amortization of the said goodwill arising therefrom both of which are different from the treatment prescribed under Indian Accounting Standard (Ind AS) 103 - ‘Business Combinations ‘ for business combination of entities under common control. Had the accounting treatment prescribed under Ind AS 103 been followed, profit after tax reported for the year ended 31 March 2019 would have been higher by Rs. 370 crores. Our opinion is not modified in respect of this matter.
Key audit matters are those matters that, in our professional judgment, were of most significance in our audit of the standalone financial statements of the current period. These matters were addressed in the context of our audit of the standalone financial statements as a whole, and in forming our opinion thereon, and we do not provide a separate opinion on these matters.
The key audit matter How the matter was addressed in our audit
Revenue recognition and rebates accrual(Refer note 2.2(b) to accounting policies.)a) Revenue recognition The timing of revenue recognition is relevant to the
reported performance of the Company.
b) Rebates accrual The Company provides rebates and has arrangements
with various customers. Some of these arrangements involve estimation when determining the amount of liability to be recognised as at the year end.
Our focus was on assessing if the rebates and related provisions made were based on relevant agreements and Company policies and approvals
a) Revenue recognition We tested the accuracy of revenue cut off around
the year end. Our work comprised the agreement of sales transactions to supporting documentation and performing analytical procedures across various sales categories.
b) Rebates accrual We have reviewed business processes and tested the
design and implementation of controls surrounding the rebate expense accrual provision. We also compared year end customer rebate accruals and rebate costs in the year, to prior year amounts and analysed the rebate trend. We have also verified the appropriateness of rebate provision calculations by agreeing amounts recognised to terms of agreements, approvals and other supporting workings.

Annual Report 2018-19 | 137
UPL Limited
Other InformationThe Company’s management and Board of Directors are responsible for the other information. The other information comprises the information included in the Company’s annual report, but does not include the financial statements and our auditors’ report thereon.
Our opinion on the standalone financial statements does not cover the other information and we do not express any form of assurance conclusion thereon.
In connection with our audit of the standalone financial statements, our responsibility is to read the other information and, in doing so, consider whether the other information is materially inconsistent with the standalone financial statements or our knowledge obtained in the audit or otherwise appears to be materially misstated. If, based on the work we have performed, we conclude that there is a material misstatement of this other information, we are required to report that fact. We have nothing to report in this regard.
Management’s Responsibility for the Standalone Financial StatementsThe Company’s management and Board of Directors are responsible for the matters stated in Section 134(5) of the Act with respect to the preparation of these standalone financial statements that give a true and fair view of the state of affairs, profit/loss and other comprehensive income, changes in equity and cash flows of the Company in accordance with the accounting principles generally accepted in India, including the Indian Accounting Standards (Ind AS) specified under section 133 of the Act. This responsibility also includes maintenance of adequate accounting records in accordance with the provisions of
the Act for safeguarding the assets of the Company and for preventing and detecting frauds and other irregularities; selection and application of appropriate accounting policies; making judgments and estimates that are reasonable and prudent; and design, implementation and maintenance of adequate internal financial controls that were operating effectively for ensuring the accuracy and completeness of the accounting records, relevant to the preparation and presentation of the standalone financial statements that give a true and fair view and are free from material misstatement, whether due to fraud or error.
In preparing the standalone financial statements, management and Board of directors are responsible for assessing the Company’s ability to continue as a going concern, disclosing, as applicable, matters related to going concern and using the going concern basis of accounting unless management either intends to liquidate the Company or to cease operations, or has no realistic alternative but to do so.
Board of Directors is also responsible for overseeing the Company’s financial reporting process.
Auditors’ Responsibilities for the Audit of the Standalone Financial StatementsOur objectives are to obtain reasonable assurance about whether the standalone financial statements as a whole are free from material misstatement, whether due to fraud or error, and to issue an auditor’s report that includes our opinion. Reasonable assurance is a high level of assurance, but is not a guarantee that an audit conducted in accordance with SAs will always detect a material misstatement when it exists. Misstatements can arise from fraud or error and are considered material if, individually or in the aggregate, they
The key audit matter How the matter was addressed in our audit
Inventory valuation(Refer note 2.2(i) to accounting policies.)
We identified valuation of inventories as a key audit matter because the Company held significant inventories at the reporting date and because of the significant degree of management judgment involved in evaluating slow- moving, obsolete inventory and the net realizable value of such inventories.
We obtained the inventory ageing report and understood with management their procedures to identify slow moving and obsolete inventories.
We analysed the ageing profile of inventories to identify slow and obsolete inventories.
We tested the standard cost assessment and year-end adjustment to actual cost by performing walkthroughs of the costing exercise and testing the actual costs of production for a representative sample of products.
We assessed the adequacy of the allowance for obsolete inventories by checking, on a sample basis, whether inventory items were categorized appropriately in the relevant ageing bracket and assessed the reasonableness of the allowance percentages applied.
We also inquired for any obsolete or slow-moving inventories identified during our inventory count observation and also separately performed net realisable value testing on selected inventory items to check that inventories are carried at the lower of cost and net realisable value.
138 | Annual Report 2018-19
UPL Limited
could reasonably be expected to influence the economic decisions of users taken on the basis of these standalone financial statements.
As part of an audit in accordance with SAs, we exercise professional judgment and maintain professional skepticism throughout the audit. We also:
• Identify and assess the risks of material misstatement of the standalone financial statements, whether due to fraud or error, design and perform audit procedures responsive to those risks, and obtain audit evidence that is sufficient and appropriate to provide a basis for our opinion. The risk of not detecting a material misstatement resulting from fraud is higher than for one resulting from error, as fraud may involve collusion, forgery, intentional omissions, misrepresentations, or the override of internal control.
• Obtain an understanding of internal control relevant to the audit in order to design audit procedures that are appropriate in the circumstances. Under section 143(3)(i) of the Act, we are also responsible for expressing our opinion on whether the Company has adequate internal financial controls with reference to financial statements in place and the operating effectiveness of such controls.
• Evaluate the appropriateness of accounting policies used and the reasonableness of accounting estimates and related disclosures made by management.
• Conclude on the appropriateness of management’s use of the going concern basis of accounting and, based on the audit evidence obtained, whether a material uncertainty exists related to events or conditions that may cast significant doubt on the Company’s ability to continue as a going concern. If we conclude that a material uncertainty exists, we are required to draw attention in our auditor’s report to the related disclosures in the standalone financial statements or, if such disclosures are inadequate, to modify our opinion. Our conclusions are based on the audit evidence obtained up to the date of our auditor’s report. However, future events or conditions may cause the Company to cease to continue as a going concern.
• Evaluate the overall presentation, structure and content of the standalone financial statements, including the disclosures, and whether the standalone financial statements represent the underlying transactions and events in a manner that achieves fair presentation.
We communicate with those charged with governance regarding, among other matters, the planned scope and timing of the audit and significant audit findings, including any significant deficiencies in internal control that we identify during our audit.
We also provide those charged with governance with a statement that we have complied with relevant ethical requirements regarding independence, and to communicate
with them all relationships and other matters that may reasonably be thought to bear on our independence, and where applicable, related safeguards.
From the matters communicated with those charged with governance, we determine those matters that were of most significance in the audit of the standalone financial statements of the current period and are therefore the key audit matters. We describe these matters in our auditors’ report unless law or regulation precludes public disclosure about the matter or when, in extremely rare circumstances, we determine that a matter should not be communicated in our report because the adverse consequences of doing so would reasonably be expected to outweigh the public interest benefits of such communication.
1. As required by the Companies (Auditor’s Report) Order, 2016 (‘the Order’), issued by the Central Government of India in terms of Section 143(11) of the Act, we give in the “Annexure A”, a statement on the matters specified in the paragraphs 3 and 4 of the Order, to the extent applicable.
(A) As required by Section 143(3) of the Act, we report that:
(a) We have sought and obtained all the information and explanations which to the best of our knowledge and belief were necessary for the purposes of our audit;
(b) In our opinion, proper books of account as required by law have been kept by the Company so far as it appears from our examination of those books;
(c) The standalone balance sheet, the statement of profit and loss (including other comprehensive income), the standalone statement of cash flows and the standalone statement of changes in equity dealt with by this Report are in agreement with the books of account;
(d) In our opinion, the aforesaid standalone financial statements comply with the Ind AS specified under section 133 of the Act;
(e) On the basis of the written representations received from the directors as on 31 March 2019 taken on record by the Board of Directors, none of the directors is disqualified as on 31 March 2019 from being appointed as a director in terms of Section 164(2) of the Act;
(f) With respect to the adequacy of the internal financial controls with reference to financial statements of the Company and the operating effectiveness of such controls, refer to our separate Report in “Annexure B”.
(B) With respect to the other matters to be included in the Auditor’s Report in accordance with Rule 11 of the Companies (Audit and Auditors) Rules, 2014, in

Annual Report 2018-19 | 139
UPL Limited
our opinion and to the best of our information and according to the explanations given to us:
(a) The Company has disclosed the impact of pending litigations as at 31 March 2019 on its financial position in its standalone financial statements; - Refer Note 35(c) to the standalone financial statements;
(b) The Company did not have any long-term contracts including derivative contracts as at the year end for which there were any material foreseeable losses;
(c) There has been no delay in transferring amounts, required to be transferred, to the Investor Education and Protection Fund by the Company;
(d) The disclosures in the standalone financial statements regarding holdings as well as dealings in specified bank notes during the period from 8 November 2016 to 30 December 2016 have not been made in these financial statements since they do not pertain to the financial year ended 31 March 2019.
(C) With respect to the matter to be included in the Auditors’ Report under section 197(16):
In our opinion and according to the information and explanations given to us, the remuneration paid by the Company to its directors during the current year is in accordance with the provisions of Section 197 of the Act. The remuneration paid to any director is not in excess of the limit laid down under Section 197 of the Act. The Ministry of Corporate Affairs has not prescribed other details under Section 197(16) which are required to be commented upon by us
For B S R & Co. LLPChartered Accountants
Firm’s Registration No: 101248W/W-100022
Bhavesh DhupeliaPlace: Mumbai PartnerDate: 17 May 2019 Membership No: 042070

140 | Annual Report 2018-19
UPL Limited
Annexure A to the Independent Auditors’ Report - 31 March 2019(Referred to in our report of even date)
(i) (a) The Company has maintained proper records showing full particulars, including quantitative details and situation of fixed assets.
(b) The Company has a regular programme of physical verification of its fixed assets by which all fixed assets are verified in a phased manner over a period of three years. In our opinion, this periodicity of physical verification is reasonable having regard to the size of the Company and the nature of its assets. Pursuant to the programme, certain fixed assets were physically verified by the management during the year. In our opinion, and according to the information and explanations given to us, no material discrepancies were noticed on such verification
(c) In our opinion and according to the information and explanations given to us by the management and on the basis of an examination of the records of the Company, the title deeds of the immovable properties as disclosed in Note 3 of the standalone financial statements are held in the name of the Company, except in the case of leasehold land, freehold land and buildings with a carrying value of Rs. 11 crores, Rs. 2 crores and Rs.47 lakhs (Gross block of Rs. 11 crores, Rs. 2 crores and Rs.1 crore) as at 31 March 2019 respectively, wherein as explained to us, the Company is not able to reconcile with fixed assets register with the title deeds and hence we are unable to comment on the same
(ii) The inventory, except goods in transit and stocks lying with third parties, has been physically verified by the management at reasonable intervals during the year. In our opinion, the frequency of such verification is reasonable. For stocks lying with third parties at the year- end, written confirmations have been obtained by management and in respect of goods-in- transit, subsequent goods receipts have been verified or confirmations have been obtained from the parties. The discrepancies noticed on verification between the physical stocks and the book records were not material and have been dealt with in the books of account
(iii) The Company has granted unsecured loan to two companies covered in the register maintained under Section 189 of the Act.
(a) In respect of the aforesaid loans, the terms and conditions under which such loans were granted are not prejudicial to the Company’s interest.
(b) One of the aforesaid loans along with interest thereon has been fully repaid during the year. In respect of another loan, which is repayable on demand, we are informed that the amount of
interest and principal demanded by the company has been fully paid during the year and thus, there has been no default on the part of parties to whom the money has been lent.
(c) There are no amounts overdue for more than ninety days at the balance sheet date in respect of the aforesaid loan
(iv) In our opinion and according to the information and explanation given to us, the Company has complied with provisions of Section 185 and 186 of the Act in respect of loans granted, investments made and providing guarantees, as applicable.
(v) In our opinion, and according to the information and explanations given to us, the Company has not accepted any deposits under Sections 73 to 76 or any other relevant provisions of the Act and the rules framed thereunder. Accordingly, para 3(v) of the Order is not applicable to the Company.
(vi) We have broadly reviewed the books of account maintained by the Company as specified under Section 148(1) of the Act, for maintenance of cost records in respect of the products manufactured by the Company, and are of the opinion that prima facie, the prescribed accounts and records have been made and maintained. However, we have not made a detailed examination of cost records with a view to determine whether they are accurate or complete.
(vii) (a) According to the information and explanations given to us and on the basis of our examination of the records of the Company, amounts deducted/accrued in the books of account in respect of undisputed statutory dues including Provident Fund, Employees’ State Insurance, Income-tax, Goods and Service tax, Duty of Customs and other material statutory dues have generally been regularly deposited during the year by the Company with the appropriate authorities though there has been slight delay in a few cases except for the provident fund dues as referred to in Note 35(d) of financial statements.
(b) According to the information and explanations given to us, no undisputed amounts payable in respect of Provident Fund, Employees’ State Insurance, Income-tax, Goods and Service Tax, Duty of customs and other material statutory dues were in arrears as at 31 March 2019 for a period of more than six months from the date they became payable. Also, refer note 35 (d) to the standalone the financial statements. Refer Note 35(d) of financial statements.

Annual Report 2018-19 | 141
UPL Limited
(c) According to the information and explanations given to us and based on our examination of the records of the Company, there are no dues of Income-tax, Sales Tax, Service tax, Duty of customs, Goods and service tax, duty of excise and value added tax as at 31 March 2019, which have not been deposited with the appropriate authorities on account of any dispute, except as stated below
Nature of the Statute
Nature of dues
Amount (in
Crores)
Amount paid under
protest (in Crores)
Period to which amounts relates
Forum where dispute is pending
Income tax Act, 1961
Income tax demands
5 - AY*1995-96 to AY 1997-98, AY 2008-09 to AY 2010-11 and AY 2015-16
Supereme Court, High Court, Commisioner Income-tax and Income- tax Appellate Tribunal
Sales tax Act Sales tax demands
22 9 FY 1985-86, 1995-96, 2005-06 to 2007-08, 2011-12, to 2014-15
Supreme Court, Jt Commissioner of Sales tax, Sales tax Tribunal
Central Excise/Finance Act
Excise duty/Service tax demands
68 1 FY 1989-90, 1994-2004 and 2007-2015
Commissioner (Appeals) Central Excise and Service tax Appellate Tribunal
Custom Act Custom duty demands
34 - FY 1992 to 1997, 2000, 2001 and 2004
Commissioner (Appeals) Central Excise and Service tax Appellate Tribunal
Foreign Trade (Development and regulation) Act
Fiscal Penalty
33 - FY 1992 to 1997 Bombay High Court
* AY – Assessment year, FY – Financial year
(viii) In our opinion and according to the information and explanations given to us, the Company has not defaulted in repayment of loans or borrowings from financial institution, bank or dues to debenture holders. The Company did not have any loans or borrowings from the government during the year.
(ix) According to the information and explanations given to us, the Company did not raise money by way of initial public offer or further public offer (including debt instruments) and term loans during the year. Accordingly, para 3(ix) of the Order is not applicable to the Company.
(x) To the best of our knowledge and according to the information and explanations given to us, no fraud by the Company or fraud on the Company by its officers or employees has been noticed or reported during the year nor have we been informed of such case by the management.
(xi) According to the information and explanations given to us, the managerial remuneration has been paid/provided in accordance with the requisite approvals mandated by the provisions of Section 197 read with Schedule V to the Act.
(xii) According to the information and explanations given to us, the Company is not a Nidhi company as prescribed under Section 406 of the Act. Accordingly, para 3(xii) of the Order is not applicable to the Company.
(xiii) According to the information and explanations given to us, all transactions with the related parties are in compliance with provisions of Section 177 and 188 of
the Act, where applicable and the details have been disclosed in the standalone Ind AS financial statements as required by the applicable Indian accounting standards.
(xiv) According to the information and explanations given to us and based on our examination of the records of the Company, no preferential allotment or private placement of shares or fully or partly convertible debentures was made during the year. Accordingly, para 3(xiv) of the Order is not applicable to the Company.
(xv) According to the information and explanations given to us and based on our examination of the records of the Company, the Company has not entered into any non-cash transactions with directors or persons connected with them. Accordingly, para 3(xv) of the Order is not applicable to the Company.
(xvi) According to the information and explanations given to us, the Company is not required to be registered under Section 45-IA of the Reserve Bank of India Act, 1934. Accordingly, reporting under the clause 3(xvi) of the Order is not applicable to the Company
For B S R & Co. LLPChartered Accountants
Firm’s Registration No: 101248W/W-100022
Bhavesh DhupeliaPlace: Mumbai PartnerDate: 17 May 2019 Membership No: 042070

142 | Annual Report 2018-19
UPL Limited
Annexure B to the Independent Auditors’ Report - 31 March 2019 Report on the internal financial controls with reference to the aforesaid standalone financial statements under Clause (i) of sub-section 3 of Section 143 of the Companies Act, 2013
(Referred to in paragraph 1(f) under ‘Report on Other Legal and Regulatory Requirements’ section of our report of even date)
OpinionWe have audited the internal financial controls with reference to the standalone financial statements of UPL Limited (“the Company”) as of 31 March 2019 in conjunction with our audit of the standalone financial statements of the Company for the year ended on that date.
In our opinion, the Company has, in all material respects, adequate internal financial controls with reference to financial statements and such internal financial controls were operating effectively as at 31 March 2019, based on the internal financial controls with reference to financial statements criteria established by the Company considering the essential components of internal control stated in the Guidance Note on Audit of Internal Financial Controls Over Financial Reporting issued by the Institute of Chartered Accountants of India (the “Guidance Note”).
Management’s Responsibility for Internal Financial ControlsThe Company’s management and the Board of Directors are responsible for establishing and maintaining internal financial controls based on the internal financial controls with reference to financial statements criteria established by the Company considering the essential components of internal control stated in the Guidance Note. These responsibilities include the design, implementation and maintenance of adequate internal financial controls that were operating effectively for ensuring the orderly and efficient conduct of its business, including adherence to Company’s policies, the safeguarding of its assets, the prevention and detection of frauds and errors, the accuracy and completeness of the accounting records, and the timely preparation of reliable financial information, as required under the Companies Act, 2013 (hereinafter referred to as “the Act”).
Auditors’ ResponsibilityOur responsibility is to express an opinion on the Company’s internal financial controls with reference to financial statements based on our audit. We conducted our audit in accordance with the Guidance Note and the Standards on Auditing, prescribed under section 143(10) of the Act, to the extent applicable to an audit of internal financial controls with reference to financial statements. Those Standards and the Guidance Note require that we comply with ethical requirements and plan and perform the audit to obtain reasonable assurance about whether adequate internal financial controls with reference to financial statements were established and maintained and whether such controls operated effectively in all material respects.
Our audit involves performing procedures to obtain audit evidence about the adequacy of the internal financial controls with reference to financial statements and their operating effectiveness. Our audit of internal financial controls with reference to financial statements included obtaining an understanding of such internal financial controls, assessing the risk that a material weakness exists, and testing and evaluating the design and operating effectiveness of internal control based on the assessed risk. The procedures selected depend on the auditor’s judgement, including the assessment of the risks of material misstatement of the standalone financial statements, whether due to fraud or error.
Auditors’ Responsibility (Continued)We believe that the audit evidence we have obtained is sufficient and appropriate to provide a basis for our audit opinion on the Company’s internal financial controls with reference to financial statements.
Annual Report 2018-19 | 143
UPL Limited
Meaning of Internal Financial Controls with reference to financial statements.A company’s internal financial controls with reference to financial statements is a process designed to provide reasonable assurance regarding the reliability of financial reporting and the preparation of financial statements for external purposes in accordance with generally accepted accounting principles. A company’s internal financial controls with reference to financial statements include those policies and procedures that (1) pertain to the maintenance of records that, in reasonable detail, accurately and fairly reflect the transactions and dispositions of the assets of the company; (2) provide reasonable assurance that transactions are recorded as necessary to permit preparation of financial statements in accordance with generally accepted accounting principles, and that receipts and expenditures of the company are being made only in accordance with authorisations of management and directors of the company; and (3) provide reasonable assurance regarding prevention or timely detection of unauthorised acquisition, use, or disposition of the company’s assets that could have a material effect on the financial statements.
Inherent Limitations of Internal Financial Controls with reference to financial statements.Because of the inherent limitations of internal financial controls with reference to financial statements, including the possibility of collusion or improper management override of controls, material misstatements due to error or fraud may occur and not be detected. Also, projections of any evaluation of the internal financial controls with reference to financial statements to future periods are subject to the risk that the internal financial controls with reference to financial statements may become inadequate because of changes in conditions, or that the degree of compliance with the policies or procedures may deteriorate.
For B S R & Co. LLPChartered Accountants
Firm’s Registration No: 101248W/W-100022
Bhavesh DhupeliaPlace: Mumbai PartnerDate: 17 May 2019 Membership No: 042070
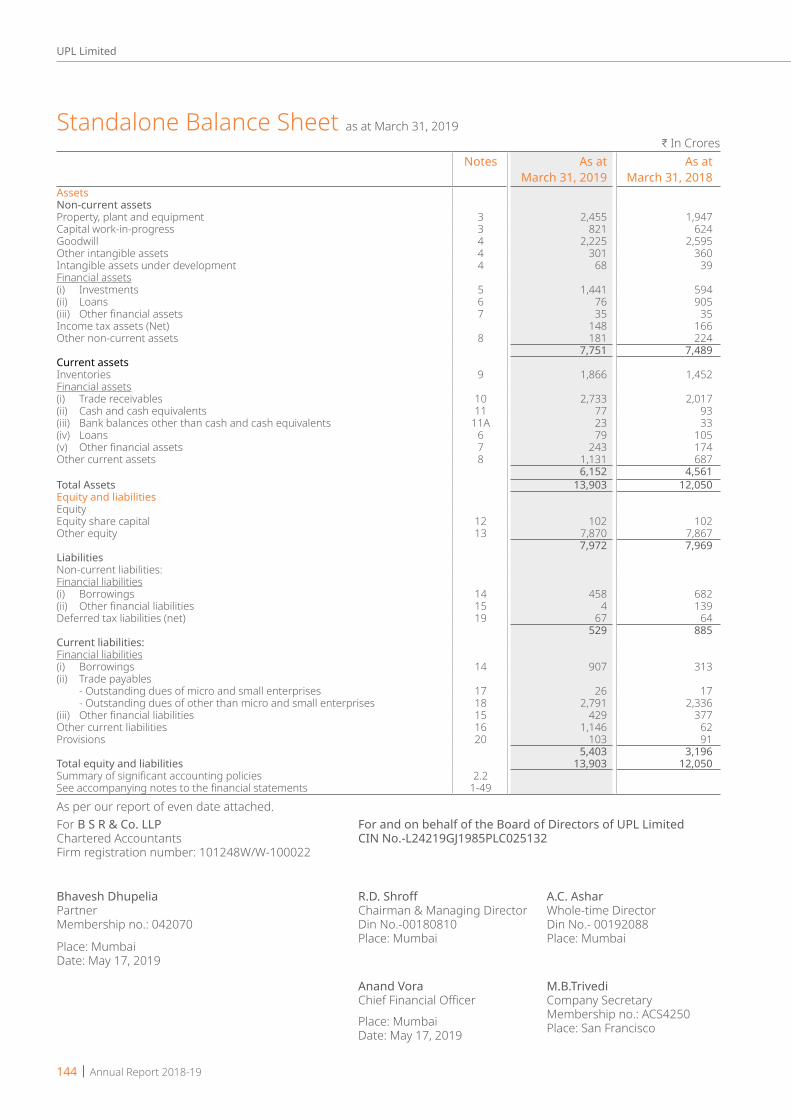
144 | Annual Report 2018-19
UPL Limited
Standalone Balance Sheet as at March 31, 2019H In Crores
Notes As atMarch 31, 2019
As atMarch 31, 2018
AssetsNon-current assetsProperty, plant and equipment 3 2,455 1,947Capital work-in-progress 3 821 624Goodwill 4 2,225 2,595Other intangible assets 4 301 360Intangible assets under development 4 68 39Financial assets(i) Investments 5 1,441 594(ii) Loans 6 76 905(iii) Other financial assets 7 35 35Income tax assets (Net) 148 166Other non-current assets 8 181 224
7,751 7,489Current assetsInventories 9 1,866 1,452Financial assets(i) Trade receivables 10 2,733 2,017(ii) Cash and cash equivalents 11 77 93(iii) Bank balances other than cash and cash equivalents 11A 23 33(iv) Loans 6 79 105(v) Other financial assets 7 243 174Other current assets 8 1,131 687
6,152 4,561Total Assets 13,903 12,050Equity and liabilitiesEquityEquity share capital 12 102 102Other equity 13 7,870 7,867
7,972 7,969LiabilitiesNon-current liabilities:Financial liabilities(i) Borrowings 14 458 682(ii) Other financial liabilities 15 4 139Deferred tax liabilities (net) 19 67 64
529 885Current liabilities:Financial liabilities(i) Borrowings 14 907 313(ii) Trade payables - Outstanding dues of micro and small enterprises 17 26 17 - Outstanding dues of other than micro and small enterprises 18 2,791 2,336(iii) Other financial liabilities 15 429 377Other current liabilities 16 1,146 62Provisions 20 103 91
5,403 3,196Total equity and liabilities 13,903 12,050Summary of significant accounting policies 2.2See accompanying notes to the financial statements 1-49
As per our report of even date attached.For B S R & Co. LLP For and on behalf of the Board of Directors of UPL LimitedChartered Accountants CIN No.-L24219GJ1985PLC025132Firm registration number: 101248W/W-100022
Bhavesh Dhupelia R.D. Shroff A.C. AsharPartner Chairman & Managing Director Whole-time DirectorMembership no.: 042070 Din No.-00180810 Din No.- 00192088 Place: Mumbai Place: Mumbai
Anand Vora M.B.Trivedi Chief Financial Officer Company Secretary Membership no.: ACS4250 Place: Mumbai Place: San Francisco Date: May 17, 2019
Place: MumbaiDate: May 17, 2019
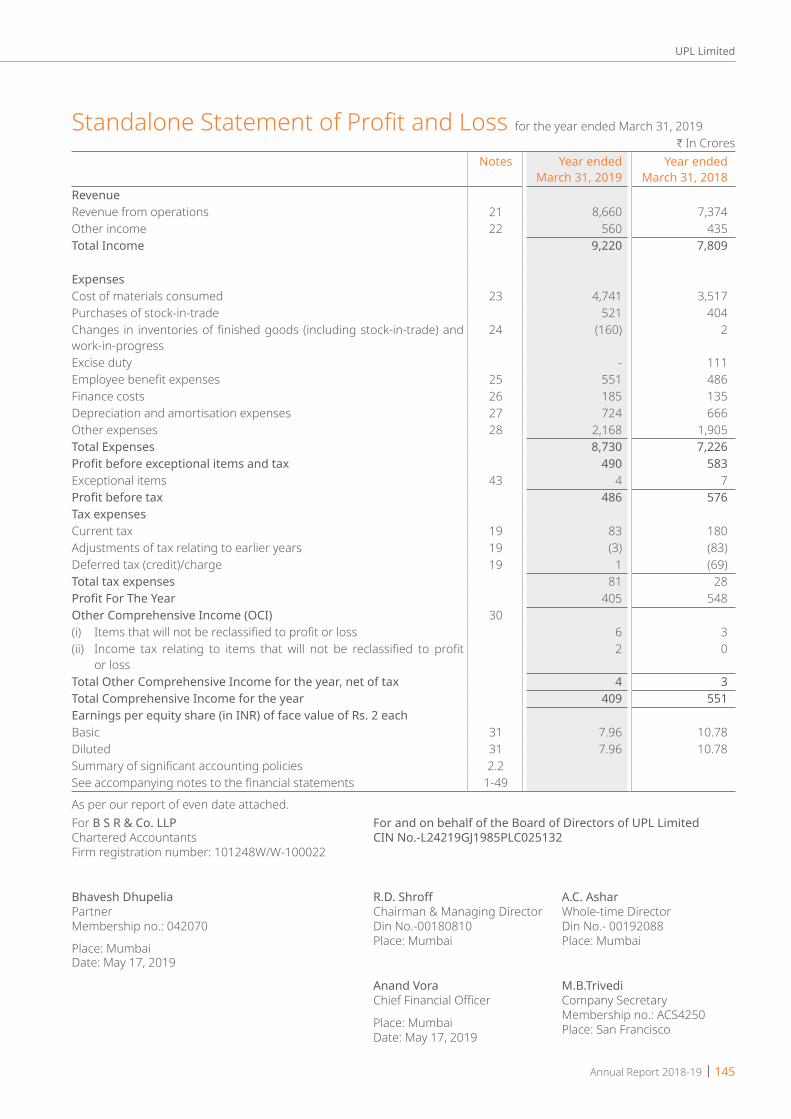
Annual Report 2018-19 | 145
UPL Limited
Standalone Statement of Profit and Loss for the year ended March 31, 2019H In Crores
Notes Year ended March 31, 2019
Year ended March 31, 2018
RevenueRevenue from operations 21 8,660 7,374Other income 22 560 435Total Income 9,220 7,809
ExpensesCost of materials consumed 23 4,741 3,517Purchases of stock-in-trade 521 404Changes in inventories of finished goods (including stock-in-trade) and work-in-progress
24 (160) 2
Excise duty - 111Employee benefit expenses 25 551 486Finance costs 26 185 135Depreciation and amortisation expenses 27 724 666Other expenses 28 2,168 1,905Total Expenses 8,730 7,226Profit before exceptional items and tax 490 583Exceptional items 43 4 7Profit before tax 486 576Tax expensesCurrent tax 19 83 180Adjustments of tax relating to earlier years 19 (3) (83)Deferred tax (credit)/charge 19 1 (69)Total tax expenses 81 28Profit For The Year 405 548Other Comprehensive Income (OCI) 30(i) Items that will not be reclassified to profit or loss 6 3(ii) Income tax relating to items that will not be reclassified to profit
or loss2 0
Total Other Comprehensive Income for the year, net of tax 4 3Total Comprehensive Income for the year 409 551Earnings per equity share (in INR) of face value of Rs. 2 eachBasic 31 7.96 10.78Diluted 31 7.96 10.78Summary of significant accounting policies 2.2See accompanying notes to the financial statements 1-49
As per our report of even date attached.For B S R & Co. LLP For and on behalf of the Board of Directors of UPL LimitedChartered Accountants CIN No.-L24219GJ1985PLC025132Firm registration number: 101248W/W-100022
Bhavesh Dhupelia R.D. Shroff A.C. AsharPartner Chairman & Managing Director Whole-time DirectorMembership no.: 042070 Din No.-00180810 Din No.- 00192088 Place: Mumbai Place: Mumbai
Anand Vora M.B.Trivedi Chief Financial Officer Company Secretary Membership no.: ACS4250 Place: Mumbai Place: San Francisco Date: May 17, 2019
Place: MumbaiDate: May 17, 2019

146 | Annual Report 2018-19
UPL Limited
Standalone Statement of Cash Flows for the year ended March 31, 2019
Year ended March 31, 2019
Year ended March 31, 2018
Cash flow from operating activitiesProfit before exceptional items and tax 490 583Adjustments forDepreciation of property, plant and equipment 284 226Amortization of intangible assets 440 440Assets written off 5 9Interest Income (65) (69)Profit on sale of assets (net) (0) -Profit on sale of Investment (46) -Fair value gain/(loss) on financial instruments at fair value through profit or loss (7) 7Dividend Income on Long-term investments in Subsidiary (412) (356)Share in profit from investment in United Phosphorus (India) LLP (19) (6)Allowances for doubtful debts and advances (net) 31 8Finance costs 185 135Unrealised exchange difference (net) (6) 1Liabilities / provisions no longer required written back (net) (12) (45)Working capital adjustments(Increase)/decrease in trade receivables (791) (51)(Increase)/decrease in inventories (414) (97)(Increase)/decrease in non-current and current financial assets (2) 2(Increase)/decrease in other non-current and current assets (445) (299)Increase/(decrease) in other non-current and current trade payables 472 151Increase/(decrease) in other non-current and current financial liabilities (58) 1Increase/(decrease)in other current liabilities 1,084 (32)Increase/(decrease) in provisions and Net employee defined benefit liabilities 17 11
730 619Income tax paid (including TDS) (net) (62) (115)Cash Flow Before Exceptional items 639 504Exceptional Items (4) (7)Net cash flows from / (used in) operating activities 635 497Cash flow from investing activitiesPurchase of property, plant and equipment (including CWIP) (987) (741)Purchase of intangible assets (including CWIP) (40) (28)Proceeds from sale of property, plant and equipment 0 -Profit on sale of Mutual funds 2 -Proceeds from redemption of preference shares of subsidiary 254 -Purchase of non current investments (1,029) -Dividend on investments 412 356Interest received 82 50Sundry loans - Given - (12)Sundry loans - Repayment received 5 9Fixed deposits and margin money (net) 10 (21)Advances and loans to subsidiaries - Given (77) (102)Advances and loans to subsidiaries - Repayment received 929 184Net cash flows from / (used in) investing activities (439) (305)
H In Crores
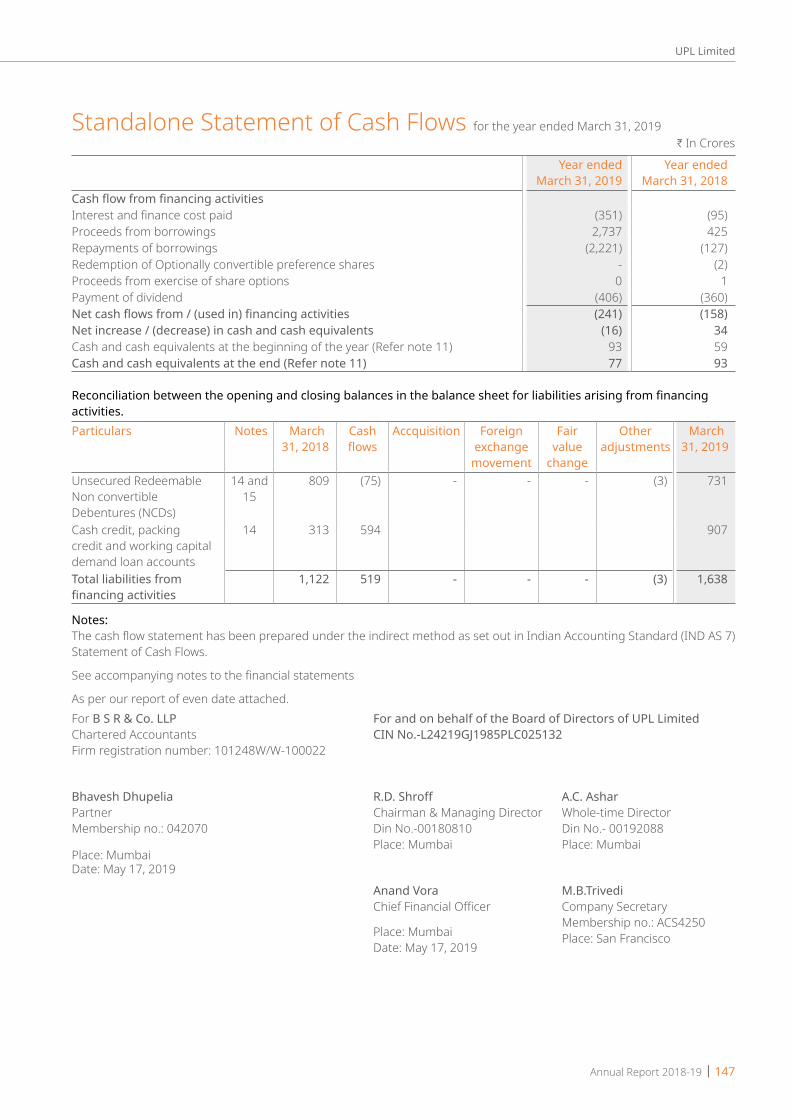
Annual Report 2018-19 | 147
UPL Limited
Standalone Statement of Cash Flows for the year ended March 31, 2019H In Crores
Year ended March 31, 2019
Year ended March 31, 2018
Cash flow from financing activitiesInterest and finance cost paid (351) (95)Proceeds from borrowings 2,737 425Repayments of borrowings (2,221) (127)Redemption of Optionally convertible preference shares - (2)Proceeds from exercise of share options 0 1Payment of dividend (406) (360)Net cash flows from / (used in) financing activities (241) (158)Net increase / (decrease) in cash and cash equivalents (16) 34Cash and cash equivalents at the beginning of the year (Refer note 11) 93 59Cash and cash equivalents at the end (Refer note 11) 77 93
Reconciliation between the opening and closing balances in the balance sheet for liabilities arising from financing activities.Particulars Notes March
31, 2018 Cash flows
Accquisition Foreign exchange
movement
Fair value
change
Other adjustments
March 31, 2019
Unsecured Redeemable Non convertible Debentures (NCDs)
14 and 15
809 (75) - - - (3) 731
Cash credit, packing credit and working capital demand loan accounts
14 313 594 907
Total liabilities from financing activities
1,122 519 - - - (3) 1,638
Notes:The cash flow statement has been prepared under the indirect method as set out in Indian Accounting Standard (IND AS 7) Statement of Cash Flows.
See accompanying notes to the financial statements
As per our report of even date attached.For B S R & Co. LLP For and on behalf of the Board of Directors of UPL LimitedChartered Accountants CIN No.-L24219GJ1985PLC025132Firm registration number: 101248W/W-100022
Bhavesh Dhupelia R.D. Shroff A.C. AsharPartner Chairman & Managing Director Whole-time DirectorMembership no.: 042070 Din No.-00180810 Din No.- 00192088 Place: Mumbai Place: Mumbai
Anand Vora M.B.Trivedi Chief Financial Officer Company Secretary Membership no.: ACS4250 Place: Mumbai Place: San Francisco Date: May 17, 2019
Place: MumbaiDate: May 17, 2019
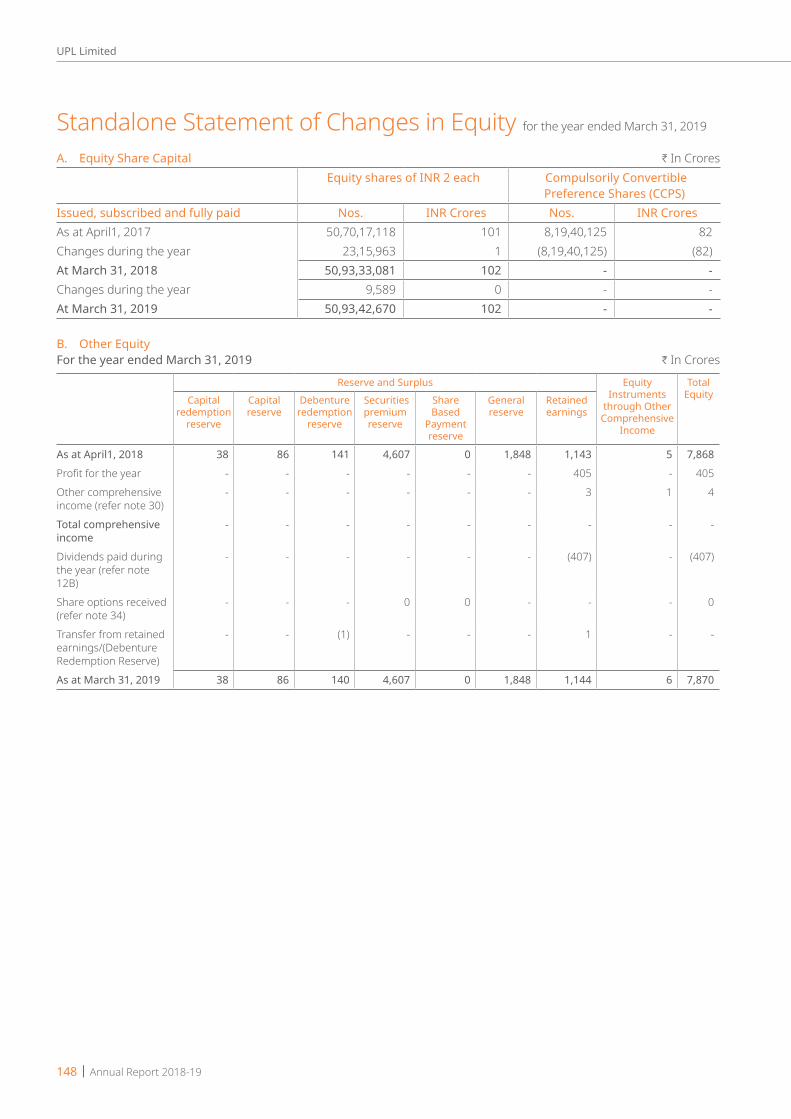
148 | Annual Report 2018-19
UPL Limited
Standalone Statement of Changes in Equity for the year ended March 31, 2019
A. Equity Share Capital H In CroresEquity shares of INR 2 each Compulsorily Convertible
Preference Shares (CCPS) Issued, subscribed and fully paid Nos. INR Crores Nos. INR CroresAs at April1, 2017 50,70,17,118 101 8,19,40,125 82 Changes during the year 23,15,963 1 (8,19,40,125) (82)At March 31, 2018 50,93,33,081 102 - - Changes during the year 9,589 0 - - At March 31, 2019 50,93,42,670 102 - -
B. Other EquityFor the year ended March 31, 2019 H In Crores
Reserve and Surplus Equity Instruments
through Other Comprehensive
Income
Total EquityCapital
redemption reserve
Capital reserve
Debenture redemption
reserve
Securities premium reserve
Share Based
Payment reserve
General reserve
Retained earnings
As at April1, 2018 38 86 141 4,607 0 1,848 1,143 5 7,868 Profit for the year - - - - - - 405 - 405 Other comprehensive income (refer note 30)
- - - - - - 3 1 4
Total comprehensive income
- - - - - - - - -
Dividends paid during the year (refer note 12B)
- - - - - - (407) - (407)
Share options received (refer note 34)
- - - 0 0 - - - 0
Transfer from retained earnings/(Debenture Redemption Reserve)
- - (1) - - - 1 - -
As at March 31, 2019 38 86 140 4,607 0 1,848 1,144 6 7,870
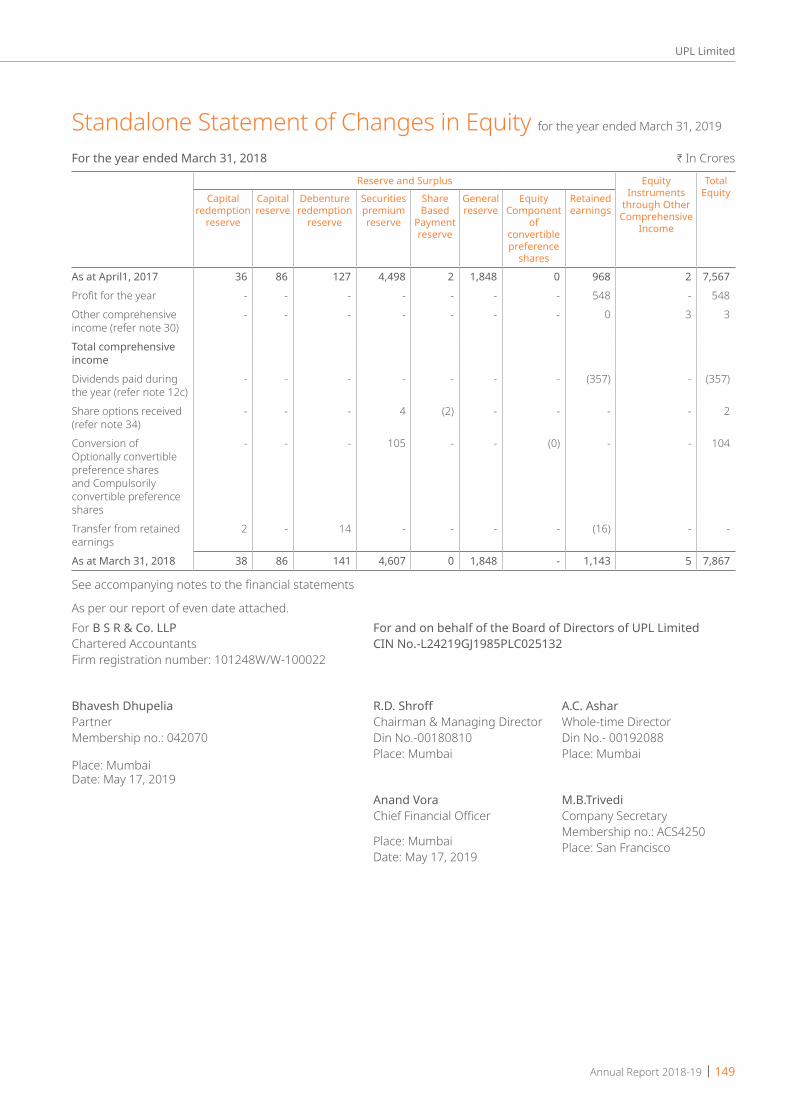
Annual Report 2018-19 | 149
UPL Limited
Standalone Statement of Changes in Equity for the year ended March 31, 2019
For the year ended March 31, 2018 H In Crores
Reserve and Surplus Equity Instruments
through Other Comprehensive
Income
Total EquityCapital
redemption reserve
Capital reserve
Debenture redemption
reserve
Securities premium reserve
Share Based
Payment reserve
General reserve
Equity Component
of convertible preference
shares
Retained earnings
As at April1, 2017 36 86 127 4,498 2 1,848 0 968 2 7,567Profit for the year - - - - - - - 548 - 548Other comprehensive income (refer note 30)
- - - - - - - 0 3 3
Total comprehensive incomeDividends paid during the year (refer note 12c)
- - - - - - - (357) - (357)
Share options received (refer note 34)
- - - 4 (2) - - - - 2
Conversion of Optionally convertible preference shares and Compulsorily convertible preference shares
- - - 105 - - (0) - - 104
Transfer from retained earnings
2 - 14 - - - - (16) - -
As at March 31, 2018 38 86 141 4,607 0 1,848 - 1,143 5 7,867
See accompanying notes to the financial statements
As per our report of even date attached.For B S R & Co. LLP For and on behalf of the Board of Directors of UPL LimitedChartered Accountants CIN No.-L24219GJ1985PLC025132Firm registration number: 101248W/W-100022
Bhavesh Dhupelia R.D. Shroff A.C. AsharPartner Chairman & Managing Director Whole-time DirectorMembership no.: 042070 Din No.-00180810 Din No.- 00192088 Place: Mumbai Place: Mumbai
Anand Vora M.B.Trivedi Chief Financial Officer Company Secretary Membership no.: ACS4250 Place: Mumbai Place: San Francisco Date: May 17, 2019
Place: MumbaiDate: May 17, 2019
150 | Annual Report 2018-19
UPL Limited
Notes to Standalone Financial Statements for the year ended March 31, 2019
1. Corporate Information UPL Limited (the Company) is a public company domiciled in India and is incorporated under the provisions of the
companies act applicable in India. Its shares are listed on two recognised stock exchanges in India. The registered office of the company is located at 3-11, G.I.D.C., Vapi, Dist- Valsad, Gujarat.
The Company is principally engaged in the business of agrochemicals, industrial chemicals, chemical intermediates, speciality chemicals and production and sale of field crops and vegetable seeds.
The standalone financial statements were authorised for issue in accordance with the resolution of the directors on May 17, 2019.
2. Accounting Policies2.1 Basis of Preparation The standalone financial statements of the Company have been prepared in accordance with Indian Accounting
Standards (Ind AS) notified under the Companies (Indian Accounting Standards) Rules, 2015 notified under section 133 of the Companies Act 2013 (“the Act”) as amended thereafter and other relevant provision of the Act.
The standalone financial statements have been prepared on an accrual basis and under the historical cost convention, except for the following assets and liabilities which have been measured at fair value:
- Derivative financial instruments - Certain financial assets and liabilities measured at fair value (refer accounting policy regarding financial instruments),
The standalone financial statements are presented in Indian Rupees (‘INR’) or (‘Rs’) which is also the Company’s functional currency and all values are rounded to the nearest crores, except when otherwise indicated. Wherever an amount is represented as Rs. ‘0’ (zero) it construes a value less than rupees fifty lakhs.
Significant accounting estimates, assumptions and judgements
The preparation of the Company’s standalone financial statements requires management to make estimates and assumptions that affect the reported amounts of revenues, expenses, assets and liabilities, and the accompanying disclosures, and the disclosure of contingent liabilities. Uncertainty about these assumptions and estimates could result in outcomes that require a material adjustment to the carrying amount of assets or liabilities effected in future periods.
Estimates and assumptions The key assumptions concerning the future and other key sources of estimation uncertainty at the reporting date, that
have a significant risk of causing a material adjustment to the carrying amounts of assets and liabilities within the next financial year, are described below. The Company based its assumptions and estimates on parameters available when the standalone financial statements were prepared. Existing circumstances and assumptions about future developments, however, may change due to market changes or circumstances arising that are beyond the control of the Company. Such changes are reflected in the assumptions when they occur.
Taxes There are many transactions and calculations undertaken during the ordinary course of business for which the ultimate
tax determination is uncertain. Where the final tax outcome of these matters is different from the amounts initially recorded, such differences will impact the current and deferred tax provisions in the period in which the tax determination is made. The assessment of probability involves estimation of a number of factors including future taxable income.
Defined benefit plans (gratuity benefits) A liability in respect of defined benefit plans is recognised in the balance sheet, and is measured as the present value
of the defined benefit obligation at the reporting date less the fair value of the plan’s assets. The present value of the defined benefit obligation is based on expected future payments at the reporting date, calculated annually by independent actuaries. Consideration is given to expected future salary levels, experience of employee departures and periods of service. Refer note 33 for details of the key assumptions used in determining the accounting for these plans.
Fair value measurement of financial instruments When the fair values of financial assets and financial liabilities recorded in the balance sheet cannot be measured based
on quoted prices in active markets, their fair value is measured using valuation techniques including the DCF model. The inputs to these models are taken from observable markets where possible, but where this is not feasible, a degree of judgement is required in establishing fair values. Judgements include considerations of inputs such as liquidity risk,
Annual Report 2018-19 | 151
UPL Limited
Notes to Standalone Financial Statements for the year ended March 31, 2019
credit risk and volatility. Changes in assumptions about these factors could affect the reported fair value of financial instruments. See Note 39 and 40 for further disclosures.
Provision against obsolete and slow-moving inventories The Company reviews the condition of its inventories and makes provision against obsolete and slow-moving inventory
items which are identified as no longer suitable for sale or use. Company estimates the net realisable value for such inventories based primarily on the latest invoice prices and current market conditions. The Company carries out an inventory review at each balance sheet date and makes provision against obsolete and slow-moving items. The Company reassesses the estimation on each balance sheet date.
Impairment of financial assets The Company assesses impairment based on expected credit losses (ECL) model on trade receivables. The Company
uses a provision matrix to determine impairment loss allowance on the portfolio of trade receivables. The provision matrix is based on its historically observed default rates over the expected life of the trade receivable and is adjusted for forward looking estimates. At every reporting date, the historical observed default rates are updated and changes in the forward-looking estimates are analysed.
Impairment of non- financial assets The Company assesses at each reporting date whether there is an indication that an asset may be impaired. If any
indication exists, or when annual impairment testing for an asset is required, the Company estimates the asset’s recoverable amount. An asset’s recoverable amount is the higher of an asset’s fair value less costs of disposal and its value in use. It is determined for an individual asset, unless the asset does not generate cash inflows that are largely independent of those from other assets or group of assets. Where the carrying amount of an asset exceeds its recoverable amount, the asset is considered impaired and is written down to its recoverable amount. In assessing value in use, the estimated future cash flows are discounted to their present value using a pre- tax discount rate that reflects current market assessment of the time value of money and the risk specific to the asset. In determining fair value less cost of disposal, recent market transactions are taken into account. If no such transactions can be identified, an appropriate valuation model is used. These calculations are corroborated by valuation multiples, quoted share price for publicly traded subsidiaries or other available fair value indicators.
2.2 Summary of significant accounting policiesa. Current versus non-current classification The Company presents assets and liabilities in the balance sheet based on current/ non-current classification.
An asset is treated as current when it is: - Expected to be realised or intended to be sold or consumed in normal operating cycle - Held primarily for the purpose of trading - Cash or cash equivalent unless restricted from being exchanged or used to settle a liability for at least twelve
months after the reporting period.
All other assets are classified as non-current.
A liability is current when: - It is expected to be settled in normal operating cycle - It is held primarily for the purpose of trading - There is no unconditional right to defer the settlement of the liability for at least twelve months after the reporting
period
The Company classifies all other liabilities as non-current.
Deferred tax assets and liabilities are classified as non-current assets and liabilities.
Based on the nature of products and the time between acquisition of assets for processing and their realisation in cash and cash equivalents, the Company has identified twelve months as its operating cycle for the purpose of current / non current classification of assets and liabilities.
b. Revenue recognition Revenue is recognised to the extent that it is probable that the economic benefits will flow to the Company and the
revenue can be reliably measured, regardless of when the payment is being made. Revenue is measured at the fair value
152 | Annual Report 2018-19
UPL Limited
of the consideration received or receivable, taking into account contractually defined terms of payment and excluding taxes or duties collected on behalf of the government.
Revenue is stated inclusive of excise duty and excludes sales tax/ value added tax (VAT)/Goods and Service Tax (GST).
The specific recognition criteria described below must also be met before revenue is recognised.
Sale of goods Revenue is recognised upon transfer of control of promised goods to customers in an amount that reflects the
consideration which the Company expects to receive in exchange for those goods.
Revenue from the sale of goods is recognised at the point in time when control is transferred to the customer which is usually on shipment.
Revenue is measured based on the transaction price, which is the consideration, adjusted for volume discounts, rebates, scheme allowances, price concessions, incentives, and returns, if any, as specified in the contracts with the customers. Revenue excludes taxes collected from customers on behalf of the government. Accruals for discounts/incentives and returns are estimated (using the most likely method)based on accumulated experience and underlying schemes and agreements with customers. Due to the short nature of credit period given to customers, there is no financing component in the contract.
Rendering of services Income from services are recognized as and when the services are rendered.
Interest income For all debt instruments measured either at amortised cost or at fair value through other comprehensive income, interest
income is recorded using the effective interest rate (EIR). EIR is the rate that exactly discounts the estimated future cash payments or receipts over the expected life of the financial instrument or a shorter period, where appropriate, to the gross carrying amount of the financial asset or to the amortised cost of a financial liability. When calculating the effective interest rate, the Company estimates the expected cash flows by considering all the contractual terms of the financial instrument (for example prepayment, extension, call and similar options) but does not consider the expected credit losses. Interest income is included in other income in the statement of profit and loss.
Export Incentive Duty free imports of raw materials under Advance License for Imports as per the Export and Import Policy are matched
with the exports made against the said licenses and the benefit / obligation is accounted by making suitable adjustments in raw material consumption.
The benefit accrued under the Duty Drawback scheme and other schemes as per the Export and Import Policy in respect of exports made under the said Schemes is included under the head “Revenue from Operations” as ‘Export Incentive’
Dividends and Royalties Dividend income is recognised when the Company’s right to receive the payment is established, which is generally when
shareholders approve the dividend. Royalty income is recognized on an accrual basis in accordance with the substance of the relevant agreement.
c. Property, Plant and Equipment Items of Property, plant and equipment including capital-work in-progress are stated at cost, net of accumulated
depreciation and accumulated impairment losses, if any. Cost comprises the purchase price and any attributable cost of bringing the asset to its working condition for its intended use. Such cost includes the cost of replacing part of the plant and equipment and borrowing costs for long-term construction projects if the recognition criteria are met. Subsequent expenditure related to an item of fixed asset is added to its book value only if it increases the future benefits from the existing asset beyond its previously assessed standard of performance. When significant parts of plant and equipment are required to be replaced at intervals, the Company depreciates them separately based on their specific useful lives. All other repair and maintenance costs are recognised in statement of profit or loss as incurred. In respect of additions to /deletions from the Fixed Assets, depreciation is provided on pro-rata basis with reference to the month of addition/deletion of the Assets.
The company, based on technical assessment made by technical expert and management estimate, depreciates certain items of plant and equipment over estimated useful lives which are different from the useful life prescribed in Schedule
Notes to Standalone Financial Statements for the year ended March 31, 2019

Annual Report 2018-19 | 153
UPL Limited
II to the Companies Act, 2013. The management believes that these estimated useful lives are realistic and reflect fair approximation of the period over which the assets are likely to be used.
Estimated useful life’s of the assets are as follows:Nature of tangible Assets Useful Life (years)Plant & Equipment's 3 to 25Building 30 to 60Laboratory Equipment's 10Office Equipment's 5Furniture, Fixtures & Equipment's 10Vehicles 8Leasehold improvements over the period of lease
Leasehold Land: No depreciation is provided for leasehold land since as per the lease agreements, the leases are renewable at the option
of the Company for a further period of 99 years at the end of the lease period of 99 years, without / with marginal payment of further premium.
The residual values, useful lives and methods of depreciation of property, plant and equipment are reviewed at each financial year end and adjusted prospectively, if appropriate.
d. Intangible assets i. Goodwill a) Goodwill arising on amalgamation in accordance with court scheme.
Goodwill arising on amalgamation of Advanta Limited has been recognised in accordance with court scheme. Said goodwill has been amortised in accordance with the court scheme for which Company has estimated useful life of 10 years. (Refer note 45)
b) Goodwill other than mentioned above - Goodwill is initially measured at cost, being the excess of the aggregate fair value of the consideration
transferred over the net of fair value of identifiable assets acquired and liability assumed. - Subsequent measurement is at cost less any accumulated impairment losses. - Goodwill is not amortised and is tested for impairment annually.
ii. Other intangible assets Intangible assets acquired separately are measured on initial recognition at cost. Following initial recognition,
intangible assets with finite life are carried at cost less any accumulated amortisation and accumulated impairment losses. Internally generated intangibles, excluding capitalised development costs, are not capitalised and the related expenditure is reflected in statement of profit or loss in the period in which the expenditure is incurred.
The amortisation period and the amortisation method for an intangible asset with a finite useful life is reviewed at least at the end of each reporting period.
Gains or losses arising from de-recognition of an intangible asset are measured as the difference between the net disposal proceeds and the carrying amount of the asset and are recognised in the statement of profit or loss when the asset is de-recognised.
Research costs are expensed as incurred. Development expenditures on an individual project are recognised as an intangible asset when the Company can demonstrate technical and commercial feasibility of making the asset available for use or sale.
Following initial recognition of the development expenditure as an asset, the asset is carried at cost less any accumulated amortisation and accumulated impairment losses. Amortisation of the asset begins when development is complete and the asset is available for use. It is amortised over the period of expected future benefit. Amortisation expense is recognised in the statement of profit and loss unless such expenditure forms part of carrying value of another asset.
Notes to Standalone Financial Statements for the year ended March 31, 2019
154 | Annual Report 2018-19
UPL Limited
A summary of the policies applied to the Company’s intangible assets is as followsNature of tangible Assets Useful Life (years) Amortisation method usedProduct Acquisitions Fifteen years Amortised on straight-line basis from the month of
additions to match their future economic benefitsGerm plasm Ten to fifteen years Amortised on straight-line basisOther Intangible assets Five years Amortised on straight-line basis
e. Borrowing costs Borrowing costs directly attributable to the acquisition, construction or production of an asset that necessarily takes a
substantial period of time to get ready for its intended use or sale are capitalised as part of the cost of the asset. All other borrowing costs are expensed in the period in which they occur. Borrowing costs consist of interest and other costs that an entity incurs in connection with the borrowing of funds. Borrowing cost also includes exchange differences to the extent regarded as an adjustment to the borrowing costs.
f. Foreign Currency Transactions and balances Transactions in foreign currency are recorded applying the exchange rate at the date of transaction. Monetary assets and
liabilities denominated in foreign currency remaining unsettled at the end of the year, are translated at the closing rates prevailing on the Balance Sheet date. Non-monetary items which are carried in terms of historical cost denominated in foreign currency are reported using the exchange rate at the date of transaction. Exchange differences arising as a result of the above are recognized as income or expenses in the statement of profit and loss. Exchange difference arising on the settlement of monetary items at rates different from those at which they were initially recorded during the year, or reported in previous standalone financial statements, are recognised as income or expenses in the year in which they arise.
Foreign exchange difference on foreign currency borrowings, loans given, settlement gain/loss and fair value gain/loss on derivative contract relating to borrowings are accounted and disclosed under finance cost. Such exchange difference does not include foreign exchange difference regarded as an adjustment to the borrowings cost and capitalised with cost of assets.
g. Fair value measurement The Company measures financial instruments, such as, derivatives at fair value at each balance sheet date on a portfolio
basis.
Fair value is the price that would be received to sell an asset or paid to transfer a liability in an orderly transaction between market participants at the measurement date. The fair value measurement is based on the presumption that the transaction to sell the asset or transfer the liability takes place either:
- In the principal market for the asset or liability, or - In the absence of a principal market, in the most advantageous market for the asset or liability
The principal or the most advantageous market must be accessible by the Company.
The fair value of an asset or a liability is measured using the assumptions that market participants would use when pricing the asset or liability, assuming that market participants act in their economic best interest.
A fair value measurement of a non-financial asset takes into account a market participant’s ability to generate economic benefits by using the asset in its highest and best use or by selling it to another market participant that would use the asset in its highest and best use.
The Company uses valuation techniques that are appropriate in the circumstances and for which sufficient data are available to measure fair value, maximizing the use of relevant observable inputs and minimizing the use of unobservable inputs.
All assets and liabilities for which fair value is measured or disclosed in the standalone financial statements are categorised within the fair value hierarchy, described as follows, based on the lowest level input that is significant to the fair value measurement as a whole:
- Level 1 — Quoted (unadjusted) market prices in active markets for identical assets or liabilities
- Level 2 — Valuation techniques for which the lowest level input that is significant to the fair value measurement is
Notes to Standalone Financial Statements for the year ended March 31, 2019

Annual Report 2018-19 | 155
UPL Limited
directly or indirectly observable
- Level 3 — Valuation techniques for which the lowest level input that is significant to the fair value measurement is unobservable
For assets and liabilities that are recognised in the standalone financial statements on a recurring basis, the Company determines whether transfers have occurred between levels in the hierarchy by re-assessing categorisation (based on the lowest level input that is significant to the fair value measurement as a whole) at the end of each reporting period.
For the purpose of fair value disclosures, the Company has determined classes of assets and liabilities on the basis of the nature, characteristics and risks of the asset or liability and the level of the fair value hierarchy as explained above.
This note summaries accounting policy for fair value. Other fair value related disclosures are given in the relevant notes. - Quantitative disclosures of fair value measurement hierarchy (note 40) - Financial instruments (including those carried at amortised cost) (note 5, 6, 7, 10, 11, 11A, 14, 15, 17,18, 38, 39, 40
and 41)
h. Leases The determination of whether an arrangement is (or contains) a lease is based on the substance of the arrangement at
the inception of the lease. The arrangement is, or contains, a lease if fulfilment of the arrangement is dependent on the use of a specific asset or assets and the arrangement conveys a right to use the asset or assets, even if that right is not explicitly specified in an arrangement.
For arrangements entered into prior to 1 April 2015, the company has determined whether the arrangement contain lease on the basis of facts and circumstances existing on the date of transition.
Company as a lessee A lease is classified at the inception date as a finance lease or an operating lease. A lease that transfers substantially all
the risks and rewards incidental to ownership to the Company is classified as a finance lease.
Finance leases are capitalised at the commencement of the lease at the inception date fair value of the leased property or, if lower, at the present value of the minimum lease payments. Lease payments are apportioned between finance charges and reduction of the lease liability so as to achieve a constant rate of interest on the remaining balance of the liability. Finance charges are recognised in finance costs in the statement of profit and loss, unless they are directly attributable to qualifying assets, in which case they are capitalized in accordance with the Company’s general policy on the borrowing costs. Contingent rentals are recognised as expenses in the periods in which they are incurred.
A leased asset is depreciated over the useful life of the asset. However, if there is no reasonable certainty that the Company will obtain ownership by the end of the lease term, the asset is depreciated over the shorter of the estimated useful life of the asset and the lease term.
Operating lease payments are recognised as an expense in the statement of profit and loss on a straight-line basis over the lease term.
Company as a lessor Leases in which the Company does not transfer substantially all the risks and rewards of ownership of an asset are
classified as operating leases. Rental income from operating lease is recognised on a straight-line basis over the term of the relevant lease.
Leases are classified as finance leases when substantially all of the risks and rewards of ownership transfer from the Company to the lessee. Amounts due from lessees under finance leases are recorded as receivables at the Company’s net investment in the leases. Finance lease income is allocated to accounting periods so as to reflect a constant periodic rate of return on the net investment outstanding in respect of the lease.
i. Inventories Stores and spares, packing materials and raw materials are valued at lower of cost or net realisable value. Cost is
determined on moving weighted average basis. The aforesaid items are valued below cost if the finished products in which they are to be incorporated are expected to be sold at a loss.
Work in progess, finished products and by-products are valued at lower of cost or net realisable value. Cost is determined on standard cost basis which approximates the actual cost. Cost of finished goods includes excise duty, as applicable. Variances, exclusive of abnormally low volume and operating performance, are adjusted to inventory.
Notes to Standalone Financial Statements for the year ended March 31, 2019
156 | Annual Report 2018-19
UPL Limited
Traded goods are valued at lower of cost and net realizable value. Cost includes cost of purchase and other costs incurred in bringing the inventories to their present location and condition. Cost is determined on a weighted average basis.
Net realisable value is the estimated selling price in the ordinary course of business, less estimated costs of completion and the estimated costs necessary to make the sale.
j. Impairment of non-financial assets The Company assesses, at each reporting date, whether there is an indication that an asset may be impaired. If any
indication exists, or when annual impairment testing for an asset is required, the Company estimates the asset’s recoverable amount. An asset’s recoverable amount is the higher of an asset’s or cash-generating unit’s (CGU) fair value less costs of disposal and its value in use. Recoverable amount is determined for an individual asset, unless the asset does not generate cash inflows that are largely independent of those from other assets or groups of assets. When the carrying amount of an asset or CGU exceeds its recoverable amount, the asset is considered impaired and is written down to its recoverable amount.
In assessing value in use, the estimated future cash flows are discounted to their present value using a pre-tax discount rate that reflects current market assessments of the time value of money and the risks specific to the asset. In determining fair value less costs of disposal, recent market transactions are taken into account. If no such transactions can be identified, an appropriate valuation model is used. These calculations are corroborated by valuation multiples, quoted share prices for publicly traded companies or other available fair value indicators.
For assets excluding goodwill, an assessment is made at each reporting date to determine whether there is an indication that previously recognised impairment losses no longer exist or have decreased. If such indication exists, the Company estimates the asset’s or CGU’s recoverable amount. A previously recognised impairment loss is reversed only if there has been a change in the assumptions used to determine the asset’s recoverable amount since the last impairment loss was recognised. The reversal is limited so that the carrying amount of the asset does not exceed its recoverable amount, nor exceed the carrying amount that would have been determined, net of depreciation, had no impairment loss been recognised for the asset in prior years. Such reversal is recognised in the statement of profit or loss.
Goodwill is tested for impairment annually as at 31 March and when circumstances indicate that the carrying value may be impaired.
Impairment is determined for goodwill by assessing the recoverable amount of each CGU (or group of CGUs) to which the goodwill relates. When the recoverable amount of the CGU is less than its carrying amount, an impairment loss is recognised. Impairment losses relating to goodwill are not reversed in future periods.
Intangible assets with indefinite useful lives are tested for impairment annually as at 31 March at the CGU level, as appropriate, and when circumstances indicate that the carrying value may be impaired.
k. Provisions Provisions are recognised when the Company has a present obligation (legal or constructive) as a result of a past event,
it is probable that an outflow of resources embodying economic benefits will be required to settle the obligation and a reliable estimate can be made of the amount of the obligation. When the Company expects some or all of a provision to be reimbursed, for example, under an insurance contract, the reimbursement is recognised as a separate asset, but only when the reimbursement is virtually certain. The expense relating to a provision is presented in the statement of profit and loss net of any reimbursement.
If the effect of the time value of money is material, provisions are discounted using a current pre-tax rate that reflects, when appropriate, the risks specific to the liability. When discounting is used, the increase in the provision due to the passage of time is recognised as a finance cost. Provisions are reviewed at each balance sheet and adjusted to reflect the current best estimates.
l. Retirement and other employee benefits Provident Fund is a defined contribution scheme established under a State Plan. The contributions to the scheme are
charged to the statement of profit and loss in the year when employee rendered related services.
Superannuation Fund is a defined contribution scheme and contributions to the scheme are charged to the statement of profit and loss in the year when the contributions are due. The scheme is funded with an insurance Company in the form of a qualifying insurance policy.
The Company has a defined benefit gratuity plan. Every employee who has completed five years or more of service gets
Notes to Standalone Financial Statements for the year ended March 31, 2019

Annual Report 2018-19 | 157
UPL Limited
a gratuity on post employment at 15 days salary (last drawn salary) for each completed year of service as per the rules of the Company. The aforesaid liability is provided for on the basis of an actuarial valuation on projected unit credit method made at the end of the financial year. The scheme is funded with an insurance Company in the form of a qualifying insurance policy.
The Company has other long-term employee benefits in the nature of leave encashment. The liability in respect of leave encashment is provided for on the basis of an actuarial valuation on projected unit credit method made at the end of the financial year. The aforesaid leave encashment is funded with an insurance Company in the form of a qualifying insurance policy.
Re-measurements, comprising of actuarial gains and losses, the effect of asset ceiling, excluding amounts included in the net interest on the net defined benefit liability and the return on plan assets (excluding amounts included in net interest on the net defined benefit liability), are recognised immediately in the balance sheet with a corresponding debit or credit to retained earnings through OCI in the period in which they occur. Re-measurements are not reclassified to statement of profit or loss in subsequent periods.
m. Financial instruments A financial instrument is any contract that gives rise to a financial asset of one entity and a financial liability or equity
instrument of another entity.
Financial assets Initial recognition and measurement All financial assets are recognised initially at cost and then measured at fair value at each reporting date plus, in the
case of financial assets not recorded at fair value through profit or loss, transaction costs that are attributable to the acquisition of the financial asset.
Debt instruments at amortised cost A ‘debt instrument’ is measured at the amortised cost if both its following conditions are met:
a) The asset is held within a business model whose objective is to hold assets for collecting contractual cash flows, and b) Contractual terms of the asset give rise on specified dates to cash flows that are solely payments of principal and
interest (SPPI) on the principal amount outstanding.
After initial measurement, such financial assets are subsequently measured at amortised cost using the effective interest rate (EIR) method. Amortised cost is calculated by taking into account any discount or premium on acquisition and fees or costs that are an integral part of the EIR. The EIR amortisation is included in other income in the statement of profit or loss. The losses arising from impairment are recognised in the statement of profit or loss.
Debt instrument at FVTOCI A ‘debt instrument’ is classified at FVTOCI if both of the following criteria are met:
a) The objective of the business model is achieved both by collecting contractual cash flows and selling the financial assets, and
b) The asset’s contractual cash flows represent SPPI.
Debt instruments included within the FVTOCI category are measured initially as well as at each reporting date at fair value. Fair value movements are recognized in the other comprehensive income (OCI). However, the company recognizes interest income, impairment losses & reversals and foreign exchange gain or loss in the Profit and Loss. On de-recognition of the asset, cumulative gain or loss previously recognised in OCI is reclassified from the equity to Profit and Loss. Interest earned whilst holding FVTOCI debt instrument is reported as interest income using the EIR method.
Debt instrument at FVTPL FVTPL is a residual category for debt instruments. Any debt instrument, which does not meet the criteria for categorization
as at amortized cost or as FVTOCI, is classified as at FVTPL.
In addition, the company may elect to designate a debt instrument, which otherwise meets amortized cost or FVTOCI criteria, as at FVTPL. However, such election is allowed only if doing so reduces or eliminates a measurement or recognition inconsistency (referred to as ‘accounting mismatch’). The company has designated certain debt instrument as at FVTPL.
Debt instruments included within the FVTPL category are measured at fair value with all changes recognized in the statement of profit and loss.
Notes to Standalone Financial Statements for the year ended March 31, 2019

158 | Annual Report 2018-19
UPL Limited
Equity investments All equity investments in the scope of Ind AS 109 are measured at fair value. Equity instruments which are held for
trading are classified as at FVTPL. For all other equity instruments, the company may make an irrevocable election to present in other comprehensive income subsequent changes in the fair value. The company makes such election on an instrument-by-instrument basis. The classification is made on initial recognition and is irrevocable.
If the company decides to classify an equity instrument as at FVTOCI, then all fair value changes on the instrument, excluding dividends, are recognized in the OCI. There is no recycling of the amounts from OCI to statement of profit and loss, even on sale of investment. However, the company may transfer the cumulative gain or loss within equity.
Equity instruments included within the FVTPL category are measured at fair value with all changes recognized in the statement of profit and loss.
De-recognition A financial asset (or, where applicable, a part of a financial asset or part of a company of similar financial assets) is
primarily de-recognised (i.e. removed from the Company’s balance sheet) when: - The rights to receive cash flows from the asset have expired, or - The company has transferred its rights to receive cash flows from the asset or has assumed an obligation to pay
the received cash flows in full without material delay to a third party under a ‘pass-through’ arrangement; and either (a) the company has transferred substantially all the risks and rewards of the asset, or (b) the company has neither transferred nor retained substantially all the risks and rewards of the asset, but has transferred control of the asset.
When the company has transferred its rights to receive cash flows from an asset or has entered into a pass-through arrangement, it evaluates if and to what extent it has retained the risks and rewards of ownership. When it has neither transferred nor retained substantially all of the risks and rewards of the asset, nor transferred control of the asset, the company continues to recognise the transferred asset to the extent of the Company’s continuing involvement. In that case, the company also recognises an associated liability. The transferred asset and the associated liability are measured on a basis that reflects the rights and obligations that the Company has retained.
Continuing involvement that takes the form of a guarantee over the transferred asset is measured at the lower of the original carrying amount of the asset and the maximum amount of consideration that the company could be required to repay.
Impairment of financial assets In accordance with Ind AS 109, the company applies expected credit loss (ECL) model for measurement and recognition
of impairment loss on the following financial assets and credit risk exposure: a) Financial assets that are debt instruments, and are measured at amortised cost e.g., loans, debt securities, deposits,
trade receivables and bank balance b) Financial assets that are debt instruments and are measured as at FVTOCI c) Lease receivables under Ind AS 17 d) Trade receivables or any contractual right to receive cash or another financial asset that result from transactions
that are within the scope of Ind AS 18 (referred to as ‘contractual revenue receivables’ in these standalone financial statements)
e) Financial guarantee contracts which are not measured as at FVTPL
The company follows ‘simplified approach’ for recognition of impairment loss allowance on: - Trade receivables and - Other receivables
The application of simplified approach does not require the company to track changes in credit risk. Rather, it recognises impairment loss allowance based on lifetime ECLs at each reporting date, right from its initial recognition.
For recognition of impairment loss on other financial assets and risk exposure, the company determines that whether there has been a significant increase in the credit risk since initial recognition. If credit risk has not increased significantly, 12-month ECL is used to provide for impairment loss. However, if credit risk has increased significantly, lifetime ECL is used. If, in a subsequent period, credit quality of the instrument improves such that there is no longer a significant increase in credit risk since initial recognition, then the entity reverts to recognising impairment loss allowance based on 12-month ECL.
Notes to Standalone Financial Statements for the year ended March 31, 2019

Annual Report 2018-19 | 159
UPL Limited
Lifetime ECL are the expected credit losses resulting from all possible default events over the expected life of a financial instrument. The 12-month ECL is a portion of the lifetime ECL which results from default events that are possible within 12 months after the reporting date.
ECL is the difference between all contractual cash flows that are due to the company in accordance with the contract and all the cash flows that the entity expects to receive (i.e., all cash shortfalls), discounted at the original EIR. When estimating the cash flows, an entity is required to consider:
- All contractual terms of the financial instrument (including prepayment, extension, call and similar options) over the expected life of the financial instrument. However, in rare cases when the expected life of the financial instrument cannot be estimated reliably, then the entity is required to use the remaining contractual term of the financial instrument.
- Cash flows from the sale of collateral held or other credit enhancements that are integral to the contractual terms.
- Financial assets measured as at amortised cost, contractual revenue receivables and lease receivables: ECL is presented as an allowance, i.e., as an integral part of the measurement of those assets in the balance sheet. The allowance reduces the net carrying amount. Until the asset meets write-off criteria, the company does not reduce impairment allowance from the gross carrying amount.
n. Financial liabilities Initial recognition and measurement Financial liabilities are classified, at initial recognition, as financial liabilities at fair value through profit or loss, loans and
borrowings, or payables, as appropriate.
All financial liabilities are recognised initially at fair value and, in the case of loans and borrowings and payables, net of directly attributable transaction costs.
The Company’s financial liabilities include trade and other payables, loans and borrowings including bank overdrafts, financial guarantee contracts and derivative financial instruments.
Subsequent measurement The measurement of financial liabilities depends on their classification, as described below:
Financial liabilities at fair value through profit or loss Financial liabilities at fair value through profit or loss include financial liabilities held for trading and financial liabilities
designated upon initial recognition as at fair value through profit or loss. Financial liabilities are classified as held for trading if they are incurred for the purpose of repurchasing in the near term. This category also includes derivative financial instruments entered into by the company that are not designated as hedging instruments in hedge relationships as defined by Ind AS 109.
Gains or losses on liabilities held for trading are recognised in the statement of profit and loss.
Loans and borrowings This is the category most relevant to the company. After initial recognition, interest-bearing loans and borrowings are
subsequently measured at amortised cost using the EIR method. Gains and losses are recognised in profit or loss when the liabilities are de-recognised as well as through the EIR amortisation process.
Amortised cost is calculated by taking into account any discount or premium on acquisition and fees or costs that are an integral part of the EIR. The EIR amortisation is included as finance costs in the statement of profit and loss.
This category generally applies to borrowings. For more information refer Note 14.
Financial guarantee contracts Financial guarantee contracts issued by the company are those contracts that require a payment to be made to
reimburse the holder for a loss it incurs because the specified debtor fails to make a payment when due in accordance with the terms of a debt instrument. Financial guarantee contracts are recognised initially as a liability at fair value, adjusted for transaction costs that are directly attributable to the issuance of the guarantee. Subsequently, the liability is measured at the higher of the amount of loss allowance determined as per impairment requirements of Ind AS 109 and the amount recognised less cumulative amortisation.
De-recognition A financial liability is derecognised when the obligation under the liability is discharged or cancelled or expires. When an
existing financial liability is replaced by another from the same lender on substantially different terms, or the terms of
Notes to Standalone Financial Statements for the year ended March 31, 2019

160 | Annual Report 2018-19
UPL Limited
an existing liability are substantially modified, such an exchange or modification is treated as the de-recognition of the original liability and the recognition of a new liability. The difference in the respective carrying amounts is recognised in the statement of profit and loss.
Offsetting of financial instruments Financial assets and financial liabilities are offset and the net amount is reported in the balance sheet if there is a
currently enforceable legal right to offset the recognised amounts and there is an intention to settle on a net basis, to realise the assets and settle the liabilities simultaneously.
o. Derivative financial instruments Initial recognition and subsequent measurement The Company uses derivative financial instruments, such as forward currency contracts, full currency swaps and interest
rate swaps contracts to hedge its foreign currency risks and interest rate risks respectively. Such derivative financial instruments are initially recognised at fair value on the date on which a derivative contract is entered into and are subsequently re-measured at fair value. Derivatives are carried as financial assets when the fair value is positive and as financial liabilities when the fair value is negative. Fair value changes are recognised in the statement of profit and loss.
p. Cash and cash equivalents Cash and cash equivalents in the balance sheet comprise cash at banks and on hand and short-term deposits with an
original maturity of three months or less, which are subject to an insignificant risk of changes in value.
For the purpose of the statement of cash flows, cash and cash equivalents consist of cash and short-term deposits, as defined above, net of outstanding bank overdrafts as they are considered an integral part of the Company’s cash management.
q. Cash dividend The Company recognises a liability to make cash distributions to equity holders when the distribution is authorised
and the distribution is no longer at the discretion of the Company. As per the corporate laws in India, a distribution is authorised when it is approved by the shareholders. A corresponding amount is recognised directly in equity.
r. Taxes Current income tax Current income tax assets and liabilities are measured at the amount expected to be recovered from or paid to the
taxation authorities in accordance with the Income-tax Act, 1961. The tax rates and tax laws used to compute the amount are those that are enacted or substantively enacted, at the reporting date.
Current income tax relating to items recognised outside profit or loss is recognised outside profit or loss (either in other comprehensive income or in equity). Current tax items are recognised in correlation to the underlying transaction either in OCI or directly in equity. Management periodically evaluates positions taken in the tax returns with respect to situations in which applicable tax regulations are subject to interpretation and establishes provisions where appropriate.
Deferred tax Deferred tax is provided using the liability method on temporary differences between the tax bases of assets and
liabilities and their carrying amounts for financial reporting purposes at the reporting date.
Deferred tax liabilities are recognised for all taxable temporary differences, except: - When the deferred tax liability arises from the initial recognition of goodwill or an asset or liability in a transaction
that is not a business combination and, at the time of the transaction, affects neither the accounting profit nor taxable profit or loss
- In respect of taxable temporary differences associated with investments in subsidiaries, associates and interests in joint ventures, when the timing of the reversal of the temporary differences can be controlled and it is probable that the temporary differences will not reverse in the foreseeable future
Deferred tax assets are recognised for all deductible temporary differences, the carry forward of unused tax credits and any unused tax losses are recognised to the extent that it is reasonably certain that taxable profit will be available against which the deductible temporary differences, and the carry forward of unused tax credits and unused tax losses can be utilised, except:
Notes to Standalone Financial Statements for the year ended March 31, 2019
Annual Report 2018-19 | 161
UPL Limited
- When the deferred tax asset relating to the deductible temporary difference arises from the initial recognition of an asset or liability in a transaction that is not a business combination and, at the time of the transaction, affects neither the accounting profit nor taxable profit or loss
The carrying amount of deferred tax assets is reviewed at each reporting date and reduced to the extent that it is no longer probable that sufficient taxable profit will be available to allow all or part of the deferred tax asset to be utilised. Unrecognised deferred tax assets are re-assessed at each reporting date and are recognised to the extent that it has become reasonably certain that future taxable profits will allow the deferred tax asset to be recovered.
Deferred tax assets and liabilities are measured at the tax rates that are expected to apply in the year when the asset is realised or the liability is settled, based on tax rates (and tax laws) that have been enacted or substantively enacted at the reporting date.
Deferred tax relating to items recognised outside profit or loss is recognised outside profit or loss (either in other comprehensive income or in equity). Deferred tax items are recognised in correlation to the underlying transaction either in OCI or directly in equity.
Minimum Alternate Tax (MAT) Minimum Alternate Tax (MAT) paid as per Indian Income Tax Act, 1961 is in the nature of unused tax credit which can
be carried forward and utilised when the Company will pay normal income tax during the specified period. Deferred tax assets on such tax credit is recognised to the extent that it is probable that the unused tax credit can be utilised in the specified future period. The net amount of tax recoverable from, or payable to, the taxation authority is included as part of receivables or payables in the balance sheet.
s. Government grants Government grants are recognised where there is reasonable assurance that the grant will be received and all attached
conditions will be complied with. When the grant relates to an expense item, it is recognised as income on a systematic basis over the periods that the related costs, for which it is intended to compensate, are expensed. When the grant relates to an asset, it is recognised as income in equal amounts over the expected useful life of the related assets.
Export Benefits: Duty free imports of raw materials under Advance License for imports as per the Import and Export Policy are matched
with the exports made against the said licenses and the net benefit/obligation has been accounted by making suitable adjustments in raw material consumption.
The benefit accrued under the Duty Drawback, Merchandise Export Incentive Scheme and other schemes as per the Import and Export Policy in respect of exports made under the said schemes is included as ‘Export Incentives’ under the head ‘Other operating revenue’.
t. Convertible preference shares Convertible preference shares are separated into liability and equity components based on the terms of the contract.
On issuance of the convertible preference shares, the fair value of the liability component is determined using a market interest rate for an equivalent non-convertible instrument. This amount is classified as a financial liability measured at amortised cost (net of transaction costs) until it is extinguished on conversion or redemption.
The remainder of the proceeds are allocated to the conversion option that is recognised and included in equity if the conversion option meets Ind AS 32 criteria for fixed to fixed classification. Transaction costs are deducted from equity, net of associated income tax. The carrying amount of the conversion option is not remeasured in subsequent years.
Transaction costs are apportioned between the liability and equity components of the convertible preference shares based on the allocation of proceeds to the liability and equity components when the instruments are initially recognised.
u. Earnings Per Share: Basic earnings per share are calculated by dividing the net profit or loss for the period attributable to equity shareholders
by the weighted average number of equity shares outstanding during the period.
For the purpose of calculating diluted earnings per share, the net profit or loss for the period attributable to equity shareholders and the weighted average number of shares outstanding during the period are adjusted for the effects of all dilutive potential equity shares.
Notes to Standalone Financial Statements for the year ended March 31, 2019

162 | Annual Report 2018-19
UPL Limited
v. Segment Reporting: Based on “Management Approach” as defined in Ind AS 108 -Operating Segments, the Chief Operating Decision Maker
evaluates the Company’s performance and allocates the resources based on an analysis of various performance indicators by business segments. Inter segment sales and transfers are reflected at market prices.
Unallocable items includes general corporate income and expense items which are not allocated to any business segment.
Segment Policies: The Company prepares its segment information in conformity with the accounting policies adopted for preparing and
presenting the standalone financial statements of the Company as a whole. Common allocable costs are allocated to each segment on an appropriate basis.
w. Contingent Liability and Contingent assets A contingent liability is a possible obligation that arises from past events whose existence will be confirmed by the
occurrence or non—occurrence of one or more uncertain future events not wholly within the control of the Company or a present obligation that is not recognized because it is not probable that an outflow of resources will be required to settle the obligation. A contingent liability also arises in extremely rare cases where there is a liability that cannot be recognized because it cannot be measured reliably. The Company does not recognize a contingent liability but discloses its existence in the standalone financial statements.
A contingent asset is not recognised unless it becomes virtually certain that an inflow of economic benefits will arise. When an inflow of economic benefits is probable, contingent asset are disclosed in the standalone financial statements.
Contingent liabilities and contingent assets are reviewed at each balance sheet date.
x. Share Based Payments: Measurement and disclosure of the employee share based payment plans is done in accordance with Ind AS 102, Share
Based Payment. The Company measures compensation cost relating to employee stock options using the fair value method. Compensation expense is amortised over the vesting period of the option on a straight line basis.
y. Standards issued but not yet effective Ind AS 116-Leases: The new standard on leases sets out the principles for the recognition, measurement, presentation and disclosure of
the leases. The core objective of this standard is to ensure that lessees and lessors provide relevant information in a manner that faithfully represent those transactions.
The Company is required to adopt Ind AS 116, Leases from 1 April, 2019. Ind AS 116 introduces a single, on- balance sheet lease accounting model for lessees. A lessee recognises a right-of-use asset representing its right to use the underlying asset and a lease liability representing its obligation to make lease payments. There are recognition exemptions for short-term leases and leases of low-value items. Lessor accounting remains similar to the current standard – i.e. lessors continue to classify leases as finance or operating leases. It replaces existing leases guidance, Ind AS 17, Leases.
The Company has completed an initial assessment of the potential impact (summarised below) on its standalone financial statements but has not yet completed its detailed assessment. The quantitative impact of adoption of Ind AS 116 on the standalone financial statements in the period of initial application is not reasonably estimable as at present.
- the total assets and liabilities on the balance sheet will increase with a decrease in net total assets, due to the depreciation of right of use assets being on a straight- line basis whilst the lease liability reduces by the principal amount of repayments;
- Interest expense will increase due to the unwinding of the effective interest rate implicit in the lease liability. Interest expense will be greater earlier in a lease’s life, due to the higher principal value, causing profit variability over the term of lease. This effect may be partially mitigated due to the number of leases held by the Company at various stages of their terms; and
- operating cash flows will be higher and financing cash flows will be lower, as repayment of the principal portion of all lease liabilities will be classified as financing activities.
The Company plans to apply Ind AS 116 initially on 1 April 2019, using the modified retrospective approach. Therefore, the cumulative effect of adopting Ind AS 116 will be recognised as an adjustment to the opening balance of retained earnings at 1 April 2019, with no restatement of comparative information.
Notes to Standalone Financial Statements for the year ended March 31, 2019

Annual Report 2018-19 | 163
UPL Limited
Notes to Standalone Financial Statements for the year ended March 31, 2019
The Company plans to apply the practical expedient to grandfather the definition of a lease on transition. This means that it will apply Ind AS 116 to all contracts entered into before 1 April 2019 and identified as leases in accordance with Ind AS 17.
In addition to the above, the following amendments to existing standards have been issued, are not yet effective and are not expected to have a significant impact on the Company’s standalone financial statements:
- Amendments to Ind AS 103, Business Combinations, and Ind AS 111, Joint Arrangements: This interpretation clarifies how an entity accounts for increasing its interest in a joint operation that meets the definition of a business.
- Amendments to Ind AS 109, Financial Instruments: amendments relating to the classification of particular pre payable financial assets.
- Amendments to Ind AS 12, Income Taxes, clarify that all income tax consequences of dividends (including payments on financial instruments classified as equity) are recognized consistently with the transactions that generated the distributable profits – i.e. in profit or loss, other comprehensive income or equity. Further Appendix C, uncertainty over income tax treatments has been added to clarify how entities should reflect uncertainties over income tax treatments, in particular when assessing the outcome a tax authority might reach with full knowledge and information if it were to make an examination.
- Amendment to Ind AS 19, Employee Benefits - The amendment to Ind AS 19 clarifies that on amendment, curtailment or settlement of a defined benefit plan, the current service cost and net interest for the remainder of the annual reporting period are calculated using updated actuarial assumptions – i.e. consistent with the calculation of a gain or loss on the plan amendment, curtailment or settlement. This amendment also clarifies that an entity first determines any past service cost, or a gain or loss on settlement, without considering the effect of the asset ceiling. This amount is recognized in profit or loss. The entity then determines the effect of the asset ceiling after plan amendment, curtailment or settlement. Any change in that effect is recognized in other comprehensive income (except for amounts included in net interest).
- Amendments to Ind AS 23, Borrowing Costs, clarify that the general borrowings pool used to calculate eligible borrowing costs excludes only borrowings that specifically finance qualifying assets that are still under development or construction.
Impact on adoption of above changes in standards is not material.
2.3 Changes in accounting policiesa. The Company applied Ind AS 115 for the first time. The nature and effect of the changes as a result of adoption of the
new accounting standard are described below.
b. Several other amendments and interpretations apply for the first time in April 1, 2018, but do not have an impact on the financial statements of the Company. The Company has not early adopted any standards, interpretations or amendments that have been issued but are not yet effective.
c. The Company adopted Ind AS 115 as per the modified retrospective approach, which requires the cumulative effect on adoption of Ind AS 115 to retained earnings at April 1, 2018. The adoption of Ind AS 115 did not have any impact on the financial statements of the Company as at and for the year ended March 31, 2019.

164 | Annual Report 2018-19
UPL Limited
3. P
rope
rty,
pla
nt a
nd e
quip
men
t H In
Cro
res
Land
- Fr
eeho
ldLa
nd -
Leas
ehol
dBu
ildin
gPl
ant a
nd
Equi
pmen
tLa
bora
tory
Eq
uipm
ent
Offi
ce
Equi
pmen
tFu
rnitu
re,
Fixt
ures
and
Eq
uipm
ent
Vehi
cles
Leas
ehol
d Im
prov
emen
tsCa
pita
l W
ork
-in-
Prog
ress
Tota
l
Cost
or v
alua
tion
At M
arch
31,
201
793
151
179
2,39
629
5154
3356
249
3,29
1Ad
ditio
ns-
-35
397
56
61
-56
11,
011
Disp
osal
s-
-(1
)(7
1)(0
)(0
)(0
)(1
)-
-(7
3)Ca
pita
lised
--
--
--
--
-(1
86)
(186
)At
Mar
ch 3
1, 2
018
9315
121
32,
722
3457
6033
5662
44,
043
Addi
tions
10
4272
07
1115
1-
901
1,69
8Di
spos
als
--
(0)
(21)
(0)
(2)
(0)
(0)
--
(23)
Capi
talis
ed-
--
--
--
--
(704
)(7
04)
At M
arch
31,
201
994
151
255
3,42
141
6675
3456
821
5,01
4Ac
cum
ulat
ed D
epre
ciat
ion
At M
arch
31,
201
7-
-48
1,11
97
4238
2431
-1,
309
Depr
ecia
tion
(refe
r not
e 27
)-
-7
196
37
63
4-
226
Disp
osal
s-
-(1
)(6
1)(0
)(1
)(0
)(0
)-
-(6
4)At
Mar
ch 3
1, 2
018
--
541,
254
1048
4427
35-
1,47
1De
prec
iatio
n (re
fer n
ote
27)
--
924
94
88
24
-28
4Di
spos
als
--
(0)
(16)
(0)
(2)
(0)
(0)
--
(18)
At M
arch
31,
201
9-
-63
1,48
714
5452
2939
-1,
737
Net
boo
k va
lue
At M
arch
31,
201
994
151
192
1,93
427
1223
517
821
3,27
6At
Mar
ch 3
1, 2
018
9315
115
91,
468
249
166
2162
42,
571
All t
he ti
tle d
eeds
are
in th
e na
me
of th
e Co
mpa
ny, e
xcep
t in
the
case
of l
ease
hold
land
, fre
ehol
d la
nd a
nd b
uild
ings
with
a c
arry
ing
valu
e of
Rs.
11 c
rore
s, Rs
. 2 c
rore
s an
d Rs
. 0 c
rore
(Gro
ss b
lock
of R
s. 11
cro
res,
Rs. 2
cro
res
and
Rs.1
cro
re) a
s at
31
Mar
ch 2
019
and
31 M
arch
201
8 re
spec
tivel
y.
H In
Cro
res
As a
t Mar
ch 3
1, 2
019
As a
t Mar
ch 3
1, 2
018
Plan
t, pr
oper
ty a
nd e
quip
men
t 2
,455
1
,947
Ca
pita
l wor
k in
pro
gres
s 8
21
624
3
,276
2
,571
Capi
tal W
ork
in P
rogr
ess
Capi
tal w
ork
in p
rogr
ess
as a
t Mar
ch 3
1, 2
019
and
Mar
ch 3
1, 2
018
com
prise
s ex
pend
iture
for t
he p
lant
and
bui
ldin
g in
the
cour
se o
f con
stru
ctio
n.
Not
es to
Sta
ndal
one
Fina
ncia
l Sta
tem
ents
for th
e ye
ar e
nded
Mar
ch 3
1, 2
019
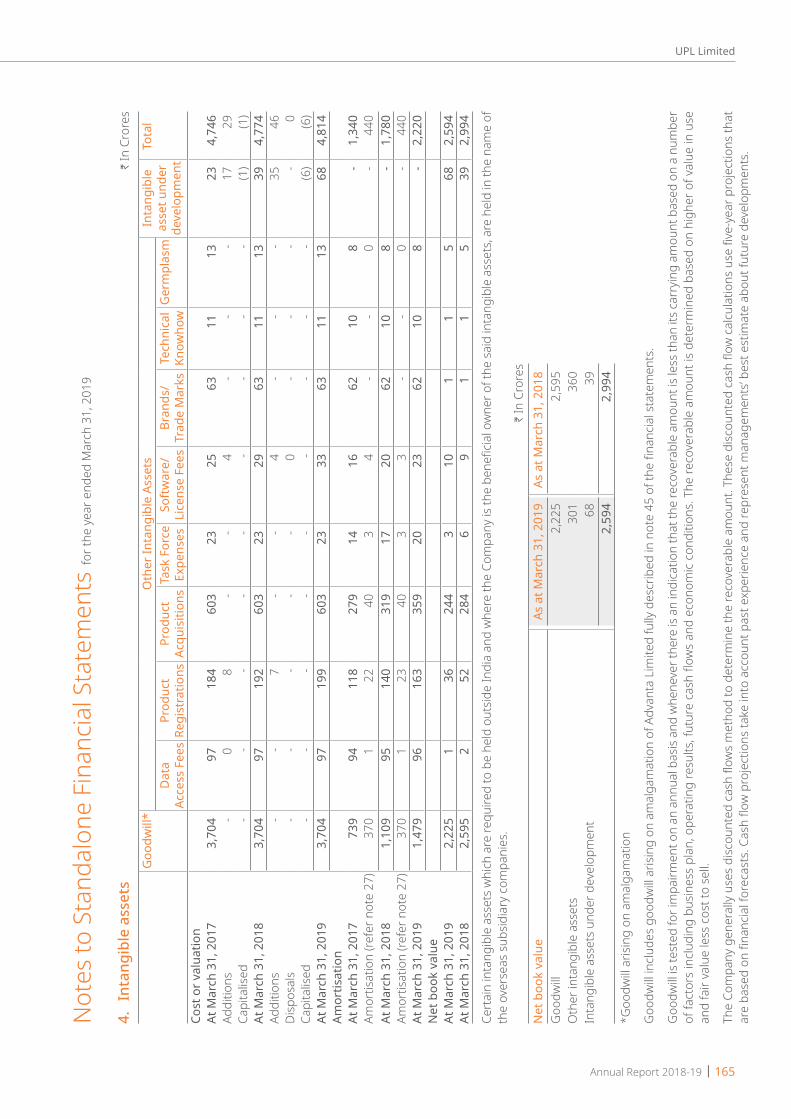
Annual Report 2018-19 | 165
UPL Limited
4. I
ntan
gibl
e as
sets
H In
Cro
res
Goo
dwill
*O
ther
Inta
ngib
le A
sset
sIn
tang
ible
as
set u
nder
de
velo
pmen
t
Tota
lD
ata
Acce
ss F
ees
Prod
uct
Regi
stra
tions
Prod
uct
Acqu
isiti
ons
Task
For
ce
Expe
nses
Softw
are/
Li
cens
e Fe
esBr
ands
/ Tr
ade
Mar
ksTe
chni
cal
Know
how
Ger
mpl
asm
Cost
or v
alua
tion
At M
arch
31,
201
73,
704
9718
460
323
2563
1113
234,
746
Addi
tions
-0
8-
-4
--
-17
29Ca
pita
lised
--
--
--
--
-(1
)(1
)At
Mar
ch 3
1, 2
018
3,70
497
192
603
2329
6311
1339
4,77
4Ad
ditio
ns-
-7
--
4-
--
3546
Disp
osal
s-
--
--
0-
--
-0
Capi
talis
ed-
--
--
--
--
(6)
(6)
At M
arch
31,
201
93,
704
9719
960
323
3363
1113
684,
814
Amor
tisat
ion
At M
arch
31,
201
773
994
118
279
1416
6210
8-
1,34
0Am
ortis
atio
n (re
fer n
ote
27)
370
122
403
4-
-0
-44
0At
Mar
ch 3
1, 2
018
1,10
995
140
319
1720
6210
8-
1,78
0Am
ortis
atio
n (re
fer n
ote
27)
370
123
403
3-
-0
-44
0At
Mar
ch 3
1, 2
019
1,47
996
163
359
2023
6210
8-
2,22
0N
et b
ook
valu
eAt
Mar
ch 3
1, 2
019
2,22
51
3624
43
101
15
682,
594
At M
arch
31,
201
82,
595
252
284
69
11
539
2,99
4
Cert
ain
inta
ngib
le a
sset
s w
hich
are
requ
ired
to b
e he
ld o
utsid
e In
dia
and
whe
re th
e Co
mpa
ny is
the
bene
ficia
l ow
ner o
f the
sai
d in
tang
ible
ass
ets,
are
held
in th
e na
me
of
the
over
seas
sub
sidia
ry c
ompa
nies
.
H In
Cro
res
Net
boo
k va
lue
As a
t Mar
ch 3
1, 2
019
As a
t Mar
ch 3
1, 2
018
Goo
dwill
2,22
5 2
,595
O
ther
inta
ngib
le a
sset
s30
1 3
60
Inta
ngib
le a
sset
s un
der d
evel
opm
ent
68 3
9 2,
594
2,9
94
*Goo
dwill
arisi
ng o
n am
alga
mat
ion
Goo
dwill
inclu
des
good
will
arisi
ng o
n am
alga
mat
ion
of A
dvan
ta L
imite
d fu
lly d
escr
ibed
in n
ote
45 o
f the
fina
ncia
l sta
tem
ents
.
Goo
dwill
is te
sted
for i
mpa
irmen
t on
an a
nnua
l bas
is an
d w
hene
ver t
here
is a
n in
dica
tion
that
the
reco
vera
ble
amou
nt is
less
than
its c
arry
ing
amou
nt b
ased
on
a nu
mbe
r of
fact
ors
inclu
ding
bus
ines
s pl
an, o
pera
ting
resu
lts, f
utur
e ca
sh fl
ows
and
econ
omic
cond
ition
s. Th
e re
cove
rabl
e am
ount
is d
eter
min
ed b
ased
on
high
er o
f val
ue in
use
an
d fa
ir va
lue
less
cos
t to
sell.
The
Com
pany
gen
eral
ly us
es d
iscou
nted
cas
h flo
ws
met
hod
to d
eter
min
e th
e re
cove
rabl
e am
ount
. The
se d
iscou
nted
cas
h flo
w c
alcu
latio
ns u
se fi
ve-y
ear p
roje
ctio
ns th
at
are
base
d on
fina
ncia
l for
ecas
ts. C
ash
flow
pro
ject
ions
take
into
acc
ount
pas
t exp
erie
nce
and
repr
esen
t man
agem
ents
’ bes
t est
imat
e ab
out f
utur
e de
velo
pmen
ts.
Not
es to
Sta
ndal
one
Fina
ncia
l Sta
tem
ents
for th
e ye
ar e
nded
Mar
ch 3
1, 2
019
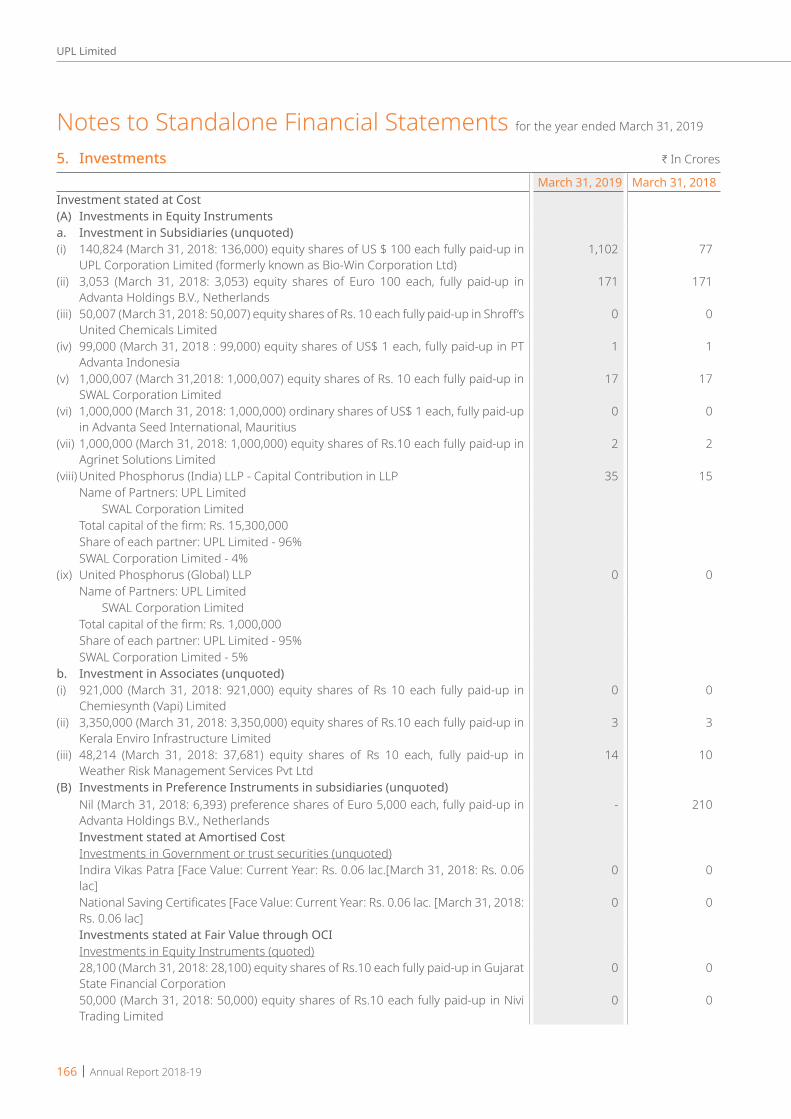
166 | Annual Report 2018-19
UPL Limited
5. Investments H In Crores
March 31, 2019 March 31, 2018Investment stated at Cost(A) Investments in Equity Instrumentsa. Investment in Subsidiaries (unquoted)(i) 140,824 (March 31, 2018: 136,000) equity shares of US $ 100 each fully paid-up in
UPL Corporation Limited (formerly known as Bio-Win Corporation Ltd)1,102 77
(ii) 3,053 (March 31, 2018: 3,053) equity shares of Euro 100 each, fully paid-up in Advanta Holdings B.V., Netherlands
171 171
(iii) 50,007 (March 31, 2018: 50,007) equity shares of Rs. 10 each fully paid-up in Shroff’s United Chemicals Limited
0 0
(iv) 99,000 (March 31, 2018 : 99,000) equity shares of US$ 1 each, fully paid-up in PT Advanta Indonesia
1 1
(v) 1,000,007 (March 31,2018: 1,000,007) equity shares of Rs. 10 each fully paid-up in SWAL Corporation Limited
17 17
(vi) 1,000,000 (March 31, 2018: 1,000,000) ordinary shares of US$ 1 each, fully paid-up in Advanta Seed International, Mauritius
0 0
(vii) 1,000,000 (March 31, 2018: 1,000,000) equity shares of Rs.10 each fully paid-up in Agrinet Solutions Limited
2 2
(viii) United Phosphorus (India) LLP - Capital Contribution in LLP 35 15 Name of Partners: UPL Limited SWAL Corporation Limited Total capital of the firm: Rs. 15,300,000 Share of each partner: UPL Limited - 96% SWAL Corporation Limited - 4%(ix) United Phosphorus (Global) LLP 0 0 Name of Partners: UPL Limited SWAL Corporation Limited Total capital of the firm: Rs. 1,000,000 Share of each partner: UPL Limited - 95% SWAL Corporation Limited - 5%b. Investment in Associates (unquoted)(i) 921,000 (March 31, 2018: 921,000) equity shares of Rs 10 each fully paid-up in
Chemiesynth (Vapi) Limited0 0
(ii) 3,350,000 (March 31, 2018: 3,350,000) equity shares of Rs.10 each fully paid-up in Kerala Enviro Infrastructure Limited
3 3
(iii) 48,214 (March 31, 2018: 37,681) equity shares of Rs 10 each, fully paid-up in Weather Risk Management Services Pvt Ltd
14 10
(B) Investments in Preference Instruments in subsidiaries (unquoted) Nil (March 31, 2018: 6,393) preference shares of Euro 5,000 each, fully paid-up in
Advanta Holdings B.V., Netherlands- 210
Investment stated at Amortised Cost Investments in Government or trust securities (unquoted) Indira Vikas Patra [Face Value: Current Year: Rs. 0.06 lac.[March 31, 2018: Rs. 0.06
lac]0 0
National Saving Certificates [Face Value: Current Year: Rs. 0.06 lac. [March 31, 2018: Rs. 0.06 lac]
0 0
Investments stated at Fair Value through OCI Investments in Equity Instruments (quoted) 28,100 (March 31, 2018: 28,100) equity shares of Rs.10 each fully paid-up in Gujarat
State Financial Corporation0 0
50,000 (March 31, 2018: 50,000) equity shares of Rs.10 each fully paid-up in Nivi Trading Limited
0 0
Notes to Standalone Financial Statements for the year ended March 31, 2019

Annual Report 2018-19 | 167
UPL Limited
March 31, 2019 March 31, 2018 41,150 (March 31, 2018: 41,150) equity shares of Rs.10 each fully paid-up in
Transpek Industry Limited5 5
5,307 (March 31, 2018: 5,307) equity shares of Rs.10 each fully paid-up in IDFC Limited
0 0
5,307 (March 31, 2018: 5,307) equity shares of Rs.10 each fully paid-up in IDFC Bank Limited.
0 0
17,990 (March 31, 2018: 17,990) equity shares of Rs.2 each fully paid-up in Bank of Baroda Limited
0 0
Investments stated at Fair Value through profit and loss a. Investments in Optionally Convertible Bonds (unquoted) 83 76 6,855 (March 31, 2018: 6,855) Optionally Convertible Bonds of Rs.1,00,000
each in Tatva Global Environment Private Limited b. Investment in Others (unquoted) 10,000 (March 31, 2018:10,000) equity shares of Rs.10 each fully paid-up in
Janakalyan Sahakari Bank Limited0 0
1,000,000 (March 31, 2018: 1,000,000) equity shares of Rs.10 each fully paid-up in Uniphos International Limited
0 0
45,000 (March 31, 2018: 45,000) equity shares of Rs.10 each fully paid-up in Bloom Packaging Private Limited
1 1
19,025 (March 31, 2018: 19,025) equity shares of Rs.10 each fully paid-up in Bench Bio Private Limited
1 1
240,000 (March 31, 2018: 240,000) equity shares of Rs. 10 each fully paid-up in UPL Investment Private Limited
2 2
57 [March 31, 2018: 57] equity shares of 1 Rand each fully paid-up in Cropserve [PTY] Limited
0 0
3,757,570 [March 31, 2018: 3,435,070] equity shares of Rs.10 each fully paid-up in Narmada Clean Tech Limited
3 3
Total Non-Current Investments 1,441 594Aggregate book value and market value of quoted investments 5 5 Aggregate amount of unquoted investments 1,436 589 Impairment of investments - - Impairment of InvestmentsInvestment at fair value through profit and loss (fully paid) reflect investment in debt instruments and unquoted equity securities. Refer note 39 for determination of their fair values.
Investment at fair value through OCI (fully paid) reflect investment in quoted equity securities. Refer note 39 for determination of their fair values.
Extent of equity interest in subsidiaries and associatesName and country of incorporation % of equity interest
March 31, 2019 March 31, 2018a. Subsidiaries UPL Corporation Limited (formerly known as Bio-Win Corporation Ltd), Mauritius 78% 100% Advanta Holdings B.V., Netherlands 100% 100% PT Advanta Indonesia 100% 100% SWAL Corporation Limited, India 100% 100% Advanta Seed International, Mauritius 100% 100% Agrinet Solutions Limited, India 50% 50% Shroffs United Chemicals Limited, India 100% 100% United Phosphorus (India) LLP 96% 95% United Phosphorus (Global) LLP, India 95% 95%
H In Crores
Notes to Standalone Financial Statements for the year ended March 31, 2019
5. Investments (contd.)
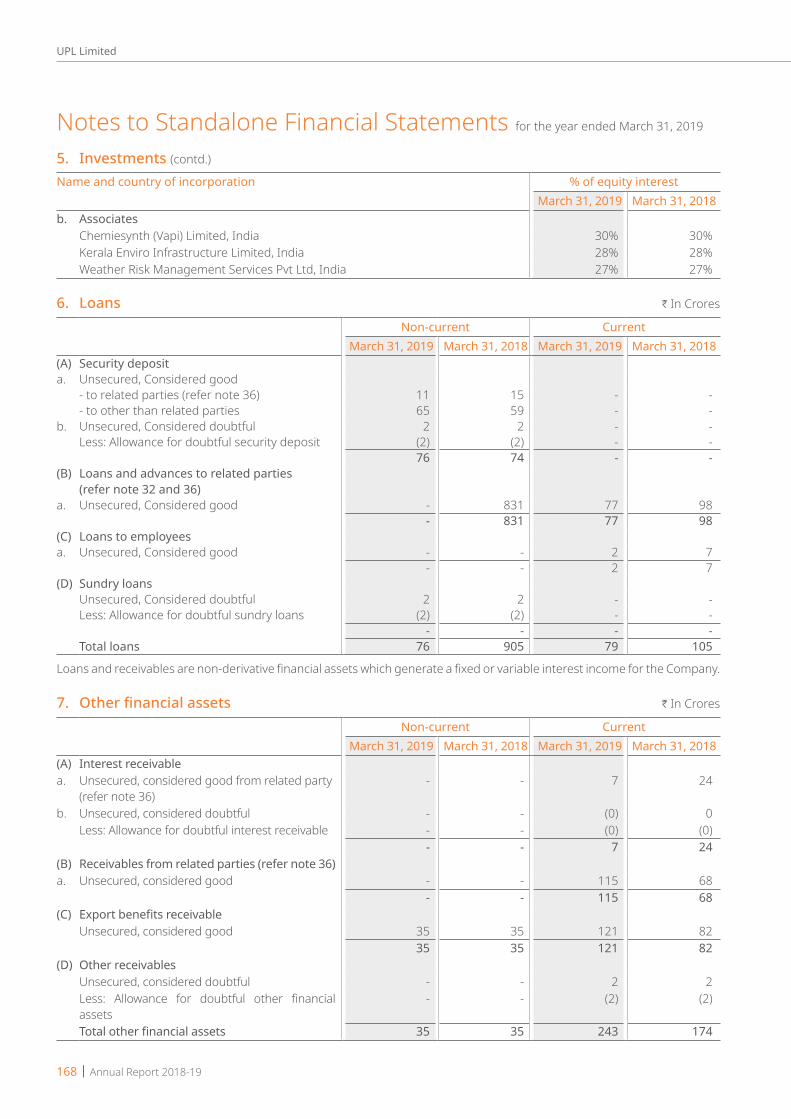
168 | Annual Report 2018-19
UPL Limited
Name and country of incorporation % of equity interestMarch 31, 2019 March 31, 2018
b. Associates Chemiesynth (Vapi) Limited, India 30% 30% Kerala Enviro Infrastructure Limited, India 28% 28% Weather Risk Management Services Pvt Ltd, India 27% 27%
6. Loans H In Crores
Non-current CurrentMarch 31, 2019 March 31, 2018 March 31, 2019 March 31, 2018
(A) Security deposita. Unsecured, Considered good
- to related parties (refer note 36) 11 15 - -- to other than related parties 65 59 - -
b. Unsecured, Considered doubtful 2 2 - -Less: Allowance for doubtful security deposit (2) (2) - -
76 74 - -(B) Loans and advances to related parties
(refer note 32 and 36)a. Unsecured, Considered good - 831 77 98
- 831 77 98(C) Loans to employeesa. Unsecured, Considered good - - 2 7
- - 2 7(D) Sundry loans
Unsecured, Considered doubtful 2 2 - -Less: Allowance for doubtful sundry loans (2) (2) - -
- - - -Total loans 76 905 79 105
Loans and receivables are non-derivative financial assets which generate a fixed or variable interest income for the Company.
7. Otherfinancialassets H In Crores
Non-current CurrentMarch 31, 2019 March 31, 2018 March 31, 2019 March 31, 2018
(A) Interest receivablea. Unsecured, considered good from related party
(refer note 36)- - 7 24
b. Unsecured, considered doubtful - - (0) 0Less: Allowance for doubtful interest receivable - - (0) (0)
- - 7 24(B) Receivables from related parties (refer note 36)a. Unsecured, considered good - - 115 68
- - 115 68(C) Export benefits receivable
Unsecured, considered good 35 35 121 8235 35 121 82
(D) Other receivablesUnsecured, considered doubtful - - 2 2Less: Allowance for doubtful other financial assets
- - (2) (2)
Total other financial assets 35 35 243 174
Notes to Standalone Financial Statements for the year ended March 31, 2019
5. Investments (contd.)

Annual Report 2018-19 | 169
UPL Limited
8. Other assets H In Crores
Non-current CurrentMarch 31, 2019 March 31, 2018 March 31, 2019 March 31, 2018
(a) Capital advances 22 66 - -(b) Statutory receivables 159 158 1,015 606(c) Prepaid expense - - 35 46(d) Other advances - - 81 35
Total other assets 181 224 1,131 687
9. Inventories (Valued at lower of cost and net realisable value) H In Crores
March 31, 2019 March 31, 2018a. Raw materials and components [includes goods in transit: Rs. 23 crores
(March 31, 2018: Rs. 22 crores)]760 519
b. Work-in-progress 175 147c. Finished goods 769 638d. Traded goods [includes goods in transit: Rs. 8 crores (March 31, 2018: Rs. 3 crores)] 80 80e. Store and spares [including fuel] 48 40f. Packing material 30 25g. By products 4 3
1,866 1,452
Amount of write down of inventories to net realisable value and other provisions / losses recognised in the statement of profit and loss as an expense is Rs. 6 crores (March 31, 2018: Rs 21 crores)
10. Trade receivables H In Crores
March 31, 2019 March 31, 2018Unsecured, Considered good - from related parties 1,028 1,052 - from others 1,705 965Unsecured, Considered doubtful - from others 108 77Less: Allowance for doubtful trade receivable (108) (77)Total trade receivables 2,733 2,017
No trade or other receivables are due from directors or other officers of the Company either severally or jointly with any other person. There are no trade or other receivables which are due from firms or private companies respectively in which any director is a partner, a director or a member.
For terms and conditions relating to related party receivables, refer note 36.
Certain trade receivables are interest bearing.Trade receivables are generally on terms of 45 to 270 days.
The Company has entered into an agreement to sell and assign its receivables to certain banks. In connection therewith, the Company sells its receivables to these banks on a non recourse basis. When the Company sells its receivables to these banks the transfer is treated as a “true sale” for both legal and financial reporting purposes. As such, the assets once transferred to these banks are not reflected on the balance sheet date of the Company. As at March 31, 2019, the Company sold receivables which have been derecognised amounting to Rs. Nil (March 31, 2018: Rs. 48 crores). For explanations on the Company’s credit risk management processes, refer note 41
11. Cash and cash equivalents H In Crores
March 31, 2019 March 31, 2018Balances with banks - Current accounts 77 93 Cash on hand 0 0 Total cash and cash equivalents 77 93
Notes to Standalone Financial Statements for the year ended March 31, 2019

170 | Annual Report 2018-19
UPL Limited
11A. Other bank balances H In Crores
March 31, 2019 March 31, 2018- Unclaimed dividend accounts 8 7- Margin money deposit ** 14 14- Deposits with original maturity for more than 3 months but less than 12 months 1 12Total other bank balances 23 33
** Margin money deposits given as security against bank guarantees
For the purpose of the statement of cash flows, cash and cash equivalents comprise the following: H In Crores
March 31, 2019 March 31, 2018Balances with banks:- Current accounts 77 93Cash on hand 0 0Total cash and cash equivalents 77 93
12. Share CapitalAuthorised share capital
Equity shares of INR 2 eachNos. INR Crores
As at April1, 2017 1,23,75,00,000 248Increase/(decrease) during the year - -At March 31, 2018 1,23,75,00,000 248Increase/(decrease) during the year - -At March 31, 2019 1,23,75,00,000 248
Issued equity capitalEquity shares of Rs. 2 each issued, subscribed and fully paid
Equity shares of INR 2 eachNos. INR Crores
As at April1, 2017 50,70,17,118 101Increase/(decrease) during the year due toConversion of OCPS and CCPS 22,24,287 1ESOP Allotments 91,676 0At March 31, 2018 50,93,33,081 102Increase/(decrease) during the year due toESOP Allotments 9,589 0At March 31, 2019 50,93,42,670 102
Terms/ rights attached to equity sharesThe Company has one class of equity shares having par value of Rs. 2 per share. Each holder of equity shares is entitled to one vote per share. The Company declares and pays dividends in Indian rupees. The dividend proposed by the Board of Directors is subject to the approval of the shareholders in the ensuing Annual General Meeting.
In the event of liquidation of the Company, the holders of equity shares will be entitled to receive the remaining assets of the Company, after distribution of all preferential amounts. The distribution will be in proportion to the number of equity shares held by the shareholders.
During the year ended March, 2019, the amount of per share dividend proposed as distributions to equity shareholders is Rs. 8 (March, 2018: Rs. 8)
The Board has recommended issue of bonus shares in the ratio 1:2 (one bonus equity share of Rs. 2 each for every two fully paid-up equity shares held), subject to the approval of the shareholders of the company.
Notes to Standalone Financial Statements for the year ended March 31, 2019
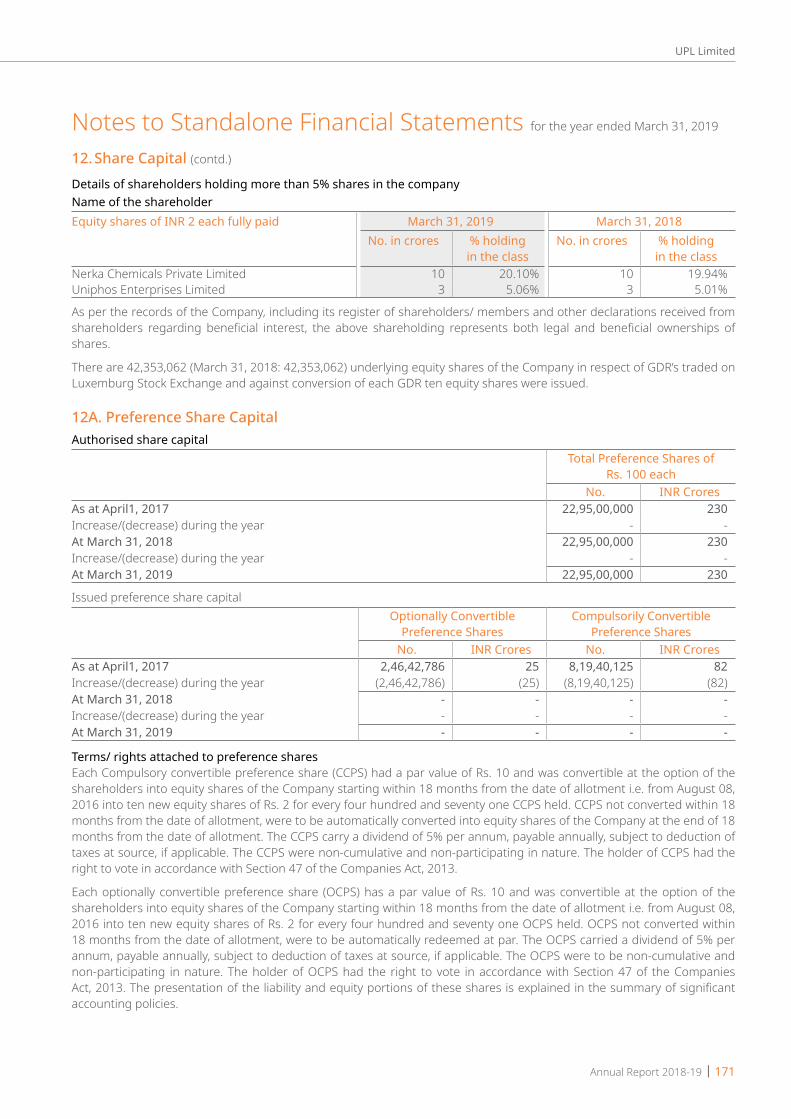
Annual Report 2018-19 | 171
UPL Limited
Details of shareholders holding more than 5% shares in the companyName of the shareholderEquity shares of INR 2 each fully paid March 31, 2019 March 31, 2018
No. in crores % holding in the class
No. in crores % holding in the class
Nerka Chemicals Private Limited 10 20.10% 10 19.94%Uniphos Enterprises Limited 3 5.06% 3 5.01%
As per the records of the Company, including its register of shareholders/ members and other declarations received from shareholders regarding beneficial interest, the above shareholding represents both legal and beneficial ownerships of shares.
There are 42,353,062 (March 31, 2018: 42,353,062) underlying equity shares of the Company in respect of GDR’s traded on Luxemburg Stock Exchange and against conversion of each GDR ten equity shares were issued.
12A. Preference Share CapitalAuthorised share capital
Total Preference Shares of Rs. 100 each
No. INR Crores As at April1, 2017 22,95,00,000 230Increase/(decrease) during the year - -At March 31, 2018 22,95,00,000 230Increase/(decrease) during the year - -At March 31, 2019 22,95,00,000 230
Issued preference share capitalOptionally Convertible
Preference SharesCompulsorily Convertible
Preference Shares No. INR Crores No. INR Crores
As at April1, 2017 2,46,42,786 25 8,19,40,125 82Increase/(decrease) during the year (2,46,42,786) (25) (8,19,40,125) (82)At March 31, 2018 - - - -Increase/(decrease) during the year - - - -At March 31, 2019 - - - -
Terms/ rights attached to preference sharesEach Compulsory convertible preference share (CCPS) had a par value of Rs. 10 and was convertible at the option of the shareholders into equity shares of the Company starting within 18 months from the date of allotment i.e. from August 08, 2016 into ten new equity shares of Rs. 2 for every four hundred and seventy one CCPS held. CCPS not converted within 18 months from the date of allotment, were to be automatically converted into equity shares of the Company at the end of 18 months from the date of allotment. The CCPS carry a dividend of 5% per annum, payable annually, subject to deduction of taxes at source, if applicable. The CCPS were non-cumulative and non-participating in nature. The holder of CCPS had the right to vote in accordance with Section 47 of the Companies Act, 2013.
Each optionally convertible preference share (OCPS) has a par value of Rs. 10 and was convertible at the option of the shareholders into equity shares of the Company starting within 18 months from the date of allotment i.e. from August 08, 2016 into ten new equity shares of Rs. 2 for every four hundred and seventy one OCPS held. OCPS not converted within 18 months from the date of allotment, were to be automatically redeemed at par. The OCPS carried a dividend of 5% per annum, payable annually, subject to deduction of taxes at source, if applicable. The OCPS were to be non-cumulative and non-participating in nature. The holder of OCPS had the right to vote in accordance with Section 47 of the Companies Act, 2013. The presentation of the liability and equity portions of these shares is explained in the summary of significant accounting policies.
Notes to Standalone Financial Statements for the year ended March 31, 2019
12. Share Capital (contd.)

172 | Annual Report 2018-19
UPL Limited
12B. Distribution made & proposed March 31, 2019 March 31, 2018
Cash dividends on equity shares declared and paid:Final dividend for the year ended 31 March 2018: Rs. 8 per share (31 March 2017: Rs. 7 per share)
407 357
Proposed dividends on equity shares:Proposed cash dividend for the year ended 31 March 2019: Rs. 8 per share (March 31, 2018: Rs. 8 per share)
407 407
Proposed dividend on equity shares is subject to approval at the annual general meeting and is not recognised as a liability as at the year end.
12C. Shares reserved for issue under optionsFor details of shares reserved for issue under the Employee Stock Option Plan (ESOP) of the Company (refer note 34)
13. Other equityi) Securities Premium
INR Crores As at April1, 2017 4,498 Increase/(decrease) during the year due of conversion of OCPS,CCPS and ESOP allotments 109 At March 31, 2018 4,607 Increase/(decrease) during the year - At March 31, 2019 4,607
ii) Retained EarningsINR Crores
As at April1, 2017 968Add: Profit for the year 548Add: Re-measurement gains (losses) on defined benefit plans 0Less: Appropriations:Dividend on Equity Shares (357)Transfer to debenture redemption reserve (14)Transfer to capital redemption reserve (2)At March 31, 2018 1,143Add: Profit for the year 405Add: Re-measurement gains (losses) on defined benefit plans 3Add: Transfer from debenture redemption reserve 1Less: Appropriations:Dividend on Equity Shares (407)At March 31, 2019 1,145
iii) Other Reserves Capital Redemption Reserve
INR Crores As at April1, 2017 36Increase/(decrease) during the year due of conversion of OCPS and CCPS 2At March 31, 2018 38Increase/(decrease) during the year -At March 31, 2019 38
Notes to Standalone Financial Statements for the year ended March 31, 2019
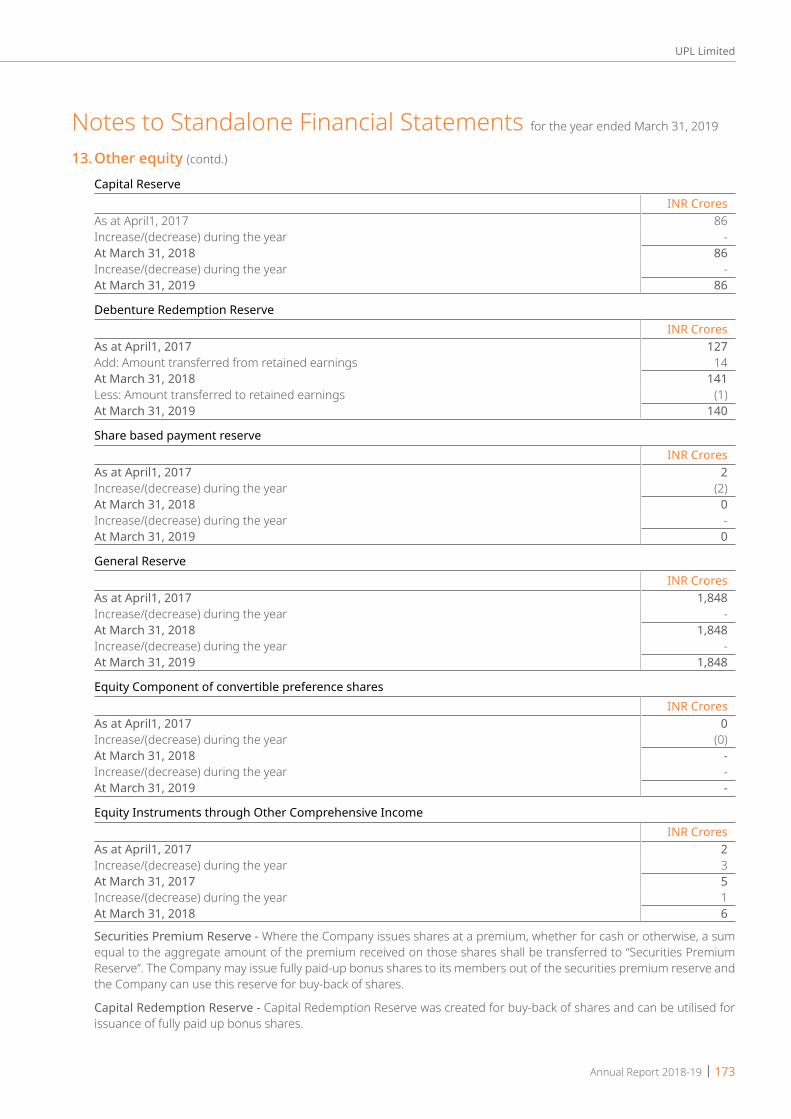
Annual Report 2018-19 | 173
UPL Limited
Capital Reserve INR Crores
As at April1, 2017 86Increase/(decrease) during the year -At March 31, 2018 86Increase/(decrease) during the year -At March 31, 2019 86
Debenture Redemption Reserve INR Crores
As at April1, 2017 127Add: Amount transferred from retained earnings 14At March 31, 2018 141Less: Amount transferred to retained earnings (1)At March 31, 2019 140
Share based payment reserve INR Crores
As at April1, 2017 2 Increase/(decrease) during the year (2)At March 31, 2018 0 Increase/(decrease) during the year - At March 31, 2019 0
General Reserve INR Crores
As at April1, 2017 1,848 Increase/(decrease) during the year - At March 31, 2018 1,848 Increase/(decrease) during the year - At March 31, 2019 1,848
Equity Component of convertible preference shares INR Crores
As at April1, 2017 0 Increase/(decrease) during the year (0)At March 31, 2018 - Increase/(decrease) during the year - At March 31, 2019 -
Equity Instruments through Other Comprehensive Income INR Crores
As at April1, 2017 2 Increase/(decrease) during the year 3 At March 31, 2017 5 Increase/(decrease) during the year 1 At March 31, 2018 6
Securities Premium Reserve - Where the Company issues shares at a premium, whether for cash or otherwise, a sum equal to the aggregate amount of the premium received on those shares shall be transferred to “Securities Premium Reserve”. The Company may issue fully paid-up bonus shares to its members out of the securities premium reserve and the Company can use this reserve for buy-back of shares.
Capital Redemption Reserve - Capital Redemption Reserve was created for buy-back of shares and can be utilised for issuance of fully paid up bonus shares.
Notes to Standalone Financial Statements for the year ended March 31, 2019
13. Other equity (contd.)

174 | Annual Report 2018-19
UPL Limited
Capital Reserve - The Company recognizes profit or loss on purchase, sale, issue or cancellation of the Company’s own equity instruments to capital reserve.
Debenture Redemption Reserve (DRR)- The Company has issued redeemable non-convertible debentures. Accordingly, the Companies (Share capital and Debentures) Rules, 2014 (as amended), require the company to create DRR out of profits of the Company available for payment of dividend. DRR is required to be created for an amount which is equal to 25% of the value of debentures issued.
Share Based Payment Reserve - The Company has an employee stock option scheme under which the option to subscribe for the companies share have been granted to the key employees and directors. The share-based payment reserve is used to recognize the value of equity-settled share-based payments provided to the key employees as part of their remuneration. Refer to note 34 for further details of the scheme.
General Reserve - General Reserve is created out of the profits earned by the Company by way of transfer from surplus in the statement of profit and loss. The Company can use this reserve for payment of dividend subject to compliance with declaration of dividend out of reserve rules and issue of fully paid-up and not paid-up bonus shares.
Other reserves H In CroresMarch 31, 2019 March 31, 2018
Capital Redemption Reserve 38 38 Capital Reserve 86 86 Debenture Redemption Reserve 140 141 Share based payment reserve 0 0 General Reserve 1,848 1,848 Equity Component of convertible preference shares - - Equity Instruments through Other Comprehensive Income 6 5 Total other reserves 2,118 2,118
14. Borrowings Non-current Borrowings H In Crores
Effective interest rate
Maturity March 31, 2019 March 31, 2018
DebenturesUnsecured Redeemable non convertible debentures (NCDs) (Refer note a below)
10.53% to 10.85%
2019-2026 458 682
Current maturities of Non- current Debentures 273 127Total Non-current Borrowings 731 809Less: Amount clubbed under “other current financial liabilities” (refer note 15)
(273) (127)
Net Non-current Borrowings 458 682
Aggregate secured loans (non-current) - - Aggregate unsecured loans (non-current) 458 682
Current Borrowings H In CroresMaturity March 31, 2019 March 31, 2018
Loans repayable On demandCash credit, packing credit and working capital demand loan accounts from Banks (Refer note b below) - Secured On demand 0 65 - Unsecured (6 months LIBOR+48 to 85bps,1month GSEC+5bps) On demand 507 248Unsecured Commercial papers from Banks and others (Refer note c below)
74-90 days 400 -
Total current Borrowings 907 313
Aggregate secured loans (current) 0 65 Aggregate unsecured loans (current) 907 248
Notes to Standalone Financial Statements for the year ended March 31, 2019
13. Other equity (contd.)
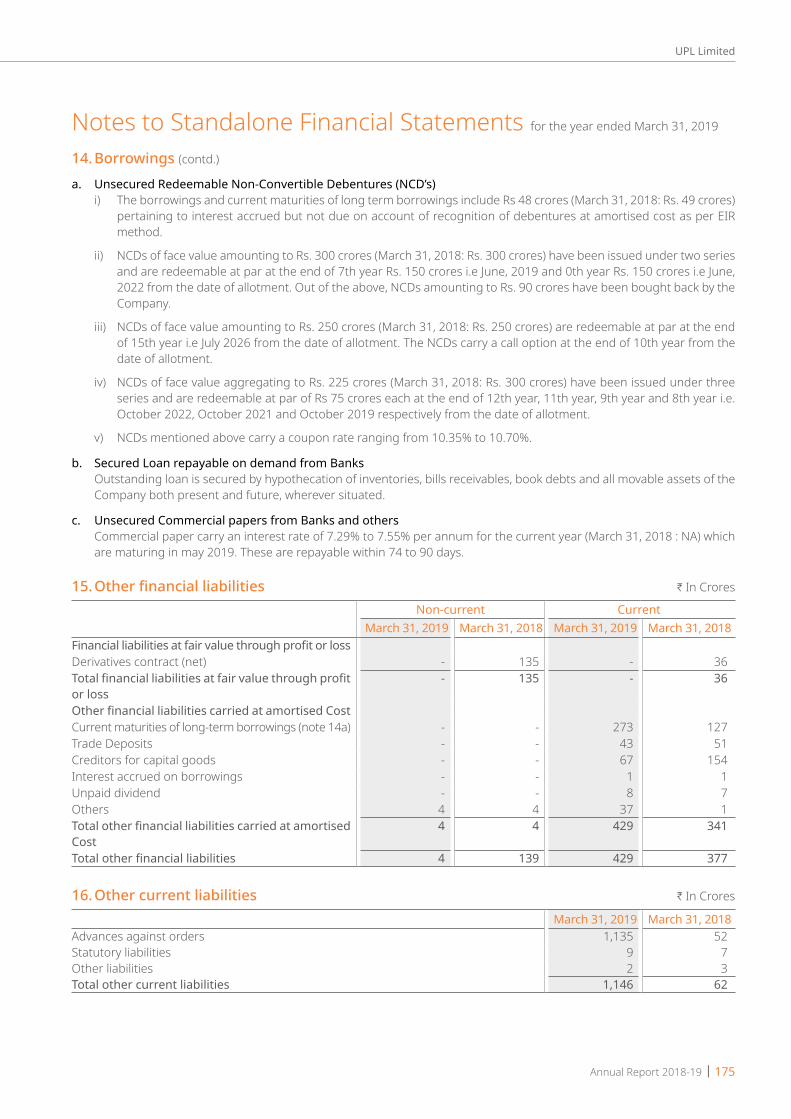
Annual Report 2018-19 | 175
UPL Limited
a. Unsecured Redeemable Non-Convertible Debentures (NCD’s) i) The borrowings and current maturities of long term borrowings include Rs 48 crores (March 31, 2018: Rs. 49 crores)
pertaining to interest accrued but not due on account of recognition of debentures at amortised cost as per EIR method.
ii) NCDs of face value amounting to Rs. 300 crores (March 31, 2018: Rs. 300 crores) have been issued under two series and are redeemable at par at the end of 7th year Rs. 150 crores i.e June, 2019 and 0th year Rs. 150 crores i.e June, 2022 from the date of allotment. Out of the above, NCDs amounting to Rs. 90 crores have been bought back by the Company.
iii) NCDs of face value amounting to Rs. 250 crores (March 31, 2018: Rs. 250 crores) are redeemable at par at the end of 15th year i.e July 2026 from the date of allotment. The NCDs carry a call option at the end of 10th year from the date of allotment.
iv) NCDs of face value aggregating to Rs. 225 crores (March 31, 2018: Rs. 300 crores) have been issued under three series and are redeemable at par of Rs 75 crores each at the end of 12th year, 11th year, 9th year and 8th year i.e. October 2022, October 2021 and October 2019 respectively from the date of allotment.
v) NCDs mentioned above carry a coupon rate ranging from 10.35% to 10.70%.
b. Secured Loan repayable on demand from Banks Outstanding loan is secured by hypothecation of inventories, bills receivables, book debts and all movable assets of the
Company both present and future, wherever situated.
c. Unsecured Commercial papers from Banks and others Commercial paper carry an interest rate of 7.29% to 7.55% per annum for the current year (March 31, 2018 : NA) which
are maturing in may 2019. These are repayable within 74 to 90 days.
15.Otherfinancialliabilities H In Crores
Non-current CurrentMarch 31, 2019 March 31, 2018 March 31, 2019 March 31, 2018
Financial liabilities at fair value through profit or lossDerivatives contract (net) - 135 - 36Total financial liabilities at fair value through profit or loss
- 135 - 36
Other financial liabilities carried at amortised CostCurrent maturities of long-term borrowings (note 14a) - - 273 127Trade Deposits - - 43 51Creditors for capital goods - - 67 154Interest accrued on borrowings - - 1 1Unpaid dividend - - 8 7Others 4 4 37 1Total other financial liabilities carried at amortised Cost
4 4 429 341
Total other financial liabilities 4 139 429 377
16. Other current liabilities H In Crores
March 31, 2019 March 31, 2018Advances against orders 1,135 52Statutory liabilities 9 7Other liabilities 2 3Total other current liabilities 1,146 62
Notes to Standalone Financial Statements for the year ended March 31, 2019
14. Borrowings (contd.)

176 | Annual Report 2018-19
UPL Limited
17. Trade payablesOutstanding dues of micro and small enterprises H In Crores
CurrentMarch 31, 2019 March 31, 2018
Trade payables 26 17 26 17
18. Trade payablesOutstanding dues of micro and small enterprises H In Crores
CurrentMarch 31, 2019 March 31, 2018
- Outstanding dues of other than micro and small enterprises 2,791 2,336 2,792 2,336
Terms and conditions of the above financial liabilities:Trade payables are non-interest bearing and are normally settled on 90-360 days termsFor explanations on the Company’s credit risk management processes, refer note 41
19. Income taxesa) The major components of income tax expense for the year are as under: i) Income tax expenses recognised in the statement of profit and loss: H In Crores
March 31, 2019 March 31, 2018Current tax:In respect of current year 83 180 Adjustments of tax relating to earlier years (3) (83)Deferred tax:In respect of current year 1 (69)
81 28
ii) Income tax expenses recognised in OCI: H In CroresMarch 31, 2019 March 31, 2018
Deferred tax expenses on remesurement of defined benefit plan 2 0 Deferred tax expenses on remesurement of equity instruments through other comprehensive income
0 0
2 0
b) Reconciliation of tax expense and the accounting profit for the year is as under: H In CroresMarch 31, 2019 March 31, 2018
Accounting profit before income tax 485 576Statutory income tax rate of 34.944% (March 31, 2018: 34.608%) 170 199Dividend Income from Subsidiary (144) (123)Profit on sale of investment to be taxed saperately (15) -Additional deduction on expenditure on Research & Development (11) (11)Amortisation of goodwill in books considered as not deductible in provision for tax 128 128
Agricultural Income exempt from tax (33) (19)MAT credit of earlier years* - (63)Others (11) 0
84 111Adjustments of tax relating to earlier years* (3) (83)Income tax expense reported in the statement of profit and loss 81 28
* Pursuant to the completion of assessments for the past years, the Company has written back excess provision of tax of Rs. 3 crores (March 2018:Rs 83 crores) and recognised minimum alternate tax credit entitlement of Rs Nil (March 2018:Rs 63 crores) for the year ended March 31, 2019
Notes to Standalone Financial Statements for the year ended March 31, 2019

Annual Report 2018-19 | 177
UPL Limited
c) Deferred taxThe major components of deferred tax assets/ (liablities) arising on account of temprory difference are as follows: H In Crores
Balance Sheet Statement of profit and lossMarch 31, 2019 March 31, 2018 March 31, 2019 March 31, 2018
Accelerated depreciation for tax purposes (225) (205) 20 16 Debentures carried at amortised cost (1) 1 2 (3)Minimum alternate tax credit 81 63 (18) (63)Provision for doubtful debts and advances 53 42 (11) (10)Gratuity 9 8 (1) (2)Leave encashment 27 24 (3) (2)Unwinding of interest cost of trade payables (13) (3) 10 (4)Others 1 7 6 (2)Net deferred tax assets/(liabilities) (67) (64) - - Deferred tax expense/(income) 3 (69)
Reflected in the balance sheet as follows: H In CroresBalance Sheet
March 31, 2019 March 31, 2018Deferred tax assets 170 144 Deferred tax liabilities: (237) (208)Deferred tax liabilities, net (67) (64)
Reconciliation of deferred tax liabilities (net): H In CroresMarch 31, 2019 March 31, 2018
Opening balance as of 1 April (64) (133)Tax income/(expense) during the year recognised in profit or loss (1) 69 Tax income/(expense) during the year recognised in OCI (2) 0 Tax income/(expense) during the year recognised in Equity - - Closing balance as at 31 March (67) (64)
The Company offsets tax assets and liabilities if and only if it has a legally enforceable right to set off current tax assets and current tax liabilities and the deferred tax assets and deferred tax liabilities relate to income taxes levied by the same tax authority.
Given that the Company does not have any intention to dispose investments in subsidiaries and associates in the forseeable future, deferred tax asset on indexation benefit in relation to such investments has not been recognised. Similarly, the Company does not have any intention to dispose of its free hold and lease hold land in the forseeable future, therefore, deferred tax asset on indexation benefit in relation to these assets has not been recognised.
20. Provisions H In Crores
March 31, 2019 March 31, 2018Net employee defined benefit liabilitiesGratuity (refer note 33) 26 23Leave encashment (refer note below) 77 68OthersDividend (refer note below) - -Total Provisions 103 91
Notes to Standalone Financial Statements for the year ended March 31, 2019
19. Income taxes (contd.)
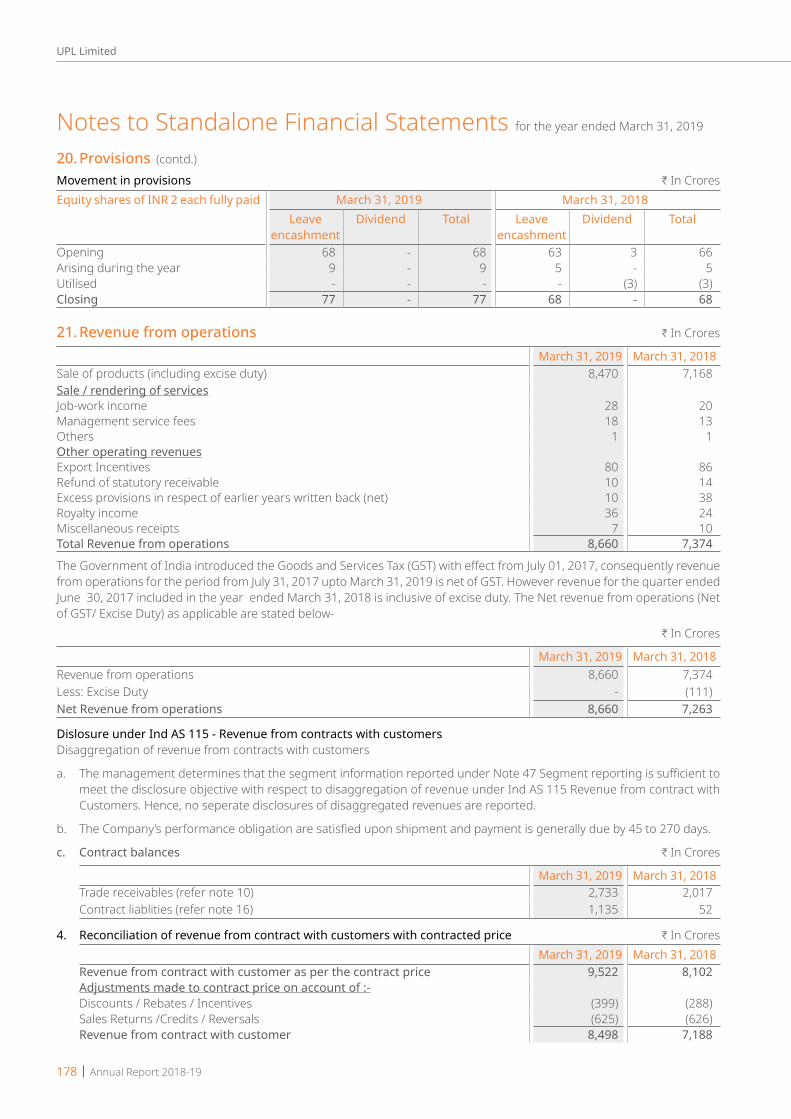
178 | Annual Report 2018-19
UPL Limited
Movement in provisions H In CroresEquity shares of INR 2 each fully paid March 31, 2019 March 31, 2018
Leave encashment
Dividend Total Leave encashment
Dividend Total
Opening 68 - 68 63 3 66Arising during the year 9 - 9 5 - 5Utilised - - - - (3) (3)Closing 77 - 77 68 - 68
21. Revenue from operations H In Crores
March 31, 2019 March 31, 2018Sale of products (including excise duty) 8,470 7,168Sale / rendering of servicesJob-work income 28 20Management service fees 18 13Others 1 1Other operating revenuesExport Incentives 80 86Refund of statutory receivable 10 14Excess provisions in respect of earlier years written back (net) 10 38Royalty income 36 24Miscellaneous receipts 7 10Total Revenue from operations 8,660 7,374
The Government of India introduced the Goods and Services Tax (GST) with effect from July 01, 2017, consequently revenue from operations for the period from July 31, 2017 upto March 31, 2019 is net of GST. However revenue for the quarter ended June 30, 2017 included in the year ended March 31, 2018 is inclusive of excise duty. The Net revenue from operations (Net of GST/ Excise Duty) as applicable are stated below-
H In Crores
March 31, 2019 March 31, 2018Revenue from operations 8,660 7,374 Less: Excise Duty - (111)Net Revenue from operations 8,660 7,263
Dislosure under Ind AS 115 - Revenue from contracts with customersDisaggregation of revenue from contracts with customers
a. The management determines that the segment information reported under Note 47 Segment reporting is sufficient to meet the disclosure objective with respect to disaggregation of revenue under Ind AS 115 Revenue from contract with Customers. Hence, no seperate disclosures of disaggregated revenues are reported.
b. The Company’s performance obligation are satisfied upon shipment and payment is generally due by 45 to 270 days.
c. Contract balances H In Crores
March 31, 2019 March 31, 2018Trade receivables (refer note 10) 2,733 2,017 Contract liablities (refer note 16) 1,135 52
4. Reconciliation of revenue from contract with customers with contracted price H In CroresMarch 31, 2019 March 31, 2018
Revenue from contract with customer as per the contract price 9,522 8,102Adjustments made to contract price on account of :-Discounts / Rebates / Incentives (399) (288)Sales Returns /Credits / Reversals (625) (626)Revenue from contract with customer 8,498 7,188
Notes to Standalone Financial Statements for the year ended March 31, 2019
20. Provisions (contd.)
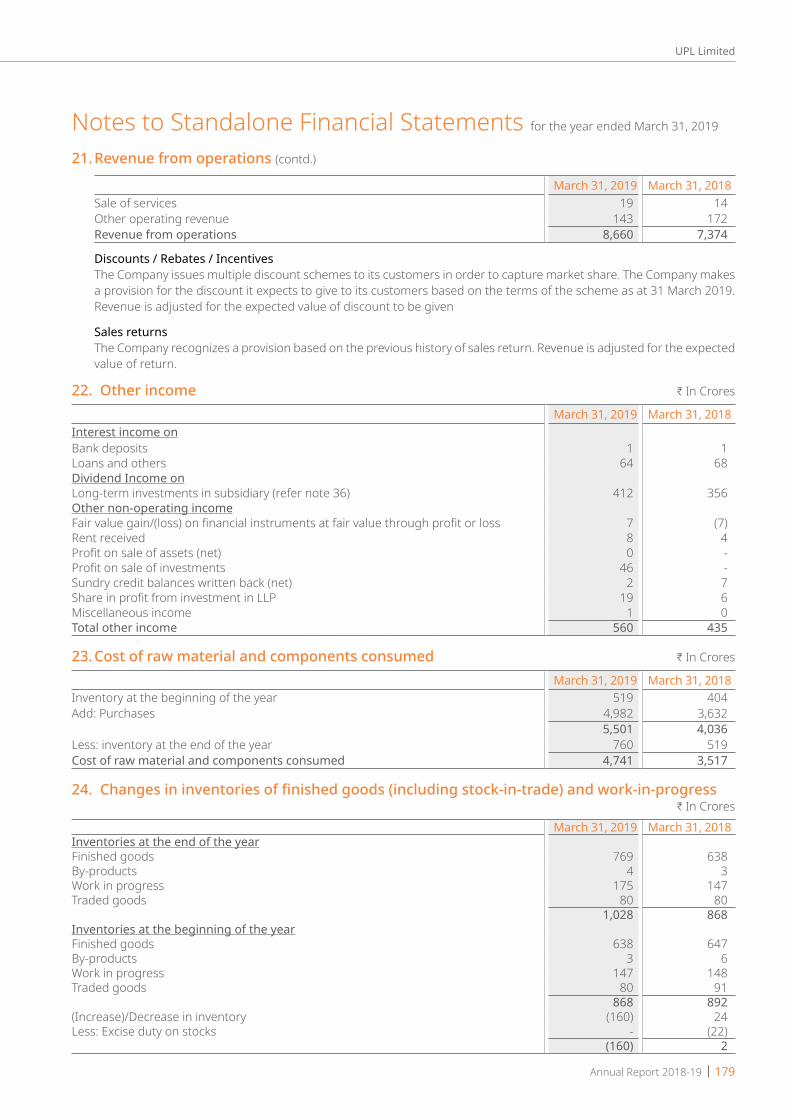
Annual Report 2018-19 | 179
UPL Limited
March 31, 2019 March 31, 2018Sale of services 19 14Other operating revenue 143 172Revenue from operations 8,660 7,374
Discounts / Rebates / Incentives The Company issues multiple discount schemes to its customers in order to capture market share. The Company makes
a provision for the discount it expects to give to its customers based on the terms of the scheme as at 31 March 2019. Revenue is adjusted for the expected value of discount to be given
Sales returns The Company recognizes a provision based on the previous history of sales return. Revenue is adjusted for the expected
value of return.
22. Other income H In Crores
March 31, 2019 March 31, 2018Interest income onBank deposits 1 1Loans and others 64 68Dividend Income onLong-term investments in subsidiary (refer note 36) 412 356Other non-operating incomeFair value gain/(loss) on financial instruments at fair value through profit or loss 7 (7)Rent received 8 4Profit on sale of assets (net) 0 -Profit on sale of investments 46 -Sundry credit balances written back (net) 2 7Share in profit from investment in LLP 19 6Miscellaneous income 1 0 Total other income 560 435
23. Cost of raw material and components consumed H In Crores
March 31, 2019 March 31, 2018Inventory at the beginning of the year 519 404 Add: Purchases 4,982 3,632
5,501 4,036 Less: inventory at the end of the year 760 519 Cost of raw material and components consumed 4,741 3,517
24.Changesininventoriesoffinishedgoods(includingstock-in-trade)andwork-in-progress H In Crores
March 31, 2019 March 31, 2018Inventories at the end of the yearFinished goods 769 638By-products 4 3Work in progress 175 147Traded goods 80 80
1,028 868Inventories at the beginning of the yearFinished goods 638 647By-products 3 6Work in progress 147 148Traded goods 80 91
868 892(Increase)/Decrease in inventory (160) 24Less: Excise duty on stocks - (22)
(160) 2
Notes to Standalone Financial Statements for the year ended March 31, 2019
21. Revenue from operations (contd.)

180 | Annual Report 2018-19
UPL Limited
25.Employeebenefitexpenses H In Crores
March 31, 2019 March 31, 2018Salaries, wages and bonus 435 391Contribution to provident and other funds (refer note 33) 27 25Share based payments to employees (refer note 34) - 0Retirement benefits (refer note 33) 29 21Staff welfare expenses 60 49
551 486
26. Finance costs H In Crores
March 31, 2019 March 31, 2018Interest: - On Debentures 77 81 - On Others 47 40Exchange Difference (net) (55) (21)(Gain)/Loss on Derivatives Instruments 50 (10)Unwinding of interest cost on trade payables 54 35Other financial charges 12 10
185 135
27. Depreciation and amortisation expenses H In Crores
March 31, 2019 March 31, 2018Depreciation of tangible assets 284 226 Amortization of intangible assets 440 440
724 666
28. Other expenses H In Crores
March 31, 2019 March 31, 2018Power and fuel 337 237 Containers & packing materials consumed 310 286 Transport charges 217 244 Sub-contracting expenses 330 316 Sales commission 44 46 Rent (Refer note: 35) 97 76 Effluent disposal charges 94 70 Travelling and conveyance 85 74 Advertising and sales promotion 84 72 Legal and professional fees 83 83 Consumption of stores and spares 69 65 Repairs and maintenancePlant and machinery 36 32 Buildings 4 3 Others 30 32 Rates and taxes 8 18 Exchange differences (net) 63 9 Charity and donations [(includes Rs 18 crores (31 March 2018: Rs 22 crores) paid for political purpose)]
29 30
CSR expenses (Refer note 46) 18 20 Insurance 14 13 Allowances for doubtful debts (net) 31 8 Assets written off 5 9 Payment to auditor (Refer details below) 3 2 Directors’ sitting fees 0 0 Miscellaneos expenses 177 160
2,168 1,905
Notes to Standalone Financial Statements for the year ended March 31, 2019
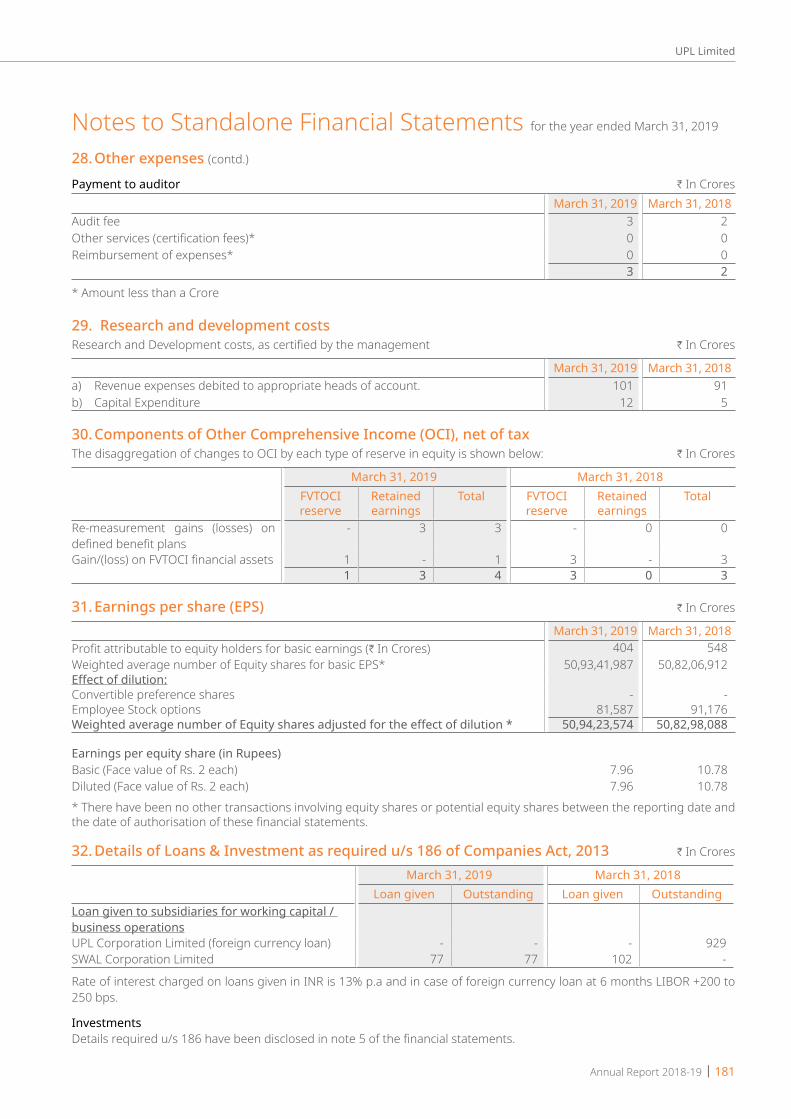
Annual Report 2018-19 | 181
UPL Limited
Payment to auditor H In CroresMarch 31, 2019 March 31, 2018
Audit fee 3 2 Other services (certification fees)* 0 0 Reimbursement of expenses* 0 0
3 2 * Amount less than a Crore
29. Research and development costsResearch and Development costs, as certified by the management H In Crores
March 31, 2019 March 31, 2018a) Revenue expenses debited to appropriate heads of account. 101 91 b) Capital Expenditure 12 5
30.ComponentsofOtherComprehensiveIncome(OCI),netoftaxThe disaggregation of changes to OCI by each type of reserve in equity is shown below: H In Crores
March 31, 2019 March 31, 2018FVTOCI reserve
Retained earnings
Total FVTOCI reserve
Retained earnings
Total
Re-measurement gains (losses) on defined benefit plans
- 3 3 - 0 0
Gain/(loss) on FVTOCI financial assets 1 - 1 3 - 31 3 4 3 0 3
31.Earningspershare(EPS) H In Crores
March 31, 2019 March 31, 2018Profit attributable to equity holders for basic earnings (H In Crores) 404 548 Weighted average number of Equity shares for basic EPS* 50,93,41,987 50,82,06,912 Effect of dilution:Convertible preference shares - - Employee Stock options 81,587 91,176 Weighted average number of Equity shares adjusted for the effect of dilution * 50,94,23,574 50,82,98,088
Earnings per equity share (in Rupees)Basic (Face value of Rs. 2 each) 7.96 10.78 Diluted (Face value of Rs. 2 each) 7.96 10.78 * There have been no other transactions involving equity shares or potential equity shares between the reporting date and the date of authorisation of these financial statements.
32. Details of Loans & Investment as required u/s 186 of Companies Act, 2013 H In Crores
March 31, 2019 March 31, 2018Loan given Outstanding Loan given Outstanding
Loan given to subsidiaries for working capital / business operationsUPL Corporation Limited (foreign currency loan) - - - 929 SWAL Corporation Limited 77 77 102 -
Rate of interest charged on loans given in INR is 13% p.a and in case of foreign currency loan at 6 months LIBOR +200 to 250 bps.
InvestmentsDetails required u/s 186 have been disclosed in note 5 of the financial statements.
Notes to Standalone Financial Statements for the year ended March 31, 2019
28. Other expenses (contd.)
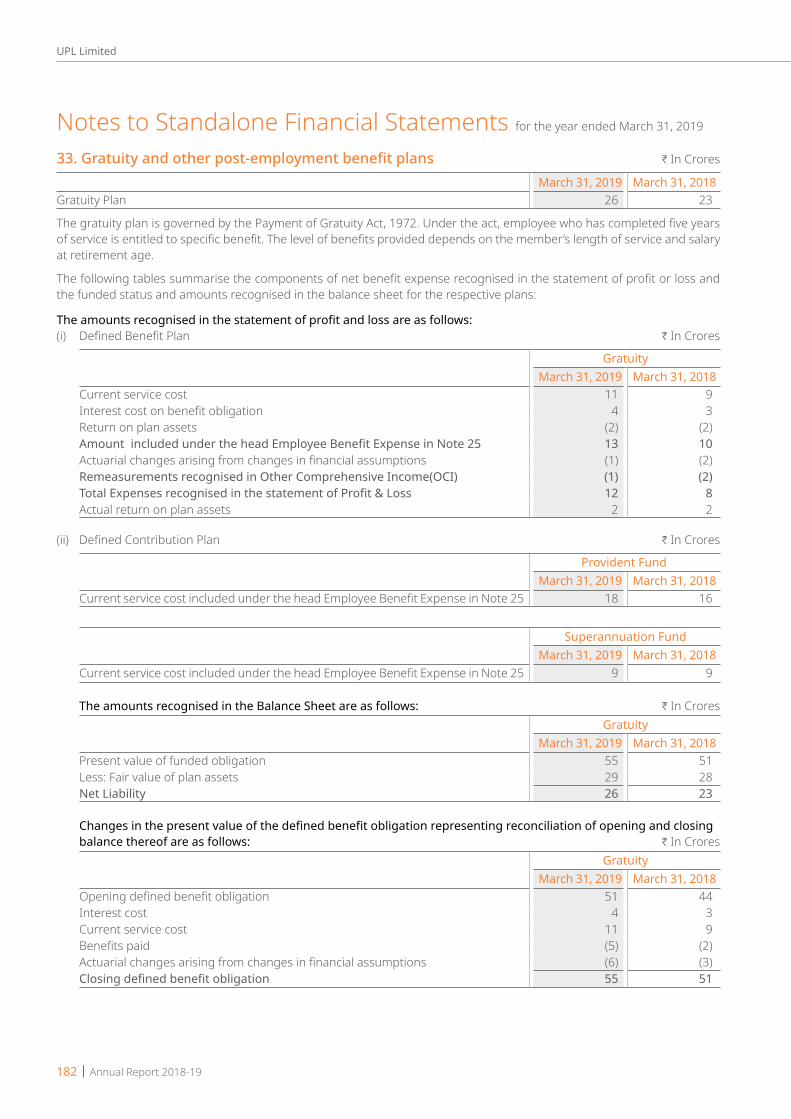
182 | Annual Report 2018-19
UPL Limited
33.Gratuityandotherpost-employmentbenefitplans H In Crores
March 31, 2019 March 31, 2018Gratuity Plan 26 23
The gratuity plan is governed by the Payment of Gratuity Act, 1972. Under the act, employee who has completed five years of service is entitled to specific benefit. The level of benefits provided depends on the member’s length of service and salary at retirement age.
The following tables summarise the components of net benefit expense recognised in the statement of profit or loss and the funded status and amounts recognised in the balance sheet for the respective plans:
The amounts recognised in the statement of profit and loss are as follows:(i) Defined Benefit Plan H In Crores
Gratuity March 31, 2019 March 31, 2018
Current service cost 11 9 Interest cost on benefit obligation 4 3 Return on plan assets (2) (2)Amount included under the head Employee Benefit Expense in Note 25 13 10 Actuarial changes arising from changes in financial assumptions (1) (2)Remeasurements recognised in Other Comprehensive Income(OCI) (1) (2)Total Expenses recognised in the statement of Profit & Loss 12 8 Actual return on plan assets 2 2
(ii) Defined Contribution Plan H In Crores
Provident FundMarch 31, 2019 March 31, 2018
Current service cost included under the head Employee Benefit Expense in Note 25 18 16
Superannuation Fund March 31, 2019 March 31, 2018
Current service cost included under the head Employee Benefit Expense in Note 25 9 9
The amounts recognised in the Balance Sheet are as follows: H In Crores Gratuity
March 31, 2019 March 31, 2018Present value of funded obligation 55 51Less: Fair value of plan assets 29 28Net Liability 26 23
Changes in the present value of the defined benefit obligation representing reconciliation of opening and closing balance thereof are as follows: H In Crores
GratuityMarch 31, 2019 March 31, 2018
Opening defined benefit obligation 51 44Interest cost 4 3Current service cost 11 9Benefits paid (5) (2)Actuarial changes arising from changes in financial assumptions (6) (3)Closing defined benefit obligation 55 51
Notes to Standalone Financial Statements for the year ended March 31, 2019
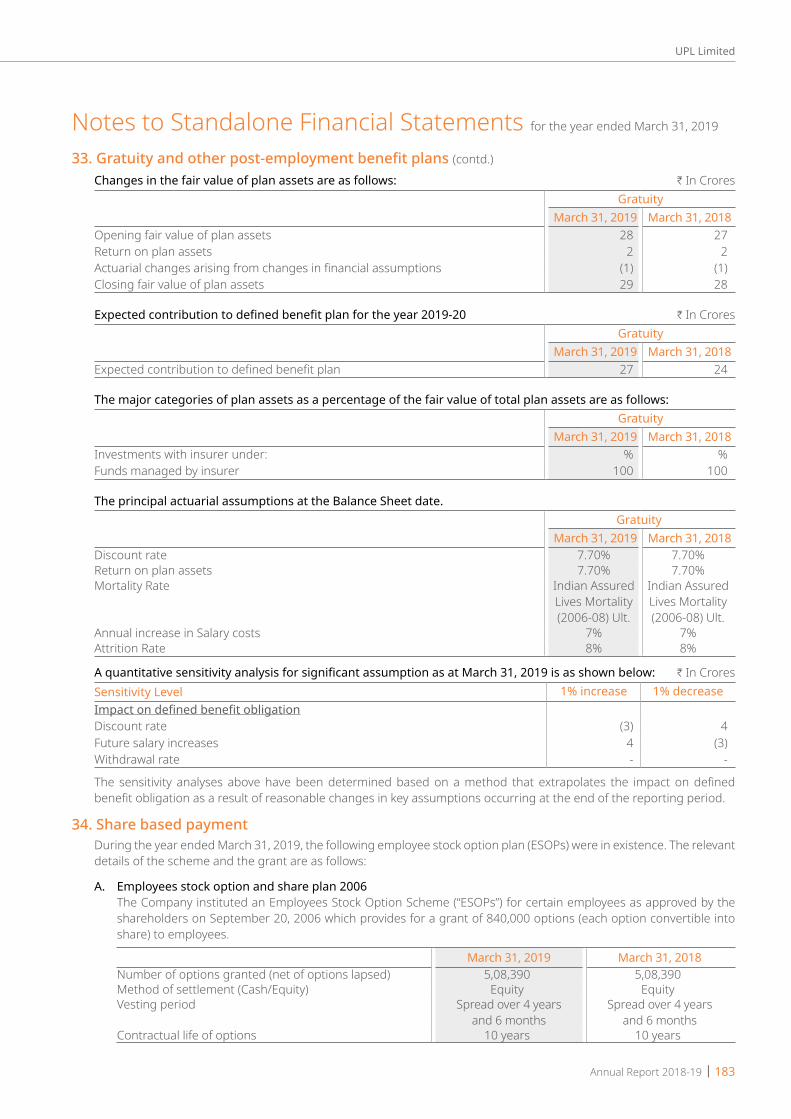
Annual Report 2018-19 | 183
UPL Limited
Changes in the fair value of plan assets are as follows: H In Crores Gratuity
March 31, 2019 March 31, 2018Opening fair value of plan assets 28 27 Return on plan assets 2 2 Actuarial changes arising from changes in financial assumptions (1) (1)Closing fair value of plan assets 29 28
Expected contribution to defined benefit plan for the year 2019-20 H In Crores Gratuity
March 31, 2019 March 31, 2018Expected contribution to defined benefit plan 27 24
The major categories of plan assets as a percentage of the fair value of total plan assets are as follows: Gratuity
March 31, 2019 March 31, 2018Investments with insurer under: % %Funds managed by insurer 100 100
The principal actuarial assumptions at the Balance Sheet date.Gratuity
March 31, 2019 March 31, 2018Discount rate 7.70% 7.70%Return on plan assets 7.70% 7.70%Mortality Rate Indian Assured
Lives Mortality (2006-08) Ult.
Indian Assured Lives Mortality (2006-08) Ult.
Annual increase in Salary costs 7% 7%Attrition Rate 8% 8%
A quantitative sensitivity analysis for significant assumption as at March 31, 2019 is as shown below: H In CroresSensitivity Level 1% increase 1% decreaseImpact on defined benefit obligationDiscount rate (3) 4 Future salary increases 4 (3)Withdrawal rate - -
The sensitivity analyses above have been determined based on a method that extrapolates the impact on defined benefit obligation as a result of reasonable changes in key assumptions occurring at the end of the reporting period.
34. Share based payment During the year ended March 31, 2019, the following employee stock option plan (ESOPs) were in existence. The relevant
details of the scheme and the grant are as follows:
A. Employees stock option and share plan 2006 The Company instituted an Employees Stock Option Scheme (“ESOPs”) for certain employees as approved by the
shareholders on September 20, 2006 which provides for a grant of 840,000 options (each option convertible into share) to employees.
March 31, 2019 March 31, 2018Number of options granted (net of options lapsed) 5,08,390 5,08,390Method of settlement (Cash/Equity) Equity EquityVesting period Spread over 4 years
and 6 monthsSpread over 4 years
and 6 monthsContractual life of options 10 years 10 years
Notes to Standalone Financial Statements for the year ended March 31, 2019
33.Gratuityandotherpost-employmentbenefitplans(contd.)

184 | Annual Report 2018-19
UPL Limited
The details of the activity have been summarized below(No. of equity shares)
March 31, 2019 March 31, 2018Outstanding at the beginning of the year 16,500 52,250Exercisable at the beginning of the year 16,500 52,250Forfeited during the year - -Exercised during the year - 35,750Vested during the year - -Expired during the year - -Outstanding at the end of the year 16,500 16,500Exercisable at the end of the year* 16,500 16,500Weighted average remaining contractual life (in years) 2.91 3.91
For options excercised during the current period, the weighted average share price at the exercise date was Rs. Nil (Mar 31, 2018: Rs. 833).
Stock options granted The Black Scholes valuation model has been used for computing the weighted average fair value considering the
following inputs:
March 31, 2019 March 31, 2018Weighted average share price/market price 68.75 68.75Exercise price (Rs. per share) 57.00 57.00Expected volatility 64.49% 64.49%Life of the options granted (vesting and exercise period) in years
Vesting period + 18 months i.e. 3 years, 4 years, 5 years, and 6 years, for each Vesting tranche
of 25%
Vesting period + 18 months i.e. 3 years, 4 years, 5 years, and 6 years, for each Vesting tranche
of 25% Expected dividends 0.30% per annum 0.30% per annum Average risk-free interest rate 8.04% per annum 8.04% per annum
B. Employees stock option plan (ESOP) 2013 The Company instituted an Employees Stock Option Scheme (“ESOPs”) for certain employees as approved by the
shareholders on December 03, 2013 which provides for a grant of 1,300,000 options (each option convertible into share) to employees.
Particulars March 31, 2019Dates of grant 30-Jan-14 27-May-14 27-May-14Dates of board approval 30-Jan-14 27-May-14 27-May-14Date of shareholders approval 03-Dec-13 03-Dec-13 03-Dec-13Number of options granted 7,11,752 35,000 35,000Method of settlement (Cash / Equity) Equity Equity EquityVesting period Spread over 4 yearsExercise period 60 months from the date of grant
The details of the activity have been summarized below H In CroresParticulars March 31, 2019 March 31, 2018Outstanding at the beginning of the year 14,676 23,723 Exercisable at the beginning of the year 13,269 2,814 Granted during the year - - Forfeited during the year - - Exercised during the year 9,047 9,047 Vested during the year - 19,502 Expired during the year - - Outstanding at the end of the year 5,629 14,676 Exercisable at the end of the year* 4,222 13,269 Weighted average remaining contractual life (in years) 0.32 1.02
Notes to Standalone Financial Statements for the year ended March 31, 2019
34. Share based payment (contd.)
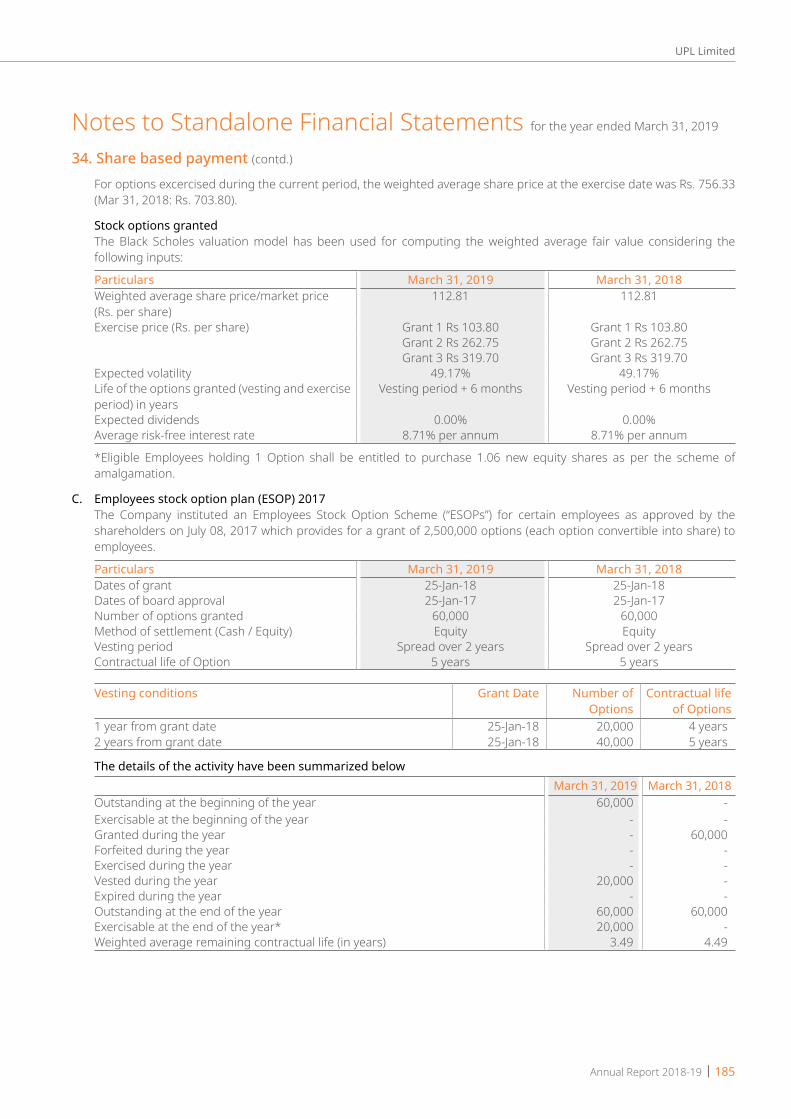
Annual Report 2018-19 | 185
UPL Limited
For options excercised during the current period, the weighted average share price at the exercise date was Rs. 756.33 (Mar 31, 2018: Rs. 703.80).
Stock options granted The Black Scholes valuation model has been used for computing the weighted average fair value considering the
following inputs:
Particulars March 31, 2019 March 31, 2018Weighted average share price/market price (Rs. per share)
112.81 112.81
Exercise price (Rs. per share) Grant 1 Rs 103.80 Grant 1 Rs 103.80Grant 2 Rs 262.75 Grant 2 Rs 262.75Grant 3 Rs 319.70 Grant 3 Rs 319.70
Expected volatility 49.17% 49.17%Life of the options granted (vesting and exercise period) in years
Vesting period + 6 months Vesting period + 6 months
Expected dividends 0.00% 0.00%Average risk-free interest rate 8.71% per annum 8.71% per annum
*Eligible Employees holding 1 Option shall be entitled to purchase 1.06 new equity shares as per the scheme of amalgamation.
C. Employees stock option plan (ESOP) 2017 The Company instituted an Employees Stock Option Scheme (“ESOPs”) for certain employees as approved by the
shareholders on July 08, 2017 which provides for a grant of 2,500,000 options (each option convertible into share) to employees.
Particulars March 31, 2019 March 31, 2018Dates of grant 25-Jan-18 25-Jan-18Dates of board approval 25-Jan-17 25-Jan-17Number of options granted 60,000 60,000Method of settlement (Cash / Equity) Equity EquityVesting period Spread over 2 years Spread over 2 yearsContractual life of Option 5 years 5 years
Vesting conditions Grant Date Number of Options
Contractual life of Options
1 year from grant date 25-Jan-18 20,000 4 years 2 years from grant date 25-Jan-18 40,000 5 years
The details of the activity have been summarized belowMarch 31, 2019 March 31, 2018
Outstanding at the beginning of the year 60,000 - Exercisable at the beginning of the year - - Granted during the year - 60,000 Forfeited during the year - - Exercised during the year - - Vested during the year 20,000 - Expired during the year - - Outstanding at the end of the year 60,000 60,000 Exercisable at the end of the year* 20,000 - Weighted average remaining contractual life (in years) 3.49 4.49
Notes to Standalone Financial Statements for the year ended March 31, 2019
34. Share based payment (contd.)

186 | Annual Report 2018-19
UPL Limited
Stock options granted The Black Scholes valuation model has been used for computing the weighted average fair value considering the
following inputs:March 31, 2019 March 31, 2018
Weighted average share price/market price (Rs. per share) 824 824Exercise price (Rs. per share) 784 784Expected volatility 21.49% 21.49%Life of the options granted (vesting and exercise period) in years 2 to 3.25 years 2 to 3.25 yearsExpected dividends - -Average risk-free interest rate 7.22% per
annum7.22% per
annum
D. Effect of the employee option plan on the Statement of Profit and Loss and on its financial position H In CroresMarch 31, 2019 March 31, 2018
Total employee compensation cost pertaining to stock option plan 1 0 Liability for employee stock option plan outstanding as at the year end 1 0
35. Commitments and contingenciesa. Leases- Operating lease commitments — Company as lessee Lease rent debited to statement of profit and loss is Rs. 97 crores (March 31, 2018: Rs. 76 crores)
The Company has entered into operating lease arrangements for its office premises, vehicles, machinery, storage locations and residential premises.
Future minimum rentals payable under non-cancellable operating leases as at 31 March are, as follows: H In Crores
March 31, 2019 March 31, 2018Within one year 21 21 After one year but more than five years 84 90 More than five years - 15
b. Commitments H In CroresMarch 31, 2019 March 31, 2018
Estimated amount of contracts remaining to be executed on capital account and not provided for (net of advances)
249 72
c. Contingent liabilities H In CroresMarch 31, 2019 March 31, 2018
Disputed Income-Tax Liability (excluding interest) 26 26Disputed Excise Duty / Service Tax liability (excluding interest) 196 203Disputed Sales Tax liability 31 31Disputed Custom Duty liability 34 34Disputed Fiscal Penalty for cancellation of licenses 33 33Claims against the Company not acknowledged as debts 4 4
e. Pursuant to the judgment of the Supreme Court of India on 28 February 2019 regarding the allowances to be considered for computing Provident Fund liability, certain components of compensation hitherto excluded from PF need to be included.There are interpretative challenges in application of the judgment retrospectively and the Company has been legally advised that the judgment would be applicable prospectively.The financial statements disclose a contingent liability in this regard. No provision has been made for the period from 28 February to 31 March 2019 as the same is not material.
Notes to Standalone Financial Statements for the year ended March 31, 2019
34. Share based payment (contd.)
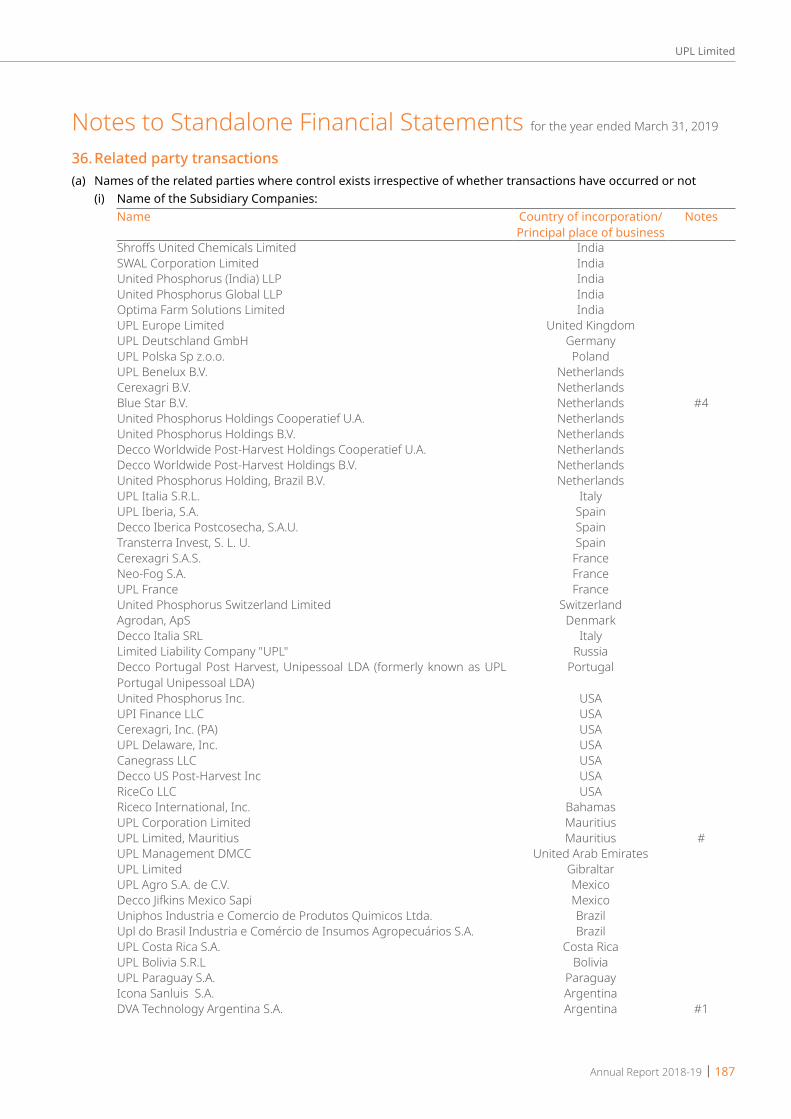
Annual Report 2018-19 | 187
UPL Limited
36. Related party transactions(a) Names of the related parties where control exists irrespective of whether transactions have occurred or not (i) Name of the Subsidiary Companies:
Name Country of incorporation/ Principal place of business
Notes
Shroffs United Chemicals Limited IndiaSWAL Corporation Limited IndiaUnited Phosphorus (India) LLP IndiaUnited Phosphorus Global LLP IndiaOptima Farm Solutions Limited IndiaUPL Europe Limited United KingdomUPL Deutschland GmbH GermanyUPL Polska Sp z.o.o. PolandUPL Benelux B.V. NetherlandsCerexagri B.V. NetherlandsBlue Star B.V. Netherlands #4United Phosphorus Holdings Cooperatief U.A. NetherlandsUnited Phosphorus Holdings B.V. NetherlandsDecco Worldwide Post-Harvest Holdings Cooperatief U.A. NetherlandsDecco Worldwide Post-Harvest Holdings B.V. NetherlandsUnited Phosphorus Holding, Brazil B.V. NetherlandsUPL Italia S.R.L. ItalyUPL Iberia, S.A. SpainDecco Iberica Postcosecha, S.A.U. SpainTransterra Invest, S. L. U. SpainCerexagri S.A.S. FranceNeo-Fog S.A. FranceUPL France FranceUnited Phosphorus Switzerland Limited SwitzerlandAgrodan, ApS DenmarkDecco Italia SRL ItalyLimited Liability Company "UPL" RussiaDecco Portugal Post Harvest, Unipessoal LDA (formerly known as UPL Portugal Unipessoal LDA)
Portugal
United Phosphorus Inc. USAUPI Finance LLC USACerexagri, Inc. (PA) USAUPL Delaware, Inc. USACanegrass LLC USADecco US Post-Harvest Inc USARiceCo LLC USARiceco International, Inc. BahamasUPL Corporation Limited MauritiusUPL Limited, Mauritius Mauritius #UPL Management DMCC United Arab EmiratesUPL Limited GibraltarUPL Agro S.A. de C.V. MexicoDecco Jifkins Mexico Sapi MexicoUniphos Industria e Comercio de Produtos Quimicos Ltda. BrazilUpl do Brasil Industria e Comércio de Insumos Agropecuários S.A. BrazilUPL Costa Rica S.A. Costa RicaUPL Bolivia S.R.L BoliviaUPL Paraguay S.A. ParaguayIcona Sanluis S.A. ArgentinaDVA Technology Argentina S.A. Argentina #1
Notes to Standalone Financial Statements for the year ended March 31, 2019

188 | Annual Report 2018-19
UPL Limited
Name Country of incorporation/ Principal place of business
Notes
UPL Argentina S A ArgentinaDecco Chile SpA ChileUPL Colombia SAS ColombiaUnited Phosphorus Cayman Limited Cayman IslandsUP Aviation Limited Cayman IslandsUPL Australia Limited AustraliaUPL New Zealand Limited New ZealandUPL Shanghai Limited ChinaUPL Limited (Korea) KoreaPT.UPL Indonesia IndonesiaPT Catur Agrodaya Mandiri IndonesiaUPL Limited Hong KongUPL Philippines Inc. PhilippinesUPL Vietnam Co. Limited VietnamUPL Limited, Japan JapanAnning Decco Fine Chemical Co. Limited ChinaUPL Ziraat Ve Kimya Sanayi Ve Ticaret Limited Sirketi TurkeyUPL Agromed Tarim Ilaclari ve Tohumculuk Sanayi ve Ticaret A.S. Turkey #2Safepack Products Limited IsraelCitrashine (Pty) Ltd South AfricaUPL Africa SARL Senegal #6Prolong Limited Israel #3Perrey Participações S.A BrazilAgrinet Solutions Limited IndiaAdvanta Netherlands Holding B.V. NetherlandsAdvanta Semillas SAIC ArgentinaAdvanta Holdings B.V. NetherlandsAdvanta Seeds International MauritiusPacific Seeds Holdings (Thailand) Limited ThailandPacific Seeds (Thai) Limited ThailandAdvanta Seeds Pty Ltd AustraliaAdvanta US LLC (formerly known as Advanta U.S. Inc.) USAAdvanta Comercio De Sementes LTDA. BrazilPT Advanta Seeds Indonesia IndonesiaAdvanta Seeds DMCC United Arab EmiratesEssentiv LCC USAUPL Agro Limited Mauritius Mauritius `@3UPL Jiangsu Limited China `@2Riceco International Bangladesh Ltd Bangladesh `@3Uniphos Malaysia Sdn Bhd Malaysia `@3Advanta Seeds Ukraine LLC UkraineDecco Gıda Tarım ve Zirai Ürünler San. Tic A.S. Turkey @Arysta LifeScience Investments LLC USA @1Arysta LifeScience America Inc. USA @1ANESA S.A. Belgium @1Arysta LifeScience Management Company, LLC USA @1Arysta LifeScience SPC, LLC USA @1Arysta LifeScience India Limited India @1Arysta LifeScience Agriservice Private Limited India @1Arysta LifeScience Togo SAU Togo @1Arysta Agro Private Limited India @1Arysta LifeScience do Brasil Indústria Química e Agropecuária SA Brazil @1Volcano Agrociencia Industria e Comercio de Defensivos Agricolas Ltda Brazil @1
Notes to Standalone Financial Statements for the year ended March 31, 2019
36. Related party transactions (contd.)
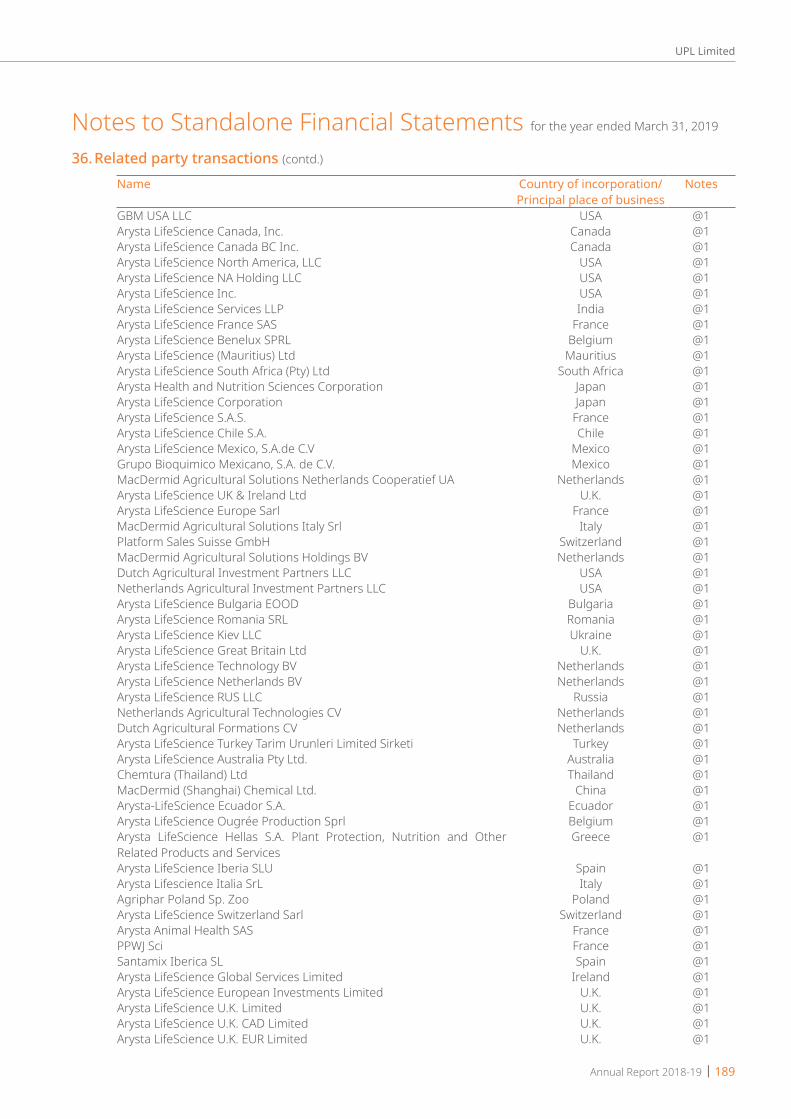
Annual Report 2018-19 | 189
UPL Limited
Name Country of incorporation/ Principal place of business
Notes
GBM USA LLC USA @1Arysta LifeScience Canada, Inc. Canada @1Arysta LifeScience Canada BC Inc. Canada @1Arysta LifeScience North America, LLC USA @1Arysta LifeScience NA Holding LLC USA @1Arysta LifeScience Inc. USA @1Arysta LifeScience Services LLP India @1Arysta LifeScience France SAS France @1Arysta LifeScience Benelux SPRL Belgium @1Arysta LifeScience (Mauritius) Ltd Mauritius @1Arysta LifeScience South Africa (Pty) Ltd South Africa @1Arysta Health and Nutrition Sciences Corporation Japan @1Arysta LifeScience Corporation Japan @1Arysta LifeScience S.A.S. France @1Arysta LifeScience Chile S.A. Chile @1Arysta LifeScience Mexico, S.A.de C.V Mexico @1Grupo Bioquimico Mexicano, S.A. de C.V. Mexico @1MacDermid Agricultural Solutions Netherlands Cooperatief UA Netherlands @1Arysta LifeScience UK & Ireland Ltd U.K. @1Arysta LifeScience Europe Sarl France @1MacDermid Agricultural Solutions Italy Srl Italy @1Platform Sales Suisse GmbH Switzerland @1MacDermid Agricultural Solutions Holdings BV Netherlands @1Dutch Agricultural Investment Partners LLC USA @1Netherlands Agricultural Investment Partners LLC USA @1Arysta LifeScience Bulgaria EOOD Bulgaria @1Arysta LifeScience Romania SRL Romania @1Arysta LifeScience Kiev LLC Ukraine @1Arysta LifeScience Great Britain Ltd U.K. @1Arysta LifeScience Technology BV Netherlands @1Arysta LifeScience Netherlands BV Netherlands @1Arysta LifeScience RUS LLC Russia @1Netherlands Agricultural Technologies CV Netherlands @1Dutch Agricultural Formations CV Netherlands @1Arysta LifeScience Turkey Tarim Urunleri Limited Sirketi Turkey @1Arysta LifeScience Australia Pty Ltd. Australia @1Chemtura (Thailand) Ltd Thailand @1MacDermid (Shanghai) Chemical Ltd. China @1Arysta-LifeScience Ecuador S.A. Ecuador @1Arysta LifeScience Ougrée Production Sprl Belgium @1Arysta LifeScience Hellas S.A. Plant Protection, Nutrition and Other Related Products and Services
Greece @1
Arysta LifeScience Iberia SLU Spain @1Arysta Lifescience Italia SrL Italy @1Agriphar Poland Sp. Zoo Poland @1Arysta LifeScience Switzerland Sarl Switzerland @1Arysta Animal Health SAS France @1PPWJ Sci France @1Santamix Iberica SL Spain @1Arysta LifeScience Global Services Limited Ireland @1Arysta LifeScience European Investments Limited U.K. @1Arysta LifeScience U.K. Limited U.K. @1Arysta LifeScience U.K. CAD Limited U.K. @1Arysta LifeScience U.K. EUR Limited U.K. @1
Notes to Standalone Financial Statements for the year ended March 31, 2019
36. Related party transactions (contd.)
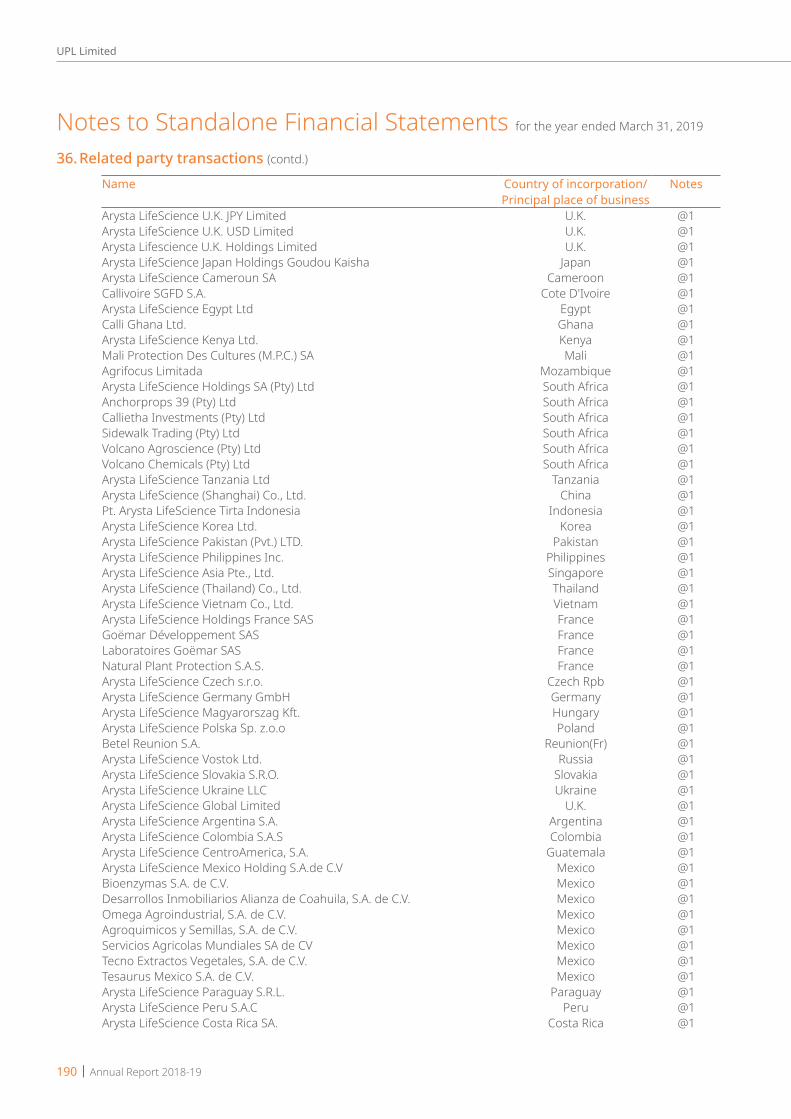
190 | Annual Report 2018-19
UPL Limited
Name Country of incorporation/ Principal place of business
Notes
Arysta LifeScience U.K. JPY Limited U.K. @1Arysta LifeScience U.K. USD Limited U.K. @1Arysta Lifescience U.K. Holdings Limited U.K. @1Arysta LifeScience Japan Holdings Goudou Kaisha Japan @1Arysta LifeScience Cameroun SA Cameroon @1Callivoire SGFD S.A. Cote D'Ivoire @1Arysta LifeScience Egypt Ltd Egypt @1Calli Ghana Ltd. Ghana @1Arysta LifeScience Kenya Ltd. Kenya @1Mali Protection Des Cultures (M.P.C.) SA Mali @1Agrifocus Limitada Mozambique @1Arysta LifeScience Holdings SA (Pty) Ltd South Africa @1Anchorprops 39 (Pty) Ltd South Africa @1Callietha Investments (Pty) Ltd South Africa @1Sidewalk Trading (Pty) Ltd South Africa @1Volcano Agroscience (Pty) Ltd South Africa @1Volcano Chemicals (Pty) Ltd South Africa @1Arysta LifeScience Tanzania Ltd Tanzania @1Arysta LifeScience (Shanghai) Co., Ltd. China @1Pt. Arysta LifeScience Tirta Indonesia Indonesia @1Arysta LifeScience Korea Ltd. Korea @1Arysta LifeScience Pakistan (Pvt.) LTD. Pakistan @1Arysta LifeScience Philippines Inc. Philippines @1Arysta LifeScience Asia Pte., Ltd. Singapore @1Arysta LifeScience (Thailand) Co., Ltd. Thailand @1Arysta LifeScience Vietnam Co., Ltd. Vietnam @1Arysta LifeScience Holdings France SAS France @1Goëmar Développement SAS France @1Laboratoires Goëmar SAS France @1Natural Plant Protection S.A.S. France @1Arysta LifeScience Czech s.r.o. Czech Rpb @1Arysta LifeScience Germany GmbH Germany @1Arysta LifeScience Magyarorszag Kft. Hungary @1Arysta LifeScience Polska Sp. z.o.o Poland @1Betel Reunion S.A. Reunion(Fr) @1Arysta LifeScience Vostok Ltd. Russia @1Arysta LifeScience Slovakia S.R.O. Slovakia @1Arysta LifeScience Ukraine LLC Ukraine @1Arysta LifeScience Global Limited U.K. @1Arysta LifeScience Argentina S.A. Argentina @1Arysta LifeScience Colombia S.A.S Colombia @1Arysta LifeScience CentroAmerica, S.A. Guatemala @1Arysta LifeScience Mexico Holding S.A.de C.V Mexico @1Bioenzymas S.A. de C.V. Mexico @1Desarrollos Inmobiliarios Alianza de Coahuila, S.A. de C.V. Mexico @1Omega Agroindustrial, S.A. de C.V. Mexico @1Agroquimicos y Semillas, S.A. de C.V. Mexico @1Servicios Agricolas Mundiales SA de CV Mexico @1Tecno Extractos Vegetales, S.A. de C.V. Mexico @1Tesaurus Mexico S.A. de C.V. Mexico @1Arysta LifeScience Paraguay S.R.L. Paraguay @1Arysta LifeScience Peru S.A.C Peru @1Arysta LifeScience Costa Rica SA. Costa Rica @1
Notes to Standalone Financial Statements for the year ended March 31, 2019
36. Related party transactions (contd.)

Annual Report 2018-19 | 191
UPL Limited
Name Country of incorporation/ Principal place of business
Notes
Arysta LifeScience de Guatemala, S.A. Guatemala @1Arysta LifeScience S.R.L. Bolivia @1Myanmar Arysta LifeScience Co., Ltd. Myanmar @1Arysta LifeScience U.K. BRL Limited U.K. @1Etec Crop Solutions Limited New Zealand @1MacDermid Agricultural Solutions Australia Pty Ltd Australia @1Arvesta Corporation USA @1Arysta LifeScience Registrations Great Britain Ltd U.K. @1Agriphar SDN BHD Malaysia @1Agriphar de Costa Rica SA Costa Rica @1Agriphar de Colombia SAS Colombia @1Industrias Agriphar SA Guatemala @1Kempton Chemicals (Pty) Ltd South Africa @1Agripraza Ltda. Portugal @1Arysta LifeScience Corporation Republica Dominicana, SRL Dominican Rpb @1Grupo Bioquimico Mexicano Republica Dominicana SA Dominican Rpb @1Arysta LifeScience Ecuador S.A. Ecuador @1Arvesta Paraguay S.A. Paraguay @1Arysta Agroquimicos y Fertilzantes Uruguay SA Uruguay @1Arysta LifeScience U.K. USD-2 Limited U.K. @1Veto-Pharma SA France @1, #5Wyjolab S.A. France @1, #5MacDermid (Nanjing) Chemical Ltd. China @1, #1
Notes @ Subsidiary formed during the year @1 Subsidiary acquired during the year `@2 Subsidiary formed during the previous year `@3 Subsidiary acquired during the previous year # During the previous year UPL Limited, Mauritius merged in UPL Corporation Limited, Mauritius. #1 Subsidiary divested during the year. #2 During the previous year, the Group through its step down wholly owned subsidiary, has increased its stake from
51% to 100% #3 During the previous year, the Group through its step down wholly owned subsidiary, has increased its stake from
50% to 100% #4 During the year, Blue Star B.V. was merged into United Phosphorus Holdings B.V. #5 During the year, Veto-Pharma SA and Wyjolab S.A. were merged into Arysta Animal Health SAS #6 Subsidiary divested during the previous year.
(b) Names of the other related parties with whom transactions have taken place during the year (i) Name of Associate Companies:
Name Country of incorporation/ Principal place of business
Notes
Weather Risk Management Private Ltd India ##Ingen Technologies Private Limited IndiaKerala Enviro Infrastructure Limited IndiaPolycoat Technologies 2010 Limited Israel3SB Produtos Agricolas S.A. Brazil $$$, #Sinagro Produtos Agropecuarios S.A. Brazil $$$, #Seara Comercial Agricola Ltda. BrazilSerra Bonita Sementes S.A. Brazil $$Bioplanta Nutricao Vegetal,Industria e Comercio S.A. Brazil
Notes to Standalone Financial Statements for the year ended March 31, 2019
36. Related party transactions (contd.)
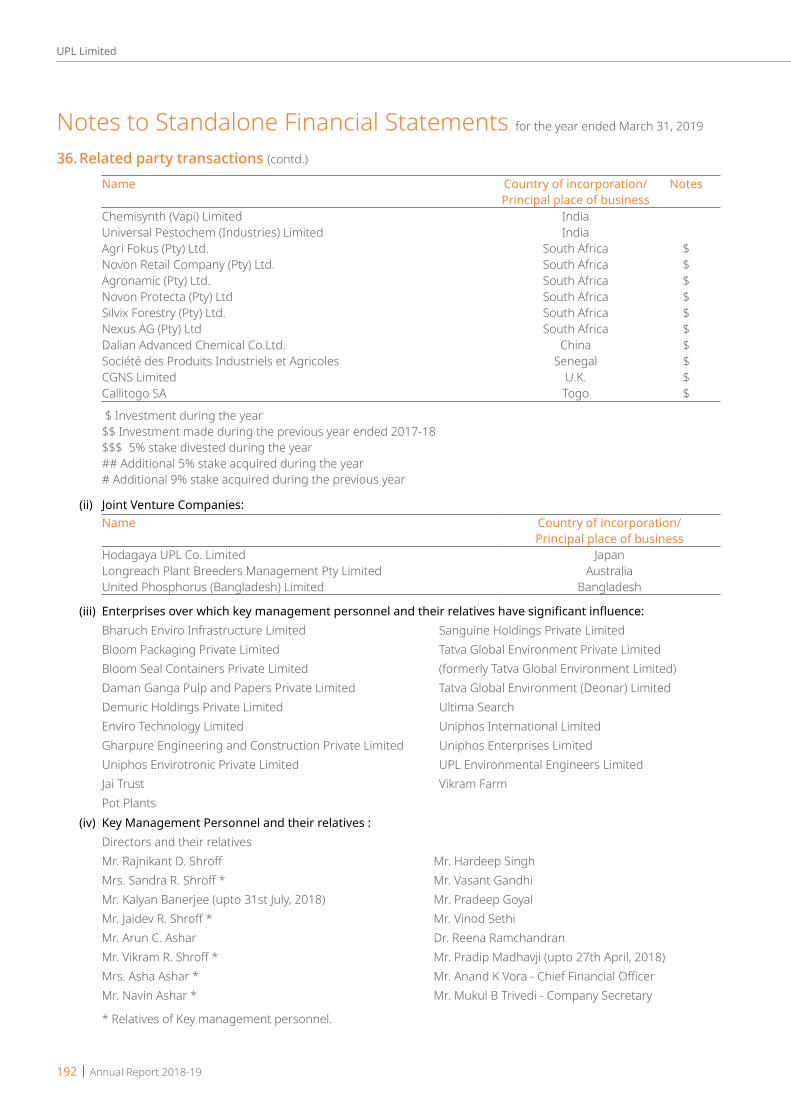
192 | Annual Report 2018-19
UPL Limited
Name Country of incorporation/ Principal place of business
Notes
Chemisynth (Vapi) Limited IndiaUniversal Pestochem (Industries) Limited IndiaAgri Fokus (Pty) Ltd. South Africa $Novon Retail Company (Pty) Ltd. South Africa $Agronamic (Pty) Ltd. South Africa $Novon Protecta (Pty) Ltd South Africa $Silvix Forestry (Pty) Ltd. South Africa $Nexus AG (Pty) Ltd South Africa $Dalian Advanced Chemical Co.Ltd. China $Société des Produits Industriels et Agricoles Senegal $CGNS Limited U.K. $Callitogo SA Togo $
$ Investment during the year $$ Investment made during the previous year ended 2017-18 $$$ 5% stake divested during the year ## Additional 5% stake acquired during the year # Additional 9% stake acquired during the previous year
(ii) Joint Venture Companies:Name Country of incorporation/
Principal place of businessHodagaya UPL Co. Limited JapanLongreach Plant Breeders Management Pty Limited AustraliaUnited Phosphorus (Bangladesh) Limited Bangladesh
(iii) Enterprises over which key management personnel and their relatives have significant influence:Bharuch Enviro Infrastructure Limited Sanguine Holdings Private LimitedBloom Packaging Private Limited Tatva Global Environment Private Limited Bloom Seal Containers Private Limited (formerly Tatva Global Environment Limited)Daman Ganga Pulp and Papers Private Limited Tatva Global Environment (Deonar) LimitedDemuric Holdings Private Limited Ultima SearchEnviro Technology Limited Uniphos International LimitedGharpure Engineering and Construction Private Limited Uniphos Enterprises LimitedUniphos Envirotronic Private Limited UPL Environmental Engineers LimitedJai Trust Vikram FarmPot Plants
(iv) Key Management Personnel and their relatives :Directors and their relativesMr. Rajnikant D. Shroff Mr. Hardeep SinghMrs. Sandra R. Shroff * Mr. Vasant GandhiMr. Kalyan Banerjee (upto 31st July, 2018) Mr. Pradeep GoyalMr. Jaidev R. Shroff * Mr. Vinod SethiMr. Arun C. Ashar Dr. Reena RamchandranMr. Vikram R. Shroff * Mr. Pradip Madhavji (upto 27th April, 2018)Mrs. Asha Ashar * Mr. Anand K Vora - Chief Financial OfficerMr. Navin Ashar * Mr. Mukul B Trivedi - Company Secretary
* Relatives of Key management personnel.
Notes to Standalone Financial Statements for the year ended March 31, 2019
36. Related party transactions (contd.)

Annual Report 2018-19 | 193
UPL Limited
Not
es to
Sta
ndal
one
Fina
ncia
l Sta
tem
ents
for th
e ye
ar e
nded
Mar
ch 3
1, 2
019
RELA
TIO
NSH
IP S
UBS
IDIA
RIES
ASS
OCI
ATES
JO
INT
VEN
TURE
ENTE
RPRI
SES
OVE
R W
HIC
H K
EY
MAN
AGEM
ENT
PERS
ON
NEL
HAV
E SI
GN
IFIC
ANT
INFL
UEN
CE
GRA
ND
TO
TAL
NAT
URE
OF
TRAN
SACT
ION
S:31
-Mar
-19
31-M
ar-1
831
-Mar
-19
31-M
ar-1
831
-Mar
-19
31-M
ar-1
831
-Mar
-19
31-M
ar-1
831
-Mar
-19
31-M
ar-1
81
INCO
ME
(A)
SALE
S:(i)
GO
OD
S 5
,499
4
,034
-
- 5
7
5
6
5,
509
4,04
7U
PL C
orpo
ratio
n Lt
d.1,
881
880
- -
- -
- -
1,8
81
880
U
PL L
imite
d G
ibra
ltar
1,45
51,
028
- -
- -
- -
1,4
55
1,0
28
SWAL
Cor
pora
tion
Lim
ited
581
512
- -
- -
- -
581
5
12
UPL
Ltd
. - M
aurit
ius
- 28
2 -
- -
- -
- -
282
U
nite
d Ph
osph
orus
(Ind
ia)
LLP
1,36
964
2 -
- -
- -
- 1
,369
6
42
Oth
ers
213
690
- -
5
7
5
6
223
7
02
(B)
DIV
IDEN
D R
ECEI
VED
412
3
56
- -
- -
- -
412
3
56
UPL
Cor
pora
tion
Ltd.
412
356
- -
- -
- -
412
3
56
(C)
MAN
AGEM
ENT
FEES
/ O
THER
SER
VICE
S 3
6 7
-
- -
- 6
8
4
2 1
5
Tatv
a G
loba
l Env
ironm
ent
Priva
te L
imite
d -
- -
- -
- 2
2
2
2
Bhar
uch
Envir
o In
frast
ruct
ure
Lim
ited
- -
- -
- -
1
1
1
1
Gha
rpur
e En
gine
erin
g an
d Co
nstr
uctio
n Pr
ivate
Lim
ited
- -
- -
- -
2
4
2
4
Uni
phos
Ent
erpr
ises
Ltd
- -
- -
- -
1
1
1
1
Uni
ted
Phos
phor
us (I
ndia
) LL
P36
7 -
- -
- -
- 3
6 7
Oth
ers
0 -
- -
- -
0
0
0
0
(D)
REN
T R
ECEI
VED
7
2
- -
- -
0
0
7
2
Uni
phos
Env
irotro
nic
Pvt
. Lt
d. -
- -
- -
- -
- -
-
Uni
ted
Phos
phor
us (I
ndia
) LL
P7
2
- -
- -
- 7
2
Oth
ers
- -
- -
- -
0
0
0
0
(E)
ROYA
LTY
INCO
ME
42
29
- -
- -
- -
42
29
Uni
ted
Phos
phor
us (I
ndia
) LL
P42
29 -
- -
- -
- 4
2 2
9
H In
Cro
res
36. R
elat
ed p
arty
tran
sact
ions
(con
td.)
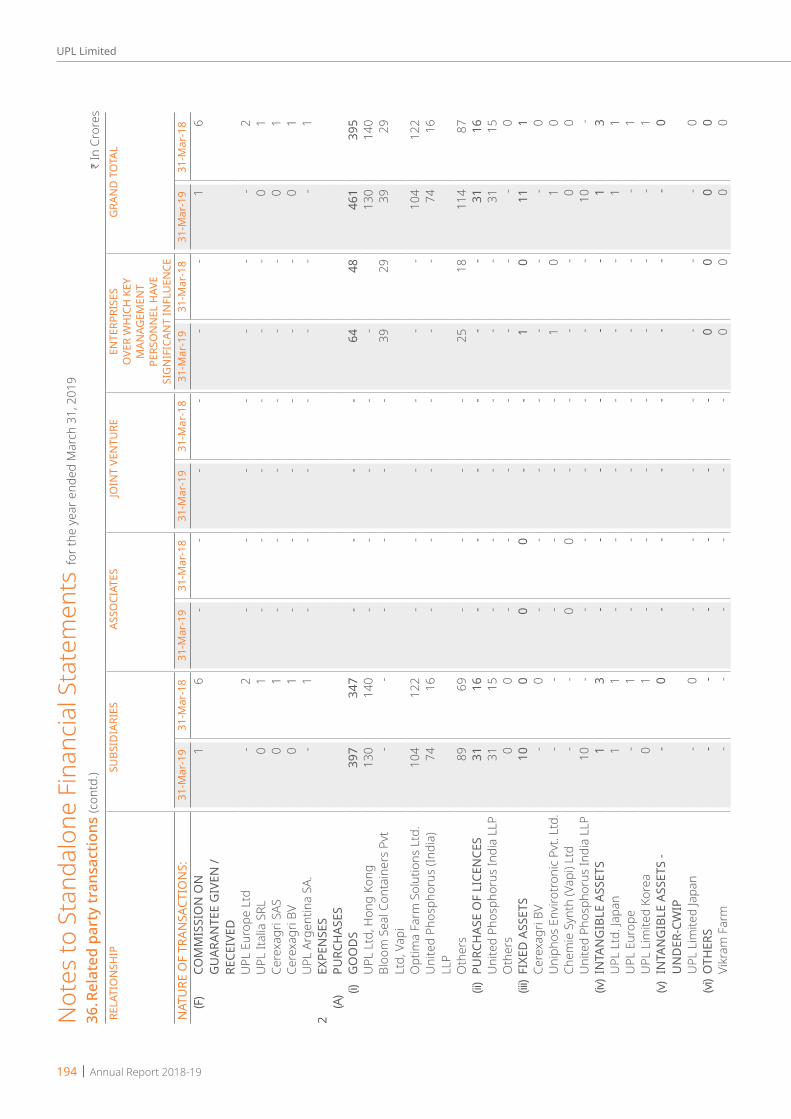
194 | Annual Report 2018-19
UPL LimitedN
otes
to S
tand
alon
e Fi
nanc
ial S
tate
men
ts for
the
year
end
ed M
arch
31,
201
9
RELA
TIO
NSH
IP S
UBS
IDIA
RIES
ASS
OCI
ATES
JO
INT
VEN
TURE
ENTE
RPRI
SES
OVE
R W
HIC
H K
EY
MAN
AGEM
ENT
PERS
ON
NEL
HAV
E SI
GN
IFIC
ANT
INFL
UEN
CE
GRA
ND
TO
TAL
NAT
URE
OF
TRAN
SACT
ION
S:31
-Mar
-19
31-M
ar-1
831
-Mar
-19
31-M
ar-1
831
-Mar
-19
31-M
ar-1
831
-Mar
-19
31-M
ar-1
831
-Mar
-19
31-M
ar-1
8(F
)CO
MM
ISSI
ON
ON
G
UAR
ANTE
E G
IVEN
/ RE
CEIV
ED
1 6
-
- -
- -
- 1
6
UPL
Eur
ope
Ltd
- 2
-
- -
- -
- -
2
UPL
Ital
ia S
RL0
1
- -
- -
- -
0
1
Cere
xagr
i SAS
0 1
-
- -
- -
- 0
1
Ce
rexa
gri B
V0
1
- -
- -
- -
0
1
UPL
Arg
entin
a SA
. -
1
- -
- -
- -
- 1
2
EXPE
NSE
S(A
)PU
RCH
ASES
(i)G
OO
DS
397
3
47
- -
- -
64
48
461
3
95
UPL
Ltd
, Hon
g Ko
ng13
014
0 -
- -
- -
130
1
40
Bloo
m S
eal C
onta
iner
s Pv
t Lt
d, V
api
- -
- -
- -
39
29
39
29
Opt
ima
Farm
Sol
utio
ns L
td.
104
122
- -
- -
- -
104
1
22
Uni
ted
Phos
phor
us (I
ndia
) LL
P74
16 -
- -
- -
- 7
4 1
6
Oth
ers
8969
- -
- -
25
18
114
8
7 (ii)
PURC
HAS
E O
F LI
CEN
CES
3116
- -
- -
- -
31
16
Uni
ted
Phos
phor
us In
dia
LLP
3115
- -
- -
- -
31
15
Oth
ers
00
- -
- -
- -
- 0
(iii
)FI
XED
ASS
ETS
10
0
0
0
- -
1
0
11
1
Cere
xagr
i BV
- 0
- -
- -
- -
- 0
U
niph
os E
nviro
troni
c Pv
t. Lt
d. -
- -
- -
- 1
0
1
0
Ch
emie
Syn
th (V
api)
Ltd
- -
0
0
- -
- -
0
0
Uni
ted
Phos
phor
us In
dia
LLP
10
- -
- -
- -
- 1
0 -
(iv)I
NTA
NG
IBLE
ASS
ETS
1
3
- -
- -
- -
1
3
UPL
Ltd
. Jap
an1
1 -
- -
- -
- 1
1
U
PL E
urop
e -
1 -
- -
- -
- -
1
UPL
Lim
ited
Kore
a0
1 -
- -
- -
- -
1
(v)IN
TAN
GIB
LE A
SSET
S -
UN
DER
-CW
IP -
0
- -
- -
- -
- 0
UPL
Lim
ited
Japa
n -
0 -
- -
- -
- -
0
(vi)O
THER
S -
- -
- -
- 0
0
0
0
Vi
kram
Far
m -
- -
- -
- 0
0
0
0
H In
Cro
res
36. R
elat
ed p
arty
tran
sact
ions
(con
td.)
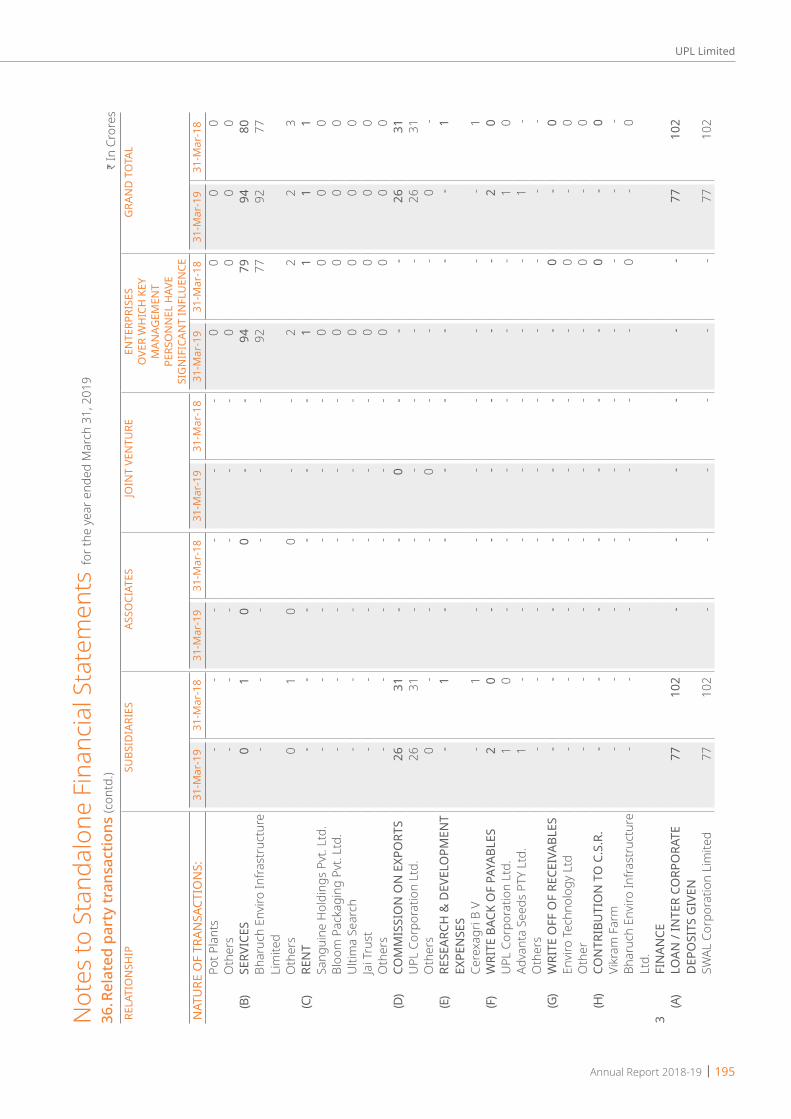
Annual Report 2018-19 | 195
UPL Limited
RELA
TIO
NSH
IP S
UBS
IDIA
RIES
ASS
OCI
ATES
JO
INT
VEN
TURE
ENTE
RPRI
SES
OVE
R W
HIC
H K
EY
MAN
AGEM
ENT
PERS
ON
NEL
HAV
E SI
GN
IFIC
ANT
INFL
UEN
CE
GRA
ND
TO
TAL
NAT
URE
OF
TRAN
SACT
ION
S:31
-Mar
-19
31-M
ar-1
831
-Mar
-19
31-M
ar-1
831
-Mar
-19
31-M
ar-1
831
-Mar
-19
31-M
ar-1
831
-Mar
-19
31-M
ar-1
8Po
t Pla
nts
- -
- -
- -
0
0
0
0
Oth
ers
- -
- -
- -
0
0
0
0
(B)
SERV
ICES
0
1
0
0
- -
94
79
94
80
Bhar
uch
Envir
o In
frast
ruct
ure
Lim
ited
- -
- -
- -
92
77
92
77
Oth
ers
01
0
0
- -
2
2
2
3
(C)
REN
T -
- -
- -
- 1
1
1
1
Sa
ngui
ne H
oldi
ngs
Pvt.
Ltd.
- -
- -
- -
0
0
0
0
Bloo
m P
acka
ging
Pvt
. Ltd
. -
- -
- -
- 0
0
0
0
U
ltim
a Se
arch
- -
- -
- -
0
0
0
0
Jai T
rust
- -
- -
- -
0
0
0
0
Oth
ers
- -
- -
- -
0
0
0
0
(D)
COM
MIS
SIO
N O
N E
XPO
RTS
26
31
- -
0
- -
- 2
6 3
1 U
PL C
orpo
ratio
n Lt
d.26
31 -
- -
- -
- 2
6 3
1 O
ther
s0
- -
- 0
-
- -
0
- (E
)RE
SEAR
CH &
DEV
ELO
PMEN
T EX
PEN
SES
- 1
-
- -
- -
- -
1
Cere
xagr
i B V
- 1
-
- -
- -
- -
1
(F)
WRI
TE B
ACK
OF
PAYA
BLES
2
0
- -
- -
- -
2
0
UPL
Cor
pora
tion
Ltd.
1 0
-
- -
- -
- 1
0
Ad
vant
a Se
eds
PTY
Ltd.
1 -
- -
- -
- -
1
- O
ther
s -
- -
- -
- -
- -
- (G
)W
RITE
OFF
OF
RECE
IVAB
LES
- -
- -
- -
- 0
-
0
Envir
o Te
chno
logy
Ltd
- -
- -
- -
- 0
-
0
Oth
er
- -
- -
- -
- 0
-
0
(H)
CON
TRIB
UTI
ON
TO
C.S
.R.
- -
- -
- -
- 0
-
0
Vikr
am F
arm
- -
- -
- -
- -
- -
Bhar
uch
Envir
o In
frast
ruct
ure
Ltd.
- -
- -
- -
- 0
-
0
3FI
NAN
CE(A
)LO
AN /
INTE
R CO
RPO
RATE
D
EPO
SITS
GIV
EN 7
7 1
02
- -
- -
- -
77
102
SWAL
Cor
pora
tion
Lim
ited
77 1
02
- -
- -
- -
77
102
Not
es to
Sta
ndal
one
Fina
ncia
l Sta
tem
ents
for th
e ye
ar e
nded
Mar
ch 3
1, 2
019
H In
Cro
res
36. R
elat
ed p
arty
tran
sact
ions
(con
td.)

196 | Annual Report 2018-19
UPL Limited
RELA
TIO
NSH
IP S
UBS
IDIA
RIES
ASS
OCI
ATES
JO
INT
VEN
TURE
ENTE
RPRI
SES
OVE
R W
HIC
H K
EY
MAN
AGEM
ENT
PERS
ON
NEL
HAV
E SI
GN
IFIC
ANT
INFL
UEN
CE
GRA
ND
TO
TAL
NAT
URE
OF
TRAN
SACT
ION
S:31
-Mar
-19
31-M
ar-1
831
-Mar
-19
31-M
ar-1
831
-Mar
-19
31-M
ar-1
831
-Mar
-19
31-M
ar-1
831
-Mar
-19
31-M
ar-1
8(B
)IN
TERE
ST R
ECEI
VED
49
43
- -
- -
0
0
49
43
UPL
Cor
pora
tion
Ltd.
41 3
5 -
- -
- -
- 4
1 3
5 SW
AL C
orpo
ratio
n Li
mite
d8
8
- -
- -
- -
8
8
Oth
ers
- 0
-
- -
- 0
0
0
0
(C
)RE
PAYM
ENT
AGAI
NST
LO
AN
GIV
EN 9
29
184
-
- -
- -
1
929
1
85
UPL
Cor
pora
tion
Ltd.
929
- -
- -
- -
- 9
29
- SW
AL C
orpo
ratio
n Li
mite
d -
184
-
- -
- -
- -
184
Ad
vant
a H
oldi
ngs
BV
Net
herla
nd -
- -
- -
- -
- -
-
Oth
ers
- -
- -
- -
- 1
-
1
(D)
GU
ARAN
TEES
CAN
CELL
ED
DU
RIN
G T
HE
YEAR
- 3
09
- -
- -
- -
- 3
09
UPL
Eur
ope
Ltd.
- 2
91
- -
- -
- -
- 2
91
Oth
ers
- 1
8 -
- -
- -
- -
18
(H)
PURC
HAS
E O
F SH
ARES
1,0
25
- -
- -
- -
- 1
,025
-
UPL
Cor
pora
tion
Ltd.
1,02
5 -
- -
- -
- -
1,0
25
- 4
(A)
REIM
BURS
MEN
TS R
ECEI
VED
60
16
- -
- -
1
0
61
17
Swal
Cor
pora
tion
Lim
ited
104
- -
- -
- -
10
4
UPL
Man
agem
ent D
MCC
-
0 -
- -
- -
- -
0
Uni
ted
Phos
phor
us (I
ndia
) LL
P5
7
- -
- -
- -
5
7
UPL
Ltd
. Gib
ralta
r39
39
- U
nite
d Ph
osph
orus
Inc
- 2
-
- -
- -
- -
2
Cere
xagr
i BV
- 2
-
- -
- -
- -
2
Oth
ers
6 1
-
- -
- 1
0
7
2
(B
)RE
IMBU
RSEM
ENTS
MAD
E 9
1
-
- -
- 0
-
9
1
Swal
Cor
pora
tion
Ltd.
- -
- -
- -
- -
00
UPL
Lim
ited
Kore
a4
40
UPL
Ltd
, Hon
g Ko
ng4
40
UPL
Vie
tnam
Co.
Ltd
.0
0
- -
- -
- -
- 0
U
PL P
arag
uay
S.A.
- 1
-
- -
- -
- -
1
Oth
ers
10
- -
- -
0
- 1
0
Not
es to
Sta
ndal
one
Fina
ncia
l Sta
tem
ents
for th
e ye
ar e
nded
Mar
ch 3
1, 2
019
H In
Cro
res
36. R
elat
ed p
arty
tran
sact
ions
(con
td.)
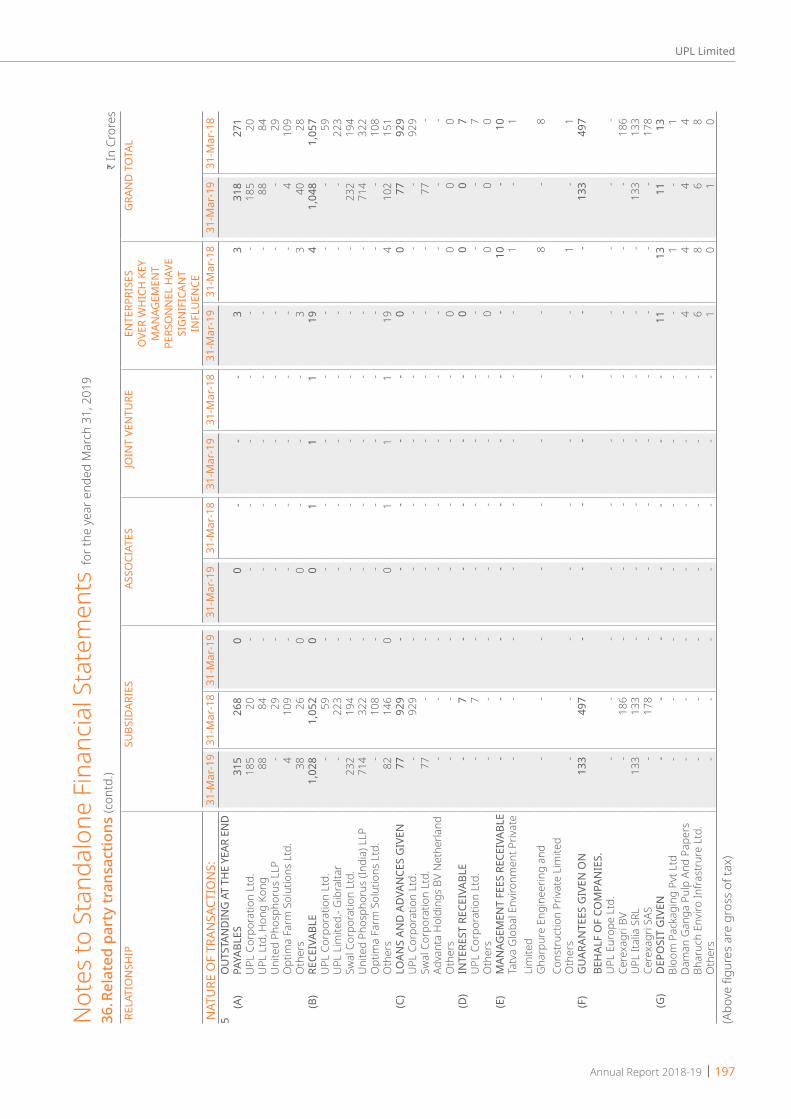
Annual Report 2018-19 | 197
UPL Limited
RELA
TIO
NSH
IP S
UBS
IDAR
IES
ASS
OCI
ATES
JO
INT
VEN
TURE
ENTE
RPRI
SES
OVE
R W
HIC
H K
EY
MAN
AGEM
ENT
PERS
ON
NEL
HAV
E SI
GN
IFIC
ANT
INFL
UEN
CE
GRA
ND
TO
TAL
NAT
URE
OF
TRAN
SACT
ION
S:31
-Mar
-19
31-M
ar-1
831
-Mar
-19
31-M
ar-1
931
-Mar
-18
31-M
ar-1
931
-Mar
-18
31-M
ar-1
931
-Mar
-18
31-M
ar-1
931
-Mar
-18
5O
UTST
ANDI
NG
AT T
HE
YEAR
EN
D(A
)PA
YABL
ES 3
15
268
0
0
-
- -
3
3
318
2
71
UPL
Cor
pora
tion
Ltd.
185
2
0 -
- -
- -
- -
185
2
0 U
PL L
td, H
ong
Kong
88
84
- -
- -
- -
- 8
8 8
4 U
nite
d Ph
osph
orus
LLP
- 2
9 -
- -
- -
- -
- 2
9 O
ptim
a Fa
rm S
olut
ions
Ltd
. 4
1
09
- -
- -
- -
- 4
1
09
Oth
ers
38
26
0
0
- -
- 3
3
4
0 2
8 (B
)RE
CEIV
ABLE
1,0
28
1,0
52
0
0
1
1
1
19
4
1,0
48
1,0
57
UPL
Cor
pora
tion
Ltd.
- 59
- -
- -
- -
- -
59
UPL
Lim
ited.
- Gib
ralta
r -
223
- -
- -
- -
- -
223
Sw
al C
orpo
ratio
n Lt
d. 2
32
194
- -
- -
- -
- 2
32
194
U
nite
d Ph
osph
orus
(Ind
ia) L
LP 7
14
322
- -
- -
- -
- 7
14
322
O
ptim
a Fa
rm S
olut
ions
Ltd
. -
108
-
- -
- -
- -
- 1
08
Oth
ers
82
146
0
0
1
1
1
1
9 4
1
02
151
(C
)LO
ANS
AND
AD
VAN
CES
GIV
EN 7
7 9
29
- -
- -
- 0
0
7
7 9
29
UPL
Cor
pora
tion
Ltd.
- 92
9 -
- -
- -
- -
- 9
29
Swal
Cor
pora
tion
Ltd.
77
--
--
--
--
77-
Adva
nta
Hol
ding
s BV
Net
herla
nd -
- -
- -
- -
- -
- -
Oth
ers
- -
- -
- -
- 0
0
0
0
(D
)IN
TERE
ST R
ECEI
VABL
E -
7
- -
- -
- 0
0
0
7
U
PL C
orpo
ratio
n Lt
d. -
7 -
- -
- -
- -
- 7
O
ther
s -
- -
- -
- -
0
0
0
0
(E)
MAN
AGEM
ENT
FEES
REC
EIVA
BLE
- -
- -
- -
- -
10
- 1
0 Ta
tva
Glo
bal E
nviro
nmen
t Priv
ate
Lim
ited
- -
- -
- -
- -
1
- 1
Gha
rpur
e En
gine
erin
g an
d Co
nstr
uctio
n Pr
ivate
Lim
ited
- -
- -
- -
- -
8
- 8
Oth
ers
- -
- -
- -
- -
1
- 1
(F
)G
UAR
ANTE
ES G
IVEN
ON
BE
HAL
F O
F CO
MPA
NIE
S. 1
33
497
-
- -
- -
- -
133
4
97
UPL
Eur
ope
Ltd.
- -
- -
- -
- -
- -
- Ce
rexa
gri B
V -
186
-
- -
- -
- -
- 1
86
UPL
Ital
ia S
RL 1
33
133
-
- -
- -
- -
133
1
33
Cere
xagr
i SAS
- 1
78
- -
- -
- -
- -
178
(G
)D
EPO
SIT
GIV
EN -
- -
- -
- -
11
13
11
13
Bloo
m P
acka
ging
Pvt
Ltd
- -
- -
- -
- -
1
- 1
Da
man
Gan
ga P
ulp
And
Pape
rs -
- -
- -
- -
4
4
4
4
Bhar
uch
Envir
o In
frast
rure
Ltd
. -
- -
- -
- -
6
8
6
8
Oth
ers
- -
- -
- -
- 1
0
1
0
(A
bove
figu
res
are
gros
s of
tax)
Not
es to
Sta
ndal
one
Fina
ncia
l Sta
tem
ents
for th
e ye
ar e
nded
Mar
ch 3
1, 2
019
H In
Cro
res
36. R
elat
ed p
arty
tran
sact
ions
(con
td.)
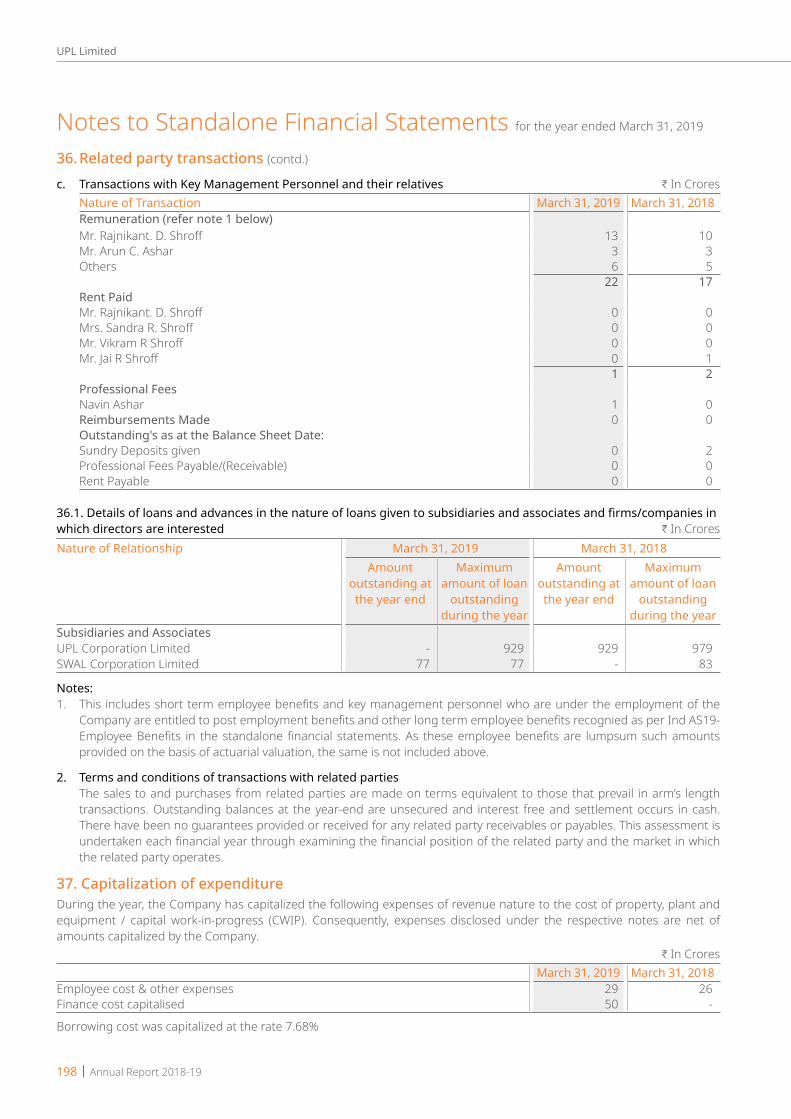
198 | Annual Report 2018-19
UPL Limited
c. Transactions with Key Management Personnel and their relatives H In CroresNature of Transaction March 31, 2019 March 31, 2018Remuneration (refer note 1 below)Mr. Rajnikant. D. Shroff 13 10Mr. Arun C. Ashar 3 3Others 6 5
22 17Rent PaidMr. Rajnikant. D. Shroff 0 0Mrs. Sandra R. Shroff 0 0Mr. Vikram R Shroff 0 0Mr. Jai R Shroff 0 1
1 2Professional FeesNavin Ashar 1 0Reimbursements Made 0 0Outstanding's as at the Balance Sheet Date:Sundry Deposits given 0 2Professional Fees Payable/(Receivable) 0 0Rent Payable 0 0
36.1. Details of loans and advances in the nature of loans given to subsidiaries and associates and firms/companies in which directors are interested H In CroresNature of Relationship March 31, 2019 March 31, 2018
Amount outstanding at the year end
Maximum amount of loan
outstanding during the year
Amount outstanding at the year end
Maximum amount of loan
outstanding during the year
Subsidiaries and AssociatesUPL Corporation Limited - 929 929 979 SWAL Corporation Limited 77 77 - 83
Notes:1. This includes short term employee benefits and key management personnel who are under the employment of the
Company are entitled to post employment benefits and other long term employee benefits recognied as per Ind AS19- Employee Benefits in the standalone financial statements. As these employee benefits are lumpsum such amounts provided on the basis of actuarial valuation, the same is not included above.
2. Terms and conditions of transactions with related parties The sales to and purchases from related parties are made on terms equivalent to those that prevail in arm’s length
transactions. Outstanding balances at the year-end are unsecured and interest free and settlement occurs in cash. There have been no guarantees provided or received for any related party receivables or payables. This assessment is undertaken each financial year through examining the financial position of the related party and the market in which the related party operates.
37. Capitalization of expenditureDuring the year, the Company has capitalized the following expenses of revenue nature to the cost of property, plant and equipment / capital work-in-progress (CWIP). Consequently, expenses disclosed under the respective notes are net of amounts capitalized by the Company.
H In CroresMarch 31, 2019 March 31, 2018
Employee cost & other expenses 29 26 Finance cost capitalised 50 -
Borrowing cost was capitalized at the rate 7.68%
Notes to Standalone Financial Statements for the year ended March 31, 2019
36. Related party transactions (contd.)
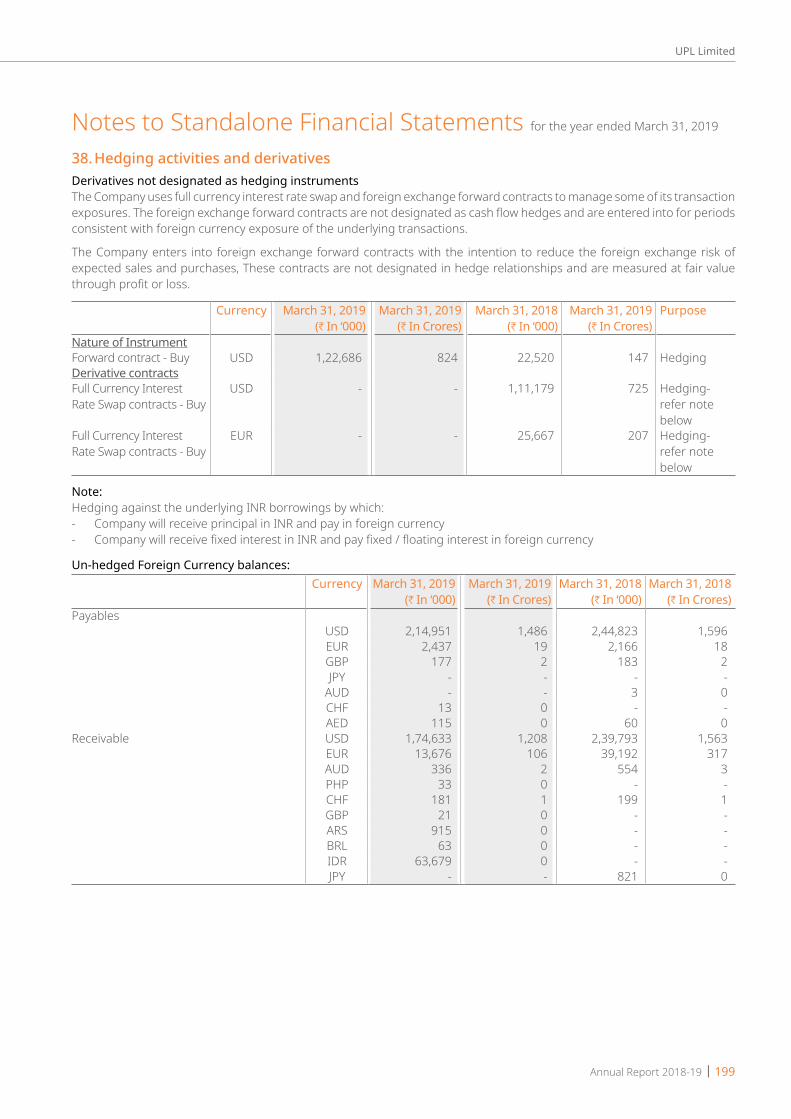
Annual Report 2018-19 | 199
UPL Limited
38. Hedging activities and derivativesDerivatives not designated as hedging instrumentsThe Company uses full currency interest rate swap and foreign exchange forward contracts to manage some of its transaction exposures. The foreign exchange forward contracts are not designated as cash flow hedges and are entered into for periods consistent with foreign currency exposure of the underlying transactions.
The Company enters into foreign exchange forward contracts with the intention to reduce the foreign exchange risk of expected sales and purchases, These contracts are not designated in hedge relationships and are measured at fair value through profit or loss.
Currency March 31, 2019(H In ‘000)
March 31, 2019 (H In Crores)
March 31, 2018 (H In ‘000)
March 31, 2019 (H In Crores)
Purpose
Nature of InstrumentForward contract - Buy USD 1,22,686 824 22,520 147 HedgingDerivative contractsFull Currency Interest Rate Swap contracts - Buy
USD - - 1,11,179 725 Hedging-refer note below
Full Currency Interest Rate Swap contracts - Buy
EUR - - 25,667 207 Hedging-refer note below
Note:Hedging against the underlying INR borrowings by which:- Company will receive principal in INR and pay in foreign currency- Company will receive fixed interest in INR and pay fixed / floating interest in foreign currency
Un-hedged Foreign Currency balances: Currency March 31, 2019
(H In ‘000)March 31, 2019
(H In Crores)March 31, 2018
(H In ‘000)March 31, 2018
(H In Crores)Payables
USD 2,14,951 1,486 2,44,823 1,596EUR 2,437 19 2,166 18GBP 177 2 183 2JPY - - - -
AUD - - 3 0CHF 13 0 - -AED 115 0 60 0
Receivable USD 1,74,633 1,208 2,39,793 1,563EUR 13,676 106 39,192 317AUD 336 2 554 3PHP 33 0 - -CHF 181 1 199 1GBP 21 0 - -ARS 915 0 - -BRL 63 0 - -IDR 63,679 0 - -JPY - - 821 0
Notes to Standalone Financial Statements for the year ended March 31, 2019
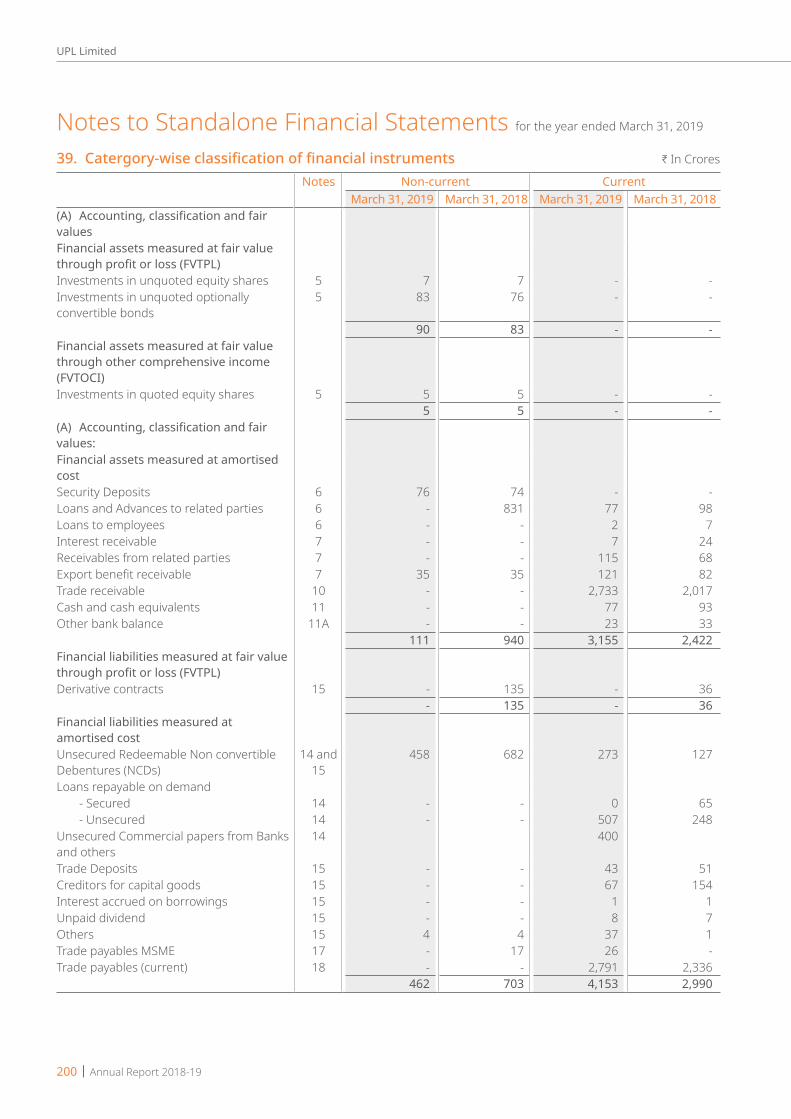
200 | Annual Report 2018-19
UPL Limited
39.Catergory-wiseclassificationoffinancialinstruments H In Crores
Notes Non-current CurrentMarch 31, 2019 March 31, 2018 March 31, 2019 March 31, 2018
(A) Accounting, classification and fair valuesFinancial assets measured at fair value through profit or loss (FVTPL)Investments in unquoted equity shares 5 7 7 - -Investments in unquoted optionally convertible bonds
5 83 76 - -
90 83 - -Financial assets measured at fair value through other comprehensive income (FVTOCI)Investments in quoted equity shares 5 5 5 - -
5 5 - -(A) Accounting, classification and fair values:Financial assets measured at amortised costSecurity Deposits 6 76 74 - -Loans and Advances to related parties 6 - 831 77 98Loans to employees 6 - - 2 7Interest receivable 7 - - 7 24Receivables from related parties 7 - - 115 68Export benefit receivable 7 35 35 121 82Trade receivable 10 - - 2,733 2,017Cash and cash equivalents 11 - - 77 93Other bank balance 11A - - 23 33
111 940 3,155 2,422Financial liabilities measured at fair value through profit or loss (FVTPL)Derivative contracts 15 - 135 - 36
- 135 - 36Financial liabilities measured at amortised costUnsecured Redeemable Non convertible Debentures (NCDs)
14 and 15
458 682 273 127
Loans repayable on demand - Secured 14 - - 0 65 - Unsecured 14 - - 507 248Unsecured Commercial papers from Banks and others
14 400
Trade Deposits 15 - - 43 51Creditors for capital goods 15 - - 67 154Interest accrued on borrowings 15 - - 1 1Unpaid dividend 15 - - 8 7Others 15 4 4 37 1Trade payables MSME 17 - 17 26 -Trade payables (current) 18 - - 2,791 2,336
462 703 4,153 2,990
Notes to Standalone Financial Statements for the year ended March 31, 2019
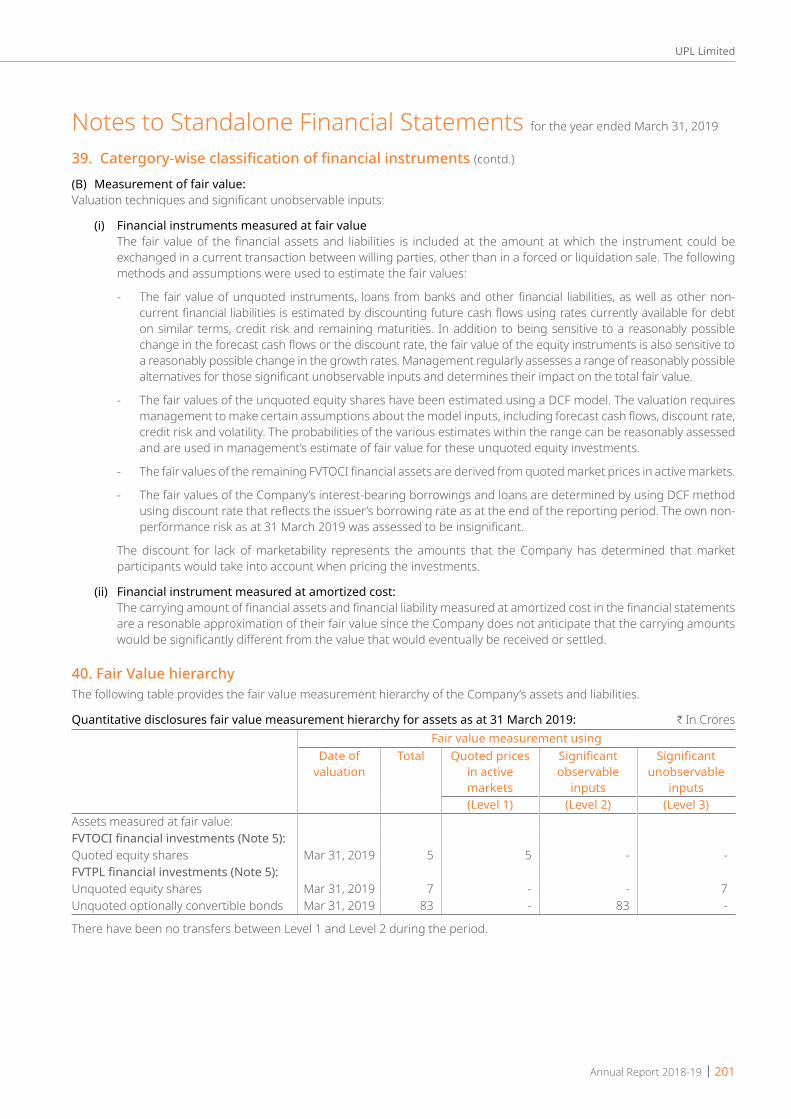
Annual Report 2018-19 | 201
UPL Limited
(B) Measurement of fair value:Valuation techniques and significant unobservable inputs:
(i) Financial instruments measured at fair value The fair value of the financial assets and liabilities is included at the amount at which the instrument could be
exchanged in a current transaction between willing parties, other than in a forced or liquidation sale. The following methods and assumptions were used to estimate the fair values:
- The fair value of unquoted instruments, loans from banks and other financial liabilities, as well as other non-current financial liabilities is estimated by discounting future cash flows using rates currently available for debt on similar terms, credit risk and remaining maturities. In addition to being sensitive to a reasonably possible change in the forecast cash flows or the discount rate, the fair value of the equity instruments is also sensitive to a reasonably possible change in the growth rates. Management regularly assesses a range of reasonably possible alternatives for those significant unobservable inputs and determines their impact on the total fair value.
- The fair values of the unquoted equity shares have been estimated using a DCF model. The valuation requires management to make certain assumptions about the model inputs, including forecast cash flows, discount rate, credit risk and volatility. The probabilities of the various estimates within the range can be reasonably assessed and are used in management’s estimate of fair value for these unquoted equity investments.
- The fair values of the remaining FVTOCI financial assets are derived from quoted market prices in active markets.
- The fair values of the Company’s interest-bearing borrowings and loans are determined by using DCF method using discount rate that reflects the issuer’s borrowing rate as at the end of the reporting period. The own non-performance risk as at 31 March 2019 was assessed to be insignificant.
The discount for lack of marketability represents the amounts that the Company has determined that market participants would take into account when pricing the investments.
(ii) Financial instrument measured at amortized cost: The carrying amount of financial assets and financial liability measured at amortized cost in the financial statements
are a resonable approximation of their fair value since the Company does not anticipate that the carrying amounts would be significantly different from the value that would eventually be received or settled.
40. Fair Value hierarchyThe following table provides the fair value measurement hierarchy of the Company’s assets and liabilities.
Quantitative disclosures fair value measurement hierarchy for assets as at 31 March 2019: H In CroresFair value measurement using
Date of valuation
Total Quoted prices in active markets
Significant observable
inputs
Significant unobservable
inputs(Level 1) (Level 2) (Level 3)
Assets measured at fair value:FVTOCI financial investments (Note 5):Quoted equity shares Mar 31, 2019 5 5 - -FVTPL financial investments (Note 5):Unquoted equity shares Mar 31, 2019 7 - - 7Unquoted optionally convertible bonds Mar 31, 2019 83 - 83 -
There have been no transfers between Level 1 and Level 2 during the period.
Notes to Standalone Financial Statements for the year ended March 31, 2019
39.Catergory-wiseclassificationoffinancialinstruments(contd.)
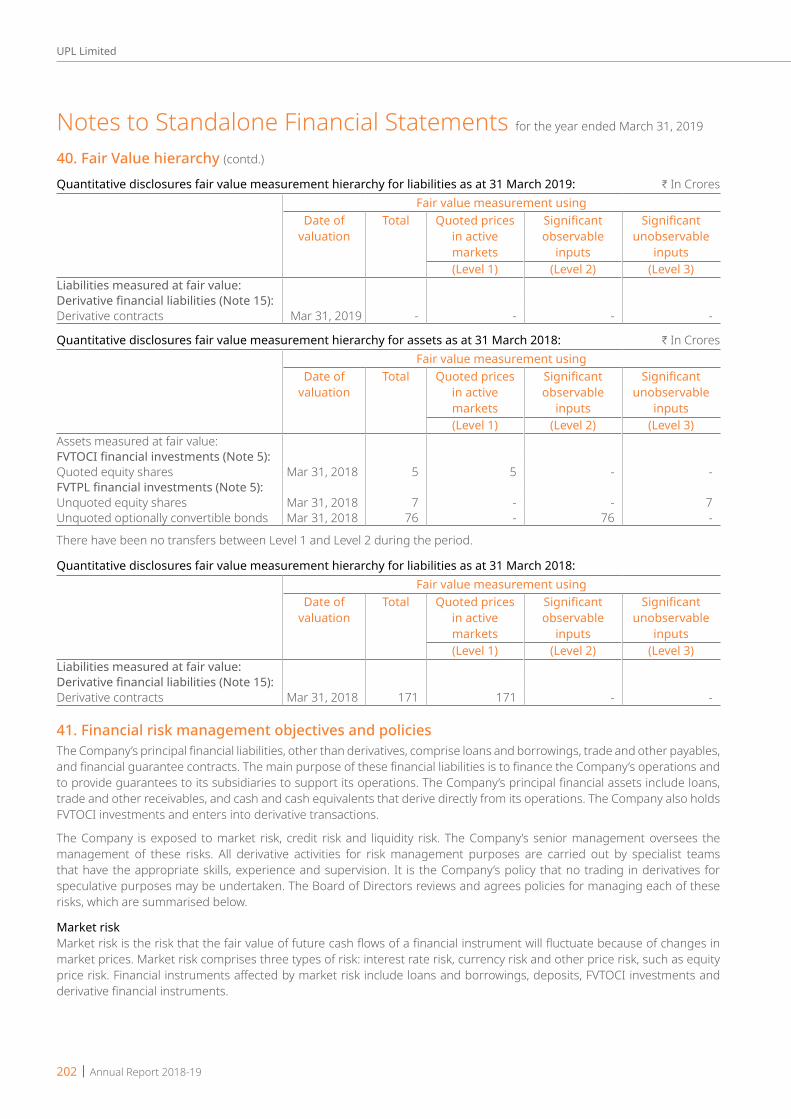
202 | Annual Report 2018-19
UPL Limited
Quantitative disclosures fair value measurement hierarchy for liabilities as at 31 March 2019: H In CroresFair value measurement using
Date of valuation
Total Quoted prices in active markets
Significant observable
inputs
Significant unobservable
inputs(Level 1) (Level 2) (Level 3)
Liabilities measured at fair value:Derivative financial liabilities (Note 15):Derivative contracts Mar 31, 2019 - - - -
Quantitative disclosures fair value measurement hierarchy for assets as at 31 March 2018: H In CroresFair value measurement using
Date of valuation
Total Quoted prices in active markets
Significant observable
inputs
Significant unobservable
inputs(Level 1) (Level 2) (Level 3)
Assets measured at fair value:FVTOCI financial investments (Note 5):Quoted equity shares Mar 31, 2018 5 5 - -FVTPL financial investments (Note 5):Unquoted equity shares Mar 31, 2018 7 - - 7Unquoted optionally convertible bonds Mar 31, 2018 76 - 76 -
There have been no transfers between Level 1 and Level 2 during the period.
Quantitative disclosures fair value measurement hierarchy for liabilities as at 31 March 2018:Fair value measurement using
Date of valuation
Total Quoted prices in active markets
Significant observable
inputs
Significant unobservable
inputs(Level 1) (Level 2) (Level 3)
Liabilities measured at fair value:Derivative financial liabilities (Note 15):Derivative contracts Mar 31, 2018 171 171 - -
41. Financial risk management objectives and policiesThe Company’s principal financial liabilities, other than derivatives, comprise loans and borrowings, trade and other payables, and financial guarantee contracts. The main purpose of these financial liabilities is to finance the Company’s operations and to provide guarantees to its subsidiaries to support its operations. The Company’s principal financial assets include loans, trade and other receivables, and cash and cash equivalents that derive directly from its operations. The Company also holds FVTOCI investments and enters into derivative transactions.
The Company is exposed to market risk, credit risk and liquidity risk. The Company’s senior management oversees the management of these risks. All derivative activities for risk management purposes are carried out by specialist teams that have the appropriate skills, experience and supervision. It is the Company’s policy that no trading in derivatives for speculative purposes may be undertaken. The Board of Directors reviews and agrees policies for managing each of these risks, which are summarised below.
Market riskMarket risk is the risk that the fair value of future cash flows of a financial instrument will fluctuate because of changes in market prices. Market risk comprises three types of risk: interest rate risk, currency risk and other price risk, such as equity price risk. Financial instruments affected by market risk include loans and borrowings, deposits, FVTOCI investments and derivative financial instruments.
Notes to Standalone Financial Statements for the year ended March 31, 2019
40. Fair Value hierarchy (contd.)
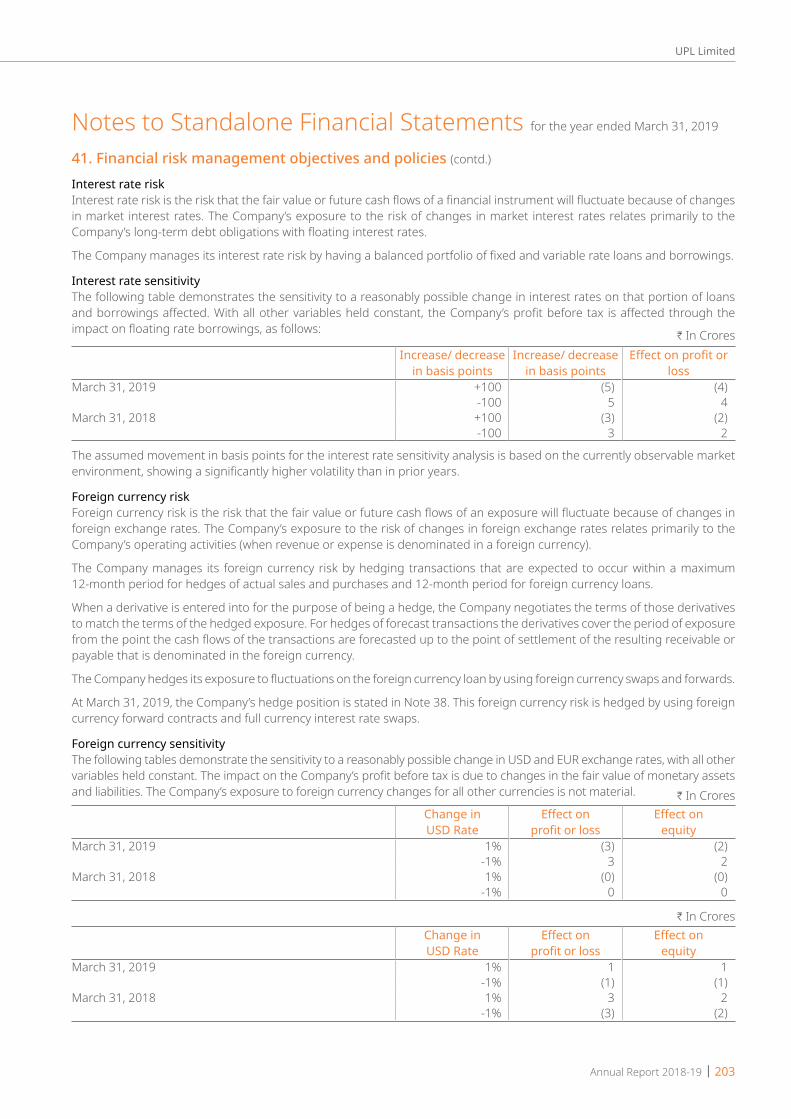
Annual Report 2018-19 | 203
UPL Limited
Interest rate riskInterest rate risk is the risk that the fair value or future cash flows of a financial instrument will fluctuate because of changes in market interest rates. The Company’s exposure to the risk of changes in market interest rates relates primarily to the Company’s long-term debt obligations with floating interest rates.
The Company manages its interest rate risk by having a balanced portfolio of fixed and variable rate loans and borrowings.
Interest rate sensitivityThe following table demonstrates the sensitivity to a reasonably possible change in interest rates on that portion of loans and borrowings affected. With all other variables held constant, the Company’s profit before tax is affected through the impact on floating rate borrowings, as follows:
H In CroresIncrease/ decrease
in basis pointsIncrease/ decrease
in basis pointsEffect on profit or
lossMarch 31, 2019 +100 (5) (4)
-100 5 4March 31, 2018 +100 (3) (2)
-100 3 2
The assumed movement in basis points for the interest rate sensitivity analysis is based on the currently observable market environment, showing a significantly higher volatility than in prior years.
Foreign currency riskForeign currency risk is the risk that the fair value or future cash flows of an exposure will fluctuate because of changes in foreign exchange rates. The Company’s exposure to the risk of changes in foreign exchange rates relates primarily to the Company’s operating activities (when revenue or expense is denominated in a foreign currency).
The Company manages its foreign currency risk by hedging transactions that are expected to occur within a maximum 12-month period for hedges of actual sales and purchases and 12-month period for foreign currency loans.
When a derivative is entered into for the purpose of being a hedge, the Company negotiates the terms of those derivatives to match the terms of the hedged exposure. For hedges of forecast transactions the derivatives cover the period of exposure from the point the cash flows of the transactions are forecasted up to the point of settlement of the resulting receivable or payable that is denominated in the foreign currency.
The Company hedges its exposure to fluctuations on the foreign currency loan by using foreign currency swaps and forwards.
At March 31, 2019, the Company’s hedge position is stated in Note 38. This foreign currency risk is hedged by using foreign currency forward contracts and full currency interest rate swaps.
Foreign currency sensitivityThe following tables demonstrate the sensitivity to a reasonably possible change in USD and EUR exchange rates, with all other variables held constant. The impact on the Company’s profit before tax is due to changes in the fair value of monetary assets and liabilities. The Company’s exposure to foreign currency changes for all other currencies is not material. H In Crores
Change in USD Rate
Effect on profit or loss
Effect on equity
March 31, 2019 1% (3) (2)-1% 3 2
March 31, 2018 1% (0) (0)-1% 0 0
H In CroresChange in USD Rate
Effect on profit or loss
Effect on equity
March 31, 2019 1% 1 1 -1% (1) (1)
March 31, 2018 1% 3 2 -1% (3) (2)
Notes to Standalone Financial Statements for the year ended March 31, 2019
41. Financial risk management objectives and policies (contd.)

204 | Annual Report 2018-19
UPL Limited
The movement in the pre-tax effect is a result of a change in the fair value of monetary assets and liabilities denominated in US dollars, where the functional currency of the entity is a currency other than US dollars. Although the derivatives have not been designated in a hedge relationship, they act as an economic hedge and will offset the underlying transactions when they occur.
Equity price riskThe Company’s listed and non-listed equity securities are susceptible to market price risk arising from uncertainties about future values of the investment securities. The investment in listed and unlisted equity securities are not significant.Credit riskCredit risk is the risk that counterparty will not meet its obligations under a financial instrument or customer contract, leading to a financial loss. The Company is exposed to credit risk from its operating activities (primarily trade receivables) and from its financing activities, including deposits with banks and financial institutions, foreign exchange transactions and other financial instruments.Financial instruments and cash depositsCredit risk from balances with banks and financial institutions is managed by the Company’s treasury department. Investments of surplus funds are made only with approved counterparties and within credit limits assigned to each counterparty. The limits are set to minimise the concentration of risks and therefore mitigate financial loss through counterparty’s potential failure to make payments.The Company’s maximum exposure to credit risk for the components of the balance sheet at March 31, 2019, 31 March 2018 is the carrying amounts as illustrated in Note 10 except for financial guarantees and derivative financial instruments.Liquidity riskLiquidity risk is the risk that the Company will not be able to meet its financial obligations as they fall due. The Company’s approach to managing liquidity is to ensure, as far as possible, that it will always have sufficient liquidity to meet its liabilities when due, under both normal and stressed conditions, without incurring unacceptable losses or risking damage to the Company’s reputation.The Company manages liquidity risk by maintaining adequate reserves, by continuously monitoring forecast and actual cash flows and matching the maturity profiles of the financial assets and liabilities.The table below summarises the maturity profile of the Company’s financial liabilities based on contractual undiscounted payments.
H In CroresMarch 31, 2019
Less than 1 year 1 to 5 years > 5 years TotalBorrowings (other than convertible preference shares) (refer note 14)
507 209 249 965
Convertible preference shares (refer note 15) - - - -Other financial liabilities (refer note 15) 429 4 - 433Trade and other payables (refer note 17 and 18) 2,817 - - 2,817Derivative contracts (refer note 15) - - - -
3,753 213 249 4,215
H In CroresMarch 31, 2019
Less than 1 year 1 to 5 years > 5 years TotalBorrowings (other than convertible preference shares) (refer note 14)
313 413 269 995
Convertible preference shares (refer note 15) - - - - Other financial liabilities (refer note 15) 341 4 - 345 Trade and other payables (refer note 17 and 18) 2,353 - - 2,353 Derivative contracts (refer note 15) 36 135 - 171
3,043 552 269 3,864
Notes to Standalone Financial Statements for the year ended March 31, 2019
41. Financial risk management objectives and policies (contd.)
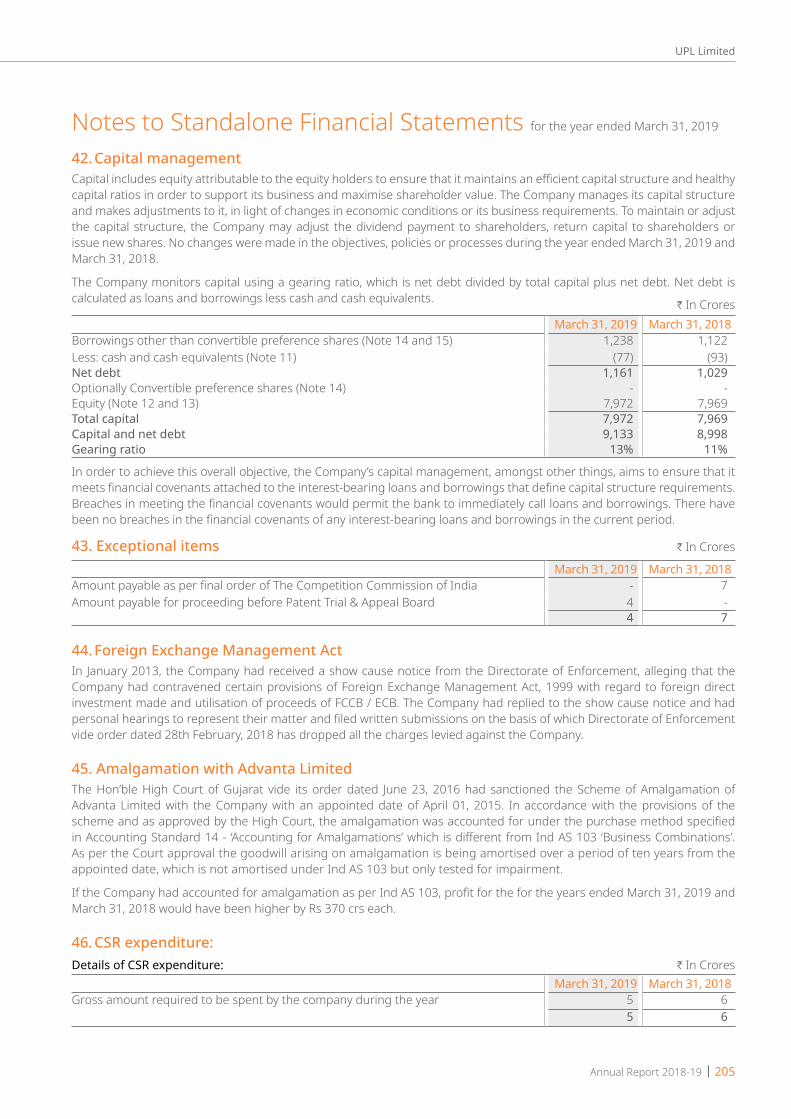
Annual Report 2018-19 | 205
UPL Limited
42. Capital managementCapital includes equity attributable to the equity holders to ensure that it maintains an efficient capital structure and healthy capital ratios in order to support its business and maximise shareholder value. The Company manages its capital structure and makes adjustments to it, in light of changes in economic conditions or its business requirements. To maintain or adjust the capital structure, the Company may adjust the dividend payment to shareholders, return capital to shareholders or issue new shares. No changes were made in the objectives, policies or processes during the year ended March 31, 2019 and March 31, 2018.
The Company monitors capital using a gearing ratio, which is net debt divided by total capital plus net debt. Net debt is calculated as loans and borrowings less cash and cash equivalents.
H In CroresMarch 31, 2019 March 31, 2018
Borrowings other than convertible preference shares (Note 14 and 15) 1,238 1,122Less: cash and cash equivalents (Note 11) (77) (93)Net debt 1,161 1,029Optionally Convertible preference shares (Note 14) - -Equity (Note 12 and 13) 7,972 7,969Total capital 7,972 7,969Capital and net debt 9,133 8,998 Gearing ratio 13% 11%
In order to achieve this overall objective, the Company’s capital management, amongst other things, aims to ensure that it meets financial covenants attached to the interest-bearing loans and borrowings that define capital structure requirements. Breaches in meeting the financial covenants would permit the bank to immediately call loans and borrowings. There have been no breaches in the financial covenants of any interest-bearing loans and borrowings in the current period.
43. Exceptional items H In Crores
March 31, 2019 March 31, 2018Amount payable as per final order of The Competition Commission of India - 7Amount payable for proceeding before Patent Trial & Appeal Board 4 -
4 7
44. Foreign Exchange Management ActIn January 2013, the Company had received a show cause notice from the Directorate of Enforcement, alleging that the Company had contravened certain provisions of Foreign Exchange Management Act, 1999 with regard to foreign direct investment made and utilisation of proceeds of FCCB / ECB. The Company had replied to the show cause notice and had personal hearings to represent their matter and filed written submissions on the basis of which Directorate of Enforcement vide order dated 28th February, 2018 has dropped all the charges levied against the Company.
45. Amalgamation with Advanta LimitedThe Hon’ble High Court of Gujarat vide its order dated June 23, 2016 had sanctioned the Scheme of Amalgamation of Advanta Limited with the Company with an appointed date of April 01, 2015. In accordance with the provisions of the scheme and as approved by the High Court, the amalgamation was accounted for under the purchase method specified in Accounting Standard 14 - ‘Accounting for Amalgamations’ which is different from Ind AS 103 ‘Business Combinations’. As per the Court approval the goodwill arising on amalgamation is being amortised over a period of ten years from the appointed date, which is not amortised under Ind AS 103 but only tested for impairment.
If the Company had accounted for amalgamation as per Ind AS 103, profit for the for the years ended March 31, 2019 and March 31, 2018 would have been higher by Rs 370 crs each.
46. CSR expenditure:Details of CSR expenditure: H In Crores
March 31, 2019 March 31, 2018Gross amount required to be spent by the company during the year 5 6
5 6
Notes to Standalone Financial Statements for the year ended March 31, 2019
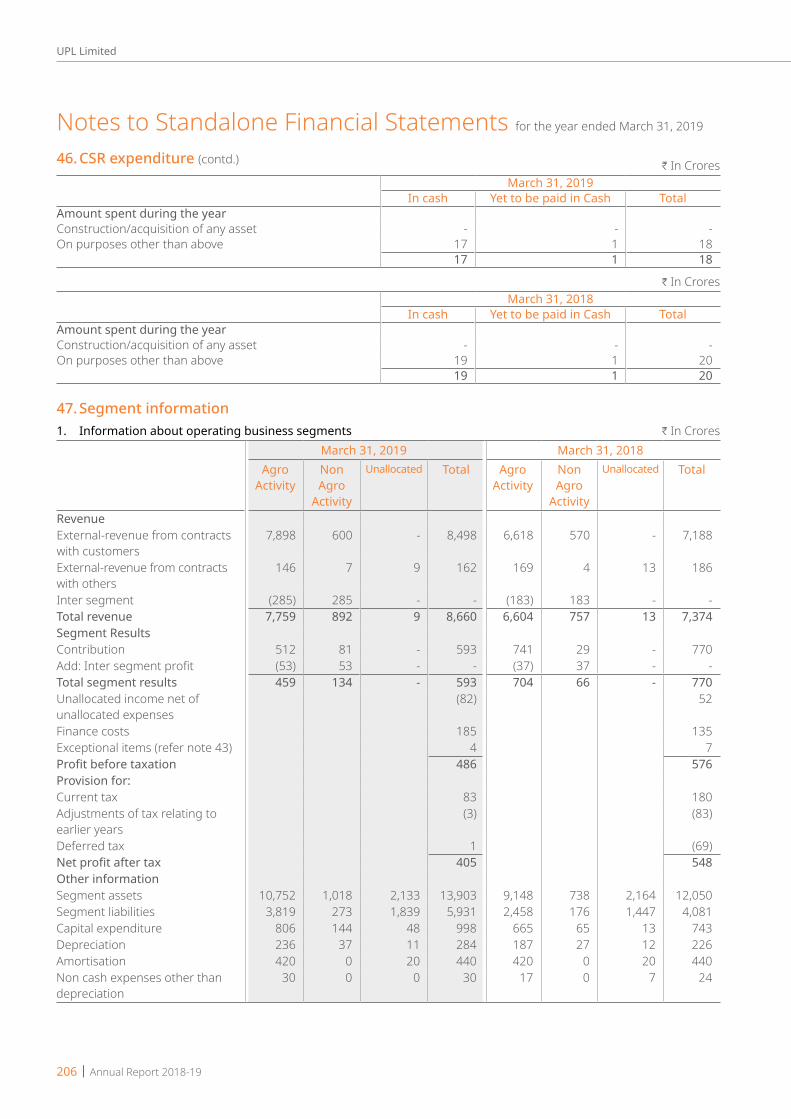
206 | Annual Report 2018-19
UPL Limited
H In CroresMarch 31, 2019
In cash Yet to be paid in Cash TotalAmount spent during the year Construction/acquisition of any asset - - - On purposes other than above 17 1 18
17 1 18
H In CroresMarch 31, 2018
In cash Yet to be paid in Cash TotalAmount spent during the year Construction/acquisition of any asset - - - On purposes other than above 19 1 20
19 1 20
47. Segment information1. Information about operating business segments H In Crores
March 31, 2019 March 31, 2018Agro
ActivityNon Agro
Activity
Unallocated Total Agro Activity
Non Agro
Activity
Unallocated Total
RevenueExternal-revenue from contracts with customers
7,898 600 - 8,498 6,618 570 - 7,188
External-revenue from contracts with others
146 7 9 162 169 4 13 186
Inter segment (285) 285 - - (183) 183 - -Total revenue 7,759 892 9 8,660 6,604 757 13 7,374Segment ResultsContribution 512 81 - 593 741 29 - 770Add: Inter segment profit (53) 53 - - (37) 37 - -Total segment results 459 134 - 593 704 66 - 770Unallocated income net of unallocated expenses
(82) 52
Finance costs 185 135Exceptional items (refer note 43) 4 7Profit before taxation 486 576Provision for:Current tax 83 180Adjustments of tax relating to earlier years
(3) (83)
Deferred tax 1 (69)Net profit after tax 405 548Other informationSegment assets 10,752 1,018 2,133 13,903 9,148 738 2,164 12,050Segment liabilities 3,819 273 1,839 5,931 2,458 176 1,447 4,081Capital expenditure 806 144 48 998 665 65 13 743Depreciation 236 37 11 284 187 27 12 226Amortisation 420 0 20 440 420 0 20 440Non cash expenses other than depreciation
30 0 0 30 17 0 7 24
Notes to Standalone Financial Statements for the year ended March 31, 2019
46. CSR expenditure (contd.)
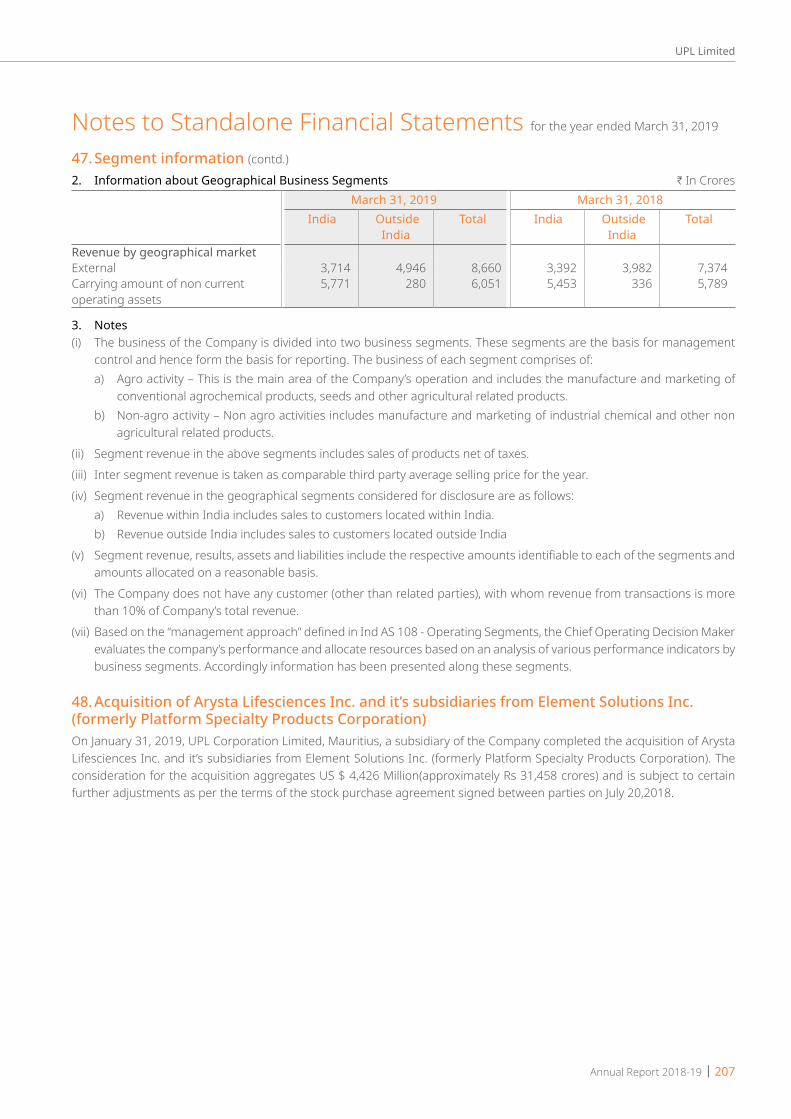
Annual Report 2018-19 | 207
UPL Limited
2. Information about Geographical Business Segments H In CroresMarch 31, 2019 March 31, 2018
India Outside India
Total India Outside India
Total
Revenue by geographical marketExternal 3,714 4,946 8,660 3,392 3,982 7,374 Carrying amount of non current operating assets
5,771 280 6,051 5,453 336 5,789
3. Notes(i) The business of the Company is divided into two business segments. These segments are the basis for management
control and hence form the basis for reporting. The business of each segment comprises of: a) Agro activity – This is the main area of the Company’s operation and includes the manufacture and marketing of
conventional agrochemical products, seeds and other agricultural related products. b) Non-agro activity – Non agro activities includes manufacture and marketing of industrial chemical and other non
agricultural related products.(ii) Segment revenue in the above segments includes sales of products net of taxes.(iii) Inter segment revenue is taken as comparable third party average selling price for the year.(iv) Segment revenue in the geographical segments considered for disclosure are as follows: a) Revenue within India includes sales to customers located within India. b) Revenue outside India includes sales to customers located outside India(v) Segment revenue, results, assets and liabilities include the respective amounts identifiable to each of the segments and
amounts allocated on a reasonable basis.(vi) The Company does not have any customer (other than related parties), with whom revenue from transactions is more
than 10% of Company’s total revenue.(vii) Based on the “management approach” defined in Ind AS 108 - Operating Segments, the Chief Operating Decision Maker
evaluates the company’s performance and allocate resources based on an analysis of various performance indicators by business segments. Accordingly information has been presented along these segments.
48. Acquisition of Arysta Lifesciences Inc. and it’s subsidiaries from Element Solutions Inc. (formerlyPlatformSpecialtyProductsCorporation)On January 31, 2019, UPL Corporation Limited, Mauritius, a subsidiary of the Company completed the acquisition of Arysta Lifesciences Inc. and it’s subsidiaries from Element Solutions Inc. (formerly Platform Specialty Products Corporation). The consideration for the acquisition aggregates US $ 4,426 Million(approximately Rs 31,458 crores) and is subject to certain further adjustments as per the terms of the stock purchase agreement signed between parties on July 20,2018.
Notes to Standalone Financial Statements for the year ended March 31, 2019
47. Segment information (contd.)

208 | Annual Report 2018-19
UPL Limited
Notes to Standalone Financial Statements for the year ended March 31, 2019
49.DetailsofduestomicroandsmallenterprisesasdefinedundertheMSMEDAct,2006 H In Crores
March 31, 2019 March 31, 2018The principal amount and interest due thereon remaining unpaid to any supplier as at the end of each accounting year:Principal amount due to micro and small enterprises 26 17 Interest due on above, current year Rs. 0 (March 31, 2018: Rs 0) 0 0 Total 26 17 The amount of interest paid by the buyer in terms of section 16 of the MSMED Act 2006 along with the amounts of the payment made to the supplier beyond the appointed day during each accounting year
- -
The amount of interest due and payable for the period of delay in making payment (which have been paid but beyond the appointed day during the year) but without adding the interest specified under the MSMED Act, 2006.
- -
The amount of interest accrued and remaining unpaid at the end of each accounting year, current year Rs. 0 (March 31, 2018: Rs. 0)The amount of further interest remaining due and payable even in the succeeding years, until such date when the interest dues as above are actually paid to the small enterprise for the purpose of disallowance as a deductible expenditure u/s 23 of MSMED Act, 2006.
Note: The information has been given in respect of such vendors to the extent they could be identified as Micro, and Small enterprises on the basis of information available with the Company.
As per our report of even date attached.For B S R & Co. LLP For and on behalf of the Board of Directors of UPL LimitedChartered Accountants CIN No.-L24219GJ1985PLC025132Firm registration number: 101248W/W-100022
Bhavesh Dhupelia R.D. Shroff A.C. AsharPartner Chairman & Managing Director Whole-time DirectorMembership no.: 042070 Din No.-00180810 Din No.- 00192088 Place: Mumbai Place: Mumbai
Anand Vora M.B.Trivedi Chief Financial Officer Company Secretary Membership no.: ACS4250 Place: Mumbai Place: San Francisco Date: May 17, 2019
Place: MumbaiDate: May 17, 2019
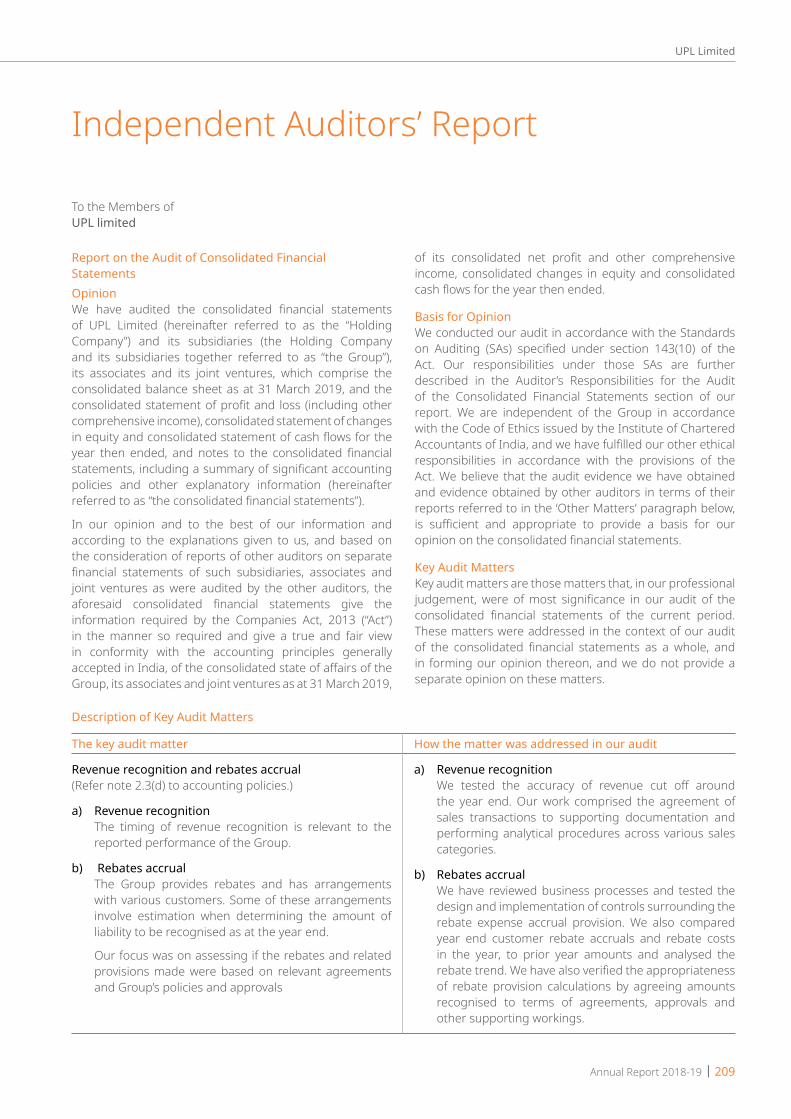
Annual Report 2018-19 | 209
UPL Limited
To the Members of UPL limited
Report on the Audit of Consolidated Financial StatementsOpinionWe have audited the consolidated financial statements of UPL Limited (hereinafter referred to as the “Holding Company”) and its subsidiaries (the Holding Company and its subsidiaries together referred to as “the Group”), its associates and its joint ventures, which comprise the consolidated balance sheet as at 31 March 2019, and the consolidated statement of profit and loss (including other comprehensive income), consolidated statement of changes in equity and consolidated statement of cash flows for the year then ended, and notes to the consolidated financial statements, including a summary of significant accounting policies and other explanatory information (hereinafter referred to as “the consolidated financial statements”).
In our opinion and to the best of our information and according to the explanations given to us, and based on the consideration of reports of other auditors on separate financial statements of such subsidiaries, associates and joint ventures as were audited by the other auditors, the aforesaid consolidated financial statements give the information required by the Companies Act, 2013 (“Act”) in the manner so required and give a true and fair view in conformity with the accounting principles generally accepted in India, of the consolidated state of affairs of the Group, its associates and joint ventures as at 31 March 2019,
of its consolidated net profit and other comprehensive income, consolidated changes in equity and consolidated cash flows for the year then ended.
Basis for OpinionWe conducted our audit in accordance with the Standards on Auditing (SAs) specified under section 143(10) of the Act. Our responsibilities under those SAs are further described in the Auditor’s Responsibilities for the Audit of the Consolidated Financial Statements section of our report. We are independent of the Group in accordance with the Code of Ethics issued by the Institute of Chartered Accountants of India, and we have fulfilled our other ethical responsibilities in accordance with the provisions of the Act. We believe that the audit evidence we have obtained and evidence obtained by other auditors in terms of their reports referred to in the ‘Other Matters’ paragraph below, is sufficient and appropriate to provide a basis for our opinion on the consolidated financial statements.
Key Audit MattersKey audit matters are those matters that, in our professional judgement, were of most significance in our audit of the consolidated financial statements of the current period. These matters were addressed in the context of our audit of the consolidated financial statements as a whole, and in forming our opinion thereon, and we do not provide a separate opinion on these matters.
Independent Auditors’ Report
The key audit matter How the matter was addressed in our audit
Revenue recognition and rebates accrual(Refer note 2.3(d) to accounting policies.)
a) Revenue recognition The timing of revenue recognition is relevant to the
reported performance of the Group.
b) Rebates accrual The Group provides rebates and has arrangements
with various customers. Some of these arrangements involve estimation when determining the amount of liability to be recognised as at the year end.
Our focus was on assessing if the rebates and related provisions made were based on relevant agreements and Group’s policies and approvals
a) Revenue recognition We tested the accuracy of revenue cut off around
the year end. Our work comprised the agreement of sales transactions to supporting documentation and performing analytical procedures across various sales categories.
b) Rebates accrual We have reviewed business processes and tested the
design and implementation of controls surrounding the rebate expense accrual provision. We also compared year end customer rebate accruals and rebate costs in the year, to prior year amounts and analysed the rebate trend. We have also verified the appropriateness of rebate provision calculations by agreeing amounts recognised to terms of agreements, approvals and other supporting workings.
Description of Key Audit Matters
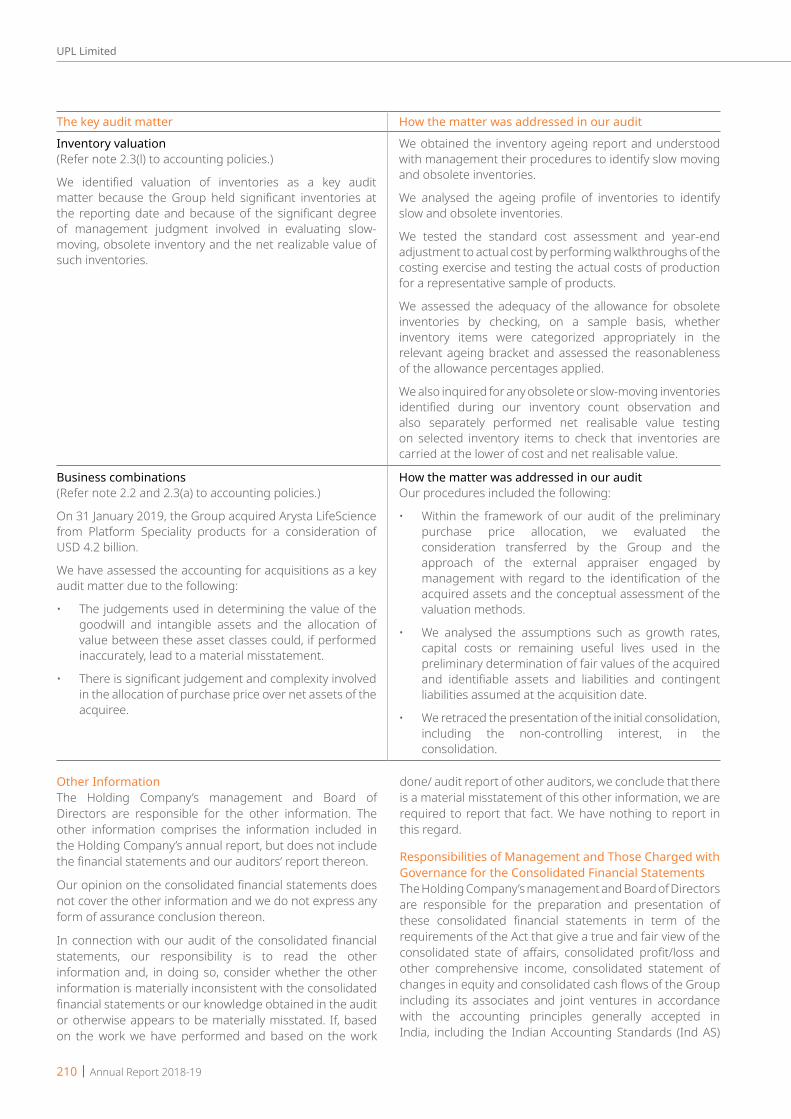
210 | Annual Report 2018-19
UPL Limited
Other InformationThe Holding Company’s management and Board of Directors are responsible for the other information. The other information comprises the information included in the Holding Company’s annual report, but does not include the financial statements and our auditors’ report thereon.
Our opinion on the consolidated financial statements does not cover the other information and we do not express any form of assurance conclusion thereon.
In connection with our audit of the consolidated financial statements, our responsibility is to read the other information and, in doing so, consider whether the other information is materially inconsistent with the consolidated financial statements or our knowledge obtained in the audit or otherwise appears to be materially misstated. If, based on the work we have performed and based on the work
done/ audit report of other auditors, we conclude that there is a material misstatement of this other information, we are required to report that fact. We have nothing to report in this regard.
Responsibilities of Management and Those Charged with Governance for the Consolidated Financial Statements The Holding Company’s management and Board of Directors are responsible for the preparation and presentation of these consolidated financial statements in term of the requirements of the Act that give a true and fair view of the consolidated state of affairs, consolidated profit/loss and other comprehensive income, consolidated statement of changes in equity and consolidated cash flows of the Group including its associates and joint ventures in accordance with the accounting principles generally accepted in India, including the Indian Accounting Standards (Ind AS)
The key audit matter How the matter was addressed in our audit
Inventory valuation(Refer note 2.3(l) to accounting policies.)
We identified valuation of inventories as a key audit matter because the Group held significant inventories at the reporting date and because of the significant degree of management judgment involved in evaluating slow- moving, obsolete inventory and the net realizable value of such inventories.
We obtained the inventory ageing report and understood with management their procedures to identify slow moving and obsolete inventories.
We analysed the ageing profile of inventories to identify slow and obsolete inventories.
We tested the standard cost assessment and year-end adjustment to actual cost by performing walkthroughs of the costing exercise and testing the actual costs of production for a representative sample of products.
We assessed the adequacy of the allowance for obsolete inventories by checking, on a sample basis, whether inventory items were categorized appropriately in the relevant ageing bracket and assessed the reasonableness of the allowance percentages applied.
We also inquired for any obsolete or slow-moving inventories identified during our inventory count observation and also separately performed net realisable value testing on selected inventory items to check that inventories are carried at the lower of cost and net realisable value.
Business combinations(Refer note 2.2 and 2.3(a) to accounting policies.)
On 31 January 2019, the Group acquired Arysta LifeScience from Platform Speciality products for a consideration of USD 4.2 billion.
We have assessed the accounting for acquisitions as a key audit matter due to the following:
• The judgements used in determining the value of the goodwill and intangible assets and the allocation of value between these asset classes could, if performed inaccurately, lead to a material misstatement.
• There is significant judgement and complexity involved in the allocation of purchase price over net assets of the acquiree.
How the matter was addressed in our auditOur procedures included the following:
• Within the framework of our audit of the preliminary purchase price allocation, we evaluated the consideration transferred by the Group and the approach of the external appraiser engaged by management with regard to the identification of the acquired assets and the conceptual assessment of the valuation methods.
• We analysed the assumptions such as growth rates, capital costs or remaining useful lives used in the preliminary determination of fair values of the acquired and identifiable assets and liabilities and contingent liabilities assumed at the acquisition date.
• We retraced the presentation of the initial consolidation, including the non-controlling interest, in the consolidation.

Annual Report 2018-19 | 211
UPL Limited
specified under section 133 of the Act. The respective Board of Directors of the companies included in the Group and of its associates and joint ventures are responsible for maintenance of adequate accounting records in accordance with the provisions of the Act for safeguarding the assets of each company and for preventing and detecting frauds and other irregularities; the selection and application of appropriate accounting policies; making judgments and estimates that are reasonable and prudent; and the design, implementation and maintenance of adequate internal financial controls, that were operating effectively for ensuring accuracy and completeness of the accounting records, relevant to the preparation and presentation of the consolidated financial statements that give a true and fair view and are free from material misstatement, whether due to fraud or error, which have been used for the purpose of preparation of the consolidated financial statements by the Directors of the Holding Company, as aforesaid.
In preparing the consolidated financial statements, the respective management and Board of Directors of the companies included in the Group and of its associates and joint ventures are responsible for assessing the ability of each company to continue as a going concern, disclosing, as applicable, matters related to going concern and using the going concern basis of accounting unless management either intends to liquidate the Company or to cease operations, or has no realistic alternative but to do so.
The respective Board of Directors of the companies included in the Group and of its associates and joint ventures is responsible for overseeing the financial reporting process of each company.
Auditor’s Responsibilities for the Audit of the Consolidated Financial StatementsOur objectives are to obtain reasonable assurance about whether the consolidated financial statements as a whole are free from material misstatement, whether due to fraud or error, and to issue an auditor’s report that includes our opinion. Reasonable assurance is a high level of assurance, but is not a guarantee that an audit conducted in accordance with SAs will always detect a material misstatement when it exists. Misstatements can arise from fraud or error and are considered material if, individually or in the aggregate, they could reasonably be expected to influence the economic decisions of users taken on the basis of these consolidated financial statements.
As part of an audit in accordance with SAs, we exercise professional judgment and maintain professional skepticism throughout the audit. We also:• Identify and assess the risks of material misstatement
of the consolidated financial statements, whether due to fraud or error, design and perform audit procedures responsive to those risks, and obtain audit evidence that is sufficient and appropriate to provide a basis for our opinion. The risk of not detecting a material misstatement resulting from fraud is higher than for one resulting from error, as fraud may involve collusion,
forgery, intentional omissions, misrepresentations, or the override of internal control.
• Obtain an understanding of internal control relevant to the audit in order to design audit procedures that are appropriate in the circumstances. Under section 143(3)(i) of the Act, we are also responsible for expressing our opinion on whether the company has adequate internal financial controls with reference to financial statements in place and the operating effectiveness of such controls.
• Evaluate the appropriateness of accounting policies used and the reasonableness of accounting estimates and related disclosures made by management.
• Conclude on the appropriateness of management’s use of the going concern basis of accounting in preparation of consolidated financial statements and, based on the audit evidence obtained, whether a material uncertainty exists related to events or conditions that may cast significant doubt on the appropriateness of this assumption. If we conclude that a material uncertainty exists, we are required to draw attention in our auditor’s report to the related disclosures in the consolidated financial statements or, if such disclosures are inadequate, to modify our opinion. Our conclusions are based on the audit evidence obtained up to the date of our auditor’s report. However, future events or conditions may cause the Group (company and subsidiaries) as well as associates and joint ventures to cease to continue as a going concern.
• Evaluate the overall presentation, structure and content of the consolidated financial statements, including the disclosures, and whether the consolidated financial statements represent the underlying transactions and events in a manner that achieves fair presentation.
• Obtain sufficient appropriate audit evidence regarding the financial information of such entities or business activities within the Group and its associates and joint ventures to express an opinion on the consolidated financial statements, of which we are the independent auditors. We are responsible for the direction, supervision and performance of the audit of financial information of such entities. For the other entities included in the consolidated financial statements, which have been audited by other auditors, such other auditors remain responsible for the direction, supervision and performance of the audits carried out by them. We remain solely responsible for our audit opinion. Our responsibilities in this regard are further described in para (a) of the section titled ‘Other Matters’ in this audit report.
We believe that the audit evidence obtained by us along with the consideration of audit reports of the other auditors referred to in sub-paragraph (a) of the Other Matters paragraph below, is sufficient and appropriate to provide a basis for our audit opinion on the consolidated financial statements.

212 | Annual Report 2018-19
UPL Limited
We communicate with those charged with governance of the Holding Company and such other entities included in the consolidated financial statements of which we are the independent auditors regarding, among other matters, the planned scope and timing of the audit and significant audit findings, including any significant deficiencies in internal control that we identify during our audit.
We also provide those charged with governance with a statement that we have complied with relevant ethical requirements regarding independence, and to communicate with them all relationships and other matters that may reasonably be thought to bear on our independence, and where applicable, related safeguards.
Auditor’s Responsibilities for the Audit of the Consolidated Financial Statements (Continued)From the matters communicated with those charged with governance, we determine those matters that were of most significance in the audit of the consolidated financial statements of the current period and are therefore the key audit matters. We describe these matters in our auditors’ report unless law or regulation precludes public disclosure about the matter or when, in extremely rare circumstances, we determine that a matter should not be communicated in our report because the adverse consequences of doing so would reasonably be expected to outweigh the public interest benefits of such communication.
Other Matters a) We did not audit the financial statements/financial
information of 99 subsidiaries whose financial statements/financial information reflect total assets of Rs 135,582 crores as at 31 March 2019, total revenues of Rs. 26,138 crores and net cash flows amounting to Rs 823 crores for the year ended on that date, as considered in the consolidated financial statements. The consolidated financial statements also include the Group’s share of net profit (and other comprehensive income) of Rs.14 crores for the year ended 31 March 2019, in respect of 18 associates and 3 joint ventures, whose financial statements/financial information have not been audited by us. These financial statements/financial information have been audited by other auditors whose reports have been furnished to us by the Management and our opinion on the consolidated financial statements, in so far as it relates to the amounts and disclosures included in respect of these subsidiaries, associates and joint ventures and our report in terms of sub-section (3) of Section 143 of the Act, in so far as it relates to the aforesaid subsidiaries, associates and joint ventures is based solely on the audit reports of the other auditors
Certain of these subsidiaries, associates and joint ventures are located outside India whose financial statements and other financial information have been prepared in accordance with accounting principles generally accepted in their respective countries and
which have been audited by other auditors under generally accepted auditing standards applicable in their respective countries. The Company’s management has converted the financial statements of such subsidiaries, associates and joint ventures located outside India from accounting principles generally accepted in their respective countries to accounting principles generally accepted in India. We have audited these conversion adjustments made by the Company’s management. Our opinion in so far as it relates to the balances and affairs of such subsidiaries, associates and joint ventures located outside India is based on the report of other auditors and the conversion adjustments prepared by the management of the Company and audited by us.
Our opinion on the consolidated financial statements, and our report on Other Legal and Regulatory Requirements below, is not modified in respect of the above matters with respect to our reliance on the work done and the reports of the other auditors.
Report on Other Legal and Regulatory RequirementsA. As required by Section 143(3) of the Act, based on
our audit and on the consideration of reports of the other auditors on separate financial statements of such subsidiaries, associates and joint ventures as were audited by other auditors, as noted in the ‘Other Matters’ paragraph, we report, to the extent applicable, that:
a) We have sought and obtained all the information and explanations which to the best of our knowledge and belief were necessary for the purposes of our audit of the aforesaid consolidated financial statements.
b) In our opinion, proper books of account as required by law relating to preparation of the aforesaid consolidated financial statements have been kept so far as it appears from our examination of those books and the reports of the other auditors.
c) The consolidated balance sheet, the consolidated statement of profit and loss (including other comprehensive income), the consolidated statement of changes in equity and the consolidated statement of cash flows dealt with by this Report are in agreement with the relevant books of account maintained for the purpose of preparation of the consolidated financial statements.
d) In our opinion, the aforesaid consolidated financial statements comply with the Ind AS specified under section 133 of the Act.
e) On the basis of the written representations received from the directors of the Holding Company as on 31 March 2019 taken on record by the Board of Directors of the Holding Company and the reports of the statutory auditors of its subsidiary companies and its associate companies incorporated in India,

Annual Report 2018-19 | 213
UPL Limited
none of the directors of the Group companies and its associate companies incorporated in India is disqualified as on 31 March 2019 from being appointed as a director in terms of Section 164(2) of the Act.
f) With respect to the adequacy of the internal financial controls with reference to financial statements of the Holding Company, its subsidiary companies and its associate companies incorporated in India and the operating effectiveness of such controls, refer to our separate Report in “Annexure A
B. With respect to the other matters to be included in the Auditor’s Report in accordance with Rule 11 of the Companies (Audit and Auditor’s) Rules, 2014, in our opinion and to the best of our information and according to the explanations given to us and based on the consideration of the reports of the other auditors on separate financial statements of the subsidiaries, associates and joint ventures, as noted in the ‘Other Matters’ paragraph:
i. The consolidated financial statements disclose the impact of pending litigations as at 31 March 2019 on the consolidated financial position of the Group, its associates and its joint ventures. Refer Note 37 to the consolidated financial statements;
ii. Provision has been made in the consolidated financial statements, as required under the applicable law or Ind AS, for material foreseeable losses, on long-term contracts including derivative contracts. Refer Note 16 to the consolidated financial statements in respect of such items as it relates to the Group, its associates and joint ventures;
iii. There has been no delay in transferring amounts to the Investor Education and Protection Fund by the Holding Company, its subsidiary Companies and
its associates incorporated in India during the year ended 31 March 2019; and
iv. The disclosures in the consolidated financial statements regarding holdings as well as dealings in specified bank notes during the period from 8 November 2016 to 30 December 2016 have not been made in the financial statements since they do not pertain to the financial year ended 31 March 2019.
C. With respect to the matter to be included in the Audit Report under section 197(16):
In our opinion and according to the information and explanations given to us and based on the reports of the statutory auditors of such subsidiary companies and associate companies incorporated in India which were not audited by us, the remuneration paid during the current year by the Holding Company, its subsidiary companies and associate companies to its directors is in accordance with the provisions of Section 197 of the Act. The remuneration paid to any director by the Holding Company, its subsidiary companies and its associate companies is not in excess of the limit laid down under Section 197 of the Act. The Ministry of Corporate Affairs has not prescribed other details under Section 197(16) which are required to be commented upon by us.
For B S R & Co. LLPChartered Accountants
Firm’s Registration No: 101248W/W-100022
Bhavesh DhupeliaPlace: Mumbai PartnerDate: 17 May 2019 Membership No: 042070
214 | Annual Report 2018-19
UPL Limited
Annexure A to the Independent Auditors’ Report Report on the internal financial controls with reference to the aforesaid consolidated financial statements under Clause (i) of Sub-section 3 of Section 143 of the Companies Act, 2013
(Referred to in paragraph A(f) under ‘Report on Other Legal and Regulatory Requirements’ section of our report of even date)
OpinionIn conjunction with our audit of the consolidated financial statements of the Company as of and for the year ended 31 March 2019, we have audited the internal financial controls with reference to consolidated financial statements of UPL Limited (hereinafter referred to as “the Holding Company”) and such companies incorporated in India under the Companies Act, 2013 which are its subsidiary companies and its associate companies as of that date.
In our opinion, the Holding Company and such companies incorporated in India which are its subsidiary companies and its associate companies have, in all material respects, adequate internal financial controls with reference to consolidated financial statements and such internal financial controls were operating effectively as at 31 March 2019, based on the internal financial controls with reference to consolidated financial statements criteria established by such companies considering the essential components of such internal controls stated in the Guidance Note on Audit of Internal Financial Controls Over Financial Reporting issued by the Institute of Chartered Accountants of India (the “Guidance Note”).
Management’s Responsibility for Internal Financial ControlsThe respective Company’s management and the Board of Directors are responsible for establishing and maintaining internal financial controls with reference to consolidated financial statements based on the criteria established by the respective Company considering the essential components of internal control stated in the Guidance Note. These responsibilities include the design, implementation and maintenance of adequate internal financial controls that were operating effectively for ensuring the orderly and efficient conduct of its business, including adherence to the respective company’s policies, the safeguarding of its assets, the prevention and detection of frauds and errors, the accuracy and completeness of the accounting records, and the timely preparation of reliable financial information,
as required under the Companies Act, 2013 (hereinafter referred to as “the Act”).
Auditors’ ResponsibilityOur responsibility is to express an opinion on the internal financial controls with reference to consolidated financial statements based on our audit. We conducted our audit in accordance with the Guidance Note and the Standards on Auditing, prescribed under section 143(10) of the Act, to the extent applicable to an audit of internal financial controls with reference to consolidated financial statements. Those Standards and the Guidance Note require that we comply with ethical requirements and plan and perform the audit to obtain reasonable assurance about whether adequate internal financial controls with reference to consolidated financial statements were established and maintained and if such controls operated effectively in all material respects.
Our audit involves performing procedures to obtain audit evidence about the adequacy of the internal financial controls with reference to consolidated financial statements and their operating effectiveness. Our audit of internal financial controls with reference to consolidated financial statements included obtaining an understanding of internal financial controls with reference to consolidated financial statements, assessing the risk that a material weakness exists, and testing and evaluating the design and operating effectiveness of the internal controls based on the assessed risk. The procedures selected depend on the auditor’s judgement, including the assessment of the risks of material misstatement of the consolidated financial statements, whether due to fraud or error.
We believe that the audit evidence we have obtained and the audit evidence obtained by the other auditors of the relevant subsidiary companies and associate companies in terms of their reports referred to in the Other Matter paragraph below, is sufficient and appropriate to provide a basis for our audit opinion on the internal financial controls with reference to consolidated financial statements.

Annual Report 2018-19 | 215
UPL Limited
Meaning of Internal Financial controls with Reference to Consolidated Financial Statements A company’s internal financial controls with reference to consolidated financial statements is a process designed to provide reasonable assurance regarding the reliability of financial reporting and the preparation of financial statements for external purposes in accordance with generally accepted accounting principles. A company’s internal financial controls with reference to consolidated financial statements includes those policies and procedures that (1) pertain to the maintenance of records that, in reasonable detail, accurately and fairly reflect the transactions and dispositions of the assets of the company; (2) provide reasonable assurance that transactions are recorded as necessary to permit preparation of financial statements in accordance with generally accepted accounting principles, and that receipts and expenditures of the company are being made only in accordance with authorisations of management and directors of the company; and (3) provide reasonable assurance regarding prevention or timely detection of unauthorised acquisition, use, or disposition of the company’s assets that could have a material effect on the financial statements.
Inherent Limitations of Internal Financial controls with Reference to consolidated Financial StatementsBecause of the inherent limitations of internal financial controls with reference to consolidated financial statements, including the possibility of collusion or improper management override of controls, material misstatements
due to error or fraud may occur and not be detected. Also, projections of any evaluation of the internal financial controls with reference to consolidated financial statements to future periods are subject to the risk that the internal financial controls with reference to consolidated financial statements may become inadequate because of changes in conditions, or that the degree of compliance with the policies or procedures may deteriorate.
Other MatterOur aforesaid reports under Section 143(3)(i) of the Act on the adequacy and operating effectiveness of the internal financial controls with reference to consolidated financial statements insofar as it relates to 10 subsidiary companies and 4 associate companies which are companies incorporated in India, is based on the corresponding reports of the auditors of such companies incorporated in India.
For B S R & Co. LLPChartered Accountants
Firm’s Registration No: 101248W/W-100022
Bhavesh DhupeliaPlace: Mumbai PartnerDate: 17 May 2019 Membership No: 042070

216 | Annual Report 2018-19
UPL Limited
Consolidated Balance Sheet as at March 31, 2019
Notes As atMarch 31, 2019
As atMarch 31, 2018
AssetsNon-current assetsProperty, plant and equipment 3 4,654 2,874Capital work-in-progress 3 1,166 1,090Goodwill 4 15,050 432Other intangible assets 4 12,197 1,131Intangible assets under development 4 617 229Investments accounted for using the equity method 5 408 386Financial assets(i) Investments 5 298 648(ii) Loans 6 156 151(iii) Trade receivables 10 4 1(iv) Other financial assets 7 167 35Income tax assets (net) 327 194Deferred tax assets (net) 18 731 529Other non-current assets 8 281 319Total non-current assets 36,056 8,019Current assetsInventories 9 9,270 4,538Financial assets(i) Investments 5 2 -(ii) Trade receivables 10 11,812 6,056(iii) Cash and cash equivalents 11 2,826 2,859(iv) Bank balance other than cash and cash equivalents 11A 25 35(v) Loans 6 51 147(vi) Other financial assets 7 310 167Income tax assets (net) 486 27Other current assets 8 2,184 1,175Total current assets 26,966 15,004Assets held for sale 26 20Total Assets 63,048 23,043
Equity and liabilitiesEquityEquity share capital 12 102 102Other equity 13 14,543 9,067Equity attributable to owners of the parent 14,645 9,169Non-controlling interests 3,358 19Total Equity 18,003 9,188LiabilitiesNon-current liabilities:Financial liabilities(i) Borrowings 15 26,383 5,873(iii) Other financial liabilities 16 136 232Provisions 17 20 20Deferred tax liabilities (net) 18 2,942 88Total non-current liabilities 29,481 6,213Current liabilities:Financial liabilities(i) Borrowings 15 2,478 634(ii) Trade payables 19 Total outstanding dues of Micro enterprises and Small enterprises 26 17 Total outstanding dues of creditors other than Micro enterprises and Small enterprises
9,397 5,658
(iii) Other financial liabilities 16 1,499 755Provisions 17 844 164Other current liabilities 20 724 357Current tax liabilities (net) 596 57
15,564 7,642Total liabilities 45,045 13,855Total equity and liabilities 63,048 23,043Summary of significant accounting policies 2.3The accompanying notes are an integral part of these consolidated financial statements. 1 - 48As per our report of even date attached.For B S R & Co. LLP For and on behalf of the Board of Directors of UPL LimitedChartered Accountants CIN No.-L24219GJ1985PLC025132Firm registration number: 101248W/W-100022
Bhavesh Dhupelia R.D. Shroff A.C.AsharPartner Chairman & Managing Director Whole-time DirectorMembership no.: 042070 Din No.-00180810 Din No.- 00192088 Place: Mumbai Place: Mumbai
Anand Vora M.B.Trivedi Chief Financial Officer Company Secretary Membership no.: ACS4250 Place: Mumbai Place: San Francisco Date: May 17, 2019
H In Crores
Place: MumbaiDate: May 17, 2019
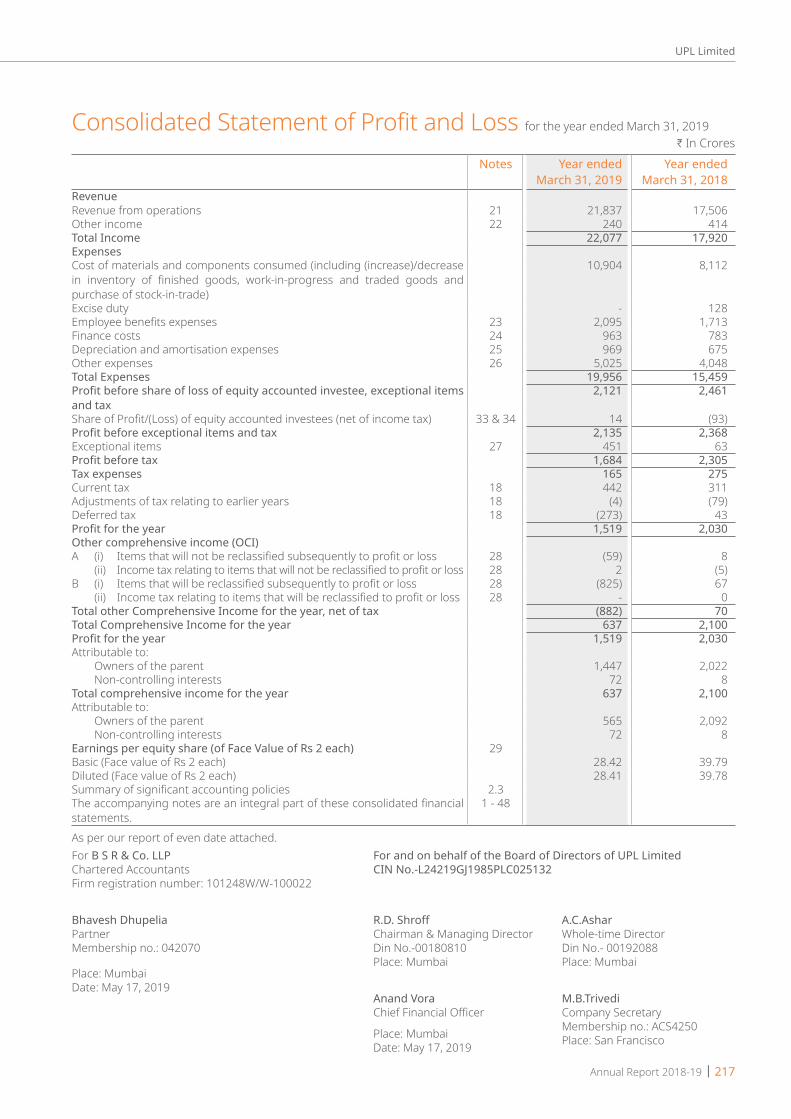
Annual Report 2018-19 | 217
UPL Limited
Consolidated Statement of Profit and Loss for the year ended March 31, 2019
Notes Year ended March 31, 2019
Year ended March 31, 2018
RevenueRevenue from operations 21 21,837 17,506Other income 22 240 414Total Income 22,077 17,920ExpensesCost of materials and components consumed (including (increase)/decrease in inventory of finished goods, work-in-progress and traded goods and purchase of stock-in-trade)
10,904 8,112
Excise duty - 128Employee benefits expenses 23 2,095 1,713Finance costs 24 963 783Depreciation and amortisation expenses 25 969 675Other expenses 26 5,025 4,048Total Expenses 19,956 15,459Profit before share of loss of equity accounted investee, exceptional items and tax
2,121 2,461
Share of Profit/(Loss) of equity accounted investees (net of income tax) 33 & 34 14 (93)Profit before exceptional items and tax 2,135 2,368Exceptional items 27 451 63Profit before tax 1,684 2,305Tax expenses 165 275Current tax 18 442 311Adjustments of tax relating to earlier years 18 (4) (79)Deferred tax 18 (273) 43Profit for the year 1,519 2,030Other comprehensive income (OCI)A (i) Items that will not be reclassified subsequently to profit or loss 28 (59) 8 (ii) Income tax relating to items that will not be reclassified to profit or loss 28 2 (5)B (i) Items that will be reclassified subsequently to profit or loss 28 (825) 67 (ii) Income tax relating to items that will be reclassified to profit or loss 28 - 0Total other Comprehensive Income for the year, net of tax (882) 70Total Comprehensive Income for the year 637 2,100Profit for the year 1,519 2,030Attributable to: Owners of the parent 1,447 2,022 Non-controlling interests 72 8Total comprehensive income for the year 637 2,100Attributable to: Owners of the parent 565 2,092 Non-controlling interests 72 8Earnings per equity share (of Face Value of Rs 2 each) 29Basic (Face value of Rs 2 each) 28.42 39.79Diluted (Face value of Rs 2 each) 28.41 39.78Summary of significant accounting policies 2.3The accompanying notes are an integral part of these consolidated financial statements.
1 - 48
As per our report of even date attached.For B S R & Co. LLP For and on behalf of the Board of Directors of UPL LimitedChartered Accountants CIN No.-L24219GJ1985PLC025132Firm registration number: 101248W/W-100022
Bhavesh Dhupelia R.D. Shroff A.C.AsharPartner Chairman & Managing Director Whole-time DirectorMembership no.: 042070 Din No.-00180810 Din No.- 00192088 Place: Mumbai Place: Mumbai
Anand Vora M.B.Trivedi Chief Financial Officer Company Secretary Membership no.: ACS4250 Place: Mumbai Place: San Francisco Date: May 17, 2019
H In Crores
Place: MumbaiDate: May 17, 2019

218 | Annual Report 2018-19
UPL Limited
Consolidated Statement of Cash Flows for the year ended March 31, 2019
Year ended March 31, 2019
Year ended March 31, 2018
A Cash Flow from operating activitiesProfit before exceptional items and tax 2,121 2,461Adjustments for:Depreciation and amortization expense 969 675Finance costs 963 783Allowance for doubtful debts and advances (net) (41) 17Assets written off 10 10Bad debts written off 10 2Gain on disposal of property, plant and equipment (3) (2)Interest Income (137) (132)Unwinding of interest on trade receivables (82) (282)Manufacturing expenses capitalised (29) (26)Excess provisions in respect of earlier years written back (net) (36) (57)Sundry credit balances written off (net) (12) 15Loss/(Gain) on sale of current and non current investments (net) (9) 7
1,604 1,010Operating profit before working capital changes 3,725 3,472Working capital adjustments(Increase) in inventories (674) (383)Decrease/(Increase) in non current and current trade receivables 370 (138)(Increase) in other non current and current assets (324) (502)(Increase)/ in other non current and current financial assets (30) (12)Increase in non current and current trade payables 277 663Increase in non current and current provisions 13 16(Decrease) in other current liabilities (28) (57)Increase in other non current and current financial liabilities (167) 90
(564) (322)Cash generated from operations 3,161 3,150Income taxes paid (net) (354) (249)Cash flow before exceptional items 2,807 2,902Exceptional items (451) (63)Net cash flow from operating activities 2,356 2,839
B Cash flow from investing activitiesPurchase of Property,plant and equipment including Capital-work-in-progress and capital advances
(1,370) (1,092)
Purchase of intangible assets including assets under development
(205) (321)
Proceeds from sale of property, plant and equipment 22 9Payment for acquisition of additional stake in subsidiary - (22)Payment for acquisition of Arysta Life Science and its subsidiaries (30,989) -Payment of contingent consideration (54) (126)Purchase of equity shares of equity accounted investees (4) (300)Purchase of investments (96) (423)Proceeds from sale of non current investments and subsidiary 427 -Sundry loans given 424 (14)Sundry loans repayment received (317) 85Fixed deposit, margin money and dividend accounts (net) 10 (21)Profit on sale of investment in mutual funds/bonds 9 (7)Interest income 175 140Net cash flow (used in) investing activities (31,968) (2,093)
C Cash flow from financing activitiesProceeds from long term borrowings 20,736 1,954Repayment of long term borrowings (78) (1,623)Short term borrowings (net) 1,308 (45)Interest paid and other financial charges (1,007) (717)Dividend paid to minority shareholders by subsidiaries (17) (12)Dividends paid (407) (357)
H In Crores

Annual Report 2018-19 | 219
UPL Limited
Consolidated Statement of Cash Flows for the year ended March 31, 2019
Year ended March 31, 2019
Year ended March 31, 2018
Proceeds from issue of shares of subsidiary to Non Controlling Interest (See Note 40)
8,358 -
Net cash flow (used in)/from financing activities 28,894 (801)D Exchange difference arising on conversion debited to foreign
currency translation reserve(362) 37
Net (Decrease)/Increase in cash and cash equivalents (A+B+C+D)
(1,081) (19)
Cash and cash equivalents as at the beginning of the year (Refer note 11)
2,859 2,880
Add: Cash and Cash Equivalents on acquisition of subsidiaries 1,048 -Cash and cash equivalents of Arysta Group as on date of acquisitionCash and cash equivalents as at the end of the year (Refer note 11)
2,826 2,859
Reconciliation between the opening and closing balances in the balance sheet for liabilities arising from financing activities. Particulars Notes March
31, 2018
Cash flows
Non-cash changes March 31, 2019Accquisition Foreign
exchange movement
Fair value
change
Other adjustments
DebenturesUnsecured Redeemable Non convertible Debentures (NCDs)
15 and 16
809 (78) - - - - 731
Bonds (Unsecured)3.25% Senior Notes 15 3,230 - - 207 - - 3,4374.50% Senior Notes 15 1,937 - - 108 - - 2,045Term LoanFrom Bank (Unsecured) 15 2 20,391 - - - - 20,394From Bank (Secured) 15 7 (4) - - - - 3From others (Unsecured) 15 19 (2) - - - - 17Cash credit, packing credit and working capital demand loan accounts and Commercial Papers
15 621 1,101 423 21 - - 2,166
Discounted Trade Receivables 15 13 (52) 352 - - - 312Finance Lease obligation 15 - 34 - - - 34Total liabilities from financing activities
6,638 21,356 809 337 - - 29,139
Notes:(i) The cash flow statement has been prepared under the indirect method as set out in Indian Accounting Standard (Ind AS 7)
Statement of Cash flows.(ii) Figures in brackets represent cash outflow
The accompanying notes are an integral part of these consolidated financial statements.
As per our report of even date attached.For B S R & Co. LLP For and on behalf of the Board of Directors of UPL LimitedChartered Accountants CIN No.-L24219GJ1985PLC025132Firm registration number: 101248W/W-100022
Bhavesh Dhupelia R.D. Shroff A.C. AsharPartner Chairman & Managing Director Whole-time DirectorMembership no.: 042070 Din No.-00180810 Din No.- 00192088 Place: Mumbai Place: Mumbai
Anand Vora M.B.Trivedi Chief Financial Officer Company Secretary Membership no.: ACS4250 Place: Mumbai Place: San Francisco Date: May 17, 2019
H In Crores
Place: MumbaiDate: May 17, 2019

220 | Annual Report 2018-19
UPL LimitedCo
nsol
idat
ed S
tate
men
t of C
hang
es in
Equ
ity for
the
year
end
ed M
arch
31,
201
9
A.
Equi
ty S
hare
Cap
ital
Equi
ty s
hare
s of
INR
2 ea
ch C
ompu
lsor
ily C
onve
rtib
le
Pref
eren
ce S
hare
s (C
CPS)
Is
sued
, sub
scrib
ed a
nd fu
lly p
aid
Nos
.IN
R Cr
ores
Nos
.IN
R Cr
ores
As a
t Apr
il1, 2
017
50,
70,1
7,11
8 1
01
8,19
,40,
125
82
Chan
ges
durin
g th
e ye
ar 2
3,15
,963
1
(8
,19,
40,1
25)
(82)
At M
arch
31,
201
8 5
0,93
,33,
081
102
-
-Ch
ange
s du
ring
the
year
9,5
89
0
--
At M
arch
31,
201
9 5
0,93
,42,
670
102
-
-
B.
Oth
er E
quity
For t
he y
ear e
nded
Mar
ch 3
1, 2
019
H In
Cro
res
Attr
ibut
able
to th
e O
wne
rs o
f the
par
ent
Tota
lN
on-
cont
rolli
ng
inte
rest
Tota
l ot
her
equi
tyRe
serv
e an
d Su
rplu
sIte
ms
of O
CICa
pita
l re
dem
ptio
n re
serv
e
Capi
tal
rese
rve
Secu
ritie
s pr
emiu
mD
eben
ture
re
dem
ptio
n re
serv
e
Gen
eral
re
serv
eSh
are
Base
d Pa
ymen
t re
serv
e
Non
-co
ntro
lling
in
tere
st
rese
rve
Reta
ined
ea
rnin
gsCa
shflo
w
hedg
e re
serv
e fo
r OCI
Equi
ty
Inst
rum
ents
th
roug
h ot
her
com
preh
ensi
ve
inco
me
Exch
ange
di
ffere
nces
on
tr
ansl
atio
n of
a fo
reig
n op
erat
ion
As a
t 1st
Apr
il 20
1845
193
4,60
714
11,
848
-(3
,693
)5,
927
-(4
4)43
9,06
719
9,08
6Pr
ofit f
or th
e ye
ar-
--
--
--
1,44
7-
--
1,44
772
1,51
9O
ther
com
preh
ensiv
e in
com
e(ne
t of t
ax)
--
--
--
-3
(62)
(60)
(763
)(8
82)
(18)
(899
)
Tota
l com
preh
ensi
ve
inco
me
-
Divid
ends
pai
d du
ring
the
year
--
--
--
-(4
07)
--
-(4
07)
(17)
(424
)
Tran
sfer
to re
tain
ed
earn
ings
--
-(1
)-
--
1-
--
--
-
Fore
ign
exch
ange
im
pact
-(1
7)-
--
--
--
-(1
7)(2
18)
(235
)
Gai
n on
equ
ity d
ilutio
n in
sub
sidia
ry-
--
--
--
5,33
5-
--
5,33
53,
023
8,35
8
Reco
gniti
on o
f NCI
on
Arys
ta a
cqui
sitio
n-
--
--
--
--
--
-49
649
6
As a
t 31
Mar
ch 2
019
4517
64,
607
140
1,84
8-
(3,6
93)
12,3
06(6
2)(1
04)
(720
)14
,543
3,35
817
,901
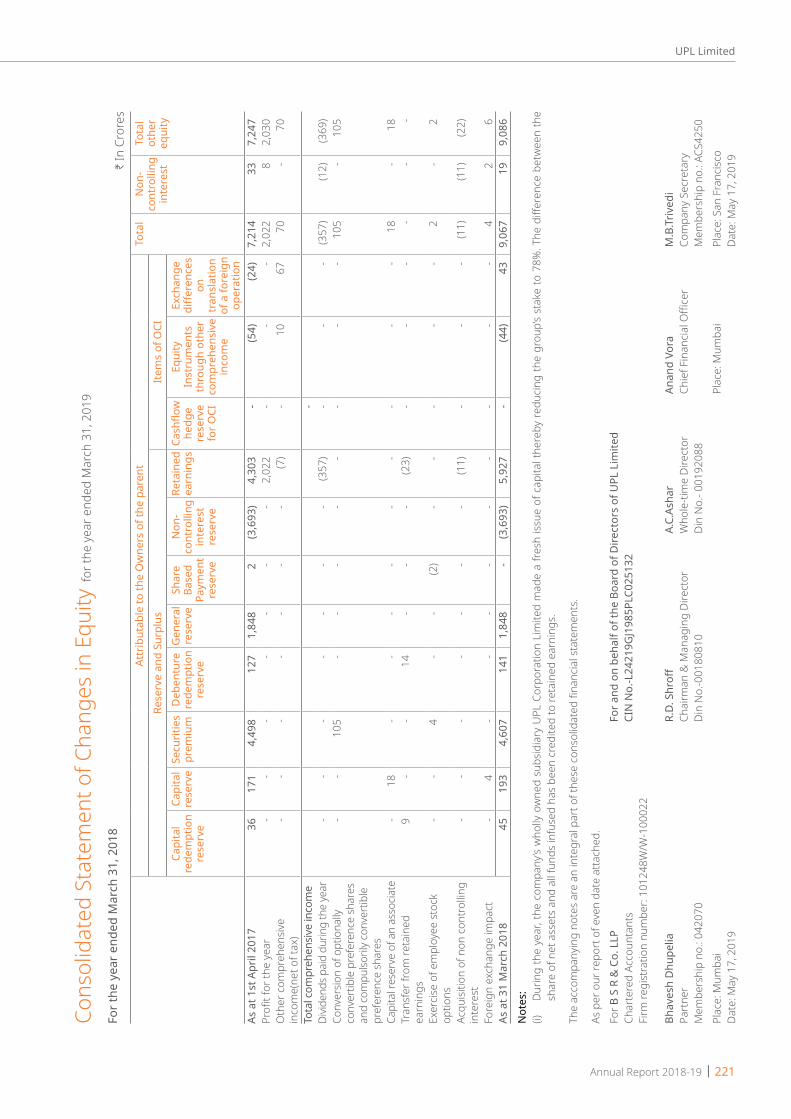
Annual Report 2018-19 | 221
UPL Limited
Cons
olid
ated
Sta
tem
ent o
f Cha
nges
in E
quity
for th
e ye
ar e
nded
Mar
ch 3
1, 2
019
For t
he y
ear e
nded
Mar
ch 3
1, 2
018
H In
Cro
res
Attr
ibut
able
to th
e O
wne
rs o
f the
par
ent
Tota
lN
on-
cont
rolli
ng
inte
rest
Tota
l ot
her
equi
tyRe
serv
e an
d Su
rplu
sIte
ms
of O
CICa
pita
l re
dem
ptio
n re
serv
e
Capi
tal
rese
rve
Secu
ritie
s pr
emiu
mD
eben
ture
re
dem
ptio
n re
serv
e
Gen
eral
re
serv
eSh
are
Base
d Pa
ymen
t re
serv
e
Non
-co
ntro
lling
in
tere
st
rese
rve
Reta
ined
ea
rnin
gsCa
shflo
w
hedg
e re
serv
e fo
r OCI
Equi
ty
Inst
rum
ents
th
roug
h ot
her
com
preh
ensi
ve
inco
me
Exch
ange
di
ffere
nces
on
tr
ansl
atio
n of
a fo
reig
n op
erat
ion
As a
t 1st
Apr
il 20
1736
171
4,49
812
71,
848
2(3
,693
)4,
303
-(5
4)(2
4)7,
214
337,
247
Profi
t for
the
year
--
--
--
-2,
022
--
-2,
022
82,
030
Oth
er c
ompr
ehen
sive
inco
me(
net o
f tax
)-
--
--
--
(7)
-10
6770
-70
Tota
l com
preh
ensiv
e in
com
e-
Divid
ends
pai
d du
ring
the
year
--
--
--
-(3
57)
--
-(3
57)
(12)
(369
)Co
nver
sion
of o
ptio
nally
co
nver
tible
pre
fere
nce
shar
es
and
com
pulso
rily c
onve
rtibl
e pr
efer
ence
shar
es
--
105
--
--
--
--
105
-10
5
Capi
tal r
eser
ve o
f an
asso
ciate
-18
--
--
--
--
-18
-18
Tran
sfer
from
reta
ined
ea
rnin
gs9
--
14-
--
(23)
--
--
--
Exer
cise
of e
mpl
oyee
sto
ck
optio
ns-
-4
--
(2)
--
--
-2
-2
Acqu
isitio
n of
non
con
trollin
g in
tere
st-
--
--
--
(11)
--
-(1
1)(1
1)(2
2)
Fore
ign
exch
ange
impa
ct-
4-
--
--
--
--
42
6As
at 3
1 M
arch
201
845
193
4,60
714
11,
848
-(3
,693
)5,
927
-(4
4)43
9,06
719
9,08
6
Not
es:
(i)
Durin
g th
e ye
ar, t
he c
ompa
ny’s
who
lly o
wne
d su
bsid
iary
UPL
Cor
pora
tion
Lim
ited
mad
e a
fresh
issu
e of
cap
ital t
here
by re
ducin
g th
e gr
oup’s
sta
ke to
78%
. The
diff
eren
ce b
etw
een
the
shar
e of
net
ass
ets
and
all f
unds
infu
sed
has
been
cre
dite
d to
reta
ined
ear
ning
s.
The
acco
mpa
nyin
g no
tes
are
an in
tegr
al p
art o
f the
se c
onso
lidat
ed fi
nanc
ial s
tate
men
ts.
As p
er o
ur re
port
of e
ven
date
atta
ched
.Fo
r B S
R &
Co.
LLP
Fo
r and
on
beha
lf of
the
Boar
d of
Dire
ctor
s of
UPL
Lim
ited
Char
tere
d Ac
coun
tant
s CI
N N
o.-L
2421
9GJ1
985P
LC02
5132
Firm
regi
stra
tion
num
ber:
1012
48W
/W-1
0002
2
Bhav
esh
Dhu
pelia
R.
D. S
hroff
A.
C.As
har
Anan
d Vo
ra
M.B
.Triv
edi
Part
ner
Chai
rman
& M
anag
ing
Dire
ctor
W
hole
-tim
e Di
rect
or
Chie
f Fin
ancia
l Offi
cer
Com
pany
Sec
reta
ryM
embe
rshi
p no
.: 04
2070
Di
n N
o.-0
0180
810
Di
n N
o.- 0
0192
088
M
embe
rshi
p no
.: AC
S425
0Pl
ace:
Mum
bai
Plac
e: M
umba
i Pl
ace:
San
Fra
ncisc
oDa
te: M
ay 1
7, 2
019
Da
te: M
ay 1
7, 2
019
222 | Annual Report 2018-19
UPL Limited
Notes to Consolidated Financial Statements for the year ended March 31, 2019
1. Corporate InformationUPL Limited (the Company) is a public Company domiciled in India and is incorporated under the provisions of the Companies Act applicable in India. Its shares are listed on two recognised stock exchanges in India. The registered office of the Company is located at 3-11, G.I.D.C., Vapi, Dist.- Valsad, Gujarat. The consolidated financial statements comprise the financial statements of UPL Limited (‘the Company’ or ‘the holding Company’ or “the parent”) and its subsidiaries (collectively, ‘the Group’), its associates and joint ventures as at and for the year ended 31 March 2019.
The Group is principally engaged in the business of agrochemicals, industrial chemicals, chemical intermediates, speciality chemicals and production and sale of field crops and vegetable seeds. Information on the Group’s structure is provided in Note 31.
The consolidated financial statements were authorised for issue in accordance with the resolution of the directors on 17 May 2019
2 Accounting Policies2.1 Basis of Preparation The consolidated financial statements of the Group have been prepared in accordance with Indian Accounting Standards
(Ind AS) notified under the Companies (Indian Accounting Standards) Rules, 2015 notified under Section 133 of the Companies Act, 2013 (‘’the Act”) as amended thereafter and other relevant provision of the Act.
The consolidated financial statements have been prepared on an accrual basis and under the historical cost convention, except for the following assets and liabilities which have been measured at fair value:
- Derivative financial instruments, - Certain financial assets and liabilities measured at fair value (refer accounting policy regarding financial instruments),
and - Consideration for business combination (including contigent consideration). - Assets and Liabilities acquired in business combination.
The consolidated financial statements are presented in Indian Rupees (‘INR’) or (‘Rs’) which is also the Company’s functional currency and all values are rounded to the nearest crores, except when otherwise indicated. Wherever an amount is represented as Rs. ‘0’ (zero),it construes a value less than rupees fifty lakhs.
Significant accounting estimates, assumptions and judgements The preparation of the Group’s consolidated financial statements requires management to make estimates and
assumptions that affect the reported amounts of revenues, expenses, assets and liabilities, and the accompanying disclosures, and the disclosure of contingent liabilities.Uncertainty about these assumptions and estimates could result in outcomes that require a material adjustment to the carrying amount of assets or liabilities affected in future periods.
Estimates and assumptions The key assumptions concerning the future and other key sources of estimation uncertainty at the reporting date, that
have a significant risk of causing a material adjustment to the carrying amounts of assets and liabilities within the next financial year, are described below. The Group based its assumptions and estimates on parameters available when the consolidated financial statements were prepared. Existing circumstances and assumptions about future developments, however, may change due to market changes or circumstances arising that are beyond the control of the Group. Such changes are reflected in the assumptions when they occur.
Taxes There are many transactions and calculations undertaken during the ordinary course of business for which the
ultimate tax determination is uncertain. Where the final tax outcome of these matters is different from the amounts initially recorded, such differences will impact the current and deferred tax provisions in the period in which the tax determination is made. Deferred tax assets are recognised for unused tax losses to the extent that it is probable that taxable profit will be available against which the losses can be utilised. Significant management judgement is required to determine the amount of deferred tax assets that can be recognised, based upon the likely timing and the level of future taxable profits together with future tax planning strategies.
Defined benefit plan (gratuity benefits) A liability in respect of defined benefit plans is recognised in the balance sheet, and is measured as the present value of
the defined benefit obligation at the reporting date less the fair value of the plan assets. The present value of the defined
Annual Report 2018-19 | 223
UPL Limited
Notes to Consolidated Financial Statements for the year ended March 31, 2019
benefit obligation is based on expected future payments at the reporting date, calculated annually by independent actuaries. Consideration is given to expected future salary levels, experience of employee departures and periods of service. Refer note 35 for details of the key assumptions used in determining the accounting for these plans.
Fair value measurement of financial instruments When the fair values of financial assets and financial liabilities recorded in the balance sheet cannot be measured based
on quoted prices in active markets, their fair value is measured using valuation techniques including the DCF model. The inputs to these models are taken from observable markets where possible, but where this is not feasible, a degree of judgement is required in establishing fair values. Judgements include considerations of inputs such as liquidity risk, credit risk and volatility. Changes in assumptions about these factors could affect the reported fair value of financial instruments. See Note 45 and 46 for further disclosures.
Provision against obsolete and slow-moving inventories The Group reviews the condition of its inventories and makes provision against obsolete and slow-moving inventory items
which are identified as no longer suitable for sale or use. Group estimates the net realisable value for such inventories based primarily on the latest invoice prices and current market conditions. The Group carries out an inventory review at each balance sheet date and makes provision against obsolete and slow-moving items. The Group reassesses the estimation on each balance sheet date.
Impairment of financial assets The Group assesses impairment based on expected credit losses (ECL) model on trade receivables.
The Group uses a provision matrix to determine impairment loss allowance on the portfolio of trade receivables. The provision matrix is based on its histroically observed default rates over the expected life of the trade receivable and is adjusted for forward looking estimates. At every reporting date, the historical observed default rates are updated and changes in the forward-looking estimates are analysed.
Impairment of non-financial assets Impairment exists when the carrying value of an asset or cash generating unit exceeds its recoverable amount, which
is the higher of its fair value less costs of disposal and its value in use. The fair value less costs of disposal calculation is based on available data from binding sales transactions, conducted at arm’s length, for similar assets or observable market prices less incremental costs for disposing of the asset. The value in use calculation is based on a DCF model. The cash flows are derived from the budget for the next five years and do not include restructuring activities that the Group is not yet committed to or significant future investments that will enhance the asset’s performance of the CGU being tested. The recoverable amount is sensitive to the discount rate used for the DCF model as well as the expected future cash-inflows and the growth rate used for extrapolation purposes. These estimates are most relevant to goodwill and other intangibles with indefinite useful lives recognised by the Group.
2.2 Basis of consolidation The consolidated financial statements comprise the financial statements of the Company and its subsidiaries, associates
and joint ventures as at 31 March 2019. Control is achieved when the Group is exposed, or has rights, to variable returns from its involvement with the investee and has the ability to affect those returns through its power over the investee.
Subsidiaries are entities controlled by the Group. Consolidation of a subsidiary begins when the Group obtains control over the subsidiary and ceases when the Group loses control of the subsidiary. Assets, liabilities, income and expenses of a subsidiary acquired or disposed off during the year are included in the consolidated financial statements from the date the Group gains control and until the date the Group ceases to control the subsidiary.
Consolidated financial statements are prepared using uniform accounting policies for like transactions and other events in similar circumstances. If a member of the group uses accounting policies other than those adopted in the consolidated financial statements for like transactions and events in similar circumstances, appropriate adjustments are made to that group member’s financial statements in preparing the consolidated financial statements to ensure conformity with the group’s accounting policies.
The financial statements of each of the subsidiaries, associates and joint ventures, other than Sinagro Produtos Agropecuarios SA. Group, 3SB Produtos Agricolas SA and Serra Bonita Sementes SA used for the purpose of consolidation are drawn up to same reporting date as that of the Company, i.e., year ended on 31 March. The audited consolidated financial statements of Sinagro Produtos Agropecuarios SA. Group, audited financial statements of 3SB Produtos Agricolas SA and Serra Bonita Sementes SA for the year ended 31st December 2018 have been considered for

224 | Annual Report 2018-19
UPL Limited
the purpose of consolidation after making necessary adjustments for the effects of significant transactions or events, if any that occur till the reporting date of the group i.e. March 31.
Consolidation procedure: (a) Combine like items of assets, liabilities, equity, income, expenses and cash flows of the parent with those of its
subsidiaries. For this purpose, income and expenses of the subsidiary are based on the amounts of the assets and liabilities recognised in the consolidated financial statements at the acquisition date.
(b) Offset (eliminate) the carrying amount of the parent’s investment in each subsidiary and the parent’s portion of equity of each subsidiary. The Business combinations policy explains how the group accounts for any related goodwill.
(c) Eliminate in full intragroup assets and liabilities, equity, income, expenses and cash flows relating to transactions between entities of the group (profits or losses resulting from intragroup transactions that are recognised in assets, such as inventory and fixed assets, are eliminated in full). Intragroup losses may indicate an impairment that requires recognition in the consolidated financial statements. Ind AS12 Income Taxes applies to temporary differences that arise from the elimination of profits and losses resulting from intragroup transactions.
Profit or loss and each component of other comprehensive income (OCI) are attributed to the equity holders of the parent of the Group and to the non-controlling interests, even if this results in the non-controlling interests having a deficit balance. When necessary, adjustments are made to the financial statements of subsidiaries to bring their accounting policies into line with the Group’s accounting policies. All intra-group assets and liabilities, equity, income, expenses and cash flows relating to transactions between members of the Group are eliminated in full on consolidation.
When the Group loses control over a subsidiary, it derecognises the assets and liabilities of the subsidiary, and any realted non controlling interest and other components of equity. Any interest retained in the form of subsidiary is measured at fair value at the date the control is lost. Any resulting gain or loss is recognised in the statement of profit and loss.
2.3 Summary of significant accounting policiesa Business combinations and goodwill Business combinations are accounted for using the acquisition method. The cost of an acquisition is measured as
the aggregate of the consideration transferred measured at acquisition date fair value and the amount of any non-controlling interests in the acquiree. For each business combination, the Group elects whether to measure the non-controlling interests in the acquiree at fair value or at the proportionate share of the acquiree’s identifiable net assets. Acquisition-related costs are expensed as incurred.
At the acquisition date, the identifiable assets acquired and the liabilities assumed are recognised at their acquisition date fair values.
The consideration transferred does not include amount related to the settlement of pre-existing relationships with the acquiree. Such amounts are generally recognised in the statement of profit and loss.
Any contingent consideration to be transferred by the acquirer is recognised at fair value at the acquisition date. Contingent consideration classified as an asset or liability that is a financial instrument and within the scope of Ind AS 109 Financial Instruments, is measured at fair value with changes in fair value recognised in statement of profit and loss. If the contingent consideration is not within the scope of Ind AS 109, it is measured in accordance with the appropriate Ind AS. Contingent consideration that is classified as equity is not re-measured at subsequent reporting dates and any difference subsequent its settlement is accounted for within equity.
Goodwill is initially measured at cost, being the excess of the aggregate of the consideration transferred and the amount recognised for non-controlling interests, and any previous interest held, over the fair value of identifiable assets acquired net of fair value of liabilities assumed. Any gain on a bargain purchase is recognised in OCI and accumulated in equity as capital reserve if there exists clear evidence, of the underlying reasons for classifying the business combination as resulting in a bargain purchase; otherwise the gain is recognised directly in equity as capital reserve.
After initial recognition, goodwill is measured at cost less any accumulated impairment losses. For the purpose of impairment testing, goodwill acquired in a business combination is, from the acquisition date, allocated to each of the Group’s cash-generating units that are expected to benefit from the combination, irrespective of whether other assets or liabilities of the acquiree are assigned to those units.
Notes to Consolidated Financial Statements for the year ended March 31, 2019

Annual Report 2018-19 | 225
UPL Limited
A cash generating unit to which goodwill has been allocated is tested for impairment annually, or more frequently when there is an indication that the unit may be impaired. If the recoverable amount of the cash generating unit is less than its carrying amount, the impairment loss is allocated first to reduce the carrying amount of any goodwill allocated to the unit and then to the other assets of the unit pro rata based on the carrying amount of each asset in the unit. Any impairment loss for goodwill is recognised in statement of profit and loss. An impairment loss recognised for goodwill is not reversed in subsequent periods.
Where goodwill has been allocated to a cash-generating unit and part of the operation within that unit is disposed of, the goodwill associated with the disposed operation is included in the carrying amount of the operation when determining the gain or loss on disposal. Goodwill disposed in these circumstances is measured based on the relative values of the disposed operation and the portion of the cash-generating unit retained.
b. Investment in associates and joint ventures The group’s interest in equity in investees comprise interests in associates and joint ventures.
An associate is an entity in which the group has significant influence, but not control or joint control, over the financial and operating policies. A joint venture is an arrangement in which the group has joint control and has right to the net assets of the arrangement, rather than the right to its assets and obligations for its liabilities.
Interests in associates and joint ventures are accounted for using the equity method. They are initially recognised at cost which includes transaction costs. Subsequent to intial recognition the consolidated financial statements include the groups share of profit and loss and OCI of equity accounted investee until the date on which significant influence or joint control ceases.”
c. Current versus non-current classification The Group presents assets and liabilities in the balance sheet based on current/ non-current classification. An asset is
treated as current when it is: - Expected to be realised or intended to be sold or consumed in normal operating cycle - Held primarily for the purpose of trading - Cash or cash equivalent unless restricted from being exchanged or used to settle a liability for at least twelve
months after the reporting period
All other assets are classified as non-current.
A liability is current when: - It is expected to be settled in normal operating cycle - It is held primarily for the purpose of trading - There is no unconditional right to defer the settlement of the liability for at least twelve months after the reporting
period
The Group classifies all other liabilities as non-current.
Deferred tax assets and liabilities are classified as non-current.
Based on the nature of products and the time between acquisition of assets for processing and their realisation in cash and cash equivalents, the Group has identified twelve months as its operating cycle for the purpose of current / non current classification of assets and liabilities.
d. Revenue recognition Revenue is recognised to the extent that it is probable that the economic benefits will flow to the Company and the
revenue can be reliably measured, regardless of when the payment is being made. Revenue is measured at the fair value of the consideration received or receivable, taking into account contractually defined terms of payment and excluding taxes or duties collected on behalf of the government.
Revenue is stated inclusive of excise duty and excludes sales tax/ value added tax (VAT)/Goods and Service Tax (GST).
The specific recognition criteria described below must also be met before revenue is recognised.
Sale of goods Revenue is recognised upon transfer of control of promised goods to customers in an amount that reflects the
consideration which the Company expects to receive in exchange for those goods.
Notes to Consolidated Financial Statements for the year ended March 31, 2019
226 | Annual Report 2018-19
UPL Limited
Revenue from the sale of goods is recognised at the point in time when control is transferred to the customer which is usually on shipment.
Revenue is measured based on the transaction price, which is the consideration, adjusted for volume discounts, rebates, scheme allowances, price concessions, incentives, and returns, if any, as specified in the contracts with the customers. Revenue excludes taxes collected from customers on behalf of the government. Accruals for discounts/incentives and returns are estimated (using the most likely method)based on accumulated experience and underlying schemes and agreements with customers. Due to the short nature of credit period given to customers, there is no financing component in the contract.
Rendering of services Income from services are recognized as and when the services are rendered.
Interest income For all debt instruments measured either at amortised cost or at fair value through other comprehensive income, interest
income is recorded using the effective interest rate (EIR). EIR is the rate that exactly discounts the estimated future cash payments or receipts over the expected life of the financial instrument or a shorter period, where appropriate, to the gross carrying amount of the financial asset or to the amortised cost of a financial liability. When calculating the effective interest rate, the Company estimates the expected cash flows by considering all the contractual terms of the financial instrument (for example prepayment, extension, call and similar options) but does not consider the expected credit losses. Interest income is included in other income in the statement of profit and loss.
Export Incentive Duty free imports of raw materials under Advance License for Imports as per the Export and Import Policy are matched
with the exports made against the said licenses and the benefit / obligation is accounted by making suitable adjustments in raw material consumption.
The benefit accrued under the Duty Drawback scheme and other schemes as per the Export and Import Policy in respect of exports made under the said Schemes is included under the head “Revenue from Operations” as ‘Export Incentive’
Dividends and Royalties Dividend income is recognised when the Company’s right to receive the payment is established, which is generally when
shareholders approve the dividend. Royalty income is recognized on an accrual basis in accordance with the substance of the relevant agreement.
e. Non-current assets held for sale The Group classifies non-current assets as held for sale if their carrying amounts will be recovered principally through
a sale rather than through continuing use. Actions required to complete the sale should indicate that it is unlikely that significant changes to the sale will be made or that the decision to sell will be withdrawn. Management must be committed to the sale expected within one year from the date of classification.
For these purposes, sale transactions include exchanges of non-current assets for other non-current assets when the exchange has commercial substance. The criteria for held for sale is regarded met only when the assets are available for immediate sale in its present condition, subject only to terms that are usual and customary for sales of such assets, its sale is highly probable; and it will genuinely be sold, not abandoned. The Group treats sale of the asset or disposal of Company to be highly probable when:
- The appropriate level of management is committed to a plan to sell the asset, - An active programme to locate a buyer and complete the plan has been initiated (if applicable), - The asset is being actively marketed for sale at a price that is reasonable in relation to its current fair value, - The sale is expected to qualify for recognition as a completed sale within one year from the date of classification,
and - Actions required to complete the plan indicate that it is unlikely that significant changes to the plan will be made or
that the plan will be withdrawn.
Non-current assets held for sale to owners are measured at the lower of their carrying amount and the fair value less costs to sell. Assets and liabilities classified as held for sale are presented separately in the balance sheet.
Property, plant and equipment and intangible assets once classified as held for sale are not depreciated or amortised.
Notes to Consolidated Financial Statements for the year ended March 31, 2019
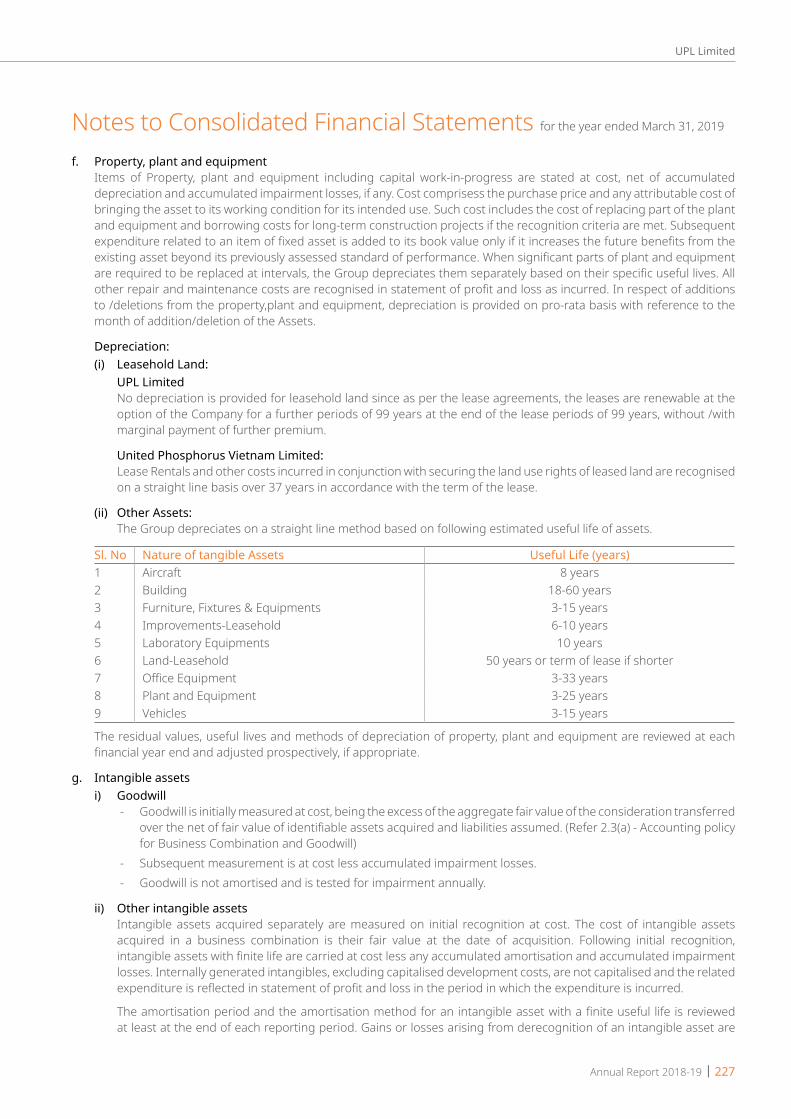
Annual Report 2018-19 | 227
UPL Limited
f. Property, plant and equipment Items of Property, plant and equipment including capital work-in-progress are stated at cost, net of accumulated
depreciation and accumulated impairment losses, if any. Cost comprisess the purchase price and any attributable cost of bringing the asset to its working condition for its intended use. Such cost includes the cost of replacing part of the plant and equipment and borrowing costs for long-term construction projects if the recognition criteria are met. Subsequent expenditure related to an item of fixed asset is added to its book value only if it increases the future benefits from the existing asset beyond its previously assessed standard of performance. When significant parts of plant and equipment are required to be replaced at intervals, the Group depreciates them separately based on their specific useful lives. All other repair and maintenance costs are recognised in statement of profit and loss as incurred. In respect of additions to /deletions from the property,plant and equipment, depreciation is provided on pro-rata basis with reference to the month of addition/deletion of the Assets.
Depreciation: (i) Leasehold Land: UPL Limited No depreciation is provided for leasehold land since as per the lease agreements, the leases are renewable at the
option of the Company for a further periods of 99 years at the end of the lease periods of 99 years, without /with marginal payment of further premium.
United Phosphorus Vietnam Limited: Lease Rentals and other costs incurred in conjunction with securing the land use rights of leased land are recognised
on a straight line basis over 37 years in accordance with the term of the lease.
(ii) Other Assets: The Group depreciates on a straight line method based on following estimated useful life of assets.
Sl. No Nature of tangible Assets Useful Life (years)1 Aircraft 8 years2 Building 18-60 years3 Furniture, Fixtures & Equipments 3-15 years4 Improvements-Leasehold 6-10 years5 Laboratory Equipments 10 years6 Land-Leasehold 50 years or term of lease if shorter7 Office Equipment 3-33 years8 Plant and Equipment 3-25 years9 Vehicles 3-15 years
The residual values, useful lives and methods of depreciation of property, plant and equipment are reviewed at each financial year end and adjusted prospectively, if appropriate.
g. Intangible assets i) Goodwill - Goodwill is initially measured at cost, being the excess of the aggregate fair value of the consideration transferred
over the net of fair value of identifiable assets acquired and liabilities assumed. (Refer 2.3(a) - Accounting policy for Business Combination and Goodwill)
- Subsequent measurement is at cost less accumulated impairment losses. - Goodwill is not amortised and is tested for impairment annually.
ii) Other intangible assets Intangible assets acquired separately are measured on initial recognition at cost. The cost of intangible assets
acquired in a business combination is their fair value at the date of acquisition. Following initial recognition, intangible assets with finite life are carried at cost less any accumulated amortisation and accumulated impairment losses. Internally generated intangibles, excluding capitalised development costs, are not capitalised and the related expenditure is reflected in statement of profit and loss in the period in which the expenditure is incurred.
The amortisation period and the amortisation method for an intangible asset with a finite useful life is reviewed at least at the end of each reporting period. Gains or losses arising from derecognition of an intangible asset are
Notes to Consolidated Financial Statements for the year ended March 31, 2019
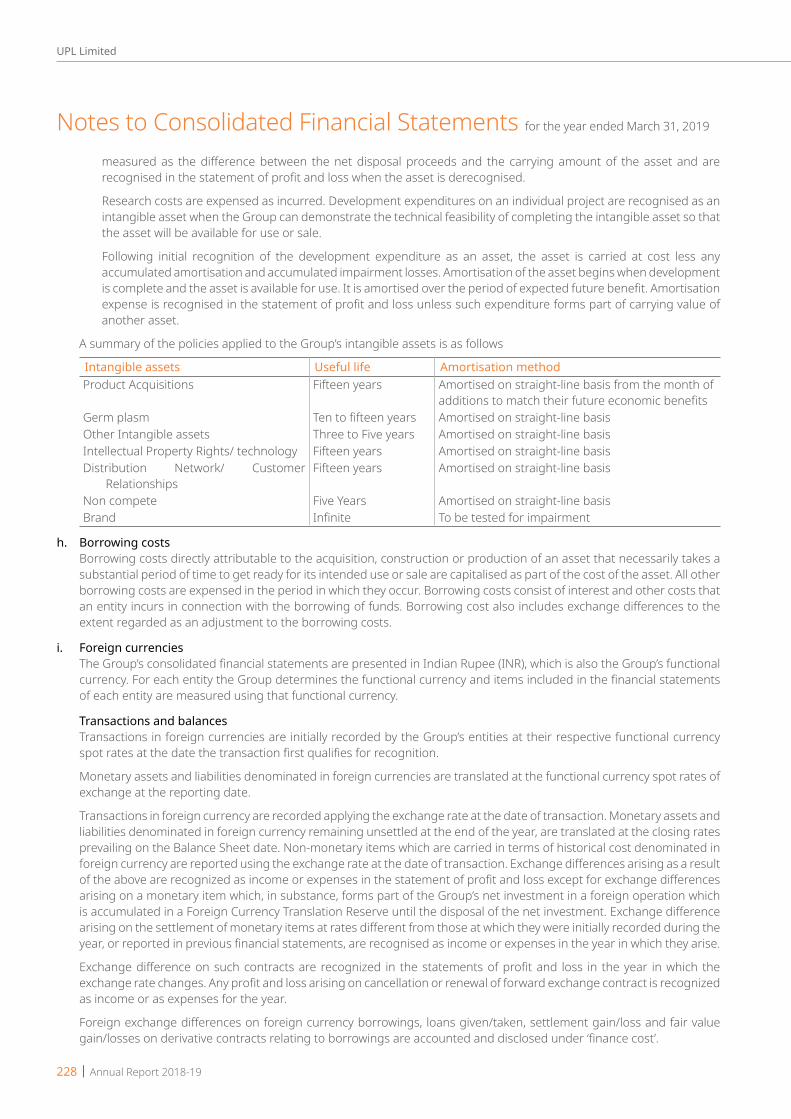
228 | Annual Report 2018-19
UPL Limited
measured as the difference between the net disposal proceeds and the carrying amount of the asset and are recognised in the statement of profit and loss when the asset is derecognised.
Research costs are expensed as incurred. Development expenditures on an individual project are recognised as an intangible asset when the Group can demonstrate the technical feasibility of completing the intangible asset so that the asset will be available for use or sale.
Following initial recognition of the development expenditure as an asset, the asset is carried at cost less any accumulated amortisation and accumulated impairment losses. Amortisation of the asset begins when development is complete and the asset is available for use. It is amortised over the period of expected future benefit. Amortisation expense is recognised in the statement of profit and loss unless such expenditure forms part of carrying value of another asset.
A summary of the policies applied to the Group’s intangible assets is as follows
Intangible assets Useful life Amortisation methodProduct Acquisitions Fifteen years Amortised on straight-line basis from the month of
additions to match their future economic benefitsGerm plasm Ten to fifteen years Amortised on straight-line basisOther Intangible assets Three to Five years Amortised on straight-line basisIntellectual Property Rights/ technology Fifteen years Amortised on straight-line basisDistribution Network/ Customer
RelationshipsFifteen years Amortised on straight-line basis
Non compete Five Years Amortised on straight-line basisBrand Infinite To be tested for impairment
h. Borrowing costs Borrowing costs directly attributable to the acquisition, construction or production of an asset that necessarily takes a
substantial period of time to get ready for its intended use or sale are capitalised as part of the cost of the asset. All other borrowing costs are expensed in the period in which they occur. Borrowing costs consist of interest and other costs that an entity incurs in connection with the borrowing of funds. Borrowing cost also includes exchange differences to the extent regarded as an adjustment to the borrowing costs.
i. Foreign currencies The Group’s consolidated financial statements are presented in Indian Rupee (INR), which is also the Group’s functional
currency. For each entity the Group determines the functional currency and items included in the financial statements of each entity are measured using that functional currency.
Transactions and balances Transactions in foreign currencies are initially recorded by the Group’s entities at their respective functional currency
spot rates at the date the transaction first qualifies for recognition.
Monetary assets and liabilities denominated in foreign currencies are translated at the functional currency spot rates of exchange at the reporting date.
Transactions in foreign currency are recorded applying the exchange rate at the date of transaction. Monetary assets and liabilities denominated in foreign currency remaining unsettled at the end of the year, are translated at the closing rates prevailing on the Balance Sheet date. Non-monetary items which are carried in terms of historical cost denominated in foreign currency are reported using the exchange rate at the date of transaction. Exchange differences arising as a result of the above are recognized as income or expenses in the statement of profit and loss except for exchange differences arising on a monetary item which, in substance, forms part of the Group’s net investment in a foreign operation which is accumulated in a Foreign Currency Translation Reserve until the disposal of the net investment. Exchange difference arising on the settlement of monetary items at rates different from those at which they were initially recorded during the year, or reported in previous financial statements, are recognised as income or expenses in the year in which they arise.
Exchange difference on such contracts are recognized in the statements of profit and loss in the year in which the exchange rate changes. Any profit and loss arising on cancellation or renewal of forward exchange contract is recognized as income or as expenses for the year.
Foreign exchange differences on foreign currency borrowings, loans given/taken, settlement gain/loss and fair value gain/losses on derivative contracts relating to borrowings are accounted and disclosed under ‘finance cost’.
Notes to Consolidated Financial Statements for the year ended March 31, 2019

Annual Report 2018-19 | 229
UPL Limited
Non-monetary items that are measured in terms of historical cost in a foreign currency are translated using the exchange rates at the dates of the initial transactions. Non-monetary items measured at fair value in a foreign currency are translated using the exchange rates at the date when the fair value is determined. The gain or loss arising on translation of non-monetary items measured at fair value is treated in line with the recognition of the gain or loss on the change in fair value of the item (i.e., translation differences on items whose fair value gain or loss is recognised in OCI or statement of profit and loss are also recognised in OCI or statement of profit and loss, respectively).
Translation of financial statements of foreign entities On consolidation, the assets and liabilities of foreign operations are translated into INR at the rate of exchange prevailing
at the reporting date and their statements of profit and loss are translated at exchange rates prevailing at the dates of the transactions. For practical reasons, the group uses a monthly average rate to translate income and expense items, if the average rate approximates the exchange rates at the dates of the transactions. The exchange differences arising on translation for consolidation are recognised in OCI. On disposal of a foreign operation, the component of OCI relating to that particular foreign operation is reclassified to the statement of profit and loss.
Any goodwill arising in the acquisition/ business combination of a foreign operation and any fair value adjustments to the carrying amounts of assets and liabilities arising on the acquisition are treated as assets and liabilities of the foreign operation and translated at the spot rate of exchange at the reporting date.
j. Fair value measurement The Group measures financial instruments, such as, derivatives at fair value at each balance sheet date on a portfolio
basis.
Fair value is the price that would be received to sell an asset or paid to transfer a liability in an orderly transaction between market participants at the measurement date. The fair value measurement is based on the presumption that the transaction to sell the asset or transfer the liability takes place either:
- In the principal market for the asset or liability, or - In the absence of a principal market, in the most advantageous market for the asset or liability
The principal or the most advantageous market must be accessible by the Group.
The fair value of an asset or a liability is measured using the assumptions that market participants would use when pricing the asset or liability, assuming that market participants act in their economic best interest.
A fair value measurement of a non-financial asset takes into account a market participant’s ability to generate economic benefits by using the asset in its highest and best use or by selling it to another market participant that would use the asset in its highest and best use.
The Group uses valuation techniques that are appropriate in the circumstances and for which sufficient data are available to measure fair value, maximising the use of relevant observable inputs and minimising the use of unobservable inputs.
All assets and liabilities for which fair value is measured or disclosed in the financial statements are categorised within the fair value hierarchy, described as follows, based on the lowest level input that is significant to the fair value measurement as a whole:
Level 1 — Quoted (unadjusted) market prices in active markets for identical assets or liabilities
Level 2 — Valuation techniques for which the lowest level input that is significant to the fair value measurement is directly or indirectly observable
Level 3 — Valuation techniques for which the lowest level input that is significant to the fair value measurement is unobservable
For assets and liabilities that are recognised in the financial statements on a recurring basis, the Group determines whether transfers have occurred between levels in the hierarchy by re-assessing categorisation (based on the lowest level input that is significant to the fair value measurement as a whole) at the end of each reporting period.
This note summarises accounting policy for fair value. Other fair value related disclosures are given in the relevant notes.
- Contingent consideration (note 42) - Quantitative disclosures of fair value measurement hierarchy (note 46) - Financial instruments (including those carried at amortised cost) (note 5, 6, 7, 10, 11, 11A, 15, 16, 19, 44, 45, 46, 47)
Notes to Consolidated Financial Statements for the year ended March 31, 2019

230 | Annual Report 2018-19
UPL Limited
k. Leases The determination of whether an arrangement is (or contains) a lease is based on the substance of the arrangement at
the inception of the lease. The arrangement is, or contains, a lease if fulfilment of the arrangement is dependent on the use of a specific asset or assets and the arrangement conveys a right to use the asset or assets, even if that right is not explicitly specified in an arrangement.
For arrangements entered into prior to 1 April 2015, the Group has determined whether the arrangement contain lease on the basis of facts and circumstances existing on the date of transition.
Group as a lessee A lease is classified at the inception date as a finance lease or an operating lease. A lease that transfers substantially all
the risks and rewards incidental to ownership to the Group is classified as a finance lease.
Finance leases are capitalised at the commencement of the lease at the inception date fair value of the leased property or, if lower, at the present value of the minimum lease payments. Lease payments are apportioned between finance charges and reduction of the lease liability so as to achieve a constant rate of interest on the remaining balance of the liability. Finance charges are recognised in finance costs in the statement of profit and loss, unless they are directly attributable to qualifying assets, in which case they are capitalized in accordance with the Group’s general policy on the borrowing costs (See note 2.1). Contingent rentals are recognised as expenses in the periods in which they are incurred.
A leased asset is depreciated over the useful life of the asset. However, if there is no reasonable certainty that the Group will obtain ownership by the end of the lease term, the asset is depreciated over the shorter of the estimated useful life of the asset and the lease term.
Operating lease payments are recognised as an expense in the statement of profit and loss on a straight-line basis over the lease term.
Group as a lessor Leases in which the Group does not transfer substantially all the risks and rewards of ownership of an asset are classified
as operating leases. Rental income from operating lease is recognised on a straight-line basis over the term of the relevant lease. Initial direct costs incurred in negotiating and arranging an operating lease are added to the carrying amount of the leased asset and recognised over the lease term on the same basis as rental income. Contingent rents are recognised as revenue in the period in which they are earned.
Leases are classified as finance leases when substantially all of the risks and rewards of ownership transfer from the Group to the lessee. Amounts due from lessees under finance leases are recorded as receivables at the Group’s net investment in the leases. Finance lease income is allocated to accounting periods so as to reflect a constant periodic rate of return on the net investment outstanding in respect of the lease.
l. Inventories (i) Stocks of stores and spares, packing materials and raw materials are valued at lower of cost or net realisable value.
Cost is determined on moving weighted average basis. The aforesaid items are valued below cost if the finished products in which they are to be incorporated are expected to be sold at a loss.
(ii) Semi-finished products, finished products and by-products are valued at lower of cost or net realisable value and for this purpose, cost is determined on standard cost basis which approximates the actual cost. Cost of finished goods includes excise duty, as applicable. Variances, exclusive of abnormally low volume and operating performance, are capitalized into inventory.
(iii) Traded goods are valued at lower of cost and net realizable value. Cost includes cost of purchase and other costs incurred in bringing the inventories to their present location and condition. Cost is determined on a weighted average basis.
Net realisable value is the estimated selling price in the ordinary course of business, less estimated costs of completion and the estimated costs necessary to make the sale.
m. Impairment of non-financial assets The Group assesses, at each reporting date, whether there is an indication that an asset may be impaired. If any indication
exists, or when annual impairment testing for an asset is required, the Group estimates the asset’s recoverable amount. An asset’s recoverable amount is the higher of an asset’s or cash-generating unit’s (CGU) fair value less costs of disposal and its value in use. Recoverable amount is determined for an individual asset, unless the asset does not generate cash inflows that are largely independent of those from other assets or groups of assets. When the carrying amount of an
Notes to Consolidated Financial Statements for the year ended March 31, 2019

Annual Report 2018-19 | 231
UPL Limited
asset or CGU exceeds its recoverable amount, the asset is considered impaired and is written down to its recoverable amount.
In assessing value in use, the estimated future cash flows are discounted to their present value using a pre-tax discount rate that reflects current market assessments of the time value of money and the risks specific to the asset. In determining fair value less costs of disposal, recent market transactions are taken into account. If no such transactions can be identified, an appropriate valuation model is used. These calculations are corroborated by valuation multiples, quoted share prices for publicly traded companies or other available fair value indicators.
The Group bases its impairment calculation on detailed budgets and forecast calculations, which are prepared separately for each of the Company’s CGUs to which the individual assets are allocated. These budgets and forecast calculations generally cover a period of five years. For longer periods, a long-term growth rate is calculated and applied to project future cash flows after the fifth year. To estimate cash flow projections beyond periods covered by the most recent budgets/forecasts, the Group extrapolates cash flow projections in the budget using a steady or declining growth rate for subsequent years, unless an increasing rate can be justified. In any case, this growth rate does not exceed the long-term average growth rate for the products, industries, or country or countries in which the entity operates, or for the market in which the asset is used.
For assets excluding goodwill, an assessment is made at each reporting date to determine whether there is an indication that previously recognised impairment losses no longer exist or have decreased. If such indication exists, the Group estimates the asset’s or CGU’s recoverable amount. A previously recognised impairment loss is reversed only if there has been a change in the assumptions used to determine the asset’s recoverable amount since the last impairment loss was recognised. The reversal is limited so that the carrying amount of the asset does not exceed its recoverable amount, nor exceed the carrying amount that would have been determined, net of depreciation, had no impairment loss been recognised for the asset in prior years. Such reversal is recognised in the statement of profit and loss.
Goodwill is tested for impairment annually as at 31 March and when circumstances indicate that the carrying value may be impaired.
Impairment is determined for goodwill by assessing the recoverable amount of each CGU (or group of CGUs) to which the goodwill relates. When the recoverable amount of the CGU is less than its carrying amount, an impairment loss is recognised. Impairment losses relating to goodwill are not reversed in future periods.
Intangible assets with indefinite useful lives are tested for impairment annually as at 31 March at the CGU level, as appropriate, and when circumstances indicate that the carrying value may be impaired.
n. Provisions General Provisions are recognised when the Group has a present obligation (legal or constructive) as a result of a past event, it
is probable that an outflow of resources embodying economic benefits will be required to settle the obligation and a reliable estimate can be made of the amount of the obligation. When the Group expects some or all of a provision to be reimbursed, for example, under an insurance contract, the reimbursement is recognised as a separate asset, but only when the reimbursement is virtually certain. The expense relating to a provision is presented in the statement of profit and loss net of any reimbursement.
If the effect of the time value of money is material, provisions are discounted using a current pre-tax rate that reflects, when appropriate, the risks specific to the liability. When discounting is used, the increase in the provision due to the passage of time is recognised as a finance cost. Provisions are reviewed at each balance sheet and adjusted to reflect the current best estimates.
Contingent liabilities recognised in a business combination A contingent liability recognised in a business combination is initially measured at its fair value. Subsequently, it is
measured at the higher of the amount that would be recognised in accordance with the requirements for provisions above or the amount initially recognised less, when appropriate, cumulative amortisation recognised in accordance with the requirements for revenue recognition.
o. Taxes Current income tax Current income tax assets and liabilities are measured at the amount expected to be recovered from or paid to the
taxation authorities. The tax rates and tax laws used to compute the amount are those that are enacted or substantively enacted, at the reporting date in the countries where the Group operates and generates taxable income.
Notes to Consolidated Financial Statements for the year ended March 31, 2019
232 | Annual Report 2018-19
UPL Limited
Current income tax relating to items recognised outside statement of profit and loss is recognised outside profit or loss (either in other comprehensive income or in equity). Management periodically evaluates positions taken in the tax returns with respect to situations in which applicable tax regulations are subject to interpretation and establishes provisions where appropriate.
Deferred tax Deferred tax is provided using the liability method on temporary differences between the tax bases of assets and
liabilities and their carrying amounts for financial reporting purposes at the reporting date.
Deferred tax liabilities are recognised for all taxable temporary differences, except: - When the deferred tax liability arises from the initial recognition of goodwill or an asset or liability in a transaction
that is not a business combination and, at the time of the transaction, affects neither the accounting profit nor taxable profit or loss
- In respect of taxable temporary differences associated with investments in subsidiaries and interests in joint ventures, when the timing of the reversal of the temporary differences can be controlled and it is probable that the temporary differences will not reverse in the foreseeable future
Deferred tax assets are recognised for all deductible temporary differences, the carry forward of unused tax credits and any unused tax losses. Deferred tax assets are recognised to the extent that it is reasonably certain that taxable profit will be available against which the deductible temporary differences, and the carry forward of unused tax credits and unused tax losses can be utilised, except:
- When the deferred tax asset relating to the deductible temporary difference arises from the initial recognition of an asset or liability in a transaction that is not a business combination and, at the time of the transaction, affects neither the accounting profit nor taxable profit or loss
- In respect of deductible temporary differences associated with investments in subsidiaries and interests in joint ventures, deferred tax assets are recognised only to the extent that it is probable that the temporary differences will reverse in the foreseeable future and taxable profit will be available against which the temporary differences can be utilised
The carrying amount of deferred tax assets is reviewed at each reporting date and reduced to the extent that it is no longer probable that sufficient taxable profit will be available to allow all or part of the deferred tax asset to be utilised. Unrecognised deferred tax assets are re-assessed at each reporting date and are recognised to the extent that it has become reasonable certainty that future taxable profits will allow the deferred tax asset to be recovered.
Deferred tax assets and liabilities are measured at the tax rates that are expected to apply in the year when the asset is realised or the liability is settled, based on tax rates (and tax laws) that have been enacted or substantively enacted at the reporting date.
Deferred tax relating to items recognised outside profit and loss is recognised outside the statement of profit and loss (either in other comprehensive income or in equity). Deferred tax items are recognised in correlation to the underlying transaction either in OCI or directly in equity.
Deferred tax assets and deferred tax liabilities are offset if a legally enforceable right exists to set off current tax assets against current tax liabilities and the deferred taxes relate to the same taxable entity and the same taxation authority.
Tax benefits acquired as part of a business combination, but not satisfying the criteria for separate recognition at that date, are recognised subsequently if new information about facts and circumstances change. Acquired deferred tax benefits recognised within the measurement period reduce goodwill related to that acquisition if they result from new information obtained about facts and circumstances existing at the acquisition date. If the carrying amount of goodwill is zero, any remaining deferred tax benefits are recognised in OCI/ capital reserve depending on the principle explained for bargain purchase gains. All other acquired tax benefits realised are recognised in statement of profit and loss.
Minimum Alternate Tax (MAT) Minimum Alternate Tax (MAT) is in the nature of unused tax credit which can be carried forward and utilised when the
Group will pay normal income tax during the specified period. Deferred tax assets on such tax credit is recognised to the extent that it is probable that the unused tax credit can be utilised in the specified future period.
Notes to Consolidated Financial Statements for the year ended March 31, 2019
Annual Report 2018-19 | 233
UPL Limited
p. Retirement and other employee benefits 1. UPL Limited and SWAL Corporation Limited i) Provident Fund is a defined contribution scheme established under a State Plan. The contributions to the
scheme are charged to the statement of profit and loss in the year when employee rendered related services.
ii) Superannuation Fund is a defined contribution scheme and contributions to the scheme are charged to the statement of profit and loss in the year when the contributions are due. The scheme is funded with an insurance company in the form of a qualifying insurance policy.
iii) The companies have a defined benefit gratuity plan. Every employee who has completed five years or more of service gets a gratuity on post employment at 15 days salary (last drawn salary) for each completed year of service as per the rules of the company. The aforesaid liability is provided for on the basis of an actuarial valuation made on projected unit credit method at the end of the financial year. The scheme is funded with an insurance company in the form of a qualifying insurance policy.
iv) The Group has other long term employee benefits in the nature of leave encashment. The liability in respect of leave encashment is provided for on the basis of actuarial valuation made on projected unit credit method at the end of the financial year. The aforesaid leave encashment is funded with an insurance company in the form of a qualifying insurance policy.
v) Remeasurements, comprising of actuarial gains and losses, the effect of the asset ceiling, excluding amounts included in net interest on the net defined benefit liability and the return on plan assets (excluding amounts included in net interest on the net defined benefit liability), are recognised immediately in the balance sheet with a corresponding debit or credit to retained earnings through OCI in the period in which they occur. Remeasurements are not reclassified to statement of profit and loss in subsequent periods.
2. All Other subsidiaries: The Companies contribute to a defined contribution plan which are charged to the statement of profit and loss as
incurred.
q. Share-based payments Measurement and disclosure of the employee share based payment plans is done in accordance with Ind AS 102, “Share
based payments”. The Group measures compensation cost relating to employee stock options using the fair value method. Compensation expense is amortised over the vesting period of the option on a straight line basis.
r. Financial instruments A financial instrument is any contract that gives rise to a financial asset of one entity and a financial liability or equity
instrument of another entity.
Financial assets Initial recognition and measurement All financial assets are recognised initially at cost and then measured at fair value at each reporting date, in the case of
financial assets not recorded at fair value through profit or loss, transaction costs that are attributable to the acquisition of the financial asset.
Debt instruments at amortised cost A ‘debt instrument’ is measured at the amortised cost if both the following conditions are met: a) The asset is held within a business model whose objective is to hold assets for collecting contractual cash flows, and b) Contractual terms of the asset give rise on specified dates to cash flows that are solely payments of principal and
interest (SPPI) on the principal amount outstanding.
After initial measurement, such financial assets are subsequently measured at amortised cost using the effective interest rate (EIR) method. Amortised cost is calculated by taking into account any discount or premium on acquisition and fees or costs that are an integral part of the EIR. The EIR amortisation is included in finance income in the statement of profit and loss. The losses arising from impairment are recognised in the statement of profit and loss.
Debt instrument at FVTOCI A ‘debt instrument’ is classified as at the FVTOCI if both of the following criteria are met: a) The objective of the business model is achieved both by collecting contractual cash flows and selling the financial
assets, and
b) The asset’s contractual cash flows represent SPPI.
Notes to Consolidated Financial Statements for the year ended March 31, 2019
234 | Annual Report 2018-19
UPL Limited
Debt instruments included within the FVTOCI category are measured initially as well as at each reporting date at fair value. Fair value movements are recognized in the other comprehensive income (OCI). However, the Group recognizes interest income, impairment losses and reversals and foreign exchange gain or loss in the statment of profit and loss.On derecognition of the asset, cumulative gain or loss previously recognised in OCI is reclassified from the equity to statement of profit and loss. Interest earned whilst holding FVTOCI debt instrument is reported as interest income using the EIR method.
Debt instrument at FVTPL FVTPL is a residual category for debt instruments. Any debt instrument, which does not meet the criteria for categorization
as at amortized cost or as FVTOCI, is classified as at FVTPL.
In addition, the Group may elect to designate a debt instrument, which otherwise meets amortized cost or FVTOCI criteria, as at FVTPL. However, such election is allowed only if doing so reduces or eliminates a measurement or recognition inconsistency (referred to as ‘accounting mismatch’).
Debt instruments included within the FVTPL category are measured at fair value with all changes recognized in the statement of profit and loss.
Equity investments All equity investments in the scope of Ind AS 109 are measured at fair value. Equity instruments which are held for
trading and contingent consideration recognised by the Company as an acquirer in a business combination to which Ind AS 103 applies are classified as at FVTPL. For all other equity instruments, the Group may make an irrevocable election to present in other comprehensive income subsequent changes in the fair value. The Group makes such election on an instrument-by-instrument basis. The classification is made on initial recognition and is irrevocable.
If the Group decides to classify an equity instrument as at FVTOCI, then all fair value changes on the instrument, excluding dividends, are recognized in the OCI. There is no recycling of the amounts from OCI to statement of profit and loss, even on sale of investment. However, the Group may transfer the cumulative gain or loss within equity.
Equity instruments included within the FVTPL category are measured at fair value with all changes recognized in the statement of profit and loss.
Derecognition A financial asset (or, where applicable, a part of a financial asset or part of a group of similar financial assets) is primarily
derecognised (i.e. removed from the Group’s consolidated balance sheet) when: - The rights to receive cash flows from the asset have expired, or - The Group has transferred its rights to receive cash flows from the asset or has assumed an obligation to pay the
received cash flows in full without material delay to a third party under a ‘pass-through’ arrangement; and either (a) the Group has transferred substantially all the risks and rewards of the asset, or (b) the Group has neither transferred nor retained substantially all the risks and rewards of the asset, but has transferred control of the asset.
When the Group has transferred its rights to receive cash flows from an asset or has entered into a pass-through arrangement, it evaluates if and to what extent it has retained the risks and rewards of ownership. When it has neither transferred nor retained substantially all of the risks and rewards of the asset, nor transferred control of the asset, the Group continues to recognise the transferred asset to the extent of the Group’s continuing involvement. In that case, the Group also recognises an associated liability. The transferred asset and the associated liability are measured on a basis that reflects the rights and obligations that the Group has retained.
Continuing involvement that takes the form of a guarantee over the transferred asset is measured at the lower of the original carrying amount of the asset and the maximum amount of consideration that the Group could be required to repay.
Impairment of financial assets In accordance with Ind AS 109, the Group applies expected credit loss (ECL) model for measurement and recognition of
impairment loss on the following financial assets and credit risk exposure:
a) Financial assets that are debt instruments, and are measured at amortised cost e.g., loans, debt securities, deposits, trade receivables and bank balance
b) Financial assets that are debt instruments and are measured as at FVTOCI
Notes to Consolidated Financial Statements for the year ended March 31, 2019

Annual Report 2018-19 | 235
UPL Limited
c) Lease receivables under Ind AS 17
d) Trade receivables or any contractual right to receive cash or another financial asset that result from transactions that are within the scope of Ind AS 18 (referred to as contractual revenue receivables’ in these financial statements)
e) Financial guarantee contracts which are not measured as at FVTPL
The Group follows ‘simplified approach’ for recognition of impairment loss allowance on: - Trade receivables or contract revenue receivables; and - All lease receivables resulting from transactions within the scope of Ind AS 17
The application of simplified approach does not require the Group to track changes in credit risk. Rather, it recognises impairment loss allowance based on lifetime ECLs at each reporting date, right from its initial recognition.
For recognition of impairment loss on other financial assets and risk exposure, the Group determines that whether there has been a significant increase in the credit risk since initial recognition. If credit risk has not increased significantly, 12-month ECL is used to provide for impairment loss. However, if credit risk has increased significantly, lifetime ECL is used. If, in a subsequent period, credit quality of the instrument improves such that there is no longer a significant increase in credit risk since initial recognition, then the entity reverts to recognising impairment loss allowance based on 12-month ECL.
Lifetime ECL are the expected credit losses resulting from all possible default events over the expected life of a financial instrument. The 12-month ECL is a portion of the lifetime ECL which results from default events that are possible within 12 months after the reporting date.
ECL is the difference between all contractual cash flows that are due to the Group in accordance with the contract and all the cash flows that the entity expects to receive (i.e., all cash shortfalls), discounted at the original EIR. When estimating the cash flows, an entity is required to consider:
- All contractual terms of the financial instrument (including prepayment, extension, call and similar options) over the expected life of the financial instrument. However, in rare cases when the expected life of the financial instrument cannot be estimated reliably, then the entity is required to use the remaining contractual term of the financial instrument
- Cash flows from the sale of collateral held or other credit enhancements that are integral to the contractual terms - Financial assets measured as at amortised cost, contractual revenue receivables and lease receivables: ECL is
presented as an allowance, i.e., as an integral part of the measurement of those assets in the balance sheet. The allowance reduces the net carrying amount. Until the asset meets write-off criteria, the company does not reduce impairment allowance from the gross carrying amount.
s. Financial liabilities Initial recognition and measurement Financial liabilities are classified, at initial recognition, as financial liabilities at fair value through profit or loss, loans and
borrowings, or payables, as appropriate.
All financial liabilities are recognised initially at fair value and, in the case of loans and borrowings and payables, net of directly attributable transaction costs.
The Group’s financial liabilities include trade and other payables, loans and borrowings including bank overdrafts and derivative financial instruments.
Subsequent measurement The measurement of financial liabilities depends on their classification, as described below:
Financial liabilities at fair value through profit or loss Financial liabilities at fair value through profit or loss include financial liabilities held for trading and financial liabilities
designated upon initial recognition as at fair value through profit or loss. Financial liabilities are classified as held for trading if they are incurred for the purpose of repurchasing in the near term. This category also includes derivative financial instruments entered into by the Group that are not designated as hedging instruments in hedge relationships as defined by Ind AS 109.
Gains or losses on liabilities held for trading are recognised in the statement of profit and loss.
Notes to Consolidated Financial Statements for the year ended March 31, 2019

236 | Annual Report 2018-19
UPL Limited
Loans and borrowings This is the category most relevant to the Group. After initial recognition, interest-bearing loans and borrowings are
subsequently measured at amortised cost using the EIR method. Gains and losses are recognised in statement of profit and loss when the liabilities are derecognised as well as through the EIR amortisation process.
Amortised cost is calculated by taking into account any discount or premium on acquisition and fees or costs that are an integral part of the EIR. The EIR amortisation is included as finance costs in the statement of profit and loss.
This category generally applies to borrowings. For more information refer Note 15.
Derecognition A financial liability is derecognised when the obligation under the liability is discharged or cancelled or expires. When an
existing financial liability is replaced by another from the same lender on substantially different terms, or the terms of an existing liability are substantially modified, such an exchange or modification is treated as the derecognition of the original liability and the recognition of a new liability. The difference in the respective carrying amounts is recognised in the statement of profit and loss.
Offsetting of financial instruments Financial assets and financial liabilities are offset and the net amount is reported in the standalone balance sheet if there
is a currently enforceable legal right to offset the recognised amounts and there is an intention to settle on a net basis, to realise the assets and settle the liabilities simultaneously.
t. Derivative financial instruments Initial recognition and subsequent measurement The Group uses derivative financial instruments, such as forward currency contracts, full currency swaps and interest
rate swaps, to hedge its foreign currency risks and interest rate risks, respectively. Such derivative financial instruments are initially recognised at fair value on the date on which a derivative contract is entered into and are subsequently re-measured at fair value. Derivatives are carried as financial assets when the fair value is positive and as financial liabilities when the fair value is negative. Fair value changes are recongnised in the statement of profit and loss.
u. Convertible preference shares Convertible preference shares are separated into liability and equity components based on the terms of the contract.
On issuance of the convertible preference shares, the fair value of the liability component is determined using a market interest rate for an equivalent non-convertible instrument. This amount is classified as a financial liability measured at amortised cost (net of transaction costs) until it is extinguished on conversion or redemption.
The remainder of the proceeds are allocated to the conversion option that is recognised and included in equity if the conversion option meets Ind AS 32 criteria for fixed to fixed classification. Transaction costs are deducted from equity, net of associated income tax. The carrying amount of the conversion option is not remeasured in subsequent years.
Transaction costs are apportioned between the liability and equity components of the convertible preference shares based on the allocation of proceeds to the liability and equity components when the instruments are initially recognised.
v. Cash and cash equivalents Cash and cash equivalents in the balance sheet comprise cash at banks and on hand and short-term deposits with an
original maturity of three months or less, which are subject to an insignificant risk of changes in value.
For the purpose of the consolidated statement of cash flows, cash and cash equivalents consist of cash and short-term deposits, as defined above, net of outstanding bank overdrafts as they are considered an integral part of the Group’s cash management.
w. Cash dividend The Group recognises a liability to make cash distributions to equity holders of the parent when the distribution
is authorised and the distribution is no longer at the discretion of the Group. As per the corporate laws in India, a distribution is authorised when it is approved by the shareholders. A corresponding amount is recognised directly in equity.
x. Government grants “Government grants are recognised where there is reasonable assurance that the grant will be received and all attached
conditions will be complied with. When the grant relates to an expense item, it is recognised as income on a systematic
Notes to Consolidated Financial Statements for the year ended March 31, 2019

Annual Report 2018-19 | 237
UPL Limited
basis over the periods that the related costs, for which it is intended to compensate, are expensed. When the grant relates to an asset, it is recognised as income in equal amounts over the expected useful life of the related asset.
y. Earnings Per Share: Basic earnings per share are calculated by dividing the net profit or loss for the period attributable to equity shareholders
by the weighted average number of equity shares outstanding during the period.
For the purpose of calculating diluted earnings per share, the net profit or loss for the period attributable to equity shareholders and the weighted average number of shares outstanding during the period are adjusted for the effects of all dilutive potential equity shares.
z. Segment Reporting: Based on “Management Approach” as defined in Ind AS 108-Operating Segments, the Chief Operating Decision Maker
evaluates the Group’s performance and allocates the resources based on an analysis of various performance indicators by business segments. Inter segment sales and transfers are reflected at market prices.
Unallocable items includes general corporate income and expense items which are not allocated to any business segment.
The Group prepares its segment information in conformity with the accounting policies adopted for preparing and presenting the financial statements of the Group as a whole. Common allocable costs are allocated to each segment on an appropriate basis.
aa. Contingent Liability and Contingent Asset: A contingent liability is a possible obligation that arises from past events whose existence will be confirmed by the
occurrence or non-occurrence of one or more uncertain future events beyond the control of the Group or a present obligation that is not recognized because it is not probable that an outflow of resources will be required to settle the obligation. A contingent liability also arises in extremely rare cases where there is a liability that cannot be recognized because it cannot be measured reliably. The Group does not recognize a contingent liability but discloses its existence in the consolidated financial statements.
ab. Biological Assets: Sinagro Produtos Agropecua’rios S.A. and 3SB Produtos Agricolas S.A. Biological assets of the group consists of harvest of soybean, corn, cotton and beans. Such biological assets are
recognised at fair value, less cost to sell, when the Group controls the asset as a result of past events, it is probable that future economic benefits associated with the asset will flow to the enterprise, and the fair value or cost of the asset can be measured reliably. Any changes to fair value are recognised in the statement of profit and loss.
ac. Recent accounting pronouncements Standards issued but not yet effective Ministry of Corporate Affairs (“MCA”) through Companies (Indian Accounting Standards) Amendment Rules, 2019 has
notified the following new Ind AS which the Group has not applied as they are effective for annual periods beginning on or after April 1, 2019:
IND AS 116-Leases : The new standard on leases sets out the principles for the recognition, measurement, presentation and disclosure of
the leases. The core objective of this standard is to ensure that lessees and lessors provide relevant information in a manner that faithfully represent those transactions.
The Group is required to adopt Ind AS 116, Leases from 1 April 2019. Ind AS 116 introduces a single, onbalance sheet lease accounting model for lessees. A lessee recognises a right-of-use asset representing its right to use the underlying asset and a lease liability representing its obligation to make lease payments. There are recognition exemptions for short-term leases and leases of low-value items. Lessor accounting remains similar to the current standard – i.e. lessors continue to classify leases as finance or operating leases. It replaces existing leases guidance, Ind AS 17, Leases.
The Group has completed an initial assessment of the potential impact on its consolidated financial statements but has not yet completed its detailed assessment. The quantitative impact of adoption of Ind AS 116 on the consolidated financial statements in the period of initial application is not reasonably estimable as at present.
- the total assets and liabilities on the balance sheet will increase with a decrease in net total assets, due to the depreciation of right of use assets being on a straightline basis whilst the lease liability reduces by the principal amount of repayments;
Notes to Consolidated Financial Statements for the year ended March 31, 2019

238 | Annual Report 2018-19
UPL Limited
Notes to Consolidated Financial Statements for the year ended March 31, 2019
- Interest expense will increase due to the unwinding of the effective interest rate implicit in the lease liability. Interest expense will be greater earlier in a lease’s life, due to the higher principal value, causing profit variability over the term of lease. This effect may be partially mitigated due to the number of leases held by the Group at various stages of their terms; and
- operating cash flows will be higher and financing cash flows will be lower, as repayment of the principal portion of all lease liabilities will be classified as financing activities.
The Group plans to apply Ind AS 116 initially on 1 April 2019, using the modified retrospective approach. Therefore, the cumulative effect of adopting Ind AS 116 will be recognised as an adjustment to the opening balance of retained earnings at 1 April 2019, with no restatement of comparative information.
The Group plans to apply the practical expedient to grandfather the definition of a lease on transition. This means that it will apply Ind AS 116 to all contracts entered into before 1 April 2019 and identified as leases in accordance with Ind AS 17.
In addition to the above, the following amendments to existing standards have been issued, are not yet effective and are not expected to have a significant impact on the Group’s consolidated financial statements:
- Amendments to Ind AS 103, Business Combinations, and Ind AS 111, Joint Arrangements: This interpretation clarifies how an entity accounts for increasing its interest in a joint operation that meets the definition of a business.
- Amendments to Ind AS 109, Financial Instruments: amendments relating to the classification of particular pre payable financial assets.
- Amendments to Ind AS 12, Income Taxes, clarify that all income tax consequences of dividends (including payments on financial instruments classified as equity) are recognized consistently with the transactions that generated the distributable profits – i.e. in profit or loss, other comprehensive income or equity. Further Appendix C, uncertainty over income tax treatments has been added to clarify how entities should reflect uncertainties over income tax treatments, in particular when assessing the outcome a tax authority might reach with full knowledge and information if it were to make an examination.
- Amendment to Ind AS 19, Employee Benefits – The amendment to Ind AS 19 clarifies that on amendment, curtailment or settlement of a defined benefit plan, the current service cost and net interest for the remainder of the annual reporting period are calculated using updated actuarial assumptions – i.e. consistent with the calculation of a gain or loss on the plan amendment, curtailment or settlement. This amendment also clarifies that an entity first determines any past service cost, or a gain or loss on settlement, without considering the effect of the asset ceiling. This amount is recognized in profit or loss. The entity then determines the effect of the asset ceiling after plan amendment, curtailment or settlement. Any change in that effect is recognized in other comprehensive income (except for amounts included in net interest).
- Amendments to Ind AS 23, Borrowing Costs, clarify that the general borrowings pool used to calculate eligible borrowing costs excludes only borrowings that specifically finance qualifying assets that are still under development or construction.
Impact on adoption of above changes in standards is not material.
2.4 Changes in accounting policiesa The Company applied Ind AS 115 for the first time. The nature and effect of the changes as a result of adoption of the
new accounting standard are described below.
b Several other amendments and interpretations apply for the first time in April 1, 2018, but do not have an impact on the financial statements of the Company. The Company has not early adopted any standards, interpretations or amendments that have been issued but are not yet effective.
c The Company adopted Ind AS 115 as per the modified retrospective approach, which requires the cumulative effect on adoption of Ind AS 115 to retained earnings at April 1, 2018. The adoption of Ind AS 115 did not have any impact on the financial statements of the Company as at and for the year ended March 31, 2019.

Annual Report 2018-19 | 239
UPL Limited
3.P
rope
rty,plantand
equ
ipmen
tand
Cap
italw
ork-in-progress
H In
cro
res
Land
- Fr
eeho
ldLa
nd -
Leas
ehol
dBu
ildin
gBu
ildin
g Le
aseh
old
Plan
t and
Eq
uipm
ent
Labo
rato
ry
Equi
pmen
tFu
rnitu
re,
Fixt
ures
an
d Eq
uipm
ent
Offi
ce
Equi
pmen
tVe
hicl
esAs
sets
Tak
en o
n Le
ase
Land
Im
prov
e-m
ents
Build
ing
Impr
ove-
men
ts
Airc
raft
Capi
tal
Wor
k-in
- Pr
ogre
ss
Tota
lFu
rnitu
re,
Fixt
ures
an
d Eq
uipm
ents
Vehi
cles
Cost
or v
alua
tion
At 1
Apr
il 20
1722
716
247
123
3,51
161
9579
112
22
1589
7363
35,
555
Addi
tions
dur
ing
the
year
--
80-
563
1210
2623
--
-2
199
11,
708
Disp
osal
s du
ring
the
year
--
(1)
-(7
3)-
(2)
(3)
(12)
-(1
)-
--
-(9
2)Tr
ansf
ers/
Capi
talis
ed-
-(5
41)
(541
)Re
class
ifica
tion
--
3-
(31)
8(6
)15
(2)
--
-(2
)-
-(1
5)Ex
chan
ge d
iffer
ence
s-
119
411
95
-2
(1)
--
31
-7
160
At 3
1 M
arch
201
822
716
357
227
4,08
986
9711
912
02
118
9074
1,09
06,
775
Addi
tions
dur
ing
the
year
31
250
21,
018
1022
2131
-(0
)-
3-
1,15
52,
515
Acqu
isitio
n du
ring
the
year
(N
ote
40)
4013
272
8-
1,10
7-
101
-10
2-
--
--
802,
290
Disp
osal
s du
ring
the
year
(0)
(2)
(1)
-(8
8)(1
)(4
)(5
)(1
0)(1
)-
-(0
)-
-(1
13)
Tran
sfer
s/Ca
pita
lised
--
--
--
--
--
--
--
(1,2
19)
(1,2
19)
Recla
ssifi
catio
n-
0(0
)-
2-
(1)
-(1
)-
--
--
4444
Exch
ange
diff
eren
ces
2(9
)(3
2)(1
)(8
1)0
(5)
(1)
(8)
(0)
(0)
(1)
15
16(1
14)
At 3
1 M
arch
201
927
228
41,
516
286,
046
9521
013
423
42
117
9379
1,16
610
,177
Dep
reci
atio
nAt
1 A
pril
2017
-1
201
171,
942
2563
5859
-1
1439
19-
2,43
9De
prec
iatio
n ch
arge
for t
he
year
(Not
e 25
)-
-16
226
26
913
19-
--
610
343
Disp
osal
s du
ring
the
year
--
(1)
(2)
(64)
-(2
)(2
)(9
)-
--
--
-(8
0)Re
class
ifica
tion
--
(1)
-(2
2)5
(9)
11(2
)-
--
--
-(1
8)Ex
chan
ge d
iffer
ence
s-
-17
496
31
2-
2-
3-
(1)
-12
7At
31
Mar
ch 2
018
-1
232
212,
214
3962
8267
21
1745
28-
2,81
1De
prec
iatio
n ch
arge
for t
he
year
(Not
e 25
)-
127
133
57
1217
240
00
710
-44
1
Depr
ecia
tion
char
ge o
n ac
quire
d as
sets
(Not
e 40
)-
3839
1-
730
-67
-54
--
--
--
1,28
1
Disp
osal
s du
ring
the
year
-(0
)(1
)-
(71)
(1)
(3)
(5)
(8)
(0)
--
(0)
--
(89)
Recla
ssifi
catio
n-
--
-(1
)-
1-
(1)
--
--
--
(1)
Exch
ange
diff
eren
ces
-(2
)(2
2)(1
)(5
5)(0
)(3
)(0
)(4
)(0
)(0
)(1
)0
2-
(86)
At 3
1 M
arch
201
9-
3862
722
3,15
245
136
9413
22
117
5240
-4,
357
Net
boo
k va
lue
At 3
1 M
arch
201
927
224
688
96
2,89
450
7441
102
(0)
(0)
(0)
4239
1,16
65,
820
At 3
1 M
arch
201
822
716
234
06
1,87
547
3537
530
-1
4546
1,09
03,
964
Net
boo
k va
lue
H In
cro
res
As a
t Mar
ch 3
1, 2
019
As a
t Mar
ch 3
1, 2
018
Plan
t, pr
oper
ty a
nd e
quip
men
t 4
,654
2
,874
Ca
pita
l wor
k-in
-pro
gres
s 1
,166
1
,090
To
tal
5,8
20
3,9
64
Capi
tal W
ork
in P
rogr
ess
Capi
tal w
ork-
in-p
rogr
ess
as a
t 31
Mar
ch 2
019
com
prise
s ex
pend
iture
for t
he p
lant
and
bui
ldin
g in
the
cour
se o
f con
stru
ctio
n.Se
curit
yFo
r pro
pert
y, pl
ant a
nd e
quip
men
t give
n as
sec
urity
(Ref
er N
ote
15)
Not
es to
Con
solid
ated
Fin
ancia
l Sta
tem
ents
for th
e ye
ar e
nded
Mar
ch 3
1, 2
019

240 | Annual Report 2018-19
UPL Limited
4. I
ntan
gibl
e as
sets
H In
cro
res
Goo
dwill
*O
ther
Inta
ngib
le A
sset
sIn
tang
ible
as
set u
nder
de
velo
pmen
t
Tota
l (E
xcl.
Goo
dwill
)D
ata
Acce
ss F
ees
Prod
uct
Regi
stra
tions
Prod
uct
Acqu
isiti
ons
Task
For
ce
Expe
nses
Softw
are/
Li
cens
e Fe
esCu
stom
er
Cont
ract
sBr
ands
/ Tr
ade
Mar
ksN
on-c
ompe
te
agre
emen
tsTr
ade
Secr
ets
Righ
t to
Use
Ger
mpl
asm
Cost
At 1
Apr
il 20
1741
911
62,
709
742
2262
436
301
2218
-25
615
94,
843
Addi
tions
dur
ing
the
year
-1
239
--
8-
--
-3
-18
743
8De
duct
ions
dur
ing
the
year
--
(18)
--
--
--
--
--
(18)
Tran
sfer
/Cap
italis
ed-
--
--
--
--
--
-(1
12)
(112
)Re
class
ifica
tion
--
20-
-(2
)-
(19)
--
-9
--
Fore
ign
Exch
ange
Ad
just
men
t13
(7)
180
5-
4(4
)-
--
--
(5)
173
At 3
1 M
arch
201
843
211
03,
130
747
2272
432
282
2218
326
522
95,
324
Acqu
isitio
ns d
urin
g th
e ye
ar (N
ote
40)
15,0
35-
12,1
32-
-30
52,
811
409
346
--
-35
616
,359
Addi
tions
dur
ing
the
year
--
151
0-
12-
2-
--
-16
432
8De
duct
ions
dur
ing
the
year
(1)
-(8
2)-
-(2
)-
--
--
--
(84)
Tran
sfer
/Cap
italis
ed-
--
--
--
--
--
-(6
3)(6
3)Re
class
ifica
tion
--
(5)
--
(0)
-5
--
--
(44)
(44)
Fore
ign
Exch
ange
Ad
just
men
t(4
16)
-(2
91)
5-
(15)
(30)
1(3
)1
(0)
4(2
5)(3
52)
At 3
1 M
arch
201
915
,050
110
15,0
3575
222
372
3,21
469
836
519
326
961
721
,468
Amor
tisat
ion
At 1
Apr
il 20
17-
115
2,07
130
014
4942
828
122
13-
222
-3,
515
Amor
tisat
ion
for t
he ye
ar
(Not
e 25
)-
124
350
35
64
3-
10-
325
Amor
tisat
ion
on d
ispos
als
--
(13)
--
--
--
--
--
(13)
Recla
ssifi
catio
n-
(7)
14(7
)-
(2)
--
--
-21
-19
Fore
ign
Exch
ange
Ad
just
men
t-
(1)
142
2(1
)5
(3)
(19)
-1
--
-12
6
At 3
1 M
arch
201
8-
108
2,45
734
516
5743
126
622
17-
253
-3,
972
Amor
tisat
ion
on a
cqui
red
inta
ngib
les (
Not
e 40
)-
3,80
9-
-26
428
035
96-
--
-4,
483
Amor
tisat
ion
for t
he ye
ar
(Not
e 25
)-
139
549
310
306
81
15
-50
8
Amor
tisat
ion
on d
ispos
als
--
(79)
--
(2)
--
(0)
--
--
(81)
Recla
ssifi
catio
n-
-(4
)-
-0
(0)
5(0
)-
--
-1
Fore
ign
Exch
ange
Ad
just
men
t-
-(1
90)
(0)
-(1
2)(2
1)0
(2)
1(0
)4
-(2
21)
At 3
1 M
arch
201
9-
109
6,38
839
419
317
719
311
124
191
262
-8,
662
Net
boo
k va
lue
At 3
1 M
arch
201
915
,050
18,
647
358
356
2,49
538
724
1(0
)2
761
712
,814
At 3
1 M
arch
201
843
22
673
402
615
116
-1
312
229
1,36
0
Not
es to
Con
solid
ated
Fin
ancia
l Sta
tem
ents
for th
e ye
ar e
nded
Mar
ch 3
1, 2
019
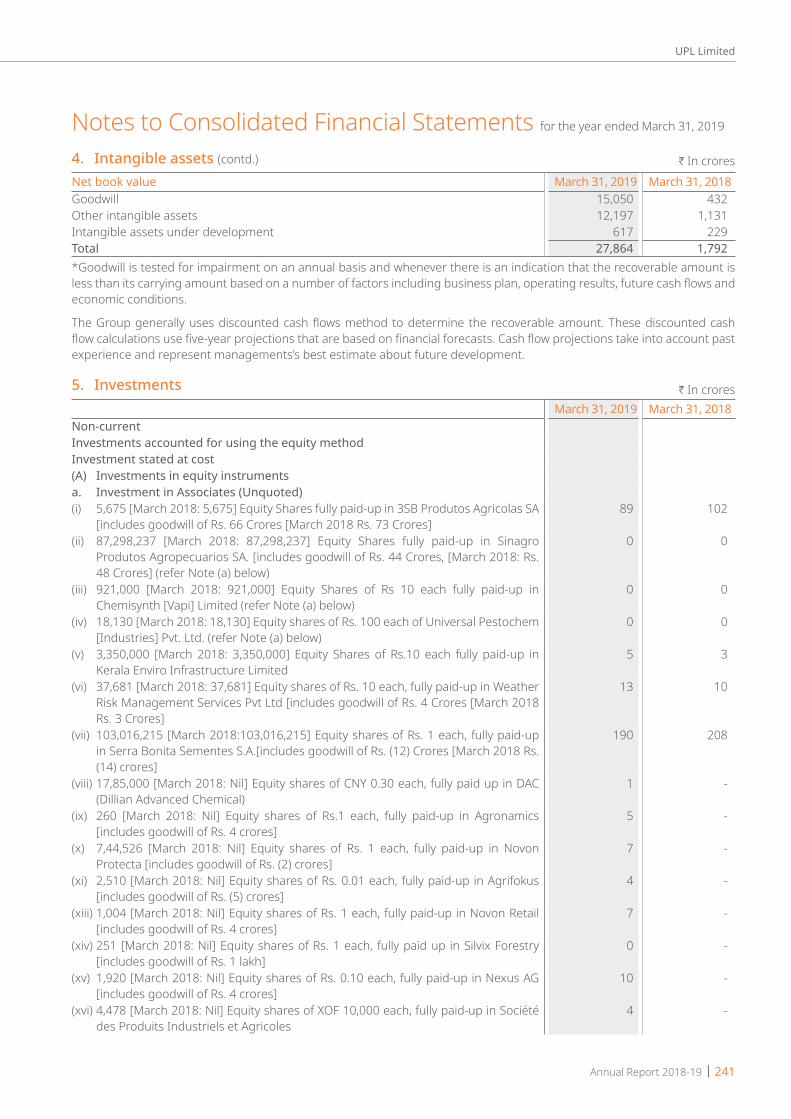
Annual Report 2018-19 | 241
UPL Limited
Net book value March 31, 2019 March 31, 2018Goodwill 15,050 432 Other intangible assets 12,197 1,131 Intangible assets under development 617 229 Total 27,864 1,792 *Goodwill is tested for impairment on an annual basis and whenever there is an indication that the recoverable amount is less than its carrying amount based on a number of factors including business plan, operating results, future cash flows and economic conditions.
The Group generally uses discounted cash flows method to determine the recoverable amount. These discounted cash flow calculations use five-year projections that are based on financial forecasts. Cash flow projections take into account past experience and represent managements’s best estimate about future development.
5. Investments H In croresMarch 31, 2019 March 31, 2018
Non-currentInvestments accounted for using the equity methodInvestment stated at cost(A) Investments in equity instrumentsa. Investment in Associates (Unquoted)(i) 5,675 [March 2018: 5,675] Equity Shares fully paid-up in 3SB Produtos Agricolas SA
[includes goodwill of Rs. 66 Crores [March 2018 Rs. 73 Crores]89 102
(ii) 87,298,237 [March 2018: 87,298,237] Equity Shares fully paid-up in Sinagro Produtos Agropecuarios SA. [includes goodwill of Rs. 44 Crores, [March 2018: Rs. 48 Crores] (refer Note (a) below)
0 0
(iii) 921,000 [March 2018: 921,000] Equity Shares of Rs 10 each fully paid-up in Chemisynth [Vapi] Limited (refer Note (a) below)
0 0
(iv) 18,130 [March 2018: 18,130] Equity shares of Rs. 100 each of Universal Pestochem [Industries] Pvt. Ltd. (refer Note (a) below)
0 0
(v) 3,350,000 [March 2018: 3,350,000] Equity Shares of Rs.10 each fully paid-up in Kerala Enviro Infrastructure Limited
5 3
(vi) 37,681 [March 2018: 37,681] Equity shares of Rs. 10 each, fully paid-up in Weather Risk Management Services Pvt Ltd [includes goodwill of Rs. 4 Crores [March 2018 Rs. 3 Crores]
13 10
(vii) 103,016,215 [March 2018:103,016,215] Equity shares of Rs. 1 each, fully paid-up in Serra Bonita Sementes S.A.[includes goodwill of Rs. (12) Crores [March 2018 Rs. (14) crores]
190 208
(viii) 17,85,000 [March 2018: Nil] Equity shares of CNY 0.30 each, fully paid up in DAC (Dillian Advanced Chemical)
1 -
(ix) 260 [March 2018: Nil] Equity shares of Rs.1 each, fully paid-up in Agronamics [includes goodwill of Rs. 4 crores]
5 -
(x) 7,44,526 [March 2018: Nil] Equity shares of Rs. 1 each, fully paid-up in Novon Protecta [includes goodwill of Rs. (2) crores]
7 -
(xi) 2,510 [March 2018: Nil] Equity shares of Rs. 0.01 each, fully paid-up in Agrifokus [includes goodwill of Rs. (5) crores]
4 -
(xiii) 1,004 [March 2018: Nil] Equity shares of Rs. 1 each, fully paid-up in Novon Retail [includes goodwill of Rs. 4 crores]
7 -
(xiv) 251 [March 2018: Nil] Equity shares of Rs. 1 each, fully paid up in Silvix Forestry [includes goodwill of Rs. 1 lakh]
0 -
(xv) 1,920 [March 2018: Nil] Equity shares of Rs. 0.10 each, fully paid-up in Nexus AG [includes goodwill of Rs. 4 crores]
10 -
(xvi) 4,478 [March 2018: Nil] Equity shares of XOF 10,000 each, fully paid-up in Société des Produits Industriels et Agricoles
4 -
H In crores
Notes to Consolidated Financial Statements for the year ended March 31, 2019
4. Intangible assets (contd.)
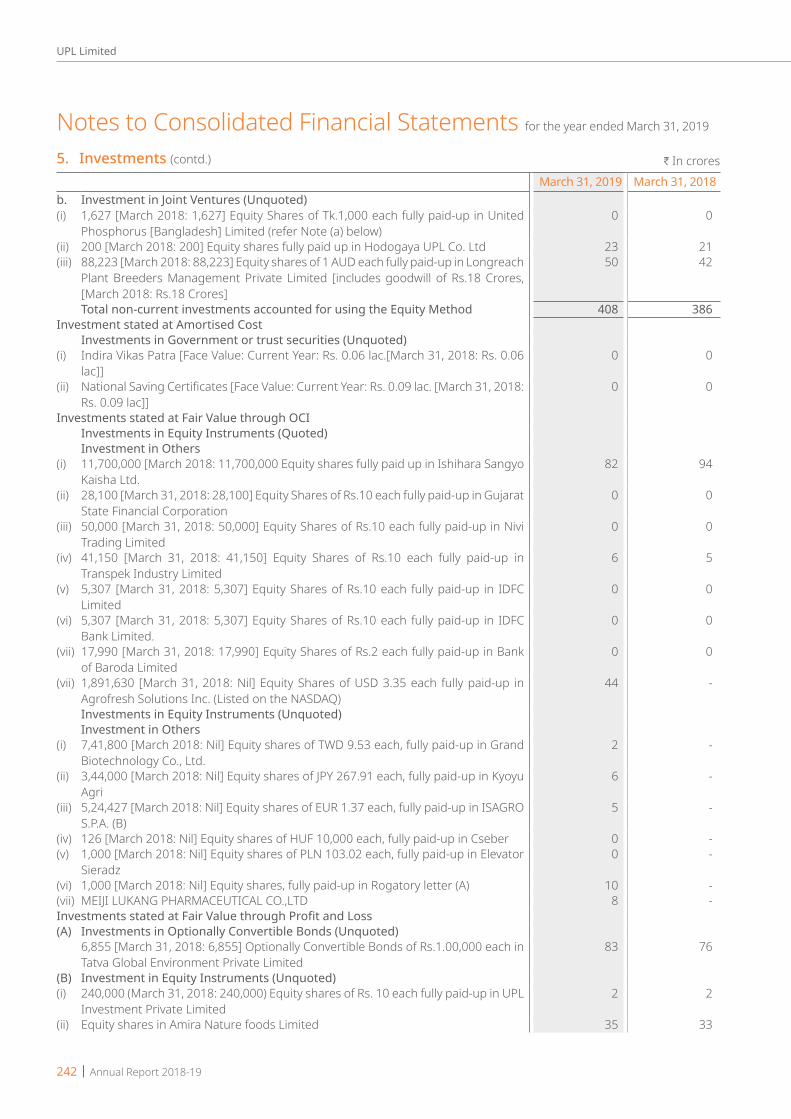
242 | Annual Report 2018-19
UPL Limited
March 31, 2019 March 31, 2018b. Investment in Joint Ventures (Unquoted)(i) 1,627 [March 2018: 1,627] Equity Shares of Tk.1,000 each fully paid-up in United
Phosphorus [Bangladesh] Limited (refer Note (a) below)0 0
(ii) 200 [March 2018: 200] Equity shares fully paid up in Hodogaya UPL Co. Ltd 23 21(iii) 88,223 [March 2018: 88,223] Equity shares of 1 AUD each fully paid-up in Longreach
Plant Breeders Management Private Limited [includes goodwill of Rs.18 Crores, [March 2018: Rs.18 Crores]
50 42
Total non-current investments accounted for using the Equity Method 408 386Investment stated at Amortised Cost
Investments in Government or trust securities (Unquoted)(i) Indira Vikas Patra [Face Value: Current Year: Rs. 0.06 lac.[March 31, 2018: Rs. 0.06
lac]]0 0
(ii) National Saving Certificates [Face Value: Current Year: Rs. 0.09 lac. [March 31, 2018: Rs. 0.09 lac]]
0 0
Investments stated at Fair Value through OCIInvestments in Equity Instruments (Quoted)Investment in Others
(i) 11,700,000 [March 2018: 11,700,000 Equity shares fully paid up in Ishihara Sangyo Kaisha Ltd.
82 94
(ii) 28,100 [March 31, 2018: 28,100] Equity Shares of Rs.10 each fully paid-up in Gujarat State Financial Corporation
0 0
(iii) 50,000 [March 31, 2018: 50,000] Equity Shares of Rs.10 each fully paid-up in Nivi Trading Limited
0 0
(iv) 41,150 [March 31, 2018: 41,150] Equity Shares of Rs.10 each fully paid-up in Transpek Industry Limited
6 5
(v) 5,307 [March 31, 2018: 5,307] Equity Shares of Rs.10 each fully paid-up in IDFC Limited
0 0
(vi) 5,307 [March 31, 2018: 5,307] Equity Shares of Rs.10 each fully paid-up in IDFC Bank Limited.
0 0
(vii) 17,990 [March 31, 2018: 17,990] Equity Shares of Rs.2 each fully paid-up in Bank of Baroda Limited
0 0
(vii) 1,891,630 [March 31, 2018: Nil] Equity Shares of USD 3.35 each fully paid-up in Agrofresh Solutions Inc. (Listed on the NASDAQ)
44 -
Investments in Equity Instruments (Unquoted)Investment in Others
(i) 7,41,800 [March 2018: Nil] Equity shares of TWD 9.53 each, fully paid-up in Grand Biotechnology Co., Ltd.
2 -
(ii) 3,44,000 [March 2018: Nil] Equity shares of JPY 267.91 each, fully paid-up in Kyoyu Agri
6 -
(iii) 5,24,427 [March 2018: Nil] Equity shares of EUR 1.37 each, fully paid-up in ISAGRO S.P.A. (B)
5 -
(iv) 126 [March 2018: Nil] Equity shares of HUF 10,000 each, fully paid-up in Cseber 0 -(v) 1,000 [March 2018: Nil] Equity shares of PLN 103.02 each, fully paid-up in Elevator
Sieradz0 -
(vi) 1,000 [March 2018: Nil] Equity shares, fully paid-up in Rogatory letter (A) 10 -(vii) MEIJI LUKANG PHARMACEUTICAL CO.,LTD 8 -Investments stated at Fair Value through Profit and Loss(A) Investments in Optionally Convertible Bonds (Unquoted)
6,855 [March 31, 2018: 6,855] Optionally Convertible Bonds of Rs.1.00,000 each in Tatva Global Environment Private Limited
83 76
(B) Investment in Equity Instruments (Unquoted)(i) 240,000 (March 31, 2018: 240,000) Equity shares of Rs. 10 each fully paid-up in UPL
Investment Private Limited2 2
(ii) Equity shares in Amira Nature foods Limited 35 33
H In crores
Notes to Consolidated Financial Statements for the year ended March 31, 2019
5. Investments (contd.)
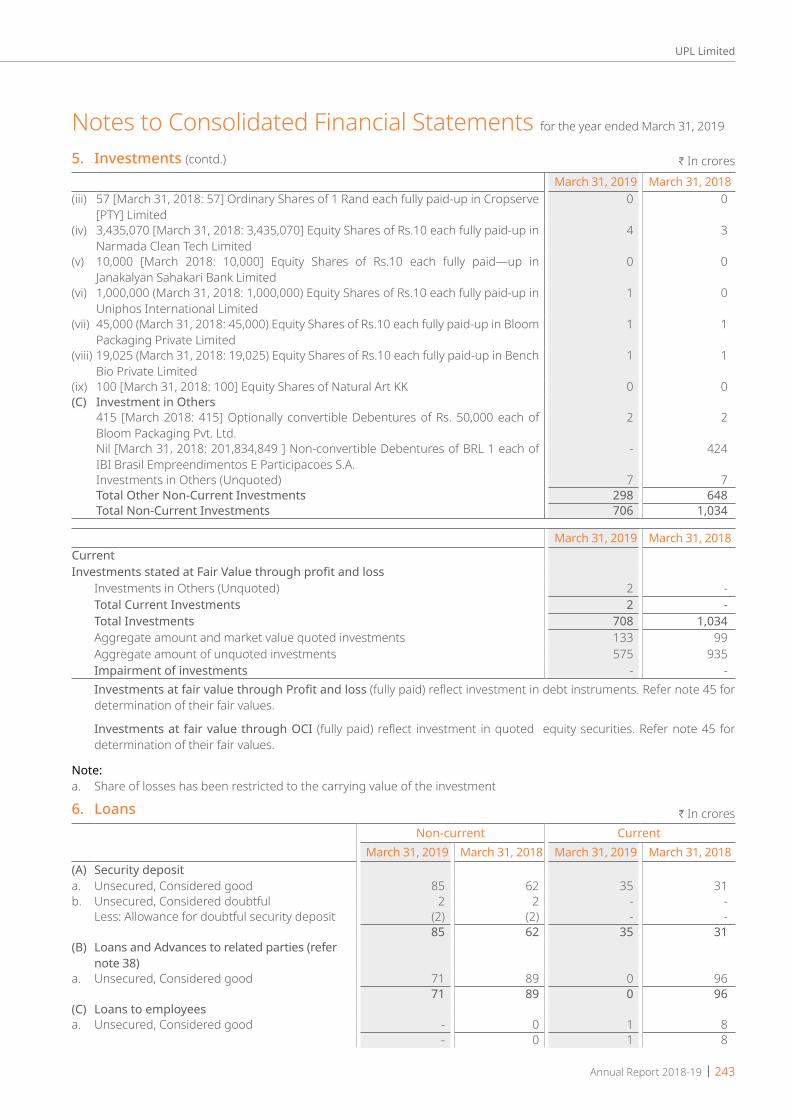
Annual Report 2018-19 | 243
UPL Limited
March 31, 2019 March 31, 2018(iii) 57 [March 31, 2018: 57] Ordinary Shares of 1 Rand each fully paid-up in Cropserve
[PTY] Limited0 0
(iv) 3,435,070 [March 31, 2018: 3,435,070] Equity Shares of Rs.10 each fully paid-up in Narmada Clean Tech Limited
4 3
(v) 10,000 [March 2018: 10,000] Equity Shares of Rs.10 each fully paid—up in Janakalyan Sahakari Bank Limited
0 0
(vi) 1,000,000 (March 31, 2018: 1,000,000) Equity Shares of Rs.10 each fully paid-up in Uniphos International Limited
1 0
(vii) 45,000 (March 31, 2018: 45,000) Equity Shares of Rs.10 each fully paid-up in Bloom Packaging Private Limited
1 1
(viii) 19,025 (March 31, 2018: 19,025) Equity Shares of Rs.10 each fully paid-up in Bench Bio Private Limited
1 1
(ix) 100 [March 31, 2018: 100] Equity Shares of Natural Art KK 0 0(C) Investment in Others
415 [March 2018: 415] Optionally convertible Debentures of Rs. 50,000 each of Bloom Packaging Pvt. Ltd.
2 2
Nil [March 31, 2018: 201,834,849 ] Non-convertible Debentures of BRL 1 each of IBI Brasil Empreendimentos E Participacoes S.A.
- 424
Investments in Others (Unquoted) 7 7Total Other Non-Current Investments 298 648Total Non-Current Investments 706 1,034
March 31, 2019 March 31, 2018CurrentInvestments stated at Fair Value through profit and loss Investments in Others (Unquoted) 2 - Total Current Investments 2 - Total Investments 708 1,034 Aggregate amount and market value quoted investments 133 99 Aggregate amount of unquoted investments 575 935 Impairment of investments - - Investments at fair value through Profit and loss (fully paid) reflect investment in debt instruments. Refer note 45 for
determination of their fair values.
Investments at fair value through OCI (fully paid) reflect investment in quoted equity securities. Refer note 45 for determination of their fair values.
Note:a. Share of losses has been restricted to the carrying value of the investment
6. Loans H In croresNon-current Current
March 31, 2019 March 31, 2018 March 31, 2019 March 31, 2018(A) Security deposita. Unsecured, Considered good 85 62 35 31 b. Unsecured, Considered doubtful 2 2 - -
Less: Allowance for doubtful security deposit (2) (2) - - 85 62 35 31
(B) Loans and Advances to related parties (refer note 38)
a. Unsecured, Considered good 71 89 0 96 71 89 0 96
(C) Loans to employeesa. Unsecured, Considered good - 0 1 8
- 0 1 8
Notes to Consolidated Financial Statements for the year ended March 31, 2019
H In crores5. Investments (contd.)

244 | Annual Report 2018-19
UPL Limited
Non-current CurrentMarch 31, 2019 March 31, 2018 March 31, 2019 March 31, 2018
(D) Sundry loansa. Unsecured, Considered good - - 15 12b. Unsecured, Considered doubtful 2 2 - -
Less: Allowance for doubtful sundry loans (2) (2) - - - - 15 12
Total loans 156 151 51 147
Loans and receivables are non-derivative financial assets which generate a fixed or variable interest income for the Group.
7. Otherfinancialassets H In croresNon-current Current
March 31, 2019 March 31, 2018 March 31, 2019 March 31, 2018(A) Interest receivablea. Unsecured, Considered good - - 10 49 b. Unsecured, Considered doubtful - - - 0
Less: Allowance for doubtful Interest receivable - - - (0) - - 10 49
(B) Derivative instruments at fair value through profit or lossDerivative contracts (net) - - 28 -
- - 28 - (C) Export Benefits receivables
Unsecured, Considered good 35 35 138 94 35 35 138 94
(D) Othersa. Unsecured, Considered good 132 - 134 24 b. Unsecured, Considered doubtful 2 2 - -
Less: Allowance for doubtful other financial assets (2) (2) - - 132 - 134 24
Total Other Financial Assets 167 35 310 167
8. Other assets H In croresNon-current Current
March 31, 2019 March 31, 2018 March 31, 2019 March 31, 2018(i) Capital advance 51 93 - - (ii) Statutory receivables 206 219 1,600 915 (iii) Other advances 24 7 584 260
Total Other Assets 281 319 2,184 1,175
9. Inventories (Valued at lower of cost and net realisable value) H In crores
March 31, 2019 March 31, 2018a. Raw materials and components 2,434 957b. Work in progress 550 372c. Finished goods 5,408 2,561d. Traded goods 690 478e. Store and spares [including fuel] 83 72f. Packing material 99 93g. By products 5 5Total inventories 9,270 4,538
Amount of write down of inventories to net realisable value and other provisions / losses recognised in the statement of profit and loss as an expense is Rs. 9 Crores (31 March 2018: Rs 23 Crores)
Notes to Consolidated Financial Statements for the year ended March 31, 2019
6. Loans (contd.)

Annual Report 2018-19 | 245
UPL Limited
10. Trade receivables H In croresNon-current Current
March 31, 2019 March 31, 2018 March 31, 2019 March 31, 2018Unsecured, Considered good - From related parties - - 141 220 - From others 4 1 11,671 5,836Unsecured, Considered doubtful - From others - - 1,063 366Less: Allowance for doubtful Trade receivables - - (1,063) (366)Total Trade receivables 4 1 11,812 6,056
No trade or other receivable are due from directors or other officers of the company either severally or jointly with any other person. There are no trade or other receivable are due from firms or private companies respectively in which any director is a partner, a director or a member.
Trade receivables are non-interest bearing and are generally on terms of 45 to 270 days.
For explanations on Group’s Credit risk management process. (Refer note 47)
The Group has entered into an agreement to sell and assign its receivables on a non recourse basis with various banks. This is treated as a “true sale” for both legal and financial reporting purposes. As such, the assets once transferred are not reflected on the balance sheet date. At 31st March, 2019, the Group sold receivables which have been recognised of Rs. 4925 Crores (Rs. 2,051 Crores at 31st March, 2018).
11. Cash and cash equivalents H In croresMarch 31, 2019 March 31, 2018
Balances with banks - Current accounts 198 141 - Foreign currency accounts 0 2 - Current accounts outside India 2,001 1,519Fixed deposit accounts - Fixed deposits outside India 603 1,164Cheques/drafts on hand 24 32Cash on hand 1 1
2,826 2,859
11A. Other bank balances H In croresMarch 31, 2019 March 31, 2018
- Deposits with original maturity for more than 3 months but less than 12 months 2 14 - Margin money deposit * 14 14 - Unclaimed dividend accounts 8 7
25 35
* Margin money deposits given as security against bank guarantees.
For the purpose of the consolidated statement of cash flows, cash and cash equivalents comprise the following: H In croresMarch 31, 2019 March 31, 2018
Balances with banks: - Current accounts 198 141 - Foreign currency accounts 0 2 - Current accounts outside India 2,001 1,519 Fixed deposit accounts 603 1,164 Cheques/drafts on hand 24 32 Cash on hand 1 1
2,826 2,859
Notes to Consolidated Financial Statements for the year ended March 31, 2019

246 | Annual Report 2018-19
UPL Limited
12. Share CapitalAuthorised share capital
Equity shares of INR 2 eachNos. H In crores
As at April1, 2017 1,23,75,00,000 248Increase/(decrease) during the year - -At March 31, 2018 1,23,75,00,000 248Increase/(decrease) during the year - -At March 31, 2019 1,23,75,00,000 248
Issued equity capitalEquity shares of Rs. 2 each issued, subscribed and fully paid
Nos. H In croresAt April 1, 2017 50,70,17,118 101Increase during the year due to :Conversion of OCPS & CCPS 22,24,287 1ESOP allotments 91,676 0At March 31, 2018 50,93,33,081 102Increase during the year 9,589 0At March 31, 2019 50,93,42,670 102
Terms/ rights attached to equity sharesThe Company has one class of equity shares having par value of Rs. 2 per share. Each holder of equity shares is entitled to one vote per share. The Company declares and pays dividends in Indian rupees. The dividend proposed by the Board of Directors is subject to the approval of the shareholders in the ensuing Annual General Meeting.
In the event of liquidation of the Company, the holders of equity shares will be entitled to receive the remaining assets of the Company, after distribution of all preferential amounts. The distribution will be in proportion to the number of equity shares held by the shareholders.
During the year ended March, 2019, the amount of per share dividend proposed as distributions to equity shareholders is Rs. 8 (March, 2018: Rs. 8)
The Board has recommended issue of bonus shares in the ratio 1:2 (one bonus equity share of Rs. 2 each for every two fully paid-up equity shares held), subject to the approval of the shareholders of the company.
Details of shareholders holding more than 5% shares in the companyName of the shareholder
Equity shares of INR 2 each fully paid March 31, 2019 March 31, 2018No. in crores % holding
in the classNo. in crores % holding
in the classNerka Chemicals Private Limited 10 19.94% 10 19.94%Uniphos Enterprises Limited 3 5.01% 3 5.01%
As per records of the Company, including its register of shareholders/ members and other declarations received from shareholders regarding beneficial interest, the above shareholding represents both legal and beneficial ownerships of shares.
There are 42,353,062 shares (March 31, 2018: 42,353,062) underlying equity shares of the Company in respect of GDR’s traded on Luxemburg Stock Exchange and against conversion of each GDR ten equity shares were issued.
Notes to Consolidated Financial Statements for the year ended March 31, 2019
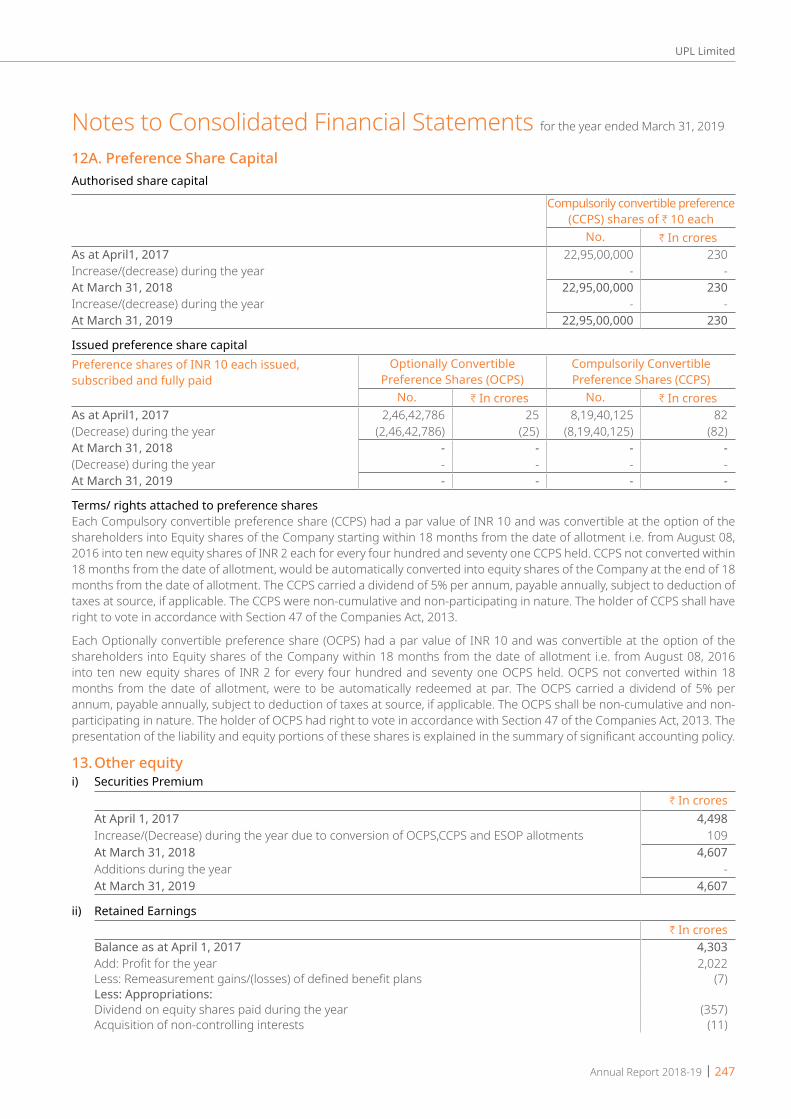
Annual Report 2018-19 | 247
UPL Limited
12A. Preference Share CapitalAuthorised share capital
Compulsorily convertible preference (CCPS) shares of H 10 each
No. H In croresAs at April1, 2017 22,95,00,000 230Increase/(decrease) during the year - -At March 31, 2018 22,95,00,000 230Increase/(decrease) during the year - -At March 31, 2019 22,95,00,000 230
Issued preference share capitalPreference shares of INR 10 each issued, subscribed and fully paid
Optionally Convertible Preference Shares (OCPS)
Compulsorily Convertible Preference Shares (CCPS)
No. H In crores No. H In croresAs at April1, 2017 2,46,42,786 25 8,19,40,125 82 (Decrease) during the year (2,46,42,786) (25) (8,19,40,125) (82)At March 31, 2018 - - - - (Decrease) during the year - - - - At March 31, 2019 - - - -
Terms/ rights attached to preference sharesEach Compulsory convertible preference share (CCPS) had a par value of INR 10 and was convertible at the option of the shareholders into Equity shares of the Company starting within 18 months from the date of allotment i.e. from August 08, 2016 into ten new equity shares of INR 2 each for every four hundred and seventy one CCPS held. CCPS not converted within 18 months from the date of allotment, would be automatically converted into equity shares of the Company at the end of 18 months from the date of allotment. The CCPS carried a dividend of 5% per annum, payable annually, subject to deduction of taxes at source, if applicable. The CCPS were non-cumulative and non-participating in nature. The holder of CCPS shall have right to vote in accordance with Section 47 of the Companies Act, 2013.
Each Optionally convertible preference share (OCPS) had a par value of INR 10 and was convertible at the option of the shareholders into Equity shares of the Company within 18 months from the date of allotment i.e. from August 08, 2016 into ten new equity shares of INR 2 for every four hundred and seventy one OCPS held. OCPS not converted within 18 months from the date of allotment, were to be automatically redeemed at par. The OCPS carried a dividend of 5% per annum, payable annually, subject to deduction of taxes at source, if applicable. The OCPS shall be non-cumulative and non-participating in nature. The holder of OCPS had right to vote in accordance with Section 47 of the Companies Act, 2013. The presentation of the liability and equity portions of these shares is explained in the summary of significant accounting policy.
13. Other equityi) Securities Premium
H In croresAt April 1, 2017 4,498 Increase/(Decrease) during the year due to conversion of OCPS,CCPS and ESOP allotments 109 At March 31, 2018 4,607 Additions during the year - At March 31, 2019 4,607
ii) Retained EarningsH In crores
Balance as at April 1, 2017 4,303 Add: Profit for the year 2,022 Less: Remeasurement gains/(losses) of defined benefit plans (7)Less: Appropriations:Dividend on equity shares paid during the year (357)Acquisition of non-controlling interests (11)
Notes to Consolidated Financial Statements for the year ended March 31, 2019

248 | Annual Report 2018-19
UPL Limited
H In croresTransfer to debenture redemption reserve, capital redemption reserve and share based payments reserve
(23)
Total appropriations (391)At March 31, 2018 5,927 Add: Profit for the year 1,447 Less: Remeasurement gains/(losses) of defined benefit plans 3 Less: Appropriations:Dividend on equity shares paid during the year (407)Transfer to debenture redemption reserve, capital redemption reserve and share based payments reserve
1
TPG ADIA share capital 5,335 Total appropriations 4,928 At March 31, 2019 12,306
iii) Other Reserves Capital Redemption Reserve
H In croresAt April 1, 2017 36 Increase/(Decrease) during the year due to conversion of OCPS and CCPS 9 At March 31, 2018 45 Changes during the year - At March 31, 2019 45
Capital ReserveH In crores
As at April1, 2017 171 Changes during the year 22 At March 31, 2018 193 Changes during the year (16)At March 31, 2019 177
Debenture Redemption ReserveH In crores
As at April1, 2017 127 Add: Amount transferred from retained earnings 14 At March 31, 2018 141 Less: Amount transferred to retained earnings (1)At March 31, 2019 140
General ReserveH In crores
As at April1, 2017 1,848 Changes during the year - At March 31, 2018 1,848 Changes during the year - At March 31, 2019 1,848
Share based payment reserveH In crores
As at April1, 2017 2 Changes during the year (2)At March 31, 2018 -Changes during the year - At March 31, 2019 0
Notes to Consolidated Financial Statements for the year ended March 31, 2019
13. Other equity (contd.)

Annual Report 2018-19 | 249
UPL Limited
Non-controlling interest reserve INR Crores
As at April1, 2017 (3,693)Changes during the year - At March 31, 2018 (3,693)Changes during the year - At March 31, 2019 (3,693)
Cashflow hedge reserve for OCI INR Crores
As at April1, 2017 - Changes during the year - At March 31, 2018 - Changes during the year (62)At March 31, 2019 (62)
FVTOCI reserve INR Crores
As at April1, 2017 (54)Changes during the year 10 At March 31, 2018 (44)Changes during the year (60)At March 31, 2019 (104)
Foreign currency translation reserve INR Crores
As at April1, 2017 (24)Changes during the year 67 At March 31, 2018 43 Changes during the year (763)At March 31, 2019 (720)
Securities Premium - Where the Holding Company issues shares at a premium, whether for cash or otherwise, a sum equal to the aggregate amount of the premium received on those shares shall be transferred to “Securities Premium ”. The Holding Company may issue fully paid-up bonus shares to its members out of the securities premium reserve and can use this reserve for buy-back of shares.
Capital redemption reserve - Capital redemption reserve was created for buy-back of shares and can be utilised for issuance of fully paid up bonus shares.
Capital reserve - The Group recognises profit or loss on purchase, sale, issue or cancellation of the Group’s own equity instruments to capital reserve.
Debenture redemption reserve (DRR) - The Holding Company has issued redeemable non-convertible debentures. The Companies (Share capital and Debentures) Rules, 2014 (as amended), require the Company to create DRR out of profits of the Company available for payment of dividend. DRR is required to be created for an amount which is equal to 25% of the value of debentures issued.
Share based payment reserve - The Holding Company has an employee stock option scheme under which the option to subscribe for the companies share have been granted to the key employees and directors. The share-based payment reserve is used to recognize the value of equity-settled share-based payments provided to the key employees and directors as part of their remuneration. Refer to Note 36 for further details of the scheme.
General reserve - General reserve is created out of the profits earned by the Holding Company by way of transfer from surplus in the statement of profit and loss. The Holding Company can use this reserve for payment of dividend and issue of fully paid-up and not paid-up bonus shares.
Notes to Consolidated Financial Statements for the year ended March 31, 2019
13. Other equity (contd.)
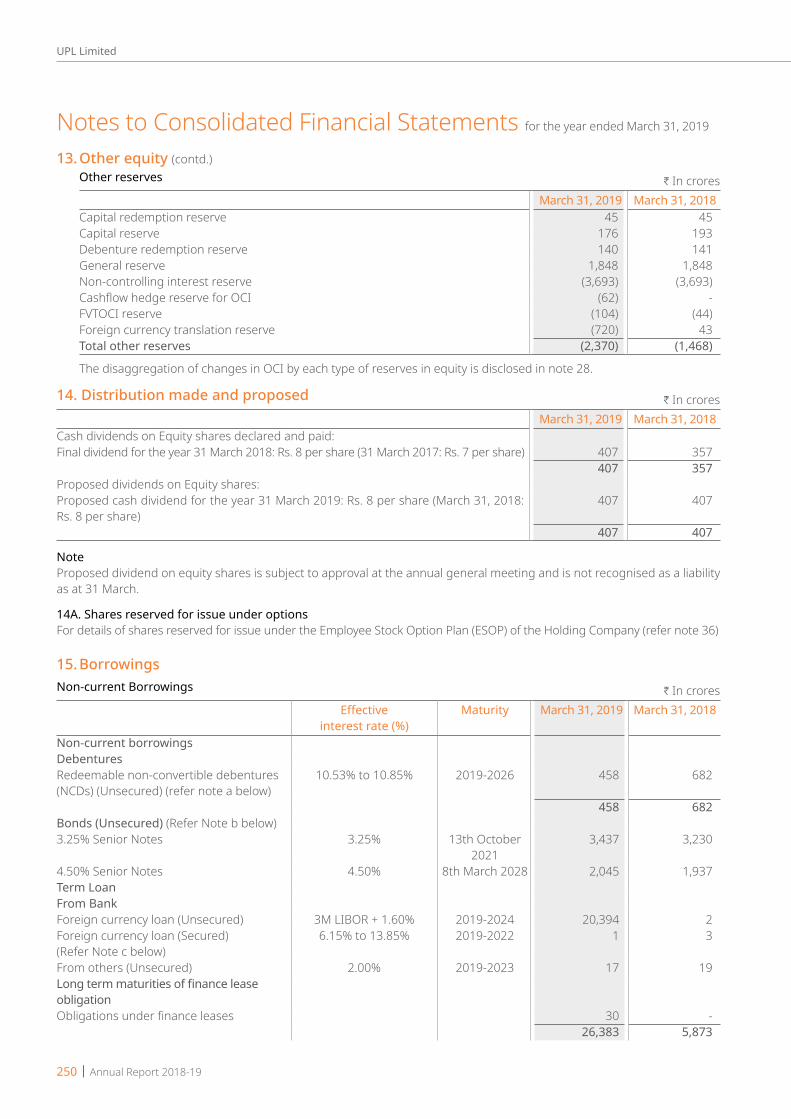
250 | Annual Report 2018-19
UPL Limited
Other reserves H In croresMarch 31, 2019 March 31, 2018
Capital redemption reserve 45 45 Capital reserve 176 193 Debenture redemption reserve 140 141 General reserve 1,848 1,848 Non-controlling interest reserve (3,693) (3,693)Cashflow hedge reserve for OCI (62) - FVTOCI reserve (104) (44)Foreign currency translation reserve (720) 43 Total other reserves (2,370) (1,468)
The disaggregation of changes in OCI by each type of reserves in equity is disclosed in note 28.
14. Distribution made and proposed H In croresMarch 31, 2019 March 31, 2018
Cash dividends on Equity shares declared and paid:Final dividend for the year 31 March 2018: Rs. 8 per share (31 March 2017: Rs. 7 per share) 407 357
407 357Proposed dividends on Equity shares:Proposed cash dividend for the year 31 March 2019: Rs. 8 per share (March 31, 2018: Rs. 8 per share)
407 407
407 407
NoteProposed dividend on equity shares is subject to approval at the annual general meeting and is not recognised as a liability as at 31 March.
14A. Shares reserved for issue under optionsFor details of shares reserved for issue under the Employee Stock Option Plan (ESOP) of the Holding Company (refer note 36)
15. BorrowingsNon-current Borrowings H In crores
Effective interest rate (%)
Maturity March 31, 2019 March 31, 2018
Non-current borrowingsDebenturesRedeemable non-convertible debentures (NCDs) (Unsecured) (refer note a below)
10.53% to 10.85% 2019-2026 458 682
458 682Bonds (Unsecured) (Refer Note b below)3.25% Senior Notes 3.25% 13th October
20213,437 3,230
4.50% Senior Notes 4.50% 8th March 2028 2,045 1,937Term LoanFrom BankForeign currency loan (Unsecured) 3M LIBOR + 1.60% 2019-2024 20,394 2Foreign currency loan (Secured) (Refer Note c below)
6.15% to 13.85% 2019-2022 1 3
From others (Unsecured) 2.00% 2019-2023 17 19Long term maturities of finance lease obligationObligations under finance leases 30 -
26,383 5,873
Notes to Consolidated Financial Statements for the year ended March 31, 2019
13. Other equity (contd.)
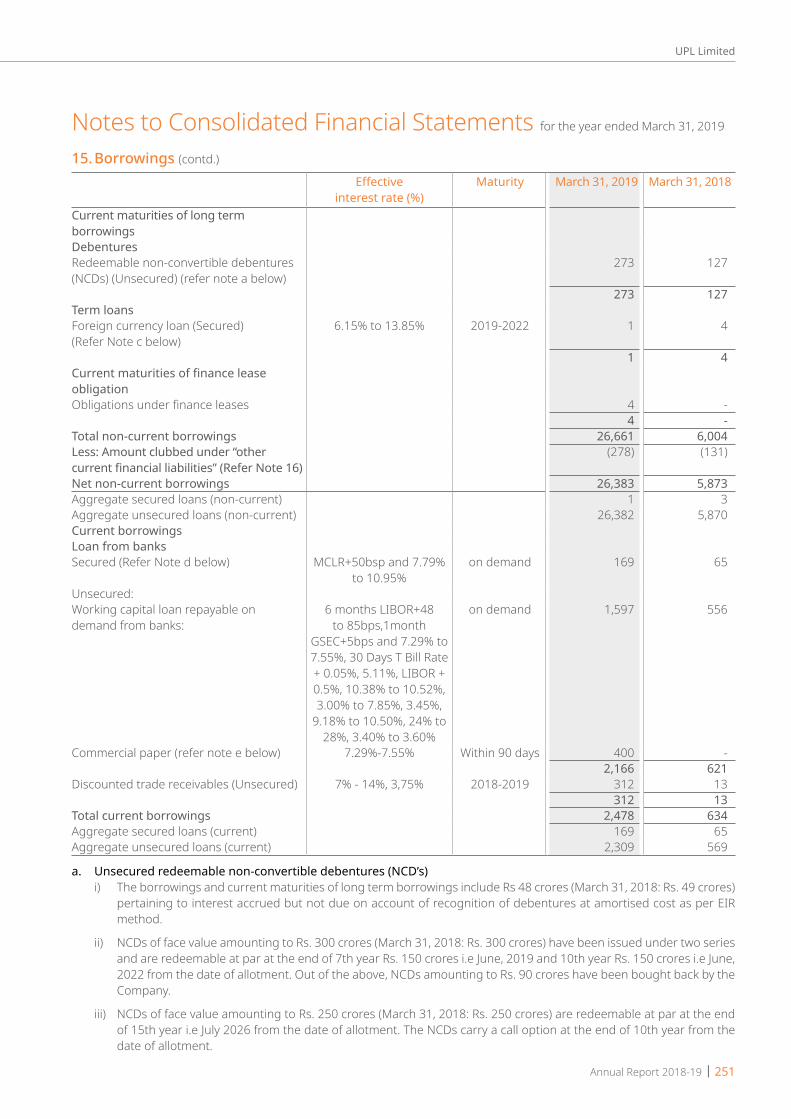
Annual Report 2018-19 | 251
UPL Limited
Effective interest rate (%)
Maturity March 31, 2019 March 31, 2018
Current maturities of long term borrowingsDebenturesRedeemable non-convertible debentures (NCDs) (Unsecured) (refer note a below)
273 127
273 127Term loansForeign currency loan (Secured) (Refer Note c below)
6.15% to 13.85% 2019-2022 1 4
1 4Current maturities of finance lease obligationObligations under finance leases 4 -
4 -Total non-current borrowings 26,661 6,004Less: Amount clubbed under “other current financial liabilities” (Refer Note 16)
(278) (131)
Net non-current borrowings 26,383 5,873Aggregate secured loans (non-current) 1 3Aggregate unsecured loans (non-current) 26,382 5,870Current borrowingsLoan from banksSecured (Refer Note d below) MCLR+50bsp and 7.79%
to 10.95%on demand 169 65
Unsecured:Working capital loan repayable on demand from banks:
6 months LIBOR+48 to 85bps,1month
GSEC+5bps and 7.29% to 7.55%, 30 Days T Bill Rate + 0.05%, 5.11%, LIBOR + 0.5%, 10.38% to 10.52%, 3.00% to 7.85%, 3.45%,
9.18% to 10.50%, 24% to 28%, 3.40% to 3.60%
on demand 1,597 556
Commercial paper (refer note e below) 7.29%-7.55% Within 90 days 400 -2,166 621
Discounted trade receivables (Unsecured) 7% - 14%, 3,75% 2018-2019 312 13312 13
Total current borrowings 2,478 634Aggregate secured loans (current) 169 65Aggregate unsecured loans (current) 2,309 569
a. Unsecured redeemable non-convertible debentures (NCD’s) i) The borrowings and current maturities of long term borrowings include Rs 48 crores (March 31, 2018: Rs. 49 crores)
pertaining to interest accrued but not due on account of recognition of debentures at amortised cost as per EIR method.
ii) NCDs of face value amounting to Rs. 300 crores (March 31, 2018: Rs. 300 crores) have been issued under two series and are redeemable at par at the end of 7th year Rs. 150 crores i.e June, 2019 and 10th year Rs. 150 crores i.e June, 2022 from the date of allotment. Out of the above, NCDs amounting to Rs. 90 crores have been bought back by the Company.
iii) NCDs of face value amounting to Rs. 250 crores (March 31, 2018: Rs. 250 crores) are redeemable at par at the end of 15th year i.e July 2026 from the date of allotment. The NCDs carry a call option at the end of 10th year from the date of allotment.
Notes to Consolidated Financial Statements for the year ended March 31, 2019
15. Borrowings (contd.)
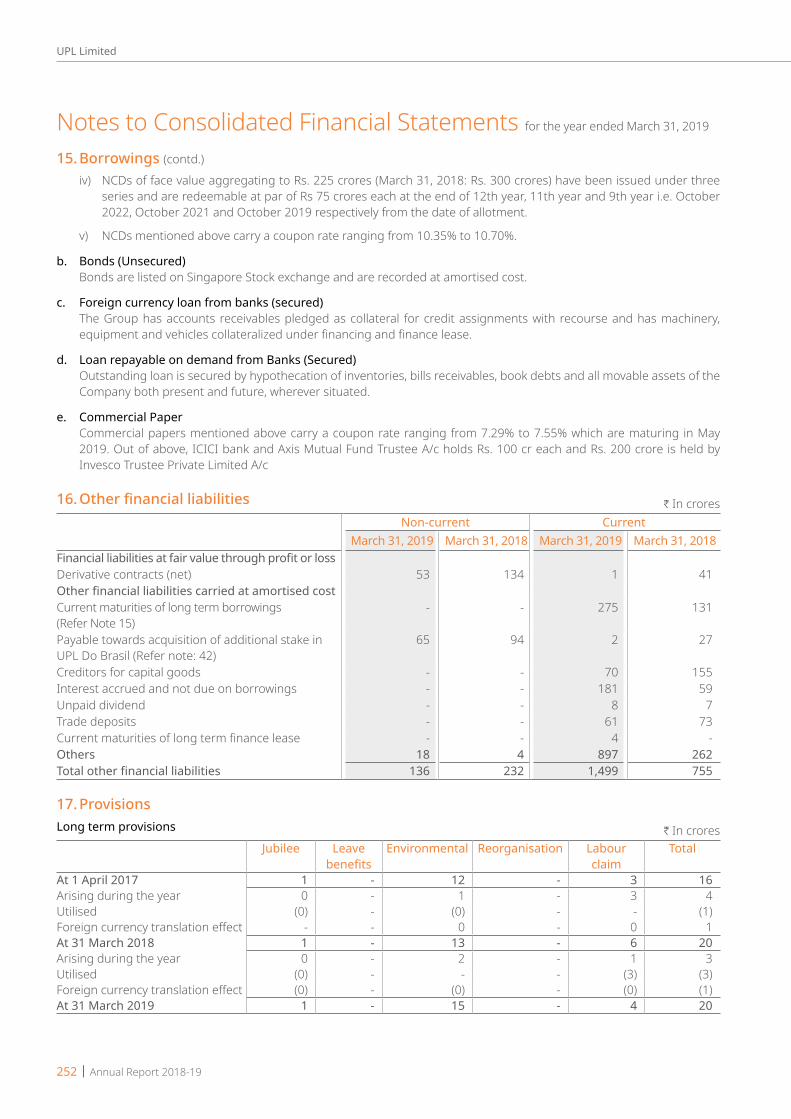
252 | Annual Report 2018-19
UPL Limited
iv) NCDs of face value aggregating to Rs. 225 crores (March 31, 2018: Rs. 300 crores) have been issued under three series and are redeemable at par of Rs 75 crores each at the end of 12th year, 11th year and 9th year i.e. October 2022, October 2021 and October 2019 respectively from the date of allotment.
v) NCDs mentioned above carry a coupon rate ranging from 10.35% to 10.70%.
b. Bonds (Unsecured) Bonds are listed on Singapore Stock exchange and are recorded at amortised cost.
c. Foreign currency loan from banks (secured) The Group has accounts receivables pledged as collateral for credit assignments with recourse and has machinery,
equipment and vehicles collateralized under financing and finance lease.
d. Loan repayable on demand from Banks (Secured) Outstanding loan is secured by hypothecation of inventories, bills receivables, book debts and all movable assets of the
Company both present and future, wherever situated.
e. Commercial Paper Commercial papers mentioned above carry a coupon rate ranging from 7.29% to 7.55% which are maturing in May
2019. Out of above, ICICI bank and Axis Mutual Fund Trustee A/c holds Rs. 100 cr each and Rs. 200 crore is held by Invesco Trustee Private Limited A/c
16.Otherfinancialliabilities H In croresNon-current Current
March 31, 2019 March 31, 2018 March 31, 2019 March 31, 2018Financial liabilities at fair value through profit or lossDerivative contracts (net) 53 134 1 41Other financial liabilities carried at amortised costCurrent maturities of long term borrowings (Refer Note 15)
- - 275 131
Payable towards acquisition of additional stake in UPL Do Brasil (Refer note: 42)
65 94 2 27
Creditors for capital goods - - 70 155Interest accrued and not due on borrowings - - 181 59Unpaid dividend - - 8 7Trade deposits - - 61 73Current maturities of long term finance lease - - 4 -Others 18 4 897 262Total other financial liabilities 136 232 1,499 755
17. ProvisionsLong term provisions H In crores
Jubilee Leave benefits
Environmental Reorganisation Labour claim
Total
At 1 April 2017 1 - 12 - 3 16Arising during the year 0 - 1 - 3 4Utilised (0) - (0) - - (1)Foreign currency translation effect - - 0 - 0 1At 31 March 2018 1 - 13 - 6 20Arising during the year 0 - 2 - 1 3Utilised (0) - - - (3) (3)Foreign currency translation effect (0) - (0) - (0) (1)At 31 March 2019 1 - 15 - 4 20
Notes to Consolidated Financial Statements for the year ended March 31, 2019
15. Borrowings (contd.)

Annual Report 2018-19 | 253
UPL Limited
Short term provisions H In croresLeave
benefitsDividend on CCPS
Contingencies Re organisation
Contingent liabilities
provision for PPA
Provision Gratuity
Provision-Defined Benefits
Total
At 1 April 2017 84 2 6 1 - 17 43 153Arising during the year 8 - - - - 5 2 15Utilised (5) (2) - - - - (7)Foreign currency translation effect (2) - - (1) - 1 5 3At 31 March 2018 85 - 6 - - 23 50 164Arising during the year 88 - 9 36 408 8 2 551Due to Acquisition of Arysta Life Science & its subsidiaries
- - - - - 59 89 148
Utilised (2) - - - - - - (2)Foreign currency translation effect (4) - (0) (1) (7) (3) (2) (17)At 31 March 2019 167 0 15 35 401 87 139 844
i) Jubilee Provision: The amount of provision represents the future jubliee expenses which are expected to be paid to the Company’s
employees when they reach an employement of 25 and 40 years, based on acturial calculations.
ii) Environmental provision: The Group’s operations are subject to environmental laws and regulations in the jurisdictions in which group operates.
Some of these laws restrict the amount and type of emissions that group’s operations can release into the environment. Group has made necessary provision required by respective local laws. The out flow of these would depend on the cessation of the respective operations.
iii) Reorganization provision: Due to a downward trend and a stronger competition, management has announced a cost reduction plan in some of
the geographies which includes a decrease in headcounts and other costs. The Group made provision in respect of the same and outflow is expected on compeletion of the respective activities.
iv) Labour / employee claim provision: Companies in the Group are parties to various lawsuits that are at administrative or judicial level or in their initial stages,
involving labour, tax and civil matters. The Group contest in court all claims and based on the assessment of their legal counsel, record a provision when the risk of loss is considered probable. The outflow is expected on completion of the respective events.
v) Provision for contingencies : The Group has considered provision for contingencies based on the best estimate of management of possible outflow
relating to customs assessment on imports.
vi) Provision for gratuity : Some entities of the Group have a defined benefit gratuity plan. Every employee who has completed five years or more
of a service gets a gratuity on post employment at 15 days salary (last drawn salary) for each completed year of service as per the rules of the Company. The aforesaid liability is provided for on the basis of an actuarial valuation on projected unit credit method made at the end of the financial year. The scheme is funded with an insurance Company in the form of a qualifying insurance policy.
18. Income taxesThe major components of income tax expense for the years ended 31 March 2019 and 31 March 2018 are:Consolidated statement of profit and loss:Profit or loss section H In crores
March 31, 2019 March 31, 2018Current income tax:Current income tax charge 442 311Adjustments of tax relating to earlier years (4) (79)Deferred tax:Relating to origination and reversal of temporary differences (273) 43 Income tax expense reported in the statement of profit or loss 165 275
Notes to Consolidated Financial Statements for the year ended March 31, 2019
17. Provisions (contd.)
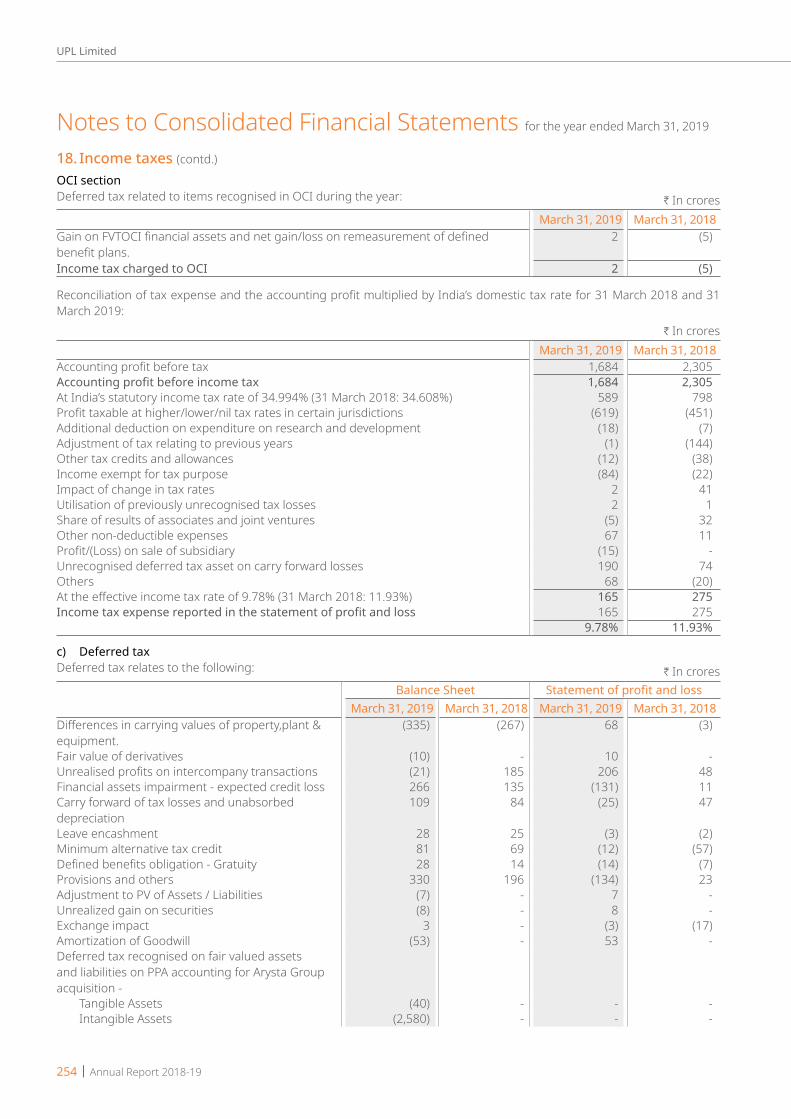
254 | Annual Report 2018-19
UPL Limited
OCI sectionDeferred tax related to items recognised in OCI during the year: H In crores
March 31, 2019 March 31, 2018Gain on FVTOCI financial assets and net gain/loss on remeasurement of defined benefit plans.
2 (5)
Income tax charged to OCI 2 (5)
Reconciliation of tax expense and the accounting profit multiplied by India’s domestic tax rate for 31 March 2018 and 31 March 2019:
H In croresMarch 31, 2019 March 31, 2018
Accounting profit before tax 1,684 2,305Accounting profit before income tax 1,684 2,305At India’s statutory income tax rate of 34.994% (31 March 2018: 34.608%) 589 798Profit taxable at higher/lower/nil tax rates in certain jurisdictions (619) (451)Additional deduction on expenditure on research and development (18) (7)Adjustment of tax relating to previous years (1) (144)Other tax credits and allowances (12) (38)Income exempt for tax purpose (84) (22)Impact of change in tax rates 2 41Utilisation of previously unrecognised tax losses 2 1Share of results of associates and joint ventures (5) 32Other non-deductible expenses 67 11Profit/(Loss) on sale of subsidiary (15) -Unrecognised deferred tax asset on carry forward losses 190 74Others 68 (20)At the effective income tax rate of 9.78% (31 March 2018: 11.93%) 165 275Income tax expense reported in the statement of profit and loss 165 275
9.78% 11.93%
c) Deferred taxDeferred tax relates to the following: H In crores
Balance Sheet Statement of profit and lossMarch 31, 2019 March 31, 2018 March 31, 2019 March 31, 2018
Differences in carrying values of property,plant & equipment.
(335) (267) 68 (3)
Fair value of derivatives (10) - 10 -Unrealised profits on intercompany transactions (21) 185 206 48Financial assets impairment - expected credit loss 266 135 (131) 11Carry forward of tax losses and unabsorbed depreciation
109 84 (25) 47
Leave encashment 28 25 (3) (2)Minimum alternative tax credit 81 69 (12) (57)Defined benefits obligation - Gratuity 28 14 (14) (7)Provisions and others 330 196 (134) 23Adjustment to PV of Assets / Liabilities (7) - 7 -Unrealized gain on securities (8) - 8 -Exchange impact 3 - (3) (17)Amortization of Goodwill (53) - 53 -Deferred tax recognised on fair valued assets and liabilities on PPA accounting for Arysta Group acquisition - Tangible Assets (40) - - - Intangible Assets (2,580) - - -
Notes to Consolidated Financial Statements for the year ended March 31, 2019
18. Income taxes (contd.)

Annual Report 2018-19 | 255
UPL Limited
Balance Sheet Statement of profit and lossMarch 31, 2019 March 31, 2018 March 31, 2019 March 31, 2018
Inventory (123) - - - Current Liabilities and Provisions 149 - - -Tax benefits 39 - (39) -Others (67) - (263) -Deferred tax expense/(income) - - (273) 43Net deferred tax assets/(liabilities) (2,210) 441 - -
Reflected in the balance sheet as follows: H In croresBalance Sheet
March 31, 2019 March 31, 2018Deferred tax assets 731 529 Deferred tax liabilities: (2,942) (88)Deferred tax Assets (net) (2,210) 441
Reconciliation of deferred tax liabilities (net): H In croresMarch 31, 2019 March 31, 2018
Opening balance as of 1 April 441 501 Tax income/(expense) during the period recognised in profit or loss 273 (43)Tax income/(expense) during the period recognised in OCI 2 (5)Exchange impact 3 (12)Deferred tax acquired in business combinations* (2,929) - Closing balance as at 31 March (2,210) 441
* including deferred tax recognised for PPA for Arysta
The Group offsets tax assets and liabilities if and only if it has a legally enforceable right to set off current tax assets and current tax liabilities and the deferred tax assets and deferred tax liabilities relate to income taxes levied by the same tax authority.
The Group has tax losses of Rs. 1,196 Crores (31 March 2018: Rs. 547 Crores) that are available for offsetting for period upto ten years against future taxable profits of the companies in which the losses arose.
Deferred tax assets have not been recognised in respect of these losses as they may not be used to offset taxable profits elsewhere in the Group, they have arisen in subsidiaries that have been loss-making for some time, and there are no other tax planning opportunities or other evidence of recoverability in the near future. If the Group were able to recognise all unrecognised deferred tax assets of current year, the profit would increase by Rs. 190 Crores.
The Group has not recognized deferred tax liability with respect to unremitted retained earnings and associated foreign currency translation reserve with respect to certain of its subsidiaries and joint ventures where the Group is in a position to control the timing of the distribution of profits and it is probable that the subsidiaries and joint ventures will not distribute the profits in the foreseeable future.
The temporary differences associated with investments in subsidiaries, associate and joint venture, for which a deferred tax liability has not been recognised.
In the previous year, pursuant to the completion of assessments for the past years, the Holding Company had written back an excess provision of tax and recognised minimum alternate tax credit entitlement relating to earlier periods aggregating to Rs 146 Crores. Further due to chnages in tax laws in the USA in previous year, tax rate in US reduced from 36% to 25%. Accordingly the Group has recognised appropriate effect on Defered Tax Assets.
Notes to Consolidated Financial Statements for the year ended March 31, 2019
18. Income taxes (contd.)

256 | Annual Report 2018-19
UPL Limited
19. Trade payables H In croresCurrent
March 31, 2019 March 31, 2018Trade payables 9,423 5,675
9,423 5,675
Terms and conditions of the above financial liabilities:- Trade payables are non-interest bearing and are normally settled on 90-360 days terms- For explanations on Group’s Credit risk management process. Refer note 47
20. Other current liabilities H In croresMarch 31, 2019 March 31, 2018
Advances against orders 338 214 Statutory liabilities 386 143 Total other current liabilities 724 357
21. Revenue from operations H In croresMarch 31, 2019 March 31, 2018
Sale of products (including excise duty) (Refer note: 49) 21,594 17,244Sale of services Job-Work /Service income 15 25Other operating revenues Export incentives 105 102 Refund of statutory receivables 12 22 Royalty income 6 1 Excess provisions in respect of earlier years written back (net) 36 57 Miscellaneous receipts 67 55Total Revenue from operation 21,837 17,506
The Government of India introduced the Goods and Services Tax (GST) with effect from 1st July 2017, consequently revenue from operations for the period from July 31, 2017 upto March 31, 2019 is net of GST. However revenue for the quarter ended 30th June 2017 included in the year ended March 31, 2018 is inclusive of excise duty. The Net Revenue from Operations (Net of GST/ Excise Duty) as applicable are stated below-
H In croresMarch 31, 2019 March 31, 2018
Revenue from operations 21,837 17,506 Less: Excise Duty - (128)Net Revenue from operations 21,837 17,378
Dislosure under Ind AS 115 - Revenue from contracts with customersThe Company is engaged into manufacturing of agrochemicals, industrial chemicals and production and sale of vegetable and field crops. There is no impact on the Company’s revenue on applying Ind AS 115 from the contract with customers.
Disaggregation of revenue from contracts with customersa. The management determines that the segment information reported under Note 39 Segment reporting is sufficient to
meet the disclosure objective with respect to disaggregation of revenue under Ind AS 115 Revenue from contract with Customers. Hence, no seperate disclosures of disaggregated revenues are reported.
b. The Company’s performance obligation are satisfied upon shipment and payment is generally due by 45 to 270 days.c. Contract balances H In crores
March 31, 2019 March 31, 2018Trade receivables (refer note 10) 11,816 6,057 Contract liablities (refer note 20) 338 214
Notes to Consolidated Financial Statements for the year ended March 31, 2019

Annual Report 2018-19 | 257
UPL Limited
d. Reconciliation of revenue from contract with customers with contracted price H In croresMarch 31, 2019 March 31, 2018
Revenue from contract with customer as per the contract price 25,534 21,048 Adjustments made to contract price on account of :-a) Discounts / Rebates / Incentives (Refer note below) 2,497 2,364 b) Sales Returns (Refer note below) 1,443 1,440 Revenue from contract with customer 21,594 17,244 Sale of services 15 25 Other operating revenue 227 237 Revenue from operations 21,837 17,506
Discounts / Rebates / Incentives The Group issues multiple discount schemes to its customers in order to capture market share. The Company makes
a provision for the discount it expects to give to its customers based on the terms of the scheme as at 31 March 2019. Revenue is adjusted for the expected value of discount to be given
Sales returns The Group recognizes a provision based on the previous history of sales return. Revenue is adjusted for the expected
value of return.
22. Other incomeOutstanding dues of micro and small enterprises H In crores
CurrentMarch 31, 2019 March 31, 2018
Interest income on Loans and others 137 132 Unwinding of interest on trade receivable 82 282Other non-operating income Profit on sale of current and non current investments (net) 9 (7) Rent received 3 2 Profit on sale of property,plant and equipment (net) 3 2 Miscellaneous income 8 3Total 240 414
23.Employeebenefitsexpense H In croresMarch 31, 2019 March 31, 2018
Salaries, wages and bonus 1,901 1,556Contribution to provident and other funds (Refer note 35) 41 34Gratuity and other retirement benefits (Refer note 35) 10 11Staff welfare expenses 143 112Total 2,095 1,713
24. Finance costs H In croresMarch 31, 2019 March 31, 2018
Interest: - On Debentures 77 81 - On Term Loans 405 209 - On Cash Credit and Working Capital Demand Loan Accounts 157 126 - On Fixed Deposits and Fixed Loans 11 5 - On Others 120 55 Exchange difference (net) (35) 145 Unwinding of interest on trade payables 126 113 Loss on derivatives Instruments 40 (8)Other financial charges 62 57 Total 963 783
Notes to Consolidated Financial Statements for the year ended March 31, 2019
21. Revenue from operations (contd.)
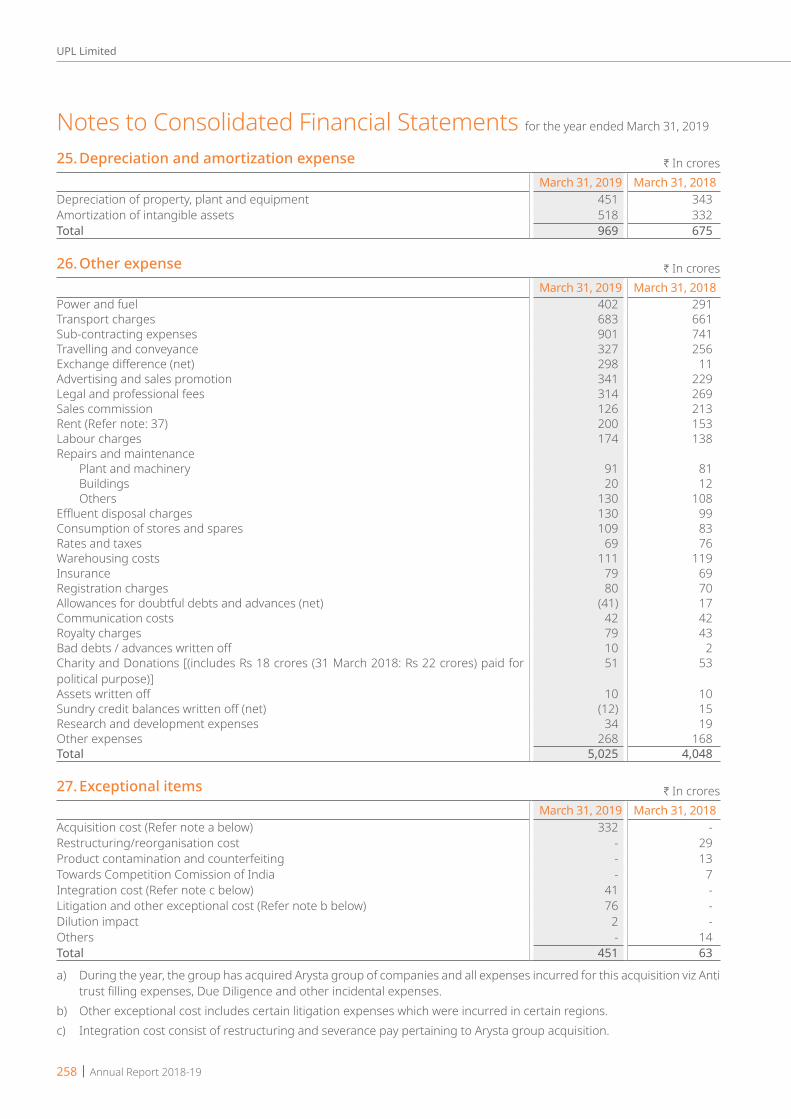
258 | Annual Report 2018-19
UPL Limited
25. Depreciation and amortization expense H In croresMarch 31, 2019 March 31, 2018
Depreciation of property, plant and equipment 451 343 Amortization of intangible assets 518 332 Total 969 675
26. Other expense H In croresMarch 31, 2019 March 31, 2018
Power and fuel 402 291Transport charges 683 661Sub-contracting expenses 901 741Travelling and conveyance 327 256Exchange difference (net) 298 11Advertising and sales promotion 341 229Legal and professional fees 314 269Sales commission 126 213Rent (Refer note: 37) 200 153Labour charges 174 138Repairs and maintenance Plant and machinery 91 81 Buildings 20 12 Others 130 108Effluent disposal charges 130 99Consumption of stores and spares 109 83Rates and taxes 69 76Warehousing costs 111 119Insurance 79 69Registration charges 80 70Allowances for doubtful debts and advances (net) (41) 17Communication costs 42 42Royalty charges 79 43Bad debts / advances written off 10 2Charity and Donations [(includes Rs 18 crores (31 March 2018: Rs 22 crores) paid for political purpose)]
51 53
Assets written off 10 10Sundry credit balances written off (net) (12) 15Research and development expenses 34 19Other expenses 268 168Total 5,025 4,048
27. Exceptional items H In croresMarch 31, 2019 March 31, 2018
Acquisition cost (Refer note a below) 332 -Restructuring/reorganisation cost - 29 Product contamination and counterfeiting - 13 Towards Competition Comission of India - 7 Integration cost (Refer note c below) 41 - Litigation and other exceptional cost (Refer note b below) 76 - Dilution impact 2 - Others - 14 Total 451 63
a) During the year, the group has acquired Arysta group of companies and all expenses incurred for this acquisition viz Anti trust filling expenses, Due Diligence and other incidental expenses.
b) Other exceptional cost includes certain litigation expenses which were incurred in certain regions.c) Integration cost consist of restructuring and severance pay pertaining to Arysta group acquisition.
Notes to Consolidated Financial Statements for the year ended March 31, 2019
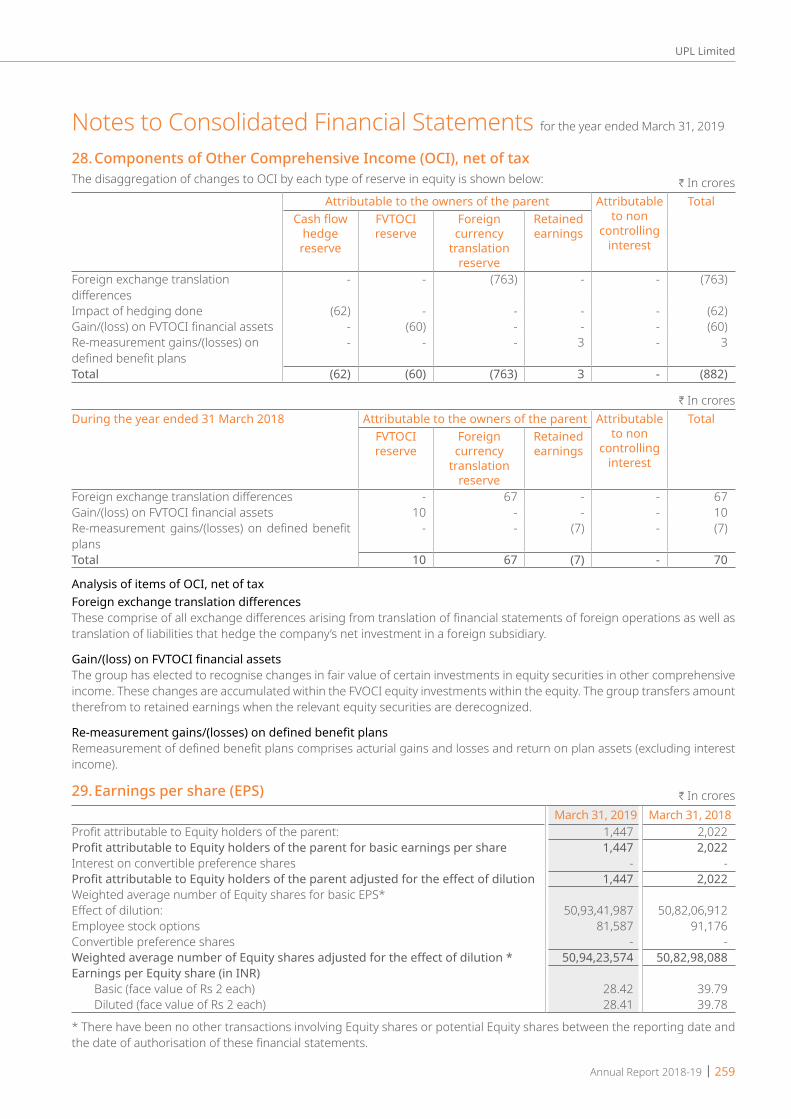
Annual Report 2018-19 | 259
UPL Limited
28.ComponentsofOtherComprehensiveIncome(OCI),netoftaxThe disaggregation of changes to OCI by each type of reserve in equity is shown below: H In crores
Attributable to the owners of the parent Attributable to non
controlling interest
TotalCash flow
hedge reserve
FVTOCI reserve
Foreign currency
translation reserve
Retained earnings
Foreign exchange translation differences
- - (763) - - (763)
Impact of hedging done (62) - - - - (62)Gain/(loss) on FVTOCI financial assets - (60) - - - (60)Re-measurement gains/(losses) on defined benefit plans
- - - 3 - 3
Total (62) (60) (763) 3 - (882)
H In croresDuring the year ended 31 March 2018 Attributable to the owners of the parent Attributable
to non controlling
interest
TotalFVTOCI reserve
Foreign currency
translation reserve
Retained earnings
Foreign exchange translation differences - 67 - - 67 Gain/(loss) on FVTOCI financial assets 10 - - - 10 Re-measurement gains/(losses) on defined benefit plans
- - (7) - (7)
Total 10 67 (7) - 70
Analysis of items of OCI, net of taxForeign exchange translation differencesThese comprise of all exchange differences arising from translation of financial statements of foreign operations as well as translation of liabilities that hedge the company’s net investment in a foreign subsidiary.
Gain/(loss) on FVTOCI financial assetsThe group has elected to recognise changes in fair value of certain investments in equity securities in other comprehensive income. These changes are accumulated within the FVOCI equity investments within the equity. The group transfers amount therefrom to retained earnings when the relevant equity securities are derecognized.
Re-measurement gains/(losses) on defined benefit plansRemeasurement of defined benefit plans comprises acturial gains and losses and return on plan assets (excluding interest income).
29.Earningspershare(EPS) H In croresMarch 31, 2019 March 31, 2018
Profit attributable to Equity holders of the parent: 1,447 2,022Profit attributable to Equity holders of the parent for basic earnings per share 1,447 2,022Interest on convertible preference shares - -Profit attributable to Equity holders of the parent adjusted for the effect of dilution 1,447 2,022Weighted average number of Equity shares for basic EPS*Effect of dilution: 50,93,41,987 50,82,06,912Employee stock options 81,587 91,176Convertible preference shares - -Weighted average number of Equity shares adjusted for the effect of dilution * 50,94,23,574 50,82,98,088Earnings per Equity share (in INR) Basic (face value of Rs 2 each) 28.42 39.79 Diluted (face value of Rs 2 each) 28.41 39.78
* There have been no other transactions involving Equity shares or potential Equity shares between the reporting date and the date of authorisation of these financial statements.
Notes to Consolidated Financial Statements for the year ended March 31, 2019

260 | Annual Report 2018-19
UPL Limited
30. Amalgamation with Advanta LimitedThe Hon’ble High Court of Gujarat vide its order dated June 23, 2016 had sanctioned the Scheme of Amalgamation of Advanta Limited with the Company with an appointed date of April 01, 2015. In accordance with the provisions of the scheme and as approved by the High Court, the amalgamation was accounted for under the purchase method specified in Accounting Standard 14 - ‘Accounting for Amalgamations’ which is different from Ind AS 103 ‘Business Combinations’. As per the Court approval the goodwill arising on amalgamation is being amortised over a period of ten years from the appointed date, which is not amortised under Ind AS 103 but only tested for impairment.
31. Group informationInformation about subsidiariesThe consolidated financial statements of the Group includes subsidiaries listed in the table below:
Sr No
Name Principal activities Country of incorporation/ Principal place
of business
% Controlling InterestMarch 31,
2019March 31,
2018
1 Shroffs United Chemicals Limited Crop protection India 100% 100%2 SWAL Corporation Limited Crop protection India 100% 100%3 United Phosphorus (India) LLP Crop protection India 100% 100%4 United Phosphorus Global LLP Crop protection India 100% 100%5 Optima Farm Solutions Limited Crop protection India 100% 100%6 UPL Europe Limited Crop protection United
Kingdom78% 100%
7 UPL Deutschland GmbH Crop protection Germany 78% 100%8 UPL Polska Sp z.o.o. Crop protection Poland 78% 100%9 UPL Benelux B.V. Crop protection Netherlands 78% 100%10 Cerexagri B.V. Crop protection Netherlands 78% 100%11 Blue Star B.V. Crop protection Netherlands #4 - 100%12 United Phosphorus Holdings
Cooperatief U.A.Crop protection Netherlands 78% 100%
13 United Phosphorus Holdings B.V. Crop protection Netherlands 78% 100%14 Decco Worldwide Post-Harvest Holdings
Cooperatief U.A.Crop protection Netherlands 78% 100%
15 Decco Worldwide Post-Harvest Holdings B.V.
Crop protection Netherlands 78% 100%
16 United Phosphorus Holding, Brazil B.V. Crop protection Netherlands 78% 100%17 UPL Italia S.R.L. Crop protection Italy 78% 100%18 UPL Iberia, S.A. Crop protection Spain 78% 100%19 Decco Iberica Postcosecha, S.A.U. Crop protection Spain 78% 100%20 Transterra Invest, S. L. U. Crop protection Spain 78% 100%21 Cerexagri S.A.S. Crop protection France 78% 100%22 Neo-Fog S.A. Crop protection France 78% 100%23 UPL France Crop protection France 78% 100%24 United Phosphorus Switzerland Limited Crop protection Switzerland 78% 100%25 Agrodan, ApS Crop protection Denmark 78% 100%26 Decco Italia SRL Crop protection Italy 78% 100%27 Limited Liability Company "UPL" Crop protection Russia 78% 100%28 Decco Portugal Post Harvest, Unipessoal
LDA (formerly known as UPL Portugal Unipessoal LDA)
Crop protection Portugal 78% 100%
29 United Phosphorus Inc. Crop protection USA 78% 100%30 UPI Finance LLC Crop protection USA 78% 100%31 Cerexagri, Inc. (PA) Crop protection USA 78% 100%32 UPL Delaware, Inc. Crop protection USA 78% 100%
Notes to Consolidated Financial Statements for the year ended March 31, 2019
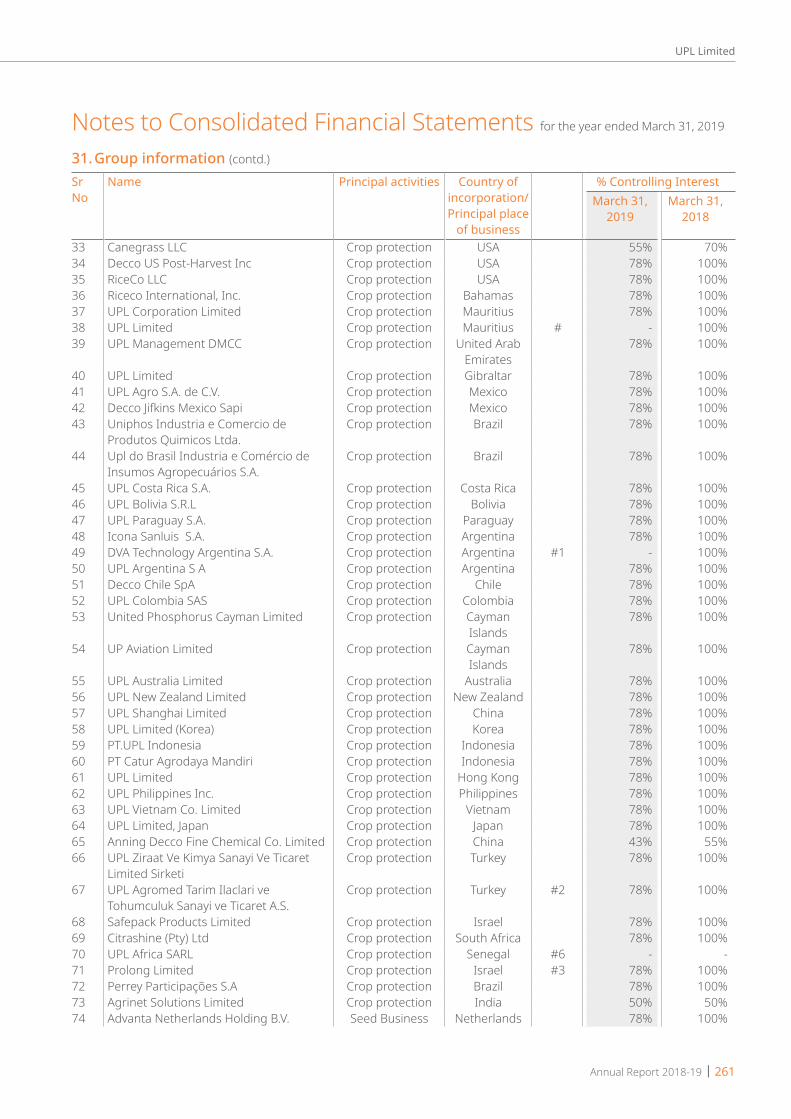
Annual Report 2018-19 | 261
UPL Limited
Sr No
Name Principal activities Country of incorporation/ Principal place
of business
% Controlling InterestMarch 31,
2019March 31,
2018
33 Canegrass LLC Crop protection USA 55% 70%34 Decco US Post-Harvest Inc Crop protection USA 78% 100%35 RiceCo LLC Crop protection USA 78% 100%36 Riceco International, Inc. Crop protection Bahamas 78% 100%37 UPL Corporation Limited Crop protection Mauritius 78% 100%38 UPL Limited Crop protection Mauritius # - 100%39 UPL Management DMCC Crop protection United Arab
Emirates78% 100%
40 UPL Limited Crop protection Gibraltar 78% 100%41 UPL Agro S.A. de C.V. Crop protection Mexico 78% 100%42 Decco Jifkins Mexico Sapi Crop protection Mexico 78% 100%43 Uniphos Industria e Comercio de
Produtos Quimicos Ltda.Crop protection Brazil 78% 100%
44 Upl do Brasil Industria e Comércio de Insumos Agropecuários S.A.
Crop protection Brazil 78% 100%
45 UPL Costa Rica S.A. Crop protection Costa Rica 78% 100%46 UPL Bolivia S.R.L Crop protection Bolivia 78% 100%47 UPL Paraguay S.A. Crop protection Paraguay 78% 100%48 Icona Sanluis S.A. Crop protection Argentina 78% 100%49 DVA Technology Argentina S.A. Crop protection Argentina #1 - 100%50 UPL Argentina S A Crop protection Argentina 78% 100%51 Decco Chile SpA Crop protection Chile 78% 100%52 UPL Colombia SAS Crop protection Colombia 78% 100%53 United Phosphorus Cayman Limited Crop protection Cayman
Islands78% 100%
54 UP Aviation Limited Crop protection Cayman Islands
78% 100%
55 UPL Australia Limited Crop protection Australia 78% 100%56 UPL New Zealand Limited Crop protection New Zealand 78% 100%57 UPL Shanghai Limited Crop protection China 78% 100%58 UPL Limited (Korea) Crop protection Korea 78% 100%59 PT.UPL Indonesia Crop protection Indonesia 78% 100%60 PT Catur Agrodaya Mandiri Crop protection Indonesia 78% 100%61 UPL Limited Crop protection Hong Kong 78% 100%62 UPL Philippines Inc. Crop protection Philippines 78% 100%63 UPL Vietnam Co. Limited Crop protection Vietnam 78% 100%64 UPL Limited, Japan Crop protection Japan 78% 100%65 Anning Decco Fine Chemical Co. Limited Crop protection China 43% 55%66 UPL Ziraat Ve Kimya Sanayi Ve Ticaret
Limited SirketiCrop protection Turkey 78% 100%
67 UPL Agromed Tarim Ilaclari ve Tohumculuk Sanayi ve Ticaret A.S.
Crop protection Turkey #2 78% 100%
68 Safepack Products Limited Crop protection Israel 78% 100%69 Citrashine (Pty) Ltd Crop protection South Africa 78% 100%70 UPL Africa SARL Crop protection Senegal #6 - - 71 Prolong Limited Crop protection Israel #3 78% 100%72 Perrey Participações S.A Crop protection Brazil 78% 100%73 Agrinet Solutions Limited Crop protection India 50% 50%74 Advanta Netherlands Holding B.V. Seed Business Netherlands 78% 100%
Notes to Consolidated Financial Statements for the year ended March 31, 2019
31. Group information (contd.)

262 | Annual Report 2018-19
UPL Limited
Sr No
Name Principal activities Country of incorporation/ Principal place
of business
% Controlling InterestMarch 31,
2019March 31,
2018
75 Advanta Semillas SAIC Seed Business Argentina 78% 100%76 Advanta Holdings B.V. Seed Business Netherlands 78% 100%77 Advanta Seeds International Seed Business Mauritius 78% 100%78 Pacific Seeds Holdings (Thailand)
LimitedSeed Business Thailand 78% 100%
79 Pacific Seeds (Thai) Limited Seed Business Thailand 78% 100%80 Advanta Seeds Pty Ltd Seed Business Australia 78% 100%81 Advanta US LLC (formerly known as
Advanta U.S. Inc.)Seed Business USA 78% 100%
82 Advanta Comercio De Sementes LTDA. Seed Business Brazil 78% 100%83 PT Advanta Seeds Indonesia Seed Business Indonesia 78% 100%84 Advanta Seeds DMCC Seed Business United Arab
Emirates78% 100%
85 Essentiv LCC Crop protection USA 39% 50%86 UPL Limited Mauritius (Formely known
as UPL Agro Limited Mauritius)Crop protection Mauritius `@3 78% 100%
87 UPL Jiangsu Limited Crop protection China `@2 55% 70%88 Riceco International Bangladesh Ltd Crop protection Bangladesh `@3 78% 100%89 Uniphos Malaysia Sdn Bhd Crop protection Malaysia `@3 78% 100%90 Advanta Seeds Ukraine LLC Seed Business Ukraine 78% 100%91 Decco Gıda Tarım ve Zirai Ürünler San.
Tic A.S. Crop protection Turkey @ 78% -
92 Arysta LifeScience Investments LLC Crop protection USA @1 78% -93 Arysta LifeScience America Inc. Crop protection USA @1 78% -94 ANESA S.A. Crop protection Belgium @1 78% -95 Arysta LifeScience Management
Company, LLCCrop protection USA @1 78% -
96 Arysta LifeScience SPC, LLC Crop protection USA @1 78% -97 Arysta LifeScience India Limited Crop protection India @1 78% -98 Arysta LifeScience Agriservice Private
LimitedCrop protection India @1 78% -
99 Arysta LifeScience Togo SAU Crop protection Togo @1 78% -100 Arysta Agro Private Limited Crop protection India @1 78% -101 Arysta LifeScience do Brasil Indústria
Química e Agropecuária SACrop protection Brazil @1 68% -
102 Volcano Agrociencia Industria e Comercio de Defensivos Agricolas Ltda
Crop protection Brazil @1 78% -
103 GBM USA LLC Crop protection USA @1 78% -104 Arysta LifeScience Canada, Inc. Crop protection Canada @1 78% -105 Arysta LifeScience Canada BC Inc. Crop protection Canada @1 78% -106 Arysta LifeScience North America, LLC Crop protection USA @1 78% -107 Arysta LifeScience NA Holding LLC Crop protection USA @1 78% -108 Arysta LifeScience Inc. Crop protection USA @1 78% -109 Arysta LifeScience Services LLP Crop protection India @1 78% -110 Arysta LifeScience France SAS Crop protection France @1 78% -111 Arysta LifeScience Benelux SPRL Crop protection Belgium @1 78% -112 Arysta LifeScience (Mauritius) Ltd Crop protection Mauritius @1 78% -113 Arysta LifeScience South Africa (Pty) Ltd Crop protection South Africa @1 78% -114 Arysta Health and Nutrition Sciences
CorporationHealth Nutrition
SolutionJapan @1 78% -
Notes to Consolidated Financial Statements for the year ended March 31, 2019
31. Group information (contd.)

Annual Report 2018-19 | 263
UPL Limited
Sr No
Name Principal activities Country of incorporation/ Principal place
of business
% Controlling InterestMarch 31,
2019March 31,
2018
115 Arysta LifeScience Corporation Crop protection Japan @1 78% -116 Arysta LifeScience S.A.S. Crop protection France @1 78% -117 Arysta LifeScience Chile S.A. Crop protection Chile @1 78% -118 Arysta LifeScience Mexico, S.A.de C.V Crop protection Mexico @1 78% -119 Grupo Bioquimico Mexicano, S.A. de C.V. Crop protection Mexico @1 78% -120 MacDermid Agricultural Solutions
Netherlands Cooperatief UACrop protection Netherlands @1 78% -
121 Arysta LifeScience UK & Ireland Ltd Crop protection U.K. @1 78% -122 Arysta LifeScience Europe Sarl Crop protection France @1 78% -123 MacDermid Agricultural Solutions Italy Srl Crop protection Italy @1 78% -124 Platform Sales Suisse GmbH Crop protection Switzerland @1 78% -125 MacDermid Agricultural Solutions
Holdings BVCrop protection Netherlands @1 78% -
126 Dutch Agricultural Investment Partners LLC
Crop protection USA @1 78% -
127 Netherlands Agricultural Investment Partners LLC
Crop protection USA @1 78% -
128 Arysta LifeScience Bulgaria EOOD Crop protection Bulgaria @1 78% -129 Arysta LifeScience Romania SRL Crop protection Romania @1 78% -130 Arysta LifeScience Kiev LLC Crop protection Ukraine @1 78% -131 Arysta LifeScience Great Britain Ltd Crop protection U.K. @1 78% -132 Arysta LifeScience Technology BV Crop protection Netherlands @1 78% -133 Arysta LifeScience Netherlands BV Crop protection Netherlands @1 78% -134 Arysta LifeScience RUS LLC Crop protection Russia @1 78% -135 Netherlands Agricultural Technologies CV Crop protection Netherlands @1 78% -136 Dutch Agricultural Formations CV Crop protection Netherlands @1 78% -137 Arysta LifeScience Turkey Tarim Urunleri
Limited SirketiCrop protection Turkey @1 78% -
138 Arysta LifeScience Australia Pty Ltd. Crop protection Australia @1 78% -139 Chemtura (Thailand) Ltd Crop protection Thailand @1 78% -140 MacDermid (Shanghai) Chemical Ltd. Crop protection China @1 78% -141 Arysta-LifeScience Ecuador S.A. Crop protection Ecuador @1 78% -142 Arysta LifeScience Ougrée Production
SprlCrop protection Belgium @1 78% -
143 Arysta LifeScience Hellas S.A. Plant Protection, Nutrition and Other Related Products and Services
Crop protection Greece @1 78% -
144 Arysta LifeScience Iberia SLU Crop protection Spain @1 78% -145 Arysta Lifescience Italia SrL Crop protection Italy @1 78% -146 Agriphar Poland Sp. Zoo Crop protection Poland @1 78% -147 Arysta LifeScience Switzerland Sarl Crop protection Switzerland @1 78% -148 Arysta Animal Health SAS Animal Health France @1 78% -149 PPWJ Sci Animal Health France @1 78% -150 Santamix Iberica SL Animal Health Spain @1 78% -151 Arysta LifeScience Global Services
LimitedCrop protection Ireland @1 78% -
152 Arysta LifeScience European Investments Limited
Crop protection U.K. @1 78% -
153 Arysta LifeScience U.K. Limited Crop protection U.K. @1 78% -154 Arysta LifeScience U.K. CAD Limited Crop protection U.K. @1 78% -
Notes to Consolidated Financial Statements for the year ended March 31, 2019
31. Group information (contd.)

264 | Annual Report 2018-19
UPL Limited
Sr No
Name Principal activities Country of incorporation/ Principal place
of business
% Controlling InterestMarch 31,
2019March 31,
2018
155 Arysta LifeScience U.K. EUR Limited Crop protection U.K. @1 78% -156 Arysta LifeScience U.K. JPY Limited Crop protection U.K. @1 78% -157 Arysta LifeScience U.K. USD Limited Crop protection U.K. @1 78% -158 Arysta Lifescience U.K. Holdings Limited Crop protection U.K. @1 78% -159 Arysta LifeScience Japan Holdings
Goudou KaishaCrop protection Japan @1 78% -
160 Arysta LifeScience Cameroun SA Crop protection Cameroon @1 78% -161 Callivoire SGFD S.A. Crop protection Cote D'Ivoire @1 78% -162 Arysta LifeScience Egypt Ltd Crop protection Egypt @1 78% -163 Calli Ghana Ltd. Crop protection Ghana @1 78% -164 Arysta LifeScience Kenya Ltd. Crop protection Kenya @1 78% -165 Mali Protection Des Cultures (M.P.C.) SA Crop protection Mali @1 66% -166 Agrifocus Limitada Crop protection Mozambique @1 78% -167 Arysta LifeScience Holdings SA (Pty) Ltd Crop protection South Africa @1 78% -168 Anchorprops 39 (Pty) Ltd Crop protection South Africa @1 78% -169 Callietha Investments (Pty) Ltd Crop protection South Africa @1 78% -170 Sidewalk Trading (Pty) Ltd Crop protection South Africa @1 78% -171 Volcano Agroscience (Pty) Ltd Crop protection South Africa @1 78% -172 Volcano Chemicals (Pty) Ltd Crop protection South Africa @1 78% -173 Arysta LifeScience Tanzania Ltd Crop protection Tanzania @1 78% -174 Arysta LifeScience (Shanghai) Co., Ltd. Crop protection China @1 78% -175 Pt. Arysta LifeScience Tirta Indonesia Crop protection Indonesia @1 39% -176 Arysta LifeScience Korea Ltd. Crop protection Korea @1 78% -177 Arysta LifeScience Pakistan (Pvt.) LTD. Crop protection Pakistan @1 78% -178 Arysta LifeScience Philippines Inc. Crop protection Philippines @1 78% -179 Arysta LifeScience Asia Pte., Ltd. Crop protection Singapore @1 78% -180 Arysta LifeScience (Thailand) Co., Ltd. Crop protection Thailand @1 78% -181 Arysta LifeScience Vietnam Co., Ltd. Crop protection Vietnam @1 78% -182 Arysta LifeScience Holdings France SAS Crop protection France @1 78% -183 Goëmar Développement SAS Crop protection France @1 78% -184 Laboratoires Goëmar SAS Crop protection France @1 78% -185 Natural Plant Protection S.A.S. Crop protection France @1 78% -186 Arysta LifeScience Czech s.r.o. Crop protection Czech Rpb @1 78% -187 Arysta LifeScience Germany GmbH Crop protection Germany @1 78% -188 Arysta LifeScience Magyarorszag Kft. Crop protection Hungary @1 78% -189 Arysta LifeScience Polska Sp. z.o.o Crop protection Poland @1 78% -190 Betel Reunion S.A. Crop protection Reunion(Fr) @1 51% -191 Arysta LifeScience Vostok Ltd. Crop protection Russia @1 78% -192 Arysta LifeScience Slovakia S.R.O. Crop protection Slovakia @1 78% -193 Arysta LifeScience Ukraine LLC Crop protection Ukraine @1 78% -194 Arysta LifeScience Global Limited Crop protection U.K. @1 78% -195 Arysta LifeScience Argentina S.A. Crop protection Argentina @1 78% -196 Arysta LifeScience Colombia S.A.S Crop protection Colombia @1 78% -197 Arysta LifeScience CentroAmerica, S.A. Crop protection Guatemala @1 78% -198 Arysta LifeScience Mexico Holding
S.A.de C.VCrop protection Mexico @1 78% -
199 Bioenzymas S.A. de C.V. Crop protection Mexico @1 78% -200 Desarrollos Inmobiliarios Alianza de
Coahuila, S.A. de C.V.Crop protection Mexico @1 78% -
Notes to Consolidated Financial Statements for the year ended March 31, 2019
31. Group information (contd.)

Annual Report 2018-19 | 265
UPL Limited
Notes to Consolidated Financial Statements for the year ended March 31, 2019
Sr No
Name Principal activities Country of incorporation/ Principal place
of business
% Controlling InterestMarch 31,
2019March 31,
2018
201 Omega Agroindustrial, S.A. de C.V. Crop protection Mexico @1 78% -202 Agroquimicos y Semillas, S.A. de C.V. Crop protection Mexico @1 78% -203 Servicios Agricolas Mundiales SA de CV Crop protection Mexico @1 78% -204 Tecno Extractos Vegetales, S.A. de C.V. Crop protection Mexico @1 78% -205 Tesaurus Mexico S.A. de C.V. Crop protection Mexico @1 78% -206 Arysta LifeScience Paraguay S.R.L. Crop protection Paraguay @1 78% -207 Arysta LifeScience Peru S.A.C Crop protection Peru @1 78% -208 Arysta LifeScience Costa Rica SA. Crop protection Costa Rica @1 78% -209 Arysta LifeScience de Guatemala, S.A. Crop protection Guatemala @1 78% -210 Arysta LifeScience S.R.L. Crop protection Bolivia @1 52% -211 Myanmar Arysta LifeScience Co., Ltd. Crop protection Myanmar @1 78% -212 Arysta LifeScience U.K. BRL Limited Crop protection U.K. @1 78% -213 Etec Crop Solutions Limited Crop protection New Zealand @1 78% -214 MacDermid Agricultural Solutions
Australia Pty LtdCrop protection Australia @1 78% -
215 Arvesta Corporation Crop protection USA @1 78% -216 Arysta LifeScience Registrations Great
Britain LtdCrop protection U.K. @1 78% -
217 Agriphar SDN BHD Crop protection Malaysia @1 78% -218 Agriphar de Costa Rica SA Crop protection Costa Rica @1 78% -219 Agriphar de Colombia SAS Crop protection Colombia @1 78% -220 Industrias Agriphar SA Crop protection Guatemala @1 78% -221 Kempton Chemicals (Pty) Ltd Crop protection South Africa @1 78% -222 Agripraza Ltda. Crop protection Portugal @1 78% -223 Arysta LifeScience Corporation
Republica Dominicana, SRLCrop protection Dominican
Rpb@1 78% -
224 Grupo Bioquimico Mexicano Republica Dominicana SA
Crop protection Dominican Rpb
@1 78% -
225 Arysta LifeScience Ecuador S.A. Crop protection Ecuador @1 78% -226 Arvesta Paraguay S.A. Crop protection Paraguay @1 78% -227 Arysta Agroquimicos y Fertilzantes
Uruguay SACrop protection Uruguay @1 78% -
228 Arysta LifeScience U.K. USD-2 Limited Crop protection U.K. @1 78% -229 Veto-Pharma SA Animal Health France @1, #5 78% -230 Wyjolab S.A. Animal Health France @1, #5 78% -231 MacDermid (Nanjing) Chemical Ltd. Crop protection China @1, #1 0% -
@ Subsidiary formed during the year@1 Subsidiary acquired during the year@2 Subsidiary formed during the previous year`@3 Subsidiary acquired during the previous year# During the previous year UPL Limited, Mauritius merged in UPL Corporation Limited, Mauritius.#1 Subsidiary divested during the year.#2 During the previous year, the Group through its step down wholly owned subsidiary, has increased its stake from 51% to 100%#3 During the previous year, the Group through its step down wholly owned subsidiary, has increased its stake from 50% to 100%#4 During the year, Blue Star B.V. was merged into United Phosphorus Holdings B.V.#5 During the year, Veto-Pharma SA and Wyjolab S.A. were merged into Arysta Animal Health SAS#6 Subsidiary divested during the previous year.
31. Group information (contd.)

266 | Annual Report 2018-19
UPL Limited
AssociatesThe Group’s interest in associates are summarised belowSr No
Name Country of incorporation/ Principal place
of business
% equity interestMarch 31,
2019March 31,
2018
1 Weather Risk Management Private Ltd India ## 32% 27%2 Ingen Technologies Private Limited India * *3 Kerala Enviro Infrastructure Limited India 28% 28%4 Polycoat Technologies 2010 Limited Israel ### - 20%5 3SB Produtos Agricolas S.A. Brazil $$$, # 45% 49%6 Sinagro Produtos Agropecuarios S.A. Brazil $$$, # 45% 49%7 Seara Comercial Agricola Ltda. Brazil ** **8 Serra Bonita Sementes S.A. Brazil $$ 33% 33%9 Bioplanta Nutricao Vegetal,Industria e Comercio S.A. Brazil *** ***10 Chemisynth (Vapi) Limited India 30% 30%11 Universal Pestochem (Industries) Limited India 44% 44%12 Agri Fokus (Pty) Ltd. South Africa $ 25% -13 Novon Retail Company (Pty) Ltd. South Africa $ 25% -14 Agronamic (Pty) Ltd. South Africa $ 28% -15 Novon Protecta (Pty) Ltd South Africa $ 25% -16 Silvix Forestry (Pty) Ltd. South Africa $ 25% -17 Nexus AG (Pty) Ltd South Africa $ 25% -18 Dalian Advanced Chemical Co.Ltd. China $ 21% -19 Société des Produits Industriels et Agricoles Senegal $ 32% -20 CGNS Limited U.K. $ 25% -21 Callitogo SA Togo $ 35% -
$ Investment in Associates during the year.* This is 100% step-down subsidiary of Weather Risk Management Private Ltd.** This is 51% step-down subsidiary of Sinagro Produtos Agropecuarios S.A.*** These are 33.33% Joint ventures of Sinagro Produtos Agropecuarios S.A.$$ Investment made during the previous year ended 2017-18$$$ 5% stake divested during the year## Additional 5% stake acquired during the year# Additional 9% stake acquired during the previous year### Divested during the year
Joint arrangement in which the group is a venturerThe Group’s interest in joint ventures is summarised belowSr No
Name Country of incorporation/ Principal
place of business
% equity interestMarch 31,
2019March 31,
20181 Hodagaya UPL Co. Limited Japan 40% 40%2 Longreach Plant Breeders Management Pty Limited Australia 70% 70%3 United Phosphorus (Bangladesh) Limited Bangladesh 50% 50%
32. Material partly owned subsidiaryFinancial information of subsidiary that have material non-controlling interests is provided below:Proportion of equity interest held by non-controlling interests(NCI):
Country of incorporation/ Principal
place of business
March 31, 2019
March 31, 2018
UPL Corporation Limited Mauritius 22% 0%
Notes to Consolidated Financial Statements for the year ended March 31, 2019
31. Group information (contd.)
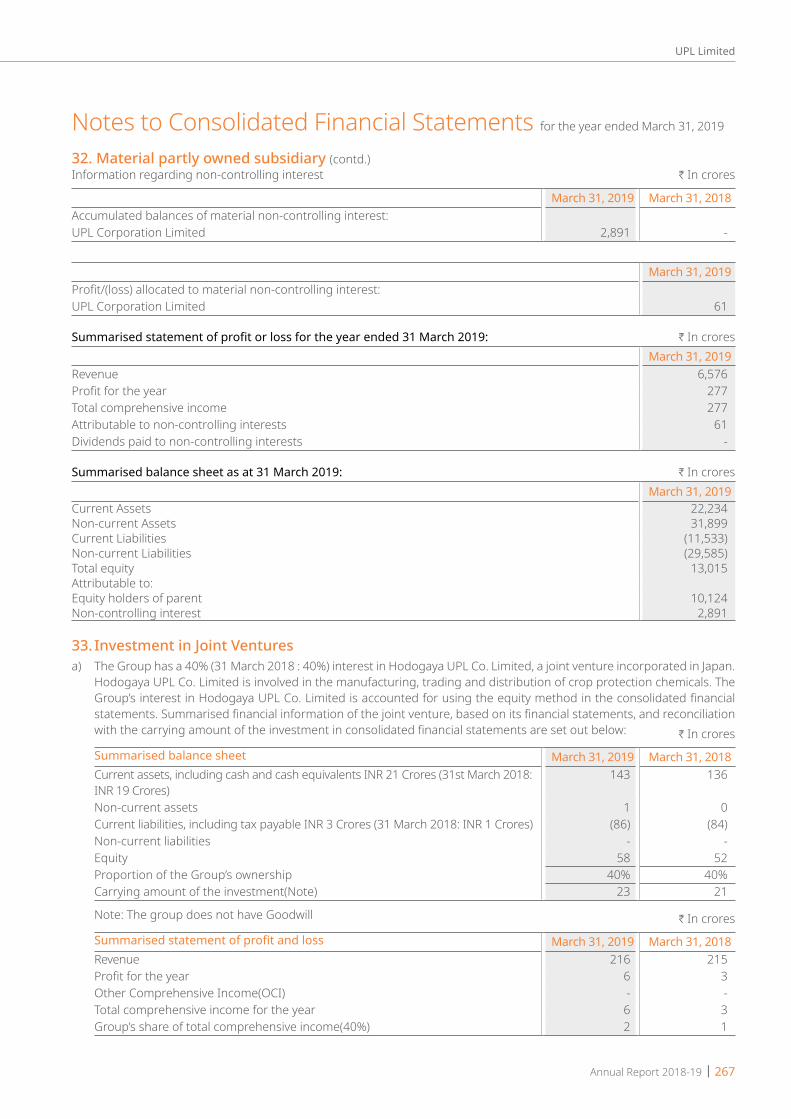
Annual Report 2018-19 | 267
UPL Limited
Information regarding non-controlling interest H In crores
March 31, 2019 March 31, 2018Accumulated balances of material non-controlling interest:UPL Corporation Limited 2,891 -
March 31, 2019Profit/(loss) allocated to material non-controlling interest:UPL Corporation Limited 61
Summarised statement of profit or loss for the year ended 31 March 2019: H In croresMarch 31, 2019
Revenue 6,576 Profit for the year 277 Total comprehensive income 277 Attributable to non-controlling interests 61 Dividends paid to non-controlling interests -
Summarised balance sheet as at 31 March 2019: H In croresMarch 31, 2019
Current Assets 22,234 Non-current Assets 31,899 Current Liabilities (11,533)Non-current Liabilities (29,585)Total equity 13,015 Attributable to: Equity holders of parent 10,124 Non-controlling interest 2,891
33. Investment in Joint Venturesa) The Group has a 40% (31 March 2018 : 40%) interest in Hodogaya UPL Co. Limited, a joint venture incorporated in Japan.
Hodogaya UPL Co. Limited is involved in the manufacturing, trading and distribution of crop protection chemicals. The Group’s interest in Hodogaya UPL Co. Limited is accounted for using the equity method in the consolidated financial statements. Summarised financial information of the joint venture, based on its financial statements, and reconciliation with the carrying amount of the investment in consolidated financial statements are set out below: H In crores
Summarised balance sheet March 31, 2019 March 31, 2018Current assets, including cash and cash equivalents INR 21 Crores (31st March 2018: INR 19 Crores)
143 136
Non-current assets 1 0Current liabilities, including tax payable INR 3 Crores (31 March 2018: INR 1 Crores) (86) (84)Non-current liabilities - -Equity 58 52Proportion of the Group’s ownership 40% 40%Carrying amount of the investment(Note) 23 21
Note: The group does not have Goodwill H In crores
Summarised statement of profit and loss March 31, 2019 March 31, 2018Revenue 216 215 Profit for the year 6 3 Other Comprehensive Income(OCI) - - Total comprehensive income for the year 6 3 Group’s share of total comprehensive income(40%) 2 1
Notes to Consolidated Financial Statements for the year ended March 31, 2019
32. Material partly owned subsidiary (contd.)
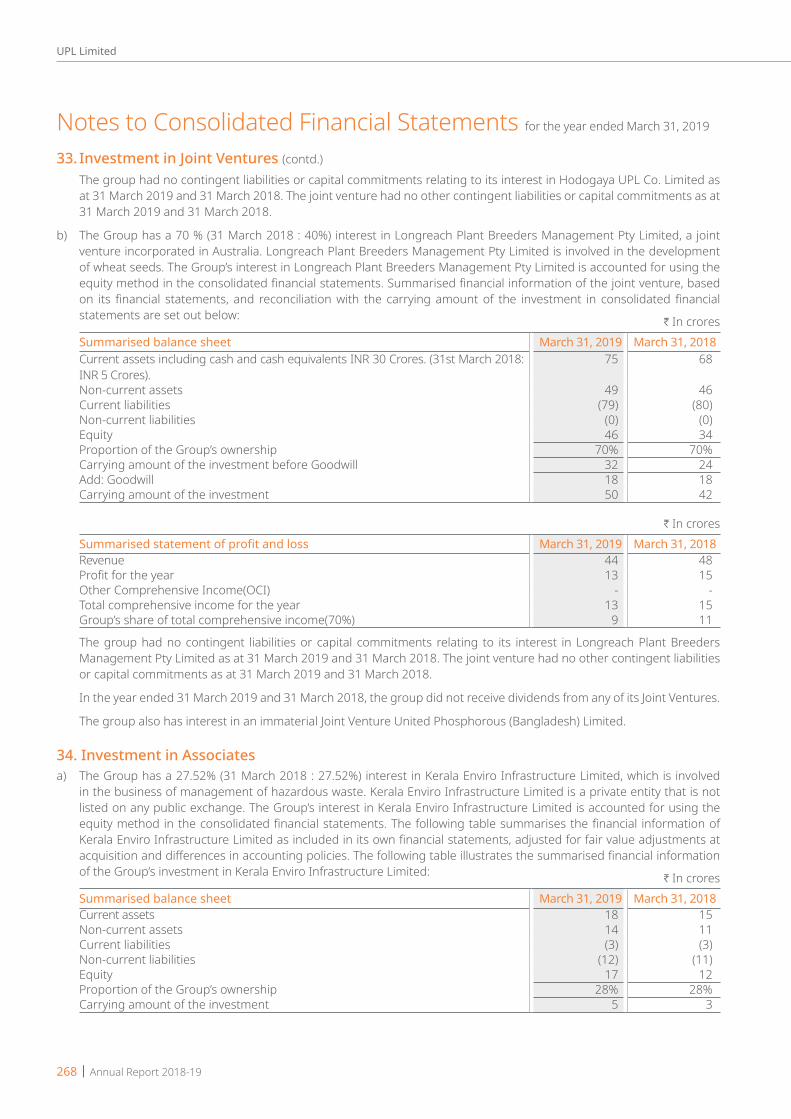
268 | Annual Report 2018-19
UPL Limited
The group had no contingent liabilities or capital commitments relating to its interest in Hodogaya UPL Co. Limited as at 31 March 2019 and 31 March 2018. The joint venture had no other contingent liabilities or capital commitments as at 31 March 2019 and 31 March 2018.
b) The Group has a 70 % (31 March 2018 : 40%) interest in Longreach Plant Breeders Management Pty Limited, a joint venture incorporated in Australia. Longreach Plant Breeders Management Pty Limited is involved in the development of wheat seeds. The Group’s interest in Longreach Plant Breeders Management Pty Limited is accounted for using the equity method in the consolidated financial statements. Summarised financial information of the joint venture, based on its financial statements, and reconciliation with the carrying amount of the investment in consolidated financial statements are set out below:
H In croresSummarised balance sheet March 31, 2019 March 31, 2018Current assets including cash and cash equivalents INR 30 Crores. (31st March 2018: INR 5 Crores).
75 68
Non-current assets 49 46Current liabilities (79) (80)Non-current liabilities (0) (0)Equity 46 34Proportion of the Group’s ownership 70% 70%Carrying amount of the investment before Goodwill 32 24Add: Goodwill 18 18Carrying amount of the investment 50 42
H In croresSummarised statement of profit and loss March 31, 2019 March 31, 2018Revenue 44 48 Profit for the year 13 15 Other Comprehensive Income(OCI) - - Total comprehensive income for the year 13 15 Group’s share of total comprehensive income(70%) 9 11
The group had no contingent liabilities or capital commitments relating to its interest in Longreach Plant Breeders Management Pty Limited as at 31 March 2019 and 31 March 2018. The joint venture had no other contingent liabilities or capital commitments as at 31 March 2019 and 31 March 2018.
In the year ended 31 March 2019 and 31 March 2018, the group did not receive dividends from any of its Joint Ventures.
The group also has interest in an immaterial Joint Venture United Phosphorous (Bangladesh) Limited.
34. Investment in Associatesa) The Group has a 27.52% (31 March 2018 : 27.52%) interest in Kerala Enviro Infrastructure Limited, which is involved
in the business of management of hazardous waste. Kerala Enviro Infrastructure Limited is a private entity that is not listed on any public exchange. The Group’s interest in Kerala Enviro Infrastructure Limited is accounted for using the equity method in the consolidated financial statements. The following table summarises the financial information of Kerala Enviro Infrastructure Limited as included in its own financial statements, adjusted for fair value adjustments at acquisition and differences in accounting policies. The following table illustrates the summarised financial information of the Group’s investment in Kerala Enviro Infrastructure Limited:
H In croresSummarised balance sheet March 31, 2019 March 31, 2018Current assets 18 15Non-current assets 14 11Current liabilities (3) (3)Non-current liabilities (12) (11)Equity 17 12Proportion of the Group’s ownership 28% 28%Carrying amount of the investment 5 3
Notes to Consolidated Financial Statements for the year ended March 31, 2019
33. Investment in Joint Ventures (contd.)
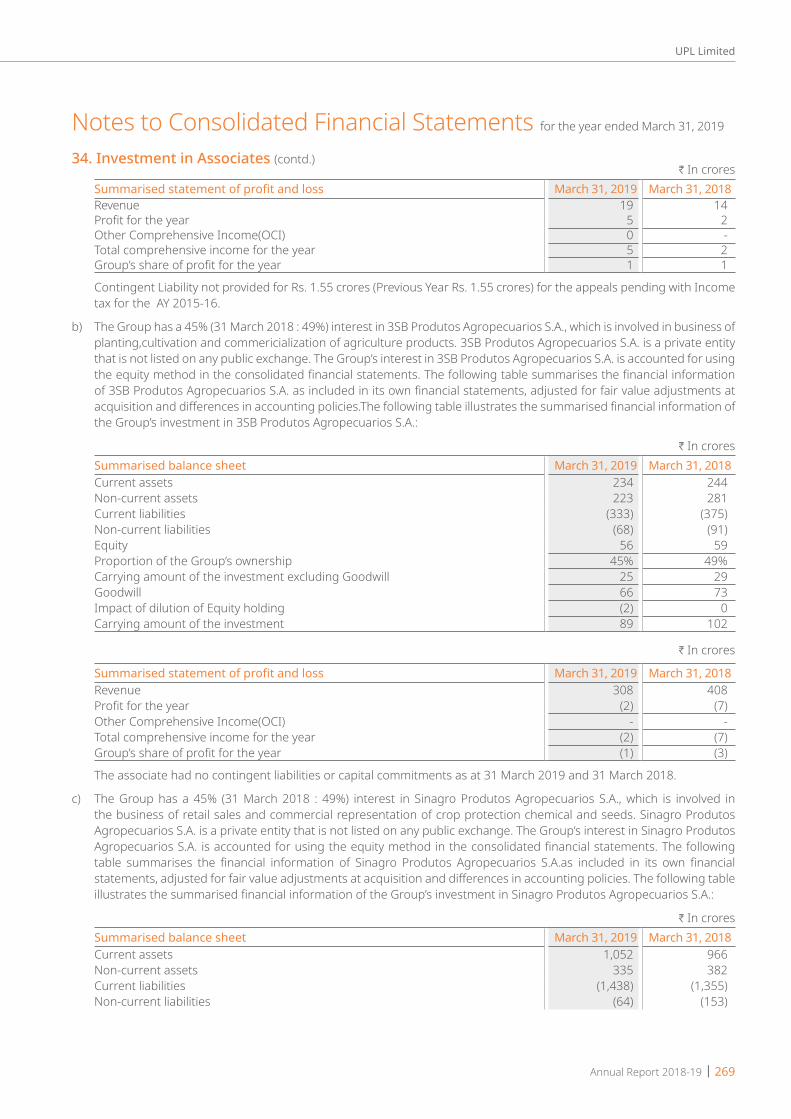
Annual Report 2018-19 | 269
UPL Limited
H In croresSummarised statement of profit and loss March 31, 2019 March 31, 2018Revenue 19 14 Profit for the year 5 2 Other Comprehensive Income(OCI) 0 - Total comprehensive income for the year 5 2 Group’s share of profit for the year 1 1
Contingent Liability not provided for Rs. 1.55 crores (Previous Year Rs. 1.55 crores) for the appeals pending with Income tax for the AY 2015-16.
b) The Group has a 45% (31 March 2018 : 49%) interest in 3SB Produtos Agropecuarios S.A., which is involved in business of planting,cultivation and commericialization of agriculture products. 3SB Produtos Agropecuarios S.A. is a private entity that is not listed on any public exchange. The Group’s interest in 3SB Produtos Agropecuarios S.A. is accounted for using the equity method in the consolidated financial statements. The following table summarises the financial information of 3SB Produtos Agropecuarios S.A. as included in its own financial statements, adjusted for fair value adjustments at acquisition and differences in accounting policies.The following table illustrates the summarised financial information of the Group’s investment in 3SB Produtos Agropecuarios S.A.:
H In croresSummarised balance sheet March 31, 2019 March 31, 2018Current assets 234 244 Non-current assets 223 281 Current liabilities (333) (375)Non-current liabilities (68) (91)Equity 56 59 Proportion of the Group’s ownership 45% 49%Carrying amount of the investment excluding Goodwill 25 29 Goodwill 66 73 Impact of dilution of Equity holding (2) 0 Carrying amount of the investment 89 102
H In crores
Summarised statement of profit and loss March 31, 2019 March 31, 2018Revenue 308 408Profit for the year (2) (7)Other Comprehensive Income(OCI) - -Total comprehensive income for the year (2) (7)Group’s share of profit for the year (1) (3)
The associate had no contingent liabilities or capital commitments as at 31 March 2019 and 31 March 2018.
c) The Group has a 45% (31 March 2018 : 49%) interest in Sinagro Produtos Agropecuarios S.A., which is involved in the business of retail sales and commercial representation of crop protection chemical and seeds. Sinagro Produtos Agropecuarios S.A. is a private entity that is not listed on any public exchange. The Group’s interest in Sinagro Produtos Agropecuarios S.A. is accounted for using the equity method in the consolidated financial statements. The following table summarises the financial information of Sinagro Produtos Agropecuarios S.A.as included in its own financial statements, adjusted for fair value adjustments at acquisition and differences in accounting policies. The following table illustrates the summarised financial information of the Group’s investment in Sinagro Produtos Agropecuarios S.A.:
H In croresSummarised balance sheet March 31, 2019 March 31, 2018Current assets 1,052 966Non-current assets 335 382Current liabilities (1,438) (1,355)Non-current liabilities (64) (153)
Notes to Consolidated Financial Statements for the year ended March 31, 2019
34. Investment in Associates (contd.)
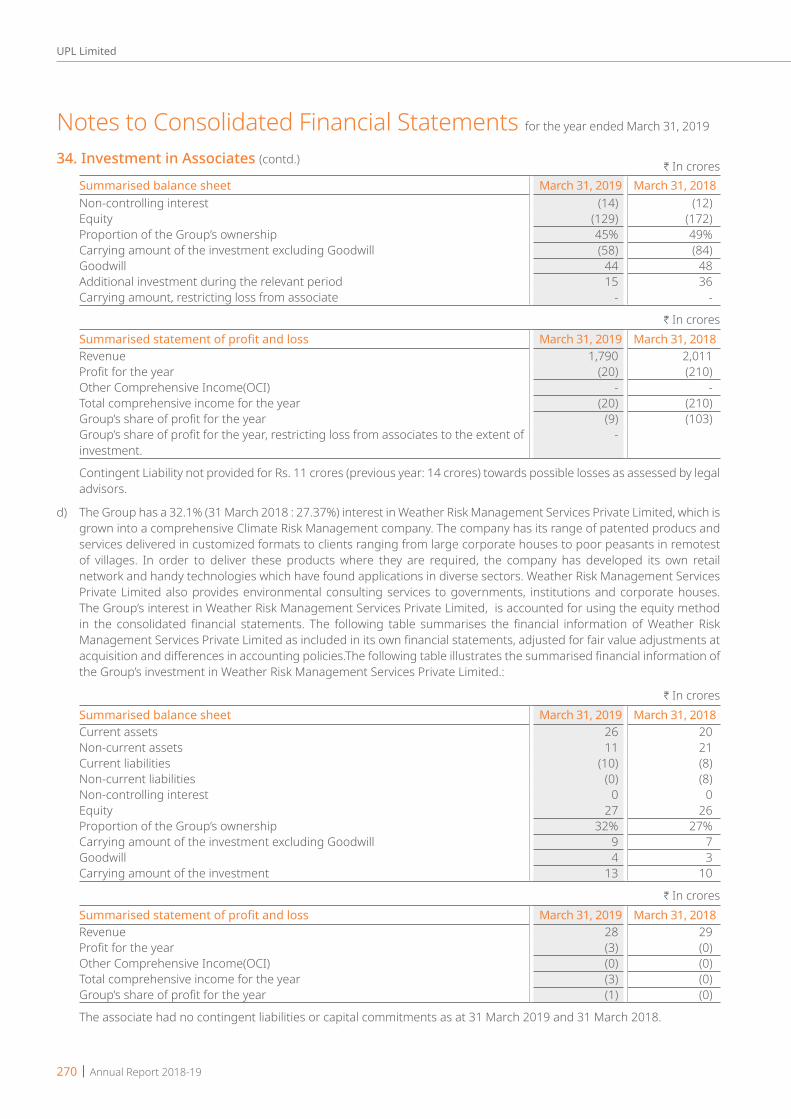
270 | Annual Report 2018-19
UPL Limited
Summarised balance sheet March 31, 2019 March 31, 2018Non-controlling interest (14) (12)Equity (129) (172)Proportion of the Group’s ownership 45% 49%Carrying amount of the investment excluding Goodwill (58) (84)Goodwill 44 48Additional investment during the relevant period 15 36Carrying amount, restricting loss from associate - -
H In croresSummarised statement of profit and loss March 31, 2019 March 31, 2018Revenue 1,790 2,011Profit for the year (20) (210)Other Comprehensive Income(OCI) - -Total comprehensive income for the year (20) (210)Group’s share of profit for the year (9) (103)Group’s share of profit for the year, restricting loss from associates to the extent of investment.
-
Contingent Liability not provided for Rs. 11 crores (previous year: 14 crores) towards possible losses as assessed by legal advisors.
d) The Group has a 32.1% (31 March 2018 : 27.37%) interest in Weather Risk Management Services Private Limited, which is grown into a comprehensive Climate Risk Management company. The company has its range of patented producs and services delivered in customized formats to clients ranging from large corporate houses to poor peasants in remotest of villages. In order to deliver these products where they are required, the company has developed its own retail network and handy technologies which have found applications in diverse sectors. Weather Risk Management Services Private Limited also provides environmental consulting services to governments, institutions and corporate houses. The Group’s interest in Weather Risk Management Services Private Limited, is accounted for using the equity method in the consolidated financial statements. The following table summarises the financial information of Weather Risk Management Services Private Limited as included in its own financial statements, adjusted for fair value adjustments at acquisition and differences in accounting policies.The following table illustrates the summarised financial information of the Group’s investment in Weather Risk Management Services Private Limited.:
H In croresSummarised balance sheet March 31, 2019 March 31, 2018Current assets 26 20Non-current assets 11 21Current liabilities (10) (8)Non-current liabilities (0) (8)Non-controlling interest 0 0Equity 27 26Proportion of the Group’s ownership 32% 27%Carrying amount of the investment excluding Goodwill 9 7Goodwill 4 3Carrying amount of the investment 13 10
H In croresSummarised statement of profit and loss March 31, 2019 March 31, 2018Revenue 28 29 Profit for the year (3) (0)Other Comprehensive Income(OCI) (0) (0)Total comprehensive income for the year (3) (0)Group’s share of profit for the year (1) (0)
The associate had no contingent liabilities or capital commitments as at 31 March 2019 and 31 March 2018.
Notes to Consolidated Financial Statements for the year ended March 31, 2019
H In crores34. Investment in Associates (contd.)
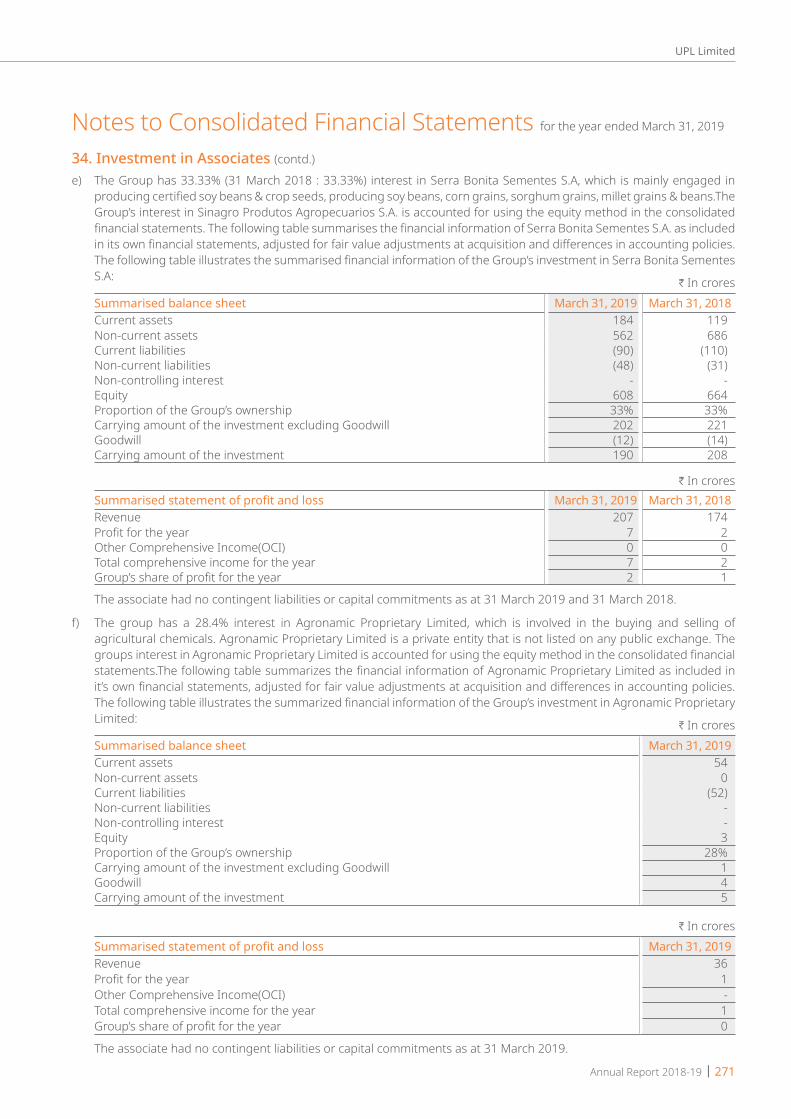
Annual Report 2018-19 | 271
UPL Limited
e) The Group has 33.33% (31 March 2018 : 33.33%) interest in Serra Bonita Sementes S.A, which is mainly engaged in producing certified soy beans & crop seeds, producing soy beans, corn grains, sorghum grains, millet grains & beans.The Group’s interest in Sinagro Produtos Agropecuarios S.A. is accounted for using the equity method in the consolidated financial statements. The following table summarises the financial information of Serra Bonita Sementes S.A. as included in its own financial statements, adjusted for fair value adjustments at acquisition and differences in accounting policies. The following table illustrates the summarised financial information of the Group’s investment in Serra Bonita Sementes S.A:
H In croresSummarised balance sheet March 31, 2019 March 31, 2018Current assets 184 119Non-current assets 562 686Current liabilities (90) (110)Non-current liabilities (48) (31)Non-controlling interest - -Equity 608 664Proportion of the Group’s ownership 33% 33%Carrying amount of the investment excluding Goodwill 202 221Goodwill (12) (14)Carrying amount of the investment 190 208
H In croresSummarised statement of profit and loss March 31, 2019 March 31, 2018Revenue 207 174Profit for the year 7 2Other Comprehensive Income(OCI) 0 0Total comprehensive income for the year 7 2Group’s share of profit for the year 2 1
The associate had no contingent liabilities or capital commitments as at 31 March 2019 and 31 March 2018.
f) The group has a 28.4% interest in Agronamic Proprietary Limited, which is involved in the buying and selling of agricultural chemicals. Agronamic Proprietary Limited is a private entity that is not listed on any public exchange. The groups interest in Agronamic Proprietary Limited is accounted for using the equity method in the consolidated financial statements.The following table summarizes the financial information of Agronamic Proprietary Limited as included in it’s own financial statements, adjusted for fair value adjustments at acquisition and differences in accounting policies. The following table illustrates the summarized financial information of the Group’s investment in Agronamic Proprietary Limited:
H In croresSummarised balance sheet March 31, 2019Current assets 54Non-current assets 0Current liabilities (52)Non-current liabilities -Non-controlling interest -Equity 3Proportion of the Group’s ownership 28%Carrying amount of the investment excluding Goodwill 1Goodwill 4Carrying amount of the investment 5
H In croresSummarised statement of profit and loss March 31, 2019Revenue 36Profit for the year 1Other Comprehensive Income(OCI) -Total comprehensive income for the year 1Group’s share of profit for the year 0
The associate had no contingent liabilities or capital commitments as at 31 March 2019.
Notes to Consolidated Financial Statements for the year ended March 31, 2019
34. Investment in Associates (contd.)

272 | Annual Report 2018-19
UPL Limited
g) The group has a 25.1% interest in Silvix Forestry Proprietary Limited, which is involved in the distribution of chemicals. Silvix Forestry Proprietary Limited is a private entity that is not listed on any public exchange. The groups interest in Silvix Forestry Proprietary Limited is accounted for using the equity method in the consolidated financial statements.The following table summarizes the financial information of Silvix Forestry Proprietary Limited as included in it’s own financial statements, adjusted for fair value adjustments at acquisition and differences in accounting policies. The following table illustrates the summarized financial information of the Group’s investment in Silvix Forestry Proprietary Limited:
H In croresSummarised balance sheet March 31, 2019Current assets 10 Non-current assets 0 Current liabilities (8)Non-current liabilities - Non-controlling interest - Equity 1 Proportion of the Group’s ownership 25%Carrying amount of the investment excluding Goodwill 0 Goodwill 0 Carrying amount of the investment 0
H In croresSummarised statement of profit and loss March 31, 2019Revenue 5Profit for the year 0Other Comprehensive Income(OCI) 0Total comprehensive income for the year 0Group’s share of profit for the year 0
The associate had no contingent liabilities or capital commitments as at 31 March 2019.
h) The group has a 25.1% interest in Agrifokus Proprietary Limited, which is involved in the trading chemicals, insecticides and herbicides. Agrifokus Proprietary Limited is a private entity that is not listed on any public exchange. The groups interest in Agrifokus Proprietary Limited is accounted for using the equity method in the consolidated financial statements. The following table summarizes the financial information of Agrifokus Proprietary Limited as included in it’s own financial statements, adjusted for fair value adjustments at acquisition and differences in accounting policies. The following table illustrates the summarized financial information of the Group’s investment in Agrifokus Proprietary Limited:
H In croresSummarised balance sheet March 31, 2019Current assets 93Non-current assets 2Current liabilities (62)Non-current liabilities 0Non-controlling interest -Equity 33Proportion of the Group’s ownership 25%Carrying amount of the investment excluding Goodwill 8Goodwill (5)Carrying amount of the investment 4
H In crores
Summarised statement of profit and loss March 31, 2019Revenue 9Profit for the year 1Other Comprehensive Income(OCI) 0Total comprehensive income for the year 1Group’s share of profit for the year 0
The associate had no contingent liabilities or capital commitments as at 31 March 2019.
Notes to Consolidated Financial Statements for the year ended March 31, 2019
34. Investment in Associates (contd.)
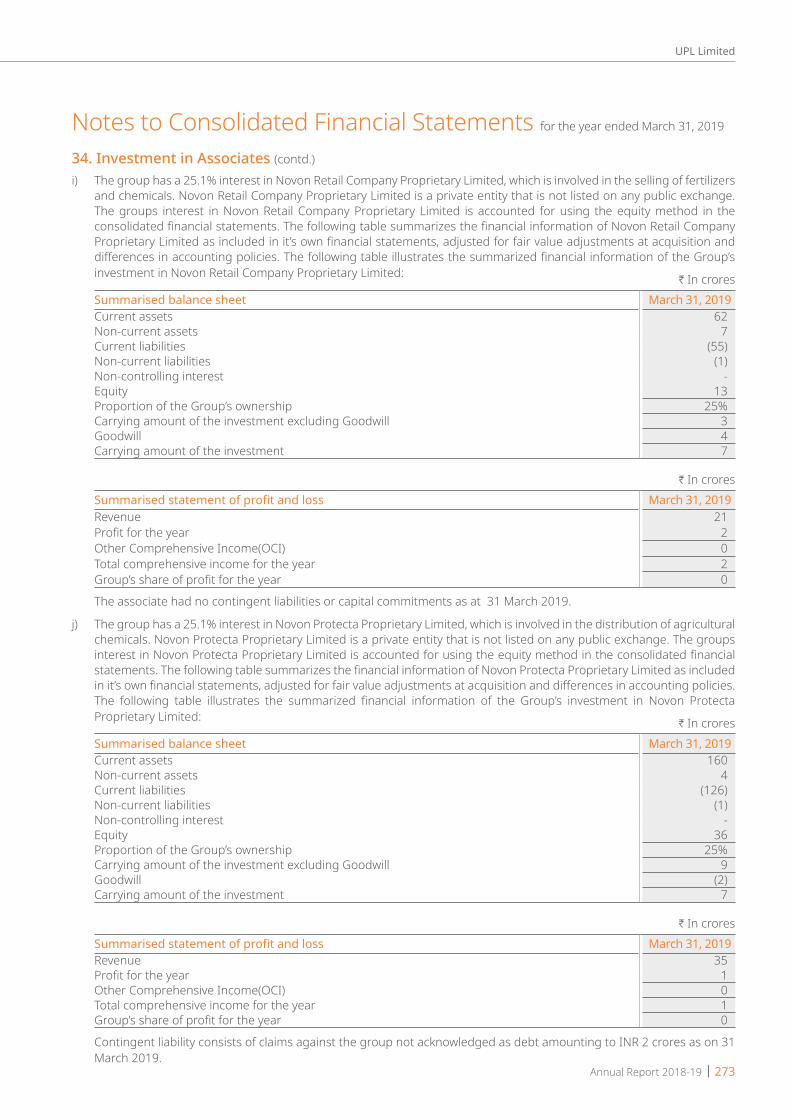
Annual Report 2018-19 | 273
UPL Limited
i) The group has a 25.1% interest in Novon Retail Company Proprietary Limited, which is involved in the selling of fertilizers and chemicals. Novon Retail Company Proprietary Limited is a private entity that is not listed on any public exchange. The groups interest in Novon Retail Company Proprietary Limited is accounted for using the equity method in the consolidated financial statements. The following table summarizes the financial information of Novon Retail Company Proprietary Limited as included in it’s own financial statements, adjusted for fair value adjustments at acquisition and differences in accounting policies. The following table illustrates the summarized financial information of the Group’s investment in Novon Retail Company Proprietary Limited:
H In croresSummarised balance sheet March 31, 2019Current assets 62 Non-current assets 7 Current liabilities (55)Non-current liabilities (1)Non-controlling interest - Equity 13 Proportion of the Group’s ownership 25%Carrying amount of the investment excluding Goodwill 3 Goodwill 4 Carrying amount of the investment 7
H In crores
Summarised statement of profit and loss March 31, 2019Revenue 21Profit for the year 2Other Comprehensive Income(OCI) 0Total comprehensive income for the year 2Group’s share of profit for the year 0
The associate had no contingent liabilities or capital commitments as at 31 March 2019.
j) The group has a 25.1% interest in Novon Protecta Proprietary Limited, which is involved in the distribution of agricultural chemicals. Novon Protecta Proprietary Limited is a private entity that is not listed on any public exchange. The groups interest in Novon Protecta Proprietary Limited is accounted for using the equity method in the consolidated financial statements. The following table summarizes the financial information of Novon Protecta Proprietary Limited as included in it’s own financial statements, adjusted for fair value adjustments at acquisition and differences in accounting policies. The following table illustrates the summarized financial information of the Group’s investment in Novon Protecta Proprietary Limited:
H In croresSummarised balance sheet March 31, 2019Current assets 160 Non-current assets 4 Current liabilities (126)Non-current liabilities (1)Non-controlling interest - Equity 36 Proportion of the Group’s ownership 25%Carrying amount of the investment excluding Goodwill 9 Goodwill (2)Carrying amount of the investment 7
H In crores
Summarised statement of profit and loss March 31, 2019Revenue 35Profit for the year 1Other Comprehensive Income(OCI) 0Total comprehensive income for the year 1Group’s share of profit for the year 0
Contingent liability consists of claims against the group not acknowledged as debt amounting to INR 2 crores as on 31 March 2019.
Notes to Consolidated Financial Statements for the year ended March 31, 2019
34. Investment in Associates (contd.)

274 | Annual Report 2018-19
UPL Limited
k) The group has a 25.1% interest in NexusAG Proprietary Limited, which is involved in the wholesale of agricultural chemicals for crop protection and fertilizer products for plant nutrition. NexusAG Proprietary Limited is a private entity that is not listed on any public exchange. The groups interest in NexusAG Proprietary Limited is accounted for using the equity method in the consolidated financial statements. The following table summarizes the financial information of NexusAG Proprietary Limited as included in it’s own financial statements, adjusted for fair value adjustments at acquisition and differences in accounting policies. The following table illustrates the summarized financial information of the Group’s investment in NexusAG Proprietary Limited:
H In croresSummarised balance sheet March 31, 2019Current assets 120 Non-current assets 18 Current liabilities (110)Non-current liabilities (6)Non-controlling interest - Equity 22 Proportion of the Group’s ownership 25%Carrying amount of the investment excluding Goodwill 6 Goodwill 4 Carrying amount of the investment 10
H In crores
Summarised statement of profit and loss March 31, 2019Revenue 57Profit for the year 1Other Comprehensive Income(OCI) 0Total comprehensive income for the year 1Group’s share of profit for the year 0
The associate had no contingent liabilities or capital commitments as at 31 March 2019.
l) The group has a 21% interest in Dalian Advanced Chemical Co.Ltd.(DAC) which is involved in the formulation of Chloropicrin. DAC is private entity that is not listed on any public exchange. DAC is accounted for using the equity method in the consolidated financial statements. The following table summarises the financial information of DAC as included in its own financials statements, adjusted for faire value adjustments at acquisition and differences in accounting policies. The following table illustrates the summarised financial information of the Group’s investment in DAC.
H In croresSummarised balance sheet March 31, 2019Current assets 0Non-current assets 2Current liabilities (0)Non-current liabilities -Non-controlling interest -Equity 3Proportion of the Group’s ownership 21%Carrying amount of the investment excluding Goodwill 1Goodwill -Carrying amount of the investment 1
H In crores
Summarised statement of profit and loss March 31, 2019Revenue 0Profit for the year (0)Other Comprehensive Income(OCI) -Total comprehensive income for the year (0)Group’s share of profit for the year (0)
The associate had no contingent liabilities or capital commitments as at 31 March 2019.
Notes to Consolidated Financial Statements for the year ended March 31, 2019
34. Investment in Associates (contd.)
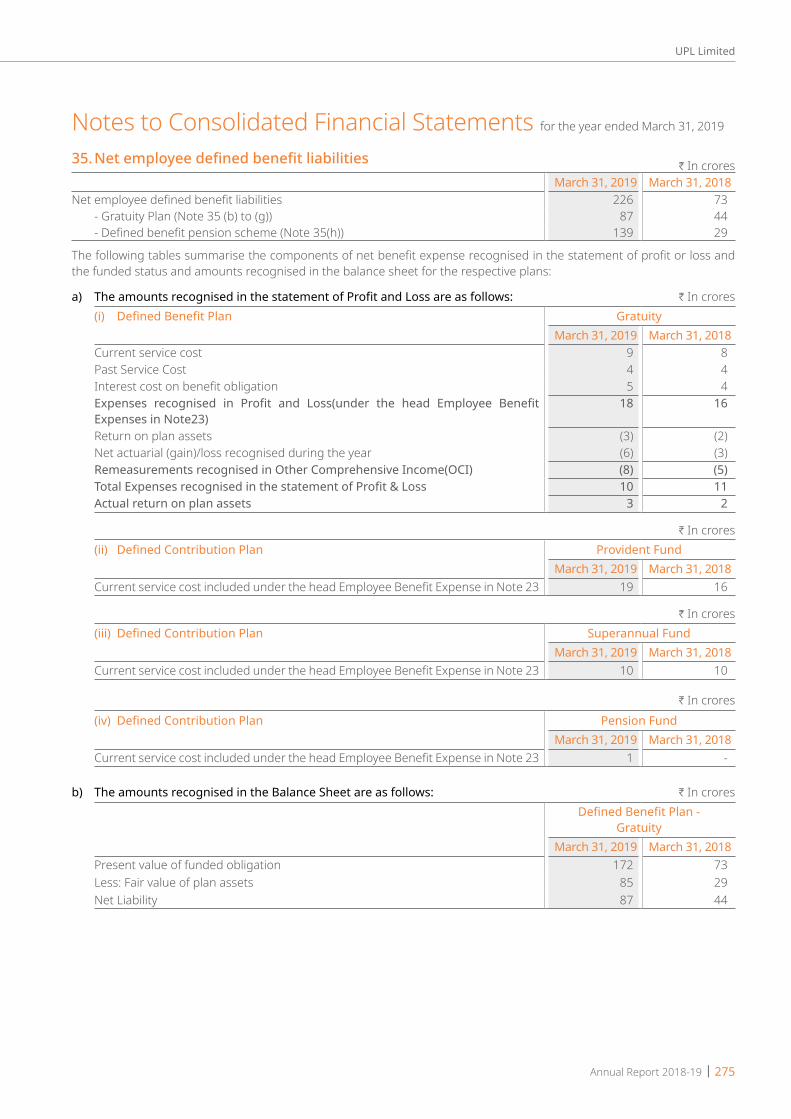
Annual Report 2018-19 | 275
UPL Limited
35.NetemployeedefinedbenefitliabilitiesH In crores
March 31, 2019 March 31, 2018Net employee defined benefit liabilities 226 73 - Gratuity Plan (Note 35 (b) to (g)) 87 44 - Defined benefit pension scheme (Note 35(h)) 139 29
The following tables summarise the components of net benefit expense recognised in the statement of profit or loss and the funded status and amounts recognised in the balance sheet for the respective plans:
a) The amounts recognised in the statement of Profit and Loss are as follows: H In crores(i) Defined Benefit Plan Gratuity
March 31, 2019 March 31, 2018Current service cost 9 8Past Service Cost 4 4Interest cost on benefit obligation 5 4Expenses recognised in Profit and Loss(under the head Employee Benefit Expenses in Note23)
18 16
Return on plan assets (3) (2)Net actuarial (gain)/loss recognised during the year (6) (3)Remeasurements recognised in Other Comprehensive Income(OCI) (8) (5)Total Expenses recognised in the statement of Profit & Loss 10 11Actual return on plan assets 3 2
H In crores(ii) Defined Contribution Plan Provident Fund
March 31, 2019 March 31, 2018Current service cost included under the head Employee Benefit Expense in Note 23 19 16
H In crores(iii) Defined Contribution Plan Superannual Fund
March 31, 2019 March 31, 2018Current service cost included under the head Employee Benefit Expense in Note 23 10 10
H In crores(iv) Defined Contribution Plan Pension Fund
March 31, 2019 March 31, 2018Current service cost included under the head Employee Benefit Expense in Note 23 1 -
b) The amounts recognised in the Balance Sheet are as follows: H In croresDefined Benefit Plan -
GratuityMarch 31, 2019 March 31, 2018
Present value of funded obligation 172 73 Less: Fair value of plan assets 85 29 Net Liability 87 44
Notes to Consolidated Financial Statements for the year ended March 31, 2019

276 | Annual Report 2018-19
UPL Limited
c) Changes in the present value of the defined benefit obligation representing reconciliation of opening and closing balance thereof are as follows:
H In croresGratuity
March 31, 2019 March 31, 2018Opening defined benefit obligation 73 63 Defined benefit obligation on account of acquisition of Arysta Life Science and its subsidiaries
127 -
Interest cost 5 5 Current service cost 9 9 Benefits paid (7) (4)Actuarial changes arising from changes in financial assumption (6) (3)Past service cost (6) 0 Exchange difference (23) 3 Closing defined benefit obligation 172 73
d) Changes in the fair value of plan assets are as follows: H In croresGratuity
March 31, 2019 March 31, 2018Opening fair value of plan assets 29 28 Fair Value of plan assets on account of acquisition of Arysta Life Science and its subsidiaries
54 -
Return on plan assets 2 2 Actuarial changes arising from changes in financial assumption (1) (1)Closing fair value of plan assets 85 29
e) Expected contribution to defined benefit plan for the year H In croresGratuity
March 31, 2019 March 31, 2018 27 23
f) The major categories of plan assets as a percentage of the fair value of total plan assets are as follows:Gratuity
March 31, 2019 %
March 31, 2018 %
Investments with insurer under: Funds managed by insurer 100 100
g) The principal actuarial assumptions at the Balance Sheet date. H In croresMarch 31, 2019 March 31, 2018
Discount rate 2.80%-7.70% 2.75 - 7.29%Return on plan assets 2.80%-7.70% 6.85 - 7.29%Mortality Rate Indian Assured Lives Mortality
(2006-08) Ult. and Indonesia - III (2011)
Indian Assured Lives Mortality (2006-08) Ult. and Indonesia - III
(2011)Annual increase in salary costs 7% 8%Attriation rate 8% 8%
A quantitative sensitivity analysis for significant assumption as at 31 March 2018 is as shown below: Assumptions H In crores
Sensitivity Level 1% increase 1% decreaseImpact on defined benefit obligationDiscount rate (2) 4 Future salary increases 4 (2)Withdrawal rate 1 1
Notes to Consolidated Financial Statements for the year ended March 31, 2019
35.Netemployeedefinedbenefitliabilities(contd.)
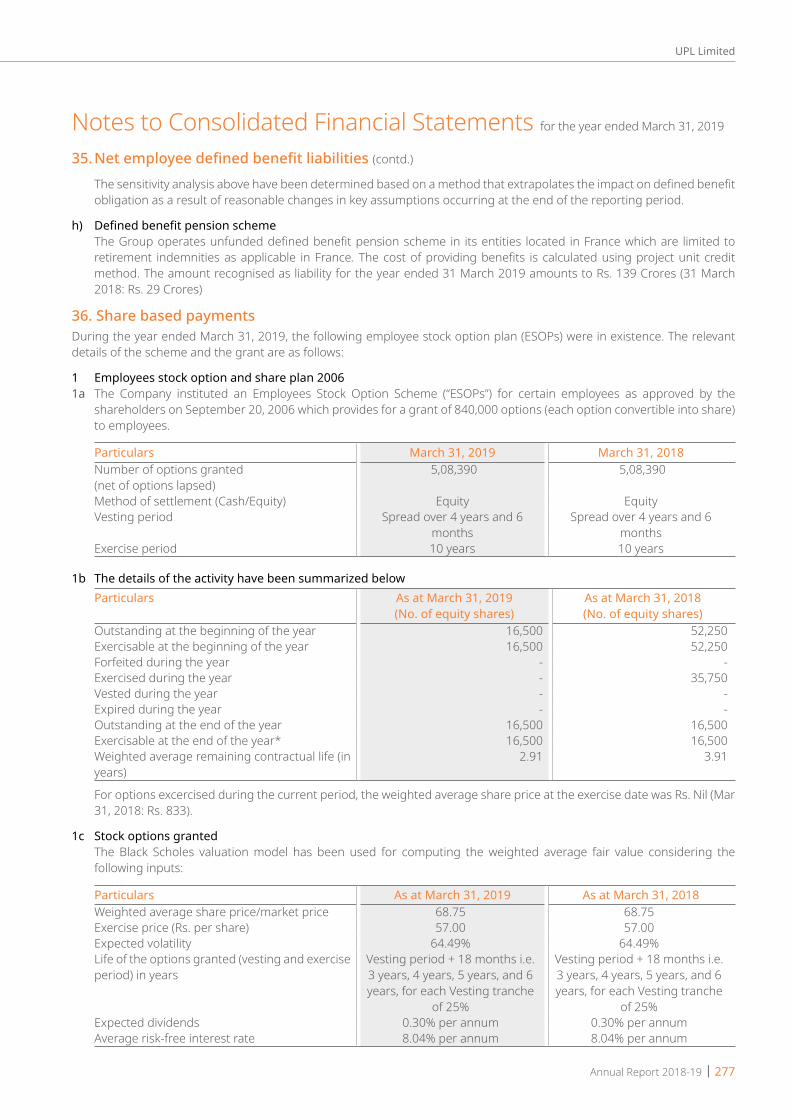
Annual Report 2018-19 | 277
UPL Limited
The sensitivity analysis above have been determined based on a method that extrapolates the impact on defined benefit obligation as a result of reasonable changes in key assumptions occurring at the end of the reporting period.
h) Defined benefit pension scheme The Group operates unfunded defined benefit pension scheme in its entities located in France which are limited to
retirement indemnities as applicable in France. The cost of providing benefits is calculated using project unit credit method. The amount recognised as liability for the year ended 31 March 2019 amounts to Rs. 139 Crores (31 March 2018: Rs. 29 Crores)
36. Share based paymentsDuring the year ended March 31, 2019, the following employee stock option plan (ESOPs) were in existence. The relevant details of the scheme and the grant are as follows:
1 Employees stock option and share plan 20061a The Company instituted an Employees Stock Option Scheme (“ESOPs”) for certain employees as approved by the
shareholders on September 20, 2006 which provides for a grant of 840,000 options (each option convertible into share) to employees.
Particulars March 31, 2019 March 31, 2018Number of options granted (net of options lapsed)
5,08,390 5,08,390
Method of settlement (Cash/Equity) Equity EquityVesting period Spread over 4 years and 6
monthsSpread over 4 years and 6
monthsExercise period 10 years 10 years
1b The details of the activity have been summarized belowParticulars As at March 31, 2019
(No. of equity shares)As at March 31, 2018(No. of equity shares)
Outstanding at the beginning of the year 16,500 52,250Exercisable at the beginning of the year 16,500 52,250Forfeited during the year - -Exercised during the year - 35,750Vested during the year - -Expired during the year - -Outstanding at the end of the year 16,500 16,500Exercisable at the end of the year* 16,500 16,500Weighted average remaining contractual life (in years)
2.91 3.91
For options excercised during the current period, the weighted average share price at the exercise date was Rs. Nil (Mar 31, 2018: Rs. 833).
1c Stock options granted The Black Scholes valuation model has been used for computing the weighted average fair value considering the
following inputs:
Particulars As at March 31, 2019 As at March 31, 2018Weighted average share price/market price 68.75 68.75Exercise price (Rs. per share) 57.00 57.00Expected volatility 64.49% 64.49%Life of the options granted (vesting and exercise period) in years
Vesting period + 18 months i.e. 3 years, 4 years, 5 years, and 6 years, for each Vesting tranche
of 25%
Vesting period + 18 months i.e. 3 years, 4 years, 5 years, and 6 years, for each Vesting tranche
of 25%Expected dividends 0.30% per annum 0.30% per annumAverage risk-free interest rate 8.04% per annum 8.04% per annum
Notes to Consolidated Financial Statements for the year ended March 31, 2019
35.Netemployeedefinedbenefitliabilities(contd.)
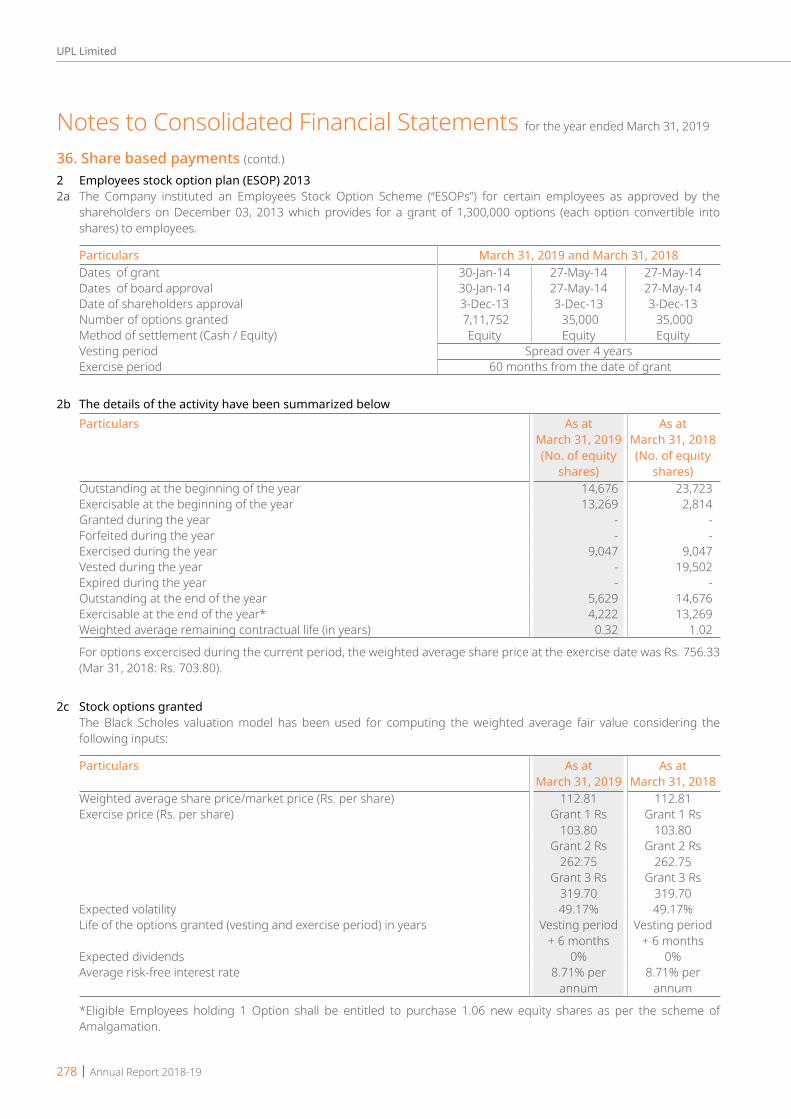
278 | Annual Report 2018-19
UPL Limited
2 Employees stock option plan (ESOP) 20132a The Company instituted an Employees Stock Option Scheme (“ESOPs”) for certain employees as approved by the
shareholders on December 03, 2013 which provides for a grant of 1,300,000 options (each option convertible into shares) to employees.
Particulars March 31, 2019 and March 31, 2018Dates of grant 30-Jan-14 27-May-14 27-May-14Dates of board approval 30-Jan-14 27-May-14 27-May-14Date of shareholders approval 3-Dec-13 3-Dec-13 3-Dec-13Number of options granted 7,11,752 35,000 35,000 Method of settlement (Cash / Equity) Equity Equity EquityVesting period Spread over 4 yearsExercise period 60 months from the date of grant
2b The details of the activity have been summarized belowParticulars As at
March 31, 2019 (No. of equity
shares)
As at March 31, 2018(No. of equity
shares)Outstanding at the beginning of the year 14,676 23,723Exercisable at the beginning of the year 13,269 2,814Granted during the year - -Forfeited during the year - -Exercised during the year 9,047 9,047Vested during the year - 19,502Expired during the year - -Outstanding at the end of the year 5,629 14,676Exercisable at the end of the year* 4,222 13,269Weighted average remaining contractual life (in years) 0.32 1.02
For options excercised during the current period, the weighted average share price at the exercise date was Rs. 756.33 (Mar 31, 2018: Rs. 703.80).
2c Stock options granted The Black Scholes valuation model has been used for computing the weighted average fair value considering the
following inputs:
Particulars As at March 31, 2019
As at March 31, 2018
Weighted average share price/market price (Rs. per share) 112.81 112.81Exercise price (Rs. per share) Grant 1 Rs
103.80Grant 1 Rs
103.80Grant 2 Rs
262.75Grant 2 Rs
262.75Grant 3 Rs
319.70Grant 3 Rs
319.70Expected volatility 49.17% 49.17%Life of the options granted (vesting and exercise period) in years Vesting period
+ 6 monthsVesting period
+ 6 monthsExpected dividends 0% 0%Average risk-free interest rate 8.71% per
annum8.71% per
annum
*Eligible Employees holding 1 Option shall be entitled to purchase 1.06 new equity shares as per the scheme of Amalgamation.
Notes to Consolidated Financial Statements for the year ended March 31, 2019
36. Share based payments (contd.)
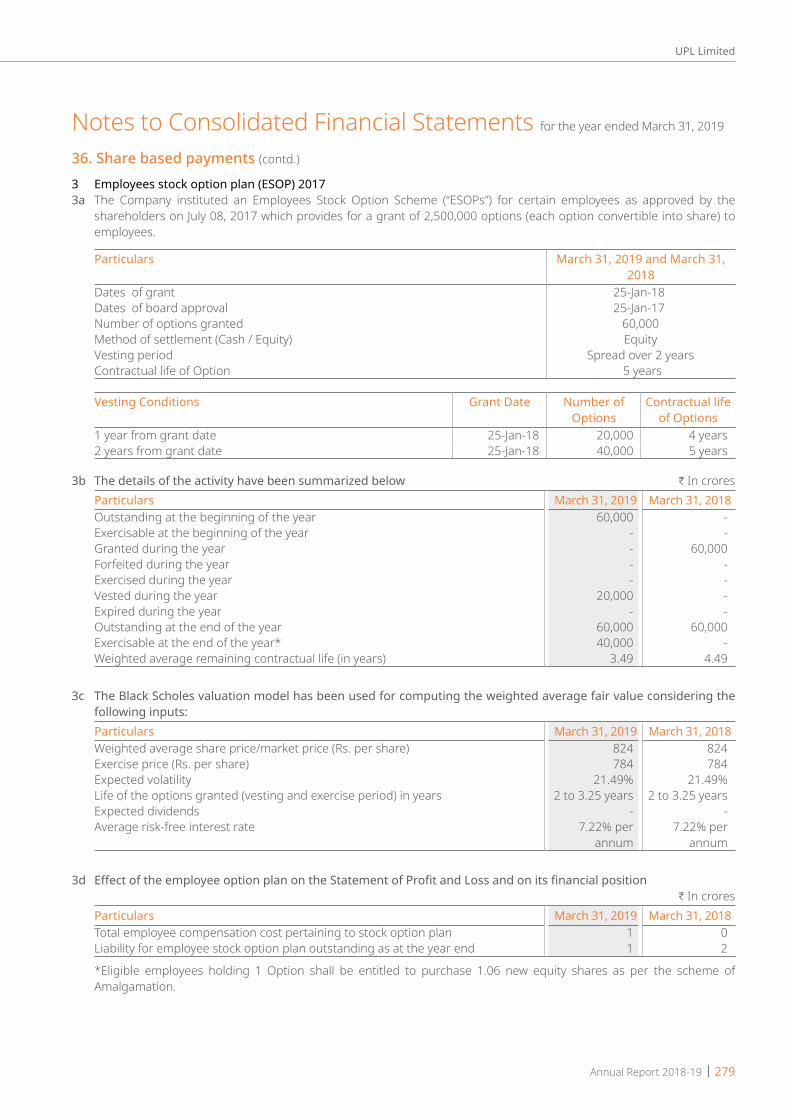
Annual Report 2018-19 | 279
UPL Limited
3 Employees stock option plan (ESOP) 20173a The Company instituted an Employees Stock Option Scheme (“ESOPs”) for certain employees as approved by the
shareholders on July 08, 2017 which provides for a grant of 2,500,000 options (each option convertible into share) to employees.
Particulars March 31, 2019 and March 31, 2018
Dates of grant 25-Jan-18Dates of board approval 25-Jan-17Number of options granted 60,000 Method of settlement (Cash / Equity) Equity Vesting period Spread over 2 years Contractual life of Option 5 years
Vesting Conditions Grant Date Number of Options
Contractual life of Options
1 year from grant date 25-Jan-18 20,000 4 years2 years from grant date 25-Jan-18 40,000 5 years
3b The details of the activity have been summarized below H In croresParticulars March 31, 2019 March 31, 2018Outstanding at the beginning of the year 60,000 - Exercisable at the beginning of the year - - Granted during the year - 60,000 Forfeited during the year - - Exercised during the year - - Vested during the year 20,000 - Expired during the year - - Outstanding at the end of the year 60,000 60,000 Exercisable at the end of the year* 40,000 - Weighted average remaining contractual life (in years) 3.49 4.49
3c The Black Scholes valuation model has been used for computing the weighted average fair value considering the following inputs:Particulars March 31, 2019 March 31, 2018Weighted average share price/market price (Rs. per share) 824 824 Exercise price (Rs. per share) 784 784 Expected volatility 21.49% 21.49%Life of the options granted (vesting and exercise period) in years 2 to 3.25 years 2 to 3.25 years Expected dividends - - Average risk-free interest rate 7.22% per
annum 7.22% per
annum
3d Effect of the employee option plan on the Statement of Profit and Loss and on its financial positionH In crores
Particulars March 31, 2019 March 31, 2018Total employee compensation cost pertaining to stock option plan 1 0 Liability for employee stock option plan outstanding as at the year end 1 2
*Eligible employees holding 1 Option shall be entitled to purchase 1.06 new equity shares as per the scheme of Amalgamation.
Notes to Consolidated Financial Statements for the year ended March 31, 2019
36. Share based payments (contd.)
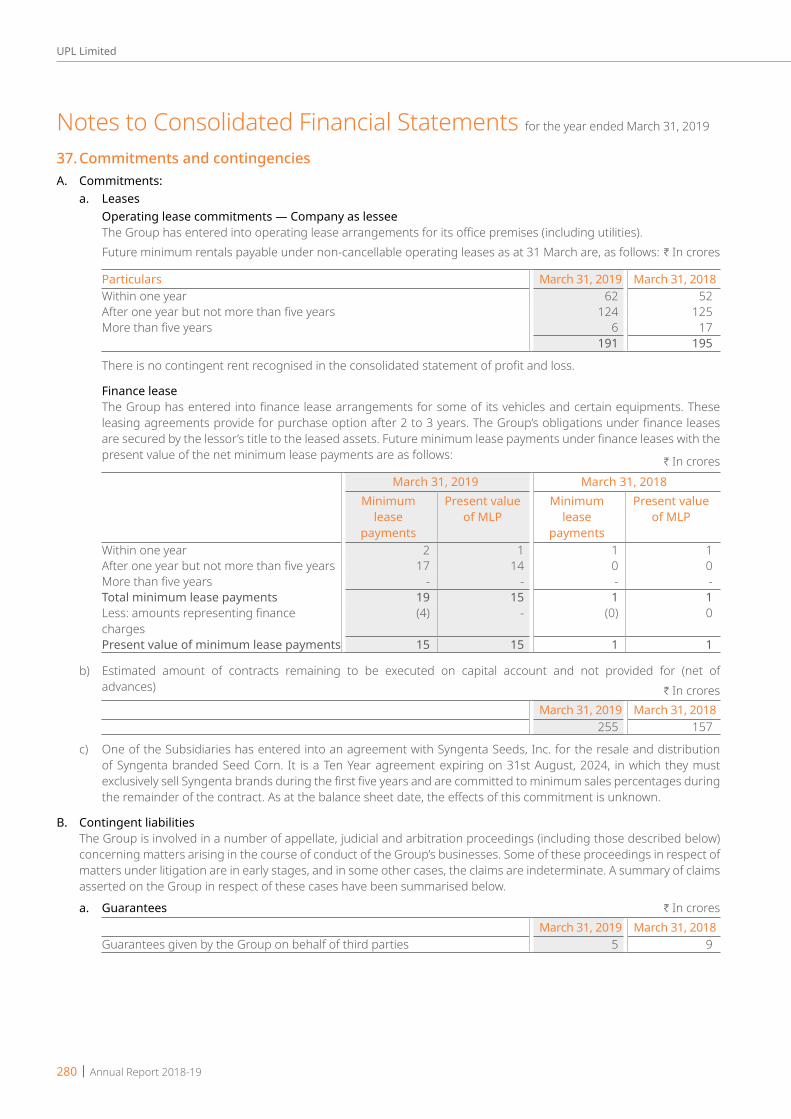
280 | Annual Report 2018-19
UPL Limited
37. Commitments and contingenciesA. Commitments: a. Leases Operating lease commitments — Company as lessee The Group has entered into operating lease arrangements for its office premises (including utilities). Future minimum rentals payable under non-cancellable operating leases as at 31 March are, as follows: H In crores
Particulars March 31, 2019 March 31, 2018Within one year 62 52 After one year but not more than five years 124 125 More than five years 6 17
191 195
There is no contingent rent recognised in the consolidated statement of profit and loss.
Finance lease The Group has entered into finance lease arrangements for some of its vehicles and certain equipments. These
leasing agreements provide for purchase option after 2 to 3 years. The Group’s obligations under finance leases are secured by the lessor’s title to the leased assets. Future minimum lease payments under finance leases with the present value of the net minimum lease payments are as follows:
H In croresMarch 31, 2019 March 31, 2018
Minimum lease
payments
Present value of MLP
Minimum lease
payments
Present value of MLP
Within one year 2 1 1 1 After one year but not more than five years 17 14 0 0 More than five years - - - - Total minimum lease payments 19 15 1 1 Less: amounts representing finance charges
(4) - (0) 0
Present value of minimum lease payments 15 15 1 1
b) Estimated amount of contracts remaining to be executed on capital account and not provided for (net of advances) H In crores
March 31, 2019 March 31, 2018255 157
c) One of the Subsidiaries has entered into an agreement with Syngenta Seeds, Inc. for the resale and distribution of Syngenta branded Seed Corn. It is a Ten Year agreement expiring on 31st August, 2024, in which they must exclusively sell Syngenta brands during the first five years and are committed to minimum sales percentages during the remainder of the contract. As at the balance sheet date, the effects of this commitment is unknown.
B. Contingent liabilities The Group is involved in a number of appellate, judicial and arbitration proceedings (including those described below)
concerning matters arising in the course of conduct of the Group’s businesses. Some of these proceedings in respect of matters under litigation are in early stages, and in some other cases, the claims are indeterminate. A summary of claims asserted on the Group in respect of these cases have been summarised below.
a. Guarantees H In croresMarch 31, 2019 March 31, 2018
Guarantees given by the Group on behalf of third parties 5 9
Notes to Consolidated Financial Statements for the year ended March 31, 2019

Annual Report 2018-19 | 281
UPL Limited
b. Tax Contigencies Amounts in respect of claims asserted by various revenue authorities on the Group, in respect of taxes, which are in
dispute, have been tabulated below: H In crores
Nature of Tax March 31, 2019 March 31, 2018Disputed Excise Duty / Service Tax Liability (excluding interest) 196 203 Disputed Income-tax Liability (excluding interest) 26 26 Disputed Sales-tax Liability 31 75 Disputed Custom duty Liability 34 34 Disputed Fiscal Penalty for cancellation of licenses 33 33
The management believes that the claims made are untenable and is contesting them. As of the reporting date, the management is unable to determine the ultimate outcome of above matters. However, in the event the revenue authorities succeed with enforcement of their assessments, the Group may be required to pay some or all of the asserted claims and the consequential interest and penalties, which would reduce net income and could have a material adverse effect on net income in the respective reported period.
c. Amount in respect of other claims H In croresNature of Claim March 31, 2019 March 31, 2018Claims payable to growers. 22 13 Other Claims (claims related to contractual and other disputes) 31 20 Group's share of contingent liabilities of associates:-Claims against the Associates not acknowledged as debts. 5 23
Agrofresh Inc (USA) had filed a litigation against one subsidiary of the Group and the other shareholders of the subsidiary inter alia for infringement of patents owned by Agrofresh in respect of a product, for loss of profits and for breach of contract. During the previous year the Group had provided Rs. 1.29 crores towards amounts expected to be paid in this regard being the estimated profits earned from the product till December 2016. During the year, the Group’s has obtained a favorable ruling resulting in invalidation of Agrofresh’s patent.
The Group had filed for dissolution of the subsidary and a counter claim of Rs.16.29 crores has been filed for the proposed dissolution.The Group understands that this claim, if any, should be against the non controlling interest shareholder and is likely to be rejected in its present form. The Group plea for dissolution of subsidiary has been upheld. Agrofresh has appealed this outcome. The litigation for the loss of profits, damages and breach of contract for the main claim is in progress. While effect of all the above is not ascertainable, the Group does not expect this to materially affect its financial statements.
Management is generally unable to reasonably estimate a range of possible loss for proceedings or disputes other than those included in the estimate above, including where:
i. plaintiffs / parties have not claimed an amount of money damages, unless management can otherwise determine an appropriate amount;
ii. the proceedings are in early stages; iii. there is uncertainty as to the outcome of pending appeals or motions or negotiations; iv. there are significant factual issues to be resolved; and/or v. there are novel legal issues presented.
However, in respect of the above matters, management does not believe, based on currently available information, that the outcomes of the litigation, will have a material adverse effect on the Group’s financial condition, though the outcomes could be material to the Group’s operating results for any particular period, depending, in part, upon the operating results for such period.
d. Pursuant to the judgment of the Supreme Court of India on 28 February 2019 regarding the allowances to be considered for computing Provident Fund liability, certain components of compensation hitherto excluded from PF need to be included.There are interpretative challenges in application of the judgment retrospectively and the Company has been legally advised that the judgment would be applicable prospectively.The financial statements disclose a contingent liability in this regard. No provision has been made for the period from 28 February to 31 March 2019 as the same is not material.
Notes to Consolidated Financial Statements for the year ended March 31, 2019
37. Commitments and contingencies (contd.)
282 | Annual Report 2018-19
UPL Limited
C. Contingent Assets During the previous year the company settled its claim of Rs 13.74 Crs against agrochemicals trader regarding
illegal parallel-trading of unauthorised copies of UPL’s product. No gain had been recognised during the previous financial year because the receipt of the additional consideration was not virtually certain as it was dependent on the ability of the party to pay the compensation
38. Related Party Disclosures:a) Name of other related parties with whom transactions have taken place during the year. i) Joint Venture Companies: United Phosphorus (Bangladesh) Limited Hodogaya UPL Co. Limited Longreach Plant Breeders Management Pty Limited
ii) Associate Companies:Kerala Enviro Infrastructure Limited Agronamic (Pty) Ltd.Weather Risk Management Services Private Limited Novon Protecta (Pty) Ltd3SB Produtos Agrícolas S.A. Silvix Forestry (Pty) Ltd.Sinagro Produtos Agropecuários S.A. Nexus AG (Pty) LtdSeara Bonita Sementes S.A. Dalian Advanced Chemical Co.Ltd.Chemisynth (Vapi) Limited Société des Produits Industriels et AgricolesUniversal Pestochem Industries Limited CGNS LimitedAgri Fokus (Pty) Ltd. Callitogo SANovon Retail Company (Pty) Ltd.
iii) Enterprises over which key management personnel and their relatives have significant influence (Other Related Parties):
Bharuch Enviro Infrastructure Limited Tatva Global Environment Private LimitedBloom Packaging Private Limited Tatva Global Environment (Deonar) LimitedBloom Seal Containers Private Limited Ultima SearchDaman Ganga Pulp and Papers Private Limited Uniphos International LimitedDemuric Holdings Private Limited Uniphos Enterprises LimitedEnviro Technology Limited Uniphos Envirotronic Private LimitedGharpure Engineering and Construction Private Limited UPL Environmental Engineers LimitedUniphos Envirotronic Private Limited Vikram FarmJRF International Ubania Realty LLPGC Laboratories VJS Investments LimitedJai Trust Bench Bio Private LimitedNerka Chemicals Private Limited Agraja Properties LimitedPot Plants Crop Care Federation of IndiaSanguine Holdings Private Limited Vankala Krishi Care Pvt Ltd
iv) Key Management Personnel and their relatives :Whole Time Directors and their relativesMr. Rajnikant D. Shroff Mr. Hardeep SinghMr. Jaidev R. Shroff * Mr. Vasant GandhiMr. Vikram R. Shroff * Mr. Pradeep GoyalMrs. Sandra R. Shroff * Mr. Vinod SethiMr. Kalyan Banerjee (Upto : 31st July 2018) Dr. Reena RamchandranMr. Arun C. Ashar Mr. Pradip Madhavji (Upto : 26th April 2018)Mrs. Asha Ashar * Mr. Anand Vora - Chief Financial OfficerMr. Navin Ashar * Mr. M.B Trivedi - Company Secretary
* Relative of key management personnel.
Notes to Consolidated Financial Statements for the year ended March 31, 2019
37. Commitments and contingencies (contd.)

Annual Report 2018-19 | 283
UPL Limited
(b)
The
follo
win
g tr
ansa
ctio
ns w
ere
carr
ied
out w
ith re
late
d pa
rtie
s in
the
ordi
nary
cou
rse
of b
usin
ess
as d
iscl
osed
in th
e au
dite
d ac
coun
ts o
f the
indi
vidu
al
com
pani
es in
the
Gro
up, a
ssoc
iate
com
pani
es a
nd jo
int v
entu
res.
H In
cro
res
NAT
URE
OF
TRAN
SACT
ION
S:31
Mar
ch 2
019
31 M
arch
201
8Jo
int
Vent
ures
Asso
ciat
esO
ther
re
late
d pa
rtie
s
TOTA
LJo
int
Vent
ures
Asso
ciat
esO
ther
re
late
d pa
rtie
s
TOTA
L
1.IN
COM
Ea)
SALE
OF
GO
OD
S52
125
518
357
120
518
2Si
nagr
o Pr
odut
os A
grop
ecuá
rios
S.A.
-11
0-
110
-81
-81
Hod
ogay
a U
PL C
o. L
imite
d47
--
4750
--
503S
B Pr
oduc
tos
Agric
olas
S.A
.-
4-
4-
29-
29O
ther
s5
115
227
105
22b)
MAN
AGEM
ENT
FEES
--
77
--
88
Tatv
a G
loba
l Env
ironm
ent P
rivat
e Li
mite
d-
-2
2-
-2
2G
harp
ure
Engi
neer
ing
& C
onst
ruct
ion
Priva
te
Lim
ited
--
22
--
44
Uni
phos
Ent
erpr
ises
Lim
ited
--
11
--
11
Bhar
uch
Envir
o In
frast
ruct
ure
Lim
ited
--
11
--
11
Oth
ers
--
00
--
00
c)RE
NT
RECE
IVED
--
00
--
00
Uni
phos
Env
irotro
nic
Priva
te L
imite
d-
-0
0-
-0
0O
ther
s-
-0
0-
-0
0d)
INTE
REST
REC
EIVE
D0
--
0-
--
-Ta
tva
Glo
bal E
nviro
nmen
t Priv
ate
Lim
ited
0-
-0
--
--
e)G
ROU
P RE
CHAR
GE
1-
-1
1-
-1
Long
reac
h Pl
ant B
reed
ers
Man
agem
ent S
ervic
es P
ty
Lim
ited
1-
-1
1-
-1
f)RO
YALT
Y48
--
4861
--
61Lo
ngre
ach
Plan
t Bre
eder
s M
anag
emen
t Ser
vices
Pty
Li
mite
d48
--
4861
--
61
2.EX
PEN
SES
a)PU
RCH
ASES
OF
GO
OD
S20
068
8820
-51
71H
odog
aya
UPL
Co.
Lim
ited
20-
-20
20-
-20
Sina
gro
Prod
utos
Agr
opec
uário
s S.
A.-
--
--
--
-Bl
oom
Sea
l Con
tain
ers
Priva
te L
imite
d-
-43
43-
-32
32Bl
oom
Pac
kagi
ng P
rivat
e Li
mite
d-
-14
14-
-13
13O
ther
s-
011
11-
-6
6b)
FIXE
D A
SSET
S0
-1
1-
00
0U
niph
os E
nviro
troni
c Pr
ivate
Lim
ited
--
11
--
0-
Inge
n Te
chno
logi
es P
.Ltd
0-
-0
--
--
Not
es to
Con
solid
ated
Fin
ancia
l Sta
tem
ents
for th
e ye
ar e
nded
Mar
ch 3
1, 2
019
38. R
elat
ed P
arty
Dis
clos
ures
: (co
ntd.
)

284 | Annual Report 2018-19
UPL Limited
H In
cro
res
NAT
URE
OF
TRAN
SACT
ION
S:31
Mar
ch 2
019
31 M
arch
201
8Jo
int
Vent
ures
Asso
ciat
esO
ther
re
late
d pa
rtie
s
TOTA
LJo
int
Vent
ures
Asso
ciat
esO
ther
re
late
d pa
rtie
s
TOTA
L
Chem
ie S
ynth
(Vap
i) Li
mite
d.-
--
--
0-
0c)
OTH
ERS
0-
11
-0
00
Vikr
am F
arm
--
00
-0
-0
Pot P
lant
s-
-0
0-
--
-Cr
op C
are
Fede
ratio
n of
Indi
a-
-0
0-
-0
0U
niph
os E
nviro
troni
c Pr
ivate
Lim
ited
--
0-
--
--
othe
rs0
-0
0-
--
-d)
SERV
ICES
0-
9495
--
7979
Bhar
uch
Envir
o In
frast
ruct
ure
Lim
ited
--
9393
--
7777
Oth
ers
0-
22
--
22
e)RE
NT
--
11
--
11
Sang
uine
Hol
ding
s Pr
ivate
Lim
ited
--
00
--
00
Ulti
ma
Sear
ch-
-0
0-
-0
0Bl
oom
Pac
kagi
ng P
rivat
e Li
mite
d-
-0
0-
-0
0Ja
i Tru
st-
-0
0-
--
-O
ther
s-
-0
0-
--
-f)
ROYA
LTY
--
--
--
--
Long
reac
h Pl
ant B
reed
ers
Man
agem
ent S
ervic
es P
ty
Lim
ited
--
--
--
-
g)CO
MM
ISSI
ON
EXP
ENSE
--
--
--
--
Sina
gro
Prod
utos
Agr
opec
uário
s S.
A.-
--
--
--
-h)
PRO
VISI
ON
FO
R D
OU
BTFU
L AD
VAN
CES
--
--
--
--
Polyc
oat T
echn
olog
ies
2010
Lim
ited
--
--
--
--
i)CO
NTR
IBU
TIO
N T
O C
SR-
--
--
--
-Vi
kram
Far
m-
--
--
--
j)G
ROU
P RE
CHAR
GE
0-
-0
0-
-0
Long
reac
h Pl
ant B
reed
ers
Man
agem
ent S
ervic
es P
ty
Lim
ited
0-
-0
0-
-0
3.FI
NAN
CE-
--
--
--
-a)
INTE
REST
INCO
ME
5-
-5
542
-47
Long
reac
h Pl
ant B
reed
ers
Man
agem
ent S
ervic
es P
ty
Lim
ited
5-
-5
5-
-5
Bhar
uch
Envir
o In
frast
ruct
ure
Lim
ited
--
--
--
--
Sina
gro
Prod
utos
Agr
opec
uário
s S.
A.-
--
--
20-
20Ta
tva
Glo
bal E
nviro
nmen
t Priv
ate
Lim
ited
--
--
--
--
3SB
Prod
ucto
s Ag
ricol
as S
.A.
--
--
-22
-22
othe
rs-
--
--
--
-
Not
es to
Con
solid
ated
Fin
ancia
l Sta
tem
ents
for th
e ye
ar e
nded
Mar
ch 3
1, 2
019
38. R
elat
ed P
arty
Dis
clos
ures
: (co
ntd.
)
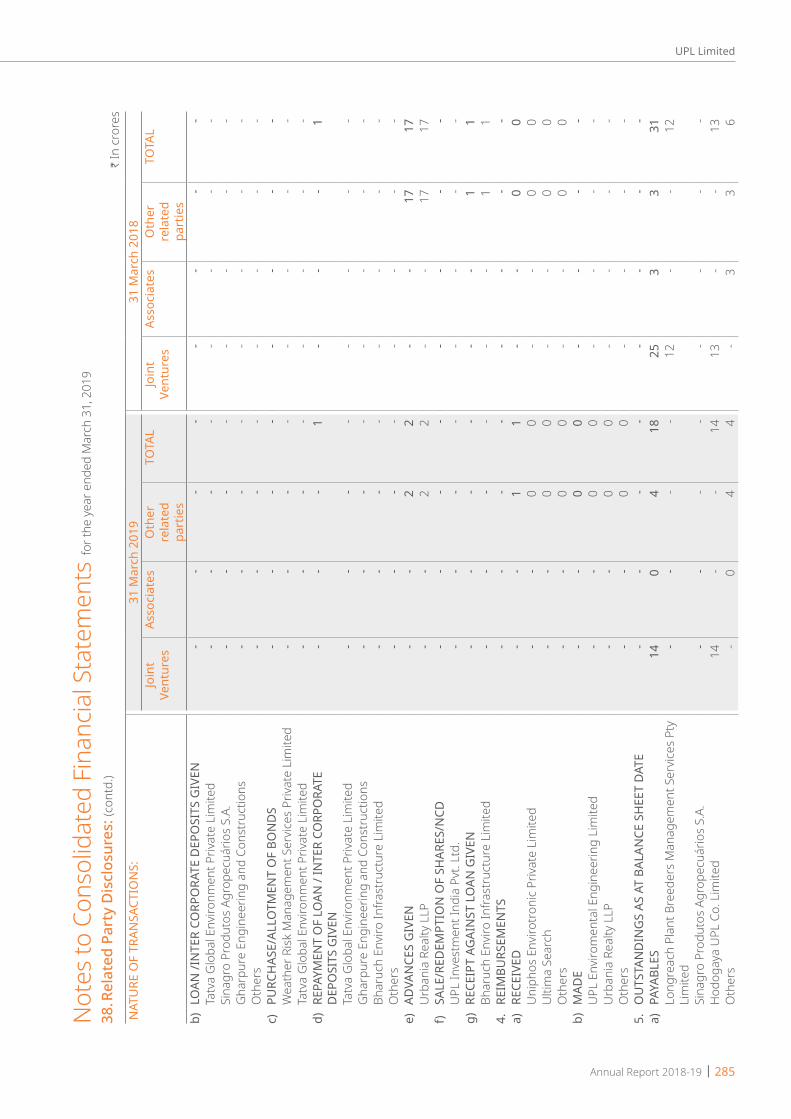
Annual Report 2018-19 | 285
UPL Limited
H In
cro
res
NAT
URE
OF
TRAN
SACT
ION
S:31
Mar
ch 2
019
31 M
arch
201
8Jo
int
Vent
ures
Asso
ciat
esO
ther
re
late
d pa
rtie
s
TOTA
LJo
int
Vent
ures
Asso
ciat
esO
ther
re
late
d pa
rtie
s
TOTA
L
b)LO
AN /I
NTE
R CO
RPO
RATE
DEP
OSI
TS G
IVEN
--
--
--
--
Tatv
a G
loba
l Env
ironm
ent P
rivat
e Li
mite
d-
--
--
--
-Si
nagr
o Pr
odut
os A
grop
ecuá
rios
S.A.
--
--
--
--
Gha
rpur
e En
gine
erin
g an
d Co
nstr
uctio
ns-
--
--
--
-O
ther
s-
--
--
--
-c)
PURC
HAS
E/AL
LOTM
ENT
OF
BON
DS
--
--
--
--
Wea
ther
Risk
Man
agem
ent S
ervic
es P
rivat
e Li
mite
d-
--
--
--
-Ta
tva
Glo
bal E
nviro
nmen
t Priv
ate
Lim
ited
--
--
--
--
d)RE
PAYM
ENT
OF
LOAN
/ IN
TER
CORP
ORA
TE
DEP
OSI
TS G
IVEN
--
-1
--
-1
Tatv
a G
loba
l Env
ironm
ent P
rivat
e Li
mite
d-
--
--
--
-G
harp
ure
Engi
neer
ing
and
Cons
truc
tions
--
--
--
--
Bhar
uch
Envir
o In
frast
ruct
ure
Lim
ited
--
--
--
--
Oth
ers
--
--
--
--
e)AD
VAN
CES
GIV
EN-
-2
2-
-17
17U
rban
ia R
ealty
LLP
--
22
--
1717
f)SA
LE/R
EDEM
PTIO
N O
F SH
ARES
/NCD
--
--
--
--
UPL
Inve
stm
ent I
ndia
Pvt
. Ltd
.-
--
--
--
-g)
RECE
IPT
AGAI
NST
LO
AN G
IVEN
--
--
--
11
Bhar
uch
Envir
o In
frast
ruct
ure
Lim
ited
--
--
--
11
4.RE
IMBU
RSEM
ENTS
--
--
--
--
a)RE
CEIV
ED-
-1
1-
-0
0U
niph
os E
nviro
troni
c Pr
ivate
Lim
ited
--
00
--
00
Ulti
ma
Sear
ch-
-0
0-
-0
0O
ther
s-
-0
0-
-0
0b)
MAD
E-
-0
0-
--
-U
PL E
nviro
men
tal E
ngin
eerin
g Li
mite
d-
-0
0-
--
-U
rban
ia R
ealty
LLP
--
00
--
--
Oth
ers
--
00
--
--
5.O
UTS
TAN
DIN
GS
AS A
T BA
LAN
CE S
HEE
T DA
TE-
--
--
--
-a)
PAYA
BLES
140
418
253
331
Long
reac
h Pl
ant B
reed
ers
Man
agem
ent S
ervic
es P
ty
Lim
ited
--
--
12-
-12
Sina
gro
Prod
utos
Agr
opec
uário
s S.
A.-
--
--
--
-H
odog
aya
UPL
Co.
Lim
ited
14-
-14
13-
-13
Oth
ers
-0
44
-3
36
Not
es to
Con
solid
ated
Fin
ancia
l Sta
tem
ents
for th
e ye
ar e
nded
Mar
ch 3
1, 2
019
38. R
elat
ed P
arty
Dis
clos
ures
: (co
ntd.
)

286 | Annual Report 2018-19
UPL Limited
H In
cro
res
NAT
URE
OF
TRAN
SACT
ION
S:31
Mar
ch 2
019
31 M
arch
201
8Jo
int
Vent
ures
Asso
ciat
esO
ther
re
late
d pa
rtie
s
TOTA
LJo
int
Vent
ures
Asso
ciat
esO
ther
re
late
d pa
rtie
s
TOTA
L
b)RE
CEIV
ABLE
S24
9819
141
2918
74
220
Hod
ogay
a U
PL C
o. L
imite
d24
--
2428
--
28Bh
aruc
h En
viro
Infra
stru
ctur
e Li
mite
d-
-3
3-
--
-3S
B Pr
odut
os A
gríco
las
S.A.
-4
-4
-51
-51
Sina
gro
Prod
utos
Agr
opec
uário
s S.
A.-
85-
85-
129
-12
9Lo
ngre
ach
Plan
t Bre
eder
s M
anag
emen
t Ser
vices
Pty
Li
mite
d0
--
--
--
-
Oth
ers
-9
1625
17
412
c)LO
ANS
/ IN
TER
CORP
ORA
TE D
EPO
SITS
GIV
EN58
-13
7159
127
-18
63S
B Pr
oduc
tos
Agric
olas
S.A
.-
--
--
54-
54Lo
ngre
ach
Plan
t Bre
eder
s M
anag
emen
t Ser
vices
Pty
Li
mite
d58
--
5859
--
59
Sina
gro
Prod
utos
Agr
opec
uário
s S.
A.-
--
--
73-
73Bh
aruc
h En
viro
Infra
stru
ctur
e Li
mite
d-
-6
6-
--
-Bl
oom
Pac
kagi
ng P
rivat
e Li
mite
d-
-2
2-
--
-O
ther
s-
-4
4-
--
-d)
MAN
AGEM
ENT
FEES
REC
EIVA
BLE
--
--
--
1010
Tatv
a G
loba
l Env
ironm
ent P
rivat
e Li
mite
d-
--
--
-1
1G
harp
ure
Engi
neer
ing
and
Cons
truc
tion
Priva
te
Lim
ited
--
--
--
88
Bhar
uch
Envir
o In
frast
ruct
ure
Lim
ited
--
--
--
--
Oth
ers
-1
1e)
INTE
REST
REC
EIVA
BLES
0-
01
0-
01
Gha
rpur
e En
gine
erin
g an
d Co
nstr
uctio
n Pr
ivate
Li
mite
d-
--
--
--
-
Sina
gro
Prod
utos
Agr
opec
uário
s S.
A.-
--
--
--
-Lo
ngre
ach
Plan
t Bre
eder
s M
anag
emen
t Ser
vices
Pty
Li
mite
d0
--
00
--
0
Tatv
a G
loba
l Env
ironm
ent P
rivat
e Li
mite
d-
-0
0-
--
-O
ther
s-
--
--
-0
0f)
DEP
OSI
TS G
IVEN
--
--
--
1414
Bhar
uch
Envir
o In
frast
ruct
ure
Lim
ited
--
--
--
88
Dam
an G
anga
Pul
p an
d Pa
pers
Priv
ate
Lim
ited
--
--
--
44
Bloo
m P
acka
ging
Priv
ate
Lim
ited
--
--
--
--
Oth
ers
--
--
--
22
g)AD
VAN
CES
GIV
EN-
-29
29-
-27
27U
rban
ia re
ality
LLP
--
2929
--
2727
Not
es to
Con
solid
ated
Fin
ancia
l Sta
tem
ents
for th
e ye
ar e
nded
Mar
ch 3
1, 2
019
38. R
elat
ed P
arty
Dis
clos
ures
: (co
ntd.
)
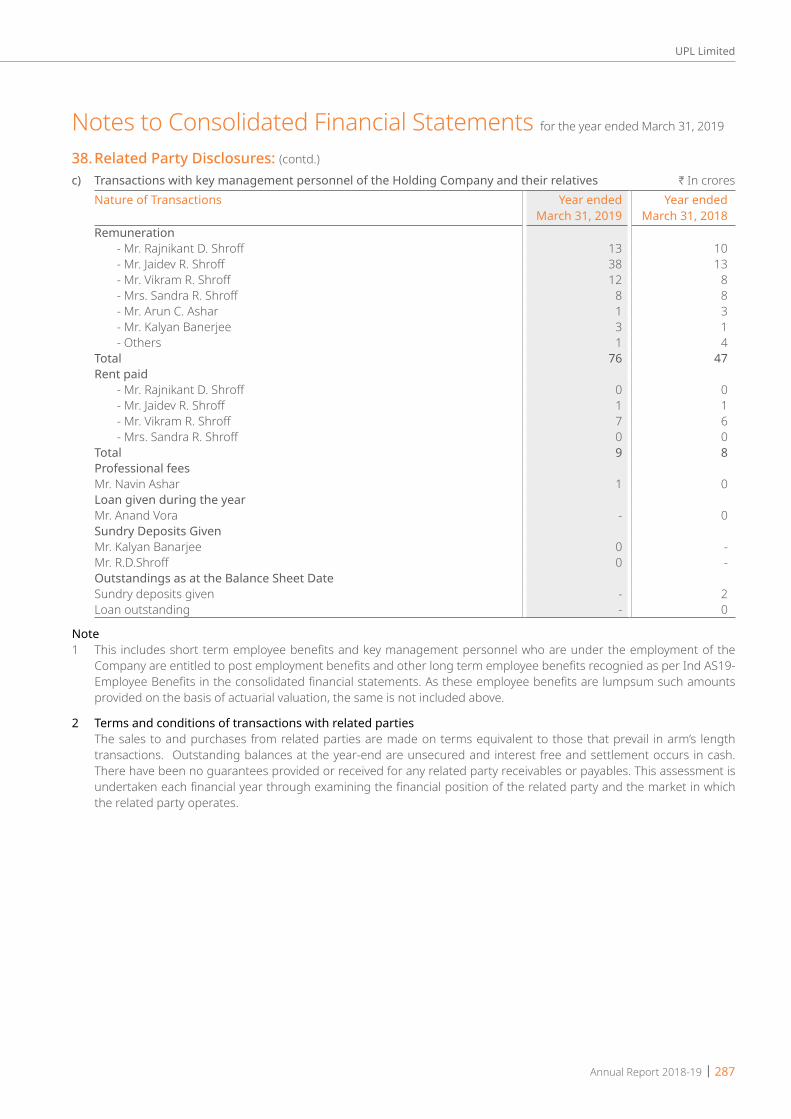
Annual Report 2018-19 | 287
UPL Limited
c) Transactions with key management personnel of the Holding Company and their relatives H In croresNature of Transactions Year ended
March 31, 2019 Year ended
March 31, 2018Remuneration - Mr. Rajnikant D. Shroff 13 10 - Mr. Jaidev R. Shroff 38 13 - Mr. Vikram R. Shroff 12 8 - Mrs. Sandra R. Shroff 8 8 - Mr. Arun C. Ashar 1 3 - Mr. Kalyan Banerjee 3 1 - Others 1 4Total 76 47Rent paid - Mr. Rajnikant D. Shroff 0 0 - Mr. Jaidev R. Shroff 1 1 - Mr. Vikram R. Shroff 7 6 - Mrs. Sandra R. Shroff 0 0Total 9 8Professional feesMr. Navin Ashar 1 0Loan given during the yearMr. Anand Vora - 0Sundry Deposits GivenMr. Kalyan Banarjee 0 -Mr. R.D.Shroff 0 -Outstandings as at the Balance Sheet DateSundry deposits given - 2Loan outstanding - 0
Note1 This includes short term employee benefits and key management personnel who are under the employment of the
Company are entitled to post employment benefits and other long term employee benefits recognied as per Ind AS19- Employee Benefits in the consolidated financial statements. As these employee benefits are lumpsum such amounts provided on the basis of actuarial valuation, the same is not included above.
2 Terms and conditions of transactions with related parties The sales to and purchases from related parties are made on terms equivalent to those that prevail in arm’s length
transactions. Outstanding balances at the year-end are unsecured and interest free and settlement occurs in cash. There have been no guarantees provided or received for any related party receivables or payables. This assessment is undertaken each financial year through examining the financial position of the related party and the market in which the related party operates.
Notes to Consolidated Financial Statements for the year ended March 31, 2019
38. Related Party Disclosures: (contd.)

288 | Annual Report 2018-19
UPL Limited
39. Segment information(A) Primary Segment Reporting (by Business Segment) H In croresSr. No.
Particulars 31 March 2019 31 March 2018Agro
ActivityNon Agro
Activity
Unallo-cated
Total Agro Activity
Non Agro
Activity
Unallo-cated
Total
1 Revenue from operations (net)a External 21,147 681 9 21,837 16,917 574 15 17,506c Intersegment (285) 285 - - (183) 183 - -
Total 20,862 966 9 21,837 16,734 757 15 17,5062 Segment Resultsa Contribution 3,564 147 3,711 3,722 66 3,788
Intersegment profits (53) 53 (37) 37 -Total Segment Results 3,511 200 - 3,711 3,685 103 - 3,788Less :(i) Finance Costs 963 783(ii) Unallocable Expenditure/ Income (net)
627 544
(iii) Share of profit/(loss) of associates and joint ventures
14 (93)
(iv) Exceptional items (refer note no. 27)
451 63
Total Profit before Tax 1,684 2,305Provision for taxCurrent tax 442 311Adjustments of tax relating to earlier years
(4) (79)
Deferred tax (273) 43Profit for the year attributable to
1,519 2,030
Owners of the parent 1,447 2,022Non-controlling interest 72 8Other InformationSegment Assets 56,128 1,356 5,564 63,048 17,209 738 5,096 23,043Segment Liabilities 11,034 353 33,658 45,045 6,320 176 7,359 13,855Capital Expenditure 1,447 139 7 1,594 1,325 69 19 1,413Depreciation 389 37 25 451 291 27 25 343Amortization 441 - 77 518 267 - 65 332Non cash expenses other than depreciation
(38) 4 - (34) 39 5 - 44
Notes to Consolidated Financial Statements for the year ended March 31, 2019

Annual Report 2018-19 | 289
UPL Limited
(B) Secondary Segment Reporting (by Geographical location of the customers) H In crores
Particulars 31 March 2019India Europe North
AmericaLatin
AmericaROW Total
Revenue by Geographical Market 3,314 3,532 3,697 7,457 3,837 21,837 Carrying amount of Non Current Operating Assets(Non Current Assets for this purpose consists of property, plant and equipment, Capital work-in-progress, Intangible assets, Intangible assets under development and other non current assets)
3,801 2,004 25,450 1,568 1,141 33,964
H In croresParticulars 31 March 2018
India Europe North America
Latin America
ROW Total
Revenue by Geographical Market 3,317 2,305 3,083 5,692 3,109 17,506Carrying amount of Non Current Operating Assets(Non Current Assets for this purpose consists of property, plant and equipment, Capital work-in-progress, Intangible assets, Intangible assets under development and other non current assets)
3,138 997 371 1,084 485 6,075
Notes (1) The business of the Group is divided into two business segments. These segments are the basis for management
control and hence form the basis for reporting. The business of each segment comprises of : a) Agro Activity - This is the main area of the Group’s operation and includes the manufacture and marketing of
conventional agrochemical products, seeds and other agricultural related products.
b) Non-agro Activity - Non agro activities includes manufacture and marketing of industrial chemical and other non agricultural related products.
(2) Capital expenditure consist of additions of property, plant and equipment and intangible assets. (3) Segment Revenue in the above segments includes sales of products net of taxes. (4) Inter Segment Revenue is taken as comparable third party average selling price for the year. (5) Segment Revenue in the geographical segments considered for disclosure are as follows: a) Revenue in India includes sales to customers located within India. b) Revenue in Europe includes sales to customers located within Europe. c) Revenue in North America includes sales to customers located within North America. d) Revenue in Latin America includes sales to customers located within Latin America. e) Revenue in Rest of world includes sales to customers located other than above Geographic segments. (6) Segment Revenue, Results, Assets and Liabilities include the respective amounts identifiable to each of the segments
and amounts allocated on a reasonable basis. (7) Based on “management approach”defined under Ind AS 108 - Operating Segments, the Chief Operating Decision
Maker evaluates the company’s performance and allocates resources based on an analysis of various performance indicators by business segments. Accordingly information has been presented along these segments
Notes to Consolidated Financial Statements for the year ended March 31, 2019
39. Segment information (contd.)

290 | Annual Report 2018-19
UPL Limited
40. Acquisition of a subsidiaryOn 31st January 2019, the Group acquired the entire share capital of Arysta Lifescience Inc, a global provider of innovative crop protection solutions including BioSolutions and Seed Treatment. As a result the Group obtained control of Arysta and it’s subsidiaries.
For the two months ended 31st March 2019, the Group’s result include a revenue of INR 1,968 crores and a profit of INR 131 crores without fair valuation adjustments pertaining to business combination of Arysta Lifescience Inc and its subsidiaries. Acquisition occurred towards the end of year and considering size and spread of business and different GAAP followed by Arysta Group, it was impracticable to calculate estimated Full year revenue and profit if it would have occurred on 1st April 2018.
A. ConsiderationH In crores
Consideration 31,459 Total 31,459
The consideration is subject to further adjustments as per the stock purchase agreements signed between the parties based on the level of working capital of the acquired business at the closing date. The maximum additional consideration would be INR 160 crores as required by Ind AS 103- Business Combinations.
The acquisition fulfills UPL’s objective of creating an integrated patent and post patent agricultural solutions business with a global footprint. It will enable the group to offer a complete basket of solutions comprising of crop protection chemicals, bio solutions and seeds covering the entire crop value chain from planting to harvest.
B. Acquisition - related costs The Group incurred acquisition related costs of INR 332 crore related to the acquisition of Arysta Group. These costs
have been included under “Exceptional items.”
C. Identifiable assets acquired and liabilities assumed The following table summarises the recognised amounts of assets acquired and liabilities assumed at the date of
acquisition.
H In croresProperty,Plant and Equipment 141Inventories 869Intellectual Property Rights/ technology 6,045Distribution Network/ Customer Relationships 2,289Non compete 239Brand 367Current liabilities (100)Deferred Tax Liability (2,831)Contingent Liabilities on PPA (412)Total identifiable net assets acquired 6,606
Measurement of fair values The valuation techniques used for measuring the fair values of material assets acquired were as follows
Assets Acquired
Valuation technique used
Property, Plant and Equipment
The Cost Approach relies upon the principle of substitution and recognizes that a prudent investor will pay no more for an asset than the cost to replace it anew with an identical or similar unit of equal utility. Replacement Cost New (RCN) is the current cost of producing or constructing a similar new item having the nearest equivalent utility as the property being valued. Under this approach, the value is determined by adjusting the replacement / reproduction cost new by the loss in value due to physical deterioration and obsolescence for asset (by passage of time and use of the asset), where applicable.
Notes to Consolidated Financial Statements for the year ended March 31, 2019

Annual Report 2018-19 | 291
UPL Limited
Assets Acquired
Valuation technique used
Market Approach: The Market Approach, commonly referred to as the Sales Comparison Approach, measures value based on what other purchasers in the market have paid for assets that can be considered reasonably similar to those being valued. When the Market Approach is utilized, data are collected on the prices paid for reasonable comparable assets. Adjustments are made to the comparable assets to compensate for differences between those assets and the asset being valued. The application of the Market Approach results in an estimate of the price reasonably expected to be realized from the sale of the asset.
Intangible Assets
Relief-from-royalty method and multi-period excess earnings method: The relief-from-royalty method considers the discounted estimated royalty payments that are expected to be avoided as a result of the patents being owned. The multi-period excess earnings method considers the present value of net cash flows expected to be generated by the customer relationships, by excluding any cash flows related to contributory assets
Inventories Market comparison technique: The fair value is determined based on the estimated selling price in the ordinary course of business less the estimated costs of completion and sale, and a reasonable profit margin based on the effort required to complete and sell the inventories.
Fair values measured on a provisional basis The Group is in process to finalise purchase price accounting for Arysta Group acquisiton. As it was occurred towards
the end of year and considering size of acquisition and spread of Arysta Group business, fair valuation is provisional. It will be finalised within one year from the date of acquisiton as per Ind AS 103.
If any new information is obtained within one year of the date of acquisition about facts and circumstances that existed at the date of acquisition identifies adjustments to the above amounts, or any additional provisions that existed at the date of acquisition, then the accounting for the acquisition will be revised.
D. Goodwill Goodwill arising from the acquisition has been recognised as follows
Note H In croresConsideration transferred (A) 31,459 NCI, based on their proportionate interest in the recognised amounts of the assets and liabilitites of Arysta
496
Net worth on date of acquisition (10,313)Fair value of identifiable net assets (C) (6,606)
15,035
Goodwill primarily relates to revenue synergies expected from complementary product portfolio and cross selling opportunities across key markets from the business combination
41. Research and development costs H In croresResearch and Development costs, as certified by the Management. March 31, 2019 March 31, 2018a) Revenue expenses debited to appropriate heads in statement of Profit & Loss 417 334b) Capital Expenditure 64 69
42. Payable towards acquisition of additional stake in UPL Do Brasil Out of the consideration payable to previous shareholders of UPL Do Brasil Industria E Comercio de insumos
Agropecurios SA amounting to Rs. 121 Crores as on March 31, 2018 (Rs. 246 Crores as on 31st March’17), UPL group has settled Rs.54 Crores during the year (Rs. 125 Crores in the year ended March 31, 2018) with previous shareholders. Out of the amount payable, the amount payable within one year from the balance sheet date amounting to Rs. 2 Crores (Rs. 27 Crores in March 31, 2018) has been disclosed as current and balance amount of Rs.65 Crores (Rs. 94 Crores as on March 31, 2018) has been disclosed as non current.
Notes to Consolidated Financial Statements for the year ended March 31, 2019
40. Acquisition of a subsidiary (contd.)
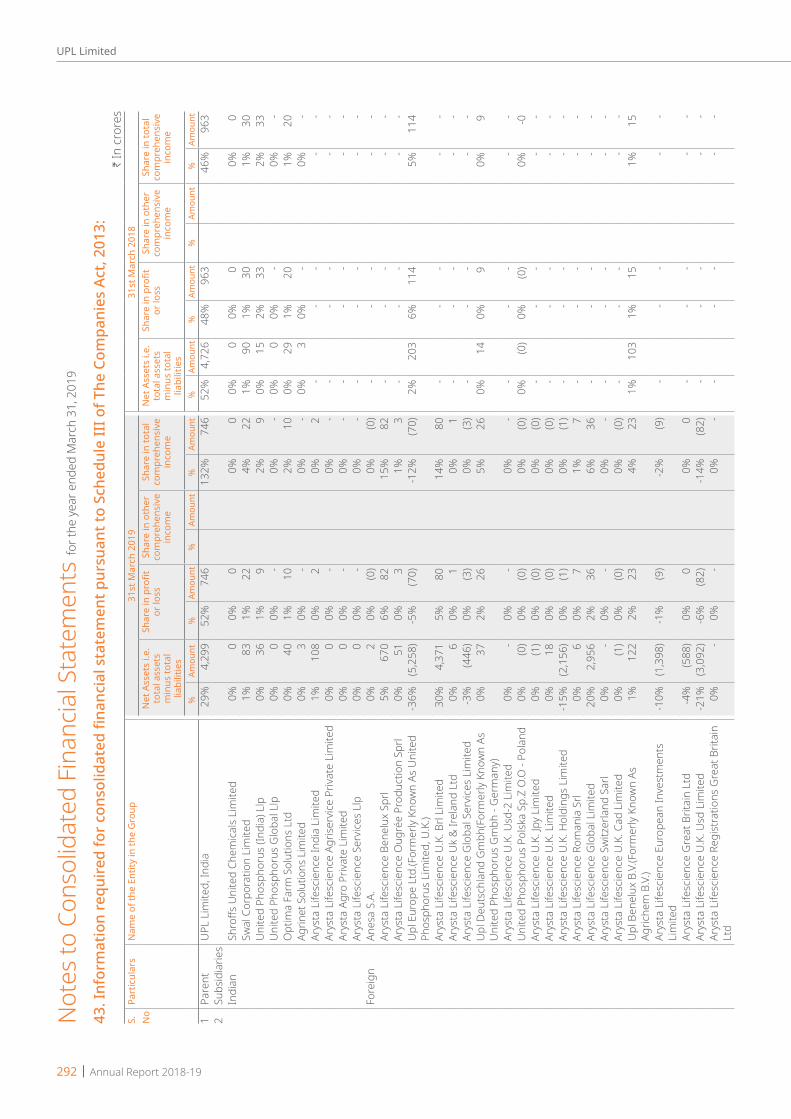
292 | Annual Report 2018-19
UPL Limited
H In
cro
res
S. No
Part
icul
ars
Nam
e of
the
Entit
y in
the
Gro
up31
st M
arch
201
931
st M
arch
201
8N
et A
sset
s i.e
. to
tal a
sset
s m
inus
tota
l lia
bilit
ies
Shar
e in
pro
fit
or lo
ssSh
are
in o
ther
co
mpr
ehen
sive
in
com
e
Shar
e in
tota
l co
mpr
ehen
sive
in
com
e
Net
Ass
ets
i.e.
tota
l ass
ets
min
us to
tal
liabi
litie
s
Shar
e in
pro
fit
or lo
ssSh
are
in o
ther
co
mpr
ehen
sive
in
com
e
Shar
e in
tota
l co
mpr
ehen
sive
in
com
e
%Am
ount
%Am
ount
%Am
ount
%Am
ount
%Am
ount
%Am
ount
%Am
ount
%Am
ount
1Pa
rent
UPL
Lim
ited,
Indi
a29
%4,
299
52%
746
132%
746
52%
4,72
648
%96
346
%96
32
Subs
idia
ries
Indi
anSh
roffs
Uni
ted
Chem
icals
Lim
ited
0%0
0%0
0%0
0%0
0%0
0%0
Swal
Cor
pora
tion
Lim
ited
1%83
1%22
4%22
1%90
1%30
1%30
Uni
ted
Phos
phor
us (I
ndia
) Llp
0%36
1%9
2%9
0%15
2%33
2%33
Uni
ted
Phos
phor
us G
loba
l Llp
0%0
0%-
0%-
0%0
0%-
0%-
Opt
ima
Farm
Sol
utio
ns L
td0%
401%
102%
100%
291%
201%
20Ag
rinet
Sol
utio
ns L
imite
d0%
30%
-0%
-0%
30%
-0%
-Ar
ysta
Life
scie
nce
Indi
a Li
mite
d1%
108
0%2
0%2
--
--
-Ar
ysta
Life
scie
nce
Agris
ervic
e Pr
ivate
Lim
ited
0%0
0%-
0%-
--
--
-Ar
ysta
Agr
o Pr
ivate
Lim
ited
0%0
0%-
0%-
--
--
-Ar
ysta
Life
scie
nce
Serv
ices
Llp
0%0
0%-
0%-
--
--
-Fo
reig
nAn
esa
S.A.
0%2
0%(0
)0%
(0)
--
--
-Ar
ysta
Life
scie
nce
Bene
lux
Sprl
5%67
06%
8215
%82
--
--
-Ar
ysta
Life
scie
nce
Oug
rée
Prod
uctio
n Sp
rl0%
510%
31%
3-
--
--
Upl
Eur
ope
Ltd.
(For
mer
ly Kn
own
As U
nite
d Ph
osph
orus
Lim
ited,
U.K
.)-3
6%(5
,258
)-5
%(7
0)-1
2%(7
0)2%
203
6%11
45%
114
Arys
ta L
ifesc
ienc
e U.
K. B
rl Li
mite
d30
%4,
371
5%80
14%
80-
--
--
Arys
ta L
ifesc
ienc
e U
k &
Irel
and
Ltd
0%6
0%1
0%1
--
--
-Ar
ysta
Life
scie
nce
Glo
bal S
ervic
es L
imite
d-3
%(4
46)
0%(3
)0%
(3)
--
--
-U
pl D
euts
chla
nd G
mbh
(For
mer
ly Kn
own
As
Uni
ted
Phos
phor
us G
mbh
- G
erm
any)
0%37
2%26
5%26
0%14
0%9
0%9
Arys
ta L
ifesc
ienc
e U.
K. U
sd-2
Lim
ited
0%-
0%-
0%-
--
--
-U
nite
d Ph
osph
orus
Pol
ska
Sp.Z
O.O
- Po
land
0%(0
)0%
(0)
0%(0
)0%
(0)
0%(0
)0%
-0Ar
ysta
Life
scie
nce
U.K.
Jpy
Lim
ited
0%(1
)0%
(0)
0%(0
)-
--
--
Arys
ta L
ifesc
ienc
e U.
K. L
imite
d0%
180%
(0)
0%(0
)-
--
--
Arys
ta L
ifesc
ienc
e U.
K. H
oldi
ngs
Lim
ited
-15%
(2,1
56)
0%(1
)0%
(1)
--
--
-Ar
ysta
Life
scie
nce
Rom
ania
Srl
0%6
0%7
1%7
--
--
-Ar
ysta
Life
scie
nce
Glo
bal L
imite
d20
%2,
956
2%36
6%36
--
--
-Ar
ysta
Life
scie
nce
Switz
erla
nd S
arl
0%-
0%-
0%-
--
--
-Ar
ysta
Life
scie
nce
U.K.
Cad
Lim
ited
0%(1
)0%
(0)
0%(0
)-
--
--
Upl
Ben
elux
B.V
.(For
mer
ly Kn
own
As
Agric
hem
B.V
.)1%
122
2%23
4%23
1%10
31%
151%
15
Arys
ta L
ifesc
ienc
e Eu
rope
an In
vest
men
ts
Lim
ited
-10%
(1,3
98)
-1%
(9)
-2%
(9)
--
--
-
Arys
ta L
ifesc
ienc
e G
reat
Brit
ain
Ltd
-4%
(588
)0%
00%
0-
--
--
Arys
ta L
ifesc
ienc
e U.
K. U
sd L
imite
d-2
1%(3
,092
)-6
%(8
2)-1
4%(8
2)-
--
--
Arys
ta L
ifesc
ienc
e Re
gist
ratio
ns G
reat
Brit
ain
Ltd
0%-
0%-
0%-
--
--
-
43.Informationrequ
iredforc
onsolid
ated
fina
ncialstatemen
tpursuan
ttoSche
duleIIIo
fThe
Com
paniesAct,2013:
Not
es to
Con
solid
ated
Fin
ancia
l Sta
tem
ents
for th
e ye
ar e
nded
Mar
ch 3
1, 2
019

Annual Report 2018-19 | 293
UPL Limited
H In
cro
res
S. No
Part
icul
ars
Nam
e of
the
Entit
y in
the
Gro
up31
st M
arch
201
931
st M
arch
201
8N
et A
sset
s i.e
. to
tal a
sset
s m
inus
tota
l lia
bilit
ies
Shar
e in
pro
fit
or lo
ssSh
are
in o
ther
co
mpr
ehen
sive
in
com
e
Shar
e in
tota
l co
mpr
ehen
sive
in
com
e
Net
Ass
ets
i.e.
tota
l ass
ets
min
us to
tal
liabi
litie
s
Shar
e in
pro
fit
or lo
ssSh
are
in o
ther
co
mpr
ehen
sive
in
com
e
Shar
e in
tota
l co
mpr
ehen
sive
in
com
e
%Am
ount
%Am
ount
%Am
ount
%Am
ount
%Am
ount
%Am
ount
%Am
ount
%Am
ount
Arys
ta L
ifesc
ienc
e G
erm
any
Gm
bh0%
(5)
0%1
0%1
--
--
-Ar
ysta
Life
scie
nce
U.K.
Eur
Lim
ited
7%1,
054
0%7
1%7
--
--
-Ce
rexa
gri B
.V. -
Net
herla
nds
2%23
52%
356%
352%
220
0%5
0%5
Arys
ta L
ifesc
ienc
e N
ethe
rland
s Bv
1%19
90%
(4)
-1%
(4)
--
--
-Bl
ue S
tar B
.V.
0%-
0%(0
)0%
(0)
0%0
0%(1
)0%
-1M
acde
rmid
Agr
icultu
ral S
olut
ions
Hol
ding
s Bv
7%95
70%
(6)
-1%
(6)
--
--
-U
nite
d Ph
osph
orus
Hol
ding
s Co
oper
atie
f U.A
.-4
6%(6
,734
)-8
%(1
19)
-21%
(119
)0%
(20)
0%(1
)0%
-1M
acde
rmid
Agr
icultu
ral S
olut
ions
N
ethe
rland
s Co
oper
atie
f Ua
0%52
0%(0
)0%
(0)
--
--
-
Uni
ted
Phos
phor
us H
oldi
ngs
B.V.
, N
ethe
rland
s2%
290
6%89
16%
89-3
%(2
79)
0%(0
)0%
-0
Arys
ta L
ifesc
ienc
e Te
chno
logy
Bv
0%1
0%(0
)0%
(0)
--
--
-De
cco
Wor
ldw
ide
Post
-Har
vest
Hol
ding
s Co
oper
atie
f U.A
.0%
(0)
0%(0
)0%
(0)
0%(0
)0%
(0)
0%-0
Dutc
h Ag
ricul
tura
l For
mat
ions
Cv
12%
1,78
51%
112%
11-
--
--
Decc
o W
orld
wid
e Po
st-H
arve
st H
oldi
ngs
B.V.
0%(5
7)0%
(4)
-1%
(4)
-1%
(62)
0%2
0%2
Net
herla
nds
Agric
ultu
ral T
echn
olog
ies
Cv0%
-0%
-0%
--
--
--
Uni
ted
Phos
phor
us H
oldi
ng, B
razil
B.V
.-2
%(2
97)
-1%
(15)
-3%
(15)
-3%
(296
)-1
%(1
7)-1
%-1
7Ad
vant
a H
oldi
ngs
Bv, N
ethe
rland
-7%
(991
)-2
%(2
4)-4
%(2
4)-6
%(5
61)
2%43
2%43
Adva
nta
Net
herla
nds
Hol
ding
s Bv
,Net
herla
nds
4%55
2-1
%(1
4)-3
%(1
4)6%
588
0%(3
)0%
-3
Upl
Ital
ia S
.R.L
.(For
mer
ly Kn
own
As C
erex
agri
Italia
S.R
.L.)
0%59
1%13
2%13
1%48
0%6
0%6
Arys
ta L
ifesc
ienc
e Ita
lia S
rl0%
650%
30%
3-
--
--
Mac
derm
id A
gricu
ltura
l Sol
utio
ns It
aly
Srl
0%13
0%0
0%0
--
--
-Ar
ysta
Life
scie
nce
Bulg
aria
Eoo
d0%
70%
31%
3-
--
--
Arys
ta L
ifesc
ienc
e H
ella
s S.
A. P
lant
Pro
tect
ion,
N
utrit
ion
And
Oth
er R
elat
ed P
rodu
cts
And
Serv
ices
0%6
0%2
0%2
--
--
-
Upl
Iber
ia, S
ocie
dad
Anon
ima
1%81
0%(4
)-1
%(4
)1%
880%
00%
0Sa
ntam
ix Ib
erica
Sl
0%(5
)0%
(0)
0%(0
)-
--
--
Arys
ta L
ifesc
ienc
e Ib
eria
Slu
0%38
0%4
1%4
--
--
-De
cco
Iber
ica P
ostc
osec
ha, S
.A.U
., Sp
ain
(For
mer
ly Ce
rexa
gri I
beric
a)1%
105
1%17
3%17
1%92
1%13
1%13
Tran
ster
ra In
vest
, S. L
. U.,
Spai
n-1
%(7
6)2%
244%
24-1
%(1
04)
0%4
0%4
Cere
xagr
i S.A
.S.
2%30
81%
122%
123%
307
2%45
2%45
Neo
-Fog
S.A
.0%
370%
71%
70%
310%
30%
3Ve
to-P
harm
a Sa
0%-
0%1
0%1
--
--
-W
yjola
b S.
A.0%
-0%
00%
0-
--
--
43.Informationrequ
iredforc
onsolid
ated
fina
ncialstatemen
tpursuan
ttoSche
duleIIIo
fThe
Com
paniesAct,2013:(c
ontd
.)
Not
es to
Con
solid
ated
Fin
ancia
l Sta
tem
ents
for th
e ye
ar e
nded
Mar
ch 3
1, 2
019
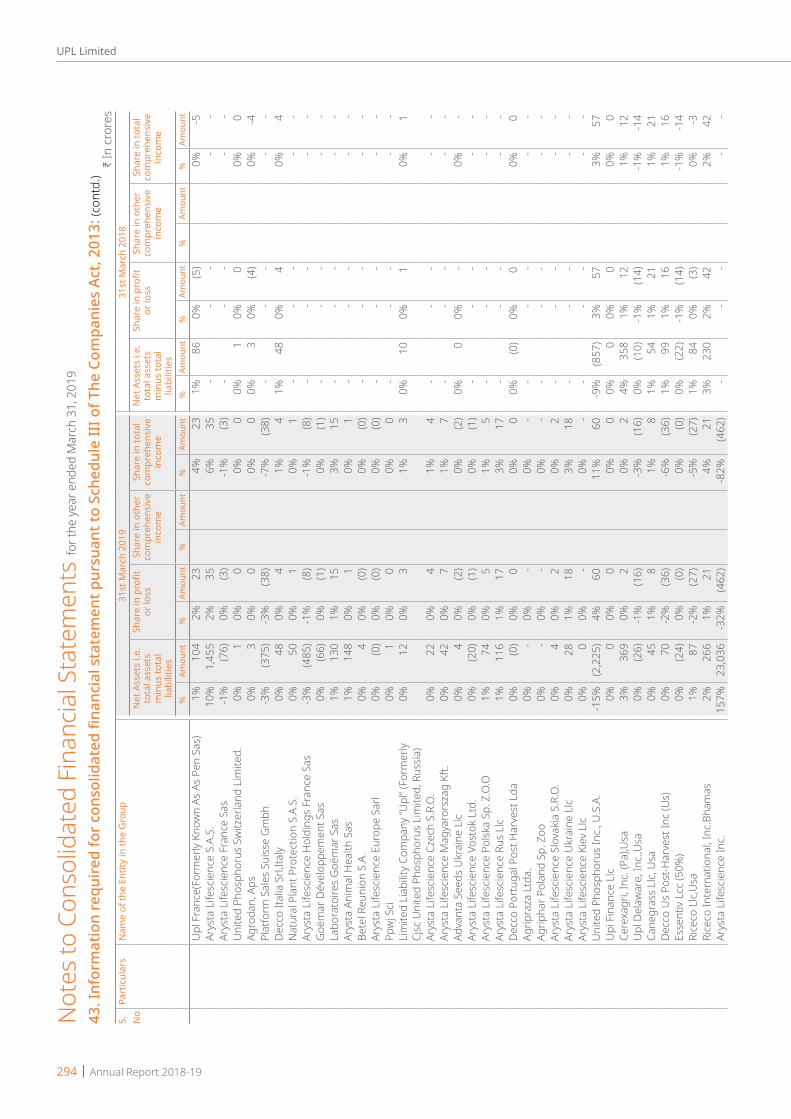
294 | Annual Report 2018-19
UPL Limited
H In
cro
res
S. No
Part
icul
ars
Nam
e of
the
Entit
y in
the
Gro
up31
st M
arch
201
931
st M
arch
201
8N
et A
sset
s i.e
. to
tal a
sset
s m
inus
tota
l lia
bilit
ies
Shar
e in
pro
fit
or lo
ssSh
are
in o
ther
co
mpr
ehen
sive
in
com
e
Shar
e in
tota
l co
mpr
ehen
sive
in
com
e
Net
Ass
ets
i.e.
tota
l ass
ets
min
us to
tal
liabi
litie
s
Shar
e in
pro
fit
or lo
ssSh
are
in o
ther
co
mpr
ehen
sive
in
com
e
Shar
e in
tota
l co
mpr
ehen
sive
in
com
e
%Am
ount
%Am
ount
%Am
ount
%Am
ount
%Am
ount
%Am
ount
%Am
ount
%Am
ount
Upl
Fra
nce(
Form
erly
Know
n As
As
Pen
Sas)
1%10
42%
234%
231%
860%
(5)
0%-5
Arys
ta L
ifesc
ienc
e S.
A.S.
10%
1,45
52%
356%
35-
--
--
Arys
ta L
ifesc
ienc
e Fr
ance
Sas
-1%
(76)
0%(3
)-1
%(3
)-
--
--
Uni
ted
Phos
phor
us S
witz
erla
nd L
imite
d.0%
10%
00%
00%
10%
00%
0Ag
roda
n, A
ps0%
30%
00%
00%
30%
(4)
0%-4
Plat
form
Sal
es S
uiss
e G
mbh
-3%
(375
)-3
%(3
8)-7
%(3
8)-
--
--
Decc
o Ita
lia S
rl,Ita
ly0%
480%
41%
41%
480%
40%
4N
atur
al P
lant
Pro
tect
ion
S.A.
S.0%
500%
10%
1-
--
--
Arys
ta L
ifesc
ienc
e H
oldi
ngs
Fran
ce S
as-3
%(4
85)
-1%
(8)
-1%
(8)
--
--
-G
oëm
ar D
ével
oppe
men
t Sas
0%(6
6)0%
(1)
0%(1
)-
--
--
Labo
rato
ires
Goë
mar
Sas
1%13
01%
153%
15-
--
--
Arys
ta A
nim
al H
ealth
Sas
1%14
80%
10%
1-
--
--
Bete
l Reu
nion
S.A
.0%
40%
(0)
0%(0
)-
--
--
Arys
ta L
ifesc
ienc
e Eu
rope
Sar
l0%
(0)
0%(0
)0%
(0)
--
--
-Pp
wj S
ci0%
10%
00%
0-
--
--
Lim
ited
Liab
ility
Com
pany
”Upl
” (Fo
rmer
ly
Cjsc
Uni
ted
Phos
phor
us L
imite
d, R
ussia
)0%
120%
31%
30%
100%
10%
1
Arys
ta L
ifesc
ienc
e Cz
ech
S.R.
O.
0%22
0%4
1%4
--
--
-Ar
ysta
Life
scie
nce
Mag
yaro
rsza
g Kf
t.0%
420%
71%
7-
--
--
Adva
nta
Seed
s U
krai
ne L
lc0%
40%
(2)
0%(2
)0%
00%
-0%
-Ar
ysta
Life
scie
nce
Vost
ok L
td.
0%(2
0)0%
(1)
0%(1
)-
--
--
Arys
ta L
ifesc
ienc
e Po
lska
Sp. Z
.O.O
1%74
0%5
1%5
--
--
-Ar
ysta
Life
scie
nce
Rus
Llc
1%11
61%
173%
17-
--
--
Decc
o Po
rtug
al P
ost H
arve
st L
da0%
(0)
0%0
0%0
0%(0
)0%
00%
0Ag
ripra
za L
tda.
0%-
0%-
0%-
--
--
-Ag
ripha
r Pol
and
Sp. Z
oo0%
-0%
-0%
--
--
--
Arys
ta L
ifesc
ienc
e Sl
ovak
ia S
.R.O
.0%
40%
20%
2-
--
--
Arys
ta L
ifesc
ienc
e U
krai
ne L
lc0%
281%
183%
18-
--
--
Arys
ta L
ifesc
ienc
e Ki
ev L
lc0%
00%
-0%
--
--
--
Uni
ted
Phos
phor
us In
c., U
.S.A
.-1
5%(2
,225
)4%
6011
%60
-9%
(857
)3%
573%
57U
pi F
inan
ce L
lc0%
00%
00%
00%
00%
00%
0Ce
rexa
gri,
Inc.
(Pa)
,Usa
3%36
90%
20%
24%
358
1%12
1%12
Upl
Del
awar
e, In
c.,U
sa0%
(26)
-1%
(16)
-3%
(16)
0%(1
0)-1
%(1
4)-1
%-1
4Ca
negr
ass
Llc,
Usa
0%45
1%8
1%8
1%54
1%21
1%21
Decc
o U
s Po
st-H
arve
st In
c (U
s)0%
70-2
%(3
6)-6
%(3
6)1%
991%
161%
16Es
sent
iv Lc
c (5
0%)
0%(2
4)0%
(0)
0%(0
)0%
(22)
-1%
(14)
-1%
-14
Rice
co L
lc,U
sa1%
87-2
%(2
7)-5
%(2
7)1%
840%
(3)
0%-3
Rice
co In
tern
atio
nal,
Inc.
Bham
as2%
266
1%21
4%21
3%23
02%
422%
42Ar
ysta
Life
scie
nce
Inc.
157%
23,0
36-3
2%(4
62)
-82%
(462
)-
--
--
Not
es to
Con
solid
ated
Fin
ancia
l Sta
tem
ents
for th
e ye
ar e
nded
Mar
ch 3
1, 2
019
43.Informationrequ
iredforc
onsolid
ated
fina
ncialstatemen
tpursuan
ttoSche
duleIIIo
fThe
Com
paniesAct,2013:(c
ontd
.)
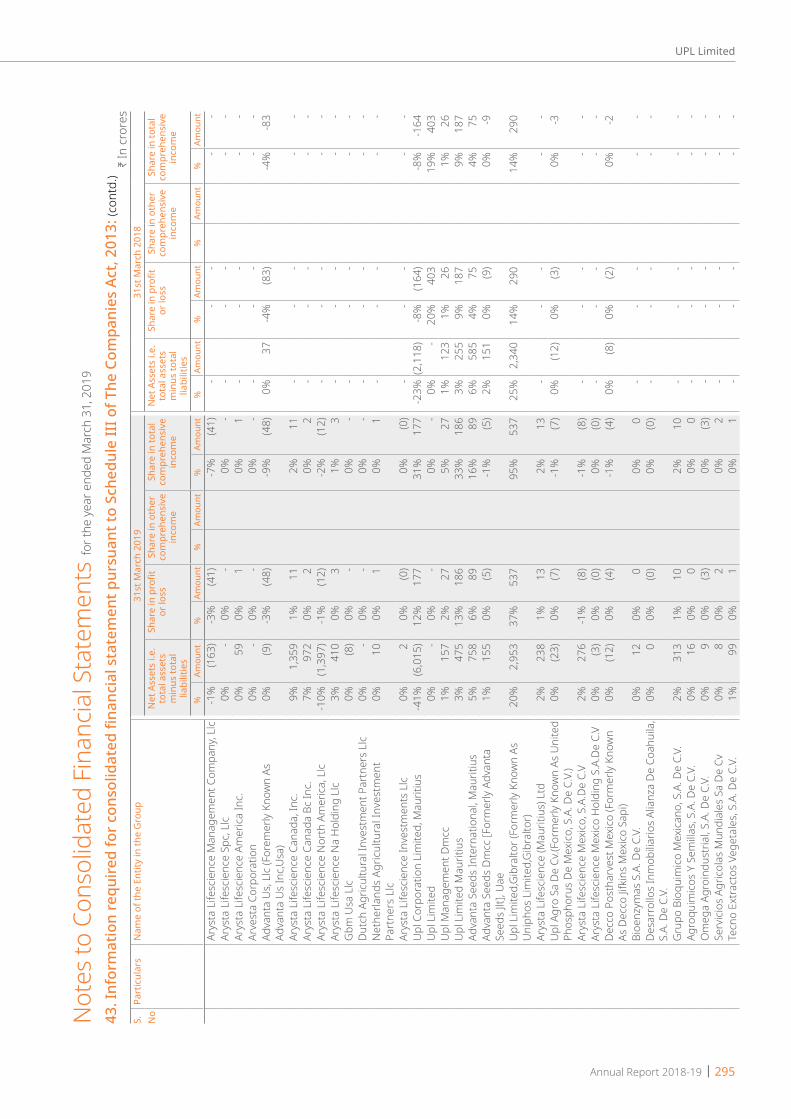
Annual Report 2018-19 | 295
UPL Limited
H In
cro
res
S. No
Part
icul
ars
Nam
e of
the
Entit
y in
the
Gro
up31
st M
arch
201
931
st M
arch
201
8N
et A
sset
s i.e
. to
tal a
sset
s m
inus
tota
l lia
bilit
ies
Shar
e in
pro
fit
or lo
ssSh
are
in o
ther
co
mpr
ehen
sive
in
com
e
Shar
e in
tota
l co
mpr
ehen
sive
in
com
e
Net
Ass
ets
i.e.
tota
l ass
ets
min
us to
tal
liabi
litie
s
Shar
e in
pro
fit
or lo
ssSh
are
in o
ther
co
mpr
ehen
sive
in
com
e
Shar
e in
tota
l co
mpr
ehen
sive
in
com
e
%Am
ount
%Am
ount
%Am
ount
%Am
ount
%Am
ount
%Am
ount
%Am
ount
%Am
ount
Arys
ta L
ifesc
ienc
e M
anag
emen
t Com
pany
, Llc
-1%
(163
)-3
%(4
1)-7
%(4
1)-
--
--
Arys
ta L
ifesc
ienc
e Sp
c, Ll
c0%
-0%
-0%
--
--
--
Arys
ta L
ifesc
ienc
e Am
erica
Inc.
0%59
0%1
0%1
--
--
-Ar
vest
a Co
rpor
atio
n0%
-0%
-0%
--
--
--
Adva
nta
Us,
Llc
(For
emer
ly Kn
own
As
Adva
nta
Us
Inc,U
sa)
0%(9
)-3
%(4
8)-9
%(4
8)0%
37-4
%(8
3)-4
%-8
3
Arys
ta L
ifesc
ienc
e Ca
nada
, Inc
.9%
1,35
91%
112%
11-
--
--
Arys
ta L
ifesc
ienc
e Ca
nada
Bc
Inc.
7%97
20%
20%
2-
--
--
Arys
ta L
ifesc
ienc
e N
orth
Am
erica
, Llc
-10%
(1,3
97)
-1%
(12)
-2%
(12)
--
--
-Ar
ysta
Life
scie
nce
Na
Hol
ding
Llc
3%41
00%
31%
3-
--
--
Gbm
Usa
Llc
0%(8
)0%
-0%
--
--
--
Dutc
h Ag
ricul
tura
l Inv
estm
ent P
artn
ers
Llc
0%-
0%-
0%-
--
--
-N
ethe
rland
s Ag
ricul
tura
l Inv
estm
ent
Part
ners
Llc
0%10
0%1
0%1
--
--
-
Arys
ta L
ifesc
ienc
e In
vest
men
ts L
lc0%
20%
(0)
0%(0
)-
--
--
Upl
Cor
pora
tion
Lim
ited,
Mau
ritiu
s-4
1%(6
,015
)12
%17
731
%17
7-2
3%(2
,118
)-8
%(1
64)
-8%
-164
Upl
Lim
ited
0%-
0%-
0%-
0%-
20%
403
19%
403
Upl
Man
agem
ent D
mcc
1%15
72%
275%
271%
123
1%26
1%26
Upl
Lim
ited
Mau
ritiu
s3%
475
13%
186
33%
186
3%25
59%
187
9%18
7Ad
vant
a Se
eds
Inte
rnat
iona
l, M
aurit
ius
5%75
86%
8916
%89
6%58
54%
754%
75Ad
vant
a Se
eds
Dmcc
[For
mer
ly Ad
vant
a Se
eds
Jlt],
Uae
1%15
50%
(5)
-1%
(5)
2%15
10%
(9)
0%-9
Upl
Lim
ited,
Gib
ralto
r (Fo
rmer
ly Kn
own
As
Uni
phos
Lim
ited,
Gib
ralto
r)20
%2,
953
37%
537
95%
537
25%
2,34
014
%29
014
%29
0
Arys
ta L
ifesc
ienc
e (M
aurit
ius)
Ltd
2%23
81%
132%
13-
--
--
Upl
Agr
o Sa
De
Cv.(F
orm
erly
Know
n As
Uni
ted
Phos
phor
us D
e M
exico
, S.A
. De
C.V.
)0%
(23)
0%(7
)-1
%(7
)0%
(12)
0%(3
)0%
-3
Arys
ta L
ifesc
ienc
e M
exico
, S.A
.De
C.V
2%27
6-1
%(8
)-1
%(8
)-
--
--
Arys
ta L
ifesc
ienc
e M
exico
Hol
ding
S.A
.De
C.V
0%(3
)0%
(0)
0%(0
)-
--
--
Decc
o Po
stha
rves
t Mex
ico (F
orm
erly
Know
n As
Dec
co Ji
fkin
s M
exico
Sap
i)0%
(12)
0%(4
)-1
%(4
)0%
(8)
0%(2
)0%
-2
Bioe
nzym
as S
.A. D
e C.
V.0%
120%
00%
0-
--
--
Desa
rrol
los
Inm
obilia
rios
Alia
nza
De C
oahu
ila,
S.A.
De
C.V.
0%0
0%(0
)0%
(0)
--
--
-
Gru
po B
ioqu
imico
Mex
icano
, S.A
. De
C.V.
2%31
31%
102%
10-
--
--
Agro
quim
icos
Y Se
milla
s, S.
A. D
e C.
V.0%
160%
00%
0-
--
--
Om
ega
Agro
indu
stria
l, S.
A. D
e C.
V.0%
90%
(3)
0%(3
)-
--
--
Serv
icios
Agr
icola
s M
undi
ales
Sa
De C
v0%
80%
20%
2-
--
--
Tecn
o Ex
tract
os V
eget
ales
, S.A
. De
C.V.
1%99
0%1
0%1
--
--
-
Not
es to
Con
solid
ated
Fin
ancia
l Sta
tem
ents
for th
e ye
ar e
nded
Mar
ch 3
1, 2
019
43.Informationrequ
iredforc
onsolid
ated
fina
ncialstatemen
tpursuan
ttoSche
duleIIIo
fThe
Com
paniesAct,2013:(c
ontd
.)

296 | Annual Report 2018-19
UPL Limited
H In
cro
res
S. No
Part
icul
ars
Nam
e of
the
Entit
y in
the
Gro
up31
st M
arch
201
931
st M
arch
201
8N
et A
sset
s i.e
. to
tal a
sset
s m
inus
tota
l lia
bilit
ies
Shar
e in
pro
fit
or lo
ssSh
are
in o
ther
co
mpr
ehen
sive
in
com
e
Shar
e in
tota
l co
mpr
ehen
sive
in
com
e
Net
Ass
ets
i.e.
tota
l ass
ets
min
us to
tal
liabi
litie
s
Shar
e in
pro
fit
or lo
ssSh
are
in o
ther
co
mpr
ehen
sive
in
com
e
Shar
e in
tota
l co
mpr
ehen
sive
in
com
e
%Am
ount
%Am
ount
%Am
ount
%Am
ount
%Am
ount
%Am
ount
%Am
ount
%Am
ount
Tesa
urus
Mex
ico S
.A. D
e C.
V.0%
00%
-0%
--
--
--
Adva
nta
Com
mer
cio D
e Se
men
tes
Ltda
,Bra
zil-1
%(9
2)-3
%(4
6)-8
%(4
6)-2
%(2
17)
-4%
(83)
-4%
-83
Perr
ey P
artic
ipaç
ões
S.A
0%7
0%(0
)0%
(0)
0%8
0%-
0%-
Uni
phos
Indu
stria
E C
omer
cio D
e Pr
odut
os
Qui
mico
s Lt
da.
0%12
1%19
3%19
2%14
01%
111%
11
Uni
ted
Phos
phor
us In
dúst
ria E
Com
ércio
de
Prod
utos
Quí
mico
s Lt
da.
0%-
0%-
0%-
0%(1
3)0%
-0%
-
Upl
Do
Bras
il - I
ndus
tria
E C
omér
cio D
e In
sum
os A
grop
ecuá
rios
S.A.
-8%
(1,1
00)
13%
194
34%
194
13%
1,15
93%
522%
52
Volca
no A
groc
ienc
ia In
dust
ria E
Com
ercio
De
Defe
nsivo
s Ag
ricol
as L
tda
0%2
0%(0
)0%
(0)
--
--
-
Arys
ta L
ifesc
ienc
e Ce
ntro
amer
ica, S
.A.
0%-
0%-
0%-
--
--
-Ar
ysta
Life
scie
nce
De G
uate
mal
a, S
.A.
0%9
0%(0
)0%
(0)
--
--
-In
dust
rias
Agrip
har S
a0%
-0%
-0%
--
--
--
Arys
ta L
ifesc
ienc
e Co
rpor
atio
n Re
publ
ica
Dom
inica
na, S
rl0%
-0%
-0%
--
--
--
Gru
po B
ioqu
imico
Mex
icano
Rep
ublic
a Do
min
icana
Sa
0%-
0%-
0%-
--
--
-
Upl
Cos
ta R
ica S
.A.
0%(2
0)0%
(1)
0%(1
)0%
(26)
-1%
(12)
-1%
-12
Arys
ta L
ifesc
ienc
e S.
R.L.
0%40
0%(1
)0%
(1)
--
--
-U
pl B
olivi
a S.
A0%
(13)
0%(7
)-1
%(7
)0%
(1)
0%(1
)0%
-1U
pl P
arag
uay
S.A.
0%(6
)0%
41%
40%
(6)
0%(4
)0%
-4Ar
ysta
Life
scie
nce
Para
guay
S.R
.L.
0%20
0%1
0%1
--
--
-Ar
vest
a Pa
ragu
ay S
.A.
0%-
0%-
0%-
--
--
-Dv
a Te
chno
logy
Arg
entin
a S.
A.0%
-0%
00%
00%
00%
-0%
-Ic
ona
Sanl
uis
S A
- Arg
entin
a0%
(24)
0%(6
)-1
%(6
)0%
(18)
0%(5
)0%
-5Ad
vant
a Se
milla
s Sa
ic, A
rgen
tina
0%(5
7)-2
%(2
2)-4
%(2
2)0%
18-1
%(2
9)-1
%-2
9Ar
ysta
Life
scie
nce
Cost
a Ri
ca S
a.0%
(1)
0%0
0%0
--
--
-Ag
ripha
r De
Cost
a Ri
ca S
a0%
-0%
-0%
--
--
--
Arys
ta A
groq
uim
icos
Y Fe
rtilz
ante
s U
rugu
ay
Sa0%
-0%
-0%
--
--
--
Arys
ta L
ifesc
ienc
e Ec
uado
r S.A
.0%
-0%
-0%
--
--
--
Arys
ta-L
ifesc
ienc
e Ec
uado
r S.A
.0%
100%
(1)
0%(1
)-
--
--
Upl
Arg
entin
a S
A (F
orm
erly
Know
n As
Icon
a S
A - A
rgen
tina)
-2%
(235
)-1
5%(2
20)
-39%
(220
)0%
(45)
-4%
(80)
-4%
-80
Arys
ta L
ifesc
ienc
e Ar
gent
ina
S.A.
1%17
8-1
%(1
3)-2
%(1
3)-
--
--
Decc
o Ch
ile S
pa0%
191%
71%
70%
120%
60%
6Ar
ysta
Life
scie
nce
Chile
S.A
.2%
300
0%3
1%3
--
--
-Ar
ysta
Life
scie
nce
Peru
S.A
.C0%
20%
00%
0-
--
--
Not
es to
Con
solid
ated
Fin
ancia
l Sta
tem
ents
for th
e ye
ar e
nded
Mar
ch 3
1, 2
019
43.Informationrequ
iredforc
onsolid
ated
fina
ncialstatemen
tpursuan
ttoSche
duleIIIo
fThe
Com
paniesAct,2013:(c
ontd
.)
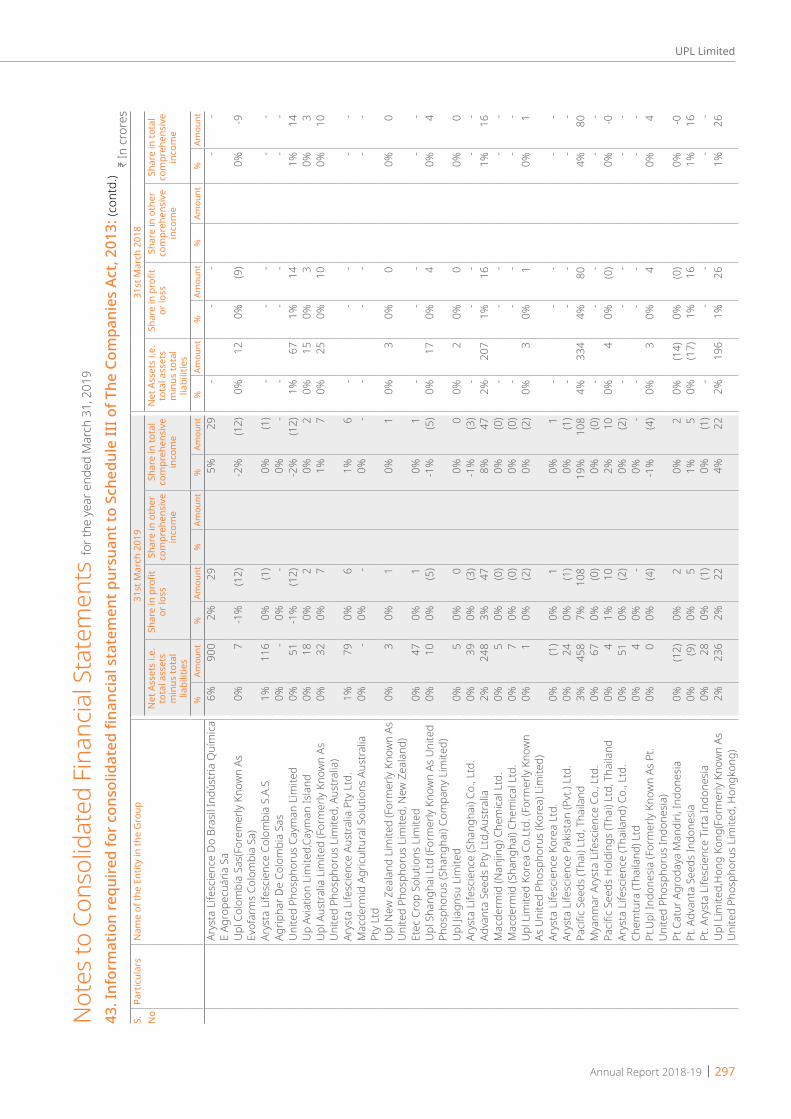
Annual Report 2018-19 | 297
UPL Limited
H In
cro
res
S. No
Part
icul
ars
Nam
e of
the
Entit
y in
the
Gro
up31
st M
arch
201
931
st M
arch
201
8N
et A
sset
s i.e
. to
tal a
sset
s m
inus
tota
l lia
bilit
ies
Shar
e in
pro
fit
or lo
ssSh
are
in o
ther
co
mpr
ehen
sive
in
com
e
Shar
e in
tota
l co
mpr
ehen
sive
in
com
e
Net
Ass
ets
i.e.
tota
l ass
ets
min
us to
tal
liabi
litie
s
Shar
e in
pro
fit
or lo
ssSh
are
in o
ther
co
mpr
ehen
sive
in
com
e
Shar
e in
tota
l co
mpr
ehen
sive
in
com
e
%Am
ount
%Am
ount
%Am
ount
%Am
ount
%Am
ount
%Am
ount
%Am
ount
%Am
ount
Arys
ta L
ifesc
ienc
e Do
Bra
sil In
dúst
ria Q
uím
ica
E Ag
rope
cuár
ia S
a6%
900
2%29
5%29
--
--
-
Upl
Col
ombi
a Sa
s(Fo
rem
erly
Know
n As
Ev
ofar
ms
Colo
mbi
a Sa
)0%
7-1
%(1
2)-2
%(1
2)0%
120%
(9)
0%-9
Arys
ta L
ifesc
ienc
e Co
lom
bia
S.A.
S1%
116
0%(1
)0%
(1)
--
--
-Ag
ripha
r De
Colo
mbi
a Sa
s0%
-0%
-0%
--
--
--
Uni
ted
Phos
phor
us C
aym
an L
imite
d0%
51-1
%(1
2)-2
%(1
2)1%
671%
141%
14U
p Av
iatio
n Li
mite
d,Ca
yman
Isla
nd0%
180%
20%
20%
150%
30%
3U
pl A
ustra
lia L
imite
d (F
orm
erly
Know
n As
U
nite
d Ph
osph
orus
Lim
ited,
Aus
tral
ia)
0%32
0%7
1%7
0%25
0%10
0%10
Arys
ta L
ifesc
ienc
e Au
stra
lia P
ty L
td.
1%79
0%6
1%6
--
--
-M
acde
rmid
Agr
icultu
ral S
olut
ions
Aus
tralia
Pt
y Lt
d0%
-0%
-0%
--
--
--
Upl
New
Zea
land
Lim
ited
(For
mer
ly Kn
own
As
Uni
ted
Phos
phor
us L
imite
d, N
ew Z
eala
nd)
0%3
0%1
0%1
0%3
0%0
0%0
Etec
Cro
p So
lutio
ns L
imite
d0%
470%
10%
1-
--
--
Upl
Sha
ngha
i Ltd
(For
mer
ly Kn
own
As U
nite
d Ph
osph
orus
(Sha
ngha
i) Co
mpa
ny L
imite
d)0%
100%
(5)
-1%
(5)
0%17
0%4
0%4
Upl
Jiag
nsu
Lim
ited
0%5
0%0
0%0
0%2
0%0
0%0
Arys
ta L
ifesc
ienc
e (S
hang
hai)
Co.,
Ltd.
0%39
0%(3
)-1
%(3
)-
--
--
Adva
nta
Seed
s Pt
y Lt
d,Au
stra
lia2%
248
3%47
8%47
2%20
71%
161%
16M
acde
rmid
(Nan
jing)
Che
mica
l Ltd
.0%
50%
(0)
0%(0
)-
--
--
Mac
derm
id (S
hang
hai)
Chem
ical L
td.
0%7
0%(0
)0%
(0)
--
--
-U
pl L
imite
d Ko
rea
Co.L
td. (
Form
erly
Know
n As
Uni
ted
Phos
phor
us (K
orea
) Lim
ited)
0%1
0%(2
)0%
(2)
0%3
0%1
0%1
Arys
ta L
ifesc
ienc
e Ko
rea
Ltd.
0%(1
)0%
10%
1-
--
--
Arys
ta L
ifesc
ienc
e Pa
kist
an (P
vt.)
Ltd.
0%24
0%(1
)0%
(1)
--
--
-Pa
cific
Seed
s (T
hai)
Ltd,
Tha
iland
3%45
87%
108
19%
108
4%33
44%
804%
80M
yanm
ar A
ryst
a Li
fesc
ienc
e Co
., Lt
d.0%
670%
(0)
0%(0
)-
--
--
Pacifi
c Se
eds
Hol
ding
s (T
hai)
Ltd,
Tha
iland
0%4
1%10
2%10
0%4
0%(0
)0%
-0Ar
ysta
Life
scie
nce
(Tha
iland
) Co.
, Ltd
.0%
510%
(2)
0%(2
)-
--
--
Chem
tura
(Tha
iland
) Ltd
0%4
0%-
0%-
--
--
-Pt
.Upl
Indo
nesia
(For
mer
ly Kn
own
As P
t. U
nite
d Ph
osph
orus
Indo
nesia
)0%
00%
(4)
-1%
(4)
0%3
0%4
0%4
Pt C
atur
Agr
oday
a M
andi
ri, In
done
sia0%
(12)
0%2
0%2
0%(1
4)0%
(0)
0%-0
Pt. A
dvan
ta S
eeds
Indo
nesia
0%(9
)0%
51%
50%
(17)
1%16
1%16
Pt. A
ryst
a Li
fesc
ienc
e Ti
rta
Indo
nesia
0%28
0%(1
)0%
(1)
--
--
-U
pl L
imite
d,H
ong
Kong
(For
mer
ly Kn
own
As
Uni
ted
Phos
phor
us L
imite
d, H
ongk
ong)
2%23
62%
224%
222%
196
1%26
1%26
43.Informationrequ
iredforc
onsolid
ated
fina
ncialstatemen
tpursuan
ttoSche
duleIIIo
fThe
Com
paniesAct,2013:(c
ontd
.)
Not
es to
Con
solid
ated
Fin
ancia
l Sta
tem
ents
for th
e ye
ar e
nded
Mar
ch 3
1, 2
019

298 | Annual Report 2018-19
UPL Limited
H In
cro
res
S. No
Part
icul
ars
Nam
e of
the
Entit
y in
the
Gro
up31
st M
arch
201
931
st M
arch
201
8N
et A
sset
s i.e
. to
tal a
sset
s m
inus
tota
l lia
bilit
ies
Shar
e in
pro
fit
or lo
ssSh
are
in o
ther
co
mpr
ehen
sive
in
com
e
Shar
e in
tota
l co
mpr
ehen
sive
in
com
e
Net
Ass
ets
i.e.
tota
l ass
ets
min
us to
tal
liabi
litie
s
Shar
e in
pro
fit
or lo
ssSh
are
in o
ther
co
mpr
ehen
sive
in
com
e
Shar
e in
tota
l co
mpr
ehen
sive
in
com
e
%Am
ount
%Am
ount
%Am
ount
%Am
ount
%Am
ount
%Am
ount
%Am
ount
%Am
ount
Upl
Phi
lippi
nes
Inc.
(For
mer
ly Kn
own
As
Uni
ted
Phos
phor
us C
orp.
Phi
lippi
nes)
0%2
1%10
2%10
0%(1
)0%
(7)
0%-7
Arys
ta L
ifesc
ienc
e Ph
ilippi
nes
Inc.
0%(5
0)0%
(1)
0%(1
)-
--
--
Upl
Vie
tnam
Co.
Ltd
(For
mer
ly Kn
own
As
Uni
ted
Phos
phor
us V
ietn
am C
o., L
imite
d)1%
106
2%24
4%24
1%79
1%21
1%21
Arys
ta L
ifesc
ienc
e Vi
etna
m C
o., L
td.
0%73
1%14
3%14
--
--
-U
niph
os M
alay
sia S
dn B
hd0%
20%
-0%
-0%
20%
(0)
0%-0
Agrip
har S
dn B
hd0%
-0%
-0%
--
--
--
Arys
ta H
ealth
And
Nut
ritio
n Sc
ienc
es
Corp
orat
ion
3%41
81%
122%
12-
--
--
Arys
ta L
ifesc
ienc
e Co
rpor
atio
n-2
1%(3
,084
)-3
%(4
2)-7
%(4
2)-
--
--
Arys
ta L
ifesc
ienc
e Ja
pan
Hol
ding
s G
oudo
u Ka
isha
0%(0
)0%
(0)
0%(0
)-
--
--
Upl
Lim
ited,
Japa
n-1
9%(2
,793
)-3
%(4
3)-8
%(4
3)1%
103
0%(1
)0%
-1An
ning
Dec
co F
ine
Chem
ical C
o. L
imite
d, C
hina
0%30
0%5
1%5
0%26
0%0
0%0
Arys
ta L
ifesc
ienc
e As
ia P
te.,
Ltd.
0%47
0%(0
)0%
(0)
--
--
-Ri
ceco
Inte
rnat
iona
l Ban
glad
esh
Lim
ited
0%5
0%2
0%2
0%1
0%0
0%0
Upl
Zira
at V
e Ki
mya
San
ayi V
e Ti
care
t Lim
ited
Sirk
eti (
Form
erly
Know
n As
Cer
exag
ri Zi
raat
Ve
Kim
ya S
anay
i Ve
Tica
ret L
imite
d Si
rket
i, Tu
rkey
)
0%69
-2%
(24)
-4%
(24)
0%2
-1%
(15)
-1%
-15
Upl
Agr
omed
Toh
umcu
luk
Sa,Tu
rkey
0%(1
2)-2
%(3
2)-6
%(3
2)0%
190%
(1)
0%-1
Decc
o Gı
da Ta
rım V
e Zi
rai Ü
rünl
er S
an. T
ic A.
S.0%
70%
31%
3-
--
--
Arys
ta L
ifesc
ienc
e Tu
rkey
Tarim
Uru
nler
i Li
mite
d Si
rket
i0%
00%
(0)
0%(0
)-
--
--
Safe
pack
Pro
duct
s Li
mite
d,Is
real
0%28
-1%
(12)
-2%
(12)
0%40
0%(3
)0%
-3Ag
rifoc
us L
imita
da1%
940%
41%
4-
--
--
Citra
shin
e (P
ty) L
td, S
outh
Afri
ca(F
orem
rly
Know
n As
Frie
dshe
lf 11
14 (P
ty) L
td, S
outh
Af
rica)
0%(4
)0%
10%
10%
(6)
0%(1
)0%
-1
Anch
orpr
ops
39 (P
ty) L
td0%
(2)
0%0
0%0
--
--
-Ar
ysta
Life
scie
nce
Hol
ding
s Sa
(Pty
) Ltd
-1%
(79)
0%(0
)0%
(0)
--
--
-Ca
llieth
a In
vest
men
ts (P
ty) L
td0%
160%
-0%
--
--
--
Volca
no A
gros
cienc
e (P
ty) L
td1%
107
0%(4
)-1
%(4
)-
--
--
Arys
ta L
ifesc
ienc
e So
uth
Afric
a (P
ty) L
td1%
980%
(7)
-1%
(7)
--
--
-Vo
lcano
Che
mica
ls (P
ty) L
td0%
00%
-0%
--
--
--
Kem
pton
Che
mica
ls (P
ty) L
td0%
-0%
-0%
--
--
--
Side
wal
k Tr
adin
g (P
ty) L
td0%
(0)
0%-
0%-
--
--
-Ar
ysta
Life
scie
nce
Keny
a Lt
d.0%
40%
10%
1-
--
--
43.Informationrequ
iredforc
onsolid
ated
fina
ncialstatemen
tpursuan
ttoSche
duleIIIo
fThe
Com
paniesAct,2013:(c
ontd
.)
Not
es to
Con
solid
ated
Fin
ancia
l Sta
tem
ents
for th
e ye
ar e
nded
Mar
ch 3
1, 2
019

Annual Report 2018-19 | 299
UPL Limited
43.Informationrequ
iredforc
onsolid
ated
fina
ncialstatemen
tpursuan
ttoSche
duleIIIo
fThe
Com
paniesAct,2013:(c
ontd
.)H In
cro
res
S. No
Part
icul
ars
Nam
e of
the
Entit
y in
the
Gro
up31
st M
arch
201
931
st M
arch
201
8N
et A
sset
s i.e
. to
tal a
sset
s m
inus
tota
l lia
bilit
ies
Shar
e in
pro
fit
or lo
ssSh
are
in o
ther
co
mpr
ehen
sive
in
com
e
Shar
e in
tota
l co
mpr
ehen
sive
in
com
e
Net
Ass
ets
i.e.
tota
l ass
ets
min
us to
tal
liabi
litie
s
Shar
e in
pro
fit
or lo
ssSh
are
in o
ther
co
mpr
ehen
sive
in
com
e
Shar
e in
tota
l co
mpr
ehen
sive
in
com
e
%Am
ount
%Am
ount
%Am
ount
%Am
ount
%Am
ount
%Am
ount
%Am
ount
%Am
ount
Arys
ta L
ifesc
ienc
e Ta
nzan
ia L
td0%
(3)
0%(1
)0%
(1)
--
--
-Ar
ysta
Life
scie
nce
Cam
erou
n Sa
0%(8
)0%
31%
3-
--
--
Upl
Afri
ca S
arl
0%-
0%-
0%-
0%-
0%0
0%0
Prol
ong
Lim
ited
0%(0
)0%
(2)
0%(2
)0%
20%
(1)
0%-1
Arys
ta L
ifesc
ienc
e Eg
ypt L
td0%
20%
(0)
0%(0
)-
--
--
Arys
ta L
ifesc
ienc
e To
go S
au0%
20%
(0)
0%(0
)-
--
--
Calli
Gha
na L
td.
0%(1
0)0%
(1)
0%(1
)-
--
--
Calliv
oire
Sgf
d S.
A.0%
430%
(0)
0%(0
)-
--
--
Mal
i Pro
tect
ion
Des
Cultu
res
(M.P.
C.) S
a0%
50%
31%
3-
--
--
0%-
0%-
3N
on-c
ontr
ollin
g in
tere
st-2
3%(3
,358
)-5
%(7
2)-1
3%(7
2)0%
(19)
0%(8
)0%
-84
Asso
ciate
sIn
dian
Kera
la E
nviro
Infra
stru
ctur
e Li
mite
d0%
50%
10%
10%
30%
10%
1W
eath
er R
isk M
anag
emen
t Priv
ate
Ltd
0%13
0%(1
)0%
(1)
0%10
0%(0
)0%
-0U
nive
rsal
Pes
toch
em (I
ndus
trie
s) L
imite
d0%
-0%
-0%
--
--
--
--
Chem
isynt
h (V
api)
Lim
ited
0%-
0%-
0%-
0%0%
(0)
0%-0
Fore
ign
3Sb
Prod
utos
Agr
ícola
s S.
A. (4
5%)
1%89
0%(1
)0%
(1)
1%10
20%
(4)
0%-4
Sina
gro
Prod
utos
Agr
opec
uário
s S.
A. (4
5%)
0%-
0%-
0%-
0%-5
%(1
03)
-5%
-103
Sear
a Bo
nita
Sem
ente
s S.
A. (3
3.33
%)
1%19
00%
20%
22%
208
0%1
0%1
Agri
Foku
s (P
ty) L
td.
0%4
0%0
0%0
Nov
on R
etai
l Com
pany
(Pty
) Ltd
.0%
70%
00%
0Ag
rona
mic
(Pty
) Ltd
.0%
50%
00%
0N
ovon
Pro
tect
a (P
ty) L
td0%
70%
00%
0Si
lvix
Fore
stry
(Pty
) Ltd
.0%
00%
00%
0N
exus
Ag
(Pty
) Ltd
0%10
0%0
0%0
Dalia
n Ad
vanc
ed C
hem
ical C
o.Lt
d.0%
10%
(0)
0%(0
)So
ciété
Des
Pro
duits
Indu
strie
ls Et
Agr
icole
s0%
40%
-0%
-5
Join
t Ven
ture
Fore
ign
Hod
agay
a U
PL C
o. L
imite
d0%
230%
20%
20%
210%
10%
1Lo
ngre
ach
Plan
t Bre
eder
s M
anag
emen
t Pty
Li
mite
d0%
501%
92%
90%
421%
111%
11
6O
ther
Com
preh
ensiv
e In
com
e10
0%(8
82)
-156
%(8
82)
100%
703%
70To
tal
100%
14,6
4510
0%1,
447
100%
(882
)10
0%56
510
0%9,
169
100%
2,02
210
0%70
100%
2,09
2
Not
es to
Con
solid
ated
Fin
ancia
l Sta
tem
ents
for th
e ye
ar e
nded
Mar
ch 3
1, 2
019
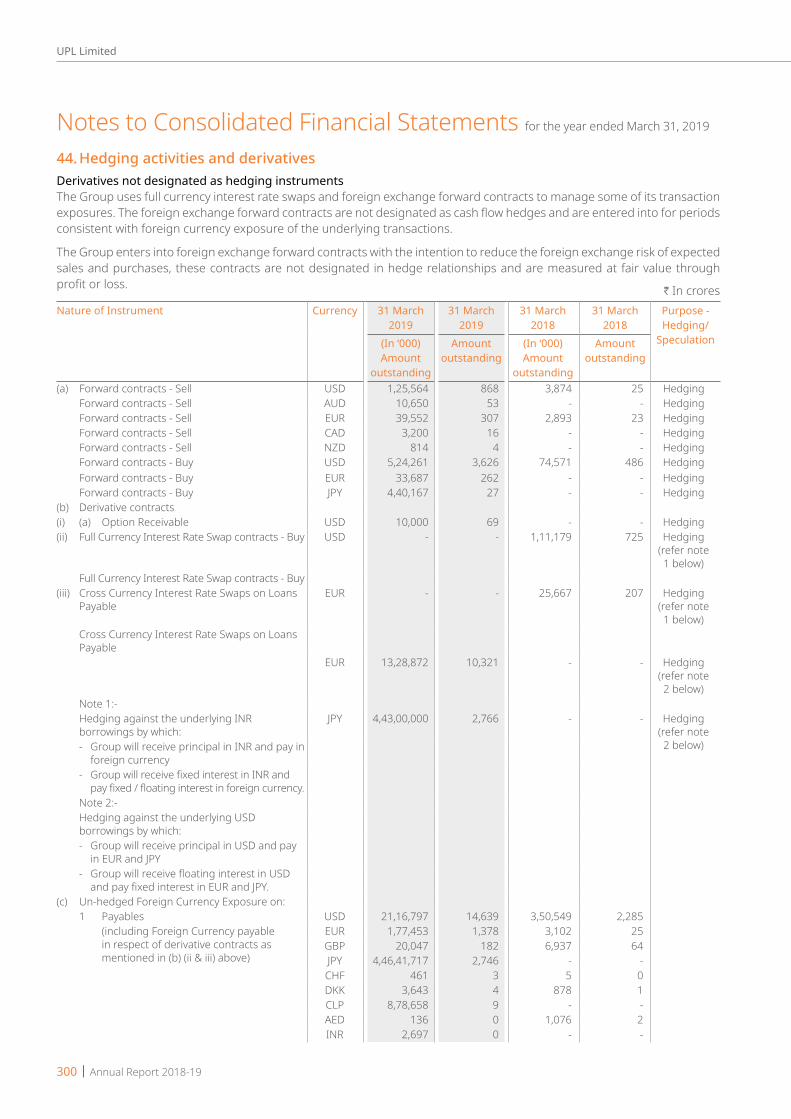
300 | Annual Report 2018-19
UPL Limited
44. Hedging activities and derivativesDerivatives not designated as hedging instrumentsThe Group uses full currency interest rate swaps and foreign exchange forward contracts to manage some of its transaction exposures. The foreign exchange forward contracts are not designated as cash flow hedges and are entered into for periods consistent with foreign currency exposure of the underlying transactions.
The Group enters into foreign exchange forward contracts with the intention to reduce the foreign exchange risk of expected sales and purchases, these contracts are not designated in hedge relationships and are measured at fair value through profit or loss.
H In croresNature of Instrument Currency 31 March
201931 March
201931 March
201831 March
2018Purpose - Hedging/
Speculation(In ‘000)Amount
outstanding
Amount outstanding
(In ‘000)Amount
outstanding
Amount outstanding
(a) Forward contracts - Sell USD 1,25,564 868 3,874 25 Hedging Forward contracts - Sell AUD 10,650 53 - - Hedging Forward contracts - Sell EUR 39,552 307 2,893 23 Hedging Forward contracts - Sell CAD 3,200 16 - - Hedging Forward contracts - Sell NZD 814 4 - - Hedging Forward contracts - Buy USD 5,24,261 3,626 74,571 486 Hedging Forward contracts - Buy EUR 33,687 262 - - Hedging Forward contracts - Buy JPY 4,40,167 27 - - Hedging(b) Derivative contracts (i) (a) Option Receivable USD 10,000 69 - - Hedging(ii) Full Currency Interest Rate Swap contracts - Buy USD - - 1,11,179 725 Hedging
(refer note 1 below)
Full Currency Interest Rate Swap contracts - Buy(iii) Cross Currency Interest Rate Swaps on Loans
PayableEUR - - 25,667 207 Hedging
(refer note 1 below)
Cross Currency Interest Rate Swaps on Loans Payable
EUR 13,28,872 10,321 - - Hedging (refer note 2 below)
Note 1:- Hedging against the underlying INR
borrowings by which:JPY 4,43,00,000 2,766 - - Hedging
(refer note 2 below)
- Group will receive principal in INR and pay in foreign currency
- Group will receive fixed interest in INR and pay fixed / floating interest in foreign currency.
Note 2:- Hedging against the underlying USD
borrowings by which:
- Group will receive principal in USD and pay in EUR and JPY
- Group will receive floating interest in USD and pay fixed interest in EUR and JPY.
(c) Un-hedged Foreign Currency Exposure on: 1 Payables USD 21,16,797 14,639 3,50,549 2,285
(including Foreign Currency payable in respect of derivative contracts as mentioned in (b) (ii & iii) above)
EUR 1,77,453 1,378 3,102 25 GBP 20,047 182 6,937 64 JPY 4,46,41,717 2,746 - - CHF 461 3 5 0 DKK 3,643 4 878 1 CLP 8,78,658 9 - - AED 136 0 1,076 2 INR 2,697 0 - -
Notes to Consolidated Financial Statements for the year ended March 31, 2019

Annual Report 2018-19 | 301
UPL Limited
Nature of Instrument Currency 31 March 2019
31 March 2019
31 March 2018
31 March 2018
Purpose - Hedging/
Speculation(In ‘000)Amount
outstanding
Amount outstanding
(In ‘000)Amount
outstanding
Amount outstanding
PLN 11 0 11 0 CAD 11,595 60 146 1 BRL 677 1 - - MUR 776 0 - - AUD 1,800 9 - - COP 1,48,61,709 32 73,61,730 17 ARS 1,77,319 28 - - CZK 24,105 7 0 0 HUF 93,837 2 163 0
CFA/XOF 1,70,633 2 - - TRY 59 0 - - ZAR 4,660 2 - - PYG 8,23,512 1 - - THB - - 421 0
2 Receivable USD 12,40,402 8,578 3,78,725 2,468 EUR 1,77,158 1,376 6,805 55 GBP 29,235 265 5,085 47 JPY 4,46,59,602 2,747 1,06,713 7 CHF 181 1 864 6 DKK 932 1 834 1 CLP 25,45,931 26 - - AED 946 2 8 0 NZD 24 0 - - PLN 4,092 7 3,431 7 CAD 85,528 441 7,978 40 AUD 6,806 33 1,450 7 COP 2,54,15,945 55 34,56,462 8 ARS 6,10,999 97 - -
CFA/XOF 2,948 0 - - ZAR 5,77,495 275 - - PYG 25,030 0 - - RON 5,841 10 - - RUB 2,38,602 25 - -
45.Catergory-wiseclassificationofFinancialInstruments H In croresRefer note
Non-Current CurrentAs at
March 31, 2019As at
March 31, 2018As at
March 31, 2019As at
March 31, 2018(A) Accounting, classification and Fair Value :Investments accounted for using the equity method
5 408 386 - -
Financial assets measured at fair value through profit or loss (FVTPL)Investments in others (unsecured) 5 9 433 2 -Investments in unquoted equity shares 5 42 40 - -Investments in unquoted optionally convertible bonds
5 83 76 - -
Derivative contracts (net) 7 - - 28 -135 549 30 -
H In crores
Notes to Consolidated Financial Statements for the year ended March 31, 2019
44. Hedging activities and derivatives (contd.)
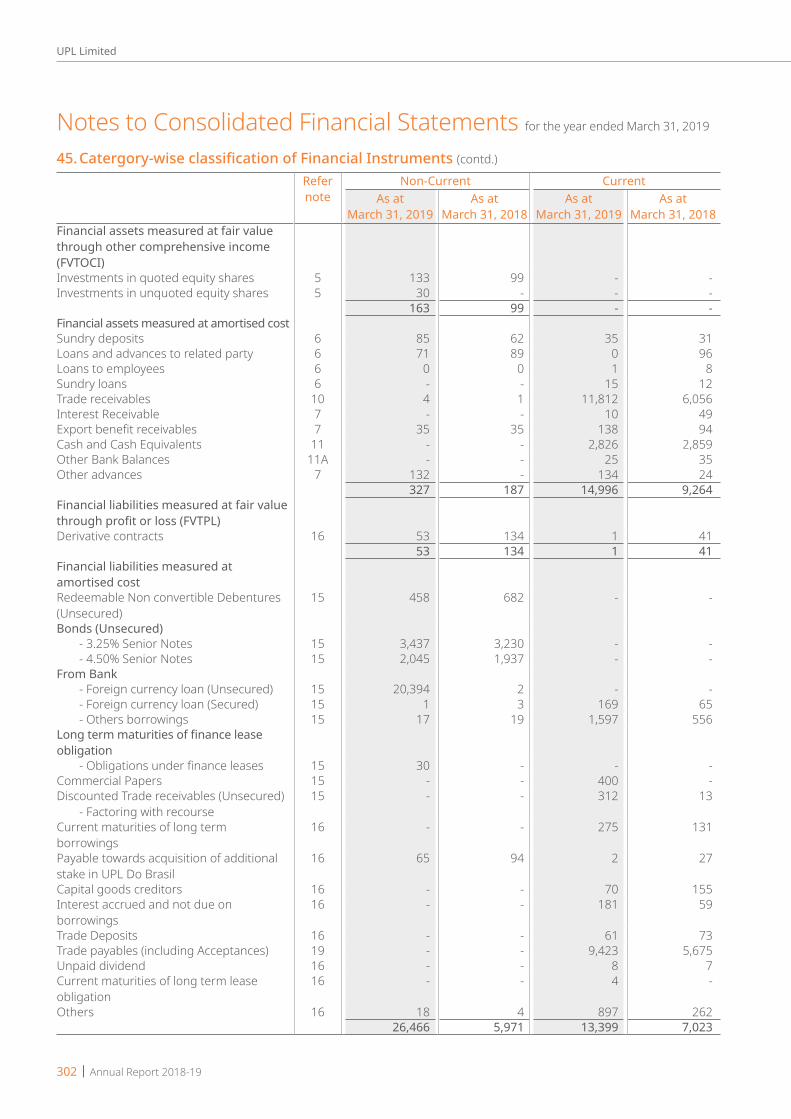
302 | Annual Report 2018-19
UPL Limited
Refer note
Non-Current CurrentAs at
March 31, 2019As at
March 31, 2018As at
March 31, 2019As at
March 31, 2018Financial assets measured at fair value through other comprehensive income (FVTOCI)Investments in quoted equity shares 5 133 99 - -Investments in unquoted equity shares 5 30 - - -
163 99 - -Financial assets measured at amortised costSundry deposits 6 85 62 35 31Loans and advances to related party 6 71 89 0 96Loans to employees 6 0 0 1 8Sundry loans 6 - - 15 12Trade receivables 10 4 1 11,812 6,056Interest Receivable 7 - - 10 49Export benefit receivables 7 35 35 138 94Cash and Cash Equivalents 11 - - 2,826 2,859Other Bank Balances 11A - - 25 35Other advances 7 132 - 134 24
327 187 14,996 9,264Financial liabilities measured at fair value through profit or loss (FVTPL)Derivative contracts 16 53 134 1 41
53 134 1 41Financial liabilities measured at amortised costRedeemable Non convertible Debentures (Unsecured)
15 458 682 - -
Bonds (Unsecured) - 3.25% Senior Notes 15 3,437 3,230 - - - 4.50% Senior Notes 15 2,045 1,937 - -From Bank - Foreign currency loan (Unsecured) 15 20,394 2 - - - Foreign currency loan (Secured) 15 1 3 169 65 - Others borrowings 15 17 19 1,597 556Long term maturities of finance lease obligation - Obligations under finance leases 15 30 - - -Commercial Papers 15 - - 400 -Discounted Trade receivables (Unsecured) - Factoring with recourse
15 - - 312 13
Current maturities of long term borrowings
16 - - 275 131
Payable towards acquisition of additional stake in UPL Do Brasil
16 65 94 2 27
Capital goods creditors 16 - - 70 155Interest accrued and not due on borrowings
16 - - 181 59
Trade Deposits 16 - - 61 73Trade payables (including Acceptances) 19 - - 9,423 5,675Unpaid dividend 16 - - 8 7Current maturities of long term lease obligation
16 - - 4 -
Others 16 18 4 897 26226,466 5,971 13,399 7,023
Notes to Consolidated Financial Statements for the year ended March 31, 2019
45.Catergory-wiseclassificationofFinancialInstruments(contd.)

Annual Report 2018-19 | 303
UPL Limited
(B) Measurement of fair value: Valuation techniques and significant unobservable inputs:
(i) Financial instruments measured at fair value The fair value of the financial assets and liabilities is included at the amount at which the instrument could be exchanged
in a current transaction between willing parties, other than in a forced or liquidation sale. The following methods and assumptions were used to estimate the fair values:
- The fair value of unquoted instruments, loans from banks and other financial liabilities, as well as other non-current financial liabilities is estimated by discounting future cash flows using rates currently available for debt on similar terms, credit risk and remaining maturities. In addition to being sensitive to a reasonably possible change in the forecast cash flows or the discount rate, the fair value of the equity instruments is also sensitive to a reasonably possible change in the growth rates. Management regularly assesses a range of reasonably possible alternatives for those significant unobservable inputs and determines their impact on the total fair value.
- The fair values of the unquoted equity shares have been estimated using a DCF model. The valuation requires management to make certain assumptions about the model inputs, including forecast cash flows, discount rate, credit risk and volatility. The probabilities of the various estimates within the range can be reasonably assessed and are used in management’s estimate of fair value for these unquoted equity investments.
- The fair values of the remaining FVTOCI financial assets are derived from quoted market prices in active markets.
- The fair values of the Company’s interest-bearing borrowings and loans are determined by using DCF method using discount rate that reflects the issuer’s borrowing rate as at the end of the reporting period. The own non-performance risk as at 31 March 2018 was assessed to be insignificant.
The discount for lack of marketability represents the amounts that the Company has determined that market participants would take into account when pricing the investments.
(ii) Financial instrument measured at amortized cost: The carrying amount of financial assets and financial liability measured at amortized cost in the financial statements are
a resonable approximation of their fair value since the Company does not anticipate that the carrying amounts would be significantly different from the value that would eventually be received or settled.
46. Fair value hierarchyThe following table provides the fair value measurement hierarchy of the Group’s assets and liabilities.
Quantitative disclosures fair value measurement hierarchy for assets as at 31 March 2019: H In croresParticulars Date of
valuationFair value measurement using
Total Quoted prices in
active markets
Significant observable
inputs
Significant unobservable
inputs(Level 1) (Level 2) (Level 3)
Assets measured at fair value:FVTOCI financial investments (Note 5):Investments in equity instruments (Quoted) 31-Mar-19 133 133 - -Others (Unquoted) 31-Mar-19 30 - - 30FVTPL financial investments (Note 5):Investments in equity instruments (Unquoted)
31-Mar-19 42 - - 42
Investments in Optionally Convertible Bonds (Unquoted)
31-Mar-19 83 - - 83
Investments in Others (Unquoted) 31-Mar-19 11 - - 11FVTPL Derivative Contracts (Note 7):Derivative contracts 31-Mar-19 28 28 - -
Notes to Consolidated Financial Statements for the year ended March 31, 2019
45.Catergory-wiseclassificationofFinancialInstruments(contd.)

304 | Annual Report 2018-19
UPL Limited
Quantitative disclosures fair value measurement hierarchy for liabilities as at 31 March 2019: H In croresParticulars Date of
valuationFair value measurement using
Total Quoted prices in
active markets
Significant observable
inputs
Significant unobservable
inputs(Level 1) (Level 2) (Level 3)
Liabilities measured at fair value:Derivative financial liabilities (Note 16):Derivative contracts 31-Mar-19 54 54 - -
Quantitative disclosures fair value measurement hierarchy for assets as at 31 March 2018: H In croresParticulars Date of
valuationFair value measurement using
Total Quoted prices in
active markets
Significant observable
inputs
Significant unobservable
inputs(Level 1) (Level 2) (Level 3)
Assets measured at fair value:FVTOCI financial investments (Note 5):Investments in Equity Instruments (Quoted) 31-Mar-18 99 99 - -Others (Unquoted) 31-Mar-18 - - - -FVTPL financial investments (Note 5):Investment in Equity Instruments (Unquoted) 31-Mar-18 40 - - 40Investments in Optionally Convertible Bonds (Unquoted)
31-Mar-18 76 - - 76
Investment in Others (Unquoted) 31-Mar-18 433 - - 433
Quantitative disclosures fair value measurement hierarchy for liabilities as at 31 March 2018: H In croresParticulars Date of
valuationFair value measurement using
Total Quoted prices in
active markets
Significant observable
inputs
Significant unobservable
inputs(Level 1) (Level 2) (Level 3)
Liabilities measured at fair value:Derivative financial liabilities (Note 16):Derivative contracts 31-Mar-18 175 175 - -
47. Financial risk management objectives and policiesThe Group’s principal financial liabilities, other than derivatives, comprise loans and borrowings, trade and other payables. The main purpose of these financial liabilities is to finance the Group’s operations. The Groups principal financial assets include loans, trade and other receivables, and cash and cash equivalents that derive directly from its operations. The Group also holds FVTOCI investments and enters into derivative transactions.
The Group is exposed to market risk, credit risk and liquidity risk. The Group’s senior management oversees the management of these risks. All derivative activities for risk management purposes are carried out by specialist teams that have the appropriate skills, experience and supervision. It is the Group’s policy that no trading in derivatives for speculative purposes may be undertaken. The Board of Directors reviews and agrees policies for managing each of these risks, which are summarised below.
Market riskMarket risk is the risk that the fair value of future cash flows of a financial instrument will fluctuate because of changes in market prices. Market risk comprises three types of risk: interest rate risk, currency risk and other price risk, such as equity price risk. Financial instruments affected by market risk include loans and borrowings, deposits, FVTOCI investments and derivative financial instruments.
Notes to Consolidated Financial Statements for the year ended March 31, 2019
46. Fair value hierarchy (contd.)
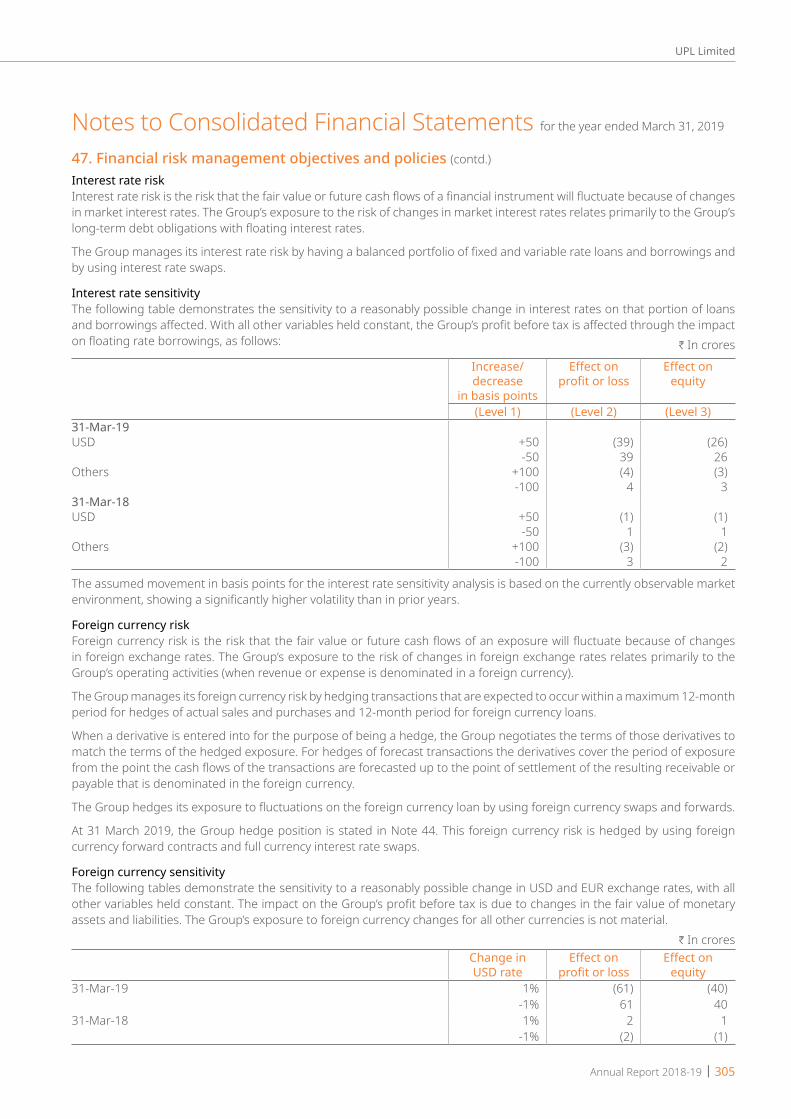
Annual Report 2018-19 | 305
UPL Limited
Interest rate riskInterest rate risk is the risk that the fair value or future cash flows of a financial instrument will fluctuate because of changes in market interest rates. The Group’s exposure to the risk of changes in market interest rates relates primarily to the Group’s long-term debt obligations with floating interest rates.
The Group manages its interest rate risk by having a balanced portfolio of fixed and variable rate loans and borrowings and by using interest rate swaps.
Interest rate sensitivityThe following table demonstrates the sensitivity to a reasonably possible change in interest rates on that portion of loans and borrowings affected. With all other variables held constant, the Group’s profit before tax is affected through the impact on floating rate borrowings, as follows: H In crores
Increase/decrease
in basis points
Effect on profit or loss
Effect on equity
(Level 1) (Level 2) (Level 3)31-Mar-19USD +50 (39) (26)
-50 39 26 Others +100 (4) (3)
-100 4 3 31-Mar-18USD +50 (1) (1)
-50 1 1 Others +100 (3) (2)
-100 3 2
The assumed movement in basis points for the interest rate sensitivity analysis is based on the currently observable market environment, showing a significantly higher volatility than in prior years.
Foreign currency riskForeign currency risk is the risk that the fair value or future cash flows of an exposure will fluctuate because of changes in foreign exchange rates. The Group’s exposure to the risk of changes in foreign exchange rates relates primarily to the Group’s operating activities (when revenue or expense is denominated in a foreign currency).
The Group manages its foreign currency risk by hedging transactions that are expected to occur within a maximum 12-month period for hedges of actual sales and purchases and 12-month period for foreign currency loans.
When a derivative is entered into for the purpose of being a hedge, the Group negotiates the terms of those derivatives to match the terms of the hedged exposure. For hedges of forecast transactions the derivatives cover the period of exposure from the point the cash flows of the transactions are forecasted up to the point of settlement of the resulting receivable or payable that is denominated in the foreign currency.
The Group hedges its exposure to fluctuations on the foreign currency loan by using foreign currency swaps and forwards.
At 31 March 2019, the Group hedge position is stated in Note 44. This foreign currency risk is hedged by using foreign currency forward contracts and full currency interest rate swaps.
Foreign currency sensitivityThe following tables demonstrate the sensitivity to a reasonably possible change in USD and EUR exchange rates, with all other variables held constant. The impact on the Group’s profit before tax is due to changes in the fair value of monetary assets and liabilities. The Group’s exposure to foreign currency changes for all other currencies is not material.
H In croresChange in USD rate
Effect on profit or loss
Effect on equity
31-Mar-19 1% (61) (40)-1% 61 40
31-Mar-18 1% 2 1-1% (2) (1)
Notes to Consolidated Financial Statements for the year ended March 31, 2019
47. Financial risk management objectives and policies (contd.)

306 | Annual Report 2018-19
UPL Limited
Change in Euro rate
Effect on profit or loss
Effect on equity
31-Mar-19 1% (0) (0)-1% 0 0
31-Mar-18 1% 0 0-1% (0) (0)
The movement in the pre-tax effect is a result of a change in the fair value of monetary assets and liabilities denominated in US dollars, where the functional currency of the entity is a currency other than US dollars. Although the derivatives have not been designated in a hedge relationship, they act as an economic hedge and will offset the underlying transactions when they occur.
Equity price riskThe Group’s listed and non-listed equity securities are susceptible to market price risk arising from uncertainties about future values of the investment securities. The investment in listed and unlisted equity securities are not significant.
Credit riskCredit risk is the risk that counterparty will not meet its obligations under a financial instrument or customer contract, leading to a financial loss. The Group is exposed to credit risk from its operating activities (primarily trade receivables) and from its financing activities, including deposits with banks and financial institutions, foreign exchange transactions and other financial instruments.
Financial instruments and cash depositsCredit risk from balances with banks and financial institutions is managed by the Group’s treasury department. Investments of surplus funds are made only with approved counterparties and within credit limits assigned to each counterparty. The limits are set to minimise the concentration of risks and therefore mitigate financial loss through counterparty’s potential failure to make payments.
The Group’s maximum exposure to credit risk for the components of the balance sheet at 31 March 2019 and 31 March 2018 is the carrying amounts as illustrated in Note 10 except for derivative financial instruments.
Liquidity riskLiquidity risk is the risk that the Group will not be able to meet its financial obligations as they fall due. The Group’s approach to managing liquidity is to ensure, as far as possible, that it will always have sufficient liquidity to meet its liabilities when due, under both normal and stressed conditions, without incurring unacceptable losses or risking damage to the Group’s reputation.
The Group manages liquidity risk by maintaining adequate reserves, by continuously monitoring forecast and actual cash flows and matching the maturity profiles of the financial assets and liabilities.
The table below summarises the maturity profile of the Group’s financial liabilities based on contractual undiscounted payments.
H In croresLess than 1 year 1 to 5 years > 5 years Total
Year ended31-Mar-19Borrowings (Refer Note 15) 2,878 23,966 2,295 29,139Other financial liabilities (Refer Note 16) 1,499 83 - 1,582Trade and other payables (Refer Note 19) 9,423 - - 9,423Derivative contracts (Refer Note 16) 1 53 - 54
13,800 24,102 2,295 40,197Year ended31-Mar-18Borrowings (Refer Note 15) 634 3,798 2,206 6,637Other financial liabilities (Refer Note 16) 715 98 - 812Trade and other payables (Refer Note 19) 5,675 - - 5,675Derivative contracts (Refer Note 16) 41 134 - 175
7,064 3,900 2,206 13,170
Notes to Consolidated Financial Statements for the year ended March 31, 2019
47. Financial risk management objectives and policies (contd.)
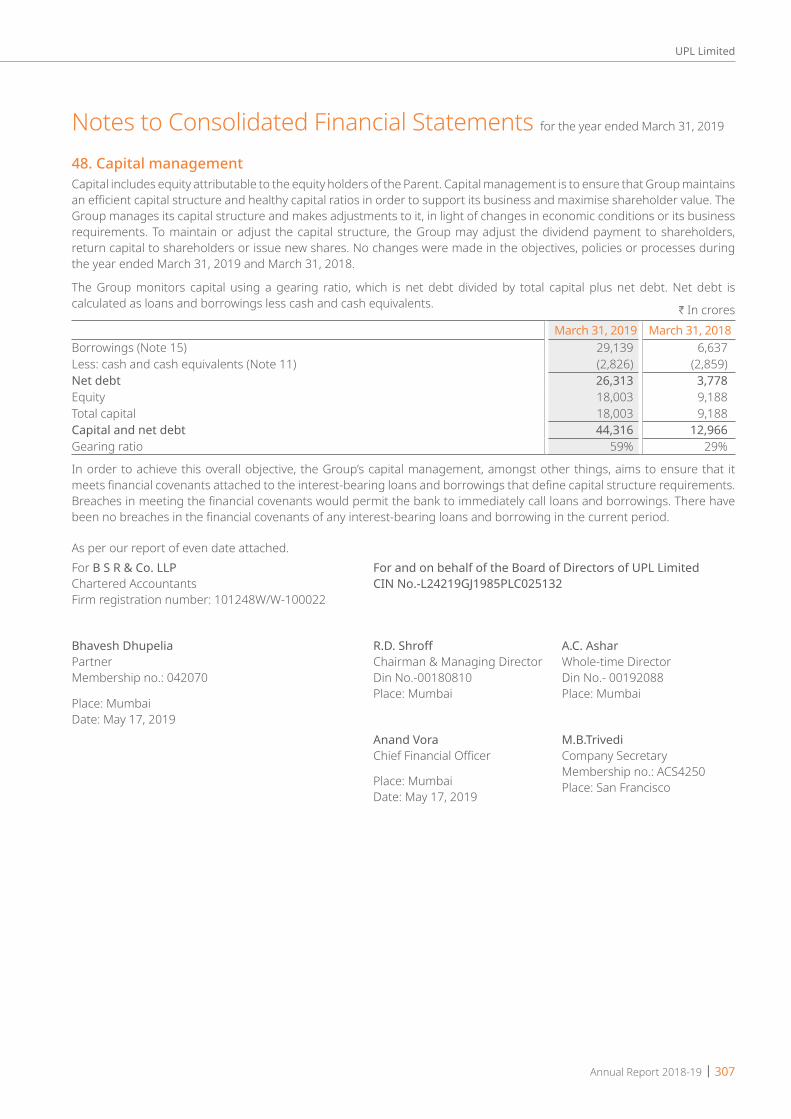
Annual Report 2018-19 | 307
UPL Limited
48. Capital managementCapital includes equity attributable to the equity holders of the Parent. Capital management is to ensure that Group maintains an efficient capital structure and healthy capital ratios in order to support its business and maximise shareholder value. The Group manages its capital structure and makes adjustments to it, in light of changes in economic conditions or its business requirements. To maintain or adjust the capital structure, the Group may adjust the dividend payment to shareholders, return capital to shareholders or issue new shares. No changes were made in the objectives, policies or processes during the year ended March 31, 2019 and March 31, 2018.
The Group monitors capital using a gearing ratio, which is net debt divided by total capital plus net debt. Net debt is calculated as loans and borrowings less cash and cash equivalents.
H In croresMarch 31, 2019 March 31, 2018
Borrowings (Note 15) 29,139 6,637Less: cash and cash equivalents (Note 11) (2,826) (2,859)Net debt 26,313 3,778Equity 18,003 9,188Total capital 18,003 9,188Capital and net debt 44,316 12,966Gearing ratio 59% 29%
In order to achieve this overall objective, the Group’s capital management, amongst other things, aims to ensure that it meets financial covenants attached to the interest-bearing loans and borrowings that define capital structure requirements. Breaches in meeting the financial covenants would permit the bank to immediately call loans and borrowings. There have been no breaches in the financial covenants of any interest-bearing loans and borrowing in the current period.
As per our report of even date attached.For B S R & Co. LLP For and on behalf of the Board of Directors of UPL LimitedChartered Accountants CIN No.-L24219GJ1985PLC025132Firm registration number: 101248W/W-100022
Bhavesh Dhupelia R.D. Shroff A.C. AsharPartner Chairman & Managing Director Whole-time DirectorMembership no.: 042070 Din No.-00180810 Din No.- 00192088 Place: Mumbai Place: Mumbai
Anand Vora M.B.Trivedi Chief Financial Officer Company Secretary Membership no.: ACS4250 Place: Mumbai Place: San Francisco Date: May 17, 2019
Notes to Consolidated Financial Statements for the year ended March 31, 2019
Place: MumbaiDate: May 17, 2019

Notes

Notes

Notes

Notes

Notes


UPL House610 B/2, Bandra Village, Off Western Express Highway,
Bandra-East, Mumbai 400 051, India.