Embed Size (px)
Citation preview

UPDATED WILSEYVILLE WOODY BIOMASS VALUE-ADDED PRODUCT YARD FEASIBILITY STUDY
April 5, 2013
Update of the Wilseyville Woody Biomass Value-
Added Product Yard Feasibility Study dated January 11, 2012
Prepared for: Calaveras Healthy Impact Products Solutions, Inc.
West Point, California
Prepared by: TSS Consultants
Rancho Cordova, California
Funding for this feasibility study was provided by the US Department of Agriculture, Rural Business Enterprises Grant

i
ACKNOWLEDGMENTS
TSS Consultants typically conducts feasibility studies utilizing in-house personnel and resources. This is a business model that our firm has utilized since it was founded in 1986. The Wilseyville Feasibility Study was unique in that the client made available an array of locally knowledgeable individuals and networks that proved invaluable during the data gathering and analysis phase of this study. The authors wish to thank several individuals and organizations for their significant efforts in support of this project. These include, but are not limited to:
Alan Leavitt, CHIPS, Inc., Project Manager, Board of Directors, Woody Biomass Utilization Capacity Building Project
Steve Wilensky, CHIPS, Inc., Board of Directors, Woody Biomass Utilization Capacity Building Project
Rick Torgerson, CHIPS, Inc., Board of Directors, Woody Biomass Utilization Capacity Building Project
Rick Breeze-Martin, Consultant to CHIPS, Inc., Woody Biomass Utilization Capacity Building Project
Bob Noble, Noble Milling and Firewood, Local Entrepreneur and ACCABU Member
Gareth Mayhead, Academic Coordinator, Forest Products, University of California Cooperative Extension
Kevin Hansen, Professional Engineer, KRH Engineering
Feasibility Study Project Steering Committee
Robert Smith, Bob Noble, John Emerson, Chris Wright, John Hofmann, Arvada Fisher, Mark Stanley, and Rick Breeze-Martin
Jim Junette, Forester, Calaveras RD, USFS
Keith Johnson, Forester, Bureau of Land Management
John Sweetman, Sale Administrator, Amador RD, USFS
John Romena, Director of Fuel Procurement, Buena Vista Biomass Power, LLC
Steve Cannon, Forester, Foothill Resource Management
Les Scott, California Hot Wood
Shawn Garvey, The Grant Farm
Elissa Brown, Sierra Nevada Conservancy
Greg Stangl, Phoenix Energy
Matt Cook, Phoenix Energy
Updated Feasibility Study for the Wilseyville Product Yard TSS Consultants
Updated Feasibility Study for the Wilseyville Product Yard ii TSS Consultants
The assessment team as assembled by TSS Consultants included:
Tad Mason, Forester and CEO, TSS (Project Manager)
Fred Tornatore, Chief Technology Officer, TSS
Todd Hansen, Forester and GIS Specialist, TSS
David Augustine, Senior Analyst, TSS
Matt Hart, Renewable Energy Specialist, TSS
Updated Feasibility Study for the Wilseyville Product Yard iii TSS Consultants
Table of Contents INTRODUCTION 1 ...........................................................................................................................STUDY OBJECTIVES 1 ....................................................................................................................SCOPE OF WORK 2 ..........................................................................................................................KEY FINDINGS 9 ..............................................................................................................................
Biomass Feedstock Availability and Pricing 9 .............................................................................. Site Review 10 ............................................................................................................................... Value-Added Opportunities 10 ...................................................................................................... Technical and Economic Analysis 11 ............................................................................................ Recommendations and Next Steps 11 ............................................................................................
WOODY BIOMASS FEEDSTOCK RESOURCE AVAILABILITY AND COST ANALYSIS 12 ....................................................................................................................................
Target Study Area 12 ..................................................................................................................... Vegetation Cover and Land Ownership/Jurisdiction 14 ............................................................ Topography Within the Target Study Area 18 ..........................................................................
Forest-Sourced Biomass 20 ........................................................................................................... Timber Harvest Residuals 20 ..................................................................................................... Fuels Treatment/Forest Restoration 22 ......................................................................................
Urban-Sourced Biomass 23 ........................................................................................................... Agricultural Byproducts 23 ............................................................................................................ Biomass Feedstock Competition Analysis 24 ...............................................................................
Current Competition 24 ............................................................................................................. Biomass Feedstock Availability – Current Forecast 26 ................................................................. Biomass Feedstock Availability – Future Forecast 2014 to 2016 26 ............................................ Biomass Feedstock Availability – Future Forecast 2017 to 2022 27 ............................................ Costs to Collect, Process and Transport Biomass Material 27 ...................................................... Current Market Prices 28 ............................................................................................................... State and Federal Environmental Analysis 29 ............................................................................... Applicable State and Federal Taxes 29 .......................................................................................... Biomass Feedstock Supply Risks and Future Sources 29 .............................................................
Feedstock Supply Competition Risk Mitigation 29 ................................................................... Time of Year Availability 29 ..................................................................................................... Transport Cost 30 ....................................................................................................................... Housing and Construction 31 ..................................................................................................... State and Federal Policies 31 .....................................................................................................
OLD MILL SITE REVIEW 32 ...........................................................................................................Environmental Setting 32 .............................................................................................................. Zoning and Land Use Permitting 35 .............................................................................................. Biological Resources 36 ................................................................................................................ Environmental Compliance 36 ...................................................................................................... Job Creation 36 ..............................................................................................................................
VALUE-ADDED OPPORTUNITIES ANALYSIS 37 ......................................................................Small-Scale Combined Heat and Power 43 ................................................................................... Firewood Processing 43 .................................................................................................................
Financial Analysis 45 ................................................................................................................. Firewood Sales – Bulk 47 ..........................................................................................................
Updated Feasibility Study for the Wilseyville Product Yard iv TSS Consultants
Firewood Sales – Bundled 48 .................................................................................................... Small-Scale Sawmill 49 .................................................................................................................
Lumber Dry Kiln 50 ................................................................................................................... Financial Analysis 51 .................................................................................................................Lumber Sales 53 ........................................................................................................................Secondary Manufacturing 53 .....................................................................................................
Biomass Fiber to Local Markets 54 ...............................................................................................OBSERVATIONS 56 .........................................................................................................................
Small-Scale Combined Heat and Power 56 ................................................................................... Firewood Processing 56 .................................................................................................................Small-Scale Sawmill 56 ................................................................................................................. Biomass Fiber to Local Markets 57 ............................................................................................... Product Yard Infrastructure Improvement 57 ................................................................................
SMALL-SCALE COMBINED HEAT AND POWER TECHNICAL FEASIBILITY ANALYSIS 58 ....................................................................................................................................
Small-Scale Combined Heat and Power Facility 58 ...................................................................... Technology Selection Process 58 .............................................................................................. Phoenix Energy Systems 59 ....................................................................................................... Phoenix Energy Process 62 ........................................................................................................Commercial Viability 63 ............................................................................................................
SMALL-SCALE COMBINED HEAT AND POWER ECONOMIC FEASIBILITY ANALYSIS 64 ....................................................................................................................................
Power Sales 64 ............................................................................................................................... Economic Analysis 64 ...................................................................................................................
Baseline Assumptions 64 ...........................................................................................................Recommendations 70 .....................................................................................................................
Project Scale 70 .......................................................................................................................... Secondary Revenue Stream 71 .................................................................................................. Feedstock Costs 71 .................................................................................................................... Debt Service 71 ..........................................................................................................................
EMPLOYMENT OPPORTUNITIES AND WORKFORCE ANALYSIS 72 ...................................Regional Employment Information 72 .......................................................................................... Bioenergy Facility Job Opportunities 73 .......................................................................................
Manager/Supervisor 73 ..............................................................................................................Biomass Plant Technicians 74 ................................................................................................... Engineering Technician 75 ........................................................................................................ Instrument & Controls Technician/Operator 75 ........................................................................
Bioenergy Facility Employment 76 ............................................................................................... Industry Challenges 76 .................................................................................................................. Training Needs and Resources 77 ..................................................................................................
NEXT STEPS AND RECOMMENDATIONS 78 .............................................................................POTENTIAL GRANT FUNDING RESOURCES 79 ........................................................................
Predevelopment Funding 79 .......................................................................................................... Project Financing 79 ......................................................................................................................Other Potential Sources 81 .............................................................................................................
APPENDIX A – CORRESPONDENCE From Calaveras County Planning Department 84 .............

Updated Feasibility Study for the Wilseyville Product Yard v TSS Consultants
APPENDIX B – STeering Committee Meeting Notes 87 ..................................................................APPENDIX C – REQUEST FOR INFORMATION 94 ....................................................................APPENDIX D – CHIPS Subcommittee for Selection of Technology Vendor/System Integrator 98 ........................................................................................................................................APPENDIX E – PHOENIX Energy Technology Overview 100 .......................................................APPENDIX F – LABOR FORCE DATA 104 ...................................................................................
Updated Feasibility Study for the Wilseyville Product Yard vi TSS Consultants
List of Figures Figure 1. Target Study Area Scope of Work 2 .................................................................................Figure 2. Target Study Area 13 .........................................................................................................Figure 3. Vegetation Cover within the Target Study Area 15 .......................................................... Figure 4. Land Ownership/Jurisdiction within the TSA 17 .............................................................. Figure 5. Slope Analysis of the TSA 19 ........................................................................................... Figure 6. Current and Potential Competition for Feedstock within the TSA 25 ..............................Figure 7. California On-Highway Diesel Prices 2007 - 2013 30 ...................................................... Figure 8. Associated Lumber and Box Company, Wilseyville Sawmill 32 ..................................... Figure 9. Old Mill Site with Product Yard Location 33 ................................................................... Figure 10. Product Yard Draft Site Plan 34 ...................................................................................... Figure 11. Value-Added Utilization Matrix 38 ................................................................................. Figure 12. Blockbuster Model 22 - 20 Firewood Processor 45 ........................................................ Figure 13. California Hot Wood, Inc., Packaged Firewood 48 ........................................................ Figure 14. Bundled Firewood 49 ...................................................................................................... Figure 15. Mobile Dimension Sawmill 50 ........................................................................................ Figure 16. Wood Box Packaging 54 .................................................................................................Figure 17. Phoenix Energy Feedstock Receiving System 60 ........................................................... Figure 18. Phoenix Energy Gasification Equipment 61 ................................................................... Figure 19. Phoenix Energy Gas Cleanup Equipment 62 .................................................................. Figure 20. Phoenix Energy Electrical Generator 62 .........................................................................Figure 21. Sensitivity Analysis Results 70 .......................................................................................Figure 22. Educational Attainment in 2000 72 .................................................................................
List of Tables Table 1. Biomass Material Potentially Available 9 .......................................................................... Table 2. Biomass Material Collection, Processing and Transport Costs with Wilseyville Site as Delivery Point 9 .................................................................................................................................Table 3. Vegetation Cover within the TSA 16 ................................................................................. Table 4. Land Ownership/Jurisdiction Forest Vegetation Cover within the TSA 18 ....................... Table 5. USFS Jurisdiction/Land Classification within the TSA 18 ................................................ Table 6. Topography Classification within the TSA 20 ...................................................................Table 7. Topography Classification by Ownership within the TSA 20 ............................................ Table 8. 2006 Through 2010 Timber Harvest Volume Produced Within the TSA (Expressed in MBF/Year) 21 .................................................................................................................................... Table 9. Forest Fuels Treatment Activities Planned within the TSA (Expressed in Acres per Year) 22 ............................................................................................................................................. Table 10. Facilities Currently Competing For Feedstock 24 ............................................................. Table 11. Facilities Potentially Competing For Feedstock 25 ........................................................... Table 12. Biomass Material Potentially Available – 2013 26 .......................................................... Table 13. Biomass Material Potentially Available – 2014 to 2016 26 ............................................. Table 14. Biomass Material Potentially Available – 2017 to 2022 27 .............................................

Updated Feasibility Study for the Wilseyville Product Yard vii TSS Consultants
Table 15. Biomass Material Collection, Processing and Transport Costs with Wilseyville Site as Delivery Point 28 ............................................................................................................................... Table 16. Five-Year Feedstock Pricing Forecast 2013 to 2017 31 .................................................... Table 17. Proforma Results – Firewood Log Pricing and Grant Funding Sensitivity 46 .................Table 18. Proforma Results - Firewood Sales Pricing and Grant Funding Sensitivity 47 ................ Table 19. Proforma Results – Sawlog Pricing and Grant Funding Sensitivity 52 ............................Table 20. Proforma Results – Lumber Sales Pricing and Grant Funding Sensitivity 52 .................. Table 21. Alternative Local Markets for Biomass Fiber 55 ............................................................. Table 22. Product Yard Infrastructure Improvement Recommendations 57 .................................... Table 23. Baseline Assumption and Sensitivity Range 65 ............................................................... Table 24. Capacity Factor Sensitivity 68 .......................................................................................... Table 25. Biochar Sales Sensitivity 68 ............................................................................................. Table 26. Nominal Output Sensitivity 68 ......................................................................................... Table 27. Feedstock Consumption Sensitivity 68 ............................................................................. Table 28. Biochar Output Sensitivity 68 ........................................................................................... Table 29. Feedstock Cost Sensitivity . 68 .......................................................................................... Table 30. Capital Investment Sensitivity 69 ..................................................................................... Table 31. Labor Cost Sensitivity 69 .................................................................................................Table 32. Operations and Maintenance Cost Sensitivity 69 ............................................................. Table 33. General Overhead Sensitivity 69 ...................................................................................... Table 34. Interest on Debt Sensitivity 69 ..........................................................................................

Updated Feasibility Study for the Wilseyville Product Yard viii TSS Consultants
ABBREVIATIONS/ACRONYMS A range of abbreviations and acronyms were utilized in this report. Organizations ACCG Amador Calaveras Consensus Group ACCABU Amador Calaveras Cooperative Association for Biomass Utilization ALBC Associated Lumber and Box Company BOE State Board of Equalization BLM Bureau of Land Management BVBP Buena Vista Biomass Power CCAPCD Calaveras County Air Pollution Control District CCWD Calaveras County Water District CHIPS Calaveras Healthy Impact Product Solutions CPUC California Public Utilities Commission HUD Department of Housing and Urban Development Noble Noble Milling and Firewood PG&E Pacific Gas & Electric SCE Southern California Edison SDG&E San Diego Gas & Electric SPI Sierra Pacific Industries TSS TSS Consultants USDA United States Department of Agriculture USFS United States Forest Service Other Terms BDT Bone Dry Ton(s) Btu British Thermal Unit CDBG Community Development Block Grant CFDA Catalog of Federal Domestic Assistance CEDLI California Economic Development Lending Institute CEQA California Environmental Quality Act CHP Combined Heat and Power CSBG Community Services Block Grant CUP Conditional Use Permit EECBG Energy Efficiency and Conservation Block Grant EISA Energy Independence and Security Act EPIC Electric Program Investment Charge E-ReMAT Electric Renewable Market Auction Tariff FIT Feed In Tariff FSC Fire Safe Council GED General Educational Development GIS Geographic Information System GT Green Ton
Updated Feasibility Study for the Wilseyville Product Yard ix TSS Consultants
IOU Investor Owned Utility IRR Internal Rate of Return ITC Investment Tax Credit kWh Kilowatt-hour MBF Thousand Board Feet MMBtu Million British Thermal Units MW Megawatt MWh Megawatt-hour NEPA National Environmental Policy Act O&M Operations and Maintenance PIER Public Interest Energy Research PPA Power Purchase Agreement PS Public Service PTC Production Tax Credit RBEG Rural Business Enterprise Grant Program RBOG Rural Business Opportunity Grants REAP Rural Energy for America Program REDLG Rural Economic Development Loan and Grant RFI Request for Information SB 1122 Senate Bill 1122 SB 32 Senate Bill 32 TBL Triple Bottom Line THP Timber Harvest Plan TSA Target Study Area U.S. United States WBUG Woody Biomass Utilization Grant WUI Wildland Urban Interface

Feasibility Study for the Wilseyville Product Yard 1 TSS Consultants
INTRODUCTION The Calaveras Healthy Impact Product Solutions, Inc. (CHIPS), a California non-profit corporation with IRS 501(c)(3) certification, has retained TSS Consultants (TSS) to update the January 11, 2012 Wilseyville Woody Biomass Value-Added Product Yard Feasibility Study to address U.S. Forest Service (USFS) Woody Biomass Utilization Grant (WBUG) compliant analysis including detailed economic and technical analyses on the technology developer chosen for bioenergy facility development at the Wilseyville yard. Additionally, TSS was asked to provide a labor force analysis for the potential bioenergy project, add a competition analysis in the feedstock availability review and a five year feedstock price forecast. CHIPS is a member the Amador Calaveras Consensus Group (ACCG) a community-based collaborative implementing an All Lands Triple Bottom Line (TBL) strategy for forest restoration and fire-safe communities. CHIPS is also a member of the local Amador Calaveras Cooperative Association for Biomass Utilization (ACCABU) with members that include local forest contractors, entrepreneurs, and others interested in developing small biomass utilization businesses. These two organizations provided TSS a Feasibility Study Steering Committee to provide expert local knowledge and to help guide the Study consistent with ACCG and ACCABU principles and purposes. The Wilseyville site is strategically located tributary to sustainably available forest biomass feedstocks. For a number of years the site supported a commercial-scale sawmill (Associated Lumber and Box Company) that sourced saw timber from the surrounding region. It was situated at Wilseyville due to the strategic site location relative to forest resources. CHIPS is currently in discussions with the Calaveras County Water District (CCWD) to purchase 13 acres of the former sawmill site for a utilization product yard. STUDY OBJECTIVES CHIPS seeks to optimize value-added opportunities for utilization of woody biomass material generated as a byproduct of forest fuels treatment and restoration activities in the upper Mokelumne and Calaveras River watersheds. The long-term plan is to facilitate a cooperative of distributed product yards that complement each other so that community-based enterprises are strategically coordinated and scaled to local sustainability. Sustainability is defined as a healthy equilibrium in the TBL between local environment, community, and economy. Key questions to be addressed by this study effort include:
What value-added forest biomass utilization business models, scaled to local resource sustainability, have the highest potential for successful implementation by local contractors?
Which business models are complementary such that a coordinated approach is possible – one that facilitates multiple businesses producing a variety of value-added products?

Updated Feasibility Study for the Wilseyville Product Yard 2 TSS Consultants
How should these multiple businesses coordinate so that a healthy equilibrium and TBL, represented by a balance between local environment, community and economy, is accomplished?
SCOPE OF WORK CHIPS has requested that TSS update the January 11, 2012 feasibility study to address USFS WBUG compliant analysis including detailed economic and technical analyses on the technology developer chosen for bioenergy facility development at the Wilseyville yard. Additionally, TSS was asked to provide a labor force analysis for the potential bioenergy project, add a competition analysis in the feedstock availability review and a five year feedstock price forecast. Detailed below are tasks that TSS has implemented in support of this feasibility study. TSS utilized relevant data and information from existing assessments and studies conducted in the region as well as new data generated as a result of this study. In addition, TSS accessed local knowledge and experiences provided by the project Steering Committee. This Scope of Work provided general guidance and intent for this feasibility study. Task 1. Pre-Work Conference Convene a meeting with the project Steering Committee. Review approach and implementation schedule/work plan for the feasibility study. Confirm primary Steering Committee contacts. Review availability of existing studies and data, focused on both local biomass feedstock availability and value-added utilization opportunities. Confirm target study area for sourcing of potential biomass feedstock resources. Set dates for Phase I and Phase II meetings with the Study Steering Committee. Figure 1 highlights the draft target feedstock sourcing areas for the Upper Mokelumne and Calaveras River watersheds and surrounding region.
Figure 1. Target Study Area Scope of Work
Updated Feasibility Study for the Wilseyville Product Yard 3 TSS Consultants
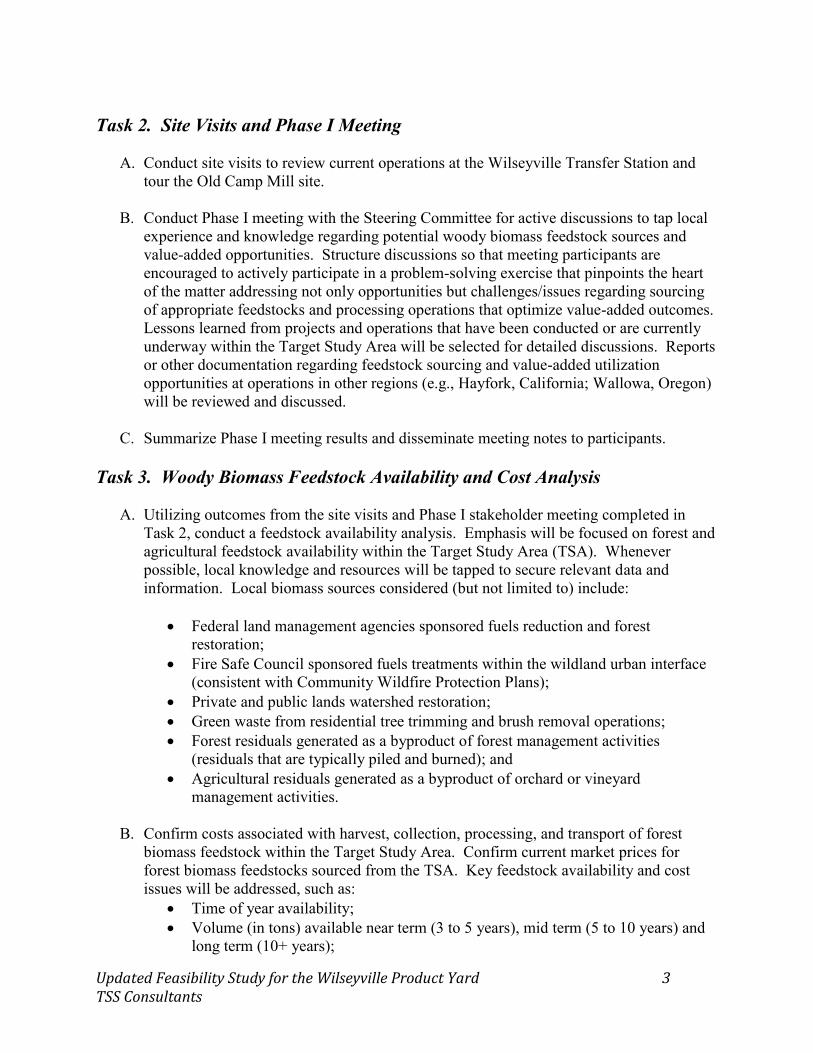
Task 2. Site Visits and Phase I Meeting
A. Conduct site visits to review current operations at the Wilseyville Transfer Station and tour the Old Camp Mill site.
B. Conduct Phase I meeting with the Steering Committee for active discussions to tap local experience and knowledge regarding potential woody biomass feedstock sources and value-added opportunities. Structure discussions so that meeting participants are encouraged to actively participate in a problem-solving exercise that pinpoints the heart of the matter addressing not only opportunities but challenges/issues regarding sourcing of appropriate feedstocks and processing operations that optimize value-added outcomes. Lessons learned from projects and operations that have been conducted or are currently underway within the Target Study Area will be selected for detailed discussions. Reports or other documentation regarding feedstock sourcing and value-added utilization opportunities at operations in other regions (e.g., Hayfork, California; Wallowa, Oregon) will be reviewed and discussed.
C. Summarize Phase I meeting results and disseminate meeting notes to participants.
Task 3. Woody Biomass Feedstock Availability and Cost Analysis
A. Utilizing outcomes from the site visits and Phase I stakeholder meeting completed in Task 2, conduct a feedstock availability analysis. Emphasis will be focused on forest and agricultural feedstock availability within the Target Study Area (TSA). Whenever possible, local knowledge and resources will be tapped to secure relevant data and information. Local biomass sources considered (but not limited to) include:
Federal land management agencies sponsored fuels reduction and forest restoration;
Fire Safe Council sponsored fuels treatments within the wildland urban interface (consistent with Community Wildfire Protection Plans);
Private and public lands watershed restoration; Green waste from residential tree trimming and brush removal operations; Forest residuals generated as a byproduct of forest management activities
(residuals that are typically piled and burned); and Agricultural residuals generated as a byproduct of orchard or vineyard
management activities.
B. Confirm costs associated with harvest, collection, processing, and transport of forest biomass feedstock within the Target Study Area. Confirm current market prices for forest biomass feedstocks sourced from the TSA. Key feedstock availability and cost issues will be addressed, such as:
Time of year availability; Volume (in tons) available near term (3 to 5 years), mid term (5 to 10 years) and
long term (10+ years);

Updated Feasibility Study for the Wilseyville Product Yard 4 TSS Consultants
Impacts of key variables (such as terrain and removal technique) on the cost of harvest, collection, processing and transport;
State and federal environmental analysis (CEQA/NEPA) required to access forest and agricultural biomass feedstocks;
State and federal taxes applicable to biomass feedstock sourcing operations (e.g., state yield tax);
Number of jobs created or retained as a result of harvest, collection, processing and transport activities; and
Five-year biomass feedstock pricing forecast.
C. Detailed risk assessment of future biomass feedstock supply including impacts of Federal, State, and local policy, availability of alternative feedstock types, and a competition analysis. Key risk and future supply categories include:
Time of year availability; Feedstock transportation costs; Housing and construction market trends; and State and Federal policies.
D. Synthesize Task 3 findings and deliver to project Steering Committee.
Task 4. Value-Added Opportunities Analysis
A. Utilizing outcomes from the site visits and stakeholder meetings completed in Task 2 as well as feedstock availability analysis results generated in Task 3, conduct a value-added opportunities analysis. Emphasis will be focused on utilization of feedstocks deemed available at volumes and prices generated as a result of Task 3. Whenever possible, local knowledge and resources will be tapped to secure relevant data and information. Additionally, a review of literature documenting value-added opportunities and outcomes (including lessons learned) will be conducted.
B. A matrix of value-added utilization opportunities will be created with specific attributes listed and assigned relative values. Included in the attribute list will be social return on investment such that investment in jobs and community are assigned a relatively high value. Ranking of the value-added opportunities will be conducted with feedback from the project Steering Committee.
Value-added opportunities considered and included in the ranking matrix will include (but not be limited to):
Chips for power and thermal energy; Soil amendments and landscape cover; Animal bedding; Post/pole products for agricultural use; Post/pole products for architectural use;
Updated Feasibility Study for the Wilseyville Product Yard 5 TSS Consultants
Fencing products; Firewood and densified fuel logs; Small scale combined power and heat production; Greenhouse and native plants nursery; and Rustic furniture/outdoor recreation sets (e.g., swing sets).
C. Synthesize Task 4 findings and deliver to project Steering Committee.
Task 5. Phase II Meeting and Detailed Value-Added Opportunity Analysis
A. Convene second meeting with the Steering Committee to review and discuss in detail the Task 3 and 4 findings. Primary focus of the meeting is to review and prioritize key opportunities regarding feedstocks and value-added uses. Using the value-added opportunities matrix as a guide, detailed discussions regarding the most appropriate technologies and markets will be considered. The outcome of the meeting will be a selection of the top two value-added opportunities (from the matrix created in Task 4) for detailed analysis and assessment.
B. Up to four value-added opportunities will be analyzed in more detail with a focus on near-term opportunities (one to five years). In addition, targeted end-use markets will have three specific regions with specific distances from the Wilseyville product yard:
Local – 1 to 60 mile radius; Regional – 61 to 150 mile radius; and External – 151+ mile radius.
Of particular interest and priority are opportunities to move products into first, the local markets, second, the regional markets, and last, the external markets. In addition to markets, time horizons will be considered. Two planning horizons will be considered: near term (one to five years) and mid term (six to ten years). As stated earlier, the primary focus will be on the near-term planning horizon. Key metrics to be addressed in the analysis include:
Minimum volume and type of woody biomass feedstock required for an appropriately scaled (sustainable) value-added activity;
Delivered cost (at Wilseyville) for each feedstock by type; Processing and support equipment required and onsite infrastructure required to
support it; Capital cost of equipment; Permits required for a value-added activity at the Wilseyville site; Onsite resources required (e.g., energy, water) and projected cost of these
resources;
Updated Feasibility Study for the Wilseyville Product Yard 6 TSS Consultants
All-in cost forecast for value-added products at the Wilseyville site delivered to local, regional and external markets;
Local, regional, and external market demand (customers, volumes) for value-added product, including potential revenue estimates;
Local market competition for production of similar products; Direct employment (by type) created in the local market area; Potential partnering opportunities with strategic firms (equity partners); Confirm opportunities for local businesses to coordinate and realize the TBL
(balance between local environment, community and economy); and Potential grant funding opportunities.
C. Summarize Phase II meeting results and disseminate to meeting participants. Synthesize
Task 5 findings and deliver to project Steering Committee.
Task 6. Technical Feasibility Analysis
A. Assessment of the selected renewable energy technology and the technology selection process. The section will include:
A description of the process used to select the preferred technology vendor and the qualifications of the selection committee; and
A discussion of the other technology vendors and the selection committee’s evaluation criteria.
B. An assessment of the selected technology and project development team. The section
will include:
Technology history and deployment; Potential environmental impacts; Projected capital costs; Projected developmental costs; Projected operations and maintenance costs; The project management organizational structure; and Project constraints or limitations.
Task 7. Economic Feasibility Analysis The economic feasibility analysis will analyze potential for the proposed project to succeed financially. Key variables will include:
Analysis of the wages and staffing requirements; Access to site utilities and transportation infrastructure; Potential for job creation; Potential end users and the accessibility to the market for marketable products; and Sensitivity analysis for key variables.
Updated Feasibility Study for the Wilseyville Product Yard 7 TSS Consultants
Task 8. Draft Feasibility Study Report Based upon information, research findings, and stakeholder input assimilated in Tasks 2 through 7, generate a draft feasibility study report. The feasibility study report will be written with the target audience in mind, including the project Steering Committee, CHIPS, Amador Calaveras Consensus Group, Amador Calaveras Cooperative Association for Biomass Utilization, Sierra Nevada Conservancy Rural Business Enterprise Grant team, local entrepreneurs and informed members of the public.
The draft feasibility study report will include, but not be limited to, the following:
Title Page Table of Contents List of Tables/Figures Introduction Key Findings
Biomass feedstock availability/pricing Site Review Value-Added Opportunities Recommendations/next steps to consider
Environmental setting and target study area Biomass feedstock resource availability and delivered cost Wilseyville transfer station/Old Camp mill site review Value-Added Opportunities Observations and Path Forward Technical Feasibility Analysis Economic Feasibility Analysis Next Steps Grant funding resources Appendices
The feasibility study report document will present a clear plan addressing specific steps to consider in moving forward with optimized business models for value-added opportunities at the Old Camp Mill site. Of keen interest to the CHIPS organization and other regional stakeholders is a feasibility study that provides innovative solutions to long-term challenges and addresses the following questions.
What value-added forest biomass utilization business models, scaled to local resource sustainability, have the highest potential for successful implementation by local contractors?
Which business models are complementary such that a coordinated approach is possible – one that facilitates multiple businesses producing a variety of value-added products?

Updated Feasibility Study for the Wilseyville Product Yard 8 TSS Consultants
How should these multiple businesses coordinate so that a healthy equilibrium and TBL, represented by a balance between local environment, community, and economy, is accomplished?
Task 9. Final Feasibility Study Report and Presentation Based on input from CHIPS and the Steering Committee, a final feasibility study report document will be issued. The final report will be generated within two weeks of receiving input. Findings and a review of the feasibility study recommendations will be presented to CHIPS, the project Steering Committee, and other key stakeholders.

Updated Feasibility Study for the Wilseyville Product Yard 9 TSS Consultants
KEY FINDINGS Summarized below are findings generated as a result of this feasibility study. Biomass Feedstock Availability and Pricing The greater Wilseyville region includes heavily forested landscapes that are managed almost evenly between public agencies and private landowners. Woody biomass material sourced from forest operations, fuels treatment activities and local transfer stations are sustainably available in volumes that could support value-added utilization enterprises located at the Wilseyville site. Table 1 provides an overview of potentially available wood waste volumes by biomass source. The standard unit of measure for woody biomass is bone dry ton (BDT). 1
Table 1. Biomass Material Potentially Available
BIOMASS MATERIAL SOURCE BDT PER YEAR LOW RANGE HIGH RANGE
Timber Harvest Residuals 21,000 42,000 Fuels Treatment Activities – USFS/BLM 8,250 13,750 Fuels Treatment Activities – FSC/NRCS/CHIPS 5,625 13,125 Urban Wood Waste – Wilseyville Transfer Stations 160 175 Agricultural Residuals 0 0
TOTAL 35,035 69,050 CURRENT COMPETION 2,500 10,000
TOTAL ADJUSTED FOR COMPETITION 33,535 59,050 Table 2 summarizes the estimated costs of collection, processing and transport to deliver biomass material to the Wilseyville site.
Table 2. Biomass Material Collection, Processing and Transport Costs with Wilseyville Site as Delivery Point
BIOMASS MATERIAL SOURCE DELIVERED MATERIAL
LOW RANGE
HIGH RANGE
Timber Harvest Residuals Chips $45/BDT $60/BDT Pre-Commercial Thinning Activities and Timber Harvest
Small Logs
$32/GT
$42/GT
Fuels Treatment Activities – USFS/BLM Chips $45/BDT $60/BDT Fuels Treatment Activities – Fire Safe Councils/NRCS/CHIPS
Chips
$50/BDT
$70/BDT
Urban Wood Waste –Received in raw form
Limbs, Construction Debris, Misc. Wood
$5/BDT
$15/BDT
1One bone dry ton is the nominal equivalent of 2,000 pounds of dry wood fiber (no moisture content).
Updated Feasibility Study for the Wilseyville Product Yard 10 TSS Consultants
Assumptions used to calculate range of costs:
No service fees or cost share arrangement available from public agencies or private landowners;
One-way transport averages 30 miles for biomass and small logs; Forest biomass is collected and processed (chipped) into truck at $30-$33/BDT; Small logs are harvested, collected and loaded onto log truck at $25-$28/GT2 (about
$150/MBF3); Haul costs are $85/hour for standard chip truck/trailer; Haul costs are $100/hour for walking floor chip truck trailer; Haul costs are $85/hour for standard log truck; Biomass chips average 14 BDT/load; and Small logs average 24 GT/load (about 4 MBF).
Site Review The old mill site location for the CHIPS product yard is in a highly disturbed state and is currently zoned for Public Service (PS). While the Calaveras County Planning Director has confirmed that the projected activities in the proposed CHIPS product yard are consistent with the PS zoning designation, a Conditional Use Permit (CUP) may still be required depending on the specific project developed on the site. The proposed site offers sufficient room for a bioenergy facility to maintain and operate equipment and store feedstock for winter operations. Investment in all-weather access roads and the extension of additional utility infrastructure will be required for interconnection, water supply, and wastewater disposal; however none of these costs are anticipated to be prohibitively expensive and are typical costs for bioenergy project developers. Value-Added Opportunities Twenty-four value-added opportunities were evaluated for commercial viability, employment potential, market potential, and costs for forest-sourced biomass material. Four value-added opportunities were selected by the Project Steering Committee for more detailed analysis. These included:
Small-scale combined heat and power; Firewood processing; Small-scale sawmill; and Biomass fiber to local markets.
Small-scale combined heat and power was selected as the preferred opportunity to pursue for the site.
2GT= green ton. One green ton represents 2,000 pounds of wood fiber. 3MBF = one thousand board feet. One board foot is equivalent to a board that is 12” wide, 12” long and 1” thick.

Updated Feasibility Study for the Wilseyville Product Yard 11 TSS Consultants
Technical and Economic Analysis A technology developer was selected through a competitive bid process by a selection subcommittee of the CHIPS board. Phoenix Energy was selected as the project developer. TSS performed a technical and economic analysis of Phoenix Energy. Technically, TSS found Phoenix Energy to utilize a commercially-proven technology and demonstrates the ability to successfully deploy this technology within the California setting through their past two bioenergy projects in California. The economic analysis yielded challenges specific to the Wilseyville site due to the high cost of feedstock and the limited market for bioenergy byproducts. However, with the experience of Phoenix Energy in the biochar market and the new Senate Bill 1122 (SB 1122) legislation, TSS believes that Phoenix Energy has the skill set to drive power generation costs down to a rate that will be successful in the competitive Electric Renewable Market Auction Tariff (E-ReMAT) Feed In Tariff (FIT) program that is currently being finalized by the California Public Utilities Commission (CPUC). Recommendations and Next Steps While there are many defined steps to develop a bioenergy facility at Wilseyville, the recommendations and suggested next steps focus on addressing the economic challenges including long-term, low-cost feedstock procurement and securing eligibility into the E-ReMAT. Preparation for the E-ReMAT includes negotiating site control and passing the Fast Track or completing a System Impact Study with Pacific Gas & Electric (PG&E). In addition, CHIPS and the project developer should work with the Calaveras County Planning Department to ensure that a CUP is not required to minimize the cost of California Environmental Quality Act (CEQA) compliance, as it will be necessary for the air permits.
Updated Feasibility Study for the Wilseyville Product Yard 12 TSS Consultants
WOODY BIOMASS FEEDSTOCK RESOURCE AVAILABILITY AND COST ANALYSIS Woody biomass material sources considered in this study includes a range of forest, agricultural and wood waste management activities:
Forest management activities:
Timber harvest operations,
Fuels treatment/forest restoration projects, and
Timber stand improvement projects;
Raw material/woody biomass from urban wood waste (construction/demolition wood, pallets, tree trimmings); and
Agricultural residuals generated as a byproduct of orchard or vineyard management activities.
Target Study Area Consistent with the objectives of the woody biomass feedstock availability analysis, the forested landscapes and watersheds located within a logical haul distance of the Wilseyville site were included in the Target Study Area (TSA). Figure 2 highlights the updated TSA. 4
4As defined by feasibility study project steering committee.

Updated Feasibility Study for the Wilseyville Product Yard 13 TSS Consultants
Figure 2. Target Study Area
Updated Feasibility Study for the Wilseyville Product Yard 14 TSS Consultants
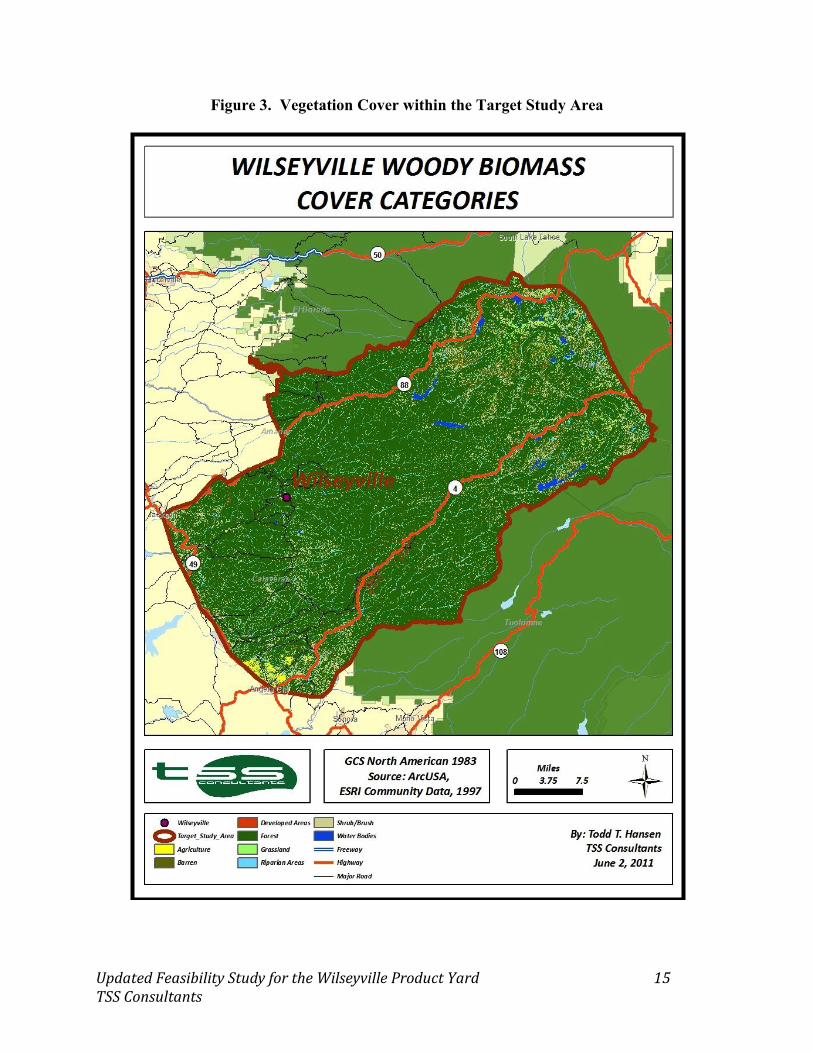
Vegetation Cover and Land Ownership/Jurisdiction Woody biomass availability for any given region is heavily dependent on vegetation cover, land management objectives and ownership. Vegetation cover within the Wilseyville TSA is predominantly forest (80%), shrubs/brush (8%), and riparian (6%) cover. Figure 3 shows vegetation cover types within the TSA.
Updated Feasibility Study for the Wilseyville Product Yard 15 TSS Consultants
Figure 3. Vegetation Cover within the Target Study Area

Updated Feasibility Study for the Wilseyville Product Yard 16 TSS Consultants
Vegetation cover types significantly influence woody biomass availability. Depending on management objectives, certain cover types could generate significant volumes of woody biomass material for use as feedstocks for value-added utilization. Table 3 summarizes vegetation cover by category within the TSA.
Table 3. Vegetation Cover within the TSA
COVER CATEGORIES ACRES PERCENT OF
TOTAL Agriculture 2,792 0.3% Barren 24,037 2.8% Developed Areas 11,262 1.3% Forest 688,466 80.2% Grassland 5,149 0.6% Riparian Areas 51,283 6.0% Shrub/Brush 68,212 7.9% Water Bodies 7,041 0.8%
TOTALS 858,241 100.0%
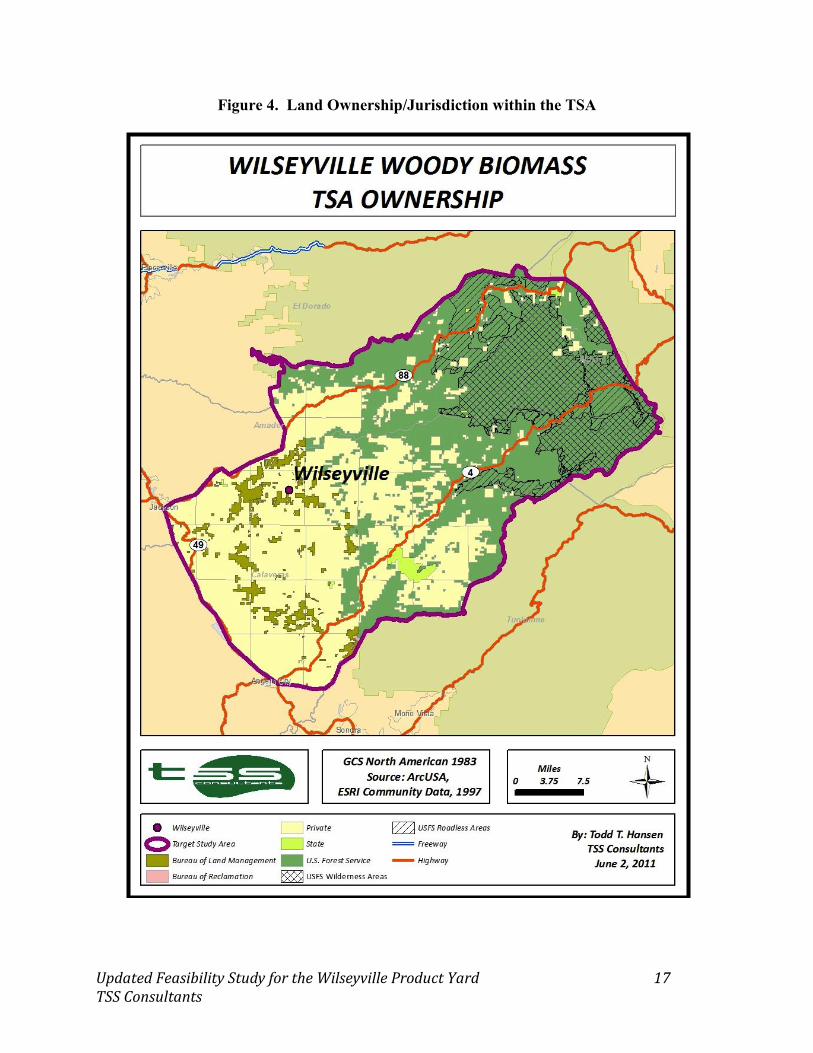
Land ownership drives vegetation management objectives and within the TSA, the U.S. Department of Agriculture (USDA) Forest Service (USFS) is the most significant land manager with responsibility for approximately 49% of the landscape. Private land makes up about 46% and the Bureau of Land Management (BLM) makes up relatively little acreage at 4%. Federal land management agencies (USFS and BLM) together manage approximately 53% of the landscape. Federal jurisdiction and management objectives have a significant influence regarding woody biomass material availability within the TSA.
Figure 4 highlights the locations of the various ownerships and jurisdictions.
Updated Feasibility Study for the Wilseyville Product Yard 17 TSS Consultants
Figure 4. Land Ownership/Jurisdiction within the TSA
Updated Feasibility Study for the Wilseyville Product Yard 18 TSS Consultants
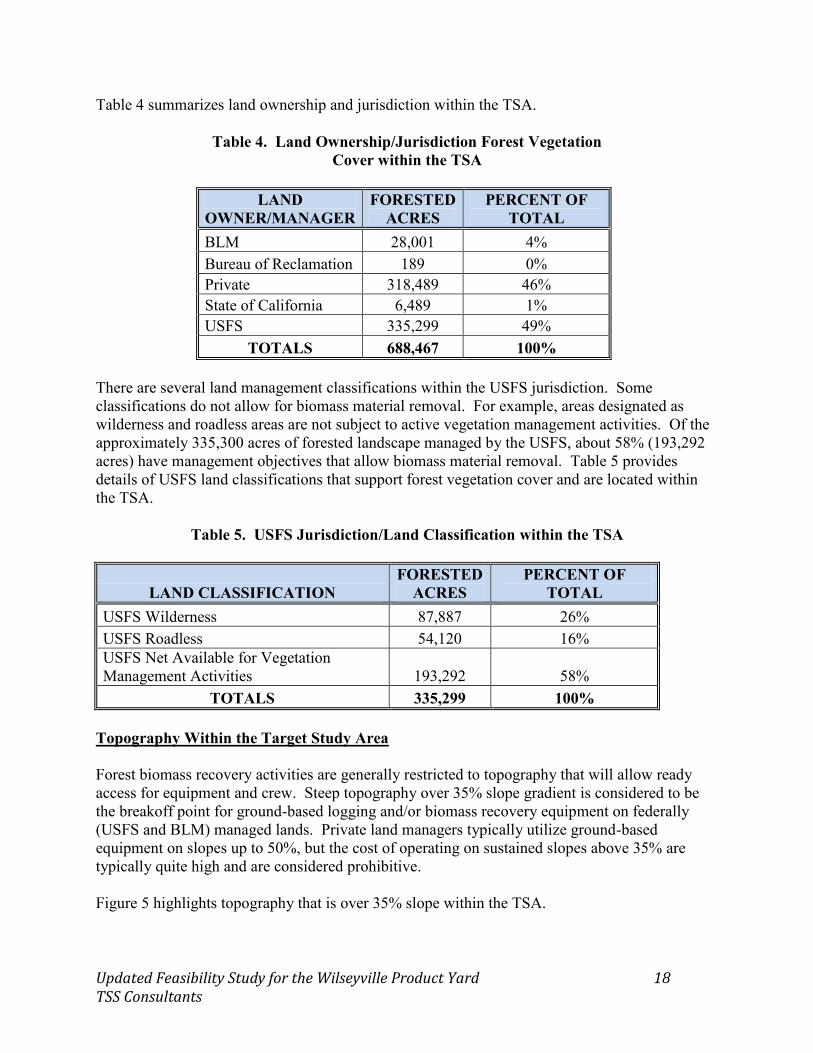
Table 4 summarizes land ownership and jurisdiction within the TSA.
Table 4. Land Ownership/Jurisdiction Forest Vegetation Cover within the TSA
LAND
OWNER/MANAGER FORESTED
ACRES PERCENT OF
TOTAL BLM 28,001 4% Bureau of Reclamation 189 0% Private 318,489 46% State of California 6,489 1% USFS 335,299 49%
TOTALS 688,467 100% There are several land management classifications within the USFS jurisdiction. Some classifications do not allow for biomass material removal. For example, areas designated as wilderness and roadless areas are not subject to active vegetation management activities. Of the approximately 335,300 acres of forested landscape managed by the USFS, about 58% (193,292 acres) have management objectives that allow biomass material removal. Table 5 provides details of USFS land classifications that support forest vegetation cover and are located within the TSA.
Table 5. USFS Jurisdiction/Land Classification within the TSA
LAND CLASSIFICATION FORESTED
ACRES PERCENT OF
TOTAL USFS Wilderness 87,887 26% USFS Roadless 54,120 16% USFS Net Available for Vegetation Management Activities 193,292 58%
TOTALS 335,299 100% Topography Within the Target Study Area Forest biomass recovery activities are generally restricted to topography that will allow ready access for equipment and crew. Steep topography over 35% slope gradient is considered to be the breakoff point for ground-based logging and/or biomass recovery equipment on federally (USFS and BLM) managed lands. Private land managers typically utilize ground-based equipment on slopes up to 50%, but the cost of operating on sustained slopes above 35% are typically quite high and are considered prohibitive. Figure 5 highlights topography that is over 35% slope within the TSA.

Updated Feasibility Study for the Wilseyville Product Yard 19 TSS Consultants
Figure 5. Slope Analysis of the TSA

Updated Feasibility Study for the Wilseyville Product Yard 20 TSS Consultants
Table 6 provides figures regarding TSA topography by slope class.
Table 6. Topography Classification within the TSA
TOPOGRAPHY ACRES PERCENT OF TOTAL 35% Slope and Less 615,098 72% Greater than 35% Slope 243,903 28%
TOTALS 859,001 100% Almost three-quarters of the topography within the TSA is 35% slope or less and is considered potentially available for biomass recovery activities. Of course, land management classifications such as wilderness or roadless area override slope conditions and are not considered available for biomass recovery activities. TSS further analyzed the slope topography to account for acres by ownership that are potentially available for vegetation management. Table 7 summarizes the results.
Table 7. Topography Classification by Ownership within the TSA
OWNERSHIP < 35% SLOPE ACRES
>35% SLOPE ACRES
TOTAL ACRES
<35% SLOPE
PERCENT OF
TOTAL
>35% SLOPE
PERCENT OF
TOTAL USFS (Net Available) 141,103 52,189 193,292 73% 27% BLM 13,744 17,701 31,445 44% 56% Private 296,068 91,265 387,333 76% 24%
TOTALS 450,915 161,155 612,070 Forest-Sourced Biomass Timber Harvest Residuals Timber harvest residuals can provide significant volumes of woody biomass material. Typically available as limbs, tops and unmerchantable logs, these residuals are waste byproducts of commercial timber harvesting operations. As such, these residuals have no merchantable value though they can be a relatively economic raw material feedstock supply for the emerging added value woody biomass utilization effort. Once collected and processed using portable chippers or grinders, this material is an excellent biomass feedstock source or feedstock for compost/mulch. Small, unmerchantable logs that do not meet sawlog specifications could also be recovered from timber harvest operations. In some cases the larger sawlogs (e.g., 10” and larger diameter measured small end inside bark) command a higher value, which could leave smaller logs

Updated Feasibility Study for the Wilseyville Product Yard 21 TSS Consultants
available for value-added utilization (depending on sawlog pricing). These smaller logs could be delimbed to a manageable diameter (e.g., 2”) and made available for value-added uses such as firewood, post/poles or animal bedding logs. Timber harvest activity within the State of California is monitored by the State Board of Equalization (BOE). The BOE levies timber harvest taxes based on annual timber harvest levels. A review of the 2006 through 2010 timber harvest data was conducted to confirm historic timber harvest activities within the TSA. Table 8 provides the results.
Table 8. 2006 Through 2010 Timber Harvest Volume Produced Within the TSA (Expressed in MBF5/Year)
COUNTY 2006 2007 2008 2009 2010 5 YEAR
AVERAGE HARVEST
% OF COUNTY
IN TSA
WEIGHTED AVERAGE HARVEST
Alpine 51 0 0 0 2,192 449 29% 129 Amador 27,274 18,297 24,626 5,927 7,718 16,768 37% 6,235 Calaveras 33,523 27,138 33,235 16,162 25,679 27,147 73% 19,854 El Dorado 99,508 91,055 44,726 20,181 19,832 55,060 7% 3,718 Tuolumne 48,392 50,558 52,975 26,976 23,596 40,499 9% 3,656
Totals 208,748 187,048 155,562 69,246 79,017 139,924 33,591 Results of the historic timber harvest review confirm that harvest levels over time have been inconsistent. A primary driver is the demand for sawlogs, which was significantly diminished in 2009 and 2010 due to curtailment of the Sierra Pacific Industries sawmill at Standard. The Standard mill has been rebuilt and is currently in commercial operation,6 which should ramp up harvest levels to pre-2009 levels. The 2006 through 2010 historic record of timber harvest across all five counties results in an average annual harvest of 139,924 MBF. The TSA is made up of portions of these counties and using GIS analysis, TSS was able to determine the portion of each county that lies within the TSA (see Table 8). Using this data, a weighted average timber harvest figure was calculated for each county. From this methodology, TSS was able to conclude that the average annual timber harvest for the TSA amounts to 33,591 MBF per year. TSS’ experience with forest biomass recovery confirms that a recovery factor of 0.9 BDT per MBF of sawlogs harvested would apply for mixed conifer stands in the TSA. This amounts to a gross potential of 30,232 BDT per year of timber harvest residuals. Not all topography or road systems will accommodate biomass recovery operations. Based on slope analysis (see Table 7) and for the purposes of this forecast, it is assumed that 70% of the timber harvest operations within the TSA are located on topography and road systems that will support biomass recovery. Using this assumption then, approximately 21,162 BDT per year are
5MBF = thousand board foot measure. One board foot is nominally 12” long by 12” wide and 1” thick. 6Per discussions with Tim Tate, SPI forester.
Updated Feasibility Study for the Wilseyville Product Yard 22 TSS Consultants
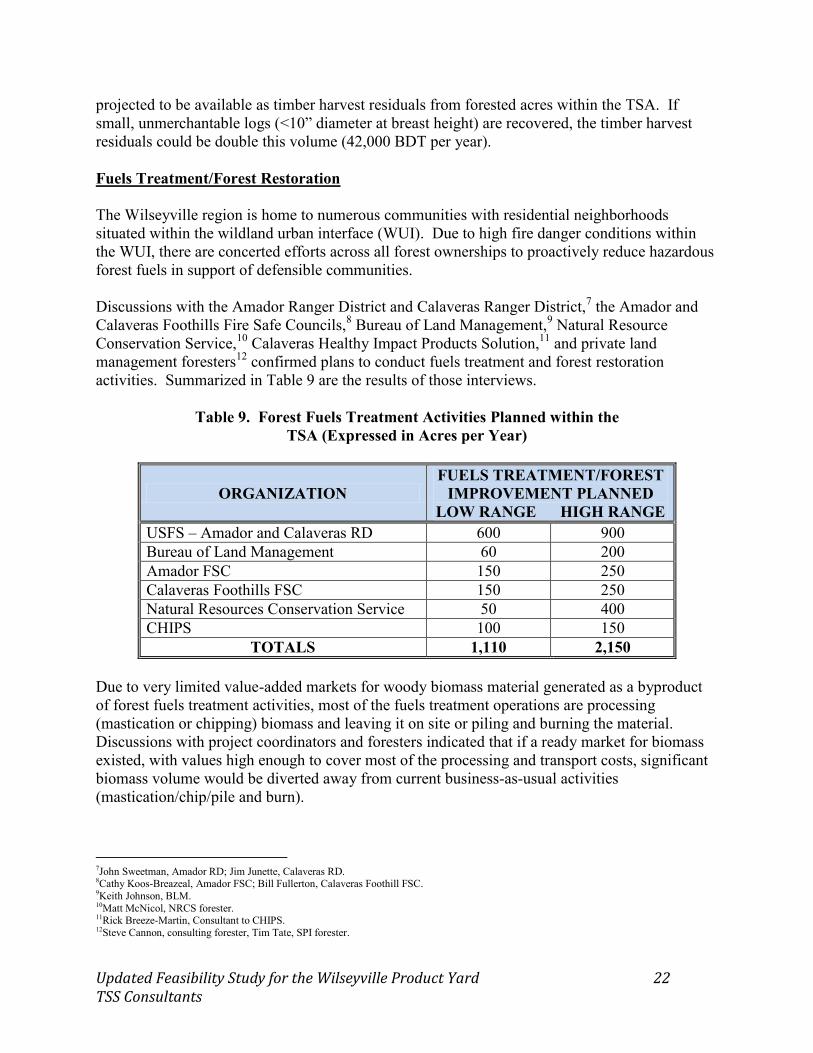
projected to be available as timber harvest residuals from forested acres within the TSA. If small, unmerchantable logs (<10” diameter at breast height) are recovered, the timber harvest residuals could be double this volume (42,000 BDT per year). Fuels Treatment/Forest Restoration The Wilseyville region is home to numerous communities with residential neighborhoods situated within the wildland urban interface (WUI). Due to high fire danger conditions within the WUI, there are concerted efforts across all forest ownerships to proactively reduce hazardous forest fuels in support of defensible communities. Discussions with the Amador Ranger District and Calaveras Ranger District,7 the Amador and Calaveras Foothills Fire Safe Councils,8 Bureau of Land Management,9 Natural Resource Conservation Service,10 Calaveras Healthy Impact Products Solution,11 and private land management foresters12 confirmed plans to conduct fuels treatment and forest restoration activities. Summarized in Table 9 are the results of those interviews.
Table 9. Forest Fuels Treatment Activities Planned within the TSA (Expressed in Acres per Year)
ORGANIZATION FUELS TREATMENT/FOREST
IMPROVEMENT PLANNED LOW RANGE HIGH RANGE
USFS – Amador and Calaveras RD 600 900 Bureau of Land Management 60 200 Amador FSC 150 250 Calaveras Foothills FSC 150 250 Natural Resources Conservation Service 50 400 CHIPS 100 150
TOTALS 1,110 2,150 Due to very limited value-added markets for woody biomass material generated as a byproduct of forest fuels treatment activities, most of the fuels treatment operations are processing (mastication or chipping) biomass and leaving it on site or piling and burning the material. Discussions with project coordinators and foresters indicated that if a ready market for biomass existed, with values high enough to cover most of the processing and transport costs, significant biomass volume would be diverted away from current business-as-usual activities (mastication/chip/pile and burn).
7John Sweetman, Amador RD; Jim Junette, Calaveras RD. 8Cathy Koos-Breazeal, Amador FSC; Bill Fullerton, Calaveras Foothill FSC. 9Keith Johnson, BLM. 10Matt McNicol, NRCS forester. 11Rick Breeze-Martin, Consultant to CHIPS. 12Steve Cannon, consulting forester, Tim Tate, SPI forester.
Updated Feasibility Study for the Wilseyville Product Yard 23 TSS Consultants
Interviews with forest managers and fiber procurement foresters confirmed that between 10 and 15 BDT per acre of forest biomass is considered recoverable during fuels treatment and forest restoration activities. Assuming an average recovery factor of 12.5 BDT per acre, and the annual acres treated shown in Table 9, between 13,875 and 26,875 BDT will be generated per year from fuels treatment and forest improvement operations in the TSA. Urban-Sourced Biomass Wood waste generated by tree service companies, local residents, and businesses in the Wilseyville area regularly generate wood waste in the form of tree trimmings, construction debris and demolition wood. Much of this wood waste is currently deposited at the Calaveras County managed Wilseyville Transfer Station. Discussions with Calaveras County Solid Waste Department13 confirmed that the County continues to accept wood waste at the transfer station and that a tip fee of $4 per cubic yard is charged at the gate. Prior to October 2009, there was no tip fee and a higher volume of wood waste was delivered. In 2008 approximately 1,950 cubic yards of wood waste was taken in. If the Wilseyville product yard is developed, a similar volume of wood waste can be expected should there be no tip fee charged. Calaveras County staff expressed a high level of interest in discontinuing acceptance of wood waste at the Wilseyville Transfer Station should the Wilseyville product yard be developed. CHIPS and County Staff are in discussions about diverting the Wilseyville wood waste stream from the transfer station to the product yard as part of coordinating public service. TSS’ discussions with landfill and transfer staff over the years indicate that each cubic yard of unprocessed brush, tree trimmings, and wood waste averages about 300 pounds. TSS’ experience is that urban wood with a heavy green component (e.g., brush, tree trimmings) will average about 40% moisture content. Using these metrics (300 lb/cubic yard and 40% moisture content), each cubic yard received will equal about 180 dry pounds of wood. Assuming that 1,950 cubic yards are accepted in a given year equates to 175 BDT per year. Agricultural Byproducts As noted in the vegetation cover analysis (see Table 3), less than 0.5% of the TSA includes land dedicated to commercial agriculture (approximately 2,792 acres). Most of these acres are likely dedicated to raising cattle and calves, which is the number one agriculture commodity in the county.14 Some commercial agriculture crops, such as orchards, do generate wood waste in the form of prunings generated annually and as orchards are replaced (nut orchards are removed and replaced about every 25 years). Vineyards may generate wood waste as they are removed, but removal is fairly rare and separating the vines from the trellis cables is very costly. The 2009 Calaveras County Crop Report confirmed that there are 800 acres of walnut orchard and 800 acres of wine grapes in the county. Discussions with local foresters and fiber managers15 confirmed that no commercial orchards exist within the TSA and that few vineyards
13Tom Garcia, Director, Public Works Department, Calaveras County. 14Per the 2009 Calaveras County Crop Report. 15John Romena, Director of Fuel Procurement, Buena Vista Biomass Power, LLC.

Updated Feasibility Study for the Wilseyville Product Yard 24 TSS Consultants
are in the TSA that might generate wood waste (e.g., prunings). TSS concludes that no volume of agricultural wood waste is currently available within the TSA.
Biomass Feedstock Competition Analysis Current Competition There are very limited existing markets for forest biomass material generated within the TSA. Existing facilities currently procuring biomass feedstock in the region that may occasionally source feedstock from the TSA are summarized in Table 10.
Table 10. Facilities Currently Competing For Feedstock
FACILITY LOCATION SCALE (MW)
DISTANCE FROM
WILSEYVILLE (MILES)
Buena Vista Biomass Power Buena Vista 18 36 Pacific Ultrapower Chinese Station Jamestown 22 50
Interviews with fuel procurement managers in the region confirmed that very little biomass feedstock is currently sourced from the TSA. Only the Buena Vista Biomass Power (BVBP) facility would possibly source feedstock that is tributary to Wilseyville. However, the BVBP facility is constrained in its ability to procure forest biomass feedstock due to its commitment with the Center for Biological Diversity to source no more that 15% of its total feedstock needs from forest operations. The next closest biomass power generation facility in the region is the Pacific Ultrapower Chinese Station facility at Jamestown. This facility typically sources urban wood waste from Stockton and the San Francisco Bay area, and agricultural byproducts from the greater Stockton area as feedstock. When occasionally sourcing forest biomass feedstock, only material close to Jamestown (typically less than 30 mile transport distance) is procured. Occasionally the Pacific Ultrapower facility may source forest biomass feedstock from the TSA. TSS estimates that between 2,500 and 10,000 BDT of forest sourced feedstock may be procured annually from within the TSA by BVBP and/or Pacific Ultrapower Chinese Station. Potential Competition TSS is not aware of any new forest biomass processing or utilization facilities planned for locations within the TSA or tributary to the TSA. The only potential competition for forest biomass feedstock could be the existing biomass power generation facility at the Sierra Pacific Industries (SPI) facility at Standard. SPI Standard typically utilizes sawmill residuals and agricultural byproducts as its primary feedstock sources. Occasionally the plant may source forest biomass material in the region that is located in close proximity to Standard. This forest biomass could be sourced from SPI lands or USFS timber sales, but very rarely would it be

Updated Feasibility Study for the Wilseyville Product Yard 25 TSS Consultants
sourced from within the TSA. Table 11 identifies potential competition for forest biomass feedstock generated within the TSA.
Table 11. Facilities Potentially Competing For Feedstock
FACILITY LOCATION SCALE (MW)
DISTANCE FROM
WILSEYVILLE (MILES)
Sierra Pacific Industries Standard 8 57 The location of the biomass power generation facilities considered current and potential competition are highlighted in Figure 6 below.
Figure 6. Current and Potential Competition for Feedstock within the TSA

Updated Feasibility Study for the Wilseyville Product Yard 26 TSS Consultants
Biomass Feedstock Availability – Current Forecast Summarized in Table 12 are the results of biomass material recovery analysis from forest activities and urban wood waste within the TSA.
Table 12. Biomass Material Potentially Available – 2013
BIOMASS MATERIAL SOURCE BDT PER YEAR LOW RANGE HIGH RANGE
Timber Harvest Residuals 21,000 42,000 Fuels Treatment Activities – USFS/BLM 8,250 13,750 Fuels Treatment Activities – FSC/NRCS/CHIPS 5,625 13,125 Urban Wood Waste – Wilseyville Transfer Station 160 175 Agricultural Residuals 0 0
TOTAL 35,035 69,050 CURRENT COMPETION 2,500 10,000
TOTAL ADJUSTED FOR COMPETITION 33,535 59,050 Biomass Feedstock Availability – Future Forecast 2014 to 2016 Summarized in Table 13 are the results of biomass material recovery analysis adjusted for biomass availability one to three years from now.
Table 13. Biomass Material Potentially Available – 2014 to 2016
BIOMASS MATERIAL SOURCE BDT PER YEAR LOW RANGE HIGH RANGE
Timber Harvest Residuals 22,500 44,000 Fuels Treatment Activities – USFS/BLM 13,250 18,750 Fuels Treatment Activities – FSC/NRCS/CHIPS 5,625 13,125 Urban Wood Waste – Wilseyville Transfer Station 225 250 Agricultural Residuals 0 0
TOTAL 41,600 76,125 PROJECTED COMPETITION 2,500 10,000
TOTAL ADJUSTED FOR COMPETION 39,100 66,125 Assumptions used for this forecast include:
General improvement in the local and regional economy (more urban wood waste generated);
Slightly improved saw timber markets (mild increase in timber harvest on public and private forest lands); and
Ramp up in forest fuels reduction activities as the ACCG All Lands TBL strategy is implemented with projects like the CFLRP Cornerstone Project.
Updated Feasibility Study for the Wilseyville Product Yard 27 TSS Consultants
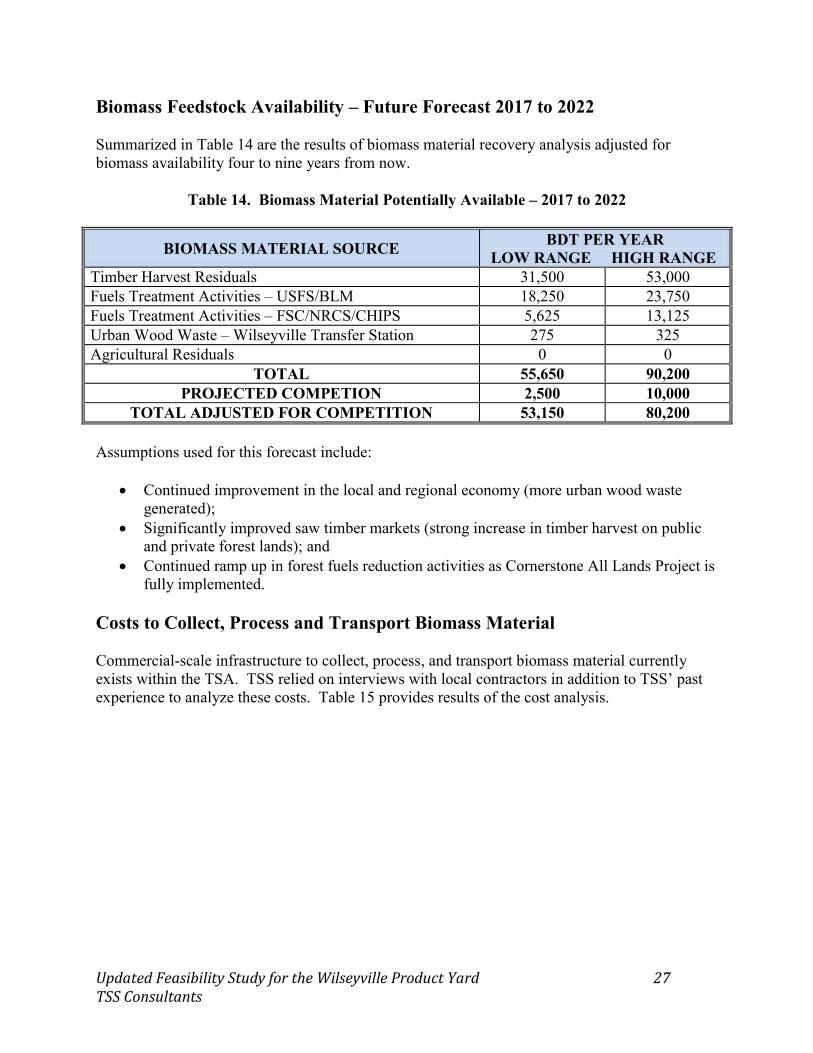
Biomass Feedstock Availability – Future Forecast 2017 to 2022 Summarized in Table 14 are the results of biomass material recovery analysis adjusted for biomass availability four to nine years from now.
Table 14. Biomass Material Potentially Available – 2017 to 2022
BIOMASS MATERIAL SOURCE BDT PER YEAR LOW RANGE HIGH RANGE
Timber Harvest Residuals 31,500 53,000 Fuels Treatment Activities – USFS/BLM 18,250 23,750 Fuels Treatment Activities – FSC/NRCS/CHIPS 5,625 13,125 Urban Wood Waste – Wilseyville Transfer Station 275 325 Agricultural Residuals 0 0
TOTAL 55,650 90,200 PROJECTED COMPETION 2,500 10,000
TOTAL ADJUSTED FOR COMPETITION 53,150 80,200 Assumptions used for this forecast include:
Continued improvement in the local and regional economy (more urban wood waste generated);
Significantly improved saw timber markets (strong increase in timber harvest on public and private forest lands); and
Continued ramp up in forest fuels reduction activities as Cornerstone All Lands Project is fully implemented.
Costs to Collect, Process and Transport Biomass Material Commercial-scale infrastructure to collect, process, and transport biomass material currently exists within the TSA. TSS relied on interviews with local contractors in addition to TSS’ past experience to analyze these costs. Table 15 provides results of the cost analysis.

Updated Feasibility Study for the Wilseyville Product Yard 28 TSS Consultants
Table 15. Biomass Material Collection, Processing and Transport Costs with Wilseyville Site as Delivery Point
BIOMASS MATERIAL SOURCE DELIVERED MATERIAL
LOW RANGE
HIGH RANGE
Timber Harvest Residuals Chips $45/BDT $60/BDT Pre-Commercial Thinning Activities and Timber Harvest Small Logs $32/GT $42/GT
Fuels Treatment Activities – USFS/BLM Chips $45/BDT $60/BDT
Fuels Treatment Activities – FSC/NRCS/CHIPS Chips $50/BDT $70/BDT
Urban Wood Waste – Received in Raw Form
Limbs, Construction Debris, Misc. Wood $5/BDT $15/BDT
Assumptions used to calculate range of costs:
No service fees or cost share arrangement available from public agencies or private landowners;
One-way transport averages 30 miles for biomass and small logs; Forest biomass is collected and processed (chipped) into truck for $30 to $33/BDT; Small logs are harvested, collected and loaded onto log truck for $25 to $28/GT; Haul costs are $85/hour for standard chip truck/trailer; Haul costs are $100/hour for walking floor chip truck trailer; Haul costs are $85/hour for standard log truck; Biomass chips average 14 BDT/load; and Small logs average 24 GT/load.
Current Market Prices Demand for woody biomass material currently exists within the TSA. Several biomass power plants and an animal bedding operation are actively procuring biomass in the form of chips and logs. Current prices range from $40 to $42 per BDT for biomass feedstock and from $30 to $32 per GT for small, typically low-grade logs for animal bedding. The SPI Standard sawmill is purchasing logs (sawmill grade) as well. Discussions with Buena Vista Biomass Power staff16 confirmed plans to begin receiving limited biomass feedstock deliveries commencing mid-January, 2012. Commercial operations are expected to commence during first quarter, 2012, with feedstock receipts ramping up to full capacity in late January or early February.
16John Romena, Director of Fuel Procurement, Buena Vista Biomass Power.
Updated Feasibility Study for the Wilseyville Product Yard 29 TSS Consultants
State and Federal Environmental Analysis Commercial forest operations on private lands such as timber harvests require a State of California approved Timber Harvest Plan (THP). The California Department of Forestry and Fire Protection is the lead state agency administering THPs. THPs are compliant with the California Environmental Quality Act (CEQA). On federally-managed lands, vegetation management activities must be compliant with the National Environmental Policy Act (NEPA). USFS and BLM conduct NEPA analysis required before commencement of vegetation management activities. Applicable State and Federal Taxes The California Board of Equalization levies timber harvest yield taxes on all commercial products removed from either public or private lands. Currently forest biomass from unmerchantable limbs, tops, and very small stems is considered to have no commercial value and is not included in yield tax calculations. Biomass Feedstock Supply Risks and Future Sources Feedstock Supply Competition Risk Mitigation The primary mitigation measure to minimize the impact of potential or current biomass supply competition is to concentrate procurement efforts in the development of suppliers located close-in and tributary to Wilseyville. A project will have significant transport cost advantages when sourcing biomass feedstock as near as possible to its location. An additional mitigation measure to minimize the impact of competing biomass purchasers is to secure stable and price competitive feedstock sources utilizing long-term supply agreements with a variety of reliable feedstock suppliers. Time of Year Availability Discussions with local foresters indicate that the typical season for field operations is May 1 through November 15. A variety of factors impact this, including snow depth and wet soil conditions (e.g., concerns regarding potential soil compaction). Logs for the sawmill or firewood processor will need to be stockpiled (decked) on site if there are plans to operate during the winter months. Processed forest biomass (chips) used as feedstock for a small power generation facility will also need to be stockpiled on site for winter operations. Urban wood waste is typically generated year round with some seasonal fluctuation (downturn) during the holiday season (mid-November through December).
Updated Feasibility Study for the Wilseyville Product Yard 30 TSS Consultants
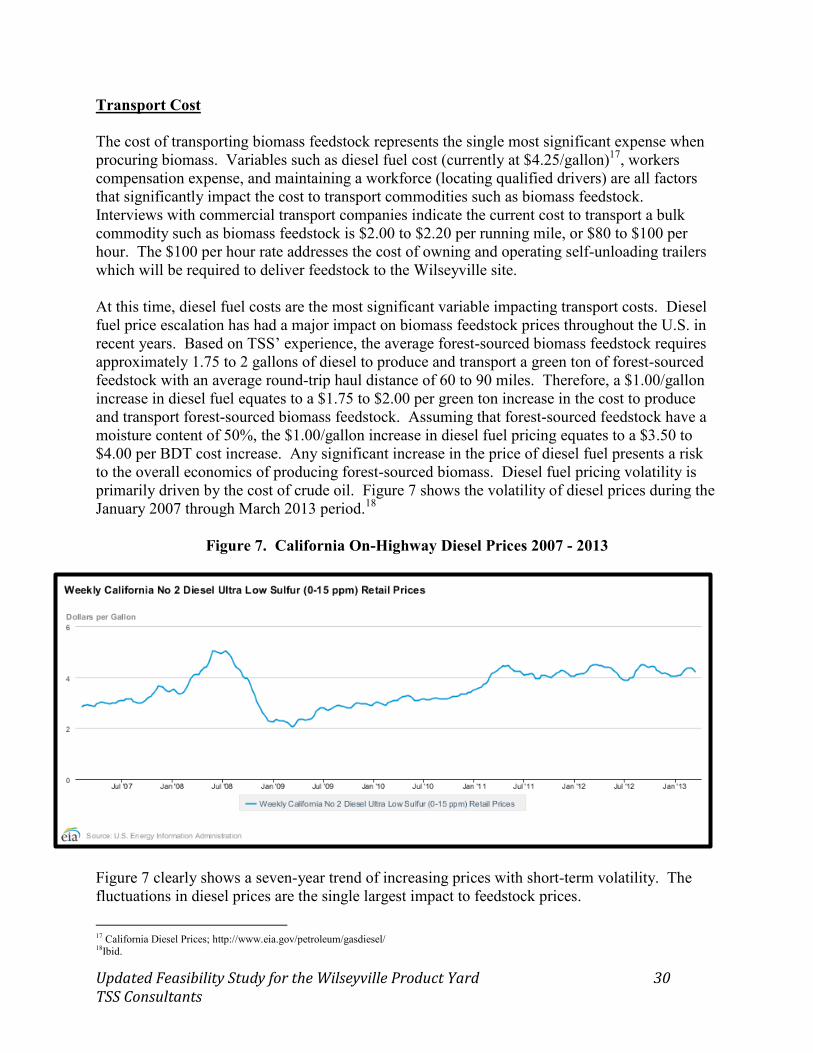
Transport Cost The cost of transporting biomass feedstock represents the single most significant expense when procuring biomass. Variables such as diesel fuel cost (currently at $4.25/gallon)17, workers compensation expense, and maintaining a workforce (locating qualified drivers) are all factors that significantly impact the cost to transport commodities such as biomass feedstock. Interviews with commercial transport companies indicate the current cost to transport a bulk commodity such as biomass feedstock is $2.00 to $2.20 per running mile, or $80 to $100 per hour. The $100 per hour rate addresses the cost of owning and operating self-unloading trailers which will be required to deliver feedstock to the Wilseyville site. At this time, diesel fuel costs are the most significant variable impacting transport costs. Diesel fuel price escalation has had a major impact on biomass feedstock prices throughout the U.S. in recent years. Based on TSS’ experience, the average forest-sourced biomass feedstock requires approximately 1.75 to 2 gallons of diesel to produce and transport a green ton of forest-sourced feedstock with an average round-trip haul distance of 60 to 90 miles. Therefore, a $1.00/gallon increase in diesel fuel equates to a $1.75 to $2.00 per green ton increase in the cost to produce and transport forest-sourced biomass feedstock. Assuming that forest-sourced feedstock have a moisture content of 50%, the $1.00/gallon increase in diesel fuel pricing equates to a $3.50 to $4.00 per BDT cost increase. Any significant increase in the price of diesel fuel presents a risk to the overall economics of producing forest-sourced biomass. Diesel fuel pricing volatility is primarily driven by the cost of crude oil. Figure 7 shows the volatility of diesel prices during the January 2007 through March 2013 period.18
Figure 7. California On-Highway Diesel Prices 2007 - 2013
Figure 7 clearly shows a seven-year trend of increasing prices with short-term volatility. The fluctuations in diesel prices are the single largest impact to feedstock prices.
17 California Diesel Prices; http://www.eia.gov/petroleum/gasdiesel/ 18Ibid.
Updated Feasibility Study for the Wilseyville Product Yard 31 TSS Consultants
Housing and Construction As economic conditions improve and the housing and construction sectors rebound, wood product manufacturing, and timber harvest activity will increase as well. An increase in wood product manufacturing will result in increasing volumes of byproduct (e.g., sawdust, bark), a traditional source of cost effective woody biomass feedstock for many biomass power generation facilities. An increase in timber harvest activity and volumes would generate additional volumes of forest-sourced biomass feedstock. Improvements in housing and construction will result in an increase in volumes of urban wood from construction and demolition projects. Though little separation and utilization of this feedstock currently occurs within the TSA, the biomass power plants that currently and potentially compete for feedstock within the TSA will have access to additional cost effective urban wood material. This will likely reduce their need to compete for forest-sourced material generated within the TSA. State and Federal Policies Public policy can be a source of risk or can provide opportunity. An example of potential risks include possible changes in land management policies and regulations that could reduce fuel treatment and forest restoration activities on both private and public lands. However, public policy can also provide opportunity, as is the case with state Senate Bill 32 (SB 32) and state SB 1122. These bills significantly improved the power sales opportunities for small-scale renewable energy projects strategically located within Investor Owned Utility (IOU) service territories. Five-Year Biomass Feedstock Pricing Forecast Table 16 represent a five-year biomass feedstock pricing forecast for a community-scale bioenergy facility at Wilseyville. The base price of $53.86 per BDT is based on the weighted average of product availability (Table 12) and cost (Table 15).
Table 16. Five-Year Feedstock Pricing Forecast 2013 to 2017
2013 2014 2015 2016 2017 Feedstock Price at
Wilseyville ($/BDT) $53.86 $54.61 $55.37 $56.15 $56.94
The feedstock price forecast presented in Table 16 is based on the following assumptions:
Feedstock supply chain is fully developed with feedstock available from forest-based operations;
Diesel fuel prices remain near $4.25/gallon through 2013, then escalate at 2% per year; Labor rates remain stable through 2013, then climb at 2% per year; and Biomass feedstock prices escalate at 1.4% annual rate due to increased diesel fuel and
labor costs from 2014 through 2017.
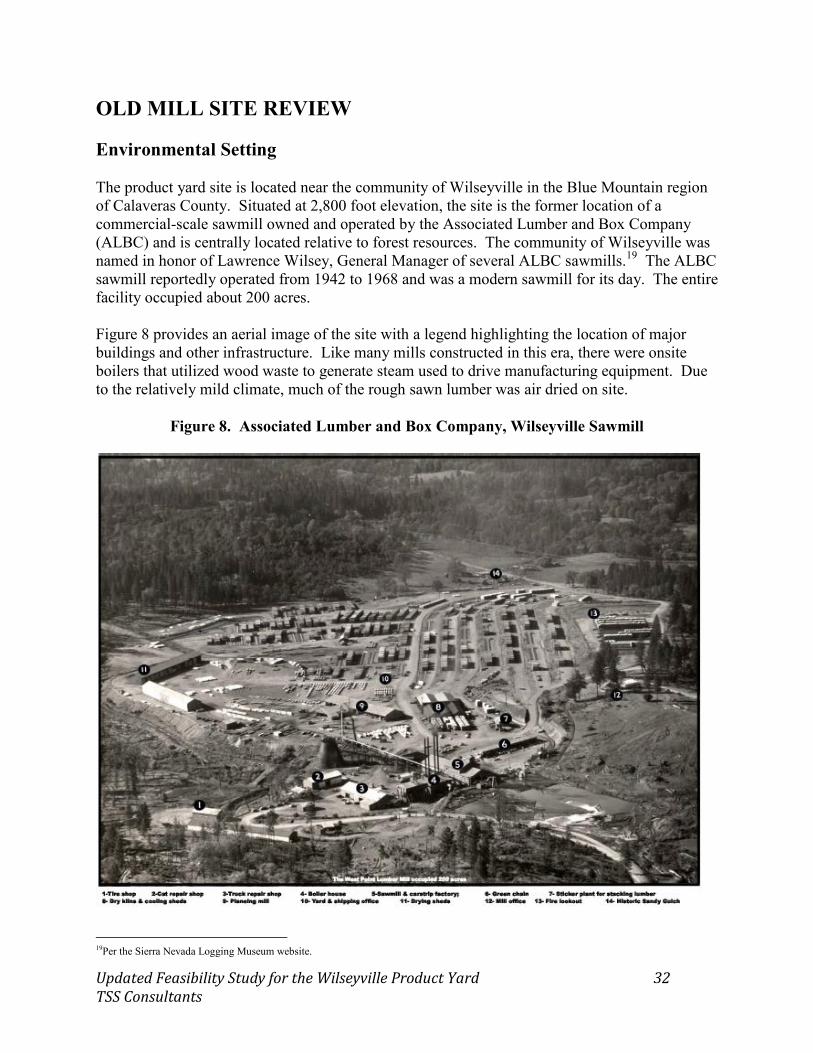
Updated Feasibility Study for the Wilseyville Product Yard 32 TSS Consultants
OLD MILL SITE REVIEW Environmental Setting The product yard site is located near the community of Wilseyville in the Blue Mountain region of Calaveras County. Situated at 2,800 foot elevation, the site is the former location of a commercial-scale sawmill owned and operated by the Associated Lumber and Box Company (ALBC) and is centrally located relative to forest resources. The community of Wilseyville was named in honor of Lawrence Wilsey, General Manager of several ALBC sawmills.19 The ALBC sawmill reportedly operated from 1942 to 1968 and was a modern sawmill for its day. The entire facility occupied about 200 acres. Figure 8 provides an aerial image of the site with a legend highlighting the location of major buildings and other infrastructure. Like many mills constructed in this era, there were onsite boilers that utilized wood waste to generate steam used to drive manufacturing equipment. Due to the relatively mild climate, much of the rough sawn lumber was air dried on site.
Figure 8. Associated Lumber and Box Company, Wilseyville Sawmill
19Per the Sierra Nevada Logging Museum website.
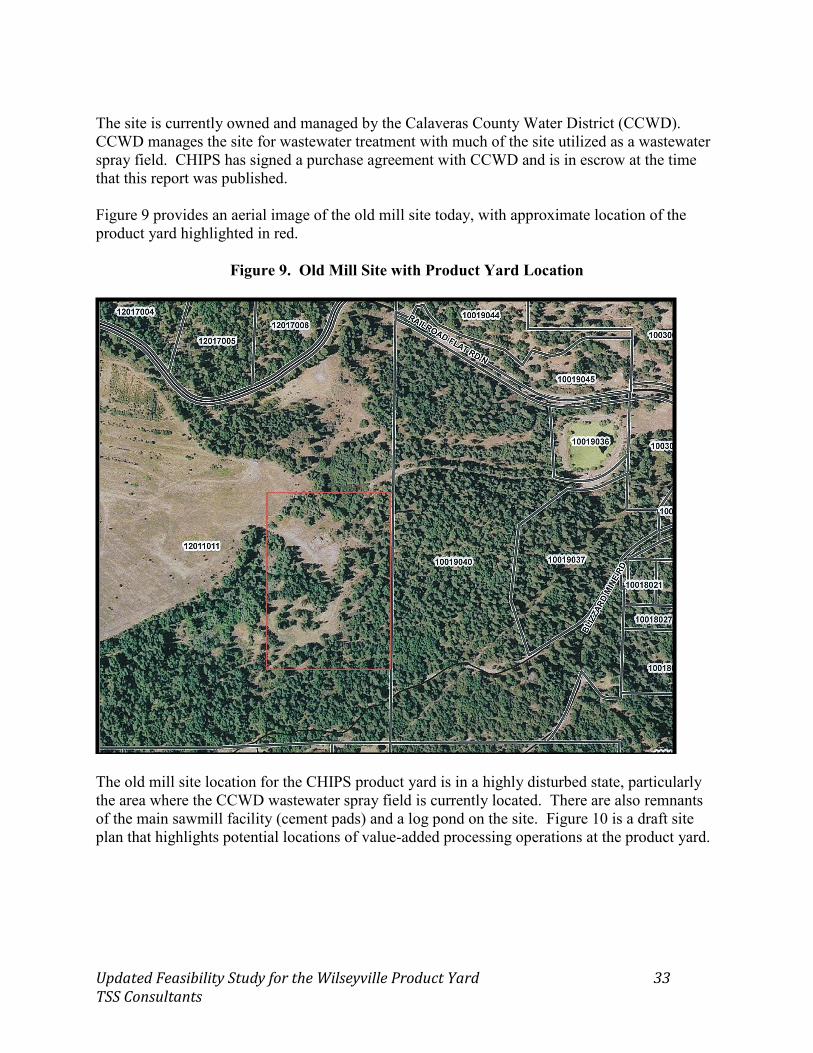
Updated Feasibility Study for the Wilseyville Product Yard 33 TSS Consultants
The site is currently owned and managed by the Calaveras County Water District (CCWD). CCWD manages the site for wastewater treatment with much of the site utilized as a wastewater spray field. CHIPS has signed a purchase agreement with CCWD and is in escrow at the time that this report was published. Figure 9 provides an aerial image of the old mill site today, with approximate location of the product yard highlighted in red.
Figure 9. Old Mill Site with Product Yard Location
The old mill site location for the CHIPS product yard is in a highly disturbed state, particularly the area where the CCWD wastewater spray field is currently located. There are also remnants of the main sawmill facility (cement pads) and a log pond on the site. Figure 10 is a draft site plan that highlights potential locations of value-added processing operations at the product yard.

Updated Feasibility Study for the Wilseyville Product Yard 34 TSS Consultants
Figure 10. Product Yard Draft Site Plan20
20Basic site template was provided courtesy of Kevin Hansen and KRH Engineering. TSS updated this site plan to accommodate infrastructure necessary for value-added processes.
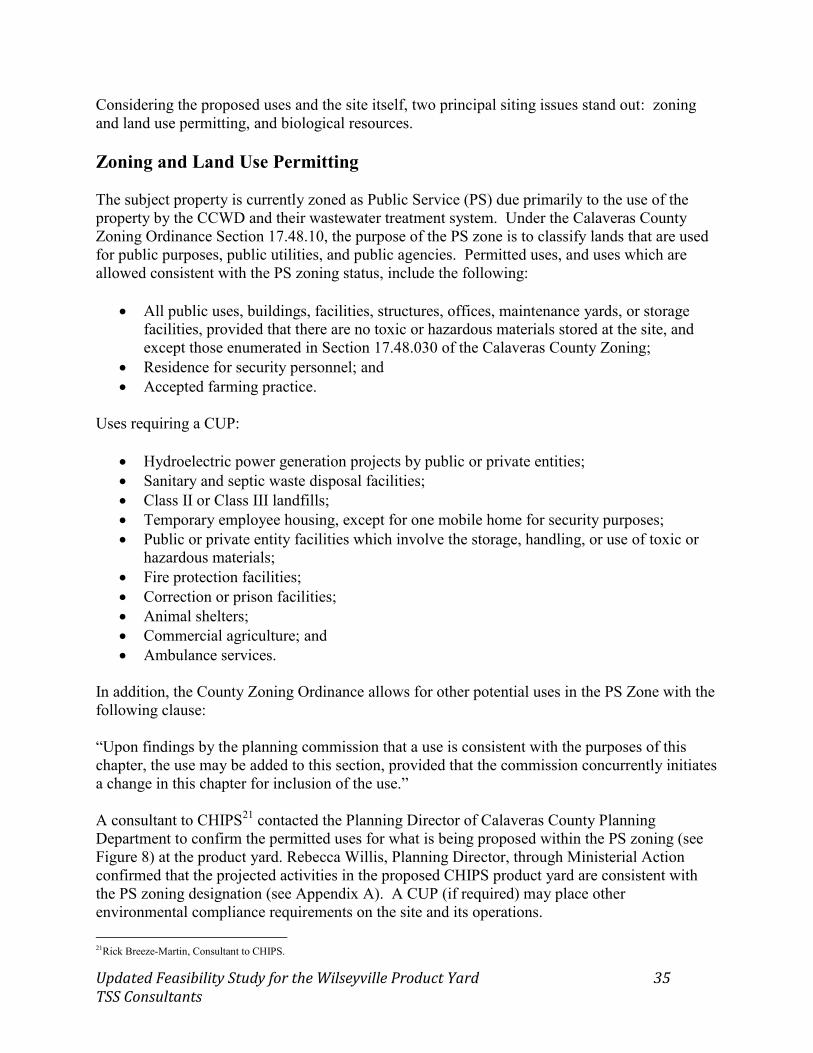
Updated Feasibility Study for the Wilseyville Product Yard 35 TSS Consultants
Considering the proposed uses and the site itself, two principal siting issues stand out: zoning and land use permitting, and biological resources. Zoning and Land Use Permitting The subject property is currently zoned as Public Service (PS) due primarily to the use of the property by the CCWD and their wastewater treatment system. Under the Calaveras County Zoning Ordinance Section 17.48.10, the purpose of the PS zone is to classify lands that are used for public purposes, public utilities, and public agencies. Permitted uses, and uses which are allowed consistent with the PS zoning status, include the following:
All public uses, buildings, facilities, structures, offices, maintenance yards, or storage facilities, provided that there are no toxic or hazardous materials stored at the site, and except those enumerated in Section 17.48.030 of the Calaveras County Zoning;
Residence for security personnel; and Accepted farming practice.
Uses requiring a CUP:
Hydroelectric power generation projects by public or private entities; Sanitary and septic waste disposal facilities; Class II or Class III landfills; Temporary employee housing, except for one mobile home for security purposes; Public or private entity facilities which involve the storage, handling, or use of toxic or
hazardous materials; Fire protection facilities; Correction or prison facilities; Animal shelters; Commercial agriculture; and Ambulance services.
In addition, the County Zoning Ordinance allows for other potential uses in the PS Zone with the following clause: “Upon findings by the planning commission that a use is consistent with the purposes of this chapter, the use may be added to this section, provided that the commission concurrently initiates a change in this chapter for inclusion of the use.” A consultant to CHIPS21 contacted the Planning Director of Calaveras County Planning Department to confirm the permitted uses for what is being proposed within the PS zoning (see Figure 8) at the product yard. Rebecca Willis, Planning Director, through Ministerial Action confirmed that the projected activities in the proposed CHIPS product yard are consistent with the PS zoning designation (see Appendix A). A CUP (if required) may place other environmental compliance requirements on the site and its operations. 21Rick Breeze-Martin, Consultant to CHIPS.

Feasibility Study for the Wilseyville Product Yard 36 TSS Consultants
Biological Resources During a site visit on June 7, 2011, it was observed that the areas where the proposed facilities have been preliminarily planned are reverting back to their natural state. This may require some biological resources study (to be determined during the initial phase of the CEQA process as led by the County Planning Department). Environmental Compliance Several of the proposed uses will require an air emissions permit from the Calaveras County Air Pollution Control District (CCAPCD). For example, a small sawmill might generate fugitive emissions (sawdust or dust from log truck traffic) that will require control and the accompanying need for a permit. A lumber dry kiln will require a combustion system (wood fired or liquid petroleum gas) to create the necessary heat for the system. A combustion system using biomass feedstock (lumber scraps or firewood) will require an air emissions permit from the CCAPCD. The air permit will likely have minimal compliance requirements, as a small lumber kiln does not fall under the Best Available Control Technology requirements due to its relatively small scale. If needed a small dry kiln (under 50 MMBtu/hour) fired on liquid petroleum gas (propane) is exempt from air permits per CCAPCD Rule 402. Job Creation Job creation from new enterprises conducting value-added processing of forest biomass material is a positive outcome of value-added processing. Estimating how many jobs might be generated is very dependent upon the enterprise considered. For example, firewood processing is quite labor intensive but composting operations are not. Additional information specific to value-added processing technologies is discussed in the value-added opportunities section of this report. (See Figure 11, Value-Added Utilization Matrix above for estimates of jobs needed for different value-added economic activities).

Feasibility Study for the Wilseyville Product Yard 37 TSS Consultants
VALUE-ADDED OPPORTUNITIES ANALYSIS A range of value-added utilization options were considered. Figure 11 is a value-added utilization matrix that was developed jointly by TSS and the University of California Cooperative Extension.22
22Gareth Mayhead, Academic Coordinator, Forest Products provided assistance in the development of the value-added matrix.
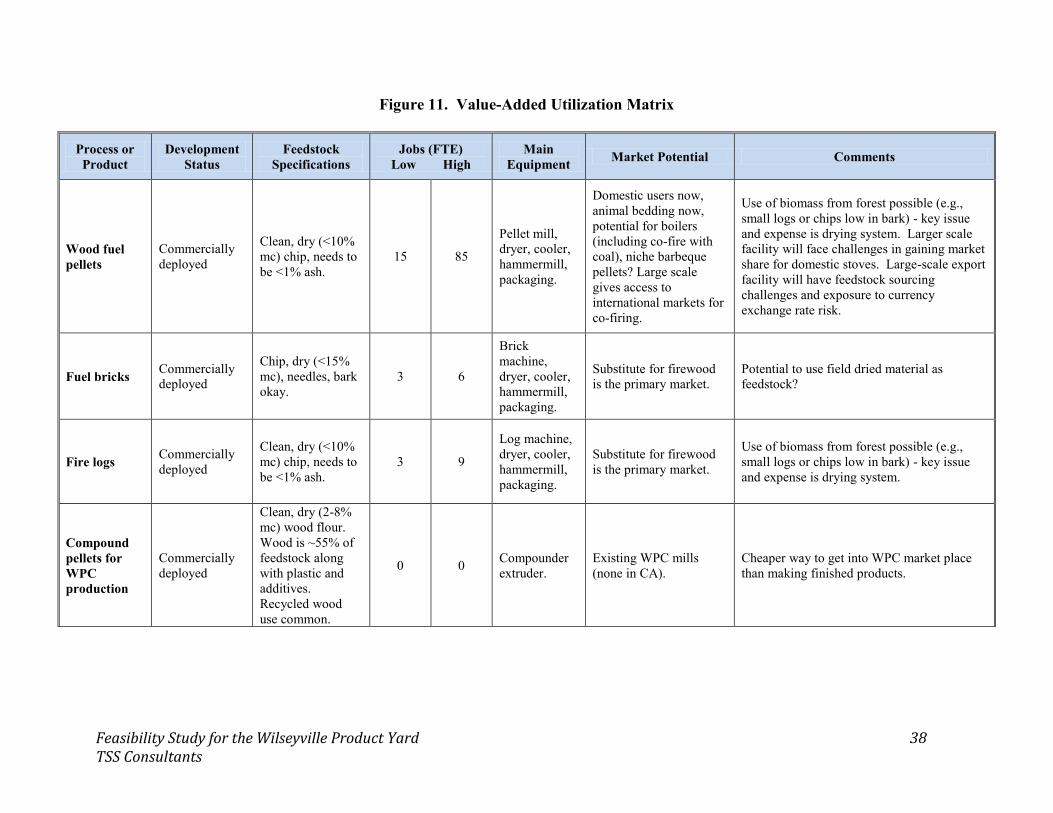
Feasibility Study for the Wilseyville Product Yard 38 TSS Consultants
Figure 11. Value-Added Utilization Matrix
Process or Product
Development Status
Feedstock Specifications
Jobs (FTE) Low High
Main Equipment Market Potential Comments
Wood fuel pellets
Commercially deployed
Clean, dry (<10% mc) chip, needs to be <1% ash.
15 85
Pellet mill, dryer, cooler, hammermill, packaging.
Domestic users now, animal bedding now, potential for boilers (including co-fire with coal), niche barbeque pellets? Large scale gives access to international markets for co-firing.
Use of biomass from forest possible (e.g., small logs or chips low in bark) - key issue and expense is drying system. Larger scale facility will face challenges in gaining market share for domestic stoves. Large-scale export facility will have feedstock sourcing challenges and exposure to currency exchange rate risk.
Fuel bricks Commercially deployed
Chip, dry (<15% mc), needles, bark okay.
3 6
Brick machine, dryer, cooler, hammermill, packaging.
Substitute for firewood is the primary market.
Potential to use field dried material as feedstock?
Fire logs Commercially deployed
Clean, dry (<10% mc) chip, needs to be <1% ash.
3 9
Log machine, dryer, cooler, hammermill, packaging.
Substitute for firewood is the primary market.
Use of biomass from forest possible (e.g., small logs or chips low in bark) - key issue and expense is drying system.
Compound pellets for WPC production
Commercially deployed
Clean, dry (2-8% mc) wood flour. Wood is ~55% of feedstock along with plastic and additives. Recycled wood use common.
0 0 Compounder extruder.
Existing WPC mills (none in CA).
Cheaper way to get into WPC market place than making finished products.

Updated Feasibility Study for the Wilseyville Product Yard 39 TSS Consultants
Process or Product
Development Status
Feedstock Specifications
Jobs (FTE) Low High
Main Equipment Market Potential Comments
Wood plastic composites (WPC)
Commercially deployed
Clean, dry (2-12% mc) wood flour. Wood is ~55% of feedstock along with plastic and additives. Recycled wood use common.
0 0
Blender (compounder extruder), extrusion line, cooler, cut-off saw.
Landscape (bender board), decking, park furniture (picnic tables and seats).
Requires cost effective thermoplastic feedstock (HDPE, LDPE, PP, PVC). Utilize recycled plastics (milk jugs, plastic bags). Commercial facilities typically use pine, oak and maple. Blending (compounding) of wood and plastic may be two processes or single process depending upon equipment. Commercial molding processes typically continuous extrusion or batch injection molding. Other processes such as resin transfer molding (RTM) and others not commercially deployed. Could just make compounded wood-plastic pellets for WPC manufacturers.
Decorative bark
Commercially deployed
Small roundwood that is easily de-barked. Raw bark from sawmills is common feedstock source.
2 6
Debarker (flail, ring or rosser head), screen (trommel or flat).
High value up in urban areas (FOB $<100/ton).
As sawmill residuals become scarce, value of bark for landscape cover increases. Alternative use is hog fuel.
Firewood Commercially deployed
Roundwood (hardwood is preferred) logs that can be processed using automated firewood processor.
2 8 Log splitter or firewood processor.
Could be marketed to urban centers in boxes or bundles. Hardwood worth more. Higher prices for firewood near to affluent urban areas.
Numerous firewood contractors already in place. Some large contractors have significant market share.
Post and pole Commercially deployed
Straight, low taper softwood (lodgepole, ponderosa, white fir) is preferred.
5 15
Rosser head peeler and/or doweller. Sorting line. Bucking saw.
Sold to treating facilities.Market treated posts for landscape timbers, vineyards (used to suspend vine wires) fences, furniture.
Need to treat - nearest facility is in Riverbank, CA.

Updated Feasibility Study for the Wilseyville Product Yard 40 TSS Consultants
Process or Product
Development Status
Feedstock Specifications
Jobs (FTE) Low High
Main Equipment Market Potential Comments
Decorative chip
Commercially deployed
Bark free and sized (no fines) wood chip.
2 6
Debarker (flail, ring or rosser head), screen (trommel or flat).
Colorized landscape cover sold in bulk and/or bagged.
Colored landscape cover requires additional equipment (colorizer). Feedstock (bark free chip) has alternative markets such as pulp/paper and furnish for composite products (particleboard/hardboard/decking).
Heating (buildings)
Commercially deployed
Woody biomass chipped to 3"minus, 50% mc, 3% ash.
1 2
Boiler system and hot water or steam delivery system.
Especially cost effective if replacing existing heating oil or propane heat. Can use for cooling also (using absorption chillers).
Feedstock sizing has been an issue with recently installed thermal energy facilities. Typical installations include schools, hospitals, and community buildings.
Small-scale sawmill
Commercially deployed
Medium to large size roundwood. 2 10
Debarker, head rig, resaw, edger.
May need to target specialty markets to secure optimal value for products.
Tough to compete with large-scale sawmills for logs and lumber sales. Niche markets for lumber is important. Most lumber is low-value commodity product.
Lumber kiln Commercially deployed
Lumber products or firewood. 1 2 Kiln (steam or
dehumidifier).
Kiln dried lumber has added value in the market place. Transport of dried lumber products is more cost effective (due to lower weight).
Could also dry firewood or heat treat lumber and packaging to meet ISPM15. Could use waste wood as a feedstock source.
Gasification Demonstration projects
Woody biomass chipped to 3"minus, 30% mc, 3% ash. Drier feedstock preferred.
2 5
Gasifier, gas clean-up, IC engine or turbine-generator.
Technology is evolving quickly and is becoming more cost effective.
More appropriate where electrical and thermal energy wholesale rates are high or in remote installations where power is not currently available.
Slow pyrolysis
Commercially deployed
Wood pieces (flexible spec). 1 2 Charcoal kiln.
Charcoal for cooking, artist’s charcoal, filtration, soil amendment (biochar).
Very few slow pyrolysis units currently deployed.

Updated Feasibility Study for the Wilseyville Product Yard 41 TSS Consultants
Process or Product
Development Status
Feedstock Specifications
Jobs (FTE) Low High
Main Equipment Market Potential Comments
Mild pyrolysis (torrefaction)
Pilot projects/R&D
Wood pieces (spec is vendor specific). 0 0 Reaction unit.
Co-firing in coal power plants (no modifications required to coal handling systems) or as feedstock supplement for biomass power plants.
Torrefied feedstock could be highly marketable due to BTU/pound and impervious to water. Coal is a key solid fuel in the marketplace and tends to set the price point.
Fast pyrolysis Pilot projects/R&D
Small (1/4" minus), dry, clean wood particles.
0 0 Reaction unit.
Char for filtration, cooking, soil improvement. No ready market for bio oil, except at oil refineries (upgrader).
Some significant investments made in R&D, including demonstration facilities (portable and fixed). Promising technology that may be commercially viable soon.
Solid fuel steam cycle (biopower)
Commercially deployed
Woody biomass chipped to 3"minus, 50% mc, 3% ash. Drier feedstock preferred.
2 30
Feedstock handling, boiler, turbine-generator, emissions control, water cooling and recovery.
Technology is evolving quickly and is becoming more cost effective.
More appropriate where electrical and thermal energy wholesale rates are high. Typically found in states with attractive Renewable Portfolio Standards.
Air filtration media
Commercially deployed
Virgin material that will grind to large heterogeneous particles.
0 0 Grinder and screen.
Wastewater treatment facilities, etc.
Need other market for grinder material (e.g., hog fuel or landscaping) that does not meet specifications for filtration media.
Compost Commercially deployed
Greenwaste (tree trimmings/grass clippings) is optimal.
2 6
Grinder, screen and windrow turner.
Soil amendment market is seasonal. Compost and mulch operations work best on same site. Typically sold in bulk or bagged.
There may be opportunities to install compost operation near existing landfills to divert greenwaste away from landfills.
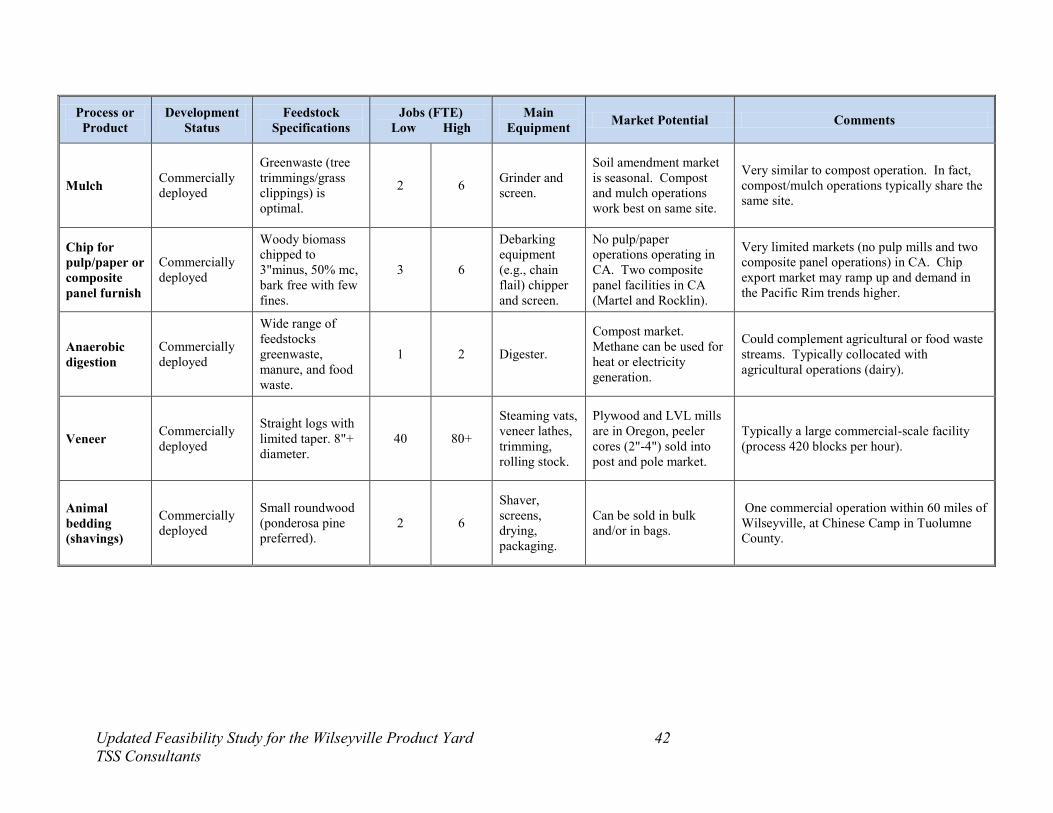
Updated Feasibility Study for the Wilseyville Product Yard 42 TSS Consultants
Process or Product
Development Status
Feedstock Specifications
Jobs (FTE) Low High
Main Equipment Market Potential Comments
Mulch Commercially deployed
Greenwaste (tree trimmings/grass clippings) is optimal.
2 6 Grinder and screen.
Soil amendment market is seasonal. Compost and mulch operations work best on same site.
Very similar to compost operation. In fact, compost/mulch operations typically share the same site.
Chip for pulp/paper or composite panel furnish
Commercially deployed
Woody biomass chipped to 3"minus, 50% mc, bark free with few fines.
3 6
Debarking equipment (e.g., chain flail) chipper and screen.
No pulp/paper operations operating in CA. Two composite panel facilities in CA (Martel and Rocklin).
Very limited markets (no pulp mills and two composite panel operations) in CA. Chip export market may ramp up and demand in the Pacific Rim trends higher.
Anaerobic digestion
Commercially deployed
Wide range of feedstocks greenwaste, manure, and food waste.
1 2 Digester.
Compost market. Methane can be used for heat or electricity generation.
Could complement agricultural or food waste streams. Typically collocated with agricultural operations (dairy).
Veneer Commercially deployed
Straight logs with limited taper. 8"+ diameter.
40 80+
Steaming vats, veneer lathes, trimming, rolling stock.
Plywood and LVL mills are in Oregon, peeler cores (2"-4") sold into post and pole market.
Typically a large commercial-scale facility (process 420 blocks per hour).
Animal bedding (shavings)
Commercially deployed
Small roundwood (ponderosa pine preferred).
2 6
Shaver, screens, drying, packaging.
Can be sold in bulk and/or in bags.
One commercial operation within 60 miles of Wilseyville, at Chinese Camp in Tuolumne County.

Feasibility Study for the Wilseyville Product Yard 43 TSS Consultants
Four value-added opportunities were selected by the Project Steering Committee23 (see Appendix B, Steering Committee meeting notes) for more detailed analysis. These included:
Small-scale combined heat and power; Firewood processing; Small-scale sawmill; and Biomass fiber to local markets.
Small-Scale Combined Heat and Power Technologies to convert woody biomass material to thermal and electrical energy have evolved significantly in recent years. Especially impressive has been the improved conversion efficiencies and cost effective operations associated with biomass gasification technologies. The primary obstacle to success is the current wholesale power market value for small-scale renewable power generation. The CPUC is currently in the feed-in tariff rulemaking process for small-scale (<3 MW) renewable power generation facilities. If the new feed-in tariff rate structure accounts for the avoided cost benefits to electric ratepayers associated with forest biomass power, a small-scale combined heat and power generation facility at Wilseyville will be economically viable. Firewood Processing There are well-developed local and regional firewood markets that a commercial-scale firewood processing facility at Wilseyville could cost effectively serve. The capital cost associated with a firewood processing operation is manageable and the internal rate of return (IRR) calculations are favorable. Key drivers for success include raw material expense (cost of firewood logs) and the market value for firewood sold into local and regional markets. There may be an opportunity to sell packaged firewood (bundled and palletized) into regional and external markets. This will require a well-defined and targeted marketing plan and additional packaging equipment. As the cost of fossil fuel energy (natural gas and liquid petroleum gas) used to heat homes has ramped up over time, homeowners have sought alternative energy sources such as firewood. Cost effective, renewable, easy to store and use, firewood use as a supplemental heating source has increased over the last few decades. The heat content of any fire depends on firewood density, resin, ash, and moisture. A rule of thumb often used for estimating heat value of firewood is one cord of well-seasoned hardwood (weighing approximately two tons) burned in an airtight, draft-controlled wood stove with an efficiency rating of 55-65% is equivalent to approximately 225 therms of natural gas consumed in normal furnaces having 65-75% efficiencies.24 Generally, hardwood firewood which provides long-burning fires contains the greatest total heating value per unit of volume (cubic foot). 23During the July 18, 2011 Steering Committee meeting and reviewed again during the October 5, 2011 Steering Committee meeting. 24Oregon Department of Agriculture (http://www.oregon.gov/ODA/MSD/fuel_facts.shtml).

Updated Feasibility Study for the Wilseyville Product Yard 44 TSS Consultants
Discussions with local foresters25 indicated that hardwood species logs including live oak, black oak, and madrone are removed on a regular basis during commercial harvest activities and during forest restoration/timber stand improvement activities. If a local market for hardwood logs (such as a firewood processing facility at Wilseyville) were available and priced competitively to address the costs of removal and transport and provide a reasonable return to the landowner, then a ready supply of hardwood logs could be available. Local foresters26 also confirmed the potential availability of softwood logs that could be available for firewood production. Diseased or insect impacted softwood species logs including ponderosa pine, white fir, red fir, Doug fir, and incense cedar that do not meet sawlog specifications (due to blue stain, rot) could be available for firewood. In addition, traditionally non-commercial softwood species such as foothill pine and lodgepole pine could also be available. Current commercial markets for firewood logs are located some distance from the Wilseyville area (El Dorado, Placerville, Oroville). Prices offered for firewood logs delivered to these locations range from $850 to $900 per truckload for hardwood logs and from $600 to $700 per truckload for softwood logs. Conversations with local foresters confirmed that due to the transportation advantage (less haul distance) of the Wilseyville yard, hardwood log prices of $800 per truckload and softwood log prices of $575 per truckload would be considered competitive. Discussions with Noble Milling and Firewood27 (Noble) suggest that a commercial firewood processor located at Wilseyville could be a financially viable enterprise. Noble has significant experience processing and marketing both firewood and lumber in the greater Wilseyville area. Bob Noble (principal) expressed an interest in pursuing a commercial-scale, integrated firewood and sawmill operation at the Wilseyville yard. TSS worked with Mr. Noble and Gareth Mayhead, University of California Forest Products Advisor, to conduct research regarding the optimized equipment configuration, production levels, and staffing for a small commercial firewood operation integrated with a small-scale sawmill operation. Mr. Noble, Mr. Mayhead, and TSS met on several occasions (in person and via conference call) to review the range of processing equipment, rolling stock, staffing requirements, target markets and challenges associated with such an operation. Results from these discussions are incorporated into the firewood and sawmill operations analysis that follows. Considering the range of hardwood and softwood logs available for firewood manufacturing, an equipment search was conducted and the Blockbuster Model 22 - 20 was found to be a good candidate technology. Figure 12 provides an image of this firewood processor. 25Steve Cannon, Foothill Resource Management and Tim Tate, Sierra Pacific Industries. 26John Sweetman, Amador RD, Jim Junette, Calaveras RD, Keith Johnson, Mother Lode Field Office BLM, Tim Tate, SPI, Steve Cannon, Foothill Resource Management. 27Bob Noble, principal, Noble Milling and Firewood.
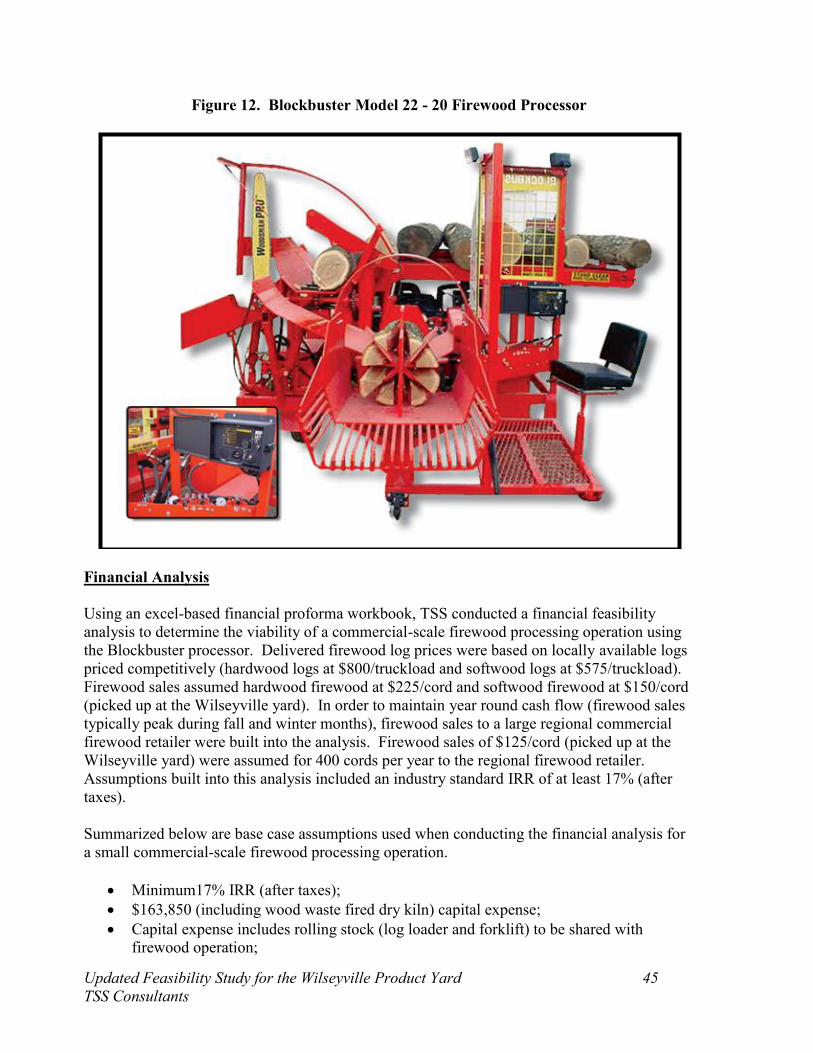
Updated Feasibility Study for the Wilseyville Product Yard 45 TSS Consultants
Figure 12. Blockbuster Model 22 - 20 Firewood Processor
Financial Analysis Using an excel-based financial proforma workbook, TSS conducted a financial feasibility analysis to determine the viability of a commercial-scale firewood processing operation using the Blockbuster processor. Delivered firewood log prices were based on locally available logs priced competitively (hardwood logs at $800/truckload and softwood logs at $575/truckload). Firewood sales assumed hardwood firewood at $225/cord and softwood firewood at $150/cord (picked up at the Wilseyville yard). In order to maintain year round cash flow (firewood sales typically peak during fall and winter months), firewood sales to a large regional commercial firewood retailer were built into the analysis. Firewood sales of $125/cord (picked up at the Wilseyville yard) were assumed for 400 cords per year to the regional firewood retailer. Assumptions built into this analysis included an industry standard IRR of at least 17% (after taxes). Summarized below are base case assumptions used when conducting the financial analysis for a small commercial-scale firewood processing operation.
Minimum17% IRR (after taxes); $163,850 (including wood waste fired dry kiln) capital expense; Capital expense includes rolling stock (log loader and forklift) to be shared with
firewood operation;
Updated Feasibility Study for the Wilseyville Product Yard 46 TSS Consultants
$88,500/year labor cost (approximately two full-time equivalent employees); $15,770/year maintenance cost; $2,400/year land lease cost; $26,000/year other operating costs (insurance, legal, utilities); 10-year accelerated tax depreciation schedule; 20-year debt service (amortization period); 5% interest rate on debt; 50% debt/50% equity in year one; 1%/year escalation for firewood logs, labor costs and firewood sales; $800/truckload for hardwood logs; 8 cord processed per truckload of hardwood logs ; $575/truckload for softwood logs; 8.6 cord processed per truckload of softwood logs; 16 cords processed per eight hour day; 3,200 cords processed annually (200 working days); 15% shrinkage of firewood (lost in the drying process); and 2,720 cords sold into local and regional markets (480 cords lost to shrinkage).
Using these assumptions results in a first year positive cash flow (after expenses) of $61,000. This scenario is entitled “Base Case.” Variables, such as the cost of firewood logs and the availability of grant funding (to underwrite capital expenses), were included and ramped both up and down to confirm the financial impacts and sensitivity. Table 17 and Table 18 summarize findings of the financial analysis comparing variables such as grant availability, firewood log pricing, and firewood sales pricing.
Table 17. Proforma Results – Firewood Log Pricing and Grant Funding Sensitivity
CASH GRANT FOR
CAPITAL EXPENSES
HARDWOOD LOG EXPENSE
($/LOAD)
SOFTWOOD LOG EXPENSE
($/LOAD)
YEAR ONE CASH FLOW
AFTER EXPENSES
INTERNAL RATE OF RETURN
(IRR) $0 (Base case) $800 $575 $61,000 78%
$0 $850 $600 $52,000 68% $0 $900 $650 $42,000 54%
$25,000 $800 $575 $61,000 93% $50,000 $800 $575 $62,000 115%

Updated Feasibility Study for the Wilseyville Product Yard 47 TSS Consultants
Table 18. Proforma Results - Firewood Sales Pricing and Grant Funding Sensitivity
CASH GRANT
FOR CAPITAL
EXPENSES
HARDWOOD FIREWOOD
SALES LOCAL
($/CORD)
SOFTWOOD FIREWOOD
SALES LOCAL
($/CORD)
SOFTWOOD FIREWOOD
SALES REGIONAL
($/CORD)
YEAR ONE CASH FLOW AFTER
EXPENSES
INTERNAL RATE OF RETURN
(IRR)
$0 (Base case) $225 $150 $125 $61,000 78% $0 $200 $125 $110 $24,000 31% $0 $250 $175 $150 $99,000 126%
$25,000 $225 $150 $125 $61,000 93% $50,000 $225 $150 $125 $62,000 115%
Unlike the small combined heat and power (CHP) business model, there are no federal tax credits available for firewood processing operations. Firewood Sales – Bulk Revenue generated from firewood sales fall into three categories:
Local hardwood sales; Local softwood sales; and Regional softwood sales.
The local sales of hardwood and softwood firewood are focused on sales to customers within a 60-mile radius of the product yard. These customers are typically rural homeowners who rely on firewood as a supplemental heating source. Demand from this customer base is very price sensitive, so it will be imperative that the market price is set at a competitive rate that will attract (and hopefully keep) customers long term. Demand from the rural homeowners is also dependent upon weather conditions. The colder the winter, the more demand there will be for home heating and for firewood. Regional firewood sales are targeting commercial firewood customers (typically large retailers) located 61 to 150 miles from the product yard. These retail customers are made up predominantly of large-scale firewood retailers (such as California Hot Wood, Inc., Duraflame, Inc.) that have packaging facilities which accept processed and cured firewood for packaging and distribution to large retailers such as Home Depot, Walmart, and Orchard Supply Hardware. Figure 13 provides an example of packaged firewood.
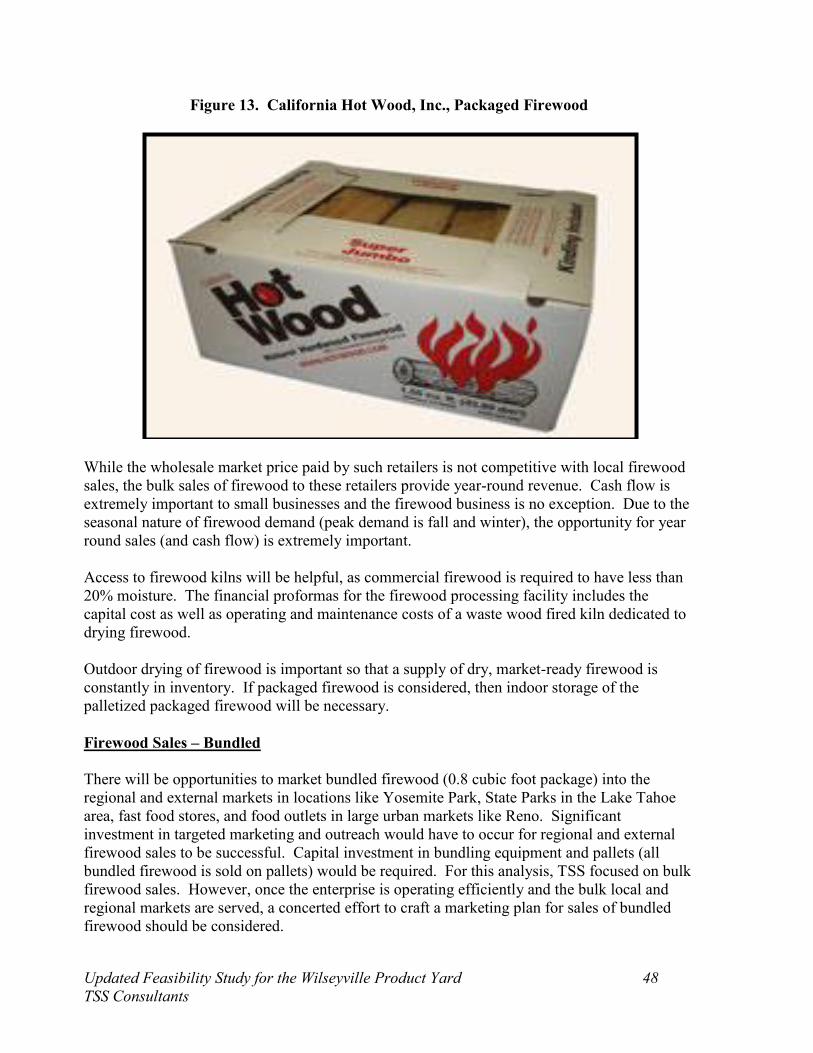
Updated Feasibility Study for the Wilseyville Product Yard 48 TSS Consultants
Figure 13. California Hot Wood, Inc., Packaged Firewood
While the wholesale market price paid by such retailers is not competitive with local firewood sales, the bulk sales of firewood to these retailers provide year-round revenue. Cash flow is extremely important to small businesses and the firewood business is no exception. Due to the seasonal nature of firewood demand (peak demand is fall and winter), the opportunity for year round sales (and cash flow) is extremely important. Access to firewood kilns will be helpful, as commercial firewood is required to have less than 20% moisture. The financial proformas for the firewood processing facility includes the capital cost as well as operating and maintenance costs of a waste wood fired kiln dedicated to drying firewood. Outdoor drying of firewood is important so that a supply of dry, market-ready firewood is constantly in inventory. If packaged firewood is considered, then indoor storage of the palletized packaged firewood will be necessary. Firewood Sales – Bundled There will be opportunities to market bundled firewood (0.8 cubic foot package) into the regional and external markets in locations like Yosemite Park, State Parks in the Lake Tahoe area, fast food stores, and food outlets in large urban markets like Reno. Significant investment in targeted marketing and outreach would have to occur for regional and external firewood sales to be successful. Capital investment in bundling equipment and pallets (all bundled firewood is sold on pallets) would be required. For this analysis, TSS focused on bulk firewood sales. However, once the enterprise is operating efficiently and the bulk local and regional markets are served, a concerted effort to craft a marketing plan for sales of bundled firewood should be considered.

Updated Feasibility Study for the Wilseyville Product Yard 49 TSS Consultants
Figure 14 is an example of a firewood bundle.
Figure 14. Bundled Firewood
Small-Scale Sawmill A small-scale sawmill located at Wilseyville will have ready access to sawlogs generated within the TSA. Strategically located between large-scale commercial sawmills, the Wilseyville yard has a transport cost advantage that will allow the facility to source sawlogs at cost effective prices. Wilseyville sawmill operations revenue is a function of local lumber sales. Lumber sales will depend on competitive pricing of finished product, both rough green lumber and dry finished lumber. There may be an opportunity to develop a secondary manufacturing product line focused on value-added production of wood boxes and display cases for end markets such as local and regional wineries. Secondary manufacturing will require additional processing equipment. A marketing plan should be considered to address lumber sales and secondary manufacturing sales opportunities. Due to the highly competitive regional lumber markets, the sawmill product marketing plan should target local sales. As noted earlier in this report, the Wilseyville site supported a commercial-scale sawmill from 1942 until 1968. The region has a long history of forest management and utilization, including the use of small-scale, portable sawmills. There is an opportunity to site and operate a small mobile sawmill at the product yard, using locally available small logs (under 24” diameter on the small end). Figure 15 is an image of a small-scale mobile dimension portable mill. A small sawmill collocated at the product yard would be a strategic addition to the firewood operation, as some of the firewood logs will no doubt meet sawlog specifications. The sawmill and firewood operation will be able to share rolling stock, such as a log loader and forklift. A log loader will be needed to off-load logs delivered to the yard, store the logs and remove the logs from storage for processing into firewood or lumber. The forklift will facilitate movement of firewood baskets (metal boxes capable of holding 1/2 cord firewood), firewood pallets (if producing firewood bundles), and units of lumber. Personnel can also be cross-trained and shared in the production of firewood or lumber, thus assisting with increased production should either operation require additional hours of production or if employees are sick.

Figure 15. Mobile Dimension Sawmill
As noted earlier in this report, the TSA is a region with an active forest management sector,
one that has produced almost 140,000 MBF of sawlogs annually for the last five years (see
Table 8). Discussions with a local sawmill operator28
confirmed that about 4 MBF per day of
sawlogs are required to sustain a small-scale mill. This equates to about one truckload of
sawlogs per day. Forecast over one year operation (assuming 160 days operating per year), the
sawmill would require about 640 MBF.
With the Wilseyville site located strategically between the commercial-scale forest products
sawmills located in Lincoln (to the north) and Standard (to the south), the product yard should
be able to cost effectively source sawlogs to support a small sawmill. Distance from
Wilseyville to Sierra Pacific Industries Lincoln sawmill is 81 miles and to Sierra Pacific
Industries Standard sawmill is 58 miles.
Lumber Dry Kiln
The sale of dry lumber allows sawmill operators to provide a blend of finished lumber products
to their customers. Some sawmills are strategically located in relatively dry, windy climates
that facilitate air drying of lumber. Air drying also requires large expanses of flat land to store
the finished lumber as it dries. The Wilseyville site climate will accommodate the air drying of
lumber, as was the business model with the Associated Lumber operation. Unfortunately, the
product yard has very little flat landscape that will be available for air drying.
A lumber kiln will be needed to produce dry lumber. Once dried, the lumber can be sold dry
rough or planed and sold as dry finished. In addition, there may be an opportunity to use the
28Bob Noble, Noble Milling and Firewood.
Updated Feasibility Study for the Wilseyville Product Yard 50
TSS Consultants
dry finished lumber in the manufacture of value-added products such as wood boxes for local
wineries or for packaged firewood.
For the purposes of this analysis, a propane fired lumber kiln capable of drying up to 8 MBF
per charge was assumed to be installed at the project yard. Propane (liquid petroleum gas) is a
preferred fuel due to its predictable and easily managed heating properties. In addition, a
lumber planer was included in the capital cost assumptions. The planer will facilitate surfacing
of dried lumber for value-added products such as interior paneling, exterior siding or for use in
manufacturing wood boxes.
Financial Analysis
Using an excel-based financial proforma workbook, TSS conducted a financial feasibility
analysis to determine the viability of a small-scale sawmill operation using a model 128
Mobile Dimension sawmill.29
Delivered sawlog prices were based on locally available logs
priced competitively (softwood sawlogs at $350 to $500/MBF) delivered to the Wilseyville
site. Lumber sales assumed rough green boards at $375 to $800/MBF and dry finished lumber
at $650/MBF for ponderosa pine lumber picked up at the yard. In order to maintain year round
cash flow, it will be important to maintain lumber inventory and operate the sawmill 160 days
per year (about eight months/year). The dry kiln will also need to operate at least on an eight
month/year basis in coordination with the sawmill. About half of the lumber produced and
sold will be dried and planed. Assumptions built into this analysis included an industry
standard IRR of at least 17%.
Summarized below are base case assumptions used when conducting the financial analysis for
a small commercial scale sawmill operation:
Minimum 17% IRR (after taxes);
$114,062 (including propane fired lumber kiln) capital expense;
Capital expense includes rolling stock (log loader and forklift) to be shared with
firewood operation;
$107,335/year labor cost (approximately four full-time equivalent employees)
$8,110/year maintenance cost;
$4,500 every 10 years maintenance cost for sawmill engine overhaul;
$2,400/year land lease cost;
$40,000/year other operating costs (e.g., propane, gasoline, diesel);
10-year accelerated tax depreciation schedule;
20-year debt service (amortization period);
5% interest rate on debt;
50% debt/50% equity in year one;
1%/year escalation for sawlogs, labor costs and lumber sales;
$375/MBF for ponderosa pine, white fir and Doug fir sawlogs;
$450/MBF for incense cedar sawlogs;
1.25:1 lumber over-run factor;
29As suggested by Bob Noble, Noble Milling and Firewood.
Updated Feasibility Study for the Wilseyville Product Yard 51
TSS Consultants
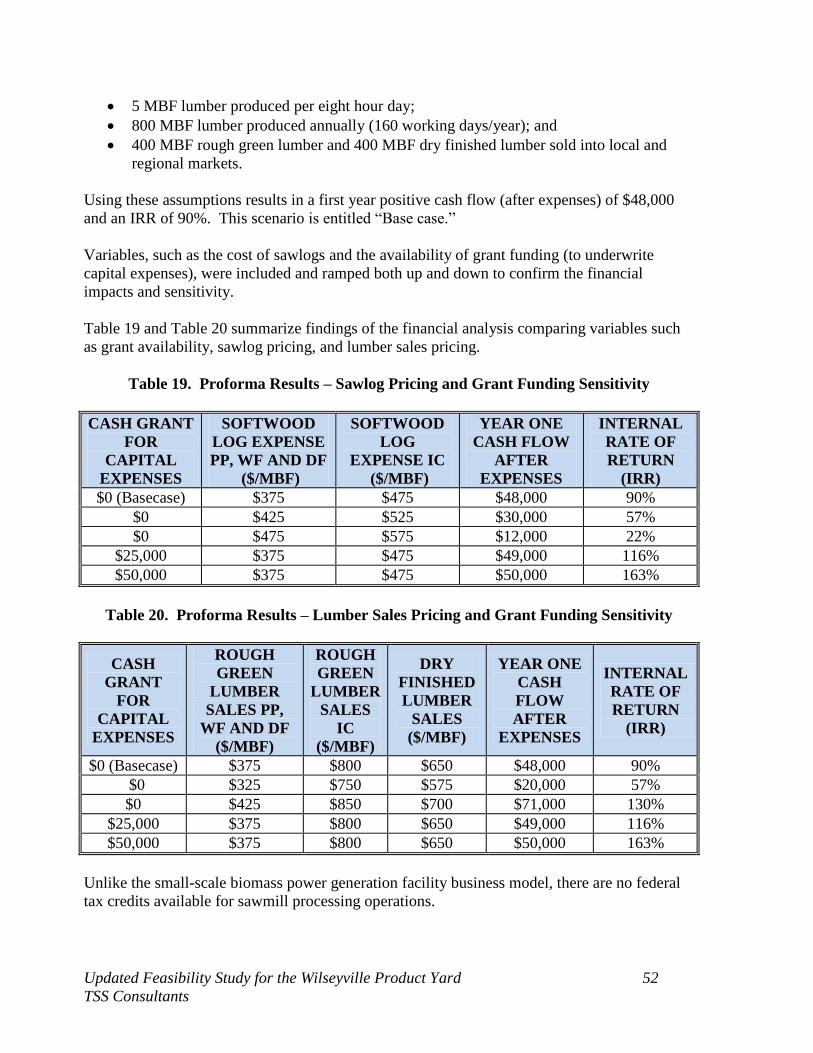
5 MBF lumber produced per eight hour day;
800 MBF lumber produced annually (160 working days/year); and
400 MBF rough green lumber and 400 MBF dry finished lumber sold into local and
regional markets.
Using these assumptions results in a first year positive cash flow (after expenses) of $48,000
and an IRR of 90%. This scenario is entitled “Base case.”
Variables, such as the cost of sawlogs and the availability of grant funding (to underwrite
capital expenses), were included and ramped both up and down to confirm the financial
impacts and sensitivity.
Table 19 and Table 20 summarize findings of the financial analysis comparing variables such
as grant availability, sawlog pricing, and lumber sales pricing.
Table 19. Proforma Results – Sawlog Pricing and Grant Funding Sensitivity
CASH GRANT
FOR
CAPITAL
EXPENSES
SOFTWOOD
LOG EXPENSE
PP, WF AND DF
($/MBF)
SOFTWOOD
LOG
EXPENSE IC
($/MBF)
YEAR ONE
CASH FLOW
AFTER
EXPENSES
INTERNAL
RATE OF
RETURN
(IRR)
$0 (Basecase) $375 $475 $48,000 90%
$0 $425 $525 $30,000 57%
$0 $475 $575 $12,000 22%
$25,000 $375 $475 $49,000 116%
$50,000 $375 $475 $50,000 163%
Table 20. Proforma Results – Lumber Sales Pricing and Grant Funding Sensitivity
CASH
GRANT
FOR
CAPITAL
EXPENSES
ROUGH
GREEN
LUMBER
SALES PP,
WF AND DF
($/MBF)
ROUGH
GREEN
LUMBER
SALES
IC
($/MBF)
DRY
FINISHED
LUMBER
SALES
($/MBF)
YEAR ONE
CASH
FLOW
AFTER
EXPENSES
INTERNAL
RATE OF
RETURN
(IRR)
$0 (Basecase) $375 $800 $650 $48,000 90%
$0 $325 $750 $575 $20,000 57%
$0 $425 $850 $700 $71,000 130%
$25,000 $375 $800 $650 $49,000 116%
$50,000 $375 $800 $650 $50,000 163%
Unlike the small-scale biomass power generation facility business model, there are no federal
tax credits available for sawmill processing operations.
Updated Feasibility Study for the Wilseyville Product Yard 52
TSS Consultants

Lumber Sales
Lumber sales opportunities are based on production of three primary product lines:
Rough green lumber: ponderosa pine, white fir and Doug fir;
Rough green lumber: incense cedar; and
Dry finished lumber: ponderosa pine.
Rough green lumber is product that is available for sale with no secondary processing (e.g.,
surfacing or drying). Examples of end uses for rough green lumber include corral boards and
outdoor structures (e.g., storage sheds). Rough green incense cedar lumber has additional
value due to the insect and decay resistant qualities of incense cedar that facilitate use in
outdoor siding, decking, and raised planting beds. Discussions with local sawmill operators30
indicate that there is significant demand for incense cedar lumber.
Dry finished ponderosa pine lumber is product that has been air dried or kiln dried and then
surfaced using a planer. Typically sold as one-inch thick boards, this lumber has a variety of
uses, including indoor paneling, shelving, or for value-added utilization secondary
manufacturing such as wood boxes. Ponderosa pine lumber is the preferred species for these
end uses due to ease of manufacturing and visual appearance.
Due to regional competition for lumber products, both rough green and dry finished lumber
will likely be sold locally (0 to 60 mile radius). Regional (61 to 150 mile radius) competition
is significant due to industrial-scale forest product producers and lumber retailers that have
economies of scale that allow them to be the low-cost producers. As the low-cost producers,
they are able to market lumber products at relatively low prices.
Secondary Manufacturing
Adding value to lumber products produced on site at the product yard is a significant
opportunity that could provide additional revenue and employment. Utilizing finished product
produced on site (e.g., dry surfaced ponderosa pine boards) in the manufacture of wood boxes
is an example of secondary manufacturing that should be considered. The key to success in
secondary manufacturing is production of a product line that targets local and regional
customers. Examples of potential local and regional customers that might be interested in a
wood box product line include wineries.
In the last several decades there has been a significant increase in the number of acres
dedicated to the cultivation of wine grapes in Amador and Calaveras counties. This has
resulted in the establishment of over 59 active wineries in these counties.31
Many of the
wineries are packaging varietal wines using wooden boxes as a value-added marketing tool.
Figure 18 provides an example of wood box packaging.
30Bob Noble, Noble Milling and Firewood. 31Winery list courtesy of Amador Vintners and Calaveras Winegrape Alliance.
Updated Feasibility Study for the Wilseyville Product Yard 53
TSS Consultants

Figure 16. Wood Box Packaging32
In addition to wood boxes, other secondary manufacturing opportunities include wine storage
racks, display cases, and shelving. All of these product lines will require additional
manufacturing equipment and skilled labor (not included in sawmill proforma calculations). In
addition, a product marketing plan, targeting local and regional customers, will be key to long-
term success for expansion into secondary manufacturing.
Biomass Fiber to Local Markets
Local commercial markets for biomass fiber are limited to existing and planned biomass power
generation facilities. The newly refurbished Buena Vista Biomass Power facility is located
closest to the Wilseyville product yard and should be considered as a potential long-term
customer.
While biomass power generation, lumber production and firewood processing represent the
clear opportunities for value-added utilization at the Wilseyville product yard of locally
produced logs and biomass, there are a number of alternative markets in the region to consider.
Table 21 provides a summary of current value-added markets for the utilization of woody
biomass material generated in the TSA. Note that these markets are listed in descending order
from higher value (landscape cover) to lower value (biomass feedstock).
32Image courtesy of askmetafilter.com.
Updated Feasibility Study for the Wilseyville Product Yard 54
TSS Consultants

Table 21. Alternative Local Markets for Biomass Fiber
MARKETS RAW MATERIAL COMMENTS
Landscape Cover Bark, chips Limited local markets.
Compost and Soil
Amendment
Tree trimmings, logyard
waste, sawdust Limited local markets.
Composite Panels Dry shavings, dry bark-free logs
Sierra Pine at Martel accepts dry
shavings. Also procuring dry, bark-free
softwood logs (no incense cedar).
Animal Bedding Softwood logs
American Wood Fibers at Jamestown is
procuring softwood logs (no incense
cedar) up to 42” diameter.
Firewood Softwood and hardwood logs
Taegers Firewood at El Dorado and
California Hot Wood at Oroville are
actively purchasing firewood logs.
Biomass
Feedstock
Forest-sourced biomass,
urban wood waste,
agricultural byproducts
Closest biomass plants include Buena
Vista Biomass Power near Ione, Covanta
Energy at Jamestown, Sierra Pacific
Industries at Standard.
At this time, local markets for biomass generated at the Wilseyville product yard are limited to
biomass feedstock for power generation. Typically higher-value markets such as landscape
cover and soil amendment are directly tied to housing and commercial construction markets,
both of which are currently depressed due to the general state of the economy. When the
economy does rebound, there may be opportunities to sell bark or sawdust into these markets.
Unlike landscape cover and soil amendment markets, the local biomass feedstock market is
currently expanding. Buena Vista Biomass Power is scheduled to begin commercial operations
during the first quarter of 2012. As noted earlier, Buena Vista will be accepting feedstock in
mid-January, 2012.33
Biomass feedstock haul costs are significant ($85/hour), so the most cost effective biomass
markets are those located close-in to Wilseyville. Buena Vista Biomass Power is the closest
(35 miles), followed by Covanta Energy at Jamestown (50 miles) and Sierra Pacific Industries
at Standard (57 miles). Current market pricing for biomass feedstock delivered to local power
plants ranges from $40 to $42/BDT.
33Per John Romena, Director of Fuel Procurement, Buena Vista Biomass Power.
Updated Feasibility Study for the Wilseyville Product Yard 55
TSS Consultants
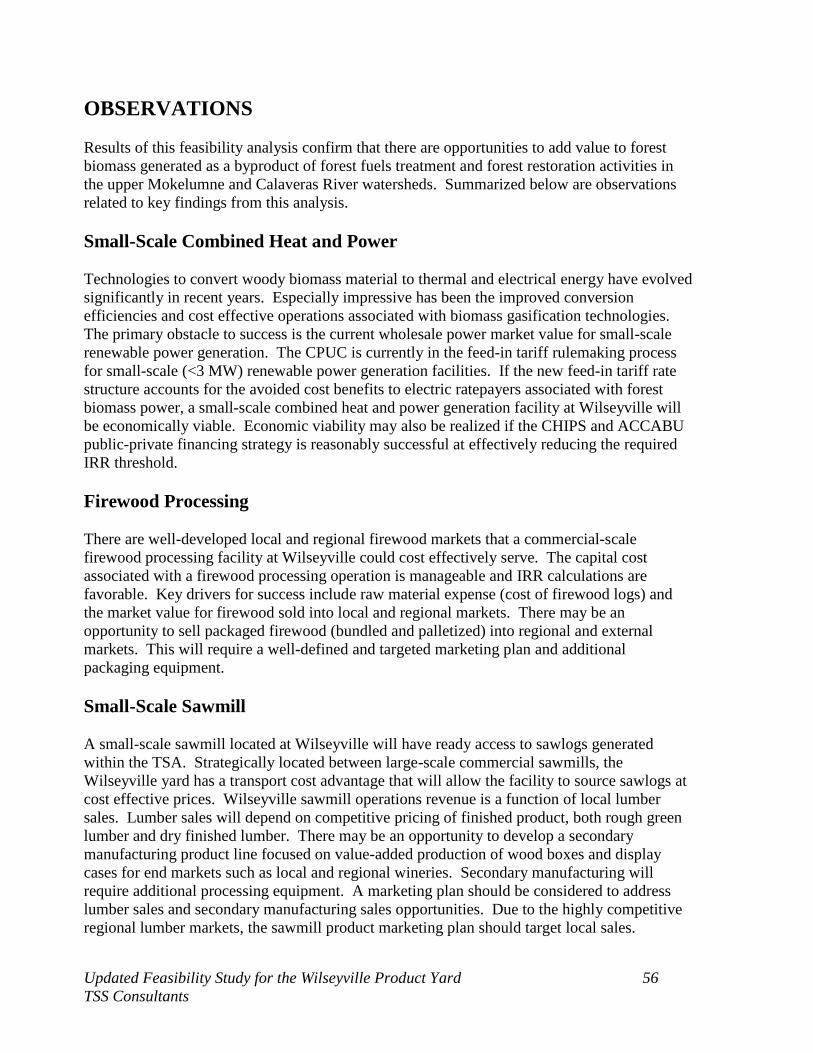
OBSERVATIONS
Results of this feasibility analysis confirm that there are opportunities to add value to forest
biomass generated as a byproduct of forest fuels treatment and forest restoration activities in
the upper Mokelumne and Calaveras River watersheds. Summarized below are observations
related to key findings from this analysis.
Small-Scale Combined Heat and Power
Technologies to convert woody biomass material to thermal and electrical energy have evolved
significantly in recent years. Especially impressive has been the improved conversion
efficiencies and cost effective operations associated with biomass gasification technologies.
The primary obstacle to success is the current wholesale power market value for small-scale
renewable power generation. The CPUC is currently in the feed-in tariff rulemaking process
for small-scale (<3 MW) renewable power generation facilities. If the new feed-in tariff rate
structure accounts for the avoided cost benefits to electric ratepayers associated with forest
biomass power, a small-scale combined heat and power generation facility at Wilseyville will
be economically viable. Economic viability may also be realized if the CHIPS and ACCABU
public-private financing strategy is reasonably successful at effectively reducing the required
IRR threshold.
Firewood Processing
There are well-developed local and regional firewood markets that a commercial-scale
firewood processing facility at Wilseyville could cost effectively serve. The capital cost
associated with a firewood processing operation is manageable and IRR calculations are
favorable. Key drivers for success include raw material expense (cost of firewood logs) and
the market value for firewood sold into local and regional markets. There may be an
opportunity to sell packaged firewood (bundled and palletized) into regional and external
markets. This will require a well-defined and targeted marketing plan and additional
packaging equipment.
Small-Scale Sawmill
A small-scale sawmill located at Wilseyville will have ready access to sawlogs generated
within the TSA. Strategically located between large-scale commercial sawmills, the
Wilseyville yard has a transport cost advantage that will allow the facility to source sawlogs at
cost effective prices. Wilseyville sawmill operations revenue is a function of local lumber
sales. Lumber sales will depend on competitive pricing of finished product, both rough green
lumber and dry finished lumber. There may be an opportunity to develop a secondary
manufacturing product line focused on value-added production of wood boxes and display
cases for end markets such as local and regional wineries. Secondary manufacturing will
require additional processing equipment. A marketing plan should be considered to address
lumber sales and secondary manufacturing sales opportunities. Due to the highly competitive
regional lumber markets, the sawmill product marketing plan should target local sales.
Updated Feasibility Study for the Wilseyville Product Yard 56
TSS Consultants

Biomass Fiber to Local Markets
Local commercial markets for biomass fiber are limited to existing and planned biomass power
generation facilities. The newly refurbished Buena Vista Biomass Power facility is located
closest to the Wilseyville product yard and should be considered as a potential long-term
customer.
Product Yard Infrastructure Improvement
In order for the product yard to serve value-added enterprises, there will be a need to improve
existing infrastructure. Table 22 provides a list of infrastructure improvements required to
facilitate operation of a small-scale biomass power facility, firewood processing operation,
sawmill operation and urban wood waste receiving yard.
Table 22. Product Yard Infrastructure Improvement Recommendations
IMPROVEMENT RANGE OF COSTS COMMENTS
Electrical Service $40,000 to $60,000
Quote from PG&E to extend
commercial service from CCWD pump
house 1,500’ to the product yard.
Infrastructure Engineering
(w/out Heat & Power co-gen)
$85,000 to $100,000 Quote from Weatherby, Reynolds and
Fritson Engineering and Design.34
Infrastructure Engineering
(for Heat & Power co-gen)
$220,000 to $250,000
Paved Road $275,000 to $325,000
2,500’ of two lane paved road from
Blizzard Mine Road into product yard.
Commercial Building $100,000 to $125,000
40’x60’ cement pad and commercial
grade building for lumber processing,
secondary manufacturing and finished
product storage.
Water Supply and Storage $100,000 to $150,000 Fire safety and dust abatement.
Total $820,000 to $1,010,000
34Provided by Rick Breeze-Martin, Consultant to CHIPS.
Updated Feasibility Study for the Wilseyville Product Yard 57
TSS Consultants
SMALL-SCALE COMBINED HEAT AND POWER
TECHNICAL FEASIBILITY ANALYSIS
The project Steering Committee, with technical assistance from TSS and UC Cooperative
Extension staff, conducted a value-added opportunity analysis to assess which of the value-
added options (as listed in Figure 11) would provide an optimized outcome when sited at
Wilseyville. The Committee settle on the small-scale combined heat and power facility as a
preferred option due to the potential forest biomass feedstock utilization afforded by this
technology, which would support forest fuels treatment and restoration. In addition, the
possibility of a long-term revenue source (10, 15 or 20 year power sales agreement) with a
financially viable entity (PG&E) to anchor the Wilseyville Product Yard was deemed
attractive.
Small-Scale Combined Heat and Power Facility
In recent years there have been significant improvements made to optimize the conversion of
woody biomass material into both thermal and electrical energy. As a direct result of these
improvements, biomass-to energy conversion technologies have improved both the operating
efficiencies and the economic performance of small-scale facilities. For this analysis, a 2.0
megawatt (MW)35
combined heat and power facility was selected for analysis. A facility
scaled at 2.0 MW (net power output) will require approximately 16,000 BDT per year of
biomass feedstock. The feedstock resource availability analysis confirmed over 33,500 BDT
per year is sustainably available at this time (see Table 12).
Technology Selection Process
The CHIPS Board of Directors developed and circulated a request for information (RFI) to
gain additional information about the development of a 2.0 to 3.0 MW CHP facility at the
Wilseyville product yard. The RFI was circulated to seven technology vendors and
developers:
Covanta Energy;
Energy Flex;
Enpower Corporation;
PHG Energy;
Phoenix Energy;
Radian Energy; and
Reliable Renewables.
The RFI (found in Appendix C) requested information about the developer’s experience with
system integration, technical specifics about their proposed equipment, potential environmental
impacts, and the ability to find and secure the required project funding.
35One megawatt is the equivalent of 1,000 kilowatts of electrical energy. One MW is enough electrical energy to power about 1,000 homes.
Updated Feasibility Study for the Wilseyville Product Yard 58
TSS Consultants
CHIPS received three proposals by the RFI submittal date. The proposals were reviewed by a
subcommittee of the CHIPS Board of Directors which included Steve Wilensky, Alan Leavitt,
and Rick Torgerson. Additionally, Rick Breeze-Martin, an adhoc member of the subcommittee
and a consultant to CHIPS (not a member of the Board of Directors) was involved in the
selection committee. The selection subcommittee was formed with the understanding that they
would be evaluating the proposed technologies, the project developer, and the ability to
achieve success with the proposed small business. The selection subcommittee members
possess a broad background with relevant experience in local government and planning,
financial management and business administration, forestry, environmental consulting, and
community development. The subcommittee team members’ biographical sketches can be
found in Appendix D.
To vet the technologies and the proposals, members of the subcommittee reached out to other
California community-based bioenergy projects including the projects in Truckee and North
Fork to discuss their experiences with project development. Through feedback from these
community organizations and internal discussion, the subcommittee developed the following
list of questions to be asked of representatives of the RFI respondents:
1) Briefly describe the technology and major components in your submittal to CHIPS and
why you have recommended them, emphasizing such factors as scalability of power-
generating capacity, O&M, and environmental controls (e.g., air emissions and
wastewater discharges).
2) Discuss your firm’s ownership, structure, and financial stability. Please provide copies
of the last 3 years’ financial statements. 3) CHIPS is currently preparing an application to the U.S. Forest Service for a woody
biomass utilization grant. The deadline for this application is April 8, 2013. In support
of this application, please describe:
a) How, as a system integrator, your firm could contribute to our project.
b) Your capability to assist CHIPS with economic analyses for the CHP facility, and
c) Your capability to assist CHIPS with estimating the amount and type of fossil fuel
offset (therms/yr) and increased fuel use efficiency.
As demonstrated by the interview questions, developer experience, technology components,
ability to commit to upfront investment, and scalability were key considerations for the project.
While TSS has not reviewed any of the RFI responses, TSS has verified that a competitive
process was used to select the preferred technology vendor by qualified personnel.
The Phoenix Energy gasification system was selected as the preferred technology developer for
this analysis.
Phoenix Energy Systems
Phoenix Energy is a California-based bioenergy systems integrator founded in 2007. Phoenix
Energy is the sister company of the European-based Energy Investors founded in 1999.
Phoenix Energy has been the developer for two bioenergy gasification projects in California, a
Updated Feasibility Study for the Wilseyville Product Yard 59
TSS Consultants
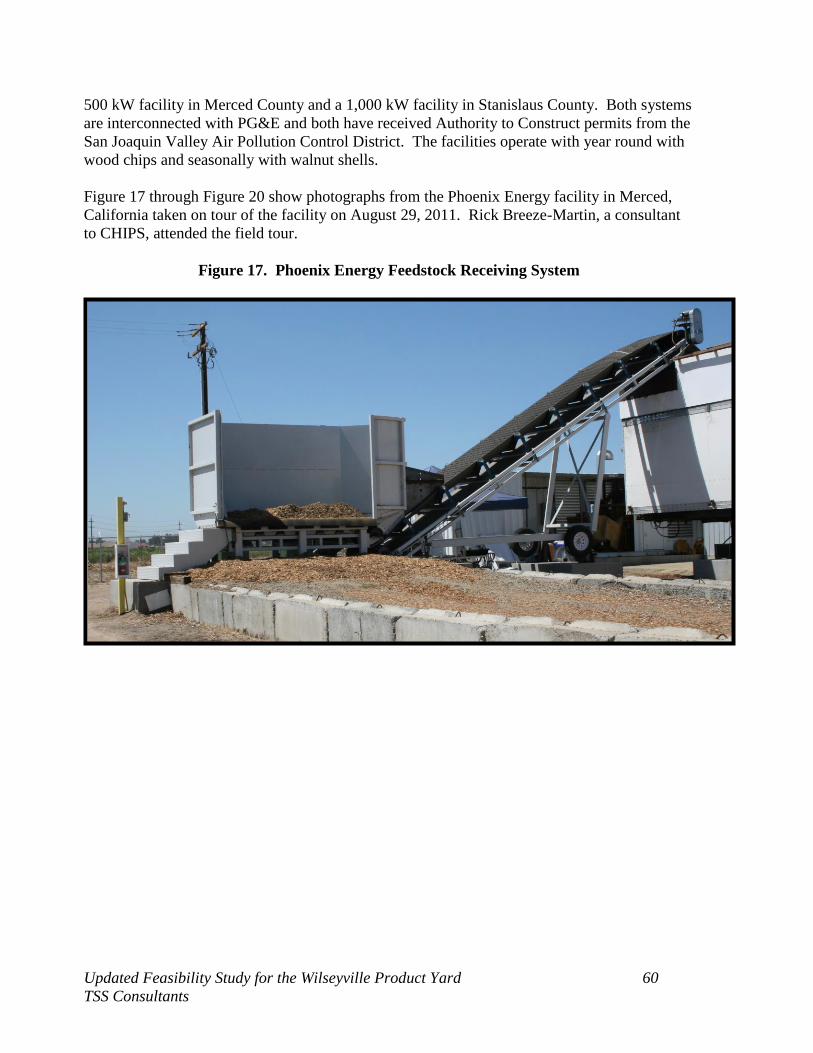
500 kW facility in Merced County and a 1,000 kW facility in Stanislaus County. Both systems
are interconnected with PG&E and both have received Authority to Construct permits from the
San Joaquin Valley Air Pollution Control District. The facilities operate with year round with
wood chips and seasonally with walnut shells.
Figure 17 through Figure 20 show photographs from the Phoenix Energy facility in Merced,
California taken on tour of the facility on August 29, 2011. Rick Breeze-Martin, a consultant
to CHIPS, attended the field tour.
Figure 17. Phoenix Energy Feedstock Receiving System
Updated Feasibility Study for the Wilseyville Product Yard 60
TSS Consultants

Figure 18. Phoenix Energy Gasification Equipment
Updated Feasibility Study for the Wilseyville Product Yard
TSS Consultants
61
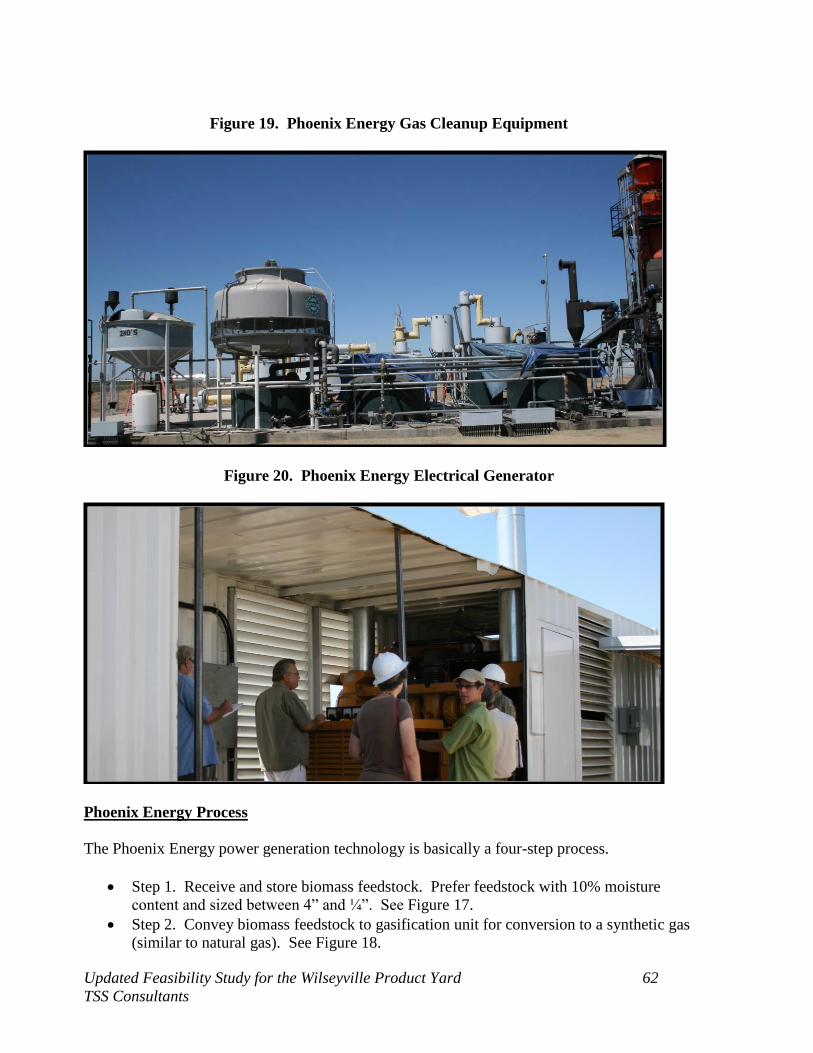
Figure 19. Phoenix Energy Gas Cleanup Equipment
Figure 20. Phoenix Energy Electrical Generator
Phoenix Energy Process
The Phoenix Energy power generation technology is basically a four-step process.
Step 1. Receive and store biomass feedstock. Prefer feedstock with 10% moisture
content and sized between 4” and ¼”. See Figure 17.
Step 2. Convey biomass feedstock to gasification unit for conversion to a synthetic gas
(similar to natural gas). See Figure 18.
Updated Feasibility Study for the Wilseyville Product Yard 62
TSS Consultants

Step 3. Cool and clean up the synthetic gas. Remove impurities such as tars and
particulates. See Figure 19.
Step 4. Deliver synthetic gas to caterpillar generator set (internal combustion engine
coupled to a generator. See Figure 20.
Other important data is outlined below.
Thermal energy can be recovered and utilized to dry biomass feedstock (forest biomass
can have up to 55% moisture content) or to possibly dry other products (e.g., lumber,
firewood). Waste heat can be extracted at three locations in the process:
Heat exchanger at the gas-cooling step;
Water jacket around the Caterpillar engine; and
Radiator at the Caterpillar engine.
Biomass feedstock usage is approximately 2 BDT per megawatt hour (MWh)36
or about
16,000 BDT per year for a 2.0 MW facility.
Footprint of the feedstock receiving and power generation equipment is less than one
acre. Feedstock storage for stockpiling feedstock through winter months (when forest
operations are not active due to wet soil conditions and inclement weather) may take up
an additional two acres.
Appendix E provides additional details on the Phoenix Energy technology.
Commercial Viability
Phoenix Energy has the proven track record, with two operational projects in California.
Phoenix Energy was the lead developer for both projects successfully completing
interconnection, the development of a power purchase agreement (PPA), CEQA, and air
permits. This experience will be critical for the success of a bioenergy facility in North Fork.
In addition to the experience of Phoenix Energy, the two projects that have been developed
utilize Ankur gasifier technology and Caterpillar engine-generators. Ankur Scientific Energy
has operated since 1986 producing gasifier technology for small-scale operations between 5
kW to 1,000 kW. The utilization of a proven technology will help to reduce start-up costs
which are critical when utilizing a forest-sourced biomass.
36MWh is 1,000 kW per hour of electrical generation.
Updated Feasibility Study for the Wilseyville Product Yard 63
TSS Consultants
SMALL-SCALE COMBINED HEAT AND POWER ECONOMIC
FEASIBILITY ANALYSIS
Power Sales
Recent California law, SB 32, requires that IOUs, such as PG&E, Southern California Edison
(SCE), and San Diego Gas & Electric (SDG&E) offer a standard feed-in tariff (FIT) rate for
renewable energy generation facilities with a capacity of 3 MW or less. The FIT program is
the Electric Renewable Market Adjusting Tariff (E-ReMAT) and is designed to promote a
competitive process in the distribution of FIT prices for small-scale renewable energy projects
in three distinct categories: baseload, peaking as-available, and non-peaking as-available. In
addition to the SB 32, SB 1122 calls for an additional carve-out in addition to the SB 32
program for bioenergy projects utilizing byproducts of sustainable forest management, biogas
from wastewater treatment, municipal organic waste diversion, food processing, and
codigestion, and dairy and other agricultural bioenergy.
A bioenergy project at Wilseyville should qualify for the SB 1122 carve-out for byproducts of
sustainable forest management programs. Wilseyville is in the service territory of PG&E. At
the time that this report was published, the CPUC is finalizing the details of the SB 32 and SB
1122 E-ReMAT program; however, TSS does not anticipate any changes that would negate the
eligibility of a small-scale bioenergy project in Wilseyville for the FIT.
Economic Analysis
The economic feasibility analysis focuses on a sensitivity analysis of economic and financial
variables critical to the project. Without a detailed analysis of the equipment list and the site-
specific construction attributes, line-by-line cost estimates cannot be made. In the economic
analysis, baseline assumptions were developed through coordination with representatives at
Phoenix Energy (selected technology developer) and sensitivity analyses were run to determine
how changes from these baseline assumptions impact the financial viability of the project. The
purpose of the sensitivity analysis is to detect potential fatal flaws and to identify critical
system variables.
Because California does not have a set-price feed-in-tariff, the sensitivity analysis output
variable will be the levelized price of electricity required to yield a 15% IRR.
Baseline Assumptions
The baseline assumptions for the proposed bioenergy project are shown in Table 23.
Additionally, Table 23 shows the key system variables that TSS has identified for sensitivity
modeling. The range of the sensitivities is listed and will be discussed subsequently.
Updated Feasibility Study for the Wilseyville Product Yard 64
TSS Consultants

Table 23. Baseline Assumption and Sensitivity Range
Project Components Baseline Assumptions Sensitivity
Capacity Factor 83% 70% to 90%
Economic Life 30 years None
Biochar Sales $.25/lb $0/lb to $0.50/lb
Nominal Electrical Capacity 2.0 MW 1.0 MW to 3.0 MW
Feedstock Consumption 2.2 lb/kWh 1.98 lb/kWh to 2.42 lb/kWh
Biochar Production 9% 7% to 11%
High Heating Value of Feedstock 8,000 Btu/dry lb None
Feedstock Costs $53.86/BDT $45/BDT to $70/BDT
Capital Investment $4.5/Watt $3.3/Watt to $5.7/Watt
Labor Cost $340,000/year $250,000/year to $450,000/year
Operations & Maintenance Cost 3.5% of Capital Investment 2% to 5% of Capital Investment
General Overhead 5% of Annual Costs 3% to 7% of Annual Costs
Interest on Debt 5% 3% to 8%
TSS performed this economic analysis with the assumption that the project developer is subject
to all applicable Federal and State taxes. Equipment capital costs are anticipated to be
depreciated using straight line depreciation37
and that the equipment capital costs represent
approximately 90% of the total capital investment. Equipment salvage value at the end of the
project’s life is assumed to be 10% and price escalation is assumed to be 2% for all expenses
unless otherwise addressed in this feasibility study (e.g. feedstock price escalation). The
project is expected to receive a 10% investment tax credit.
Capacity Factor
The capacity factor of a project represents the run-time as a function of the total number of
hours per year. A capacity factor of 83% means that within one year (8,760 hours), the facility
is expected to be online at full capacity for approximately 7,250 hours. Three major
components factor into capacity factor: planned maintenance outages, unplanned outages (e.g.,
feedstock jams), and operating under full capacity (less than 3 MW). Based on conversations
with Phoenix Energy and from TSS’s experience, a baseline estimate of 83% capacity factor is
appropriate for a baseload power generating facility as the unit is expected to operate between
7,000 and 7,50038
hours per year. The manufacture’s data for the gasifier suggests that a capacity factor of approximately 90% is achievable; however, Phoenix Energy has indicated
that they are cautious about this number as there are other factors outside of the gasifier itself
that cause system downtime. The low-range estimate of 70% for capacity factor accounts for
only 6,100 hours of operation annually.
37TSS recognizes that energy equipment may be depreciated under MACRS seven-year depreciation schedule; however, TSS finds that this
accelerated depreciation can greatly skew a net present value analysis to indicate a high IRR despite inadequate cash flows over the economic
life of the facility. 38Based on conversations with Phoenix Energy.
Updated Feasibility Study for the Wilseyville Product Yard 65
TSS Consultants

Biochar Sales
The biochar market is a growing, but young market. Biochar pricing has been highly volatile
over the last few years. Currently, some biochar retailers are receiving over $2 per pound for
retail sales and over $0.50 per pound for wholesale. Due to the scale and relatively short
timeframe of the current biochar market, TSS assumes only $500 per ton ($0.25 per pound) for
biochar sales. To buffer against the collapse of the market, the low-range estimate for biochar
sales assumes that there is no biochar market. The high-range estimate for biochar sales is
$0.50 per pound to reflect the current market demand. Additionally, biochar may be used as an
input product for activated charcoal, a higher-value product; however, at this time, TSS does
not know of any biochar that has been sold to activated charcoal manufacturers.
Feedstock Consumption
The feedstock consumption rate varies significantly depending on the feedstock quality and the
efficiency of the selected equipment. Phoenix Energy suggests a baseline estimate of 2.2
pounds per kilowatt-hour produced for feedstock at 8% moisture content (approximately 21%
total system efficiency). This overall system efficiency is consistent with the literature and
TSS experience. TSS recommends a 10% range for the high and low estimates (2.42 lb/kWh
and 1.98 lb/kWh respectively).
Biochar Production
Production of biochar can change dramatically depending on how the gasifier is tuned. A
gasifier can be tuned to maximize biochar production or syngas production. For this analysis,
TSS will focus on a gasifier that is tuned to maximize syngas production (and therefore
electricity). The decision for a project owner to reconfigure the gasifier to maximize biochar
production is a management tool for maximizing revenue by balancing biochar and electricity
production. Therefore, the baseline analysis will be for electricity which has a known and
established market.
Biochar production is anticipated to be approximately 9%39
but may vary between 7% and
11% based on the feedstock and the ambient conditions. These estimates are consistent with
the literature and in conversations with Phoenix Energy.
Feedstock Costs
Consistent with the findings in the Woody Biomass Feedstock Resource and Cost Analysis, the
baseline price is the weighted average of the biomass material availability (Table 12) and
collection, processing, and transport costs (Table 15).
Capital Investment
The capital investment for a project is largely based on the cost of the equipment and the cost
of installation. A large variable comes from the required cost for installation as determined by
39Based on conversations with Phoenix Energy
Updated Feasibility Study for the Wilseyville Product Yard 66
TSS Consultants
the outcome of PG&E’s System Impact Study. Site specific attributes such as soil conditions
may also affect the total capital investment required. Based on conversations with Phoenix
Energy and TSS experience, an estimated cost of $4.5 per watt will be used for a facility of this
scale. This estimate is consistent with Phoenix Energy’s past projects with a 10% assumption
for savings due to economies of scale (Phoenix Energy’s past projects are scaled at 0.5 MW
and 1.0 MW in California).
Labor Cost
Labor costs are based on the need for two people on-site at all times for a plant that operates
continuously.40
Based on the Phoenix Energy’s experience with their other California
installation and consistent with wages in Wilseyville, the personnel at the plant are expected to
receive $15 per hour with a burden rate (e.g., cost of health benefits, paid vacation) of
approximately 30%. The baseline estimate for labor costs is approximately $340,000 per year.
This does not include general administrative costs including insurance and administrative staff.
For the high-range labor cost estimate, TSS bases the $450,000 per year value on a wage rate
of $20 per hour. For the low-range estimate, TSS bases the $250,000 per year value on an
average of 1.5 employees on site at all times.
Maintenance Cost
Annual maintenance costs include a wide variety of items including replacement parts,
consumables (e.g., engine oil), and infrastructure upgrades. Annual maintenance costs may
change drastically; however TSS bases maintenance cost expectations on an average cost. TSS
estimates maintenance costs to range between 2% and 5% of the total equipment costs with a
baseline value of 3.5%. Based on the capital costs previously identified, the baseline
maintenance costs is approximately $425,000 per year ranging from $245,000 to $600,000 per
year.
General Overhead
General overhead includes items such as insurance, administrative staff, annual permit fees and
compliance monitoring, property tax or property lease, and a contingency budget. Based on
TSS experience, $95,000 per year is indicative of approximately 5% of the total annual
operating costs. This is consistent with Phoenix Energy’s experience with their past projects. A range of 3% to 7% will be reviewed for the purposes of this sensitivity analysis.
Interest on Debt
Interest on debt may vary widely depending on funding sources. Due to the risks associated
with the new small-scale bioenergy market and the uncertainty surrounding the new E-ReMAT
program, TSS suggests a baseline assumption of 5% interest on debt due to the availability of
low-interest loans for bioenergy development. Low-interest loans through governmental
agency development programs and non-profit organizations are potentially available with
interest rates of approximately 3%.
40Ibid.
Updated Feasibility Study for the Wilseyville Product Yard 67
TSS Consultants
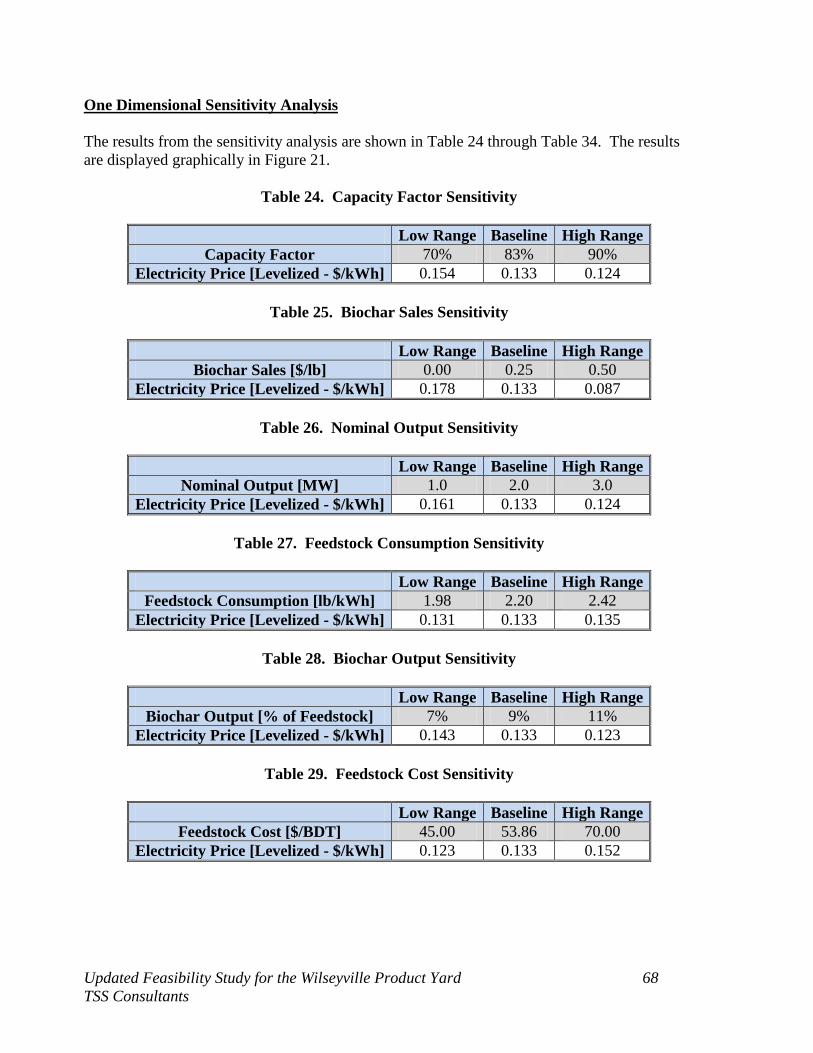
One Dimensional Sensitivity Analysis
The results from the sensitivity analysis are shown in Table 24 through Table 34. The results
are displayed graphically in Figure 21.
Table 24. Capacity Factor Sensitivity
Low Range Baseline High Range
Capacity Factor 70% 83% 90%
Electricity Price [Levelized - $/kWh] 0.154 0.133 0.124
Table 25. Biochar Sales Sensitivity
Low Range Baseline High Range
Biochar Sales [$/lb] 0.00 0.25 0.50
Electricity Price [Levelized - $/kWh] 0.178 0.133 0.087
Table 26. Nominal Output Sensitivity
Low Range Baseline High Range
Nominal Output [MW] 1.0 2.0 3.0
Electricity Price [Levelized - $/kWh] 0.161 0.133 0.124
Table 27. Feedstock Consumption Sensitivity
Low Range Baseline High Range
Feedstock Consumption [lb/kWh] 1.98 2.20 2.42
Electricity Price [Levelized - $/kWh] 0.131 0.133 0.135
Table 28. Biochar Output Sensitivity
Low Range Baseline High Range
Biochar Output [% of Feedstock] 7% 9% 11%
Electricity Price [Levelized - $/kWh] 0.143 0.133 0.123
Table 29. Feedstock Cost Sensitivity
Low Range Baseline High Range
Feedstock Cost [$/BDT] 45.00 53.86 70.00
Electricity Price [Levelized - $/kWh] 0.123 0.133 0.152
Updated Feasibility Study for the Wilseyville Product Yard
TSS Consultants
68
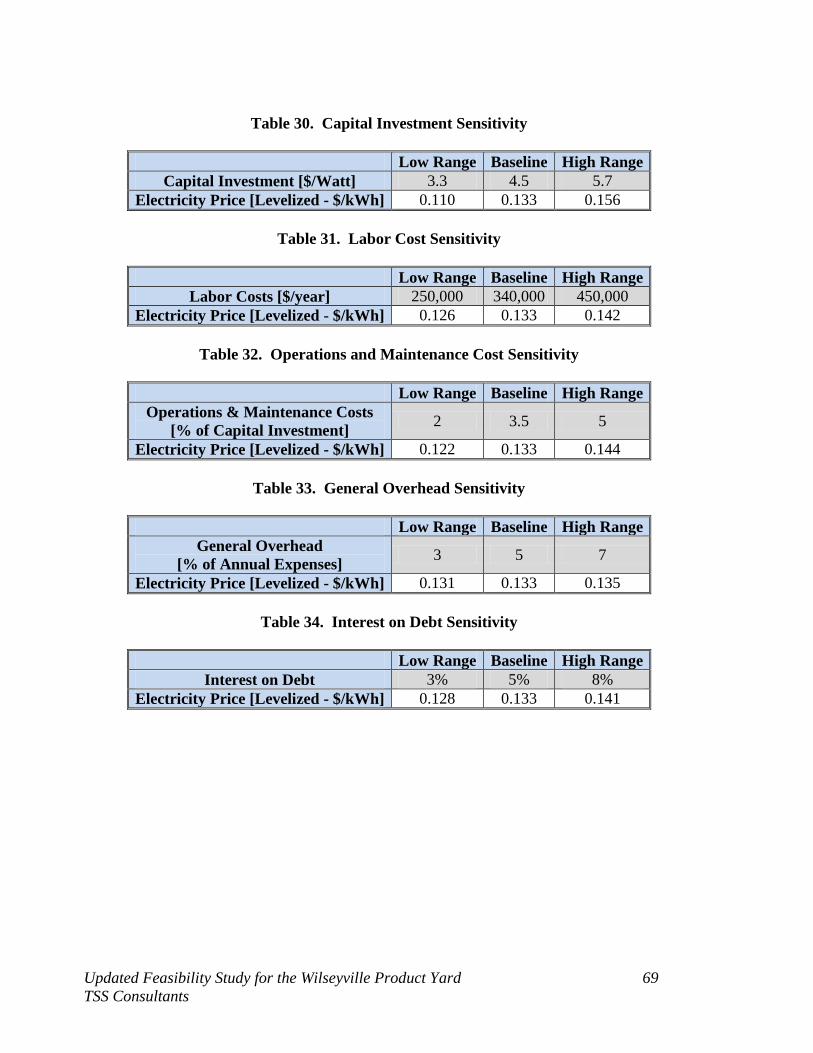
Table 30. Capital Investment Sensitivity
Low Range Baseline High Range
Capital Investment [$/Watt] 3.3 4.5 5.7
Electricity Price [Levelized - $/kWh] 0.110 0.133 0.156
Table 31. Labor Cost Sensitivity
Low Range Baseline High Range
Labor Costs [$/year] 250,000 340,000 450,000
Electricity Price [Levelized - $/kWh] 0.126 0.133 0.142
Table 32. Operations and Maintenance Cost Sensitivity
Low Range Baseline High Range
Operations & Maintenance Costs
[% of Capital Investment] 2 3.5 5
Electricity Price [Levelized - $/kWh] 0.122 0.133 0.144
Table 33. General Overhead Sensitivity
Low Range Baseline High Range
General Overhead
[% of Annual Expenses] 3 5 7
Electricity Price [Levelized - $/kWh] 0.131 0.133 0.135
Table 34. Interest on Debt Sensitivity
Low Range Baseline High Range
Interest on Debt 3% 5% 8%
Electricity Price [Levelized - $/kWh] 0.128 0.133 0.141
Updated Feasibility Study for the Wilseyville Product Yard
TSS Consultants
69

Figure 21. Sensitivity Analysis Results
0.08
0.09
0.1
0.11
0.12
0.13
0.14
0.15
0.16
0.17
0.18
Low Range
Baseline
High Range
The most significant metrics for the financial viability of the project are biochar sales followed
by nominal output, capital investment, capital costs, and feedstock costs. Note that financial
assistance through new market tax credits or grants is not factored into this analysis and if
obtained would improve the financial outlook illustrated in this section.
Recommendations
The baseline analysis is for a project primarily focused on the production and sales of
electricity. The baseline levelized price of electricity at $0.133 fits within the upper level
bounds of the E-ReMAT FIT program. It is important to recognize the importance of the
biochar sales for the financial viability of this project. TSS believes that the developer team,
Phoenix Energy, has the ability to utilize the biochar market as a secondary revenue stream.
Project Scale
As shown in Figure 21, there are economies of scale that come with a larger project. An
important example is that labor costs remain the same for a 2.0 MW project and a 3.0 MW
project. Labor is an important component of the average annual costs and in the baseline
analysis represents approximately one-third of the total annual expense. Additionally,
economies of scale are realized for site preparation and infrastructure as these costs do not rise
proportionally with the size of the facility. However, it is important to realize the
interconnection costs may vary greatly with economies of scale and PG&E should be consulted
to understand how a generating facility may impact the local distribution circuit.
Updated Feasibility Study for the Wilseyville Product Yard 70
TSS Consultants
Secondary Revenue Stream
While several potential heat loads have been discussed throughout the development of this
feasibility report, TSS has not been able to identify any probable near-term purchasers of
process heat from a bioenergy facility in Wilseyville. However, Phoenix Energy has a proven
track-record in the emerging market for biochar. Biochar is a high fixed-carbon byproduct of
the gasification process. Recent demand for biochar has been primarily from the agricultural
sector as a means of soil amendment as biochar has the potential to enhance soil nutrient levels
because of its resistance to decomposition and ability to store nutrients and water in the upper-
levels of soil. Phoenix Energy has demonstrated success with marketing and sales of biochar
from their other two California-based projects. This additional revenue stream will be critical
to the success of the bioenergy facility.
The cap and trade carbon sequestration could in the future provide an additional revenue
stream based on the high fixed carbon composition of biochar. At this time, TSS has not seen
a strong market for carbon in California although policy trends suggest that the carbon market
may grow in the future.
Feedstock Costs
Feedstock costs are the single most significant variable cost incurred in the operation of a CHP
facility. As noted in Table 16, the 2013 feedstock price forecast is $53.86/BDT. TSS
recommends that there are opportunities to reduce this expense including:
Improved operational efficiencies to reduce the cost of collection and processing of
forest biomass.
Seek out opportunity purchases of feedstocks that are less costly than forest biomass
feedstocks (e.g., urban wood waste, local tree trimmings, agricultural byproducts).
Secure service contracts from public land agencies in the form of stewardship contracts
that offset a portion of the cost to collect, process, and transport excess forest biomass
material. Typically this offset is in the form of $/acre payment for forest thinning and
fuels reduction services.
Debt Service
There are opportunities to secure low-interest loans to reduce the cost of debt service. Several
public programs provide low interest loans including:
USDA - Rural Energy for America Program (REAP)
USDA - Rural Economic Development Loan and Grants (REDLG)
California Economic Development Lending Institute (CEDLI)
See the Potential Grant Funding Resources section of this report for more detailed information
on these programs.
Updated Feasibility Study for the Wilseyville Product Yard 71
TSS Consultants
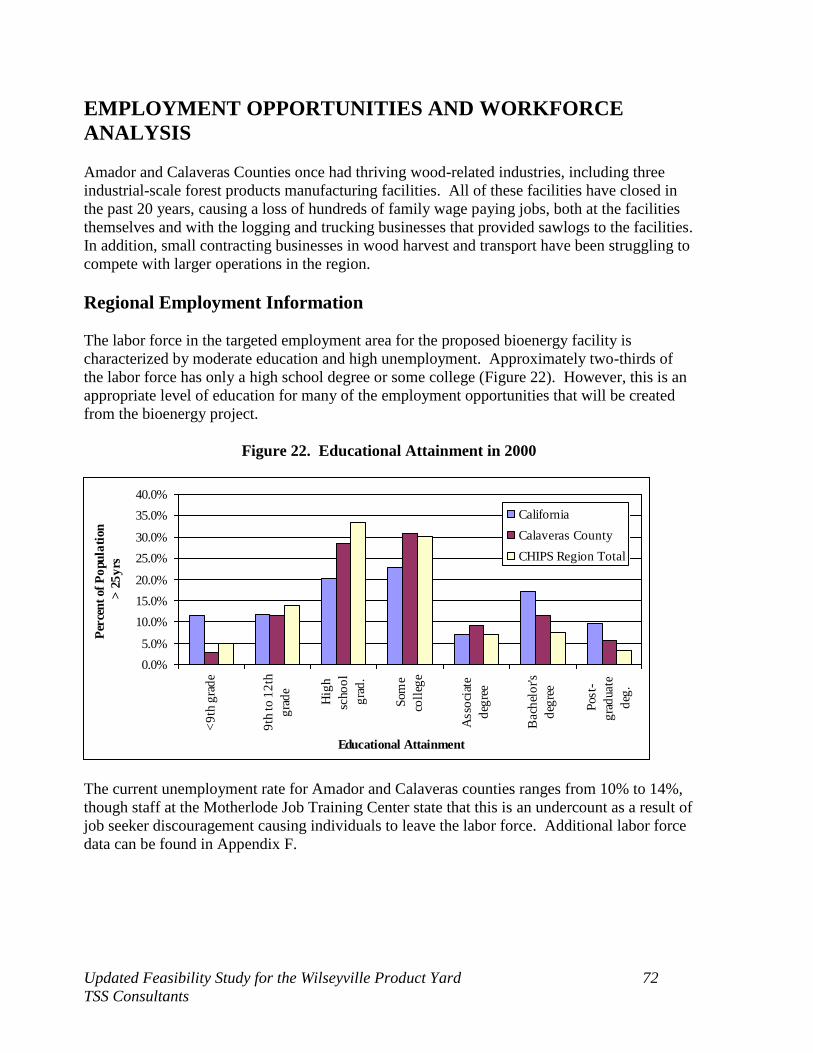
EMPLOYMENT OPPORTUNITIES AND WORKFORCE
ANALYSIS
Amador and Calaveras Counties once had thriving wood-related industries, including three
industrial-scale forest products manufacturing facilities. All of these facilities have closed in
the past 20 years, causing a loss of hundreds of family wage paying jobs, both at the facilities
themselves and with the logging and trucking businesses that provided sawlogs to the facilities.
In addition, small contracting businesses in wood harvest and transport have been struggling to
compete with larger operations in the region.
Regional Employment Information
The labor force in the targeted employment area for the proposed bioenergy facility is
characterized by moderate education and high unemployment. Approximately two-thirds of
the labor force has only a high school degree or some college (Figure 22). However, this is an
appropriate level of education for many of the employment opportunities that will be created
from the bioenergy project.
Figure 22. Educational Attainment in 2000
0.0%
5.0%
10.0%
15.0%
20.0%
25.0%
30.0%
35.0%
40.0%
<9
th g
rad
e
9th
to
12
th
gra
de
Hig
h
scho
ol
gra
d.
Som
e
coll
ege
Asso
ciat
e
deg
ree
Bach
elo
r's
deg
ree
Post-
gra
duate
deg
.
Educational Attainment
Per
cen
t of
Po
pu
lati
on
> 2
5y
rs
California
Calaveras County
CHIPS Region Total
The current unemployment rate for Amador and Calaveras counties ranges from 10% to 14%,
though staff at the Motherlode Job Training Center state that this is an undercount as a result of
job seeker discouragement causing individuals to leave the labor force. Additional labor force
data can be found in Appendix F.
Updated Feasibility Study for the Wilseyville Product Yard 72
TSS Consultants
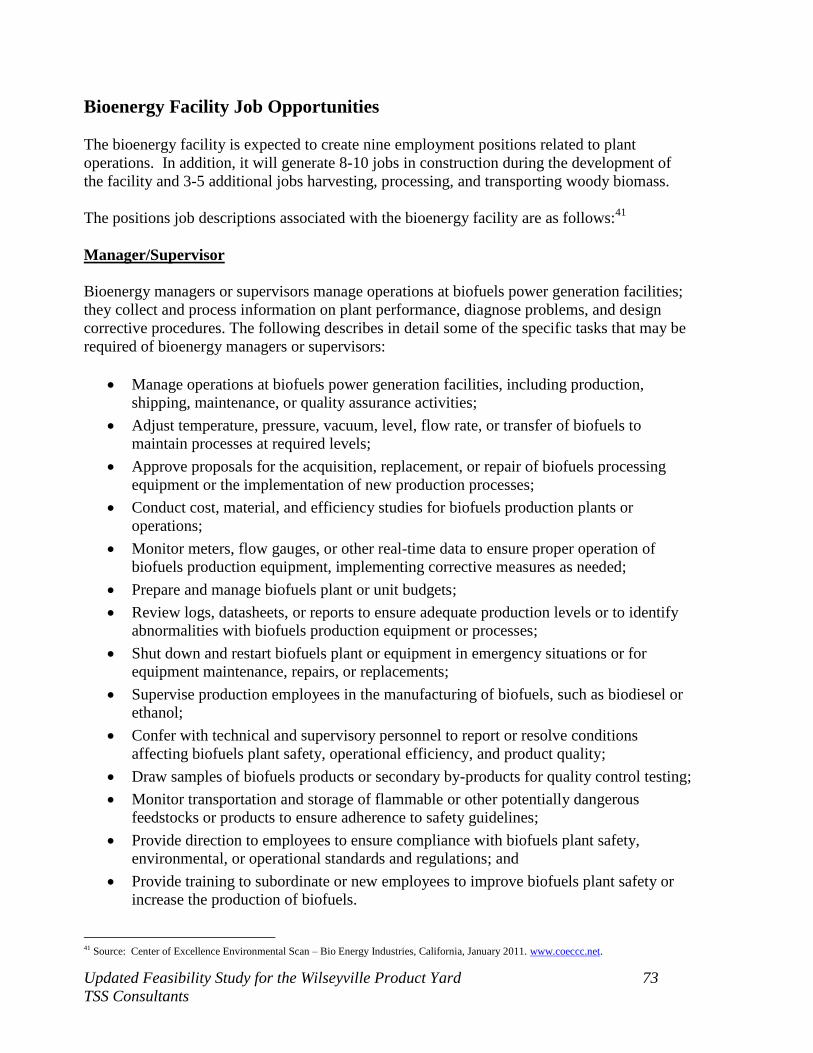
Bioenergy Facility Job Opportunities
The bioenergy facility is expected to create nine employment positions related to plant
operations. In addition, it will generate 8-10 jobs in construction during the development of
the facility and 3-5 additional jobs harvesting, processing, and transporting woody biomass.
The positions job descriptions associated with the bioenergy facility are as follows:41
Manager/Supervisor
Bioenergy managers or supervisors manage operations at biofuels power generation facilities;
they collect and process information on plant performance, diagnose problems, and design
corrective procedures. The following describes in detail some of the specific tasks that may be
required of bioenergy managers or supervisors:
Manage operations at biofuels power generation facilities, including production,
shipping, maintenance, or quality assurance activities;
Adjust temperature, pressure, vacuum, level, flow rate, or transfer of biofuels to
maintain processes at required levels;
Approve proposals for the acquisition, replacement, or repair of biofuels processing
equipment or the implementation of new production processes;
Conduct cost, material, and efficiency studies for biofuels production plants or
operations;
Monitor meters, flow gauges, or other real-time data to ensure proper operation of
biofuels production equipment, implementing corrective measures as needed;
Prepare and manage biofuels plant or unit budgets;
Review logs, datasheets, or reports to ensure adequate production levels or to identify
abnormalities with biofuels production equipment or processes;
Shut down and restart biofuels plant or equipment in emergency situations or for
equipment maintenance, repairs, or replacements;
Supervise production employees in the manufacturing of biofuels, such as biodiesel or
ethanol;
Confer with technical and supervisory personnel to report or resolve conditions
affecting biofuels plant safety, operational efficiency, and product quality;
Draw samples of biofuels products or secondary by-products for quality control testing;
Monitor transportation and storage of flammable or other potentially dangerous
feedstocks or products to ensure adherence to safety guidelines;
Provide direction to employees to ensure compliance with biofuels plant safety,
environmental, or operational standards and regulations; and
Provide training to subordinate or new employees to improve biofuels plant safety or
increase the production of biofuels.
41 Source: Center of Excellence Environmental Scan – Bio Energy Industries, California, January 2011. www.coeccc.net.
Updated Feasibility Study for the Wilseyville Product Yard 73
TSS Consultants

Occupational Wage: Bioenergy managers/supervisors are usually part of the manufacturing
industry (80% employed in this sector) and in 2009 this occupation had a national median
wage of $40.90 hourly, $85,080 annually. The median hourly wage in 2009 for California was
$43.47 hourly and $90,400 annually.
Education and Training: The most common educational or training level for bioenergy
managers/supervisors is work experience in a related occupation.
Biomass Plant Technicians
Biomass plant technicians control and monitor biomass plant activities and perform
maintenance as needed. The following describes in detail some of the specific tasks that may
be required of biomass plant technicians:
Measure and monitor raw biomass feedstock, including wood, waste, or refuse
materials;
Operate valves, pumps, engines, or generators to control and adjust production of
biofuels or biomass-fueled power;
Perform routine maintenance or make minor repairs to mechanical, electrical, or
electronic-equipment in biomass plants;
Assess quality of biomass feedstock;
Calculate, measure, load, or mix biomass feedstock for power generation;
Calibrate liquid flow devices or meters, including fuel, chemical, and water meters;
Inspect biomass power plant or processing equipment, recording or reporting damage
and mechanical problems;
Operate biomass fuel-burning boiler or biomass fuel gasification system equipment in
accordance with specifications or instructions;
Operate equipment to heat biomass, using knowledge of controls, combustion, and
firing mechanisms;
Operate equipment to start, stop, or regulate biomass-fueled generators, generator units,
boilers, engines, or auxiliary systems;
Operate high-pressure steam boiler or water chiller equipment for electrical
cogeneration operations;
Preprocess feedstock to prepare for biochemical or thermochemical production
processes;
Record or report operational data such as readings on meters, instruments, and gauges;
Clean work areas to ensure compliance with safety regulations;
Manage parts and supply inventories for biomass plants; and
Read and interpret instruction manuals or technical drawings related to biomass-fueled
power or biofuels production equipment or processes.
Updated Feasibility Study for the Wilseyville Product Yard 74
TSS Consultants
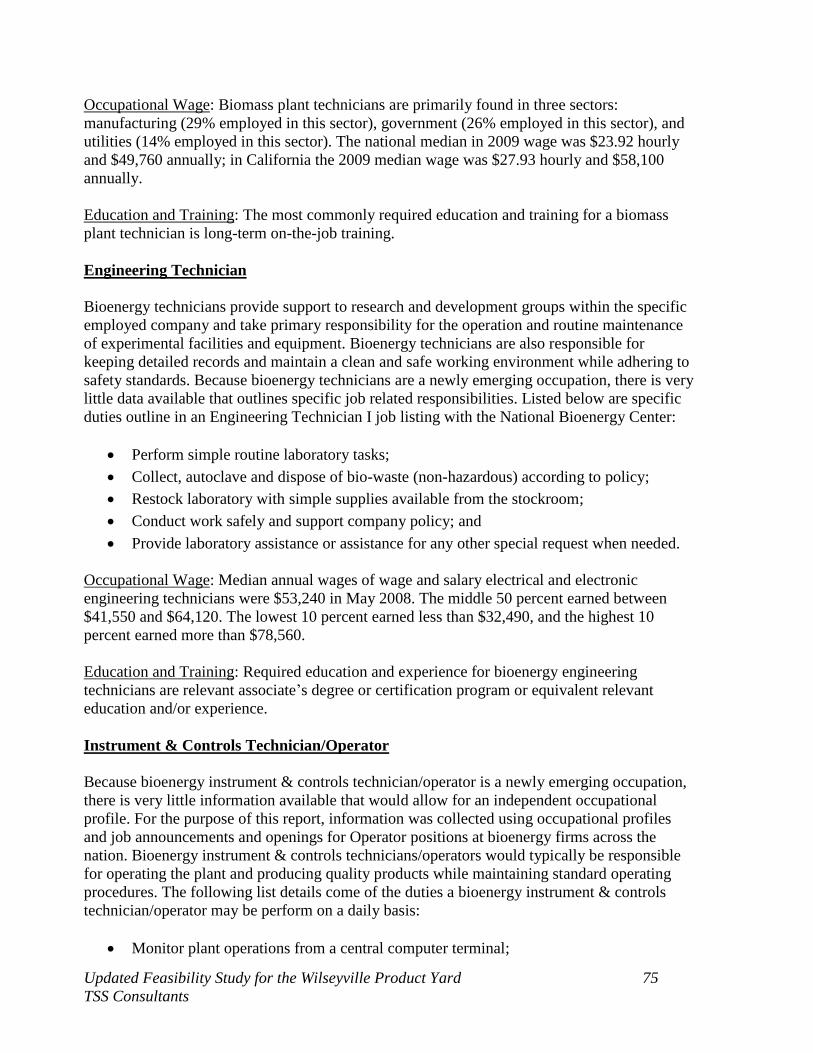
Occupational Wage: Biomass plant technicians are primarily found in three sectors:
manufacturing (29% employed in this sector), government (26% employed in this sector), and
utilities (14% employed in this sector). The national median in 2009 wage was $23.92 hourly
and $49,760 annually; in California the 2009 median wage was $27.93 hourly and $58,100
annually.
Education and Training: The most commonly required education and training for a biomass
plant technician is long-term on-the-job training.
Engineering Technician
Bioenergy technicians provide support to research and development groups within the specific
employed company and take primary responsibility for the operation and routine maintenance
of experimental facilities and equipment. Bioenergy technicians are also responsible for
keeping detailed records and maintain a clean and safe working environment while adhering to
safety standards. Because bioenergy technicians are a newly emerging occupation, there is very
little data available that outlines specific job related responsibilities. Listed below are specific
duties outline in an Engineering Technician I job listing with the National Bioenergy Center:
Perform simple routine laboratory tasks;
Collect, autoclave and dispose of bio-waste (non-hazardous) according to policy;
Restock laboratory with simple supplies available from the stockroom;
Conduct work safely and support company policy; and
Provide laboratory assistance or assistance for any other special request when needed.
Occupational Wage: Median annual wages of wage and salary electrical and electronic
engineering technicians were $53,240 in May 2008. The middle 50 percent earned between
$41,550 and $64,120. The lowest 10 percent earned less than $32,490, and the highest 10
percent earned more than $78,560.
Education and Training: Required education and experience for bioenergy engineering
technicians are relevant associate’s degree or certification program or equivalent relevant
education and/or experience.
Instrument & Controls Technician/Operator
Because bioenergy instrument & controls technician/operator is a newly emerging occupation,
there is very little information available that would allow for an independent occupational
profile. For the purpose of this report, information was collected using occupational profiles
and job announcements and openings for Operator positions at bioenergy firms across the
nation. Bioenergy instrument & controls technicians/operators would typically be responsible
for operating the plant and producing quality products while maintaining standard operating
procedures. The following list details come of the duties a bioenergy instrument & controls
technician/operator may be perform on a daily basis:
Monitor plant operations from a central computer terminal;
Updated Feasibility Study for the Wilseyville Product Yard 75
TSS Consultants

Collect samples and conduct tests and record data;
Make field adjustments of equipment, perform tank transfers, and all other field
operations;
Respond to alarm conditions with appropriate actions and adjustments;
Communicate operations status, discrepancies, maintenance requirements and any other
issues to a supervisor; and
Record data for operations, work orders, work permits and keep a daily logbook.
Occupational Wage: Bioenergy instrument & controls technician/operator had a median wage
in 2009 of $29.04 hourly and $60,400 annually. In 2008, there were 35,000 people employed
as bioenergy instrument and controls technicians/operators.
Education and Training: Bioenergy instrument and controls technician/operator‘s requires a
high school diploma or the equivalent. An associate’s degree in a technical field is preferred.
Bioenergy Facility Employment
TSS notes that the job positions discussed in the previous section reflect the required skill sets
and wage rates of large-scale (>10 MW) bioenergy facilities. The bioenergy sector is largely
comprised of these plants although there are growing numbers of small-scale bioenergy
producers. The large-scale facilities utilize high pressure steam and require more specialized
training than the small-scale gasification facilities.
Additionally, Phoenix Energy maintains a staff consisting of plant engineers and managers that
oversee all of their operations. The primary hiring for the proposed project in Wilseyville
would be from the biomass plant technician category. However, given the simplicity of small-
scale gasification projects and the rural area where the facility is to be located, TSS anticipates
wage rates to be below the stated median, closer to $15 per hour. Phoenix Energy has verified
this expectation based on their experiences operating two other facilities in California.
Industry Challenges
Bioenergy employers in California indicate a high level of difficulty attracting trained and
experienced personnel. The level of difficulty creates a challenge for employers to hire
replacement positions as well as any new jobs that may develop. The biggest difficulty
reported is recruiting entry level employees with appropriate training and education.
On the other hand, most employers expect recruits to be trained on the job, with possible
certification or associate’s degree in mechanical engineering for the more technical positions.
Based on this, it is unlikely that specific certifications or degrees will be demanded of potential
employees.
Updated Feasibility Study for the Wilseyville Product Yard 76
TSS Consultants

Training Needs and Resources
As noted above, training for these positions consist mostly of on-the-job training. The
Motherlode Job Training Center has already developed on-the-job training programs for the
CHIPS employment programs related to forestry work, and may be willing to extend this
resource to the bioenergy facility. California Indian Manpower Consortium has also indicated
an interest in assisting with occupational skills training, Adult Basic Education, GED training,
job readiness skills, and on-the-job training.
Updated Feasibility Study for the Wilseyville Product Yard 77
TSS Consultants
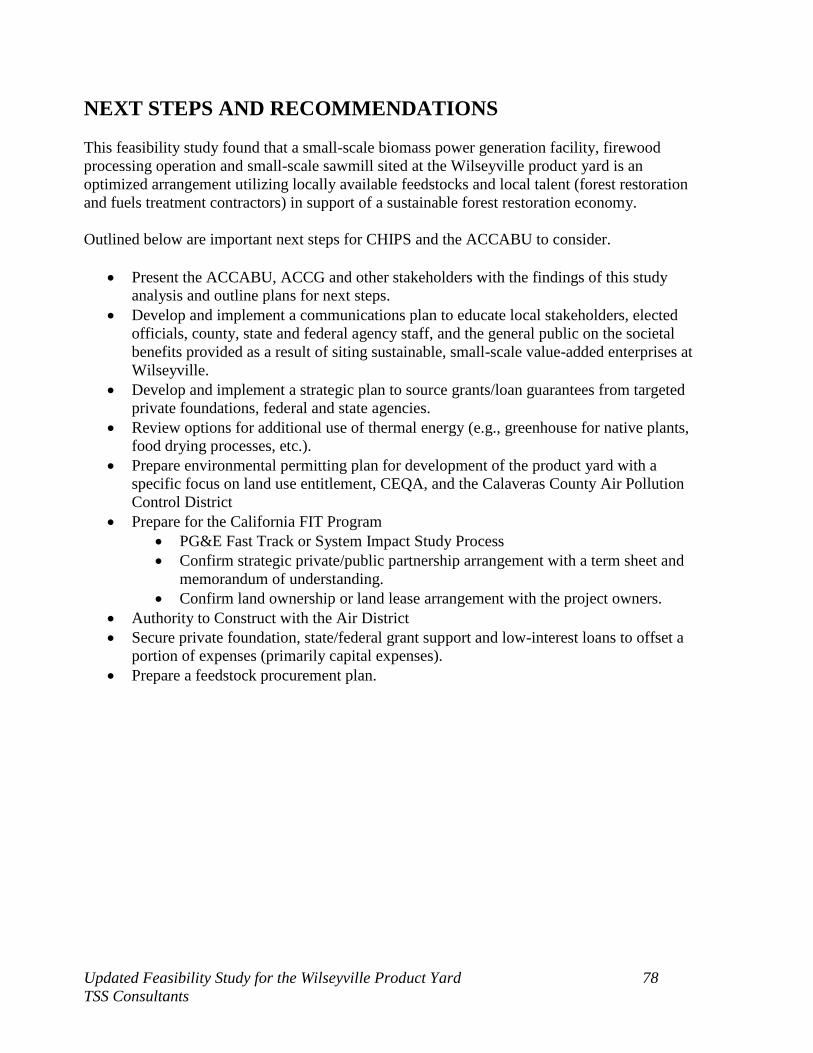
NEXT STEPS AND RECOMMENDATIONS
This feasibility study found that a small-scale biomass power generation facility, firewood
processing operation and small-scale sawmill sited at the Wilseyville product yard is an
optimized arrangement utilizing locally available feedstocks and local talent (forest restoration
and fuels treatment contractors) in support of a sustainable forest restoration economy.
Outlined below are important next steps for CHIPS and the ACCABU to consider.
Present the ACCABU, ACCG and other stakeholders with the findings of this study
analysis and outline plans for next steps.
Develop and implement a communications plan to educate local stakeholders, elected
officials, county, state and federal agency staff, and the general public on the societal
benefits provided as a result of siting sustainable, small-scale value-added enterprises at
Wilseyville.
Develop and implement a strategic plan to source grants/loan guarantees from targeted
private foundations, federal and state agencies.
Review options for additional use of thermal energy (e.g., greenhouse for native plants,
food drying processes, etc.).
Prepare environmental permitting plan for development of the product yard with a
specific focus on land use entitlement, CEQA, and the Calaveras County Air Pollution
Control District
Prepare for the California FIT Program
PG&E Fast Track or System Impact Study Process
Confirm strategic private/public partnership arrangement with a term sheet and
memorandum of understanding.
Confirm land ownership or land lease arrangement with the project owners.
Authority to Construct with the Air District
Secure private foundation, state/federal grant support and low-interest loans to offset a
portion of expenses (primarily capital expenses).
Prepare a feedstock procurement plan.
Updated Feasibility Study for the Wilseyville Product Yard 78
TSS Consultants
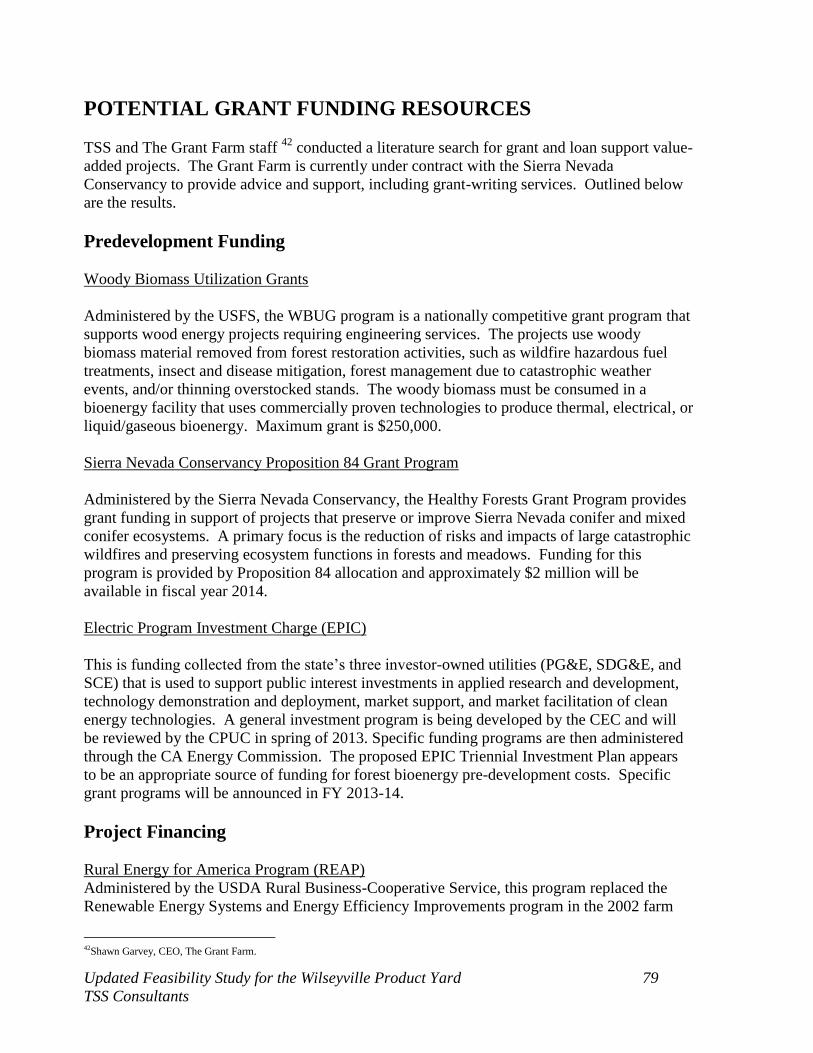
POTENTIAL GRANT FUNDING RESOURCES
TSS and The Grant Farm staff 42
conducted a literature search for grant and loan support value-
added projects. The Grant Farm is currently under contract with the Sierra Nevada
Conservancy to provide advice and support, including grant-writing services. Outlined below
are the results.
Predevelopment Funding
Woody Biomass Utilization Grants
Administered by the USFS, the WBUG program is a nationally competitive grant program that
supports wood energy projects requiring engineering services. The projects use woody
biomass material removed from forest restoration activities, such as wildfire hazardous fuel
treatments, insect and disease mitigation, forest management due to catastrophic weather
events, and/or thinning overstocked stands. The woody biomass must be consumed in a
bioenergy facility that uses commercially proven technologies to produce thermal, electrical, or
liquid/gaseous bioenergy. Maximum grant is $250,000.
Sierra Nevada Conservancy Proposition 84 Grant Program
Administered by the Sierra Nevada Conservancy, the Healthy Forests Grant Program provides
grant funding in support of projects that preserve or improve Sierra Nevada conifer and mixed
conifer ecosystems. A primary focus is the reduction of risks and impacts of large catastrophic
wildfires and preserving ecosystem functions in forests and meadows. Funding for this
program is provided by Proposition 84 allocation and approximately $2 million will be
available in fiscal year 2014.
Electric Program Investment Charge (EPIC)
This is funding collected from the state’s three investor-owned utilities (PG&E, SDG&E, and
SCE) that is used to support public interest investments in applied research and development,
technology demonstration and deployment, market support, and market facilitation of clean
energy technologies. A general investment program is being developed by the CEC and will
be reviewed by the CPUC in spring of 2013. Specific funding programs are then administered
through the CA Energy Commission. The proposed EPIC Triennial Investment Plan appears
to be an appropriate source of funding for forest bioenergy pre-development costs. Specific
grant programs will be announced in FY 2013-14.
Project Financing
Rural Energy for America Program (REAP)
Administered by the USDA Rural Business-Cooperative Service, this program replaced the
Renewable Energy Systems and Energy Efficiency Improvements program in the 2002 farm
42Shawn Garvey, CEO, The Grant Farm.
Updated Feasibility Study for the Wilseyville Product Yard 79
TSS Consultants

bill. The program provides grants and loans for a variety of rural energy projects, including
efficiency improvements and renewable energy projects. Assistance is limited to small
businesses, farmers, and ranchers with projects located in a rural community. REAP grants
and guarantees can be used individually or in combination. Together the grants and loan
guarantees can finance up to 75% of a project's cost. Grants alone can finance up to 25% of
the project cost, not to exceed $500,000 for renewables and $250,000 for efficiency.
Rural Economic Development Loan And Grant (REDLG)
Administered by USDA Rural Development the REDLG program provides funding to rural
projects through local utility organizations. Under the RED Loan program, USDA provides
zero interest loans to local utilities which they, in turn, pass through to local businesses
(ultimate recipients) for projects that will create and retain employment in rural areas. The
ultimate recipients repay the lending utility directly. The utility is responsible for repayment to
the Agency. Under the RED Grant program, USDA provides grant funds to local utility
organizations which use the funding to establish revolving loan funds. Loans are made from
the revolving loan fund to projects that will create or retain rural jobs. When the revolving
loan fund is terminated, the grant is repaid to the Agency.
Business And Industry Guaranteed Loans
Administered by USDA, the purpose of the Business and Industry Guaranteed Loan Program is
to improve, develop, or finance business, industry, and employment and improve the economic
and environmental climate in rural communities. This purpose is achieved by bolstering the
existing private credit structure through the guarantee of quality loans which will provide
lasting community benefits. A borrower must be engaged in or proposing to engage in a
business that will:
Provide employment;
Improve the economic or environmental climate;
Promote the conservation, development, and use of water for aquaculture; or
Reduce reliance on nonrenewable energy resources by encouraging the development
and construction of solar energy systems and other renewable energy systems.
Department of Commerce/Economic Adjustment Assistance
Provides a wide range of technical, planning, and public works and infrastructure assistance in
regions experiencing adverse economic changes that may occur suddenly or over time (e.g.,
strategy development, infrastructure construction, revolving loan fund capitalization). (CFDA
No. 11.307)
California Economic Development Lending Institute (CEDLI)
CEDLI, the California Economic Development Lending Initiative, is a multibank community
development corporation established in 1995 to invest capital in small businesses and nonprofit
Updated Feasibility Study for the Wilseyville Product Yard 80
TSS Consultants

community organizations throughout California in both urban and rural communities. We are
committed to increasing access to capital for small businesses and community organizations to
allow them to grow, create jobs and to facilitate community economic development.
Wells Fargo Regional Foundation / Community Development Program
Wells Fargo looks for projects that keep communities strong, diverse, and vibrant. In
California, Wells Fargo makes grants in Community economic development to support the
improvement of low- and moderate-income communities through programs that:
Create and sustain affordable housing;
Promote economic development by financing small businesses or farms ;
Provide job training and workforce development; and
Revitalize and stabilize communities .
Biomass Research and Development Initiative
Administered by the USDA and the U.S. Department of Energy. Both agencies produce joint
solicitations each year to provide financial assistance in addressing research and development
of biomass-based products, bioenergy, biofuels, and related processes. Approximate funding
per project is $7,500,000.
Business and Energy Guaranteed Loans
Business and Energy Guaranteed Loans are administered through the USDA. To improve,
develop, or finance business, industry, and employment and improve the economic and
environmental climate in rural communities.
New Market Tax Credits
These are competitive tax credit allocations granted to Community Development Financing
Institutions which can provide tax credit funding for approximately 20% of the capital
investment. These are complicated legal and administrative instruments, so they are generally
used in projects of $5 million and over.
Other Potential Sources
Rural Business Enterprise Grant Program (RBEG)
Administered by USDA Rural Development the RBEG program provides grants for rural
projects that finance and facilitate development of small and emerging rural businesses help
fund distance learning networks, and help fund employment related adult education programs.
To assist with business development, RBEGs may fund a broad array of activities. There is no
maximum level of grant funding. However, smaller projects are given higher priority.
Generally grants range $10,000 up to $500,000.
Updated Feasibility Study for the Wilseyville Product Yard 81
TSS Consultants
Rural Business Opportunity Grants (RBOG)
Administered by USDA Rural Development the RBOG program promotes sustainable
economic development in rural communities with exceptional needs through provision of
training and technical assistance for business development, entrepreneurs, and economic
development officials and to assist with economic development planning. The maximum grant
for a project serving a single states is $50,000. The maximum grant for a project serving two
or more states is $150,000.
Department of Energy/Energy Efficiency and Conservation Block Grant (EECBG) Program
The Energy Efficiency and Conservation Block Grant (EECBG) Program represents a priority
to deploy the cheapest, cleanest, and most reliable energy technologies we have – energy
efficiency and conservation – across the country. The Program, authorized in Title V, Subtitle
E of the Energy Independence and Security Act (EISA) and signed into law on December 19,
2007, is modeled after the Community Development Block Grant program administered by the
Department of Housing and Urban Development (HUD). It is intended to assist U.S. cities,
counties, states, territories, and Indian tribes to develop, promote, implement, and manage
energy efficiency and conservation projects and programs designed to:
Reduce fossil fuel emissions;
Reduce the total energy use of the eligible entities;
Improve energy efficiency in the transportation, building, and other appropriate sectors;
and
Create and retain jobs.
Through formula and competitive grants, the Program empowers local communities to make
strategic investments to meet the nation's long-term goals for energy independence and
leadership on climate change
California Housing and Community Development/Community Development Block Grant
(CDBG) Program
The primary federal objective of the CDBG program is the development of viable communities
by providing decent housing and a suitable living environment and by expanding economic
opportunities, principally for persons of low and moderate income. "Persons of low and
moderate income" or the "targeted income group" are defined as families, households, and
individuals whose incomes do not exceed 80 percent of the county median income, with
adjustments for family or household size.
California Community Services and Development/Community Services Block Grant (CSBG)
Legislation provided for the CSBG program in the federal Omnibus Budget Reconciliation Act
of 1981 to help eliminate the causes and ameliorate the conditions of poverty. Currently each
state receives an allocation of funds to distribute to community service providers who provide
Updated Feasibility Study for the Wilseyville Product Yard 82
TSS Consultants

a variety of services to clients who meet the income guidelines. Services to eligible clients
must contribute to the achievement of one or more of the six goals developed by the National
CSBG Monitoring and Assessment Task Force.
Low-income people become more self-sufficient;
The conditions in which low-income people live are improved;
Low-income people own a stake in their community;
Partnerships among supporters and providers of services to low-income people are
achieved;
Agencies increase their capacity to achieve results; and
Low-income people achieve their potential by strengthening family and other
supportive systems.
Public Interest Energy Research (PIER)
Administered by the California Energy Commission, the PIER program provides funding in
support of research, development and deployment of innovative business models and
technologies. Primarily focused on research that forward the development of renewable energy
in California, including community scale (<10 MW) project deployment.
Healthy Forests Grant Program
Administered by the Sierra Nevada Conservancy, the Healthy Forests Grant Program provides
grant funding in support of projects that preserve or improve Sierra Nevada conifer and mixed
conifer ecosystems. A primary focus is the reduction of risks and impacts of large catastrophic
wildfires and preserving ecosystem functions in forests and meadows. Funding for this
program is provided by Proposition 84 allocation and is available through fiscal year 2013.
Funding in fiscal year 2012 - 2013 is focused on ranching and agricultural lands.
Updated Feasibility Study for the Wilseyville Product Yard 83
TSS Consultants

APPENDIX A – CORRESPONDENCE FROM CALAVERAS
COUNTY PLANNING DEPARTMENT
Feasibility Study for the Wilseyville Product Yard TSS Consultants
84
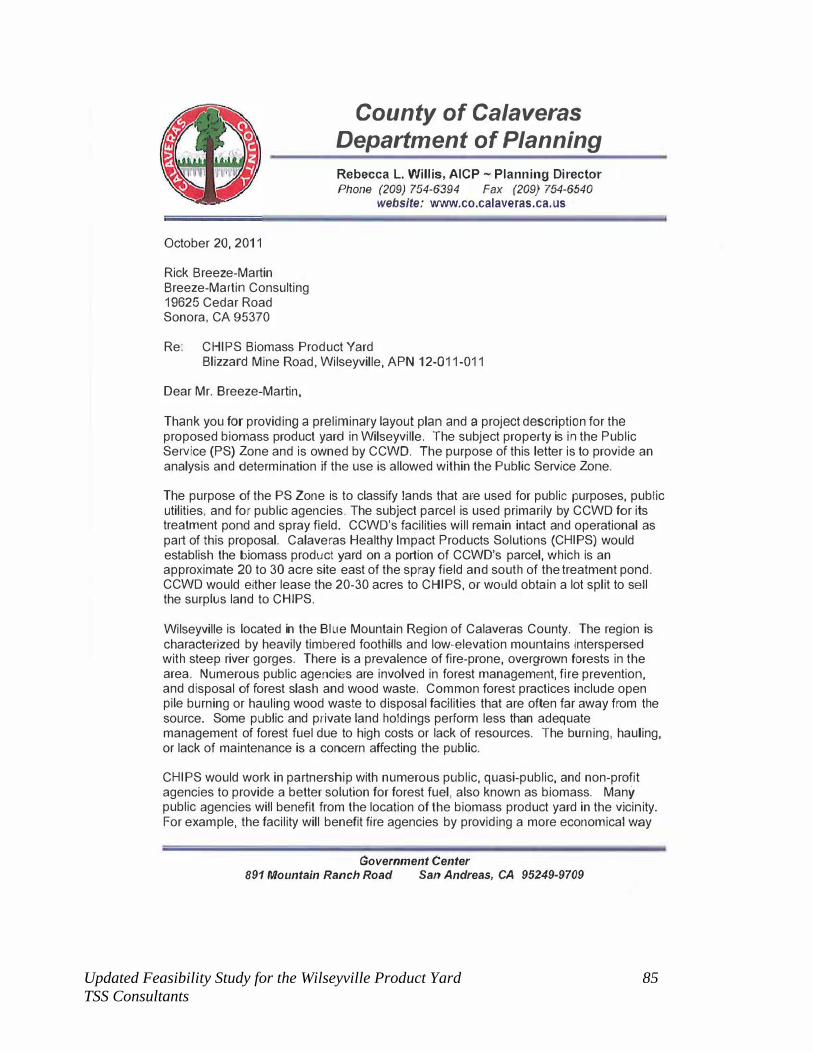
County of Calaveras Department of Planning
Rebecca L. Willis, AICP ~ Planning Director Phone (209) 754-6394 Fax (209) 754-6540
website: www.co.calaveras.ca. us
October 20, 2011
Rick Breeze-Martin Breeze-Martin Consulting 19625 Cedar Road Sonora, CA 95370
Re: CHIPS Biomass Product Yard Blizzard Mine Road, Wilseyville, APN 12-011-011
Dear Mr. Breeze-Martin,
Thank you for providing a preliminary layout plan and a project description for the proposed biomass product yard in Wilseyville. The subject property is in the Public Service (PS) Zone and is owned by CCWD. The purpose of this letter is to provide an analysis and determination if the use is allowed within the Public Service Zone.
The purpose of the PS Zone is to classify lands that are used for public purposes, public utilities, and for public agencies. The subject parcel is used primarily by CCWD for its treatment pond and spray field. CCWD's facilities will remain intact and operational as part of this proposal. Calaveras Healthy Impact Products Solutions (CHIPS) would establish the biomass product yard on a portion of CCWD's parcel, which is an approximate 20 to 30 acre site east of the spray field and south of the treatment pond. CCWD would either lease the 20-30 acres to CHIPS, or would obtain a lot split to sell the surplus land to CHIPS.
Wilseyville is located in the Blue Mountain Region of Calaveras County. The region is characterized by heavily timbered foothills and low-elevation mountains interspersed with steep river gorges. There is a prevalence of fire-prone, overgrown forests in the area. Numerous public agencies are involved in forest management, fire prevention, and disposal of forest slash and wood waste. Common forest practices include open pile burning or hauling wood waste to disposal facilities that are often far away from the source. Some public and private land holdings perform less than adequate management of forest fuel due to high costs or lack of resources. The burning, hauling, or lack of maintenance is a concern affecting the public.
CHIPS would work in partnership with numerous public, quasi-public, and non-profit agencies to provide a better solution for forest fuel, also known as biomass. Many public agencies will benefit from the location of the biomass product yard in the vicinity. For example, the facility will benefit fire agencies by providing a more economical way
Government Center
891 Mountain Ranch Road San Andreas, CA 95249-9709
Updated Feasibility Study for the Wilseyville Product Yard 85
TSS Consultants
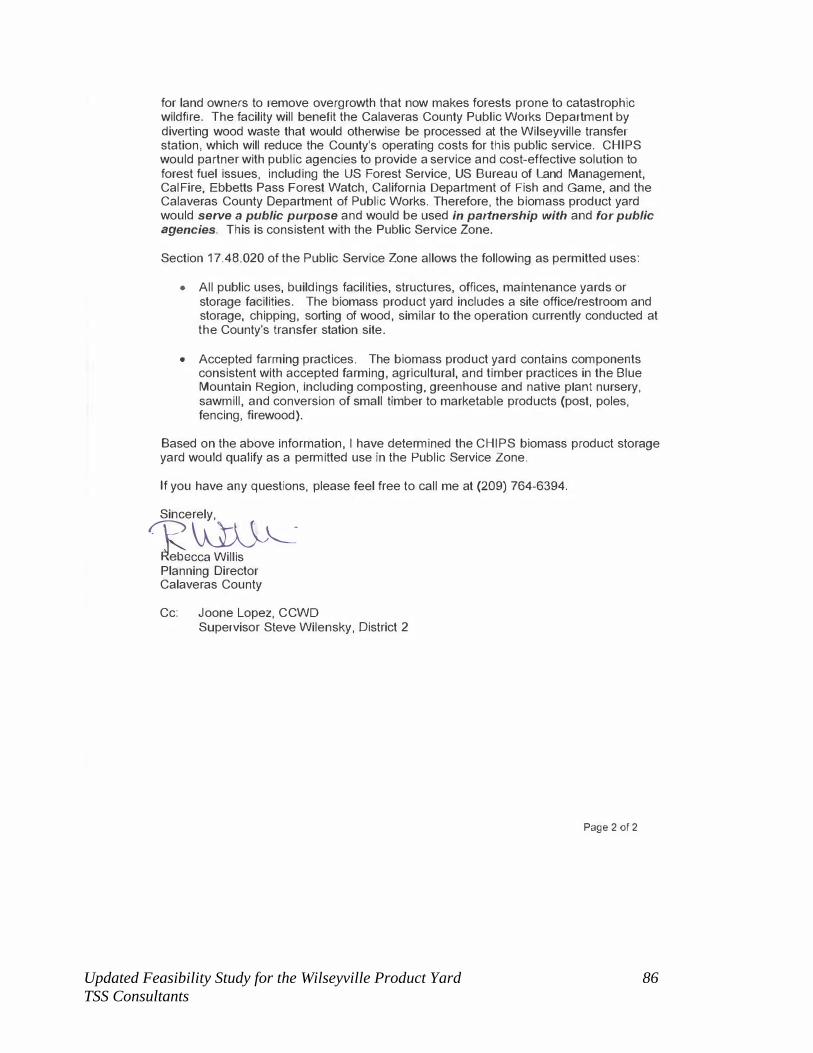
for land owners to remove overgrowth that now makes forests prone to catastrophic wildfire. The facility will benefit the Calaveras County Public Works Department by diverting wood waste that would otherwise be processed at the Wilseyville transfer station, which will reduce the County's operating costs for this public service. CHIPS would partner with public agencies to provide a service and cost-effective solution to forest fuel issues, including the US Forest Service, US Bureau of Land Management, Cal Fire, Ebbetts Pass Forest Watch, California Department of Fish and Game, and the Calaveras County Department of Public Works. Therefore, the biomass product yard would serve a public purpose and would be used in partnership with and for public
agencies. This is consistent with the Public Service Zone.
Section 17.48.020 of the Public Service Zone allows the following as permitted uses:
• All public uses, buildings facilities, structures, offices, maintenance yards or storage facilities. The biomass product yard includes a site office/restroom and storage, chipping, sorting of wood, similar to the operation currently conducted at the County's transfer station site.
• Accepted farming practices. The biomass product yard contains components consistent with accepted farming, agricultural, and timber practices in the Blue Mountain Region, including composting, greenhouse and native plant nursery, sawmill, and conversion of small timber to marketable products (post, poles, fencing, firewood).
Based on the above information, I have determined the CHIPS biomass product storage yard would qualify as a permitted use in the Public Service Zone.
If you have any questions, please feel free to call me at (209) 764-6394.
Sincerely,
<P Rebecca Willis Planning Director Calaveras County
Cc: Joone Lopez, CCWD Supervisor Steve Wilensky, District 2
Page 2 of 2
Updated Feasibility Study for the Wilseyville Product Yard 86
TSS Consultants

APPENDIX B – STEERING COMMITTEE MEETING NOTES
Updated Feasibility Study for the Wilseyville Product Yard
TSS Consultants
87
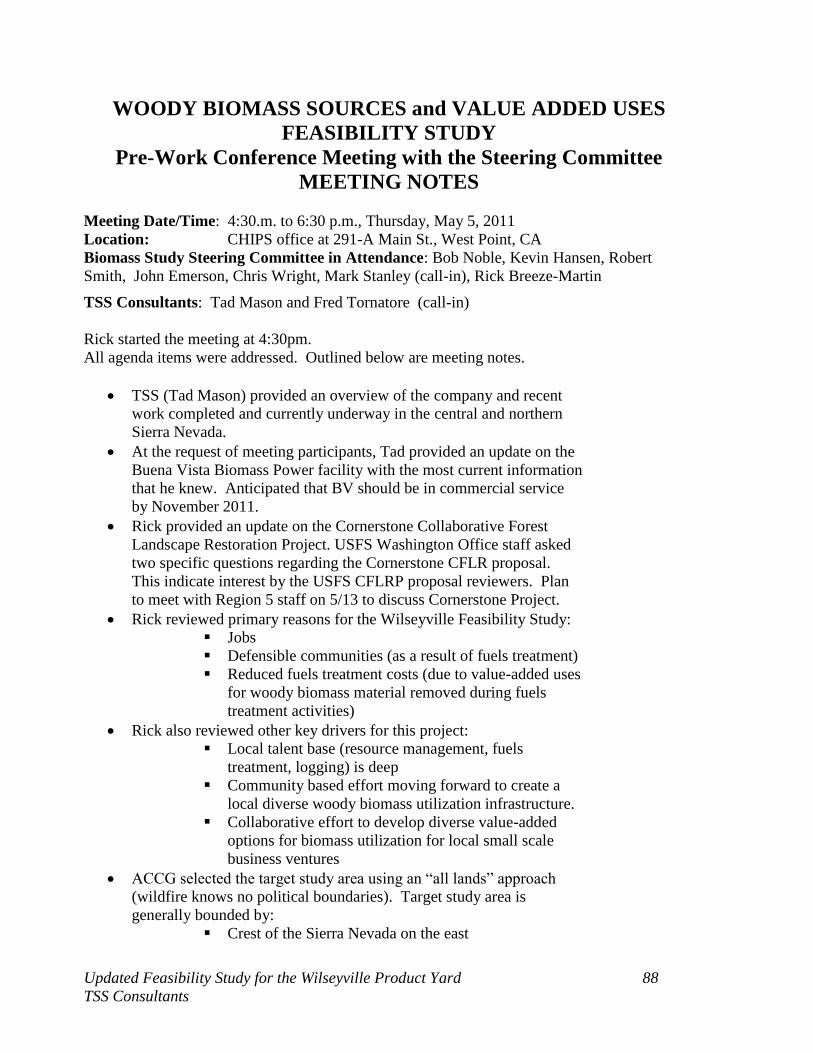
WOODY BIOMASS SOURCES and VALUE ADDED USES
FEASIBILITY STUDY
Pre-Work Conference Meeting with the Steering Committee
MEETING NOTES
Meeting Date/Time: 4:30.m. to 6:30 p.m., Thursday, May 5, 2011
Location: CHIPS office at 291-A Main St., West Point, CA
Biomass Study Steering Committee in Attendance: Bob Noble, Kevin Hansen, Robert
Smith, John Emerson, Chris Wright, Mark Stanley (call-in), Rick Breeze-Martin
TSS Consultants: Tad Mason and Fred Tornatore (call-in)
Rick started the meeting at 4:30pm.
All agenda items were addressed. Outlined below are meeting notes.
TSS (Tad Mason) provided an overview of the company and recent
work completed and currently underway in the central and northern
Sierra Nevada.
At the request of meeting participants, Tad provided an update on the
Buena Vista Biomass Power facility with the most current information
that he knew. Anticipated that BV should be in commercial service
by November 2011.
Rick provided an update on the Cornerstone Collaborative Forest
Landscape Restoration Project. USFS Washington Office staff asked
two specific questions regarding the Cornerstone CFLR proposal.
This indicate interest by the USFS CFLRP proposal reviewers. Plan
to meet with Region 5 staff on 5/13 to discuss Cornerstone Project.
Rick reviewed primary reasons for the Wilseyville Feasibility Study:
Jobs
Defensible communities (as a result of fuels treatment)
Reduced fuels treatment costs (due to value-added uses
for woody biomass material removed during fuels
treatment activities)
Rick also reviewed other key drivers for this project:
Local talent base (resource management, fuels
treatment, logging) is deep
Community based effort moving forward to create a
local diverse woody biomass utilization infrastructure.
Collaborative effort to develop diverse value-added
options for biomass utilization for local small scale
business ventures
ACCG selected the target study area using an “all lands” approach
(wildfire knows no political boundaries). Target study area is
generally bounded by:
Crest of the Sierra Nevada on the east
Updated Feasibility Study for the Wilseyville Product Yard
TSS Consultants
88
Hwy 49 on the west
Hwy 88 to the north
Hwy 4 to the south
Regarding the Wilseyville 20 acre collection yard site:
Chris mentioned that there has been a soil survey
completed that may help target areas on the site that
need clean up.
Bob noted that there is some arsenic in the region, but
this is naturally occurring and not a cause for concern.
Reviewed site attributes:
Has historically been used as a sawmill
Some infrastructure in place (roads, level
ground, drainage system)
Easy access off county roads
Centrally located to existing and planned fuels
treatment activities
Reviewed needed infrastructure:
Fire safety system (above ground water storage
with gravity feed)
Kevin will contact Jim Carroll, the area Fire Chief to find out what the
fire safety system requirements are for the Wilseyville site.
Rick will check with the Calaveras County Water District (CCWD)
about:
Land lease costs for the Wilseyville site
Current power rates paid by the CCWD
Currently the Wilseyville site is zoned “public service”. It may need
to be re-zoned to accommodate a production yard. May need an EIR
to accomplish this. Chris suggested a categorical exclusion could be
considered in place of a full EIR (and still be CEQA compliant).
Next Meeting is June 7. Meet at CHIPS office at 4:30 with field visits
earlier in the day:
Conduct site review, tour Lily Gap and Hwy 88
projects
Meet with USFS/BLM staff to discuss planned
activities in the target study area?
Conduct Phase I meeting with Steering Committee
WOODY BIOMASS SOURCES and VALUE ADDED
Updated Feasibility Study for the Wilseyville Product Yard
TSS Consultants
89
USES FEASIBILITY STUDY
Task 3 Meeting with the Steering Committee
Meeting Date/Time: 4:30.m. to 6:55 p.m., Monday, July 18, 2011
Location: CHIPS office at 291-A Main St., West Point, CA
Biomass Study Steering Committee in Attendance: Bob Noble, Robert
Smith, John Hofmann, Rick Breeze-Martin; with Chris Post of CalFire also in
attendance
TSS Consultants: Tad Mason with Gareth Mayhead
Meeting Notes
Rick started the meeting at 4:30 p.m.
Outlined below are meeting notes.
Rick opened the meeting at 4:30 p.m. and gave a quick overview of the
meeting purpose to review the study Task 3 document and get a status of
tasks 4 and 5.
Tad provided an overview of the product yard permitting review
conducted by Fred Tornatore (TSS Consultants). The site is zoned Public
Service and may require a Conditional Use Permit, to allow for
commercial enterprises. However, this will depend substantially on how
the new Planning Director interprets and frames the site revitalization and
proposed uses to the Planning Commission. Rick is to follow-up with the
new Planning Director after they are hired with background on our
intentions, and he is to get what studies Pat McGrivy may have from the
effort at developing a community park. Nothing can move forward until
the CCWD Board of Directors approves the project in concept and
permits it to move forward with direction to CCWD staff. Air permits
secured from the Calaveras County Air Pollution Control District will be
required if a lumber or firewood kiln are installed on site.
Bob reported out that Jim Carroll, West Point area Fire Chief, indicated
that for the proposed product yard he would want to see a 2,500 to 5,000
gallon tank with the ability to pull water for his fire fighting vehicles.
Chris indicated it is to be in compliance with section 4291 of the CalFire
fire code and he gave a brief overview.
Tad gave a page by page overview of the Task 3 document: “WOODY BIOMASS FEEDSTOCK AVAILABILITY AND COST ANALYSIS” and the group discussed it from several angles. Suggestions were made
such as clarifying in the document that as a matter of course in such
studies it’s projections were built on the trends from the past few years,
and that time will determine if a shift away from forest work focused on
saw log markets to one focused on the woody biomass involved in forest
restoration may change future outcomes. Tad is going to incorporate
clarifying comments such as this from the discussion as and when
appropriate in the final documents.
Updated Feasibility Study for the Wilseyville Product Yard
TSS Consultants
90
Tad and Gareth provided an update and overview of the decision matrix
they are developing for wood biomass value added ventures. The group
discussed the revised matrix and suggested some additions such as hog
fuel / chips as a basic feedstock for multiple value added activities and
thus an important item to list, and pine needles as a plentiful material that
might be useful. Also, the point was made that from a community fire
point of view chipping brush and small cull trees is likely to provide more
feedstock at different qualities than the Buena Vista power plant can
absorb. Considering adding as many value added activities as possible
using chipped raw material from fire fuel reduction was encouraged.
This lead to a discussion about what specific value added uses from the
long list would be studied in more detail. After lengthy and useful
discussion, with some arm twisting here and there the following four
ventures were chosen for study by TSS Consultants.
o Small Saw Mill and Kiln
o Firewood and Kiln
o Posts and Poles
o Hog Fuel / chips for power and heat generation (clarification was
that this not include just any or all value added options using this
feedstock, but focus on the two biomass power plants nearby and
product yard co-generation).
Tad gave a brief overview of the remaining study schedule and agreed to
try and complete the draft study in mid - September.
Meeting adjourned at 6:55 p.m.
Updated Feasibility Study for the Wilseyville Product Yard
TSS Consultants
91
WOODY BIOMASS SOURCES and VALUE ADDED USES
FEASIBILITY STUDY
Project Update Meeting with the Steering Committee
Meeting Date/Time: 4:00 p.m. to 5:30 p.m., Wednesday, October 5, 2011
Location: Veterans Hall, West Point, CA
Biomass Study Steering Committee in Attendance: Bob Noble, Robert Smith, John
Hofmann, Rick Breeze-Martin, John Emerson, Chris Wright, and Arvada Fischer.
TSS Consultants: Tad Mason with Gareth Mayhead
Meeting Notes
Rick Breeze-Martin facilitated and opened the meeting at 4:05 p.m. Rick provided an overview
of the meeting purpose, and reviewed the meeting agenda.
Product Yard Update on CCWD & Planning - 5 to 10 minutes
Rick reported that the Calaveras County Water District (CCWD) Board of Directors
approved the sale of the property with some conditions that must be addressed (e.g.,
securing a valuation appraisal for the property, and conducting a land survey). Property
transfer may take place as soon as Spring/Summer 2012.
He also reported out on an initial meeting with the new County Planning Director who will
be setting up a meeting to include and coordinate with County Public Works and
Environmental Health regarding County requirements and approvals. Rick is to provide a
brief project concept and larger maps for the meeting with County Department Directors.
TSS overview of draft Feasibility Study Uses section – 10 to 15 minutes
Tad Mason gave an overview of the key issues for each of the four value-added uses being
studied (e.g. scale of operations, markets profiles, financial pro forma, etc.) for the product
yard:
On site Co-Generation of Heat and Power (focusing on using small
gasification plant technology);
Firewood and Kiln operation;
Chips for fuel, etc. (focusing on chipped material to the Power Plants at
Buena Vista and/or UltraPower, and co-gen small plant on product yard);
and,
Sawmill and Kiln.
Committee Discussion and input to the TSS Overview – 35 to 40 minutes
The Committee members discussed and asked questions of each value added use presented
by Tad and provided input for consideration or confirmation regarding draft estimates.
Updated Feasibility Study for the Wilseyville Product Yard 92
TSS Consultants

Input items provided by the Committee included, but was not limited to prices and
availability of raw feedstock, employee salaries and benefits, lease costs / improvements
needed, etc. Tad took notes of the different comments and input points provided during the
draft review of the study. Tad confirmed plans for TSS to deliver a draft feasibility report
by 12/31/11.
Meeting adjourned at 5:30 p.m.
Updated Feasibility Study for the Wilseyville Product Yard 93
TSS Consultants

APPENDIX C – REQUEST FOR INFORMATION
Updated Feasibility Study for the Wilseyville Product Yard
TSS Consultants
94

Updated Feasibility Study for the Wilseyville Product Yard 95
TSS Consultants
WOODY BIOMASS COMBINED HEAT & POWER PROJECT IN WILSEYVILLE, CA
Request for Information
The Calaveras Healthy Impact Products Solutions, Inc. (CHIPS), a California non-profit corporation with federal IRS 50 l (c)(3) ce1tification, with help from a feasibility study done by TSS Consultants, has determined that a small combined heat and power facility is an appropriate project for the Blue Mountain communities of Calaveras County. The project is a su·ategic step to utilize local forest biomass material generated as a result of forest management and hazardous fuels treatment activities near Wilseyville, California. The project is an important part of the larger woody biomass product yard that CHWS is developing as a member pa1tner of the Amador Calaveras Cooperative Association for Biomass Utilization ("the Association").
Proposals in response to this RFI are to help CHIPS identify development partners for a 2 to 3 MW Combined Heat and Power (CHP) Plant at the Wilseyville Biomass Product Yard. CHIPS intends to pursue a power sale opportunity expected from California's recently approved "SB 1122" for community scaled power generation, and as appropriate pa1ticipate in the voters' recently passed "Proposition 39" implementation. CHWS is seeking proposals with information from qualified respondents interested in participating as a project development team member for a Combined Heat and Power Plant (CHP). The Plant is intended to be an anchor business at the Wilseyville Product Yard. CHWS is especially interested in venture development pa1t11ers that fit one or more of the following characteristics: • Has (a) completed at least one project of similar technology and capacity or (b) begun
consu·uction of at least one other similar project; • Has other appropriate financial, technical, and/or development capacity and related
experience to participate as a partner in this CHP development project;
As part of its role in the development pa1tnership CHIPS anticipates providing value such as land for the project, assisting in the local permit process, providing assistance in identifying and preparing grant applications, as appropriate and available providing tax credits, providing plant support services, and taking primary responsibility for public information and relations, among other values CHIPS will provide as a member of the development team prutners.
Project Timeline: Plans are to review responses to the RFI and select the top ranked technology and project development team within 30 days of receipt of proposals. CHWS and the selected candidate(s) will enter into negotiations that will result in execution of a memorandum of understanding and term sheet.
Technology Requirement: The proposed facility should generate up to 2 - 3 MW (net) of base load elecu·icity delivered to the grid and operating at a minimum of 86% of capacity. Waste heat or excess steam may be used for fuel drying (average forest biomass fuel moisture will be 40% to 55%) and drying lumber (there is a small sawmill to be collocated on the Wilseyville site). The heat requirement is estimated to be about l MMBtu/hr for the lumber drying kiln and may be supplied with waste heat at a minimum of 700°F into the heat exchanger or with syngas conditioned to run in a liquid propane engine. Several adjacent buildings could benefit from the waste heat produced by the facility, but heating loads ru·e small and should not be accounted for in this RFI. Electricity will likely be sold to the local utility, PG&E.
CHP Project RF!: Approved by CHIPS 1 2 -1 2 -20 I 2 Page I

Updated Feasibility Study for the Wilseyville Product Yard 96
TSS Consultants
WOODY BIOMASS COMBINED HEAT & POWER PROJECT IN WILSEYVILLE, CA
Air Emissions: Air emissions are of pa11icular concern as the proposed site is located in a nonattainment area for criteria air pollutants. Air emissions for the proposed system must meet Calaveras County air pollutant emissions standards.
Water Effiuence: Water effluence is of concern and au waste water must be carefully disposed of in accordance to Calaveras County requirements. Submittals should also address water input and discharge in units of gallons per minute.
Noise: The proposed site is zoned public service but there are residences in the area and other businesses on the site. For this reason, it is desirable that the process be as quiet as possible so as not to disturb nearby residents and businesses.
Feedstock Parameters: Available feedstock will be 95% forest harvest residuals (limbs and tops) and hazardous fuels (small stems and brush) processed to be sized at 3" minus. Average moisture content will range from 40% to 55% and high heating value (HHV) of the fuel is estimated to be 8,000 to 8,500 Btu/dry lb. Proposals should include fuel-handling systems for feedstock delivery including any necessary drying, and conveying equipment.
Selection Criteria: Responses will be evaluated based on the following criteria: ( I) Ability to produce base load electricity for sale directly to the grid; (2) Ability to operate at a minimum of 86% capacity; (3) Environmental impacts including noise, air, water supply needs, and water discharge volumes; (4) Facility size (footprint); (5) Fuel consumption rates per unit of output (net heat rate); (6) Estimated capital and operating costs for entire system (including ancillary equipment such as fuel drying equipment); (7) Capacity and willingness to participate as necessary in up-front pre-development and development funding.
Contents of Response Submittal: All responses should include the following information. Responses should be organized in the following format: I) A technical description of the unit from fuel receiving equipment through delivery of electricity to a substation. 2) Identify required resources including water supply, footprint, fuel consumption rates at various heat contents (Btu/dry lb.), etc.
3) Environmental impact summary including noise impacts, air emissions, water supply, water discharge, ash disposal, tar disposal, hazardous waste disposal, etc. An approximate chemical composition and/or concentrations of emissions (air, water, or solids) should be included for any emissions source.
4) Financials. This section may include for CHlPS' consideration any preferred financial / ownership models, including but not limited to outright client ownership, client and vendor partnership, vendor ownership and operation, or other form. The financial section must include both estimated capital costs and annual operation and maintenance costs for an appropriate development scenario. Financial models should be run with a range of feedstock pricing from $45/BDT to $60/BDT to provide an indicative estimate of base load power ($.xx/kWh) cost and heat ($xx/MMBtu). All proposals should include all equipment necessary for emission control devices required to meet the standards outlined above (including but not limited to air emissions
CHP Project RF!: Approved by CHIPS 1 2 -12-2012 Page 2
Updated Feasibility Study for the Wilseyville Product Yard 97
TSS Consultants
WOODY BIOMASS COMBINED HEAT & POWER PROJECT IN WILSEYVILLE, CA
conu·ols, fuel drying systems, fuel handling systems, elecu·ic grid connections, and water treatment facilities if required). 5) Statement of qualifications of manufacturer, including experience with woody biomass fuels,contact information for proposed or currently operating systems, available operating histories and references.
6) Supplementary information (at the discretion of the candidate).
All questions from parties interested in this RFI should be directed to the CHIPS Project Consultant by close of business Monday, January 7, 2013. The Project Consultant anticipates responding to all respondents answers to questions received by January 7 th by Friday, January 11, 2013. Questions received after Jan. 7th may not be answered prior to the response deadline.
Deadline for Responses: Elecu-onic replies are due by close of business Friday, January 18, 2013. Reponses are to be submitted to the Project Consultant [email protected] unless other arrangements are requested in advance. Please limit your responses to no more than 30 pages. Candidate's responses should be delivered in digital format (no need to send hardcopies).
Responding to this request does not create any obligation on the part of CHIPS to select, partner with, or otherwise create a legal obligation or relationship with any respondent.
Contact: All communications should be directed to the CHIPS Project Consultant:
Rick Breeze-Mrutin Breeze-Martin Consulting 19625 Cedar Rd. Sonora, CA 95370 (209) 588-0210 office (209) 602-5571 mobile
CHP Project RF!: Approved by CHIPS 1 2 -12-2012 Page 3
APPENDIX D – CHIPS SUBCOMMITTEE FOR SELECTION
OF TECHNOLOGY VENDOR/SYSTEM INTEGRATOR
Updated Feasibility Study for the Wilseyville Product Yard
TSS Consultants
98
Steve Wilensky. Mr. Wilensky is the chairman of CHIPS Board of Directors and a founding
director of CHIPS. He served for 8 years as a Calaveras County supervisor and has served on
numerous other boards and commissions, including the Upper Mokelumne Watershed Council
and the Sierra Nevada Conservancy. Mr. Wilensky has an in-depth understanding of the
planning process needed to implement local projects, and has proven success at building
consensus between local, state and federal stakeholders to resolve differences and achieve
project goals. Mr. Wilensky has owned and operated a farm in Calaveras County since 1986.
As a successful business owner, he understands the principals of operating an agricultural
enterprise and making decisions to ensure long-term stability and success.
Alan Leavitt. Mr. Leavitt is a member of the CHIPS Board of Directors. He is a California-
registered civil engineer with 30 years of experience designing and managing construction and
environmental projects in Northern California. Mr. Leavitt has served as principal engineer,
chief financial officer, and managing member of several highly successful enterprises,
including environmental consulting firms and a brownfields development company. He has a
long-standing interest in sustainable forest management, beginning with his service as a Peace
Corps volunteer in Central America, where Mr. Leavitt managed a local work force to
implement forest restoration and soil conservation projects. For the past decade, Mr. Leavitt
has owned and managed hardwood rangeland in Calaveras County, where he is committed to
applying the principals of sustainable forestry and restoration with native plant species.
Rick Torgerson. Mr. Torgerson is a member of CHIPS Board of Directors and is a local
business owner in Calaveras County. He has a solid background in business, finance, and real
estate. He owns and manages a local publishing company, and is committed to the economic
development of the Blue Mountain area.
Rick Breeze-Martin. Mr. Breeze-Martin is a CHIPS consultant. He provides a wide range of
services to communities and organizations, including strategic planning, economic and
community development projects, business planning, project design, and employee training.
Mr. Martin’s public service positions include serving as executive director of Amador-
Tuolumne Community Action Agency, serving as a director of the Central Sierra Watershed
Coalition, planning commissioner for Tuolumne County, and other civic organizations.
Updated Feasibility Study for the Wilseyville Product Yard 99
TSS Consultants

APPENDIX E – PHOENIX ENERGY TECHNOLOGY
OVERVIEW
Updated Feasibility Study for the Wilseyville Product Yard
TSS Consultants
100
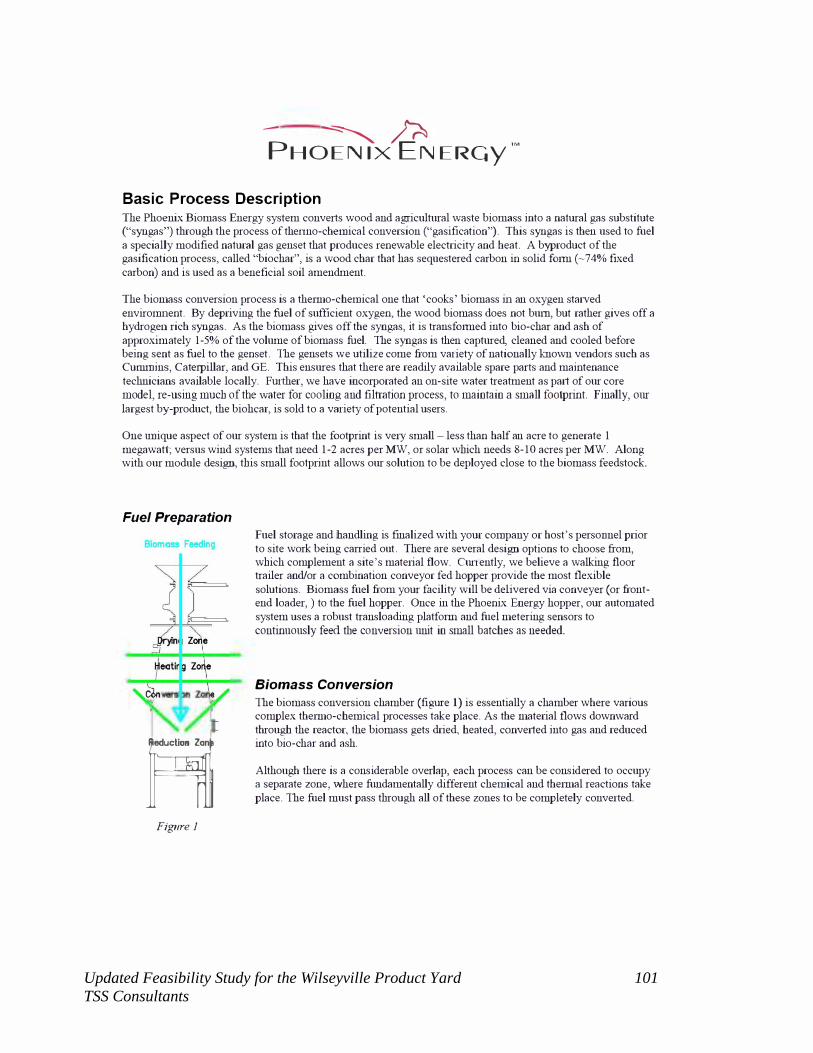
Updated Feasibility Study for the Wilseyville Product Yard 101
TSS Consultants
- il PHOENIX ENER4y
1M
Basic Process Description The Phoenix Biomass Energy system converts wood and agricultural waste biomass into a natural gas substitute ("syngas") through the process of thenno-chemical conversion ("gasification"). This syngas is then used to fuel a specially modified natural gas genset that produces renewable electricity and heat. A byproduct of the gasification process, called "biochar", is a wood char that has sequestered carbon in solid f01m (-74% fixed carbon) and is used as a beneficial soil amendment.
The biomass conversion process is a the1mo-chemical one that 'cooks' biomass in an oxygen staived enviromnent. By depriving the fuel of sufficient oxygen, the wood biomass does not bum, but rather gives off a hydrogen rich syngas. As the biomass gives off the syngas, it is transfo1med into bio-char and ash of approximately 1-5% of the volume of biomass fuel. The syngas is then captured, cleaned and cooled before being sent as fuel to the genset. The gensets we utilize come from vai·iety of nationally known vendors such as Cummins, Caterpillar, and GE. This ensures that there are readily available spare parts and maintenance technicians available locally. Fllliher, we have incorporated an on-site water treatment as paii of our core model, re-using much of the water for cooling and filtrntion process, to maintain a small footprint. Finally, our largest by-product, the biohcai·, is sold to a vai·iety of potential users.
One tmique aspect of our system is that the footprint is ve1y small - less than half an acre to generate 1 megawatt; versus wind systems that need 1-2 acres per MW, or solar which needs 8-10 acres per MW. Along with our module design, this small footprint allows our solution to be deployed close to the biomass feedstock.
Fuel Preparation
Con e
r 1 Figure 1
Fuel storage and handling is finalized with your company or host's personnel prior to site work being carried out. There are several design options to choose from, which complement a site's mate1ial flow. Currently, we believe a walking floor trailer and/or a combination conveyor fed hopper provide the most flexible solutions. Biomass fuel from your facility will be dehvered via conveyer (or frontend loader, ) to the fuel hopper. Once in the Phoenix Energy hopper, our automated system uses a robust transloading platfo1m and fuel metering sensors to continuously feed the conversion unit in small batches as needed.
Biomass Conversion
The biomass conversion chamber (figlll·e I) is essentially a chamber where various complex the1mo-chemical processes take place. As the material flows downwai·d through the reactor, the biomass gets dried, heated, conve1ied into gas and reduced into bio-char and ash.
Although there is a considerable overlap, each process can be considered to occupy a separate zone, where fundamentally different chemical and the1mal reactions take place. The fuel must pass through all of these zones to be completely conve1ied.

Updated Feasibility Study for the Wilseyville Product Yard 102
TSS Consultants
The downdraft conversion unit, employed by Phoenix Energy, is under negative air drawn by a high-pressure blower. The essential characteristic of the downdraft design is that the tars given off in the heating zone are
drawn through the conversion zone, where they will be broken down or oxidized. When this happens, the energy they contain is usefully recovered with the rnixture of gases in the exit stream being relatively clean, and ready for further processing. Expected total gas contaminant concentration prior to filtration is up to 100 times
lower than what is often seen in updraft and fluid-bed systems.
Gas Cleansing
After the syngas has been extracted from the conversion chamber it is cooled and cleaned by a series of scmbbers and filters. First, the gas passes through a
venturi sciubber, which is known to remove particulate in the sub-micrometer range. The gas is then passed
through a series of four filters. The first is a coarse filter to coalesce residual liquids. The second is a rejuvenating active sawdust filter, the third is a similar
passive filter, and the fomth is a fabric bag filter. The filter media are sawdust and biomass chips so instead
of using expensive synthetic filters that need to be thrown away, the used filter media can be simply placed back into the fuel hopper and consumed.
Figure 2 - The P2 50 biomass conversion chamber (red) andfilte,ing system (blue)
Power Generation
Phoenix Energy units are based on a spark-ignited engine genset. Depending on the size chosen, the engines are
capable of providing 500 or 1,000KW operating on syngas. Phoenix Energy will customize the selected genset to allow syngas carburetion for this engine and provide standard paralleling switchgear for electrical output.
At present we believe the CAT 3516 or the Cummins 1710 offer the most
attractive engine options for yolu- fnm, however we c.an work with any natural
gas genset. First and foremost there is a large secondary market for CAT and Cunnnins engines and the service
coverage in the US is very good. These engines also have unique
featlu-es enabling good fuel economy, better emissions, high durability, and extended oil / filter change periods.
They nlll on variety of gaseous fuels like narural gas, b io-gas, sewage gas,
LPG etc. Engines are available in both types of aspirations, narurally aspirated and rurbocharged, after-cooled
Figure 3 -A P500 installation in California

Updated Feasibility Study for the Wilseyville Product Yard 103
TSS Consultants
versions. Both CAT and Cummins engines have been designed to combine compact size, low emission levels and excellent perfonnance characteristics of high-speed technology with the medium speed benefits ofwatercooled exhaust valve seats, steel-crown pistons & combustion control.
Bio-char & ash handling, and Low Water usage
Bio-char & ash are removed from the conversion chamber using a dry extraction process designed around a water cooled auger at the base of the gasifier. Scrubbed paiticulate in the fonn of ash is extracted at the base of the cyclone. A closed water loop is used for both cooling and process water. On-site water treatment, utilizing biochar and sand filters allows for recirculation of both water loops reducing water usage to a minimum. In fact, at certain times of the year the system is actually water accretive as moisture is removed from the biomass and captured in the process water loop. Water levels are maintained in separate storage tanks for each loop and pumped through both the cooling and filtration process. The automated filter is typical for river sludge treatment and separates the solids from the re-circulated water. The biochar , is a "capture & store" byproduct that is separated out, using a special mechanical separator, for resale as a soil amendment or ADC, sequestering cai·bon in solid form while in the ground for up to 1,000 years! While we don't include these biochai· sales in our conservative base fmancial forecast, we do believe that carbon credits related to biochar may become a valuable revenue source in the near future. Water leaving the filter is passed through a final stationary filter prior to heat exchange. The scrubbing water is absorbing heat from the syngas and must be cooled in a cooling tower prior to retuming to the closed-loop scrnbber.
APPENDIX F – LABOR FORCE DATA
Feasibility Study for the Wilseyville Product Yard 104 TSS Consultants
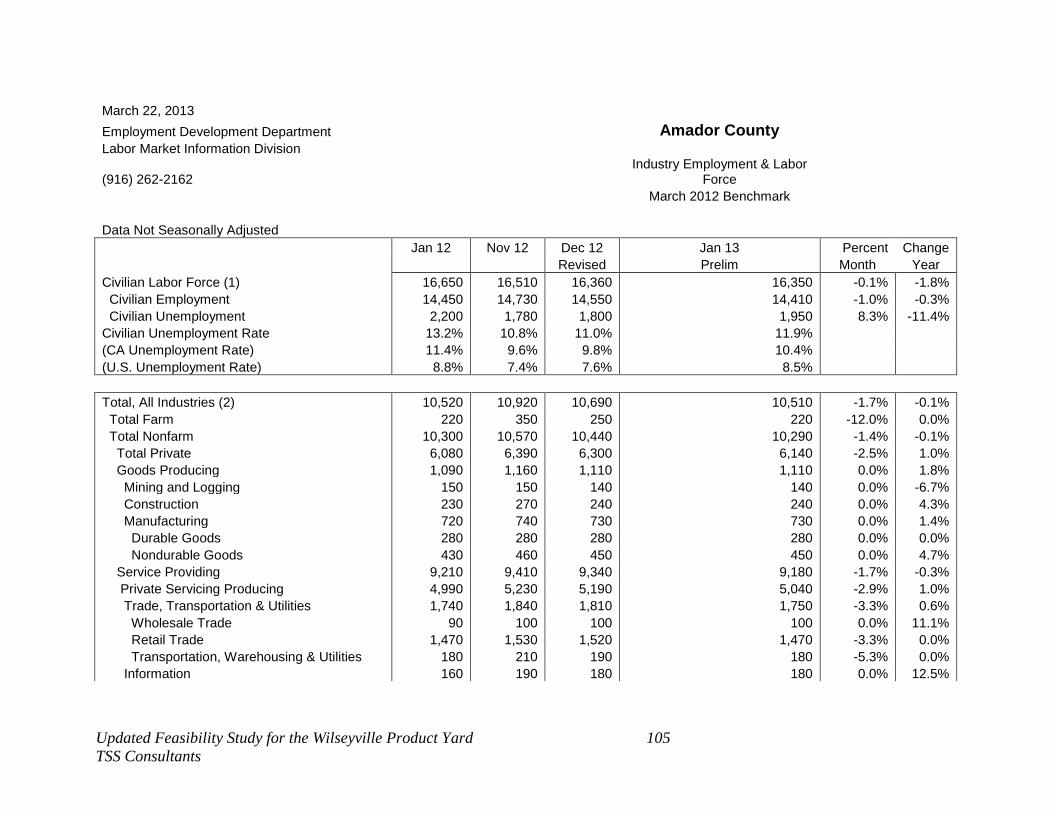
March 22, 2013
Employment Development Department
Labor Market Information Division
(916) 262-2162
Amador County
Industry Employment & Labor Force
March 2012 Benchmark
Data Not Seasonally Adjusted
Civilian Labor Force (1) 16,650 16,510 16,360 16,350 -0.1% -1.8%
Civilian Employment 14,450 14,730 14,550 14,410 -1.0% -0.3%
Civilian Unemployment 2,200 1,780 1,800 1,950 8.3% -11.4%
Civilian Unemployment Rate 13.2% 10.8% 11.0% 11.9%
(CA Unemployment Rate) 11.4% 9.6% 9.8% 10.4%
(U.S. Unemployment Rate) 8.8% 7.4% 7.6% 8.5%
Jan 12 Nov 12 Dec 12
Revised
Jan 13
Prelim
Percent
Month
Change
Year
Total, All Industries (2) 10,520 10,920 10,690 10,510 -1.7% -0.1%
Total Farm 220 350 250 220 -12.0% 0.0%
Total Nonfarm 10,300 10,570 10,440 10,290 -1.4% -0.1%
Total Private 6,080 6,390 6,300 6,140 -2.5% 1.0%
Goods Producing 1,090 1,160 1,110 1,110 0.0% 1.8%
Mining and Logging 150 150 140 140 0.0% -6.7%
Construction 230 270 240 240 0.0% 4.3%
Manufacturing 720 740 730 730 0.0% 1.4%
Durable Goods 280 280 280 280 0.0% 0.0%
Nondurable Goods 430 460 450 450 0.0% 4.7%
Service Providing 9,210 9,410 9,340 9,180 -1.7% -0.3%
Private Servicing Producing 4,990 5,230 5,190 5,040 -2.9% 1.0%
Trade, Transportation & Utilities 1,740 1,840 1,810 1,750 -3.3% 0.6%
Wholesale Trade 90 100 100 100 0.0% 11.1%
Retail Trade 1,470 1,530 1,520 1,470 -3.3% 0.0%
Transportation, Warehousing & Utilities 180 210 190 180 -5.3% 0.0%
Information 160 190 180 180 0.0% 12.5%
Updated Feasibility Study for the Wilseyville Product Yard 105
TSS Consultants

Financial Activities 270 280 270 260 -3.7% -3.7%
Professional & Business Services 440 430 420 420 0.0% -4.5%
Educational & Health Services 1,320 1,260 1,270 1,260 -0.8% -4.5%
Leisure & Hospitality 870 1,020 1,010 930 -7.9% 6.9%
Other Services 200 220 230 230 0.0% 15.0%
Government 4,220 4,180 4,150 4,150 0.0% -1.7%
Federal Government 80 100 80 90 12.5% 12.5%
State & Local Government 4,140 4,090 4,070 4,050 -0.5% -2.2%
State Government 1,500 1,410 1,390 1,390 0.0% -7.3%
Local Government 2,640 2,670 2,670 2,670 0.0% 1.1%
Updated Feasibility Study for the Wilseyville Product Yard 106
TSS Consultants
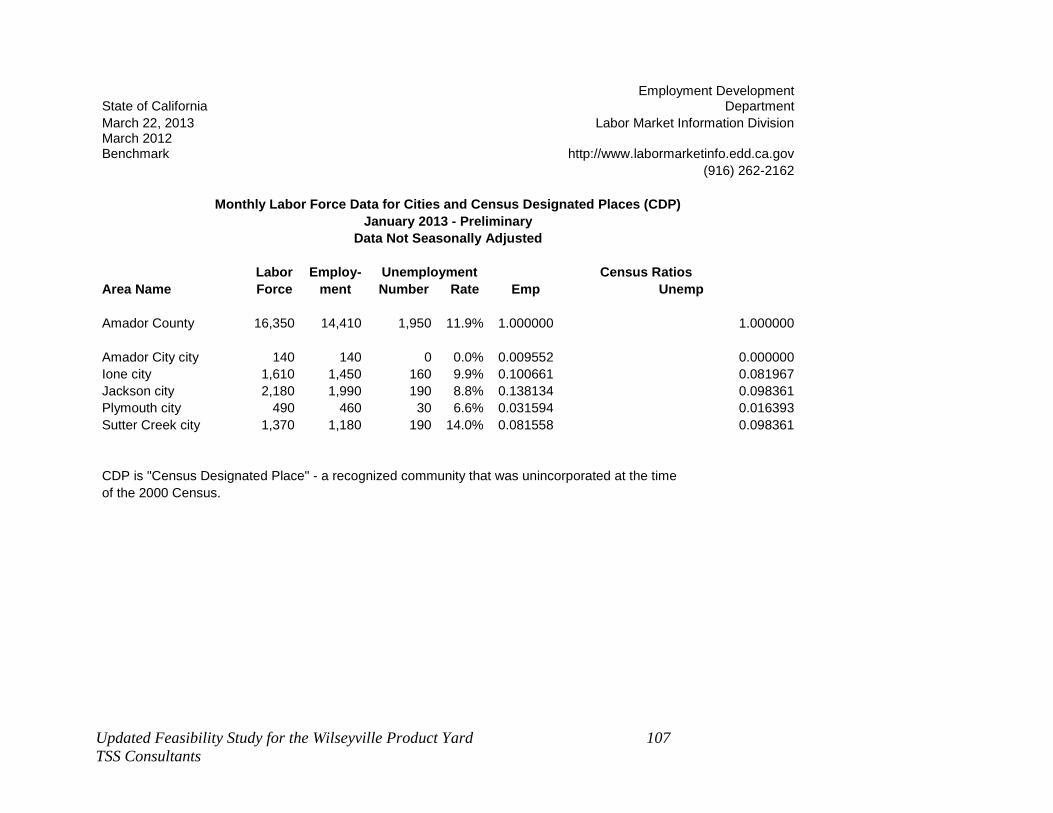
State of California
March 22, 2013 March 2012 Benchmark
Employment Development Department
Labor Market Information Division
http://www.labormarketinfo.edd.ca.gov
(916) 262-2162
Monthly Labor Force Data for Cities and Census Designated Places (CDP)
January 2013 - Preliminary
Data Not Seasonally Adjusted
Labor
Force
Employ-
ment
Unemployment Census Ratios
Unemp Area Name Number Rate Emp
Amador County 16,350 14,410 1,950 11.9% 1.000000 1.000000
Amador City city 140 140 0 0.0% 0.009552 0.000000
Ione city 1,610 1,450 160 9.9% 0.100661 0.081967
Jackson city 2,180 1,990 190 8.8% 0.138134 0.098361
Plymouth city 490 460 30 6.6% 0.031594 0.016393
Sutter Creek city 1,370 1,180 190 14.0% 0.081558 0.098361
CDP is "Census Designated Place" - a recognized community that was unincorporated at the time
of the 2000 Census.
Updated Feasibility Study for the Wilseyville Product Yard 107
TSS Consultants

March 22, 2013
Employment Development Department
Labor Market Information Division
(916) 262-2162
Calaveras County
Industry Employment & Labor Force
March 2012 Benchmark
Data Not Seasonally Adjusted
Civilian Labor Force (1) 19,240 19,070 19,060 18,960 -0.5% -1.5%
Civilian Employment 16,380 16,820 16,750 16,460 -1.7% 0.5%
Civilian Unemployment 2,860 2,240 2,310 2,500 8.2% -12.6%
Civilian Unemployment Rate 14.9% 11.8% 12.1% 13.2%
(CA Unemployment Rate) 11.4% 9.6% 9.8% 10.4%
(U.S. Unemployment Rate) 8.8% 7.4% 7.6% 8.5%
Jan 12 Nov 12 Dec 12
Revised
Jan 13
Prelim
Percent
Month
Change
Year
Total, All Industries (2) 7,150 7,510 7,460 7,230 -3.1% 1.1%
Total Farm 60 70 70 70 0.0% 16.7%
Total Nonfarm 7,090 7,440 7,390 7,160 -3.1% 1.0%
Total Private 4,780 5,040 4,980 4,780 -4.0% 0.0%
Goods Producing 820 920 880 800 -9.1% -2.4%
Mining, Logging and Construction 530 620 580 520 -10.3% -1.9%
Manufacturing 290 300 300 290 -3.3% 0.0%
Durable Goods 150 150 160 150 -6.3% 0.0%
Nondurable Goods 130 150 140 140 0.0% 7.7%
Service Providing 6,270 6,520 6,510 6,360 -2.3% 1.4%
Private Servicing Producing 3,960 4,120 4,100 3,980 -2.9% 0.5%
Trade, Transportation & Utilities 1,230 1,220 1,260 1,210 -4.0% -1.6%
Wholesale Trade 110 100 110 100 -9.1% -9.1%
Retail Trade 860 880 880 850 -3.4% -1.2%
Transportation, Warehousing & Utilities 250 240 270 250 -7.4% 0.0%
Information 110 100 110 110 0.0% 0.0%
Financial Activities 240 240 240 240 0.0% 0.0%
Professional & Business Services 350 340 340 350 2.9% 0.0%
Updated Feasibility Study for the Wilseyville Product Yard 108
TSS Consultants
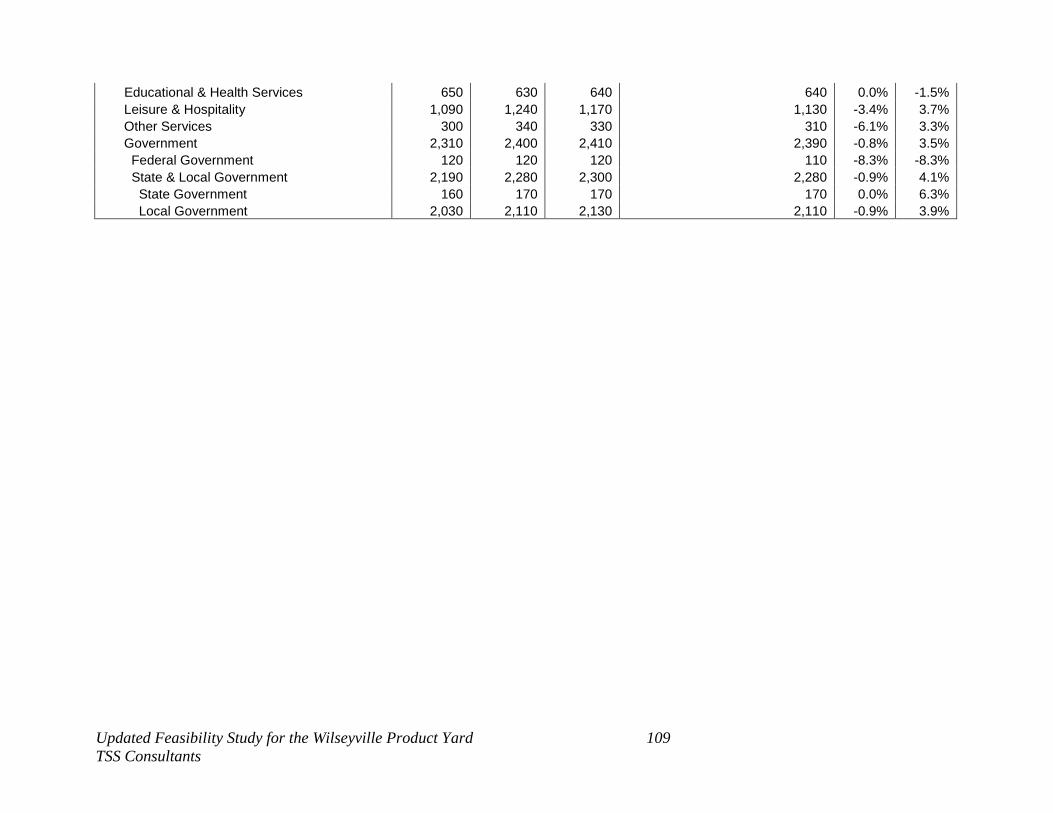
Educational & Health Services 650 630 640 640 0.0% -1.5%
Leisure & Hospitality 1,090 1,240 1,170 1,130 -3.4% 3.7%
Other Services 300 340 330 310 -6.1% 3.3%
Government 2,310 2,400 2,410 2,390 -0.8% 3.5%
Federal Government 120 120 120 110 -8.3% -8.3%
State & Local Government 2,190 2,280 2,300 2,280 -0.9% 4.1%
State Government 160 170 170 170 0.0% 6.3%
Local Government 2,030 2,110 2,130 2,110 -0.9% 3.9%
Updated Feasibility Study for the Wilseyville Product Yard 109
TSS Consultants
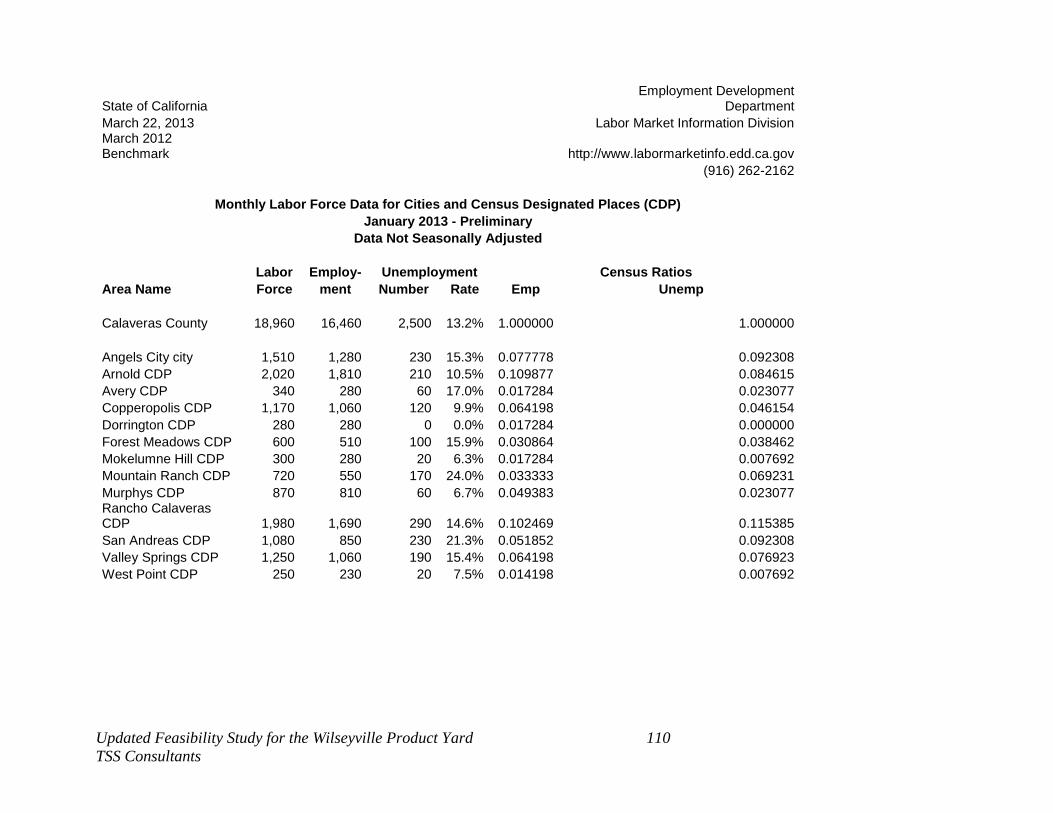
State of California
March 22, 2013 March 2012 Benchmark
Employment Development Department
Labor Market Information Division
http://www.labormarketinfo.edd.ca.gov
(916) 262-2162
Monthly Labor Force Data for Cities and Census Designated Places (CDP)
January 2013 - Preliminary
Data Not Seasonally Adjusted
Labor
Force
Employ-
ment
Unemployment Census Ratios
Unemp Area Name Number Rate Emp
Calaveras County 18,960 16,460 2,500 13.2% 1.000000 1.000000
Angels City city 1,510 1,280 230 15.3% 0.077778 0.092308
Arnold CDP 2,020 1,810 210 10.5% 0.109877 0.084615
Avery CDP 340 280 60 17.0% 0.017284 0.023077
Copperopolis CDP 1,170 1,060 120 9.9% 0.064198 0.046154
Dorrington CDP 280 280 0 0.0% 0.017284 0.000000
Forest Meadows CDP 600 510 100 15.9% 0.030864 0.038462
Mokelumne Hill CDP 300 280 20 6.3% 0.017284 0.007692
Mountain Ranch CDP 720 550 170 24.0% 0.033333 0.069231
Murphys CDP 870 810 60 6.7% 0.049383 0.023077 Rancho Calaveras CDP 1,980 1,690 290 14.6% 0.102469 0.115385
San Andreas CDP 1,080 850 230 21.3% 0.051852 0.092308
Valley Springs CDP 1,250 1,060 190 15.4% 0.064198 0.076923
West Point CDP 250 230 20 7.5% 0.014198 0.007692
Updated Feasibility Study for the Wilseyville Product Yard 110
TSS Consultants