Embed Size (px)
Citation preview
1
Update on Science Advisory Team Evaluation Methods for the
MLPA South Coast Study Region
Presented to the MLPA South Coast Regional Stakeholder GroupJanuary 13, 2009 • San Diego, CA
Prepared byDr. Mark Carr – University of California, Santa Cruz
on behalf of the MLPA Master Plan Science Advisory Team
Science Guidelines and Evaluations
Guidelines are designed to ensure that marine protected area (MPA) networks achieve the goals of the act
SAT evaluations provide feedback about how well proposals meet the guidelines
2
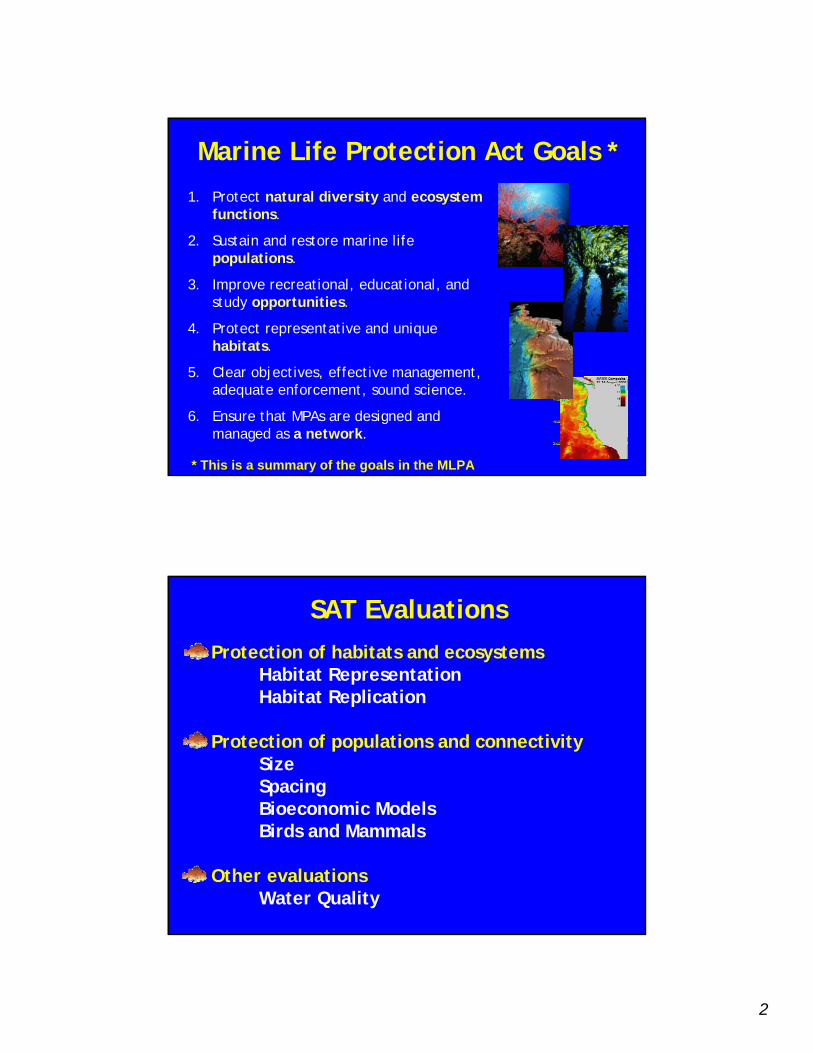
Marine Life Protection Act Goals *1. Protect natural diversity and ecosystem
functions.
2. Sustain and restore marine lifepopulations.
3. Improve recreational, educational, and study opportunities.
4. Protect representative and unique habitats.
5. Clear objectives, effective management, adequate enforcement, sound science.
6. Ensure that MPAs are designed and managed as a network.
* This is a summary of the goals in the MLPA
SAT EvaluationsProtection of habitats and ecosystems
Habitat RepresentationHabitat Replication
Protection of populations and connectivitySizeSpacingBioeconomic ModelsBirds and Mammals
Other evaluationsWater Quality
3
Laying the Basis for SAT Evaluations
Understanding the environmental and geographic gradients in the study region –SAT defined bioregions
Understanding how extractive activities impact ecosystems – SAT defined levels of protection
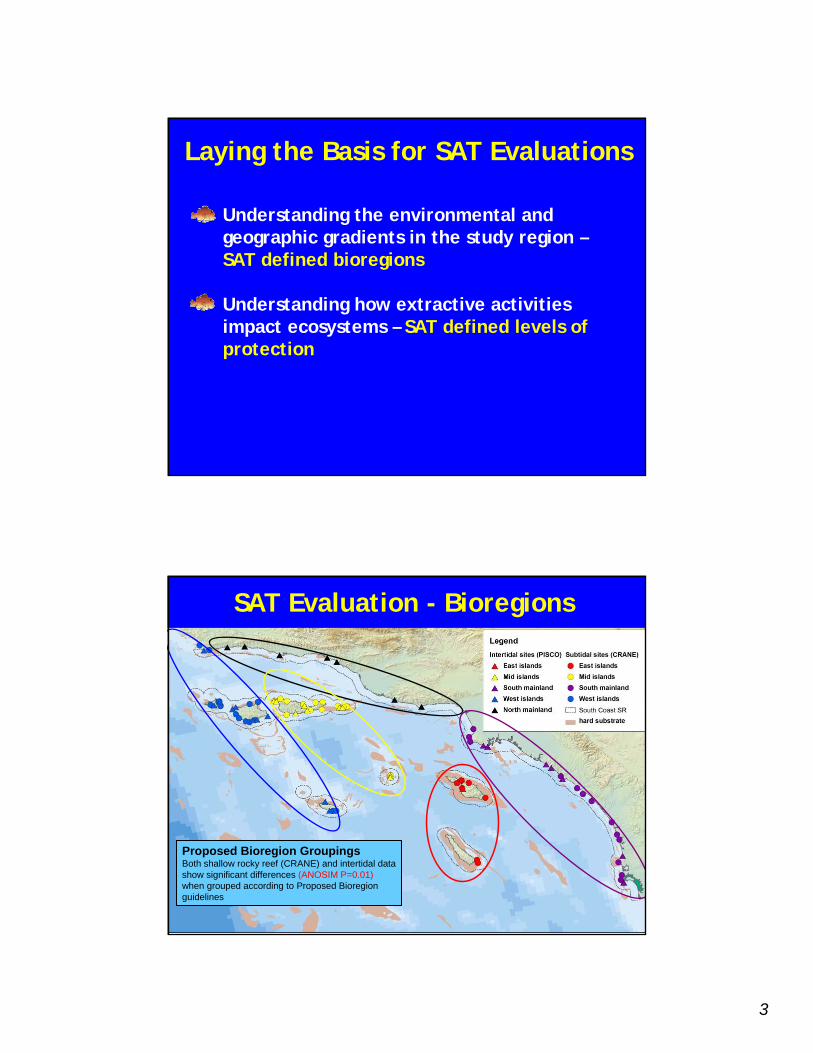
Proposed Bioregion GroupingsBoth shallow rocky reef (CRANE) and intertidal datashow significant differences (ANOSIM P=0.01)when grouped according to Proposed Bioregion guidelines
SAT Evaluation - Bioregions
4
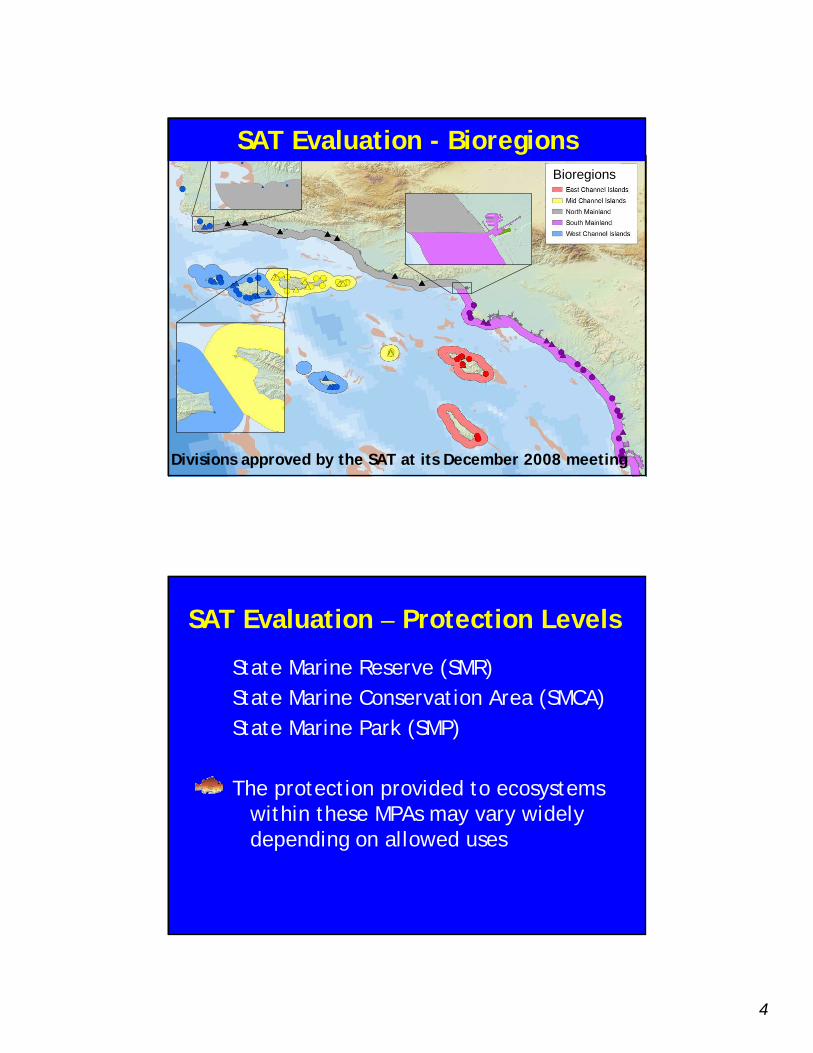
Bioregions
SAT-approved bioregionsSAT Evaluation - Bioregions
Divisions approved by the SAT at its December 2008 meeting
SAT Evaluation – Protection Levels
State Marine Reserve (SMR) State Marine Conservation Area (SMCA)State Marine Park (SMP)
The protection provided to ecosystems within these MPAs may vary widely depending on allowed uses
5
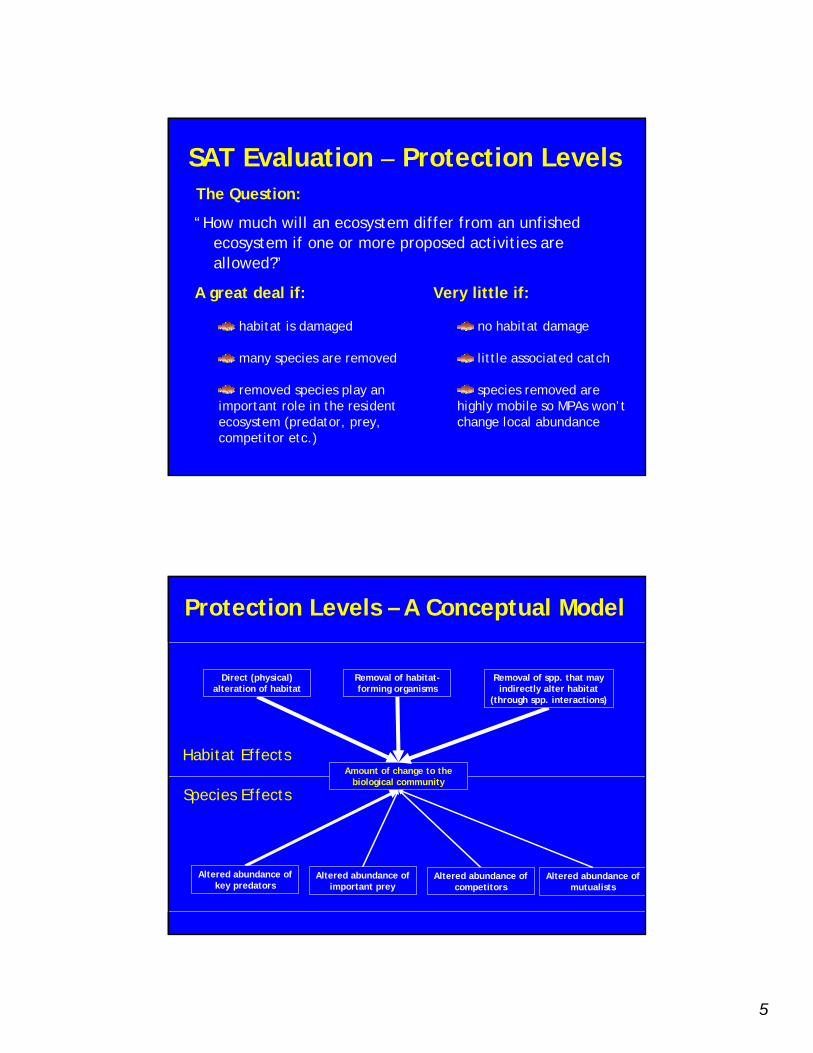
“How much will an ecosystem differ from an unfished ecosystem if one or more proposed activities are allowed?”
The Question:
A great deal if:
habitat is damaged
many species are removed
removed species play an important role in the resident ecosystem (predator, prey, competitor etc.)
Very little if:
no habitat damage
little associated catch
species removed are highly mobile so MPAs won’t change local abundance
SAT Evaluation – Protection Levels
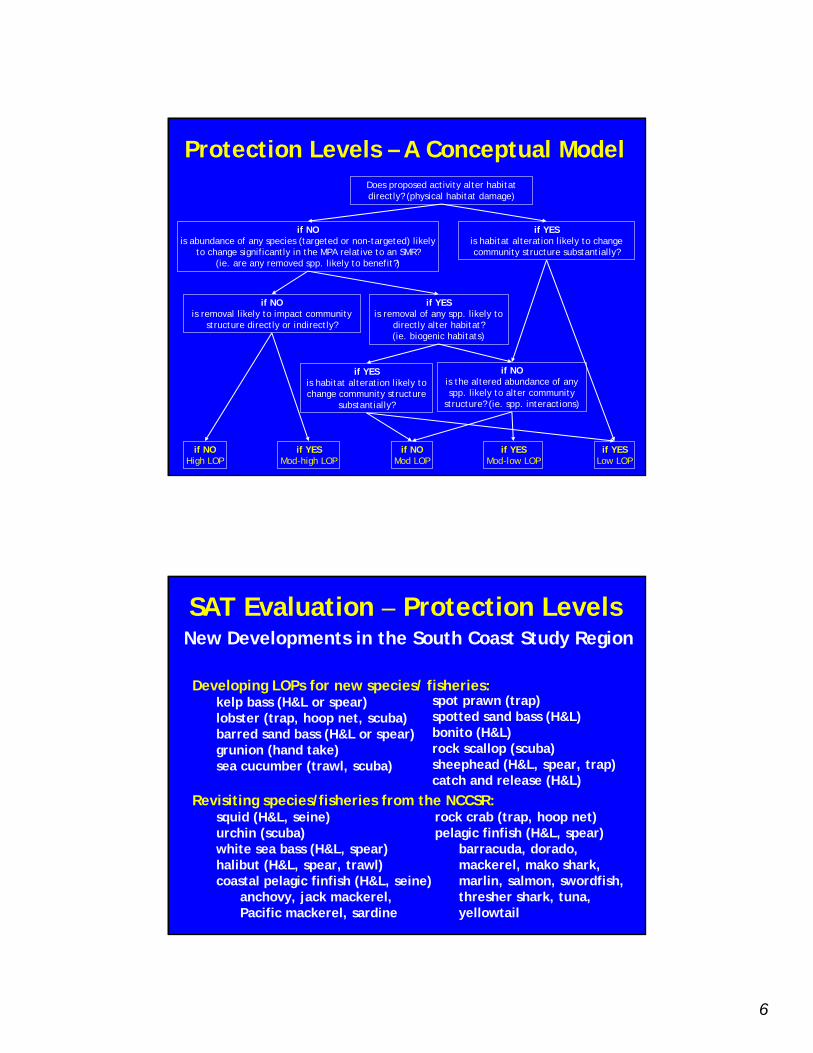
Protection Levels – A Conceptual Model
Amount of change to the biological community
Direct (physical) alteration of habitat
Removal of habitat-forming organisms
Altered abundance of key predators
Altered abundance of important prey
Altered abundance of competitors
Removal of spp. that may indirectly alter habitat
(through spp. interactions)
Altered abundance of mutualists
Habitat Effects
Species Effects
6
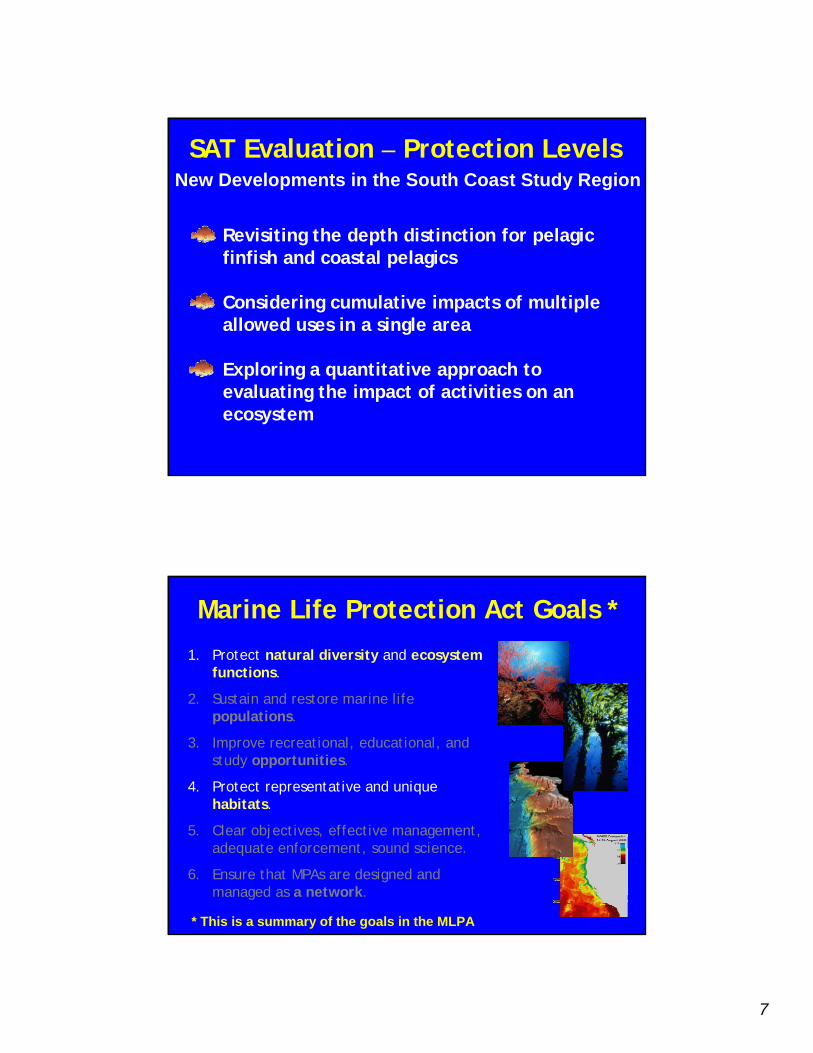
if NOis abundance of any species (targeted or non-targeted) likely
to change significantly in the MPA relative to an SMR? (ie. are any removed spp. likely to benefit?)
if NOis removal likely to impact community
structure directly or indirectly?
if NOHigh LOP
if YESMod-high LOP
if YESis removal of any spp. likely to
directly alter habitat? (ie. biogenic habitats)
if YESis habitat alteration likely to change community structure
substantially?
if YESLow LOP
if NOMod LOP
if NOis the altered abundance of any spp. likely to alter community
structure? (ie. spp. interactions)
if YESMod-low LOP
Does proposed activity alter habitat directly? (physical habitat damage)
if YESis habitat alteration likely to change community structure substantially?
Protection Levels – A Conceptual Model
SAT Evaluation – Protection Levels
Developing LOPs for new species/ fisheries:kelp bass (H&L or spear)lobster (trap, hoop net, scuba)barred sand bass (H&L or spear)grunion (hand take)sea cucumber (trawl, scuba)
Revisiting species/fisheries from the NCCSR:squid (H&L, seine)urchin (scuba)white sea bass (H&L, spear)halibut (H&L, spear, trawl)coastal pelagic finfish (H&L, seine)
anchovy, jack mackerel, Pacific mackerel, sardine
spot prawn (trap)spotted sand bass (H&L)bonito (H&L)rock scallop (scuba)sheephead (H&L, spear, trap)catch and release (H&L)
rock crab (trap, hoop net)pelagic finfish (H&L, spear)
barracuda, dorado, mackerel, mako shark, marlin, salmon, swordfish, thresher shark, tuna, yellowtail
New Developments in the South Coast Study Region
7
SAT Evaluation – Protection LevelsNew Developments in the South Coast Study Region
Revisiting the depth distinction for pelagic finfish and coastal pelagics
Considering cumulative impacts of multiple allowed uses in a single area
Exploring a quantitative approach to evaluating the impact of activities on an ecosystem
Marine Life Protection Act Goals *1. Protect natural diversity and ecosystem
functions.
2. Sustain and restore marine lifepopulations.
3. Improve recreational, educational, and study opportunities.
4. Protect representative and unique habitats.
5. Clear objectives, effective management, adequate enforcement, sound science.
6. Ensure that MPAs are designed and managed as a network.
* This is a summary of the goals in the MLPA
8
Master Plan Guidance forHabitat Representation
Every ‘key’ marine habitat should be represented in the MPA network to protect the diversity of species that live in different habitats and those that move among different habitats over their lifetime.
‘Key’ marine habitats should be replicated in multiple MPAs across large environmental and geographic gradients to protect the greater diversity of species and communities that occur across such gradients, and to protect species from local year-to-year fluctuations in larval production and recruitment.
Seafloor Habitats
•Intertidal zones•Rocky reefs•Sandy or soft ocean bottoms•Underwater pinnacles•Submarine canyons
Biogenic Habitats
•Kelp forests•Seagrass beds
Oceanographic Habitats
•Upwelling areas•Freshwater plumes•Retention zones
Depth Zones
• Intertidal• Intertidal to 30 m• 30 to 100 m • 100 to 200 m• 200 m and deeper
Key Marine Habitats
9
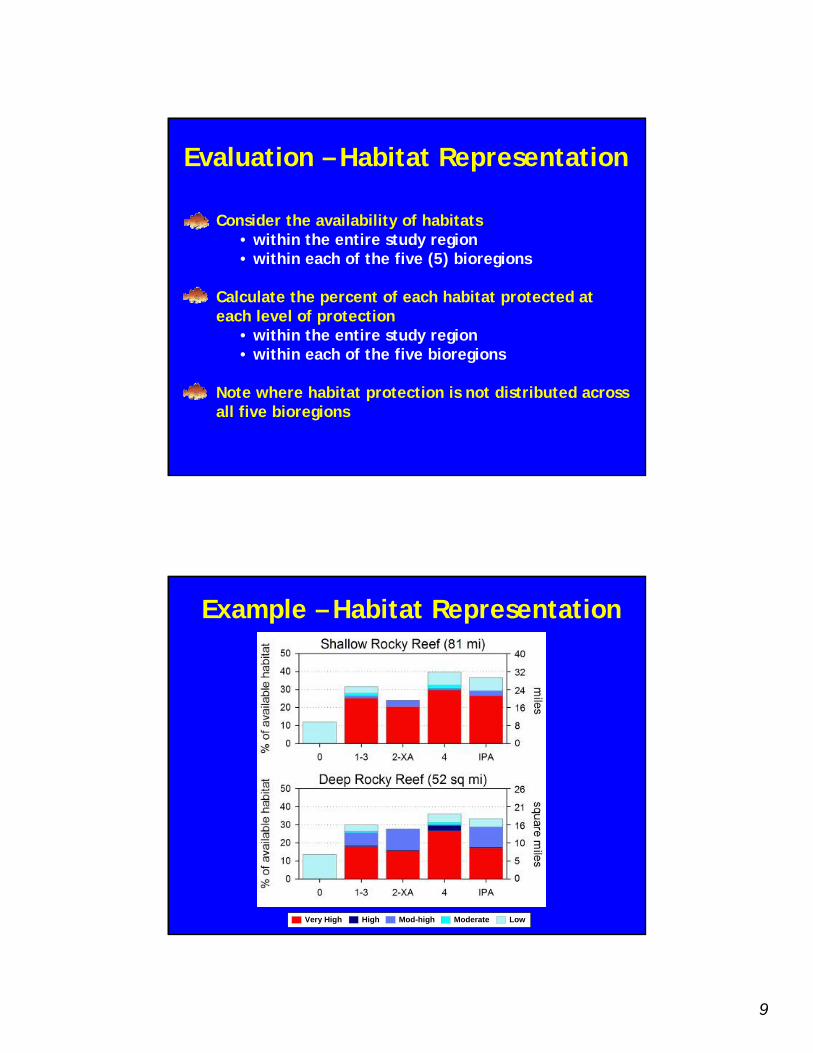
Evaluation – Habitat Representation
Consider the availability of habitats• within the entire study region• within each of the five (5) bioregions
Calculate the percent of each habitat protected at each level of protection
• within the entire study region• within each of the five bioregions
Note where habitat protection is not distributed across all five bioregions
Example – Habitat Representation
Very High High Mod-high Moderate Low
10
Evaluation – Habitat RepresentationNew Developments in the South Coast Study Region
Reviewing GIS habitat layers to assess their limitations
Considering methods for evaluating representation of unique habitats
Unique habitats under consideration by the SAToil seeps elk kelp bedshydrothermal vents hydrocoral beds
Master Plan Guidance forHabitat Replication
"Key" marine habitats should be replicated in multiple MPAs across large environmental and geographic gradients to protect the greater diversity of species and communities that occur across such gradients, and to protect species from local year-to-year fluctuations in larval production and recruitment.
At least three to five replicate MPAs should be designed for each habitat type within a biogeographical region to provide analytical power for management comparisons and to buffer against catastrophic loss of an MPA.
11
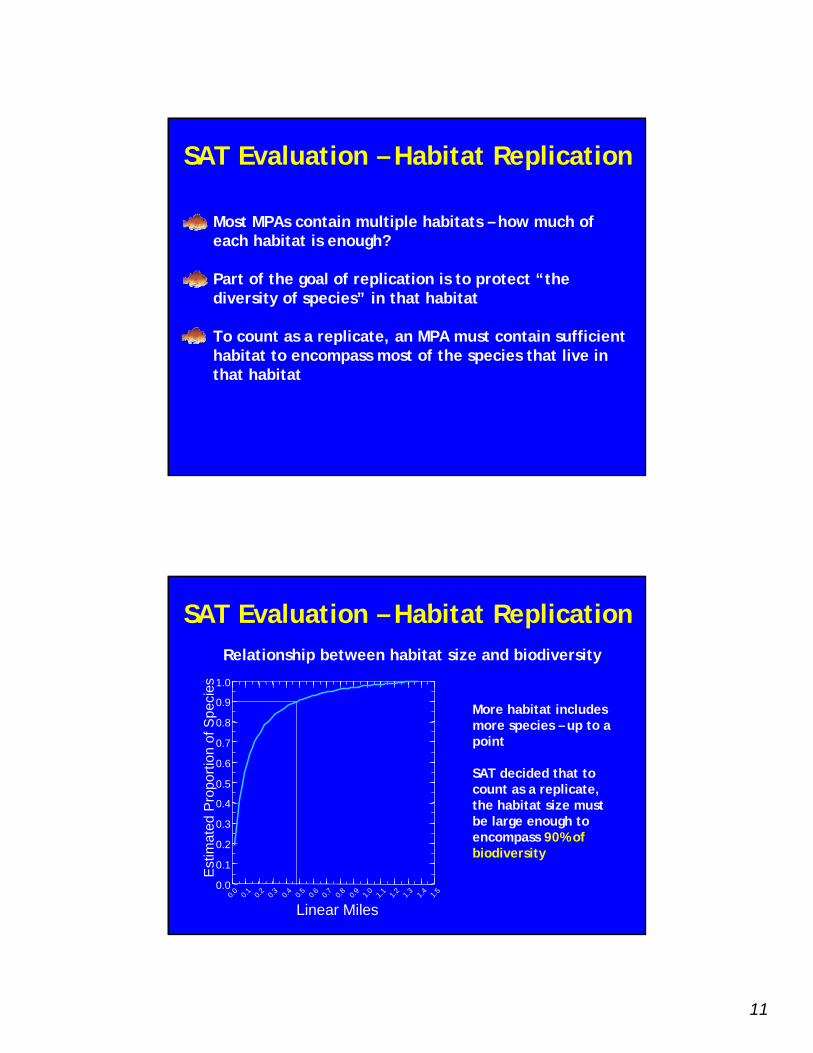
SAT Evaluation – Habitat Replication
Most MPAs contain multiple habitats – how much of each habitat is enough?
Part of the goal of replication is to protect “the diversity of species” in that habitat
To count as a replicate, an MPA must contain sufficient habitat to encompass most of the species that live in that habitat
Relationship between habitat size and biodiversity
More habitat includes more species – up to a point
SAT decided that to count as a replicate, the habitat size must be large enough to encompass 90% of biodiversity
SAT Evaluation – Habitat Replication
0.0 0.1 0.2 0.3 0.4 0.5 0.6 0.7 0.8 0.9 1.0 1.1 1.2 1.3 1.4 1.5
Linear Miles
0.0
0.1
0.2
0.3
0.4
0.5
0.6
0.7
0.8
0.9
1.0
Est
imat
ed P
ropo
rtion
of S
peci
es
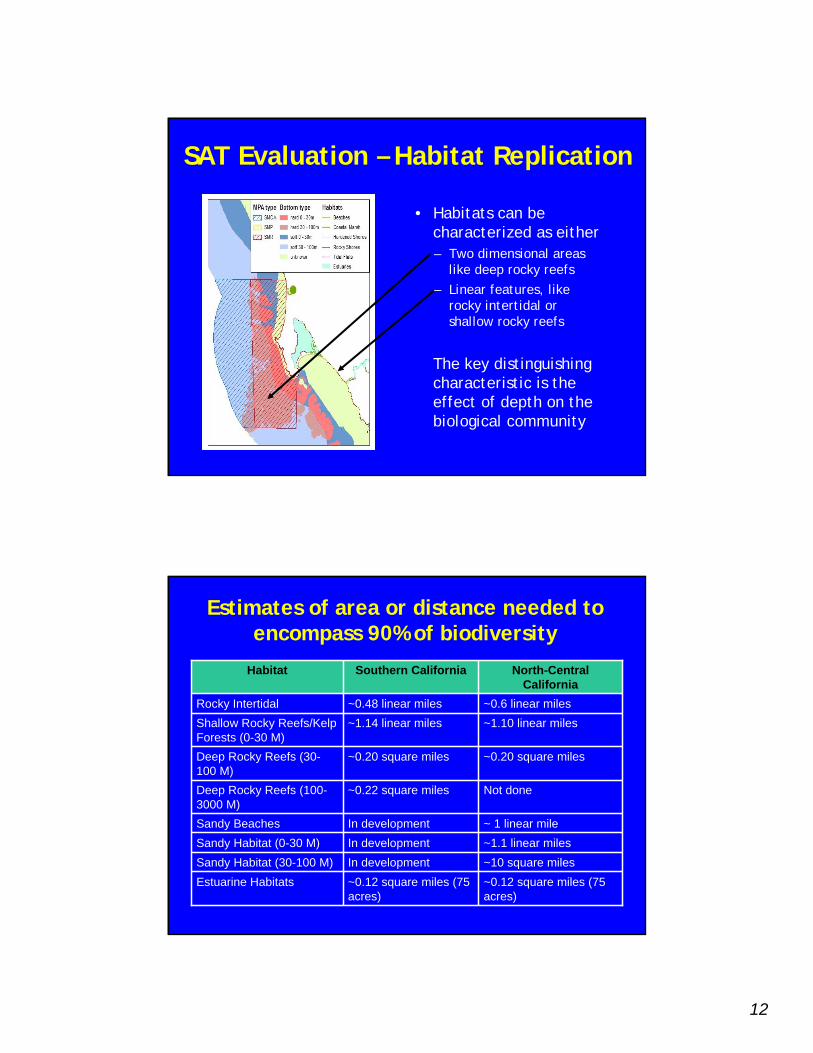
12
• Habitats can be characterized as either– Two dimensional areas
like deep rocky reefs– Linear features, like
rocky intertidal or shallow rocky reefs
The key distinguishing characteristic is the effect of depth on the biological community
SAT Evaluation – Habitat Replication
~ 1 linear mileIn developmentSandy Beaches
~0.12 square miles (75 acres)
~0.12 square miles (75 acres)
Estuarine Habitats
Not done~0.22 square milesDeep Rocky Reefs (100-3000 M)
~0.20 square miles~0.20 square milesDeep Rocky Reefs (30-100 M)
Habitat Southern California North-Central California
Rocky Intertidal ~0.48 linear miles ~0.6 linear milesShallow Rocky Reefs/Kelp Forests (0-30 M)
~1.14 linear miles ~1.10 linear miles
Sandy Habitat (0-30 M) In development ~1.1 linear milesSandy Habitat (30-100 M) In development ~10 square miles
Estimates of area or distance needed to encompass 90% of biodiversity
13
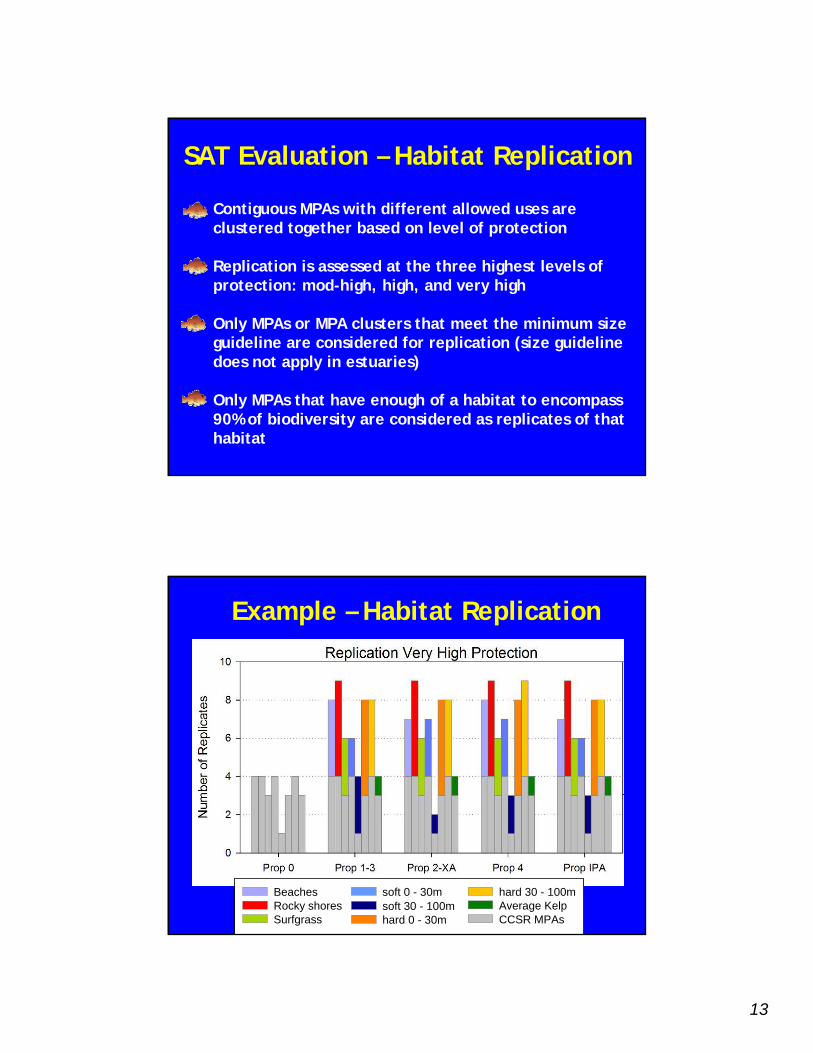
SAT Evaluation – Habitat Replication
Contiguous MPAs with different allowed uses are clustered together based on level of protection
Replication is assessed at the three highest levels of protection: mod-high, high, and very high
Only MPAs or MPA clusters that meet the minimum size guideline are considered for replication (size guideline does not apply in estuaries)
Only MPAs that have enough of a habitat to encompass 90% of biodiversity are considered as replicates of that habitat
Example – Habitat Replication
Beaches Rocky shores Surfgrass
soft 0 - 30m soft 30 - 100m hard 0 - 30m
hard 30 - 100m Average Kelp CCSR MPAs
14
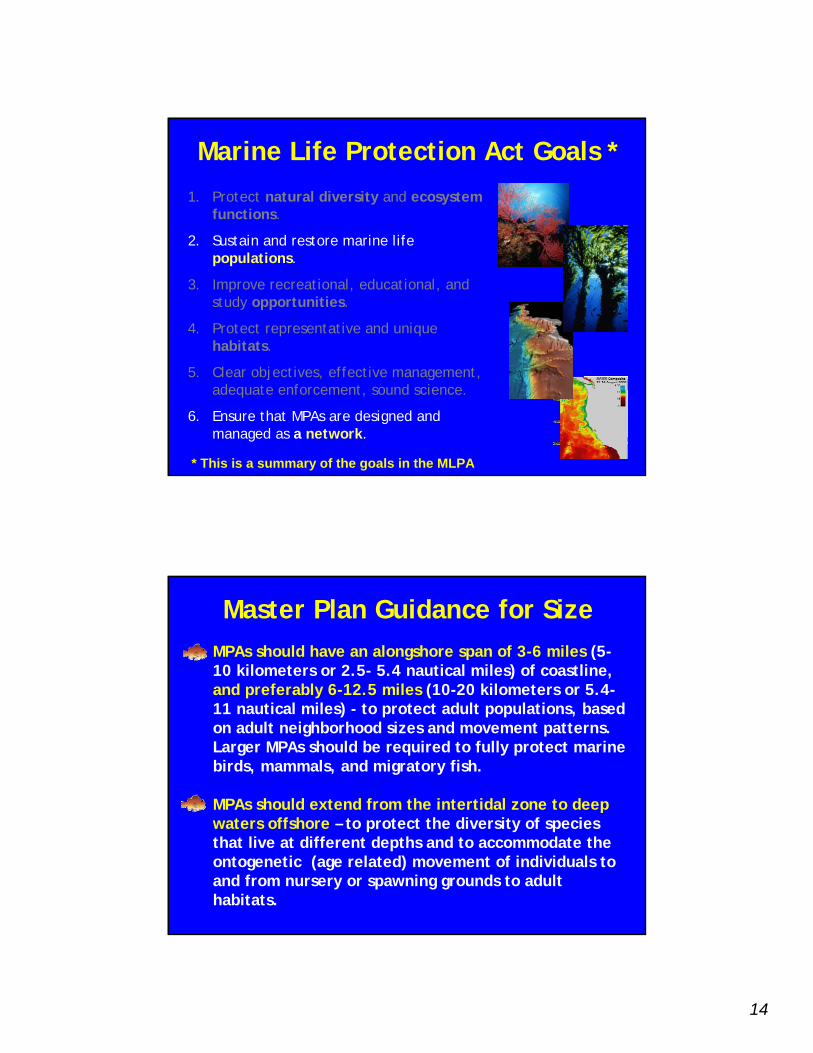
Marine Life Protection Act Goals *1. Protect natural diversity and ecosystem
functions.
2. Sustain and restore marine lifepopulations.
3. Improve recreational, educational, and study opportunities.
4. Protect representative and unique habitats.
5. Clear objectives, effective management, adequate enforcement, sound science.
6. Ensure that MPAs are designed and managed as a network.
* This is a summary of the goals in the MLPA
Master Plan Guidance for SizeMPAs should have an alongshore span of 3-6 miles (5-10 kilometers or 2.5- 5.4 nautical miles) of coastline, and preferably 6-12.5 miles (10-20 kilometers or 5.4-11 nautical miles) - to protect adult populations, based on adult neighborhood sizes and movement patterns. Larger MPAs should be required to fully protect marine birds, mammals, and migratory fish.
MPAs should extend from the intertidal zone to deep waters offshore – to protect the diversity of species that live at different depths and to accommodate the ontogenetic (age related) movement of individuals to and from nursery or spawning grounds to adult habitats.
15
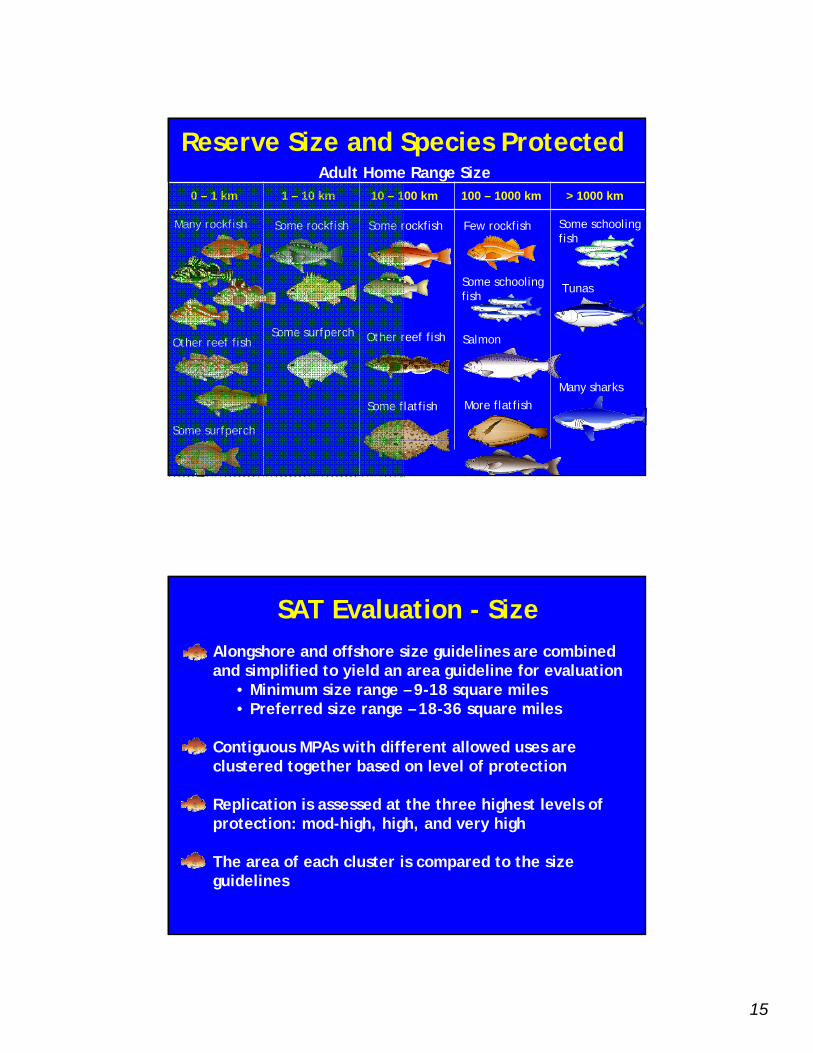
Some schooling fish
0 – 1 km 1 – 10 km 10 – 100 km 100 – 1000 km > 1000 km
Reserve Size and Species Protected
Many rockfish
Other reef fish
Some surfperch
Some surfperch
Some rockfish Some rockfish
Other reef fish
Some flatfish
Few rockfish
Salmon
More flatfish
Some schooling fish
Tunas
Many sharks
Adult Home Range Size
SAT Evaluation - SizeAlongshore and offshore size guidelines are combined and simplified to yield an area guideline for evaluation
• Minimum size range – 9-18 square miles• Preferred size range – 18-36 square miles
Contiguous MPAs with different allowed uses are clustered together based on level of protection
Replication is assessed at the three highest levels of protection: mod-high, high, and very high
The area of each cluster is compared to the size guidelines
16
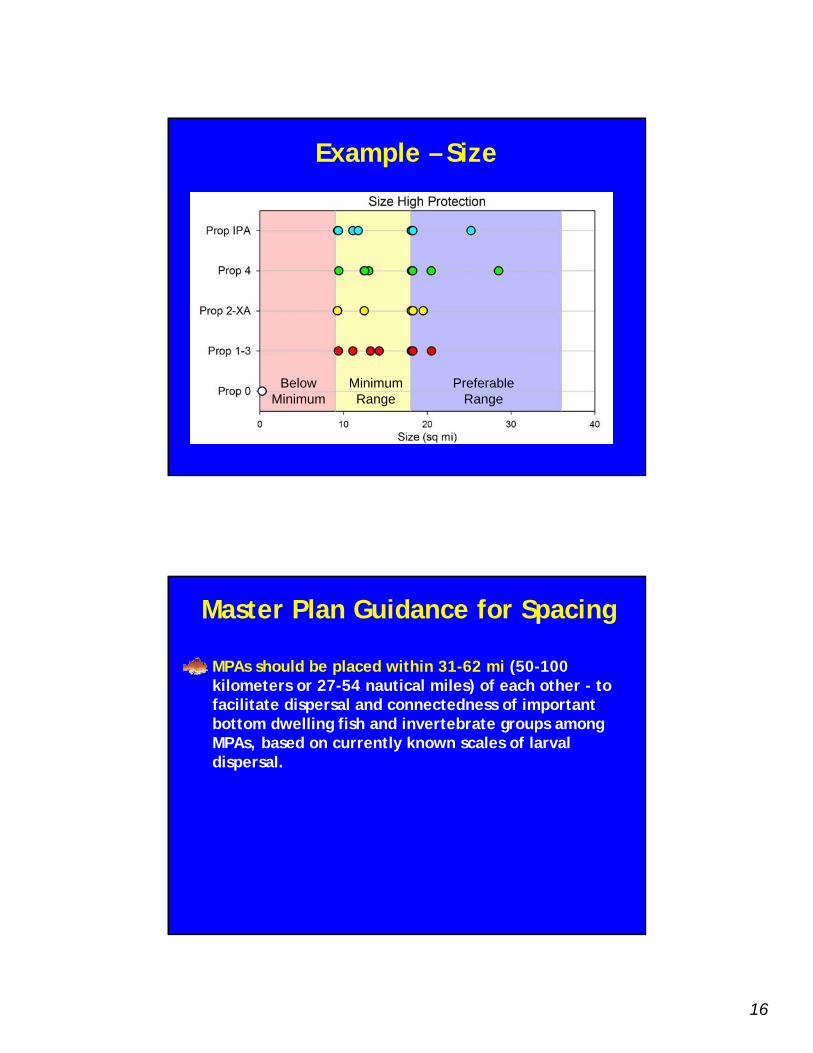
Example – Size
BelowMinimum
Minimum Range
PreferableRange
Master Plan Guidance for Spacing
MPAs should be placed within 31-62 mi (50-100 kilometers or 27-54 nautical miles) of each other - to facilitate dispersal and connectedness of important bottom dwelling fish and invertebrate groups among MPAs, based on currently known scales of larval dispersal.
17
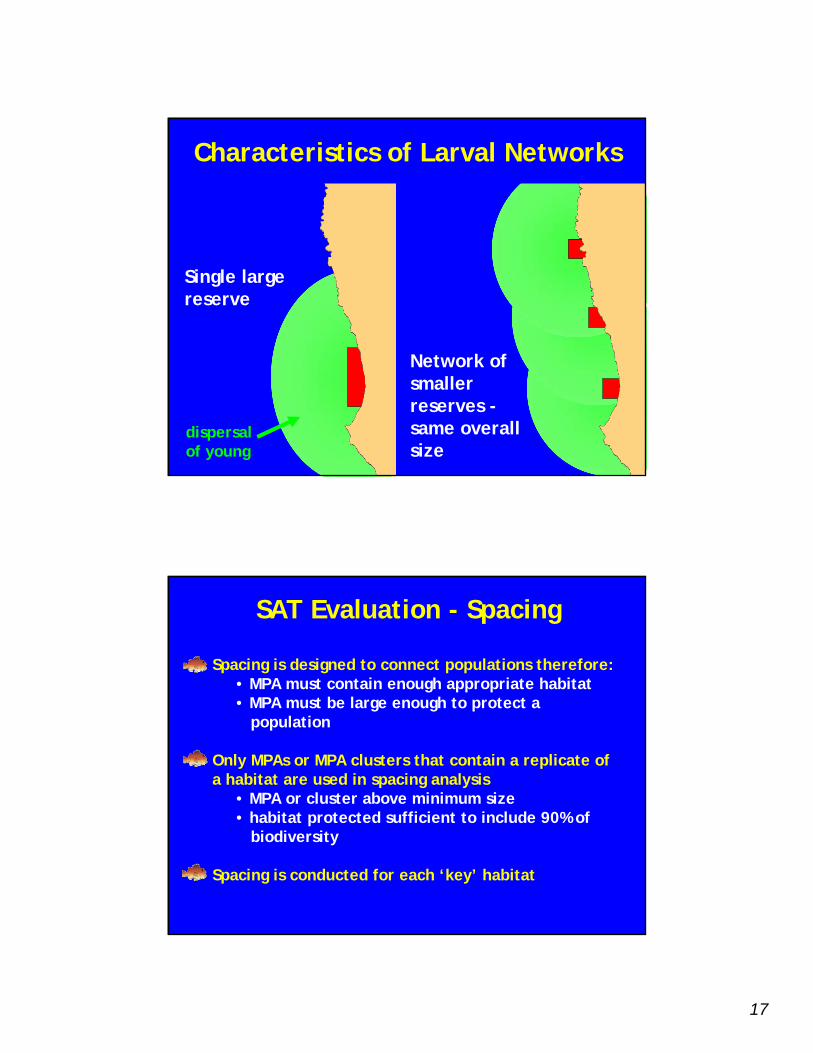
Characteristics of Larval Networks
Single large reserve
Network of smallerreserves -same overall size
dispersal of young
SAT Evaluation - Spacing
Spacing is designed to connect populations therefore:• MPA must contain enough appropriate habitat• MPA must be large enough to protect a
population
Only MPAs or MPA clusters that contain a replicate of a habitat are used in spacing analysis
• MPA or cluster above minimum size• habitat protected sufficient to include 90% of
biodiversity
Spacing is conducted for each ‘key’ habitat
18
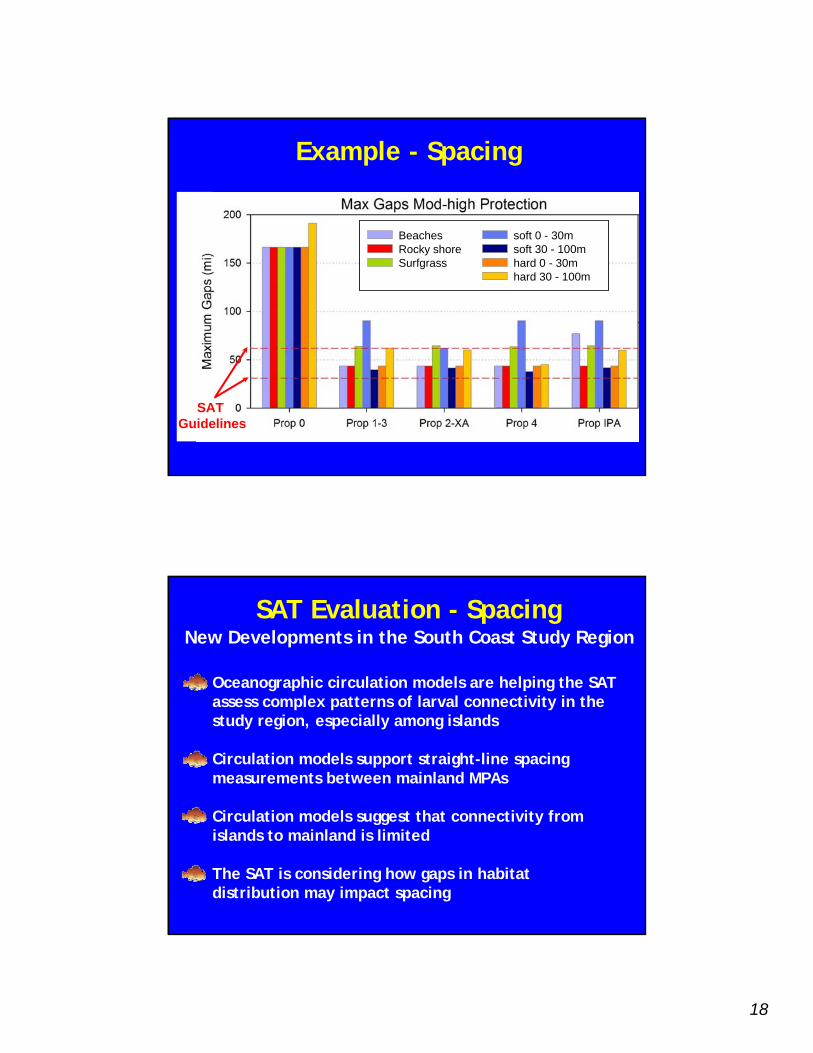
Example - Spacing
Beaches Rocky shoreSurfgrass
soft 0 - 30m soft 30 - 100m hard 0 - 30m hard 30 - 100m
SAT Guidelines
SAT Evaluation - Spacing
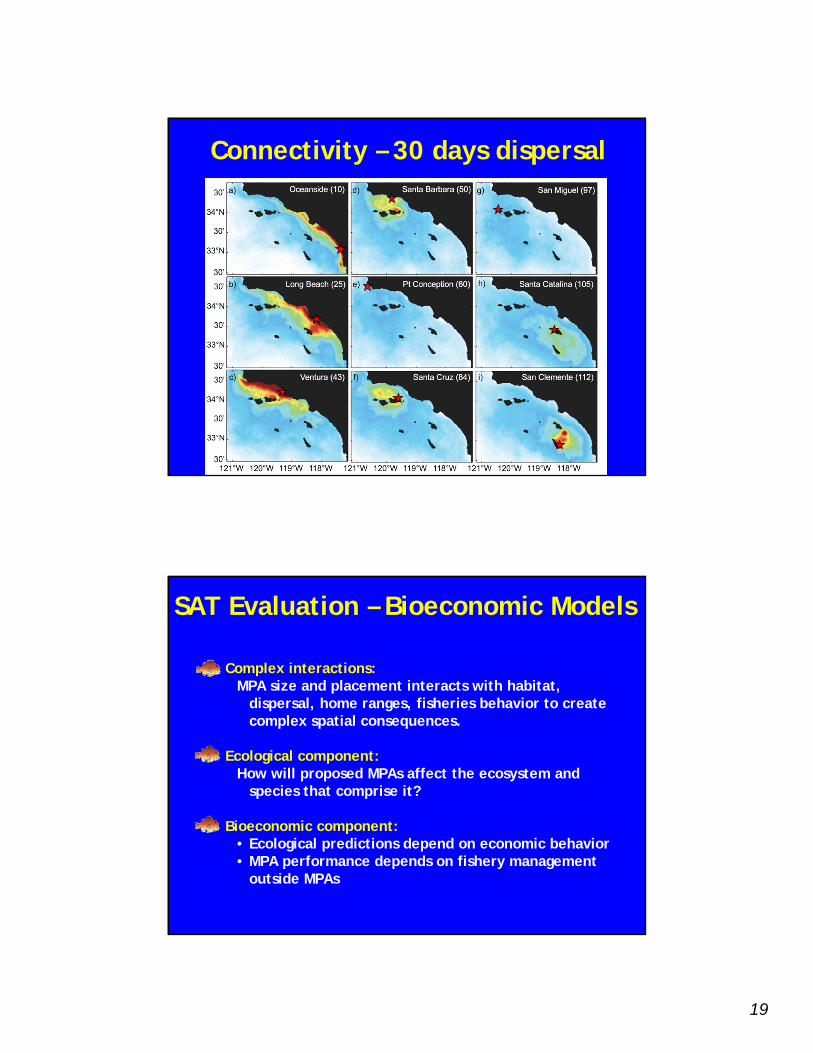
Oceanographic circulation models are helping the SAT assess complex patterns of larval connectivity in the study region, especially among islands
Circulation models support straight-line spacing measurements between mainland MPAs
Circulation models suggest that connectivity from islands to mainland is limited
The SAT is considering how gaps in habitat distribution may impact spacing
New Developments in the South Coast Study Region
19
Connectivity – 30 days dispersal
SAT Evaluation – Bioeconomic Models
Complex interactions:MPA size and placement interacts with habitat,
dispersal, home ranges, fisheries behavior to create complex spatial consequences.
Ecological component:How will proposed MPAs affect the ecosystem and
species that comprise it?
Bioeconomic component:• Ecological predictions depend on economic behavior• MPA performance depends on fishery management
outside MPAs
20
SAT Evaluation – Bioeconomic Models
Use spatially-explicit models to predict:•Biomass of different species across space•“Sustainability” of stock•Yield, Effort and Profit across space•Change from status quo
Key attributes:•Oceanographic and habitat patterns•Larval dispersal•Adult movement•Parameterized for a range of life histories and habitat associations
•Fleet behavior in response to proposed MPAs
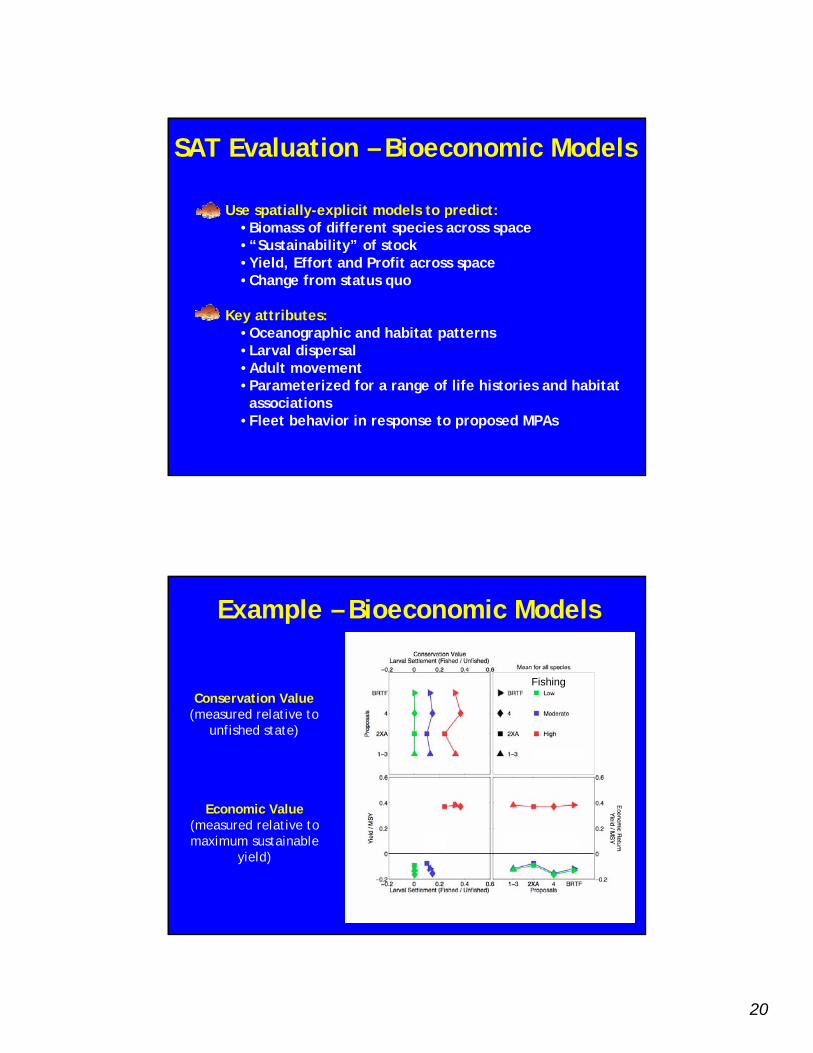
Example – Bioeconomic Models
Conservation Value(measured relative to
unfished state)
Economic Value(measured relative to maximum sustainable
yield)
Fishing
21
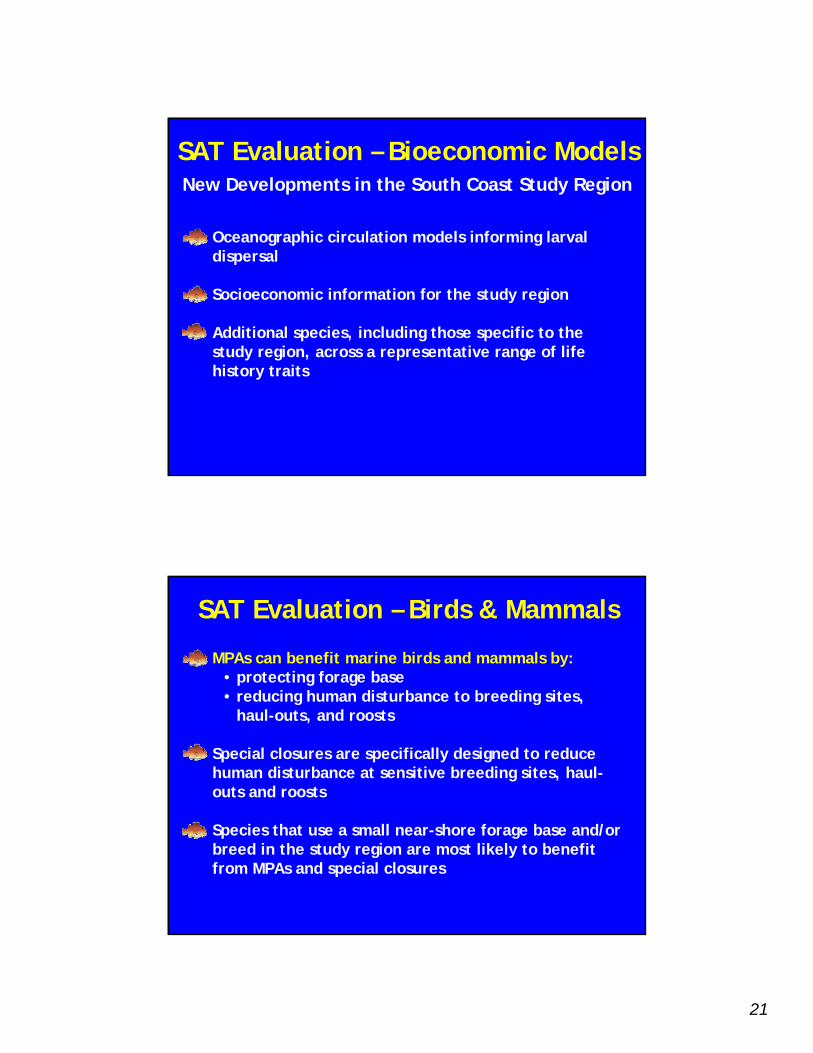
SAT Evaluation – Bioeconomic Models
Oceanographic circulation models informing larval dispersal
Socioeconomic information for the study region
Additional species, including those specific to the study region, across a representative range of life history traits
New Developments in the South Coast Study Region
SAT Evaluation – Birds & Mammals
MPAs can benefit marine birds and mammals by:• protecting forage base• reducing human disturbance to breeding sites,
haul-outs, and roosts
Special closures are specifically designed to reduce human disturbance at sensitive breeding sites, haul-outs and roosts
Species that use a small near-shore forage base and/or breed in the study region are most likely to benefit from MPAs and special closures
22
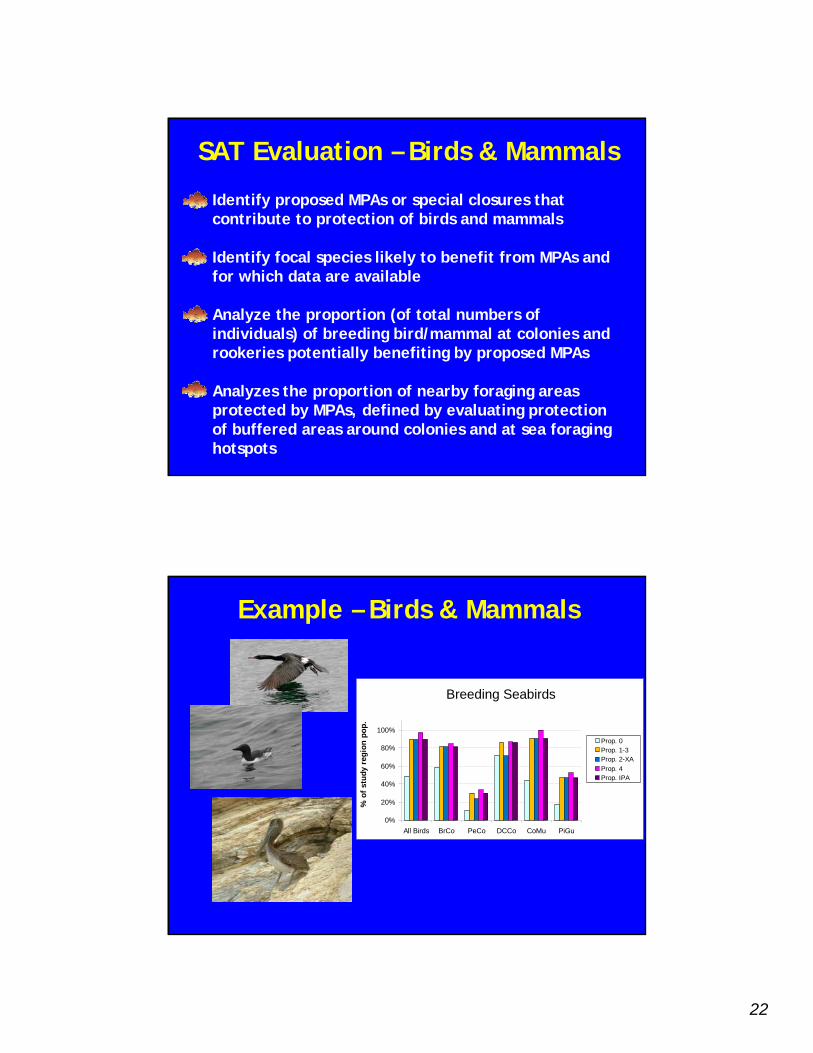
SAT Evaluation – Birds & Mammals
Identify proposed MPAs or special closures that contribute to protection of birds and mammals
Identify focal species likely to benefit from MPAs and for which data are available
Analyze the proportion (of total numbers of individuals) of breeding bird/mammal at colonies and rookeries potentially benefiting by proposed MPAs
Analyzes the proportion of nearby foraging areas protected by MPAs, defined by evaluating protection of buffered areas around colonies and at sea foraging hotspots
Example – Birds & Mammals
NCCSR total
0%
20%
40%
60%
80%
100%
All Birds BrCo PeCo DCCo CoMu PiGu
% o
f stu
dy r
egio
n po
p.
Prop. 0Prop. 1-3Prop. 2-XAProp. 4Prop. IPA
Breeding Seabirds
23
SAT Guidance – Water Quality
No guidance provided by the MLPA on how to consider water quality in siting MPAs
The master plan states: “Placement of MPAs should take into account the adjacent terrestrial environment andassociated human activities.”
SAT identifies and maps areas of water quality concernpower-plant intakes and dischargesstorm water dischargeswaste water discharges
SAT identifies areas of water quality opportunityAreas of special biological significance
SAT Evaluation – Water QualityNew Developments in the South Coast Study Region
No water quality evaluation done in previous study regions
The SAT is developing methods to evaluate MPA proposals with respect to water quality (for round 2)
• avoidance of water quality concern areas• inclusion of water quality opportunity areas
Water quality is a secondary consideration in MPA design, as the MLPA does not regulate water quality
24
Summary
SAT is starting with the guidelines and evaluation methods developed in previous study regions
Recognizing differences between the south coast study region and central coast/north central coast study regions, SAT is considering modifications for design guidance and proposal evaluation
Continued discussion between SCRSG and SAT is key and greatly appreciated