Embed Size (px)
Citation preview
Fall 2013
-
100,000,000
200,000,000
300,000,000
400,000,000
500,000,000
600,000,000
700,000,000
2007 2008 2009 2010 2011 2012 2013 2014
State Fiscal Year
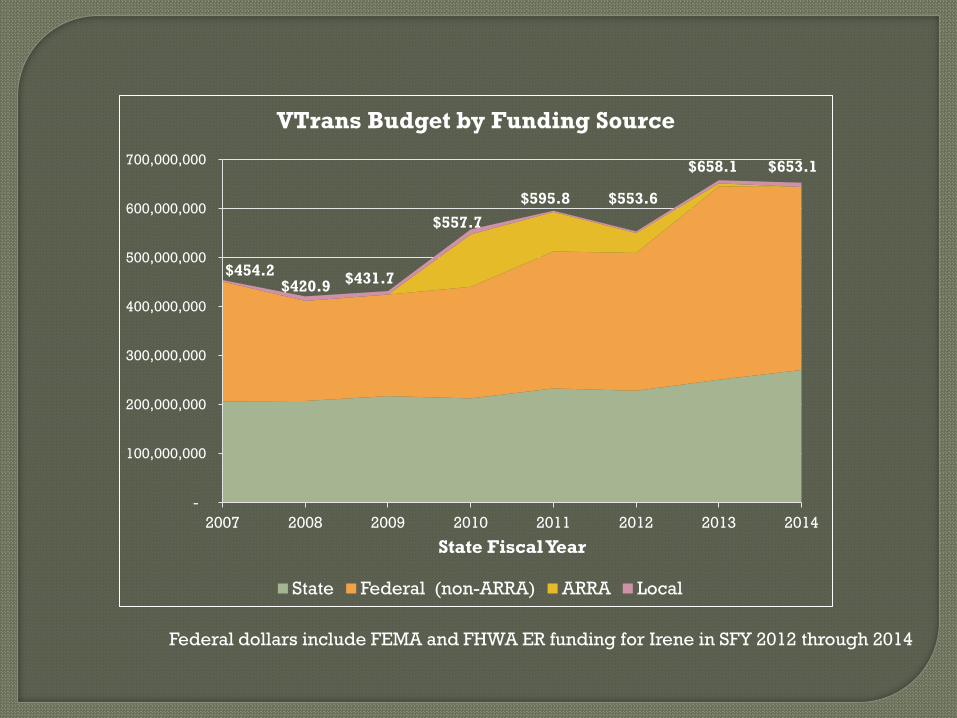
VTrans Budget by Funding Source
State Federal (non-ARRA) ARRA Local
$454.2 $420.9
$431.7
$557.7
$595.8 $553.6
$658.1 $653.1
Federal dollars include FEMA and FHWA ER funding for Irene in SFY 2012 through 2014
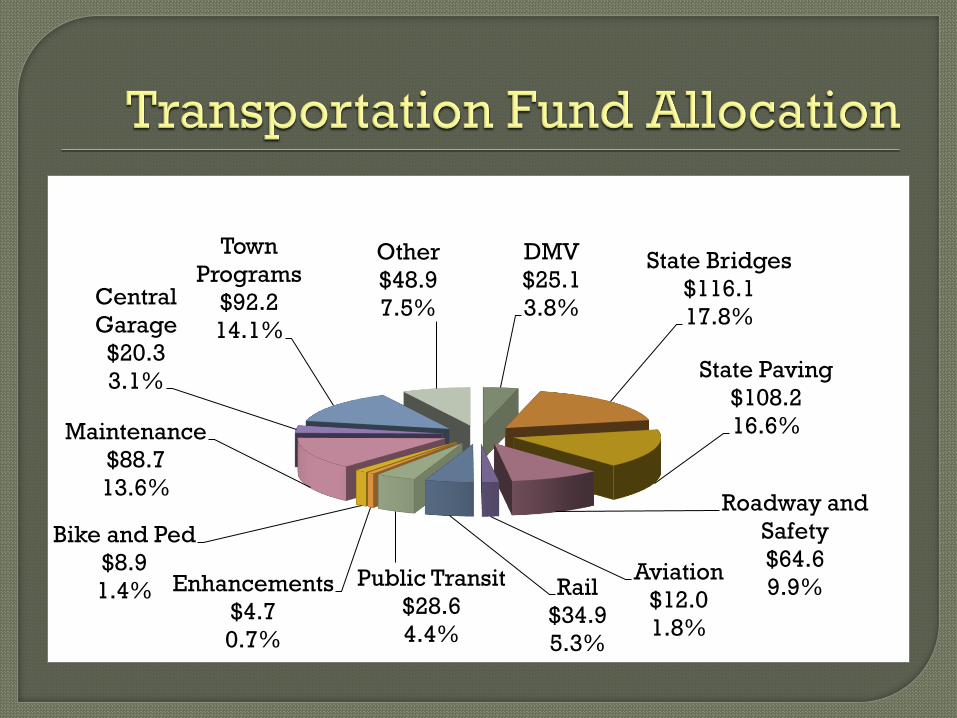
DMV
$25.1
3.8%
State Bridges
$116.1
17.8%
State Paving
$108.2
16.6%
Roadway and
Safety
$64.6
9.9% Aviation
$12.0
1.8%
Rail
$34.9
5.3%
Public Transit
$28.6
4.4%
Enhancements
$4.7
0.7%
Bike and Ped
$8.9
1.4%
Maintenance
$88.7
13.6%
Central
Garage
$20.3
3.1%
Town
Programs
$92.2
14.1%
Other
$48.9
7.5%
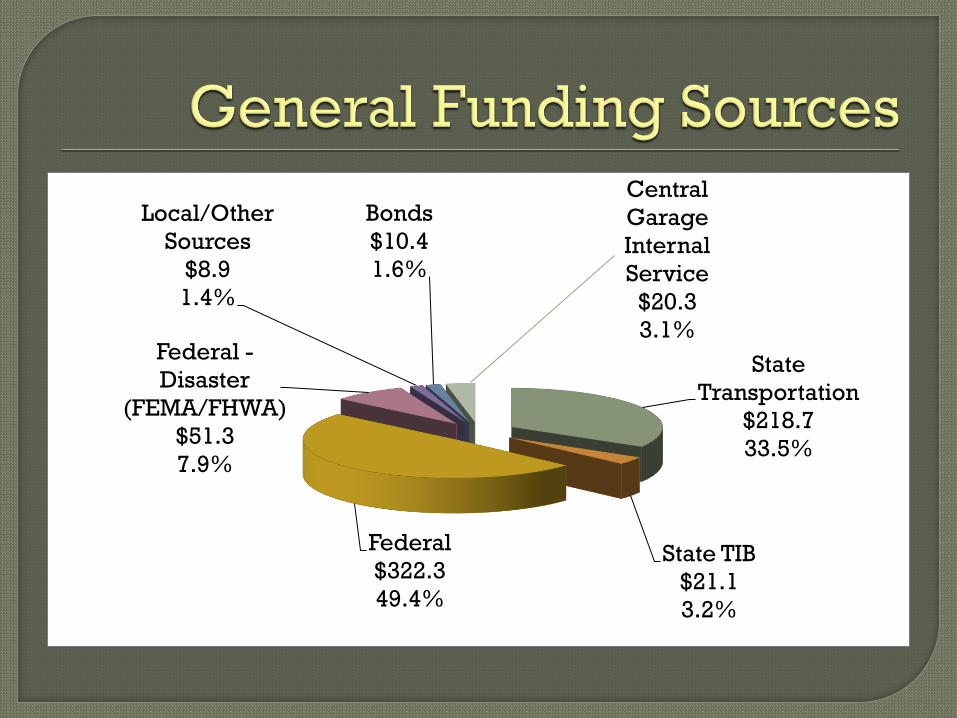
State
Transportation
$218.7
33.5%
State TIB
$21.1
3.2%
Federal
$322.3
49.4%
Federal -
Disaster
(FEMA/FHWA)
$51.3
7.9%
Local/Other
Sources
$8.9
1.4%
Bonds
$10.4
1.6%
Central
Garage
Internal
Service
$20.3
3.1%
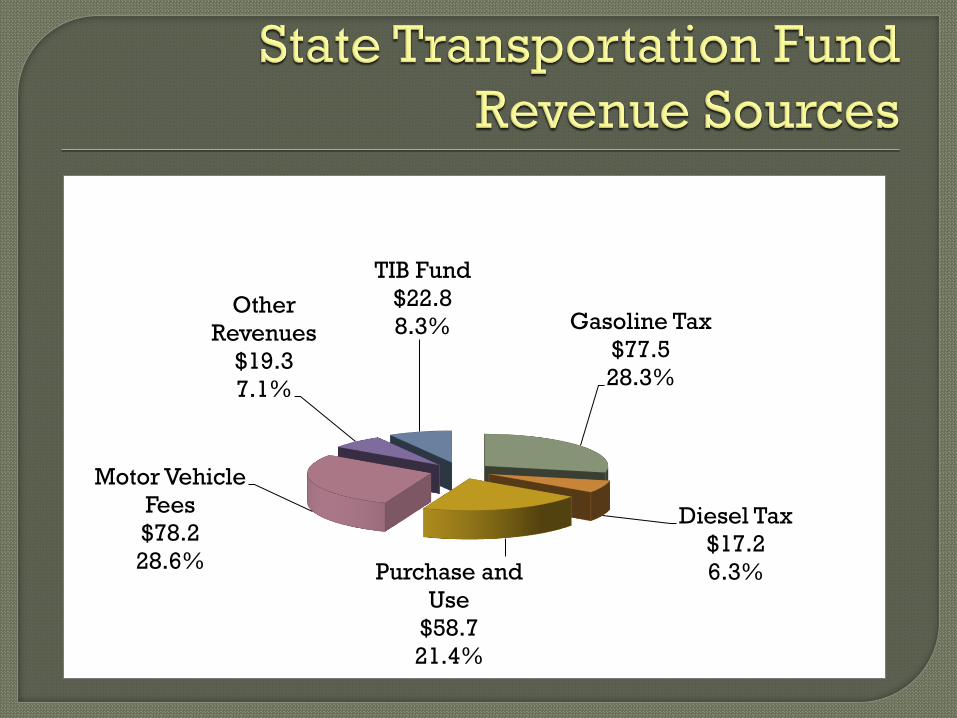
Gasoline Tax
$77.5
28.3%
Diesel Tax
$17.2
6.3% Purchase and
Use
$58.7
21.4%
Motor Vehicle
Fees
$78.2
28.6%
Other
Revenues
$19.3
7.1%
TIB Fund
$22.8
8.3%
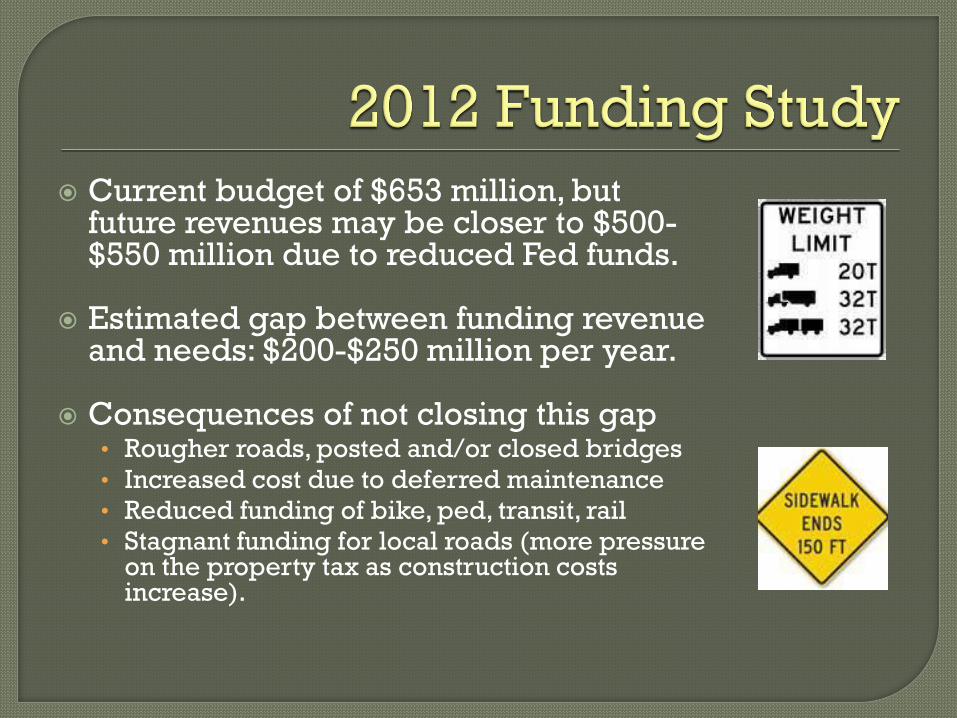
Current budget of $653 million, but future revenues may be closer to $500-$550 million due to reduced Fed funds.
Estimated gap between funding revenue
and needs: $200-$250 million per year.
Consequences of not closing this gap • Rougher roads, posted and/or closed bridges
• Increased cost due to deferred maintenance
• Reduced funding of bike, ped, transit, rail
• Stagnant funding for local roads (more pressure on the property tax as construction costs increase).
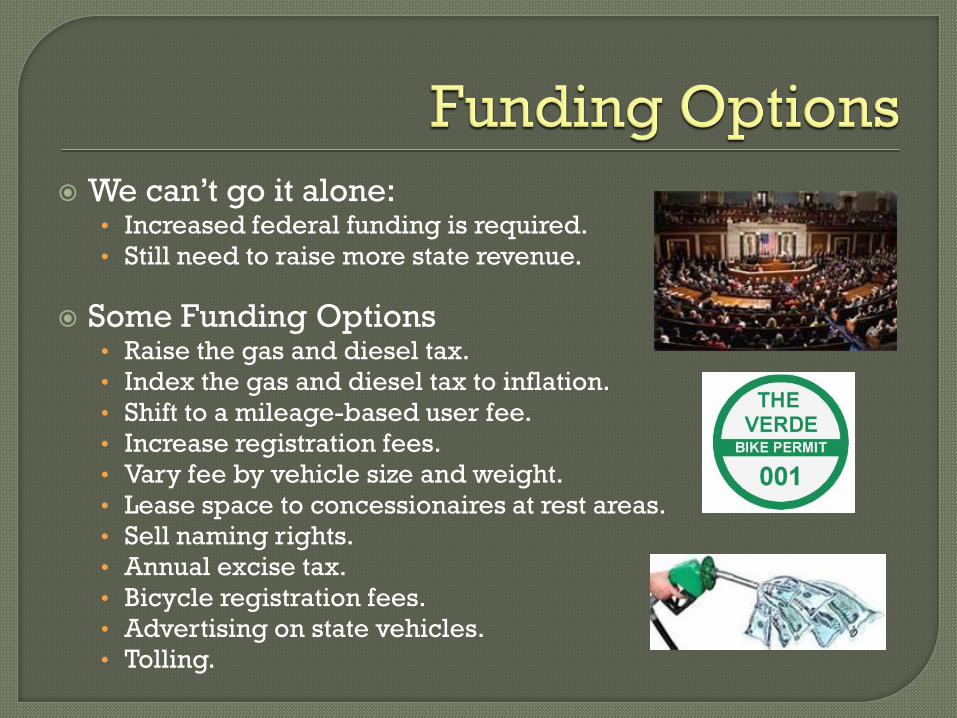
We can’t go it alone: • Increased federal funding is required.
• Still need to raise more state revenue.
Some Funding Options • Raise the gas and diesel tax.
• Index the gas and diesel tax to inflation.
• Shift to a mileage-based user fee.
• Increase registration fees.
• Vary fee by vehicle size and weight.
• Lease space to concessionaires at rest areas.
• Sell naming rights.
• Annual excise tax.
• Bicycle registration fees.
• Advertising on state vehicles.
• Tolling.

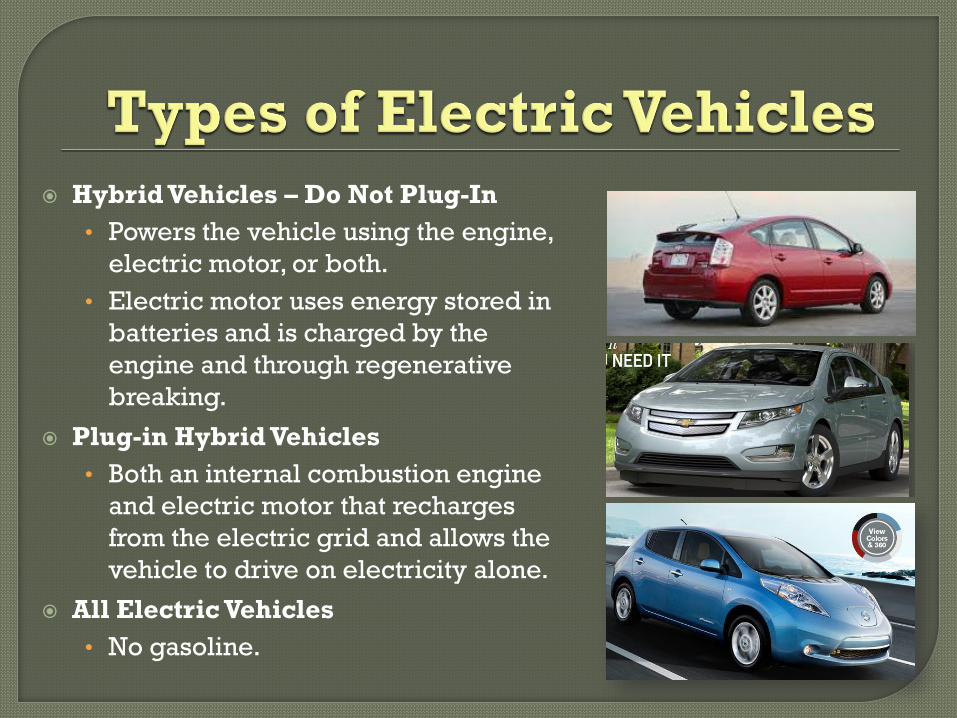
Hybrid Vehicles – Do Not Plug-In
• Powers the vehicle using the engine,
electric motor, or both.
• Electric motor uses energy stored in
batteries and is charged by the
engine and through regenerative
breaking.
Plug-in Hybrid Vehicles
• Both an internal combustion engine
and electric motor that recharges
from the electric grid and allows the
vehicle to drive on electricity alone.
All Electric Vehicles
• No gasoline.

Electric
Vehicle
Registration
Tracking
October
2013
Make and Model Number registered
statewide
Chevrolet Volt 73
Toyota Prius Plug-in 213
Tesla Roadster & Model S 20
Nissan Leaf 44
Mitsubishi iMiEV 16
Ford C-MAX Energi 20
Ford Fusion Energi 16
Ford Focus Electric 4
Smart Electric Drive 3
Other (e.g. after market
conversions) 23
Total 432
October 2013 AEV and PHEV Registrations by Vehicle Model in Vermont, (VEIC, 2013)

U.S. Energy Information Agency projects 5,600 Vermont EVs by 2023. Current registrations exceed projections.
State Energy Plan sets goal of 25% of Vermont fleet – 142,975 vehicles – to be EVs by 2030.
Actual number likely tied to charging-station development and consumer comfort.
About 226 strategically located public stations
believed necessary.
EVs present competing goals • State Energy Plan encourages EV use
• State goal: 25% renewable-energy fleet by 2030
• Transportation funding tied to gas tax
• Hitting goal represents $21 million loss in gas taxes
Remedy options need to be practical • Easy to administer
• Easy for Vermonters to understand and accept
• Provide a stable revenue stream
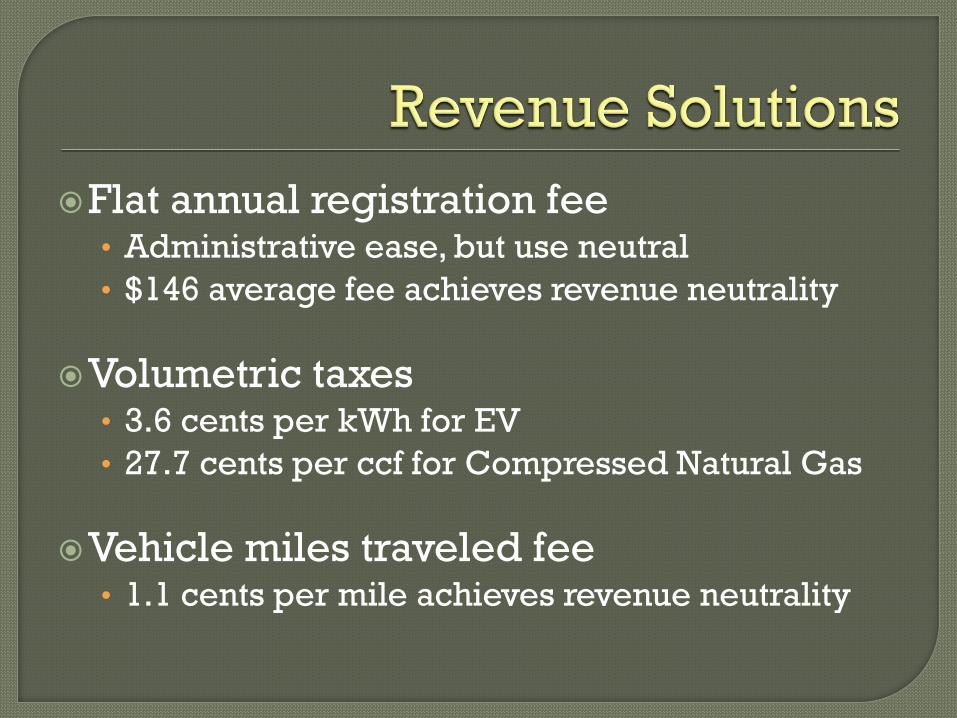
Flat annual registration fee • Administrative ease, but use neutral
• $146 average fee achieves revenue neutrality
Volumetric taxes • 3.6 cents per kWh for EV
• 27.7 cents per ccf for Compressed Natural Gas
Vehicle miles traveled fee • 1.1 cents per mile achieves revenue neutrality
Fall 2013
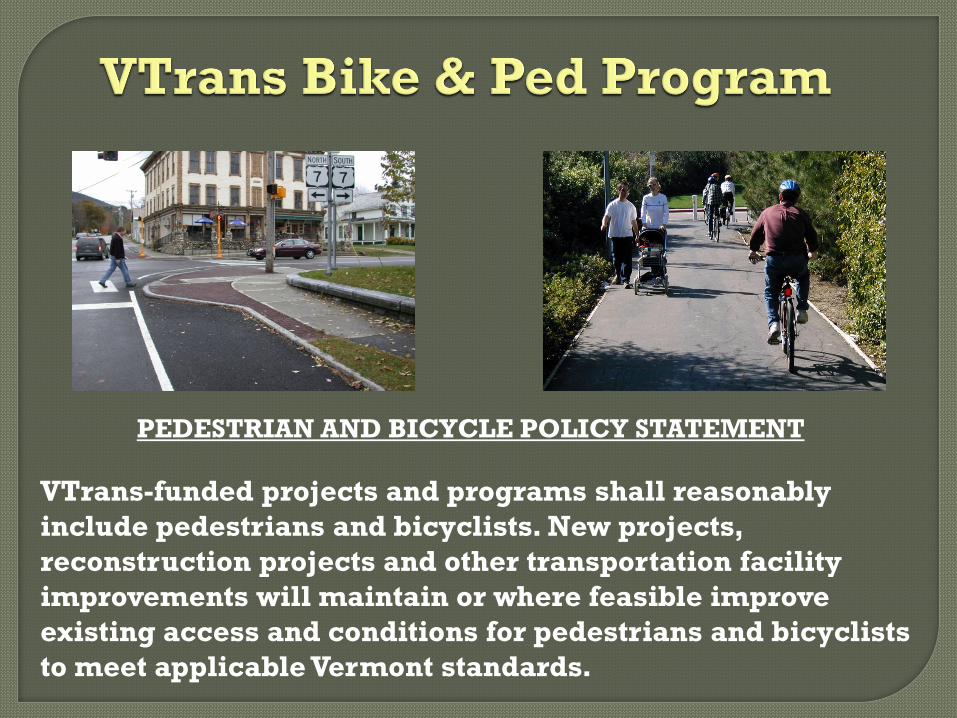
PEDESTRIAN AND BICYCLE POLICY STATEMENT
VTrans-funded projects and programs shall reasonably
include pedestrians and bicyclists. New projects,
reconstruction projects and other transportation facility
improvements will maintain or where feasible improve
existing access and conditions for pedestrians and bicyclists
to meet applicable Vermont standards.
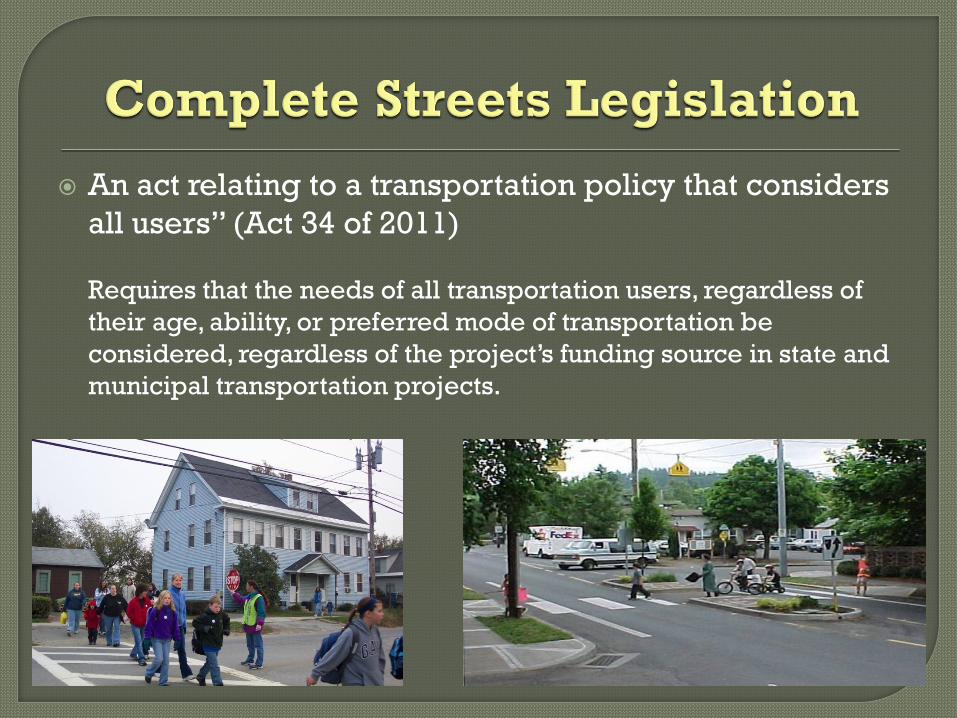
An act relating to a transportation policy that considers
all users” (Act 34 of 2011)
Requires that the needs of all transportation users, regardless of
their age, ability, or preferred mode of transportation be
considered, regardless of the project’s funding source in state and
municipal transportation projects.
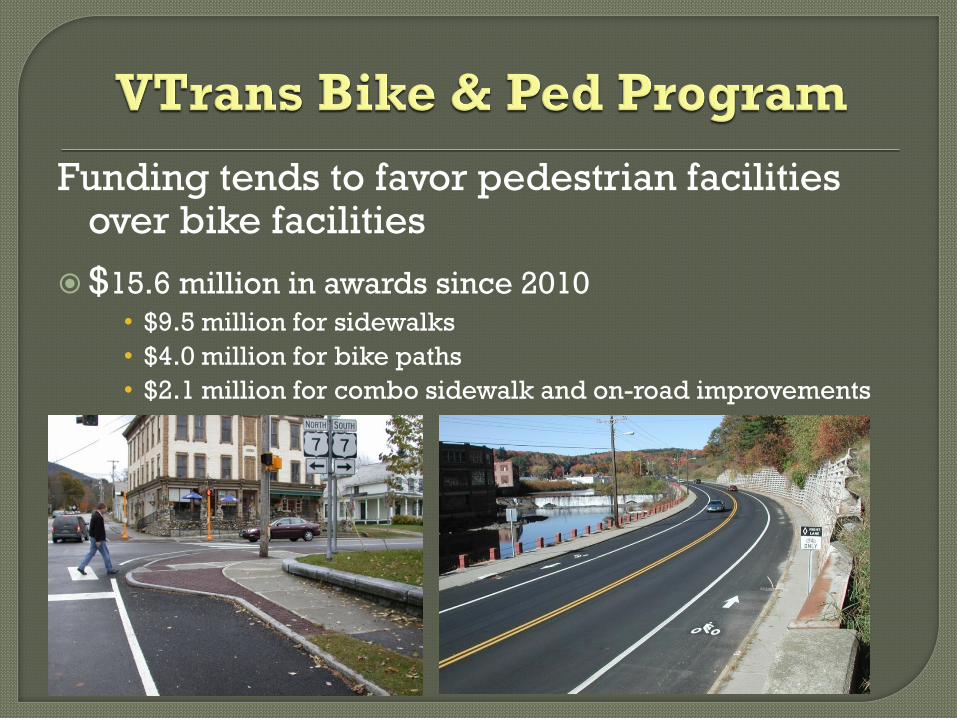
Funding tends to favor pedestrian facilities over bike facilities
$15.6 million in awards since 2010
• $9.5 million for sidewalks
• $4.0 million for bike paths
• $2.1 million for combo sidewalk and on-road improvements
For bikes, VTrans adds 3-foot shoulders to roads where there
are none today. How should these efforts be prioritized?
• Local recreational loops?
• Commuting stretches that connect destinations?
• Emphasis on heavy traffic roads?
• Is widening shoulders enough?
• Separate bikeways needed?
For sidewalks, funding tends to be for village centers.
• When do you put sidewalk on a bridge? Other locations?
• Fund a lot of sidewalks, not shared-use paths. This OK?

Encouragement & Education
What should VTrans do for safety education?
• Radio PSA?
• Front Porch Forum?
• Public gatherings?
• On-line tutorials?
• Other?
How can VTrans encourage biking and walking? • Policy statement mentions encouragement, but Agency is
struggling to find effective ways and is looking for ideas.
Fall 2013
Rail is only mode that does not have dedicated federal
funding, relying almost exclusively on state funds and
discretionary federal funding that is difficult to obtain.
The Feds have a High Speed & Intercity Passenger Rail
Program that funds track improvements. Vermont
participates, but funding is competitive.
Lack of dedicated federal funding has made it
challenging to maintain good operating conditions for
both freight and passenger service.
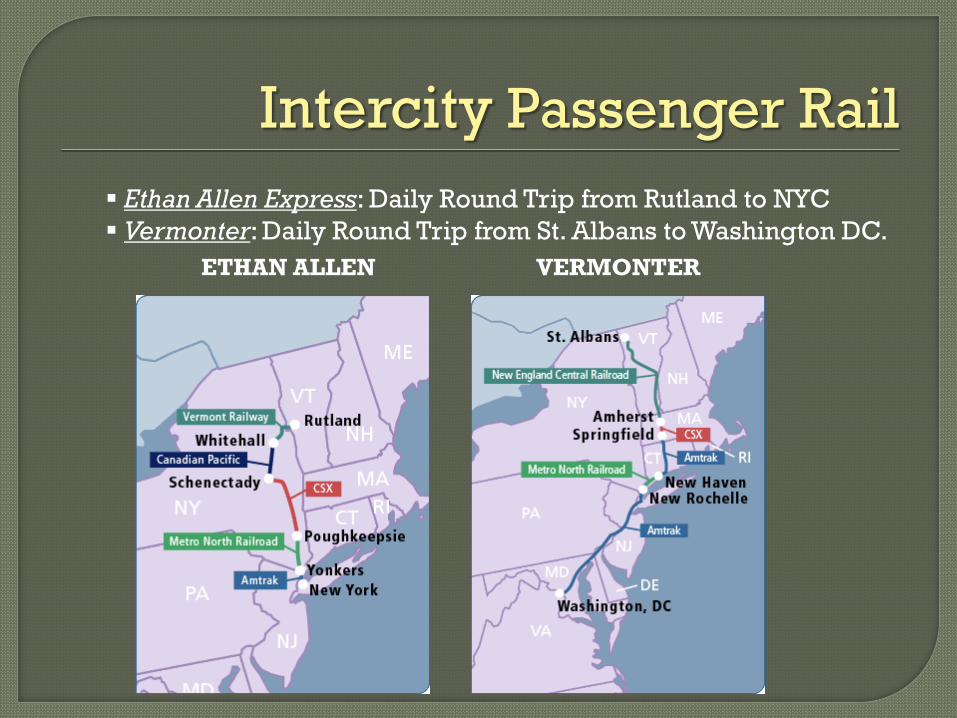
Intercity Passenger Rail
Ethan Allen Express: Daily Round Trip from Rutland to NYC
Vermonter: Daily Round Trip from St. Albans to Washington DC.
ETHAN ALLEN VERMONTER
Approximately $7.2 million is needed to annually support the Ethan Allen Express and Vermonter, up from about $4.8 million just a year ago.
Priority new services have been identified
as 1) the western corridor and 2) extension of the Vermonter to Montreal.
Western corridor includes expanding service north from Rutland to Middlebury and Burlington, as well as south of Rutland to Manchester and Bennington.
While freight and passenger upgrades complement each other, their needs also compete for limited resources as most rail lines do not carry passengers.
Feds now require Vermont to have both a long-
term capitalization plan as well as list funding priorities.
In the past, the State’s Rail Plan was a general policy document that was only State mandated.
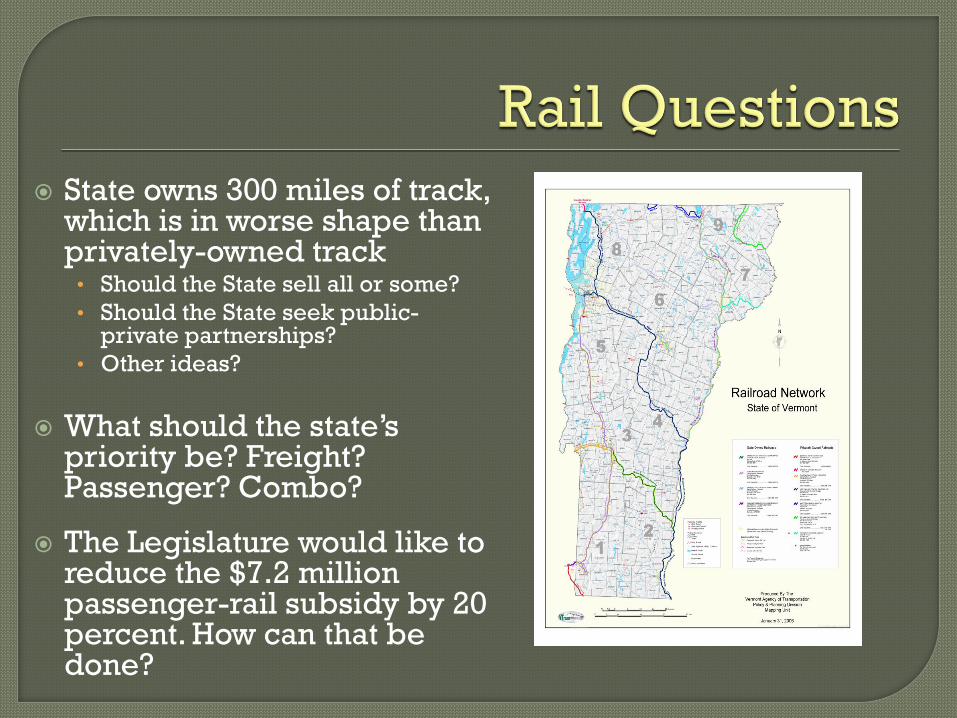
State owns 300 miles of track, which is in worse shape than privately-owned track
• Should the State sell all or some?
• Should the State seek public-private partnerships?
• Other ideas?
What should the state’s
priority be? Freight? Passenger? Combo?
The Legislature would like to reduce the $7.2 million passenger-rail subsidy by 20 percent. How can that be done?

Fall 2013
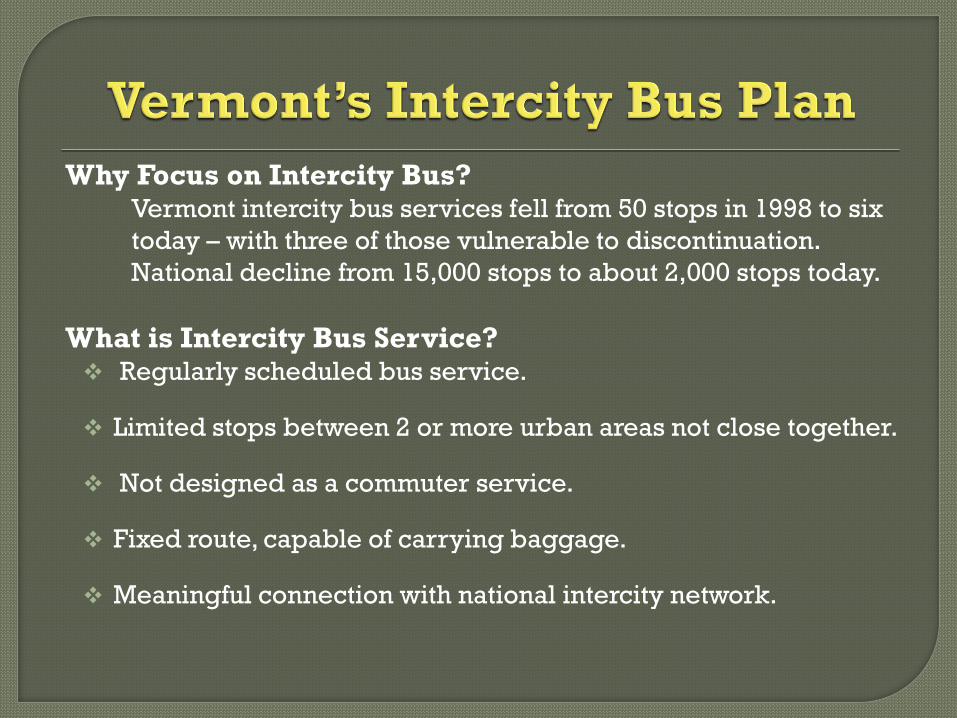
Why Focus on Intercity Bus? Vermont intercity bus services fell from 50 stops in 1998 to six
today – with three of those vulnerable to discontinuation.
National decline from 15,000 stops to about 2,000 stops today.
What is Intercity Bus Service? Regularly scheduled bus service.
Limited stops between 2 or more urban areas not close together.
Not designed as a commuter service.
Fixed route, capable of carrying baggage.
Meaningful connection with national intercity network.

Within Vermont, service is limited:
o Greyhound: Montreal>Burlington>
Montpelier>White River Junction> Boston
o Greyhound: White River Junction> Bellows Falls> Brattleboro> Springfield, MA
o Yankee Trails: Bennington>Albany
o Megabus: Burlington>Boston
In the works, on line soon:
o Albany>Bennington>Burlington
o Rutland>White River
State subsidizes three lines at $400,000 annually.
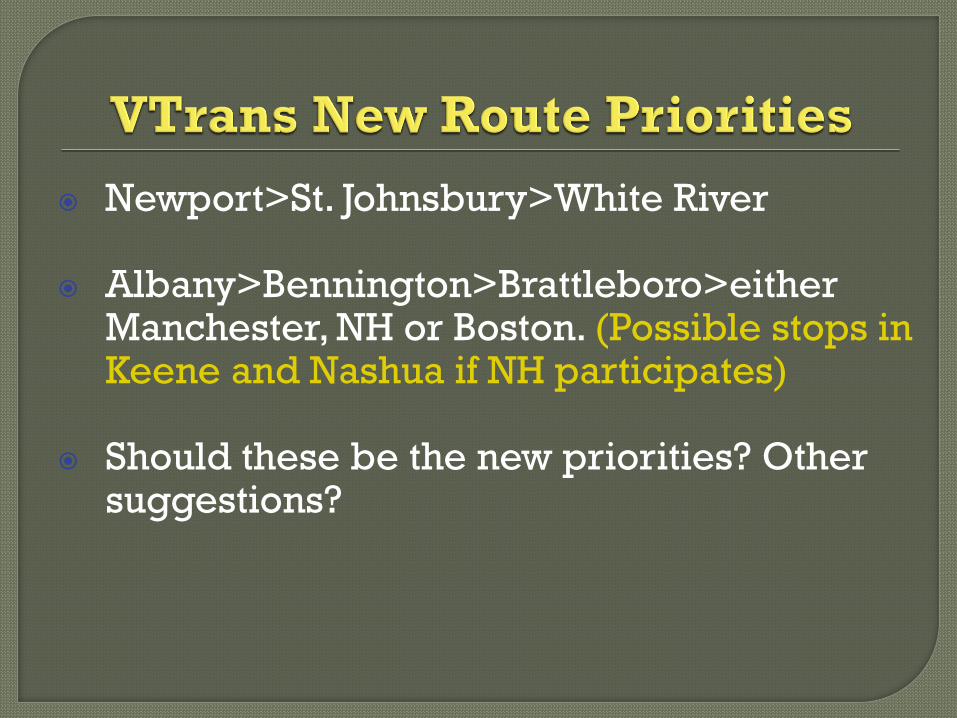
Newport>St. Johnsbury>White River
Albany>Bennington>Brattleboro>either Manchester, NH or Boston. (Possible stops in Keene and Nashua if NH participates)
Should these be the new priorities? Other suggestions?
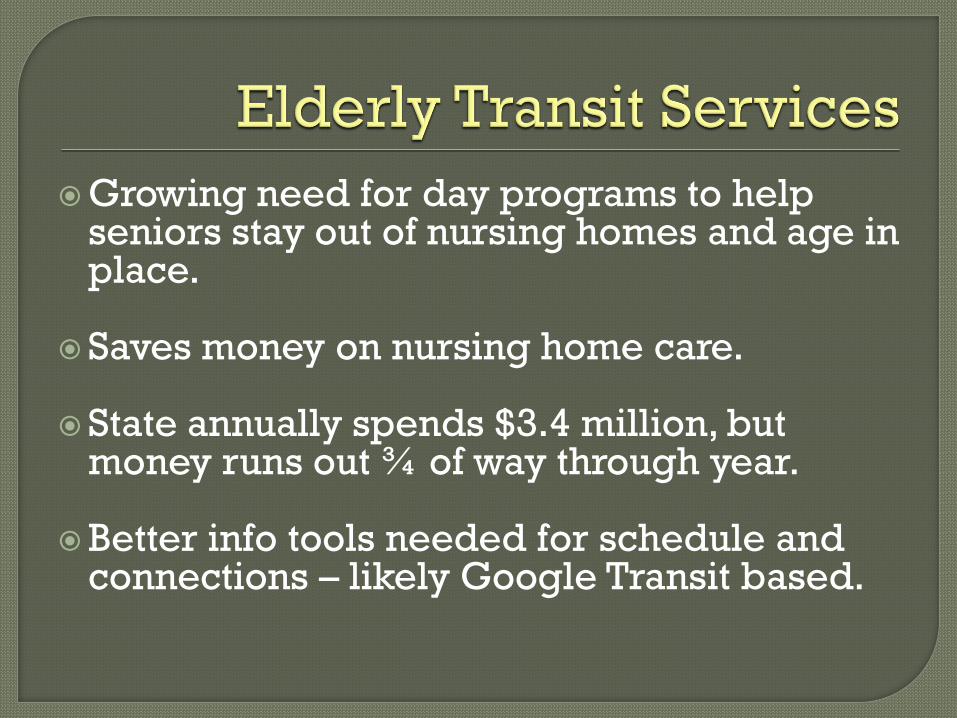
Growing need for day programs to help seniors stay out of nursing homes and age in place.
Saves money on nursing home care.
State annually spends $3.4 million, but
money runs out ¾ of way through year.
Better info tools needed for schedule and connections – likely Google Transit based.
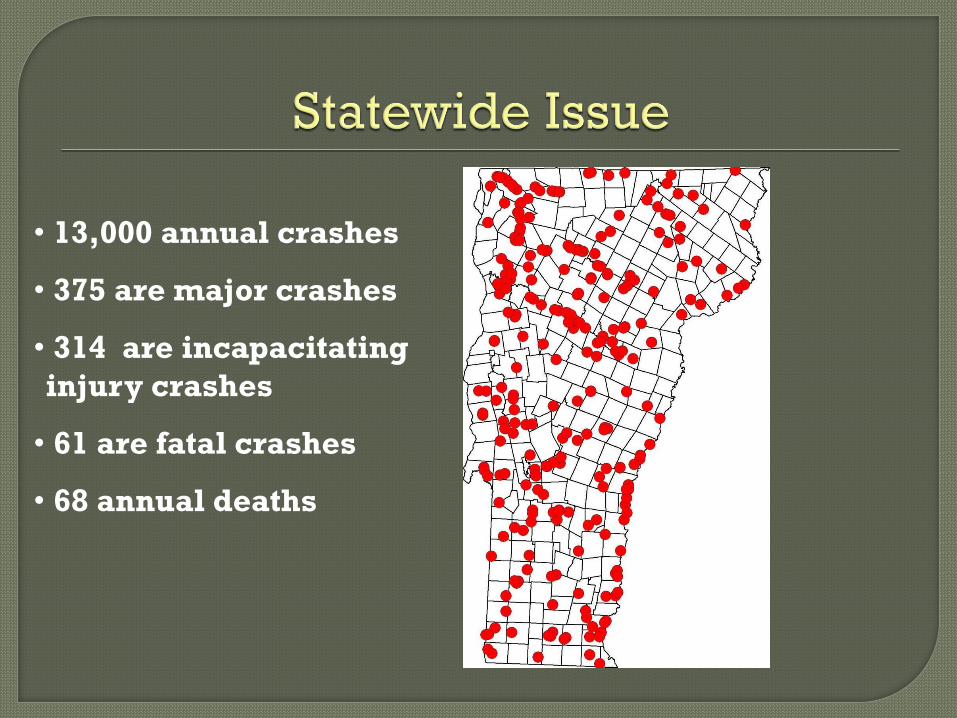
• 13,000 annual crashes
• 375 are major crashes
• 314 are incapacitating
injury crashes
• 61 are fatal crashes
• 68 annual deaths
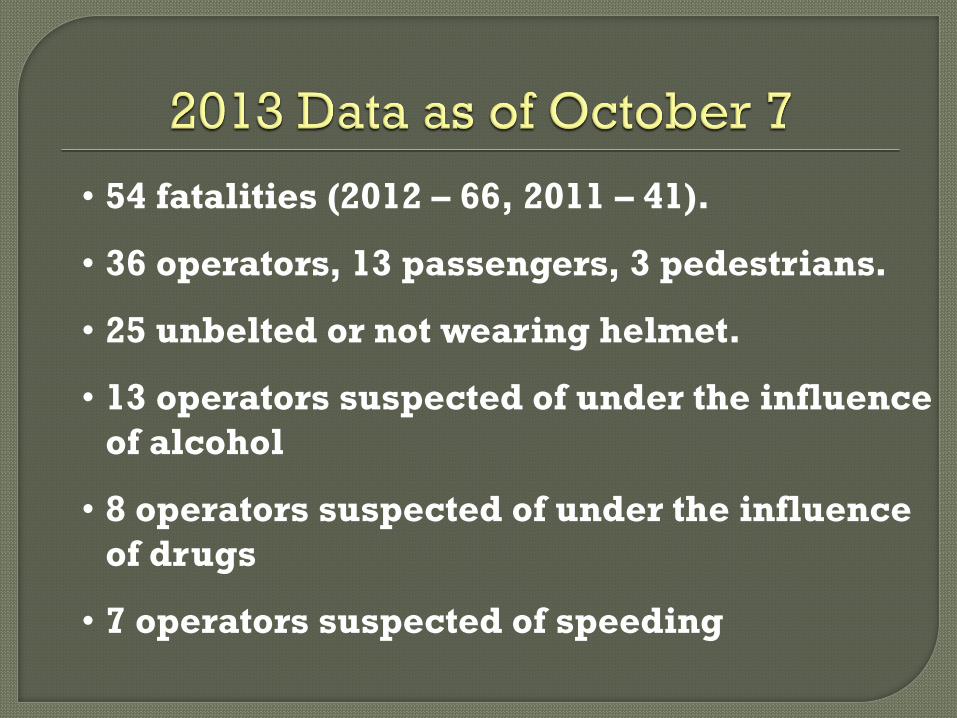
• 54 fatalities (2012 – 66, 2011 – 41).
• 36 operators, 13 passengers, 3 pedestrians.
• 25 unbelted or not wearing helmet.
• 13 operators suspected of under the influence
of alcohol
• 8 operators suspected of under the influence
of drugs
• 7 operators suspected of speeding

Critical Emphasis Areas
Young Drivers Alcohol
Driver Inattention
Safety Belts
Lane Departure Aggressive Driving
Intersections

Examples of recent initiatives include:
1. Data Driven Targeted Speed Enforcement
2. Roundabout Construction
3. Increased emphasis on pavement markings and
rumble stripes
4. Consolidated messages and efforts on safety
initiatives (i.e. Click it or Ticket)
5. Regional Safety Forums
6. What else?

Fall 2013

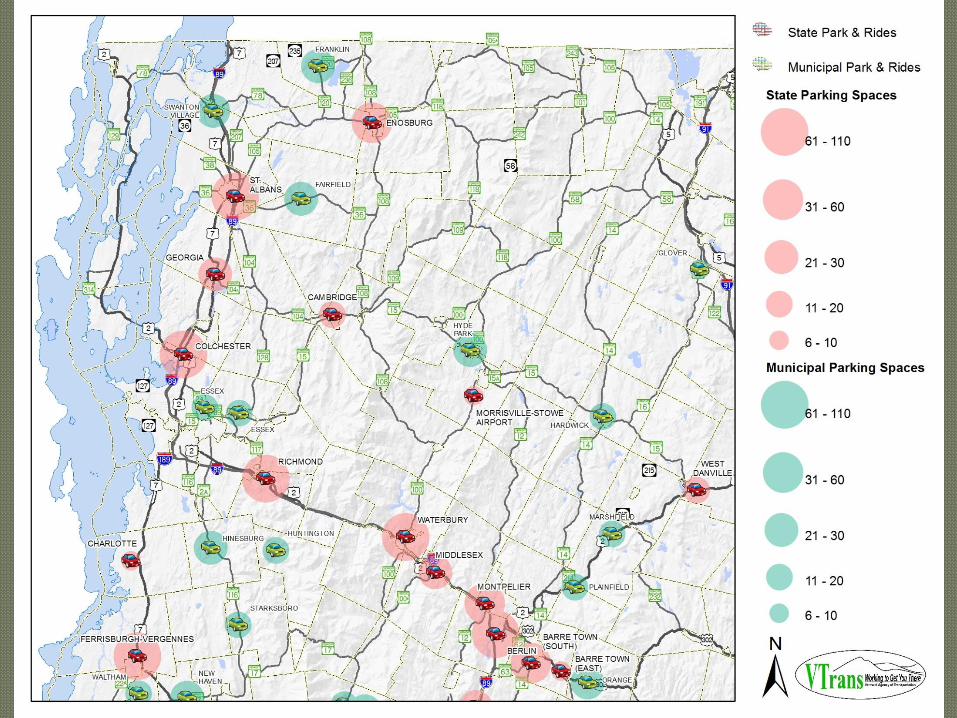
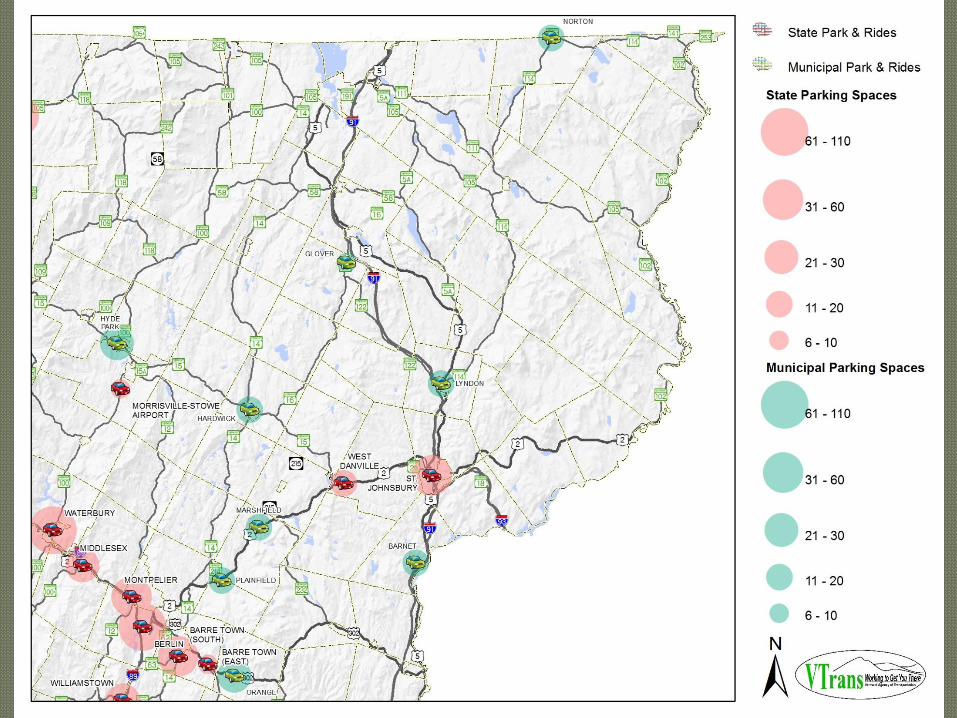
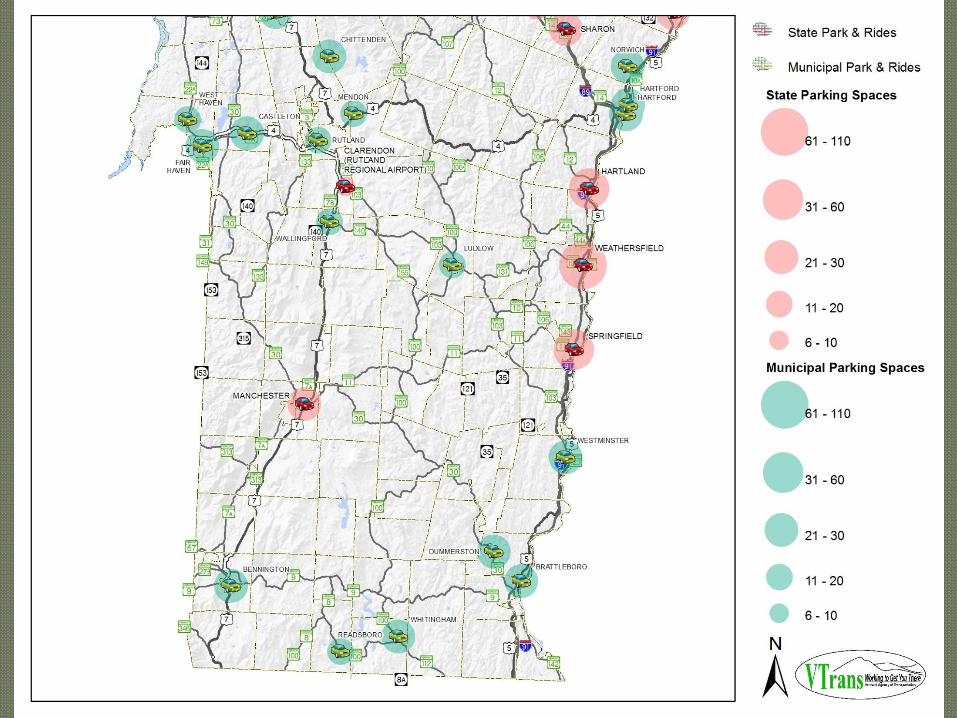
In 2003, there were 23 state Park & Rides
with about 742 spaces.
In 2013, there are 28 State Park & Rides
with about 1,270 spaces.
In 2005, state started municipal Park &
Ride program, to date funding 46
facilities with 750 spaces.

State looking to develop statewide plan and identify
gaps, both state-owned and municipal.
Is there local demand? Are lots over capacity? Where
should new ones go, and why?
What do you use Park & Rides for?
• Commuting?
• Recreational travel?
• Business travel?
What do lots need to be successful? Lights?
Landscaping? Cleanliness? Other?